Article

Numerical Study of the Local Scouring Process and Influencing Factors of Semi-Exposed Submarine Cables

School of Electric Power Engineering, South China University of Technology, Guangzhou 510640, China
*
Author to whom correspondence should be addressed.
J. Mar. Sci. Eng. 2023, 11(7), 1349; https://doi.org/10.3390/jmse11071349
Submission received: 10 June 2023 / Revised: 19 June 2023 / Accepted: 27 June 2023 / Published: 1 July 2023
(This article belongs to the Section Ocean Engineering)

Abstract

:
Local scouring might result in the spanning of submarine cables, endangering their mechanical and electrical properties. In this contribution, a three-dimensional computational fluid dynamics simulation model is developed using FLOW-3D, and the scouring process of semi-exposed submarine cables is investigated. The effects of the sediment critical Shields number, sediment density, and ocean current velocity on local scouring are discussed, and variation rules for the submarine cables’ spanning time are provided. The results indicate that three scouring holes are formed around the submarine cables. The location of the bottom of the holes corresponds to that of the maximum shear velocity. The continuous development of scouring holes at the wake position leads to the spanning of the submarine cables. The increase in the sediment’s critical Shields number and sediment density, as well as the decrease in the ocean current velocity, will extend the time for maintaining the stability of the upstream scouring hole and retard the development velocity of the wake position and downstream scouring holes. The spanning time has a cubic relationship with the sediment’s critical Shields number, a linear relationship with the sediment density, and an exponential relationship with the ocean current velocity. In this paper, the local scouring process of semi-exposed submarine cables is studied, which provides a theoretical basis for the operation and maintenance of submarine cables.

1. Introduction

As a key piece of equipment in cross-sea power grids, submarine cables are widely used to connect autonomous power grids, supply power to islands or offshore platforms, and transmit electric power generated by marine renewable energy installations to onshore substations [1]. Once submarine cables break down due to natural disasters or human-made damage, the normal operation of other marine electric power equipment connected to them may be affected. These chain reactions will cause great economic losses and serious social impacts [2].
To protect submarine cables, they are usually buried 1 to 3 m below the seabed [3]. However, submarine cables are still confronted with potential threats from the complex subsea environment. Under the influence of fishing, anchor damage, ocean current scouring, and other factors, the sediment above submarine cables will always inevitably migrate. When a submarine cable is partially exposed, the scouring at this position will be exacerbated; eventually, it will cause the submarine cable to span. According to a field investigation of the 500 kV oil-filled submarine cable that is part of the Hainan networking system, the total length of the span is 49 m [4]. Under strong ocean currents, spanning submarine cables may experience vortex-induced vibrations. Fatigue stress caused by vortex-induced vibrations may lead to metal sheath rupture [5], which endangers the mechanical and electrical properties of submarine cables. Therefore, understanding the local scouring processes of partially exposed submarine cables is crucial for predicting scouring patterns. This is the basis for developing effective operation and maintenance strategies for submarine cables.
The mechanism and influencing factors of sediment erosion have been examined by researchers around the world. In 1988, Sumer [6] conducted experiments to show that the shedding vortex in the wake of a pipeline would increase the Shields parameter by 3–4 times, which would result in severe scouring. In 1991, Chiew [7] performed experiments to prove that the maximum scouring depth could be obtained when the pipeline was located on a flat bed and was scoured by a unidirectional water flow. Based on the test results, they provided a prediction formula for the maximum scouring depth. In 2003, Mastbergen [8] proposed a one-dimensional, steady-state numerical model of turbidity currents, which considered the negative pore pressures in the seabed. The calculated results of this model were basically consistent with the actual scouring of a submarine canyon. In 2007, Dey [9] presented a semitheoretical model for the computation of the maximum clear-water scour depth below underwater pipelines in uniform sediments under a steady flow, and the predicted scour depth in clear water satisfactorily agreed with the observed values. In 2008, Dey [10] conducted experiments on clear-water scour below underwater pipelines under a steady flow and obtained a variation pattern of the depth of the scouring hole. In 2008, Liang [11] used a two-dimensional numerical simulation to study the scouring process of a tube bundle under the action of currents and waves. They discovered that, compared with the scouring of a single tube, the scouring depth of the tube bundle was deeper, and the scouring time was longer. In 2012, Yang [12] found that placing rubber sheets under pipes can greatly accelerate their self-burial. The rubber sheets had the best performance when their length was about 1.5 times the size of the pipe. In 2020, Li [13] investigated the two-dimensional local scour beneath two submarine pipelines in tandem under wave-plus-current conditions via numerical simulation. They found that for conditions involving waves plus a low-strength current, the scour pattern beneath the two pipelines behaved like that in the pure-wave condition. Conversely, when the current had equal strength to the wave-induced flow, the scour pattern beneath the two pipelines resembled that in the pure-current condition. In 2020, Guan [14] studied and discussed the interactive coupling effects among a vibrating pipeline, flow field, and scour process through experiments, and the experimental data showed that the evolution of the scour hole had significant influences on the pipeline vibrations. In 2021, Liu [15] developed a two-dimensional finite element numerical model and researched the local scour around a vibrating pipeline. The numerical results showed that the maximum vibration amplitude of the pipeline could reach about 1.2 times diameter, and the maximum scour depth occurred on the wake side of the vibrating pipeline. In 2021, Huang [16] carried out two-dimensional numerical simulations to investigate the scour beneath a single pipeline and piggyback pipelines subjected to an oscillatory flow condition at a KC number of 11 and captured typical steady-streaming structures around the pipelines due to the oscillatory flow condition. In 2021, Cui [17] investigated the characteristics of the riverbed scour profile for a pipeline buried at different depths under the condition of riverbed sediments with different particle sizes. The results indicated that, in general, the equilibrium scour depth changed in a spoon shape with the gradual increase in the embedment ratio. In 2022, Li [18] used numerical simulation to study the influence of the burial depth of partially buried pipelines on the surrounding flow field, but they did not investigate the scour depth. In 2022, Zhu [19] performed experiments to prove that the scour hole propagation rate under a pipeline decreases with an increasing pipeline embedment ratio and rises with the KC number. In 2022, Najafzadeh [20] proposed equations for the prediction of the scouring propagation rate around pipelines due to currents based on a machine learning model, and the prediction results were consistent with the experimental data. In 2023, Ma [21] used the computational fluid dynamics coarse-grained discrete element method to simulate the scour process around a pipeline. The results showed that this method can effectively reduce the considerable need for computing resources and excessive computation time. In 2023, through numerical simulations, Hu [22] discovered that the water velocity and the pipeline diameter had a significant effect on the depth of scouring.
In the preceding works, the researchers investigated the mechanism of sediment scouring and the effect of various factors on the local scouring of submarine pipelines. However, submarine cables are buried beneath the seabed, while submarine pipelines are erected above the seabed. The difference in laying methods leads to a large discrepancy between their local scouring processes. Therefore, the conclusions of the above investigations are not applicable to the local scouring of submarine cables. Currently, there is no report on the research of the local scouring of partially exposed submarine cables.
In this paper, a three-dimensional computational fluid dynamics (CFD) finite element model, based on two-phase flow, is established using FLOW-3D. The local scouring process of semi-exposed submarine cables under steady-state ocean currents is studied, and the variation rules of the depth and the shape of the scouring holes, as well as the shear velocity with time, are obtained. By setting different critical Shields numbers of the sediment, different sediment densities, and different ocean current velocities, the change rule of the scouring holes’ development rate and the time required for the spanning of submarine cables are explored.

2. Sediment Scouring Model

In the sediment scouring model, the sediment is set as the dispersed particle, which is regarded as a kind of quasifluid. In this context, sediment scouring is considered as a two-phase flow process between the liquid phase and solid particle phase. The sediment in this process is further divided into two categories: one is suspended in the fluid, and the other is deposited on the bottom.
When the local Shields number of sediment is greater than the critical Shields number, the deposited sediment will be transformed into the suspended sediment under the action of ocean currents. The calculation formulae of the local Shields numbers θ and the critical Shields numbers θcr of sediment is given as [23,24]
θ = U f 2 ( ρ s / ρ f 1 ) g d 50 ,
θ c r = 0.3 1 + 1.2 D * + 0.055 ( 1 e 0.02 D * ) ,
D * = d 50 ρ f ( ρ s ρ f ) g / μ 2 3 ,
where Uf is the shearing velocity of bed surface, ρs is the density of the sediment particle, ρf is the fluid density, g is the acceleration of gravity, d50 is the median size of sediment, and μ is the dynamic viscosity of sediment.
And each sediment particle suspended in the fluid obeys the equations for mass conservation and energy conservation
c s t + ( u ¯ c s ) = 0 ,
u s t + u ¯ u s = 1 ρ s P + F K f s ρ s u r ,
where cs is the concentration of the sediment particle, u ¯ is the mean velocity vector of the fluid and the sediment particle, us is the velocity of the sediment particle, fs is the volume fraction of the sediment particle, P is the pressure, F is the volumetric and viscous force, K is the drag force, and ur is the relative velocity.

3. Numerical Setup and Modeling

In this paper, a three-dimensional submarine cable local scouring simulation model is established by FLOW-3D. Based on the numerical simulation, the process of the submarine cable, which gradually changes from semi-exposed to the spanning state under the steady-state ocean current, is studied. The geometric modeling, the mesh division, the physical field setup, and the grid independent test of CFD numerical model are as follows.

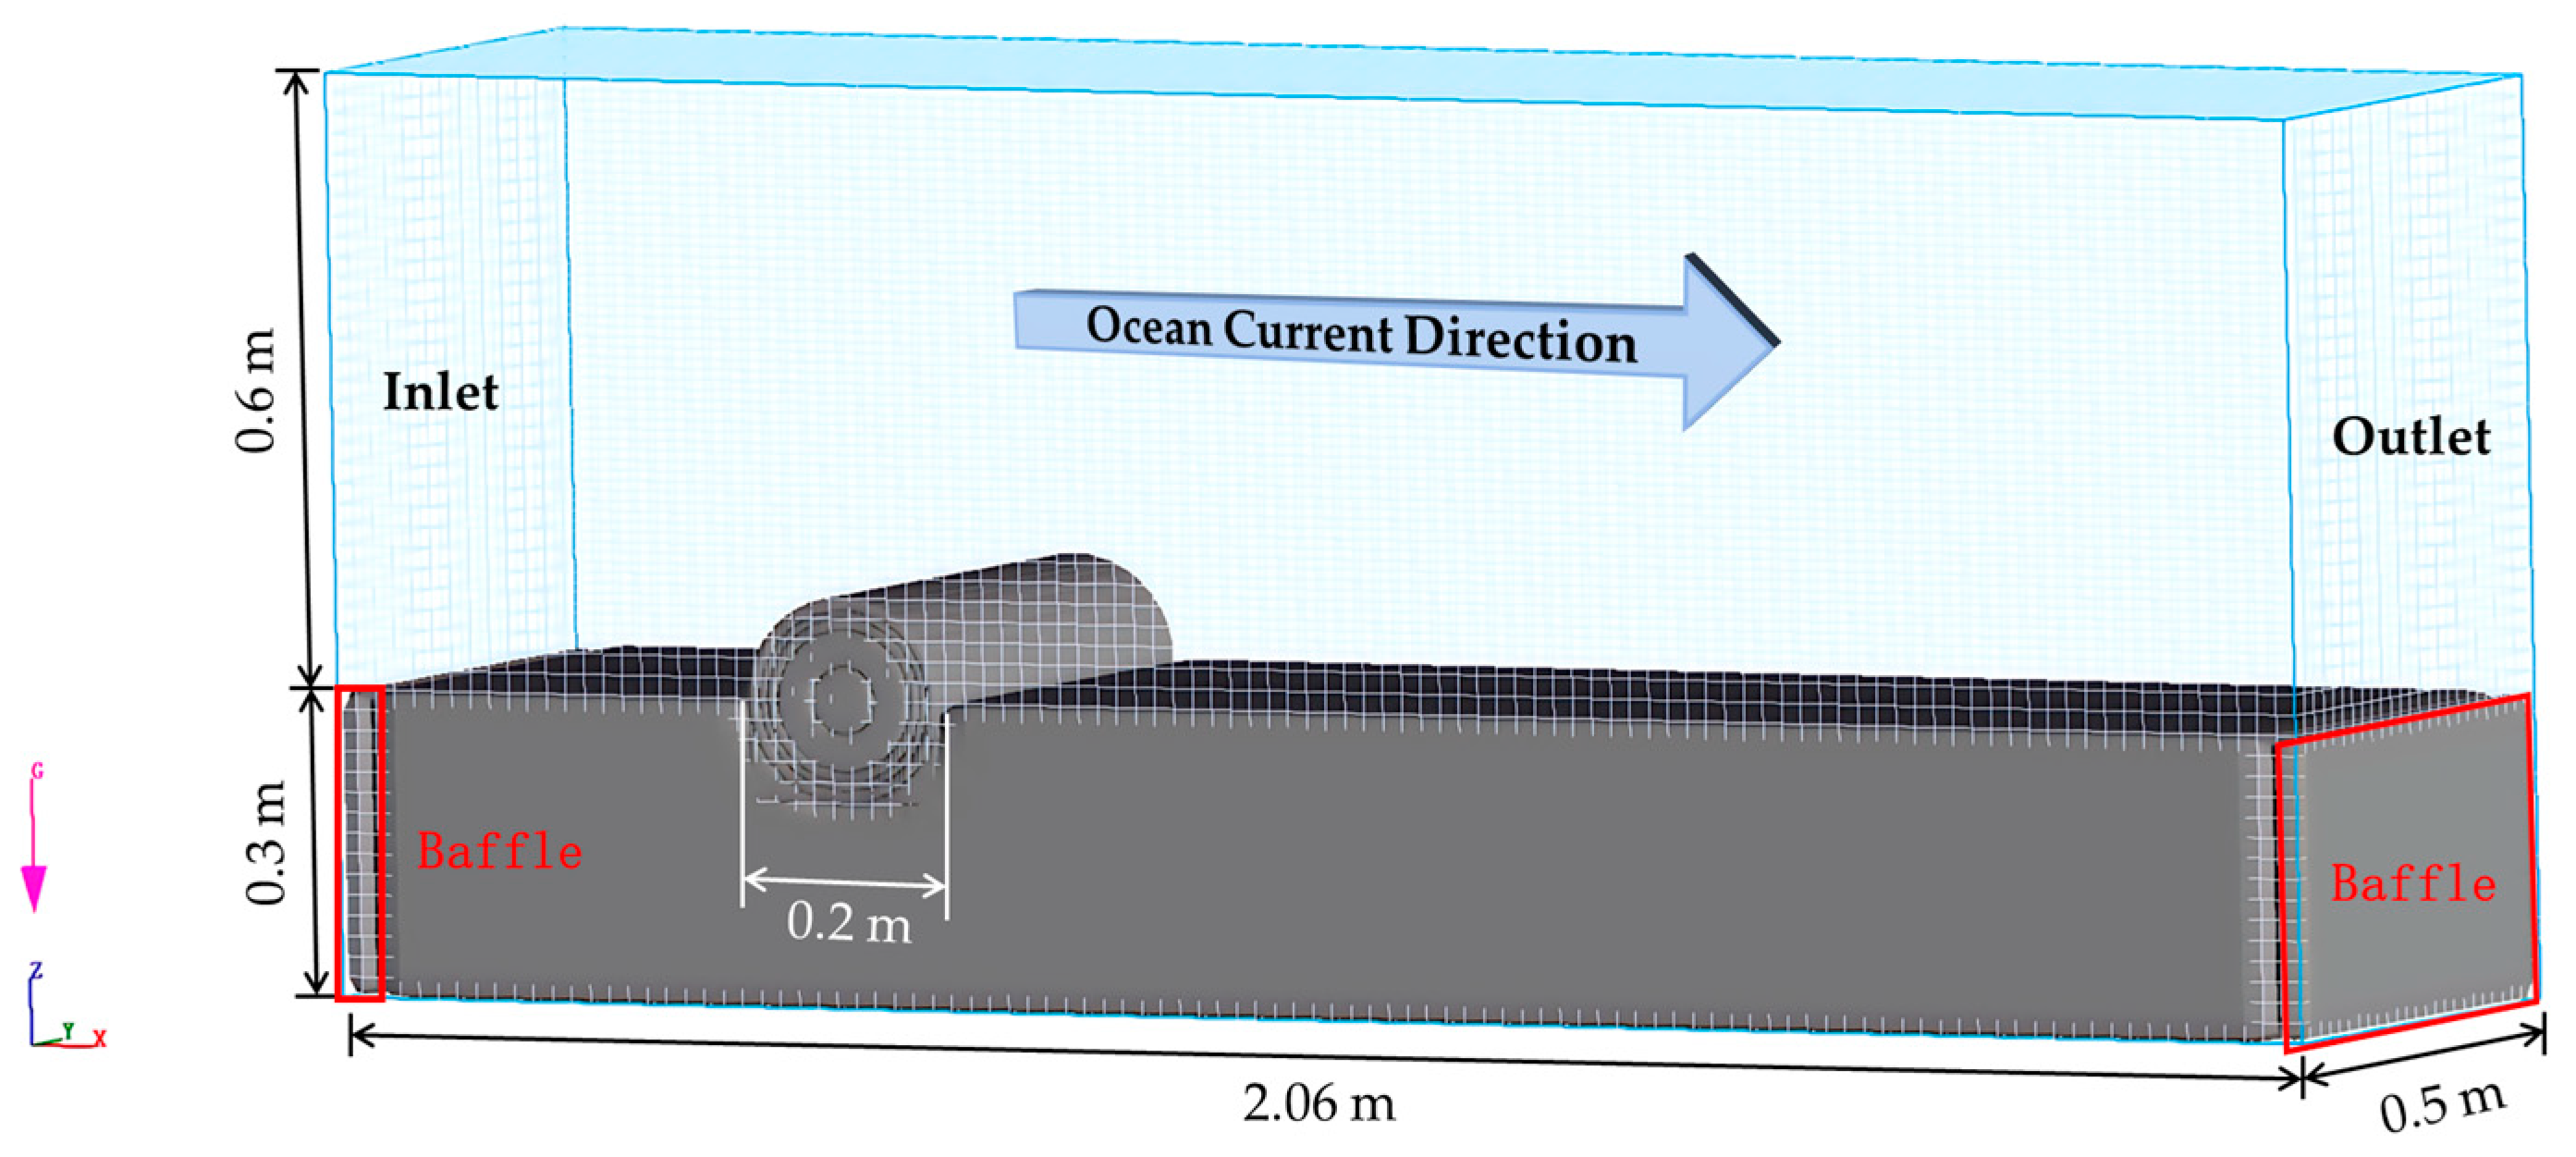
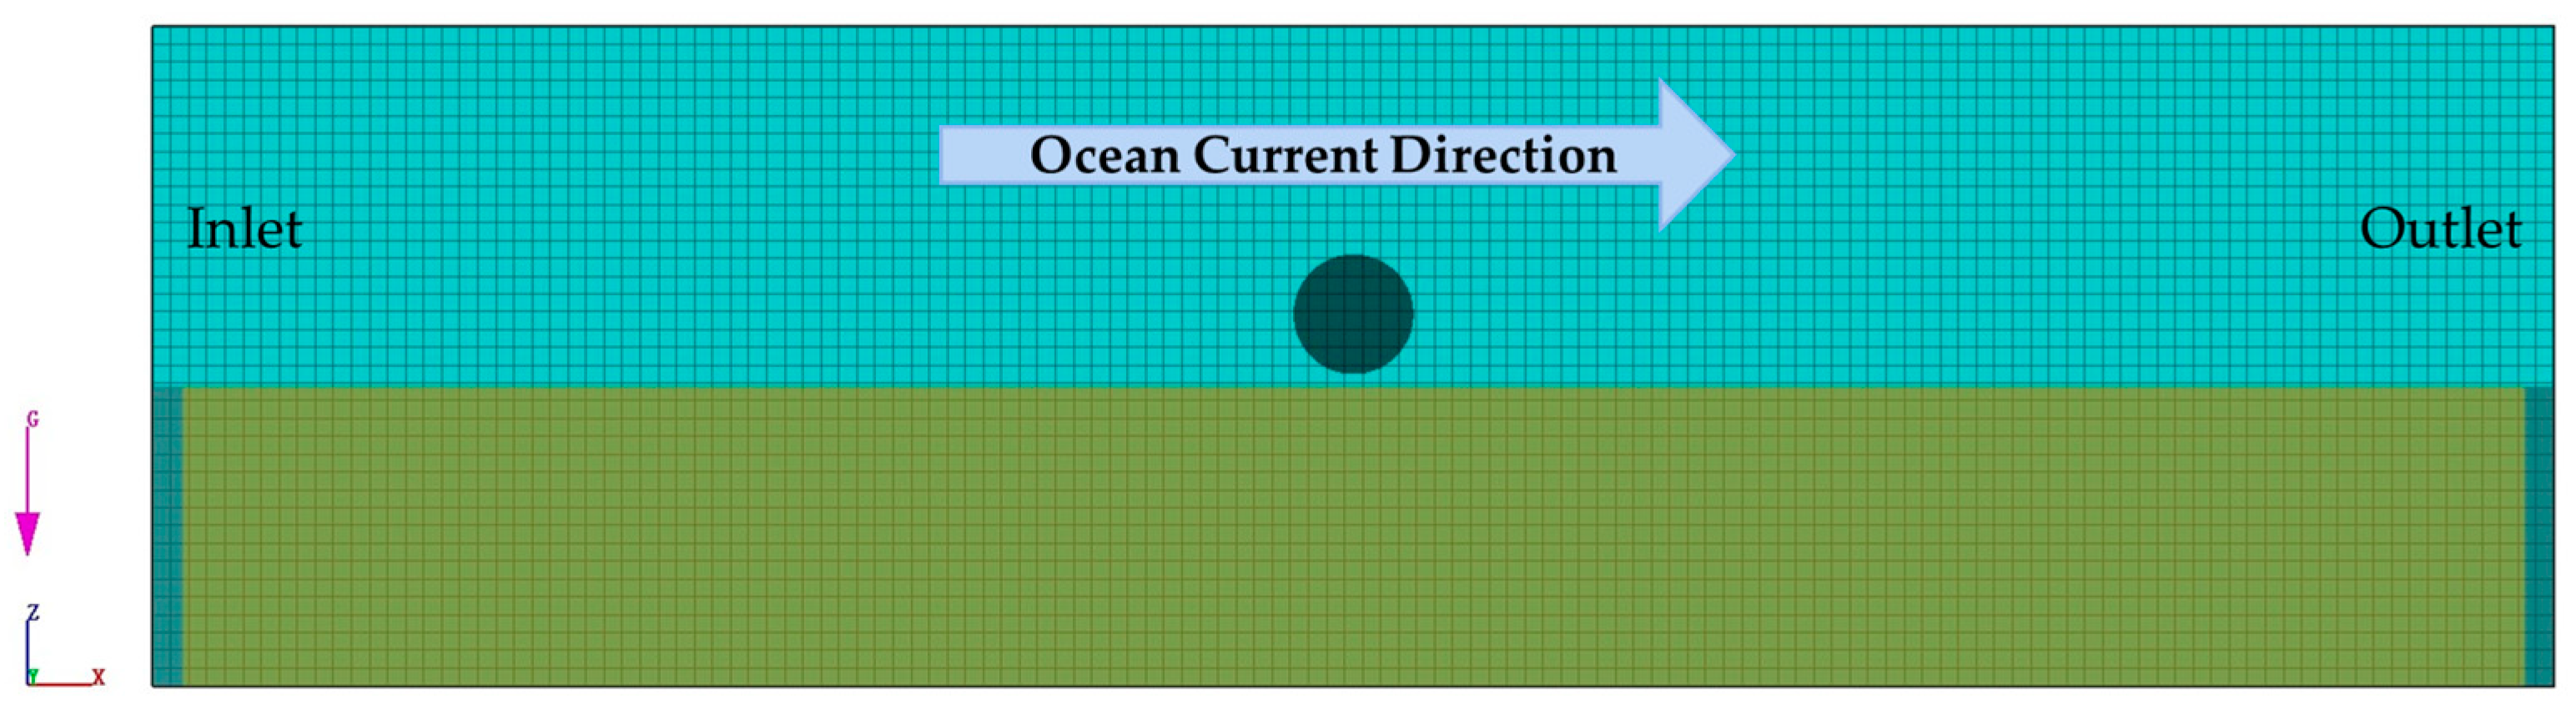
3.1. Geometric Modeling and Mesh Division

A three-dimensional (3D) numerical model of the local scouring of a semi-exposed submarine cable is established, which is shown in Figure 1. The dimensions of the model are marked in Figure 1. The inlet direction of the ocean current is defined as the upstream of the submarine cable (referred to as upstream), and the outlet direction of the ocean current is defined as the downstream of the submarine cable (referred to as downstream).
The submarine cable with a diameter of 0.2 m is positioned on sediment that is initially in a semi-exposed state. When the length of the span is short, the submarine cable will not show obvious deformation due to gravity or scouring from the ocean current. Therefore, the submarine cable surface is set as the fixed boundary. The model’s left boundary is set as the inlet, the right boundary is set as the outlet, the front and rear boundaries are set as symmetry, and the bottom boundary is set as the non-slip wall. Since the water depth above the submarine cable is more than 0.6 m in practice, the top boundary of the model is also set as symmetry. The sediment near the inlet and the outlet will be carried by ocean currents, which leads to the abnormal scouring terrain. At each end of the sediment, a baffle (thickness of 3 cm) is installed to ensure that the simulation results can reflect the real situation.
Due to the fact that the flow field around the semi-exposed submarine cable is not a simple two-dimensional symmetrical distribution, it should be solved by three-dimensional numerical simulation. Considering the accuracy and efficiency of the calculation, the size of mesh is set to 0.02 m. The total number of meshes after the dissection is 133,254.

3.2. Physical Field Setup

The CFD finite element model contains four physical field modules: sediment scouring module, gravity and non-inertial reference frame module, density evaluation module, and viscosity and turbulence module. In this paper, the renormalization group (RNG) k-ε turbulence model is used, which has high computational accuracy for turbulent vortices. Therefore, this turbulence model is suitable for calculating the sediment scouring process around the semi-exposed submarine cable [25]. The key parameters of the numerical simulation are referring to the survey results of submarine sediments in the Korean Peninsula [26], as listed in Table 1.

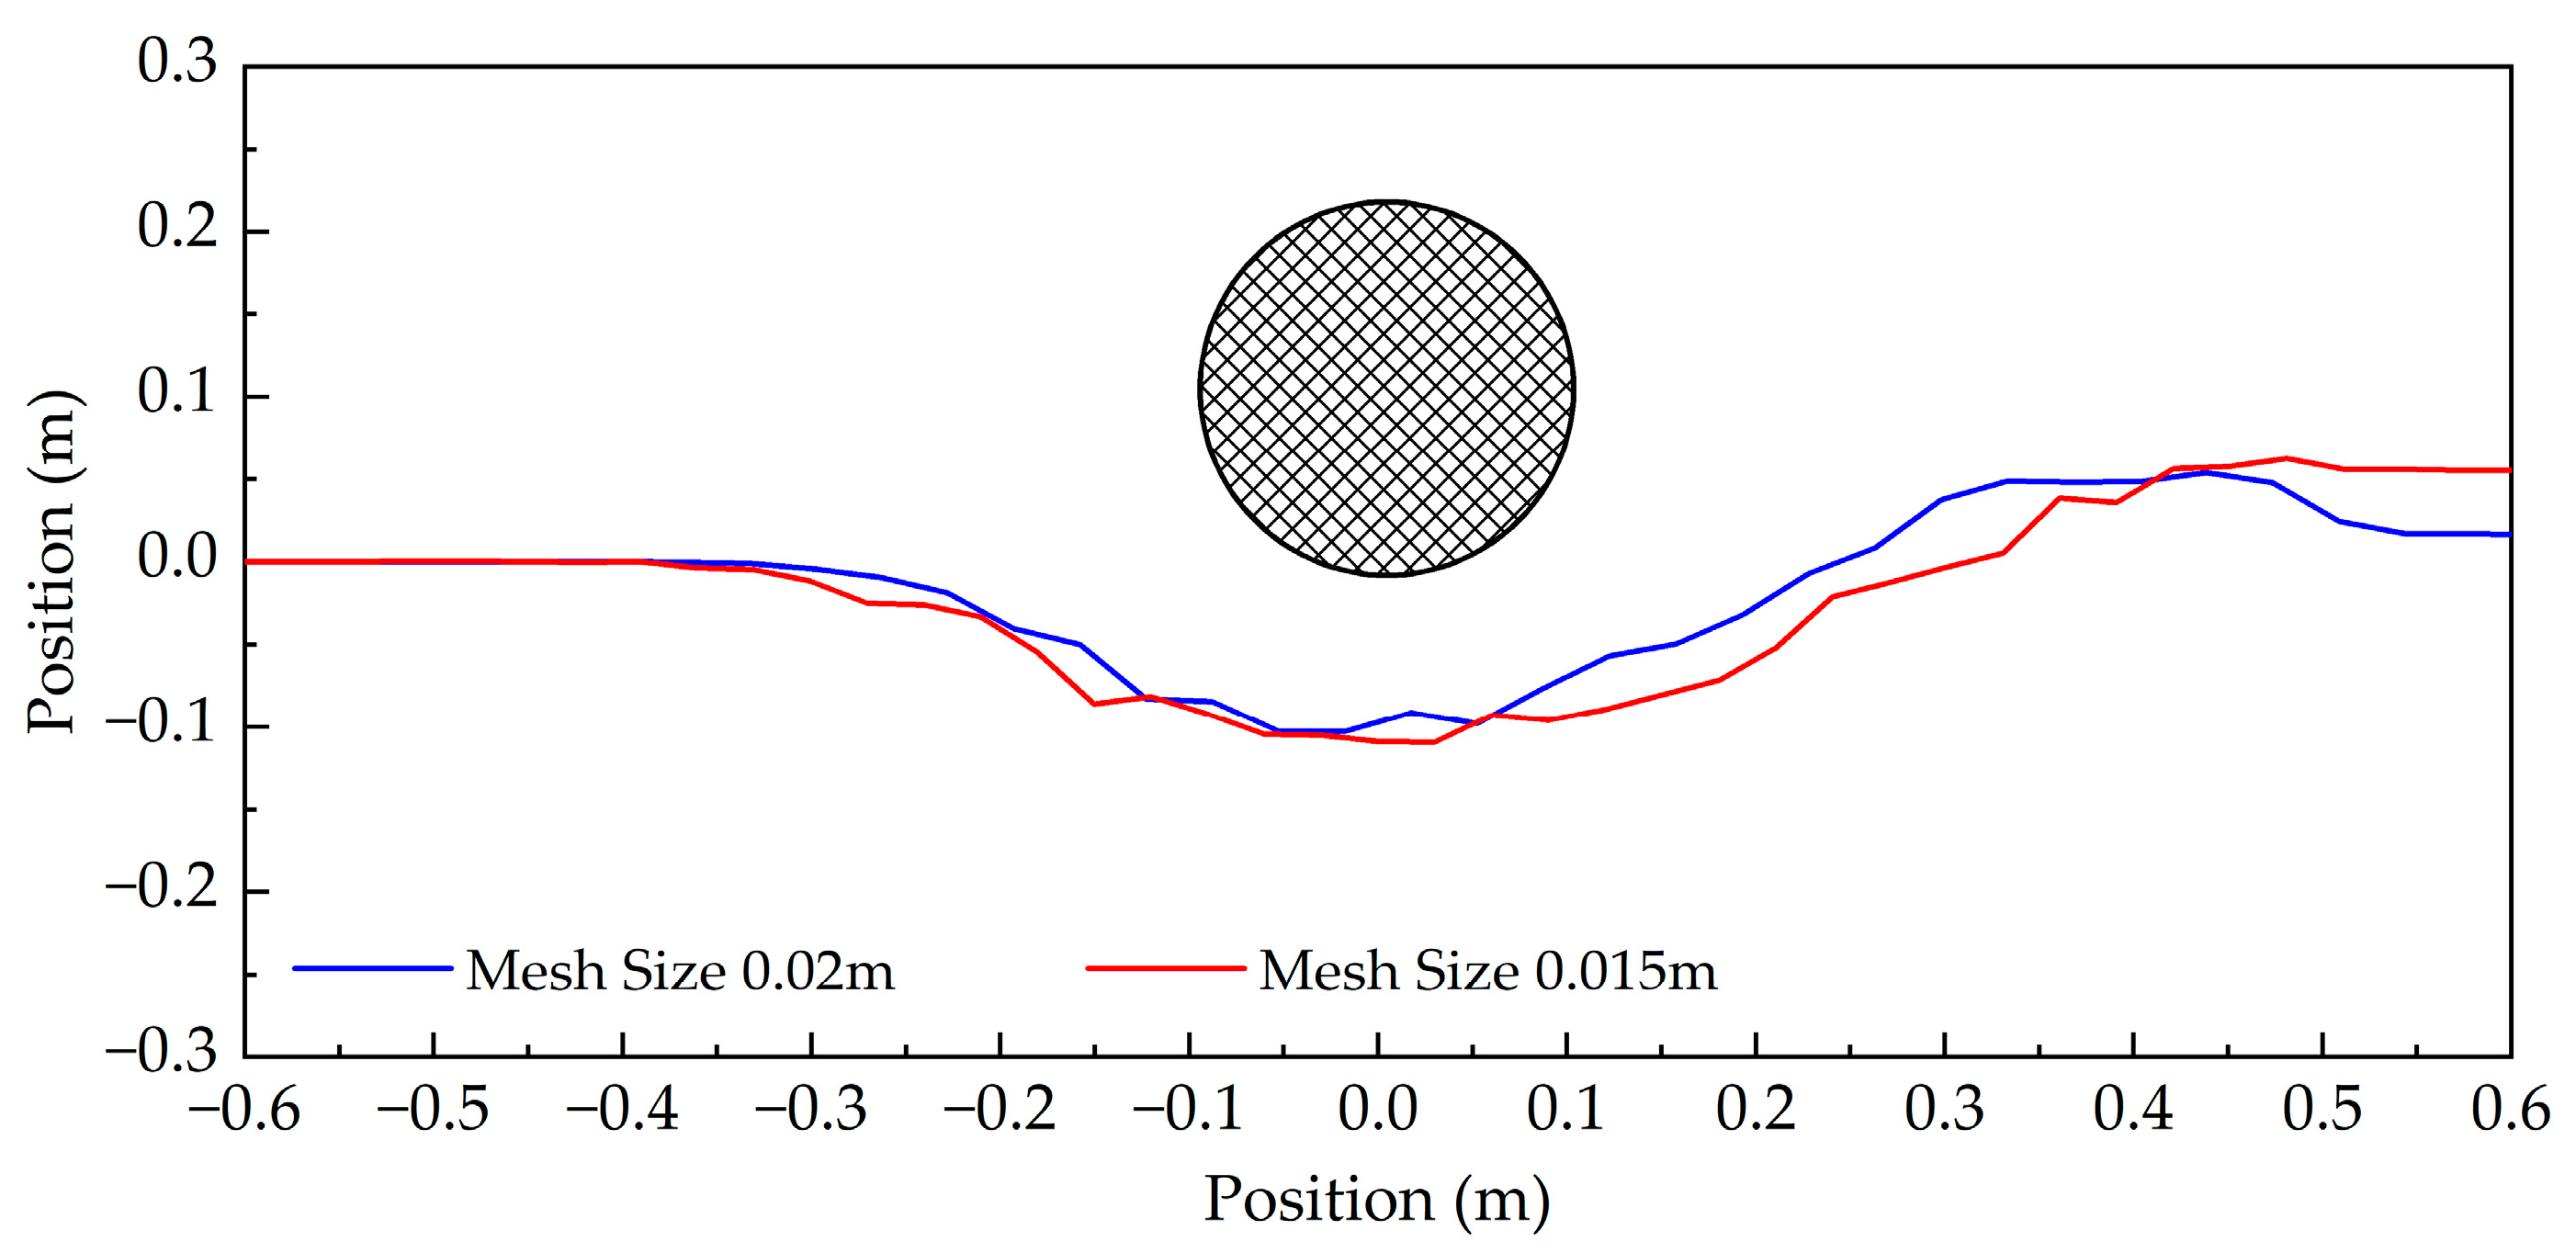
3.3. Mesh Independent Test

In order to eliminate errors caused by the quantity of grids in the calculation process, two sizes of mesh are set on the validation model, and the scour profiles under different mesh sizes are compared. The validation model is shown in Figure 2, and the scouring terrain under different mesh size is given in Figure 3.
It can be seen from Figure 3 that with the increase in the number of meshes, the scouring terrain of the verification model changes slightly, and the scouring depth is basically unchanged. Considering the accuracy of the numerical simulation and the calculation’s time cost, it is reasonable to consider setting the mesh size to 0.02 m.

4. Results and Analysis

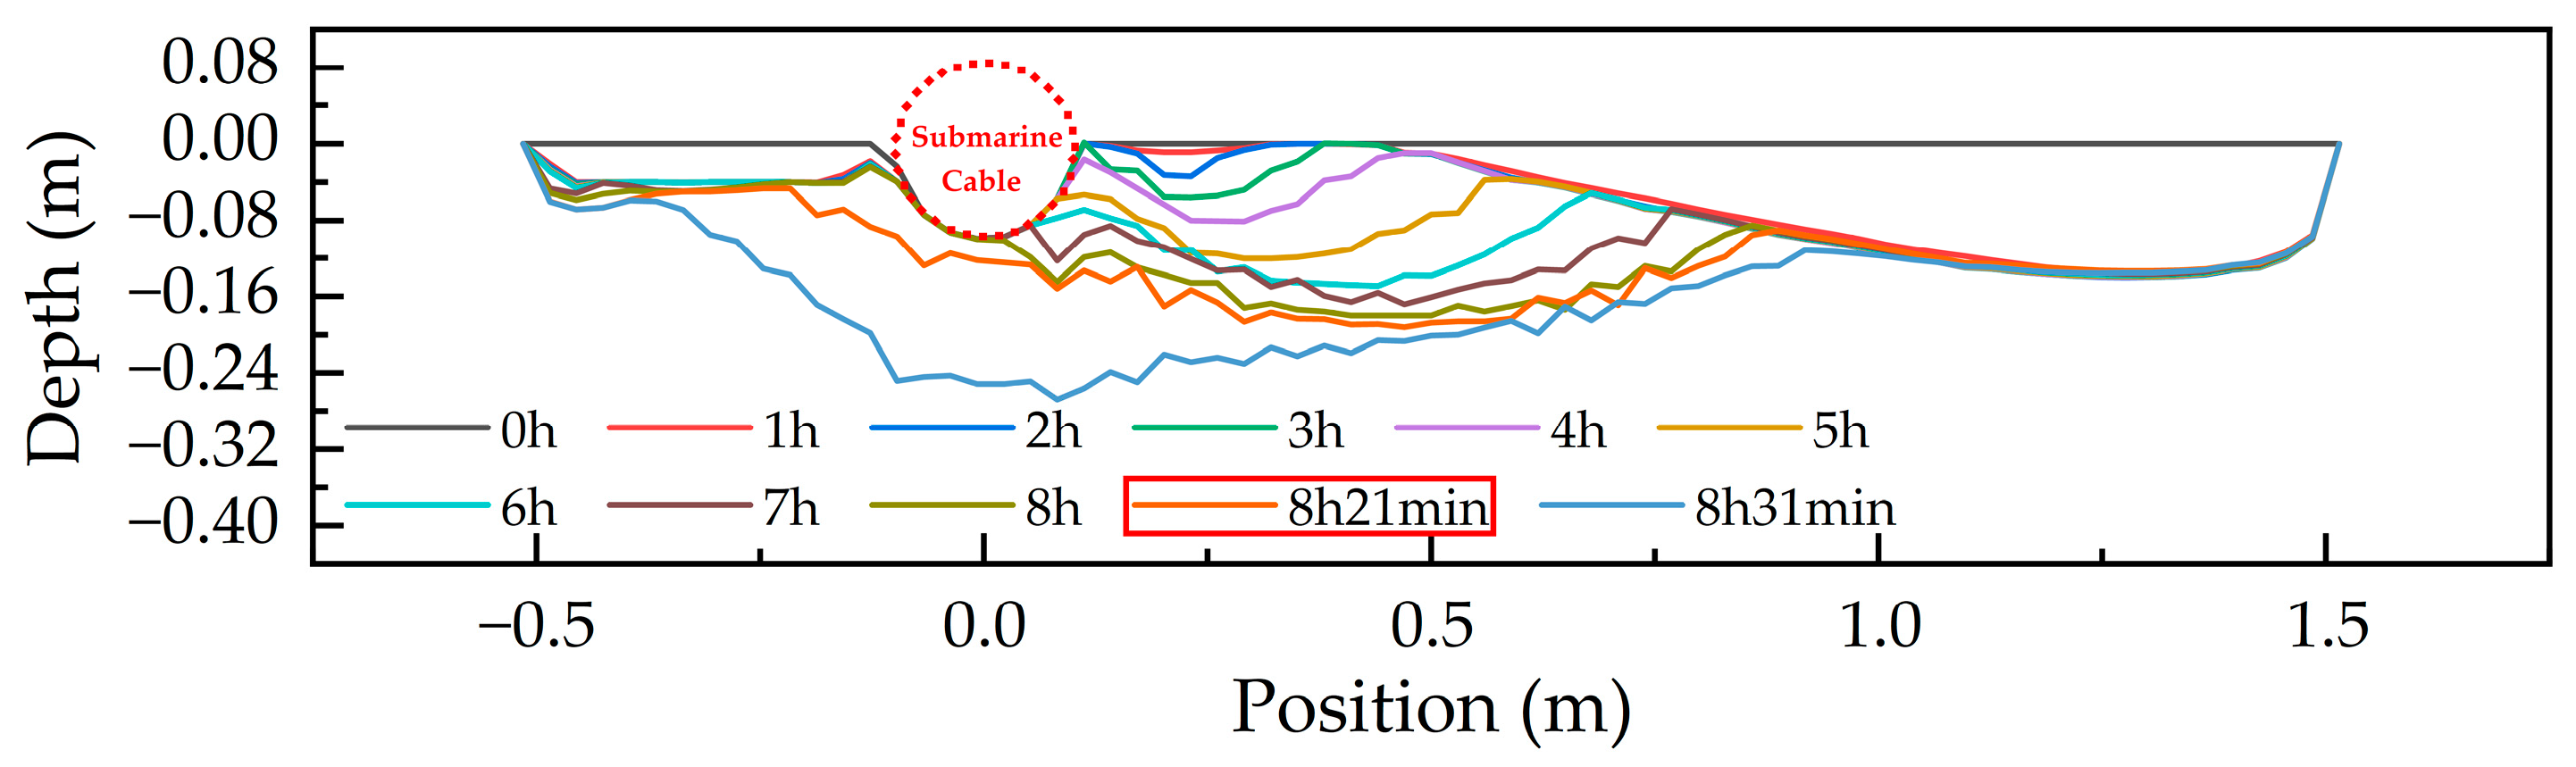
4.1. Analysis of Local Scouring Process

Based on the CFD finite element numerical simulation, the local scouring process of the submarine cable under the steady-state ocean current is analyzed. The end time of the simulation is 9 h, the initial time step is 0.01 s, and the fluid velocity is 0.40 m/s. Simulation results are saved every minute. Figure 4 illustrates the scouring terrain around the semi-exposed submarine cable, which has been scoured by the steady-state current for 5 h.
As can be seen from Figure 4, three scouring holes were separately formed in the upstream wake position and downstream of the semi-exposed submarine cable. The scouring holes are labeled according to their locations. The variation of the scouring terrain around the semi-exposed submarine cable over time is given in Figure 5. The red circle in the picture corresponds to the position of the submarine cable, and the red box in the legend marks the time when the submarine cable is spanning.
From Figure 5, in the first hour of scouring, the upstream (−0.5 m to −0.1 m) and downstream (0.43 m to 1.5 m) scouring holes appeared. The upstream scouring hole was relatively flat with depth of 0.04 m. The depth of the downstream scouring hole increased with the increase in distance, and the maximum depth was 0.13 m. The scouring hole that developed at the wake position was very shallow, and its depth was only 0.007 m.
In the second hour of scouring, the upstream scouring hole’s depth remained nearly constant. The depth of the downstream scouring hole only increased by 0.002 m. The scouring hole at the wake position developed steadily, and its depth increased from 0.007 m to 0.014 m.
The upstream and downstream scouring holes did not continue to develop during the third to the sixth hour. Compared to the first two hours, the development of scouring holes at the wake position accelerated significantly, with an average growth rate of 0.028 m/h. The growth rate in the fifth hour of the scouring hole at the wake position was slightly faster than the other times. After 6 h of scouring, the sediment on the right side of the submarine cable had been hollowed out.
In the seventh and the eighth hour of scouring, the upstream scouring hole’s depth increased slightly, the downstream scouring hole still remained stable, and the depth of the scouring hole at wake position increased by 0.019 m. The sediment under the submarine cable was gradually eroded as well. By the end of the eighth hour, the lower right part of the submarine cable had been exposed to water as well.
At 8 h 21 min of the scouring, the submarine cable was completely spanned, and the scouring holes were connected to each other. Within the next 10 min, the development of the scouring holes sped up significantly, and the maximum depth of scouring holes increased greatly to 0.27 m.
In reference [17], researchers have studied the local scouring process of semi-buried pipelines in sandy riverbeds through experiments. The test results show that the scouring process can be divided into a start-up stage, micropore formation stage, extension stage, and equilibrium stage. In this paper, the first three stages are simulated, and the results are in good agreement with the experiment, which proves the accuracy of the present numerical model.
In this research, the velocity of ocean currents at the sediment surface is defined as the shear velocity, which plays an important role in the process of local scouring. Figure 6 provides visual data on how the shear velocity varies over time.
The semi-exposed submarine cable protrudes from the seabed, which makes the shear velocity of its surface much higher than other locations. After the submarine cable is spanned, the shear velocity of the scouring hole surface below it is taken. This is the reason for the sudden change of shear velocity at the submarine cable’s location in Figure 6.
The shear velocity in the initial state of the upstream scouring hole is obviously greater than in subsequent times. After 1 h of scouring, the shear velocity in the upstream scouring hole rapidly decreased from 1.1 × 10⁻² m/s to 3.98 × 10⁻³ m/s and remained stable until the end of the sixth hour. This phenomenon explains why the upstream scouring hole developed rapidly in the first hour but remained stable for the following 5 h.
The shear velocity in the downstream scouring hole reduced at first and then increased; its initial value was 1.41 × 10⁻² m/s. It took approximately 5 h for the shear velocity to stabilize, and the stable shear velocity was 2.26 × 10⁻³ m/s. Therefore, compared with the upstream scouring hole, the downstream scouring hole was deeper and required more time to reach stability.
The initial shear velocity in the scouring hole at the wake position was only 7.1 × 10⁻³ m/s, which almost does not change in the first hour. This leads to a very slow development of the scouring hole at the wake position in the early stages. The maximum shear velocity in this scouring hole gradually increased to 1.05 × 10⁻² m/s from the second to the fifth hour, and then decreased to 6.61 × 10⁻³ m/s by the end of the eighth hour. This is why the scouring hole at the wake position grows fastest around the fifth hour. Consistent with the pattern of change in the scouring hole’s terrain, the location of the maximal shear velocity also shifted to the right with time.
The shear velocity of all three scouring holes rose dramatically in the last hour. Combined with the terrain in Figure 5, this can be attributed to the complete spanning of the submarine cable.
From Equations (3)–(5), one can see the movement of the sediment is related directly with the sediment’s critical Shields number, sediment density, and ocean current velocity. Based on the parameters in Table 1, the influence of the above parameters on the local scouring process of semi-exposed submarine cables will be discussed.

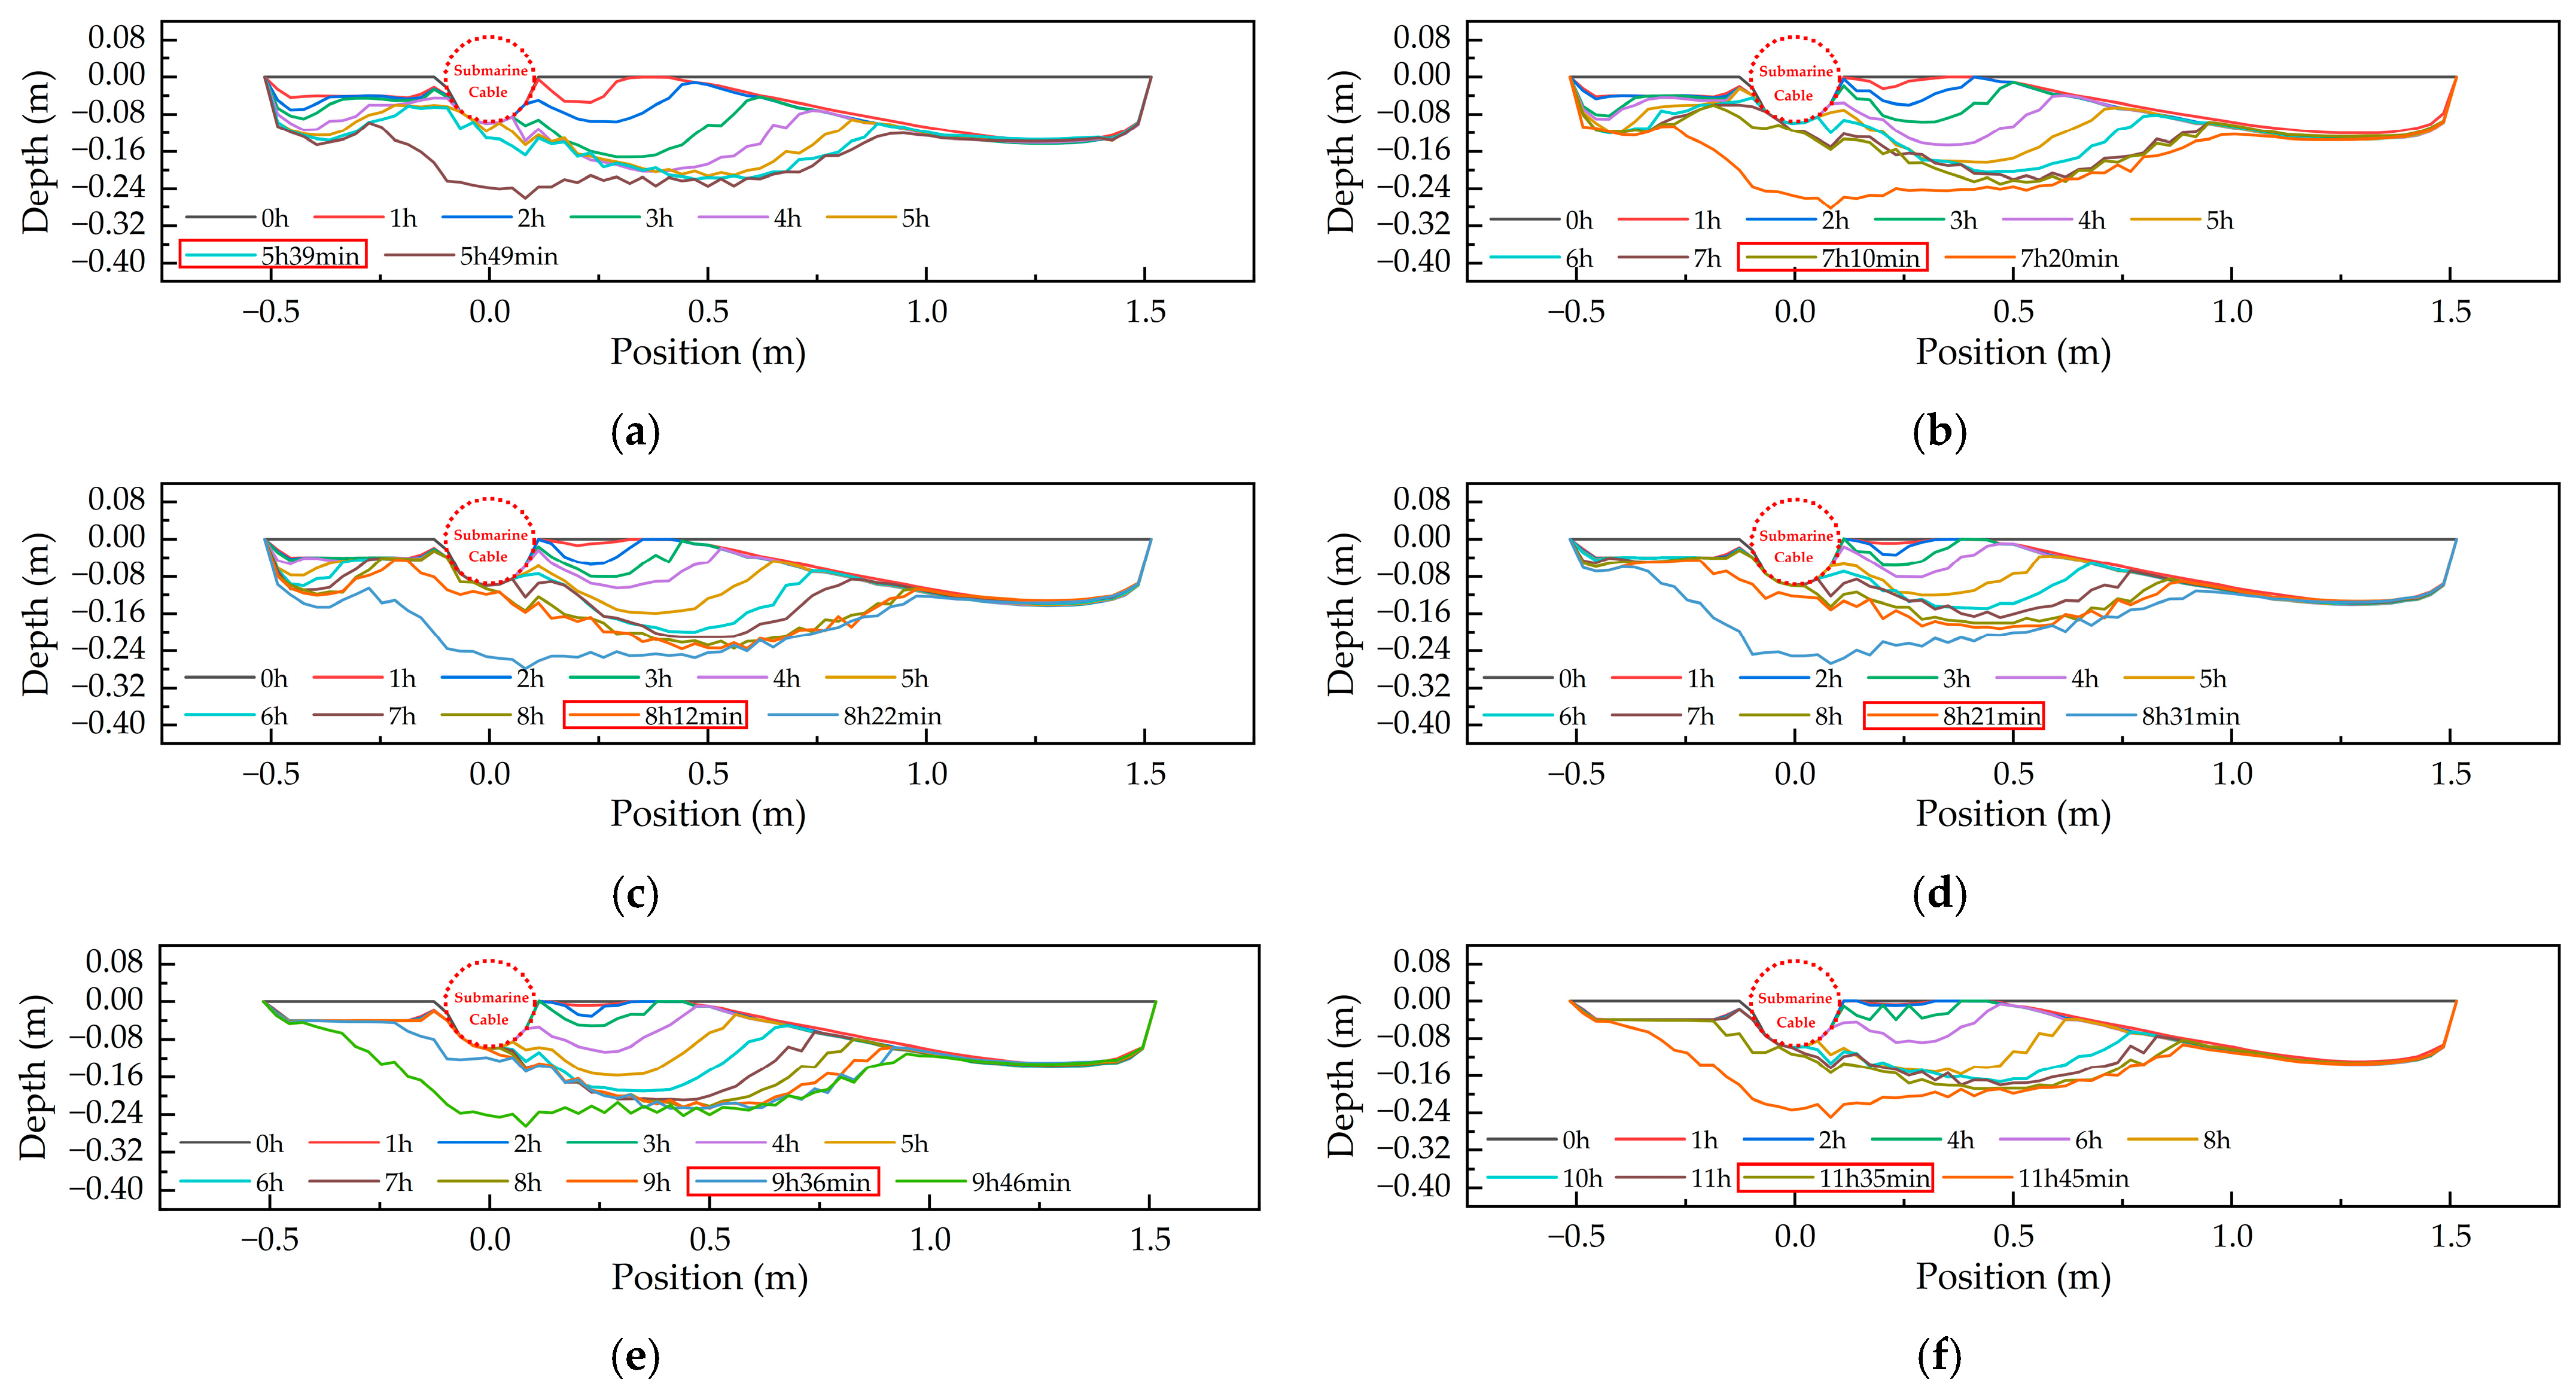
4.2. Influence Factors

4.2.1. Sediment’s Critical Shields Number

The sediment’s critical Shields number θcr is set as 0.02, 0.03, 0.04, 0.05, 0.06, and 0.07, and the variations of scouring terrain over time under each θcr are displayed in Figure 7.
From Figure 7, one can see that a change in θcr will affect the depth of the upstream scouring hole and the development speed of the scouring hole at the wake position, but it will have no significant impact on the expansion of the downstream scouring hole.
Under conditions of different θcr, the upstream scouring hole will reach a temporary plateau within 1 h, at which time the stable depth will be about 0.04 m. When θcr ≤ 0.05, the upstream scouring hole will continue to expand after a few hours. The stable time is obviously affected by θcr, which will gradually increase from 1 h to 11 h with the increase in θcr. The terrain of the upstream scouring hole will gradually convert to deep on the left and to shallow on the right. Since the scouring hole at the wake position has not been stable, its state at the time of submarine cable spanning is studied emphatically. In the whole process of scouring, the scouring hole at the wake position continues to develop and does not reach a stable state. With the increase in θcr, the development velocity of the scouring hole at the wake position will decrease considerably. Its average evolution velocity decreases from 3.88 cm/h to 1.62 cm/h, and its depth decreases from 21.9 cm to 18.8 cm. Under the condition of each θcr, the downstream scouring hole will stabilize within 1 h, and the stable depth will be basically unchanged (all about 13.5 cm).
As θcr increases, so does the sediment’s ability to withstand shearing forces, which will cause it to become increasingly difficult to be eroded or carried away by ocean currents. This effect has been directly reflected in the depth of scouring holes (upstream and wake position). Due to the blocking effect of semi-exposed submarine cables, the wake is elongated, which is why the downstream scouring hole develops before the scouring hole at the wake position and quickly reaches a stable state. However, due to the high wake intensity, this process is not significantly affected by the change of θcr.

4.2.2. Sediment Density

The density of sediment ρs is set as 1550 kg/m3, 1600 kg/m3, 1650 kg/m3, 1700 kg/m3, 1750 kg/m3, and 1800 kg/m3, and the variation of scouring terrain over time under each ρs are displayed in Figure 8.
From Figure 8, one can see that a change in ρs will also affect the depth of the upstream scouring hole and the development speed of the scouring hole at the wake position. In addition, it can even have an impact on the downstream scouring hole depth.
Under different ρs conditions, the upstream scouring hole will always reach a temporary stable state in 1 h, at which time the stable depth will be 0.04 m. When ρs ≤ 1750 kg/m3, the upstream scouring hole will continue to expand after a few hours. The stabilization time of upstream scouring hole is more clearly affected by ρs, which will gradually increase from 3 h to 13 h with the increase in ρs. The terrain of the upstream scouring hole will gradually change to deep on the left and to shallow on the right. Since the scouring hole at the wake position has not been stable, its state at the time of the submarine cable spanning is studied emphatically, too. In the whole process of scouring, the scouring hole at the wake position continues to develop and does not reach a stable state. When ρs is large, the development rate of scouring hole obviously decreased with time. With the increase in ρs, the development velocity of the scouring hole at the wake position reduces from 3.38 cm/h to 1.14 cm/h, and the depth of this scouring hole declines from 20 cm to 15 cm. As ρs increases, the stabilization time of the downstream scouring hole increases from less than 1 h to about 2 h, but the stabilization depth of the downstream scouring hole remains essentially the same (all around 13.5 cm).
As can be seen from Equation (1), the increase in ρs will reduce the Shields number, thus weakening the shear action of the sediment by the ocean current, which explains the extension of the stability time of the upstream scouring hole. At the same time, with the increase in the depth of scouring hole at the wake position, its shear velocity will decreases. Therefore, under a larger ρs value, the development speed of scouring hole at the wake position will decrease significantly with time. Possibly for the same reason, ρs can affect the development rate of downstream scouring hole.

4.2.3. Ocean Current Velocity

The ocean current velocity v is set as 0.35 m/s, 0.40 m/s, 0.45 m/s, 0.50 m/s, 0.55 m/s, and 0.60 m/s. Figure 9 presents the variation in scouring terrain with time for each v.
Changes in v affect the depth of the upstream and downstream scouring holes, as well as the development velocity of the wake position and downstream scouring holes.
When v ≤ 0.45 m/s, the upstream scouring hole will reach a temporary stable state within 1 h, at which point the stable depth will be 0.04 m. The stabilization time of the upstream scouring hole is affected by v, which will gradually decrease from 15 h to 3 h with the increase in v. When v > 0.45 m/s, the upstream scouring hole is going to expand continuously. With the increase in v, its average development velocity increases from 6.68 cm/h to 8.66 cm/h, and its terrain changes to deep on the left and to shallow on the right. When the submarine cable is spanning, special attention should be paid to the depth of the scouring hole at the wake position. Throughout whole scouring process, the scouring hole at the wake position continues to develop and does not reach a stable state. With the increase in v, the depth of scouring hole at the wake position will increase from 14 cm to 20 cm, and the average development velocity will increase from 0.91 cm/h to 10.43 cm/h. As v increases, the time required to stabilize the downstream scouring hole is shortened from 1to 2 h to less than 1 h, but the stable depth is remains nearly constant at 13.5 cm.
An increase in v will increase the shear velocity. Therefore, when the depth of the scouring hole increases, the shear velocity in the hole will also increase, which can deepen both the upstream and downstream scouring hole. According to Equation (1), the Shields number is proportional to the square of the shear velocity. The increase in shear velocity significantly intensifies local scouring, which increases the development rate of scouring holes at the wake position and downstream.

4.3. Variation Rule of Spanning Time

In this paper, the spanning time is defined as the time taken for a semi-exposed submarine cable (initial state) to become a spanning submarine cable. Figure 10 illustrates the effect of the above parameters on the spanning time of the semi-exposed submarine cable.
From Figure 10a, the spanning time monotonically increases with the increase in the critical Shields number of sediment. However, the slope of the curve decreases first and then increases, and the inflection point is at θcr = 4.59 × 10⁻². The relationship between spanning time t and sediment’s critical Shields number θcr can be formulated by a cubic function as shown in Equation (6):
t = 2.98 + 6.76 θ c r 1.45 θ c r 2 + 0.11 θ c r 3 .
It can be seen from Figure 10b that with the increase in the sediment density, the spanning time increases monotonically and linearly. The relationship between the spanning time t and the sediment’s density ρs can be formulated by the first order function as shown in Equation (7):
t = 41.59 + 30.54 ρ s .
Figure 10c shows that with the increase in the ocean current velocity, the spanning time decreases monotonically. The slope of the curve increases with the increase in the ocean current velocity, so it can be considered that there is saturation of the ocean current velocity effect. The relationship between the spanning time t and the ocean current velocity v can be formulated by the exponential function
t = 0.15 v 4.38 .

5. Conclusions

In this paper, a three-dimensional CFD finite element numerical simulation model is established, which is used to research the local scouring process of the semi-exposed submarine cable under the steady-state ocean current. The relationship between shear velocity and scouring terrain is discussed, the influence of sediment critical Shields number, sediment density and ocean current velocity on the local scouring process is analyzed, and the variation rules of the spanning time of the semi-exposed submarine cable is given. The conclusions are as follows:
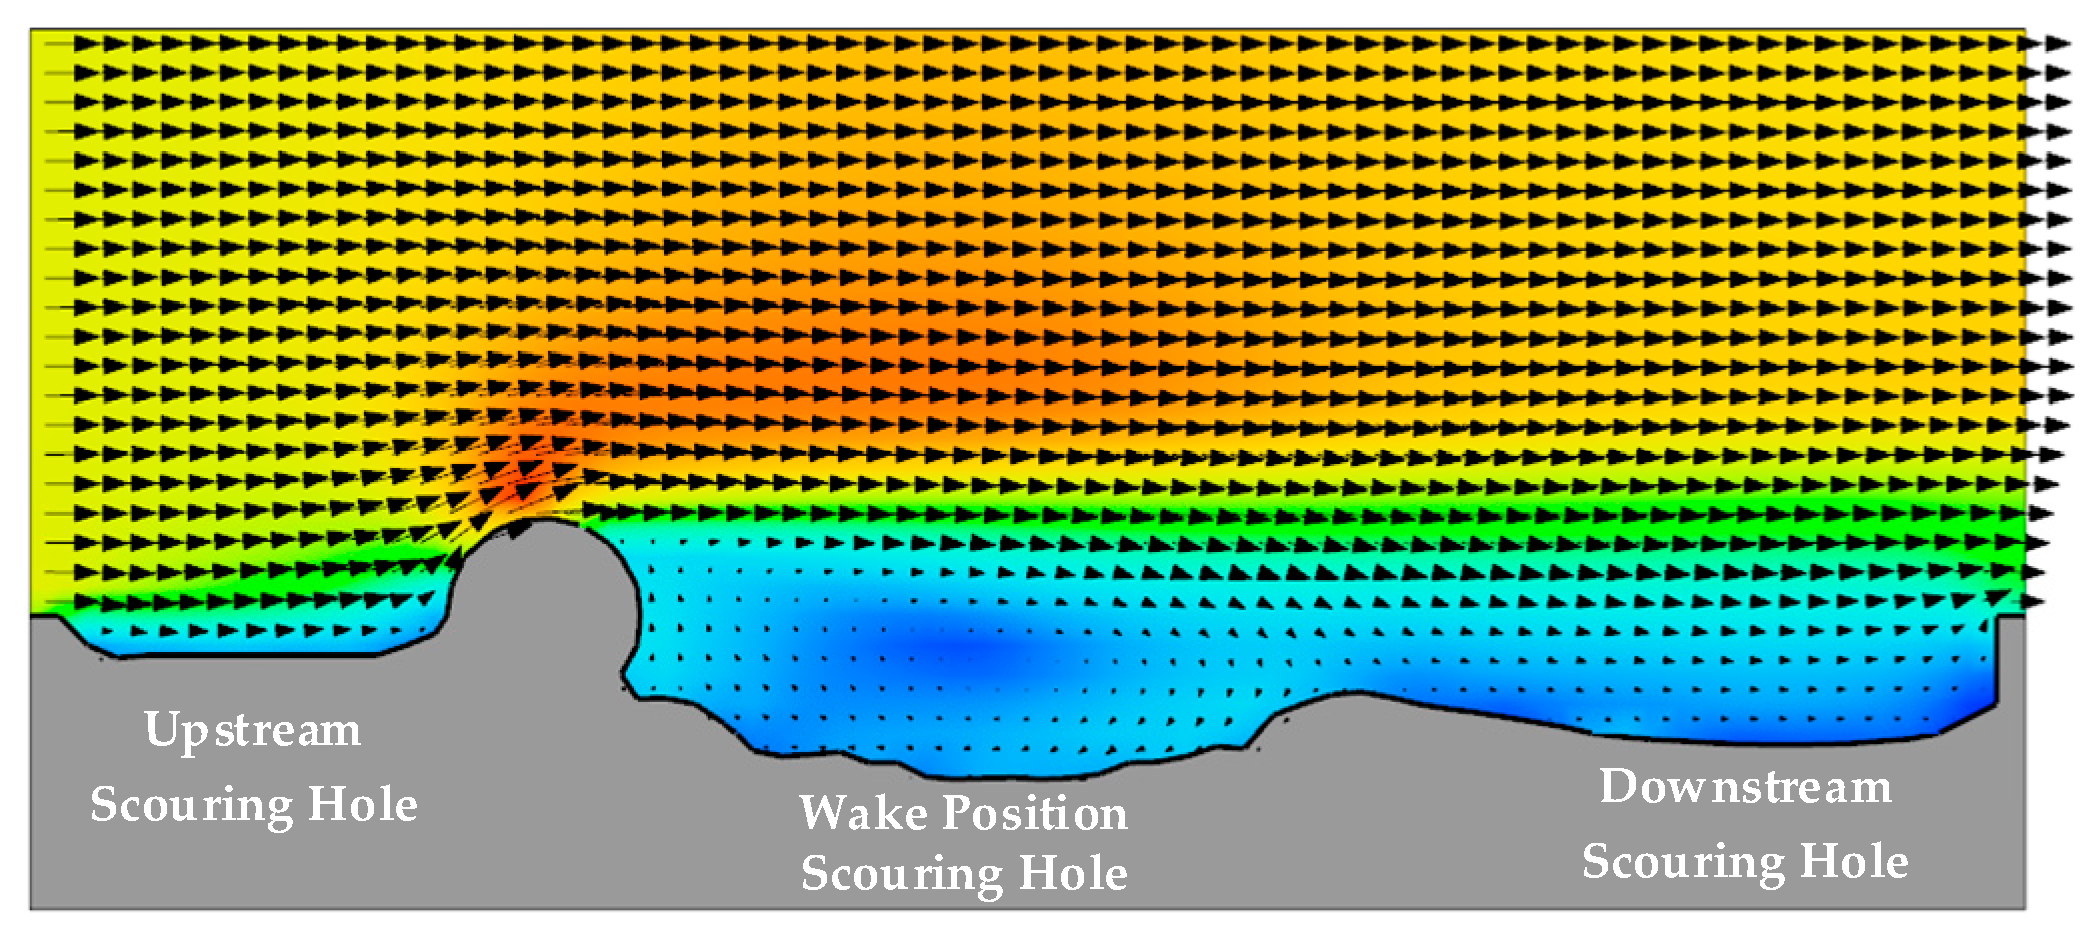
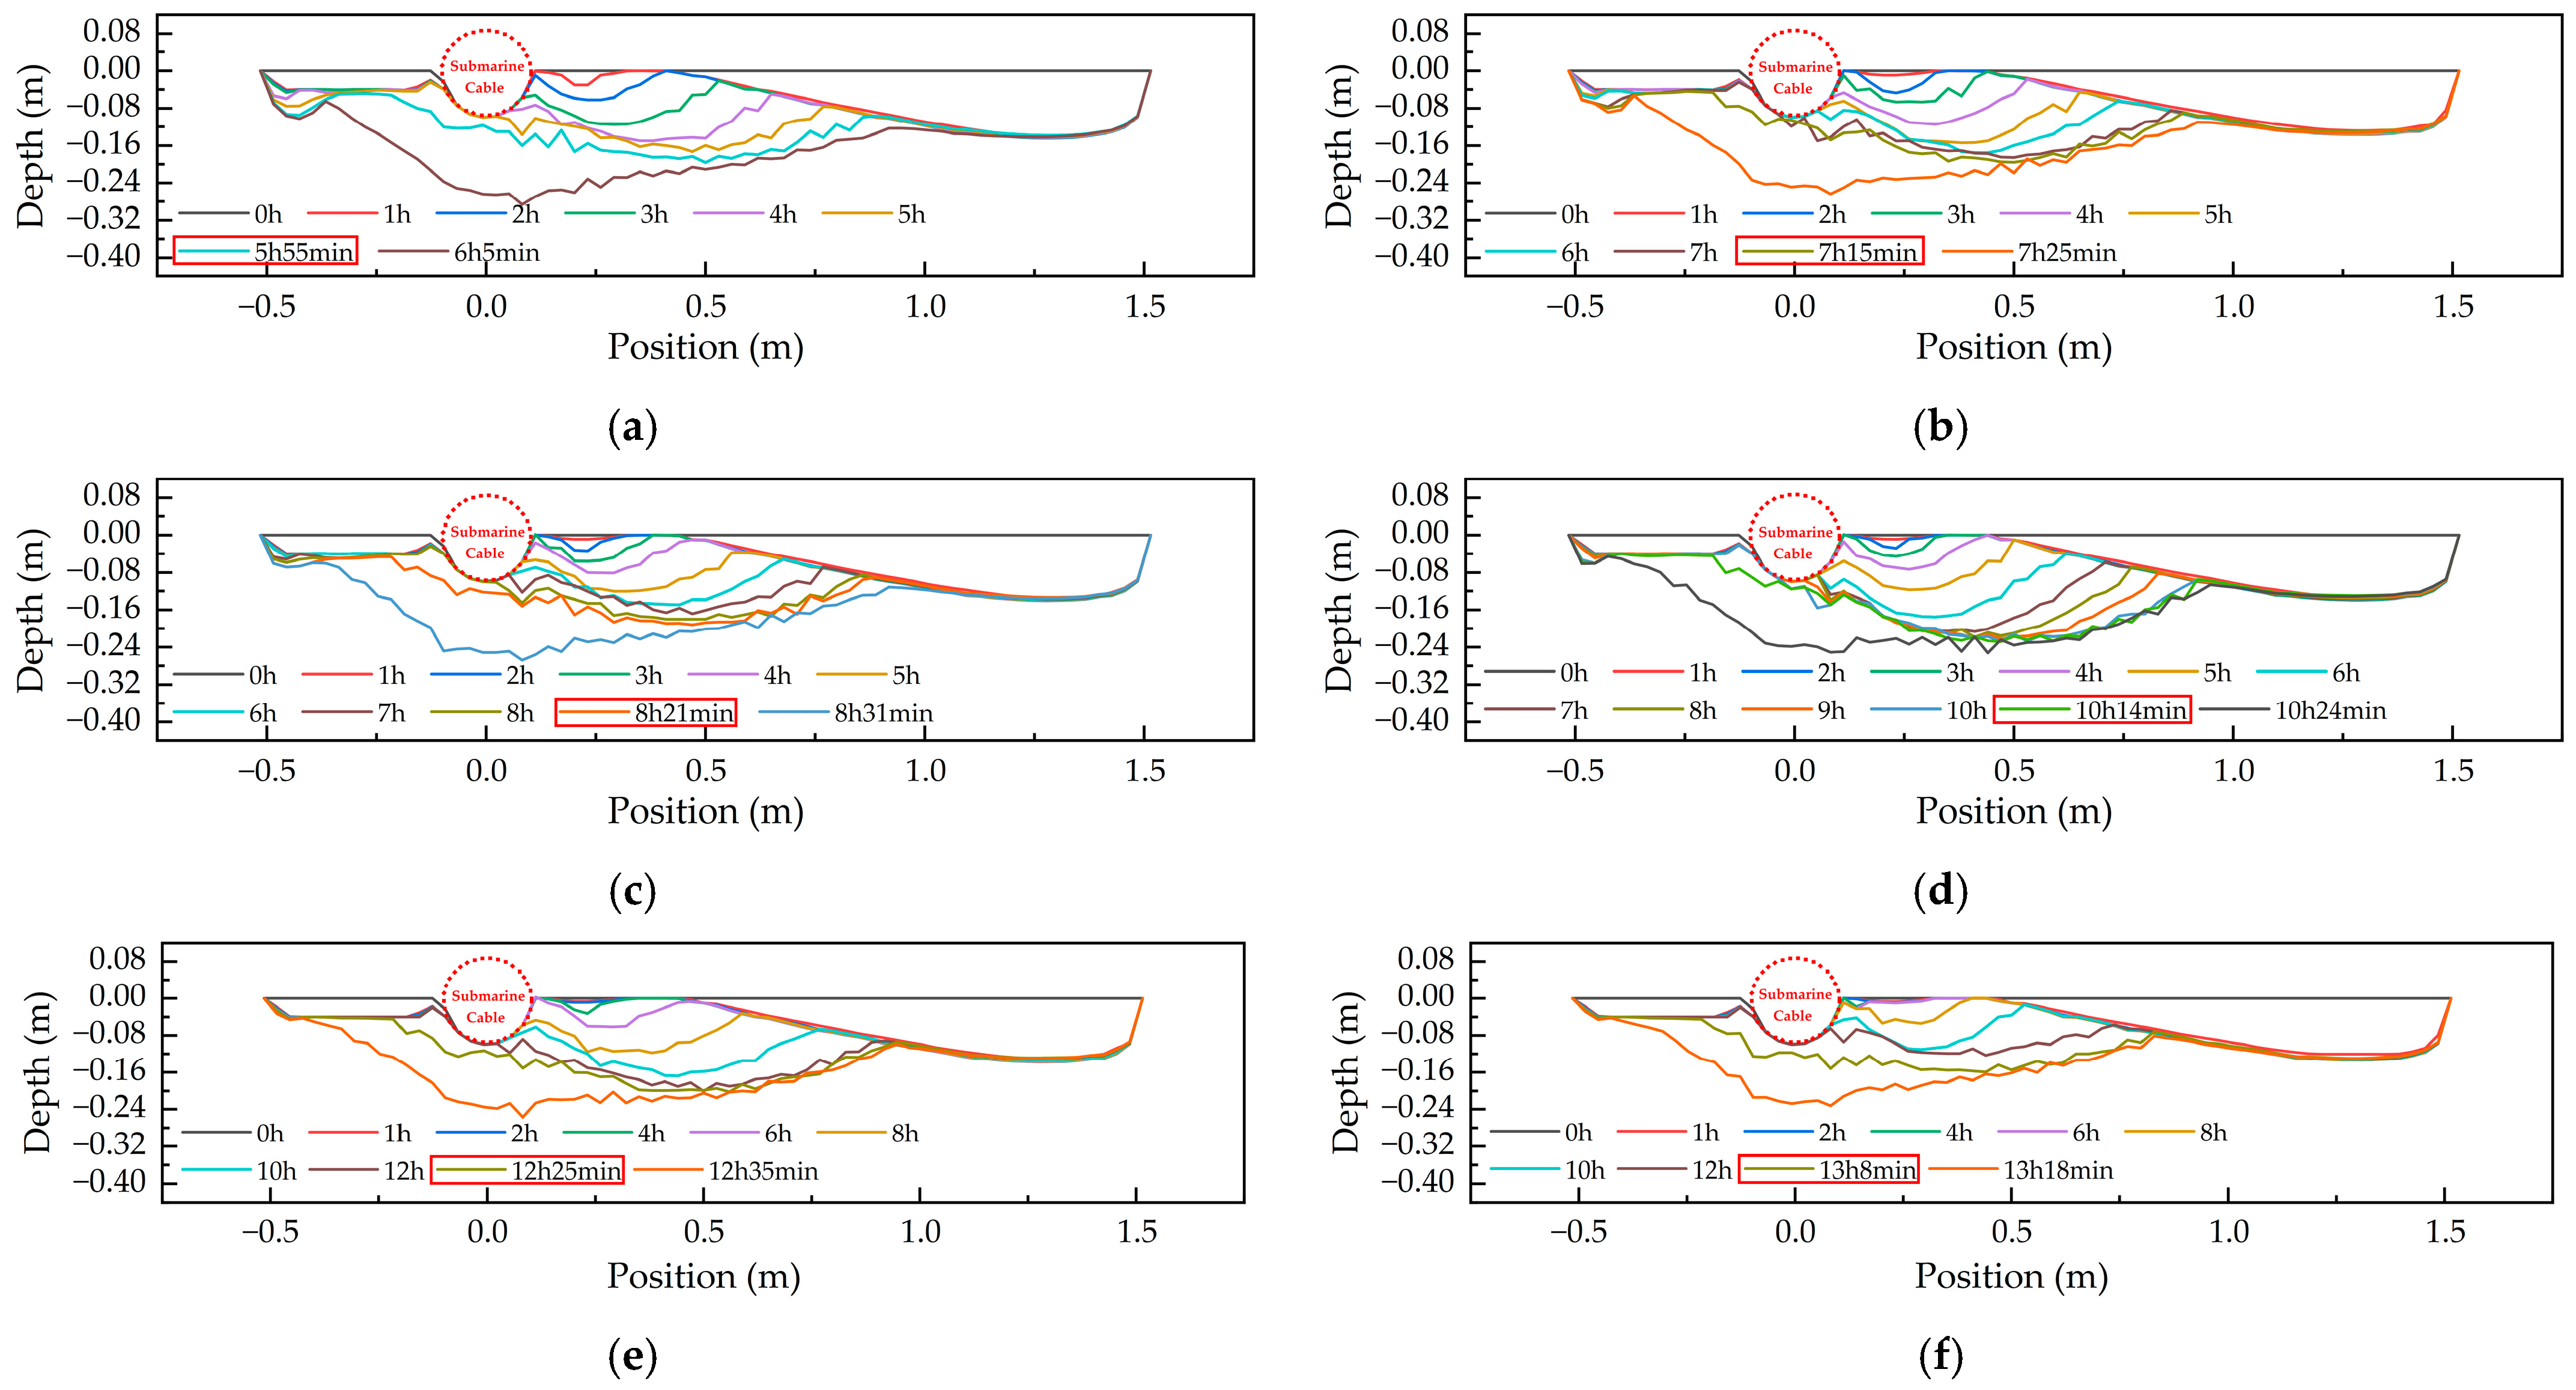
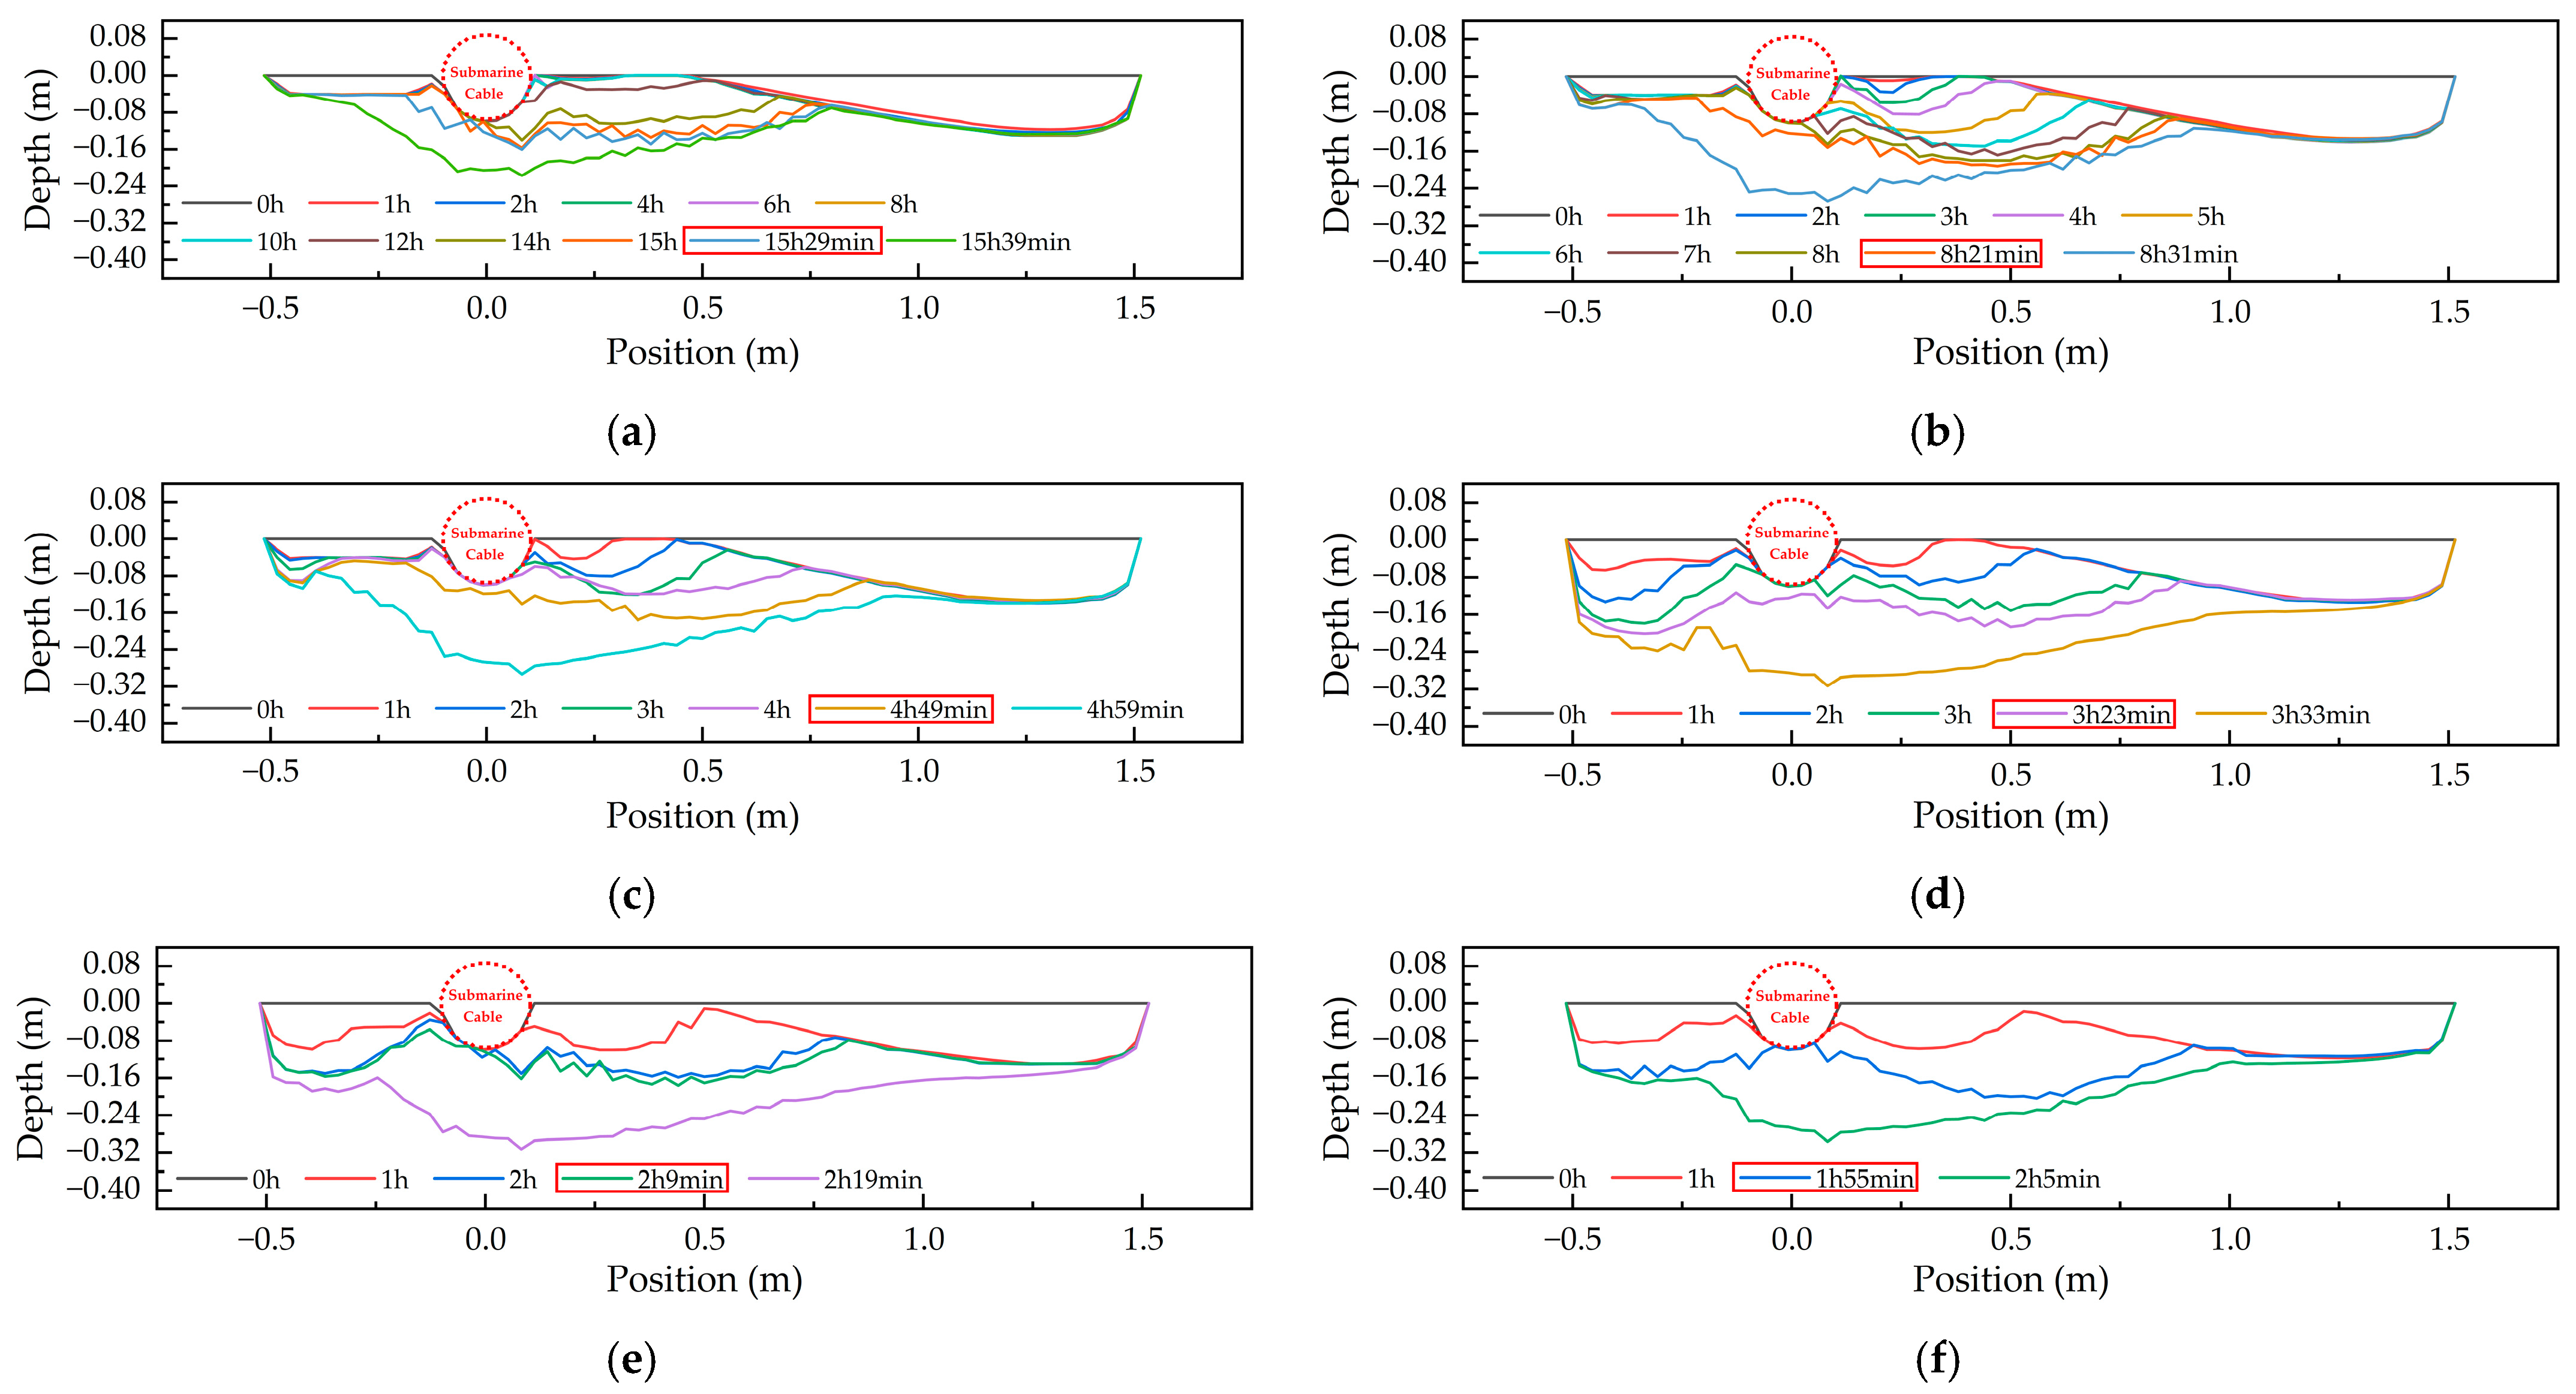
  • Under the steady-state ocean currents, scouring holes will be formed at the upstream, wake position and downstream of the semi-exposed submarine cable. The upstream and downstream scouring holes develop faster, which will reach a temporary stable state at about 1 h after the start of the scouring. The scouring hole at the wake position will continue to expand at a slower rate and eventually lead to the spanning of the submarine cable.
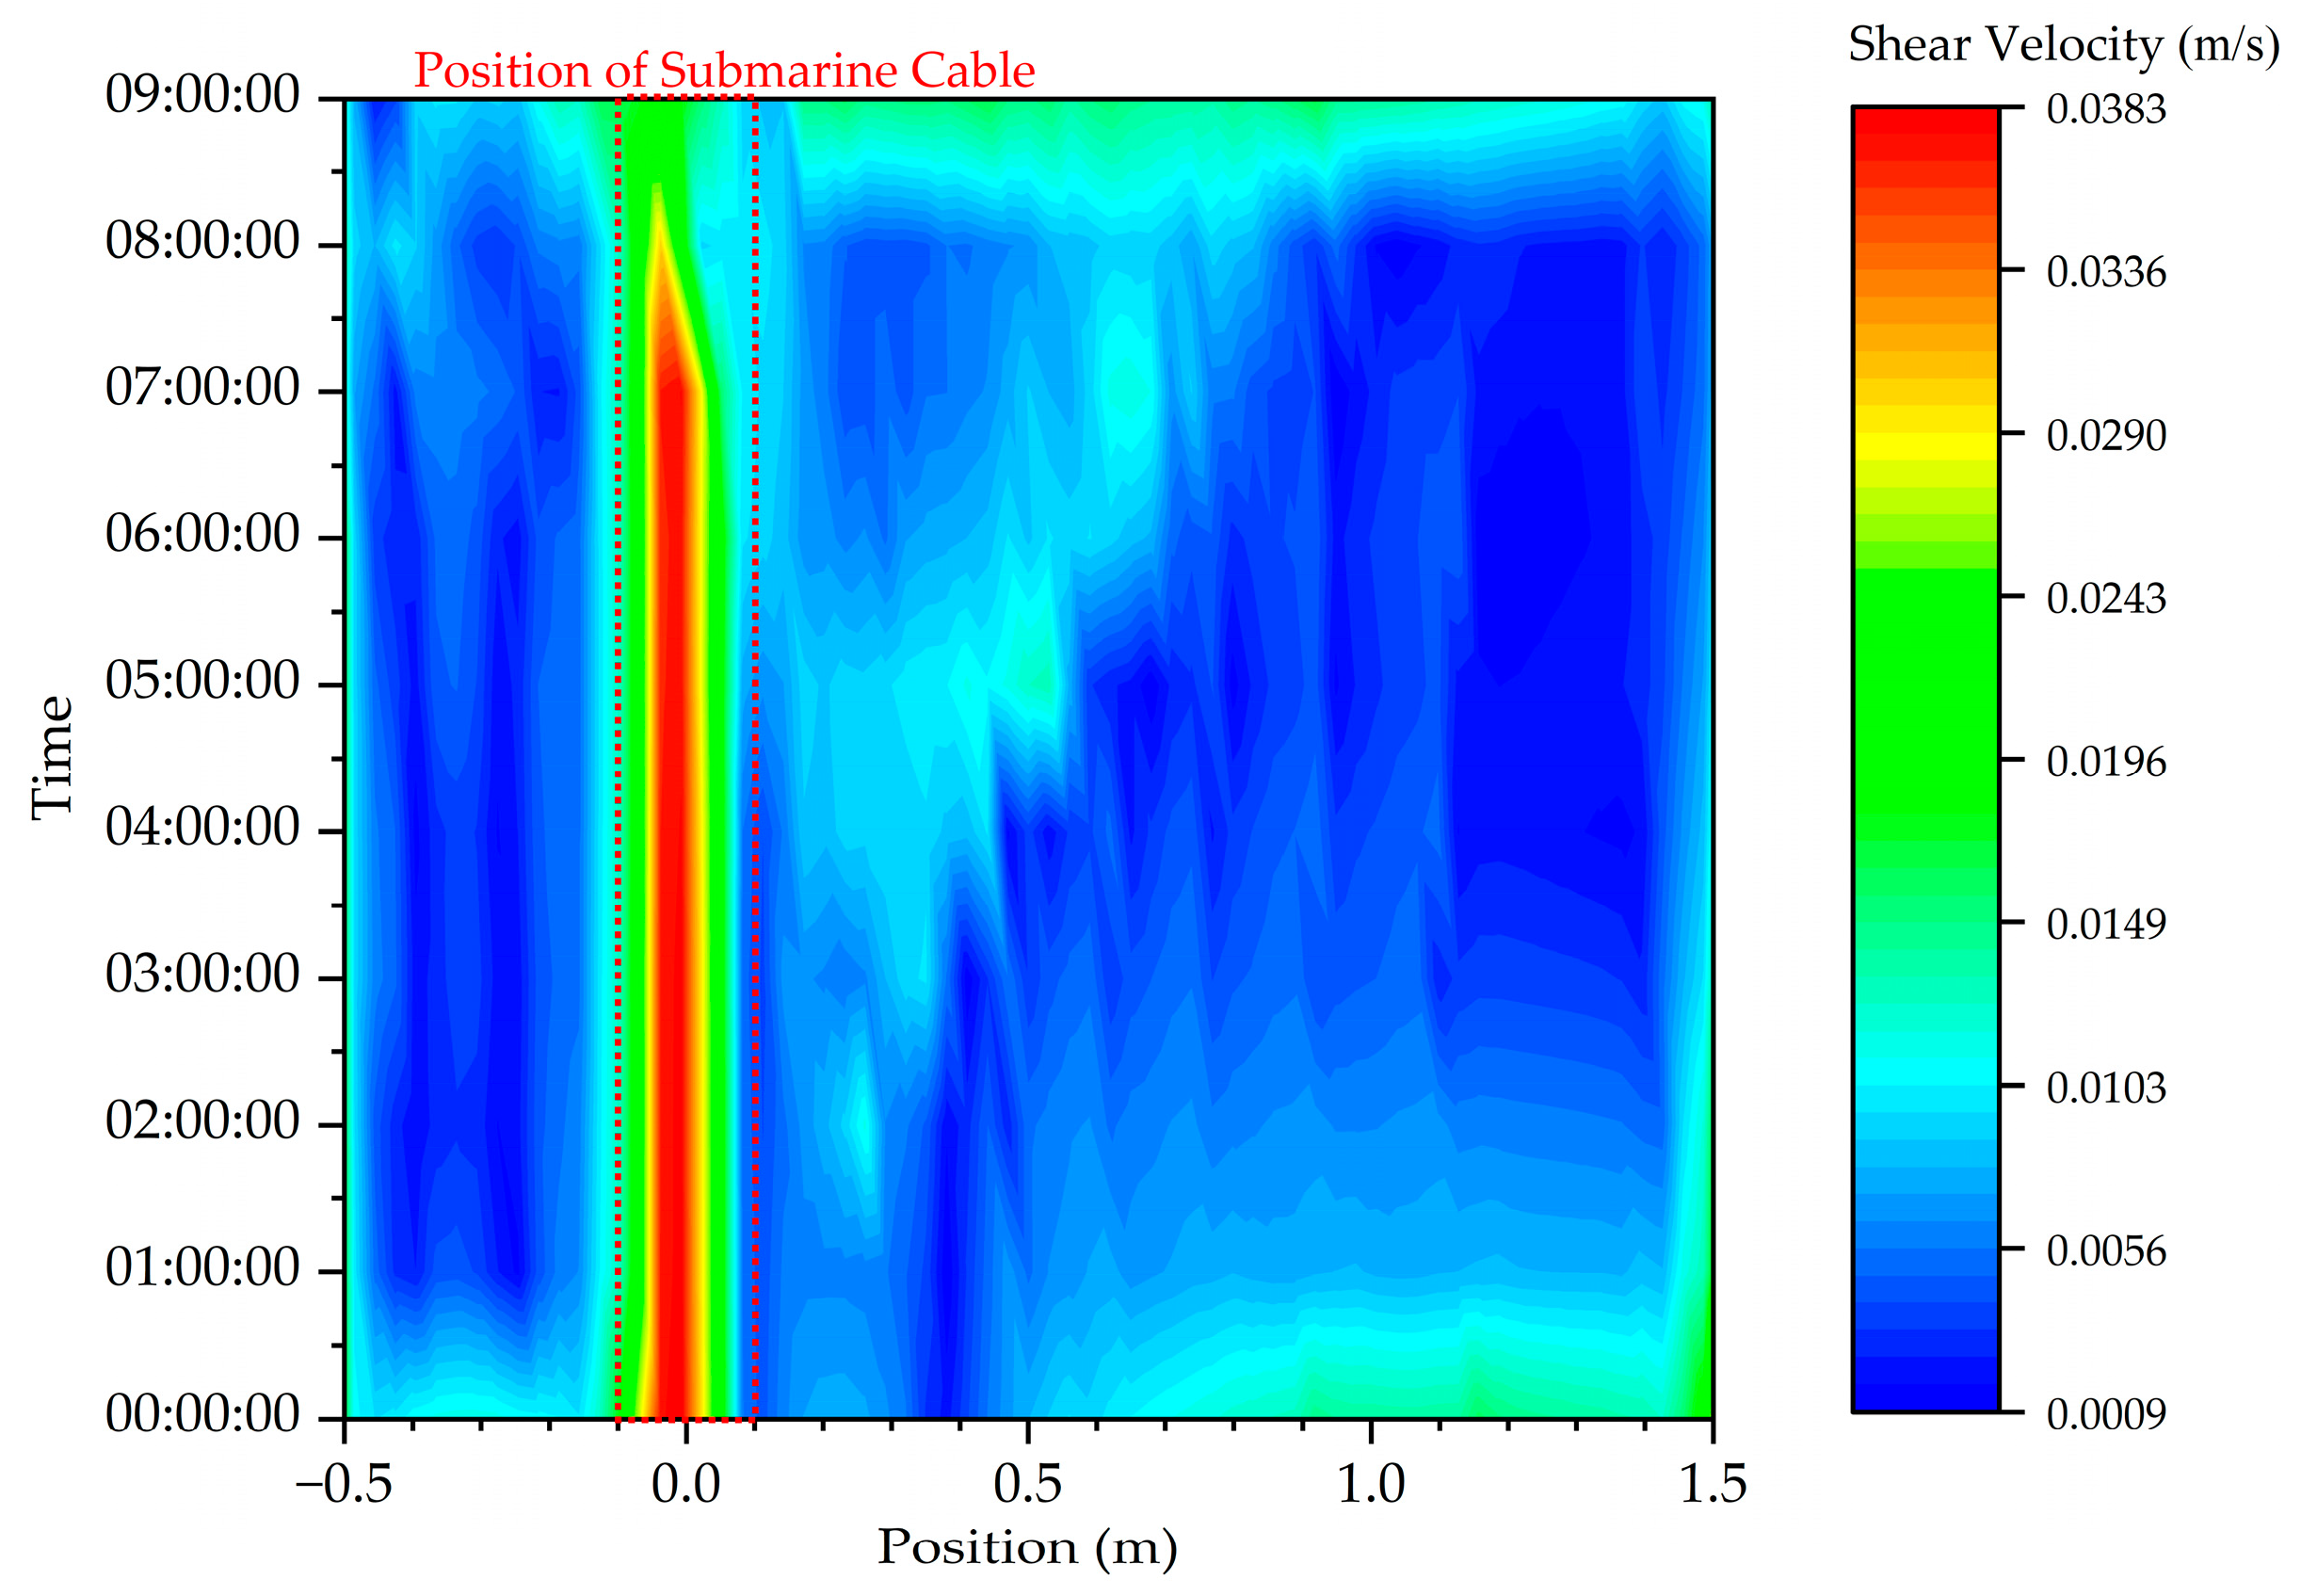
  • There is a close relationship between the distribution of shear velocity and the scouring terrain. As the local scouring process occurs, the location of the maximum shear velocity within the scouring hole shifts and causes the bottom of the hole to move as well.
  • When the sediment’s critical Shields number and density are significantly large and ocean current velocity is sufficiently low, the duration of the stable state of the upstream scouring hole will be prolonged, and the average development velocity of the scouring holes at the wake position and downstream will be reduced.
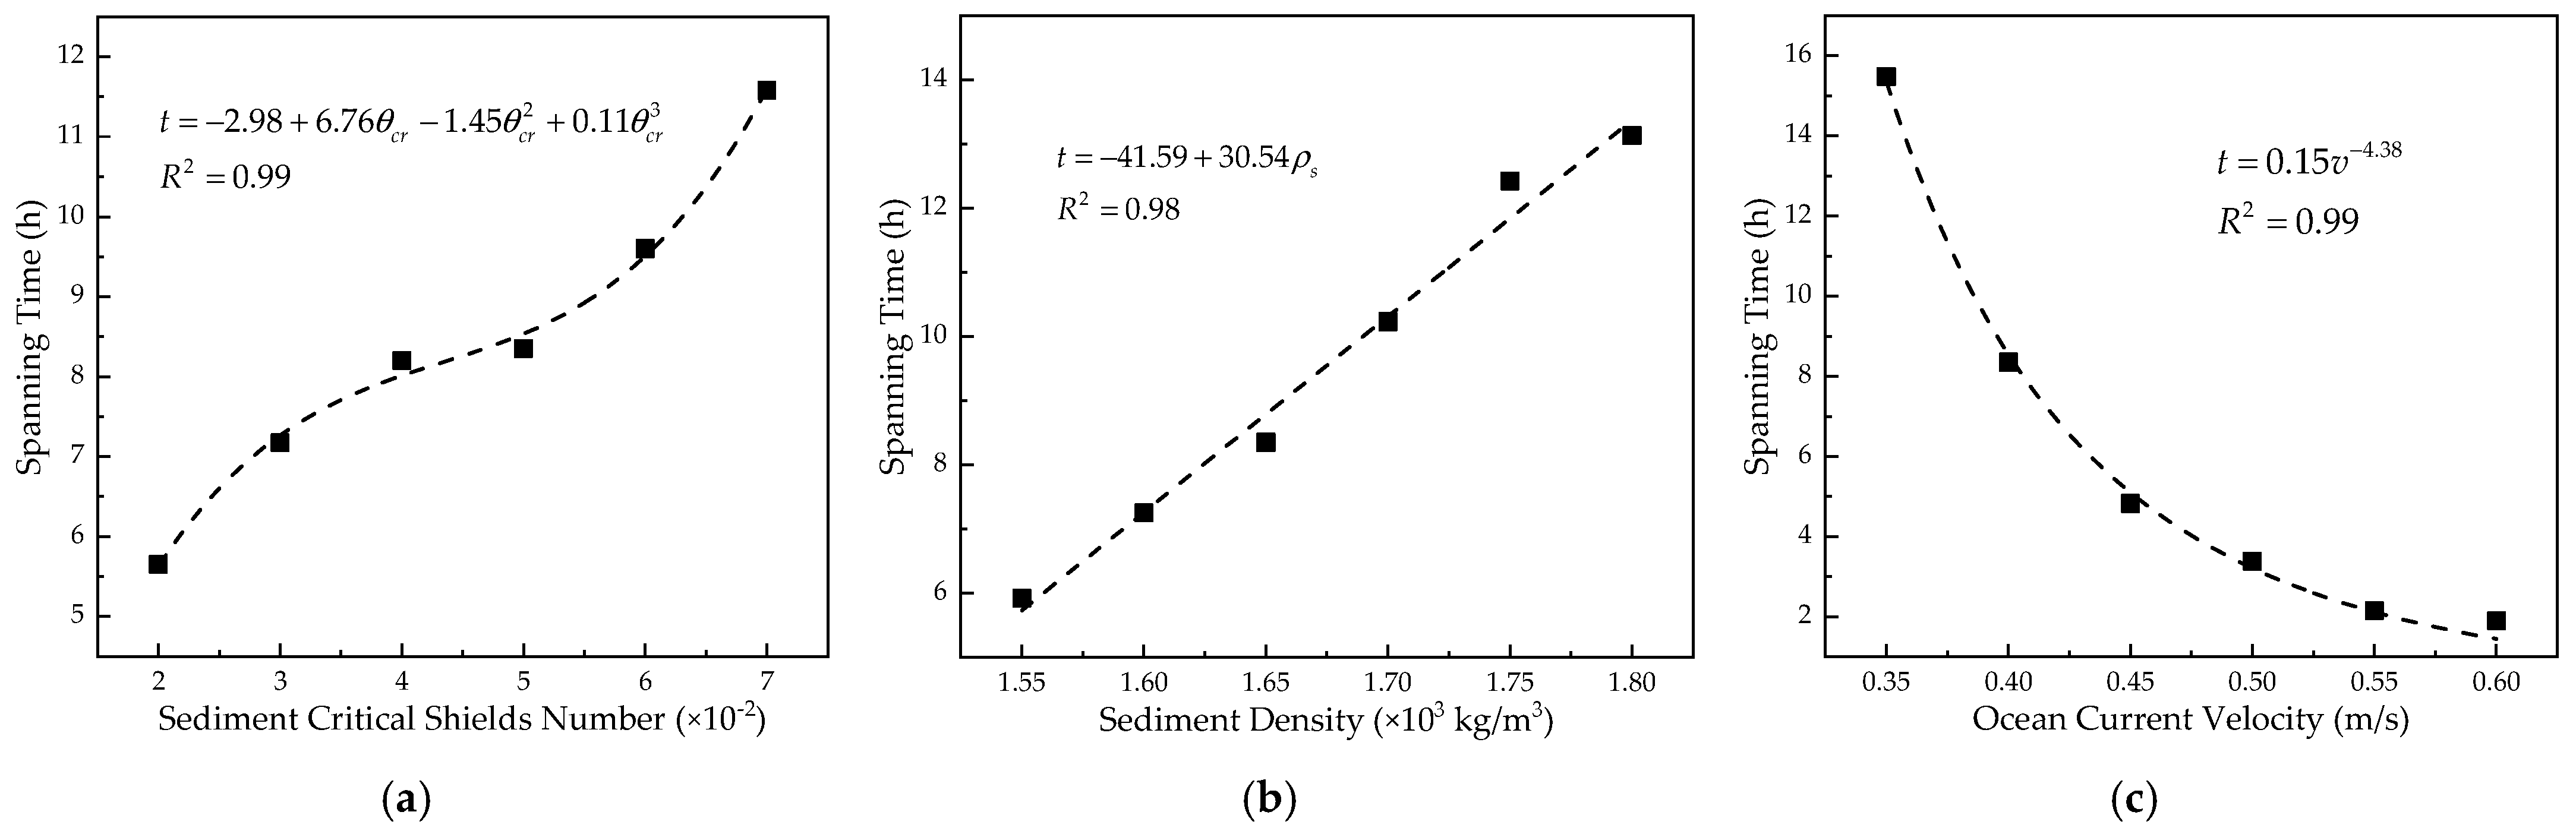
  • The relationship between the spanning time and the critical Shields number θcr can be formulated as a cubic function, in which the curve’s inflection point is θcr = 4.59 × 10⁻². The relationship between spanning time and sediment density can be formulated as a linear function. The relationship between spanning time and ocean current velocity can be formulated by exponential function.
Based on the conclusions of this paper, even when it is too late to take measures or when the exposed position of the submarine cable cannot be located, the degree of burial depth development still can be predicted. This prediction is important for the operation and maintenance of the submarine cable. However, the study still leaves something to be desired. Only the local scouring process under the steady-state ocean current was studied, which is an extreme condition. In practice, exposed submarine cables are more likely to be scoured by reciprocating ocean currents. In the future, we will investigate the local scouring of submarine cables under the reciprocating ocean current.

Author Contributions

Conceptualization, Y.H. and Q.L.; methodology, Q.L., P.Z. and H.T.; software, Q.L.; validation, Q.L., L.C. and W.T.; writing—original draft preparation, Q.L.; writing—review and editing, Y.H. and Q.L.; supervision, Y.H. and L.Y. All authors have read and agreed to the published version of the manuscript.

Funding

This research was funded by the [Smart Grid Joint Fund Key Project between National Natural Science Foundation of China and State Grid Corporation] grant number [U1766220].

Institutional Review Board Statement

Not applicable.

Informed Consent Statement

Not applicable.

Data Availability Statement

The data supporting the reported results cannot be shared at this time, as they have been used in producing more publications on this research.

Acknowledgments

This work is supported by the Smart Grid Joint Fund Key Project of the National Natural Science Foundation of China and State Grid Corporation (Grant No. U1766220).

Conflicts of Interest

The authors declare no conflict of interest.

References

  1. Taormina, B.; Bald, J.; Want, A.; Thouzeau, G.; Lejart, M.; Desroy, N.; Carlier, A. A review of potential impacts of submarine power cables on the marine environment: Knowledge gaps, recommendations and future directions. Renew. Sust. Energ. Rev. 2018, 96, 380–391. [Google Scholar] [CrossRef]
  2. Gulski, E.; Anders, G.J.; Jogen, R.A.; Parciak, J.; Siemiński, J.; Piesowicz, E.; Paszkiewicz, S.; Irska, I. Discussion of electrical and thermal aspects of offshore wind farms’ power cables reliability. Renew. Sust. Energ. Rev. 2021, 151, 111580. [Google Scholar] [CrossRef]
  3. Wang, W.; Yan, X.; Li, S.; Zhang, L.; Ouyang, J.; Ni, X. Failure of submarine cables used in high-voltage power transmission: Characteristics, mechanisms, key issues and prospects. IET Gener. Transm. Distrib. 2021, 15, 1387–1402. [Google Scholar] [CrossRef]
  4. Chen, H.; Chen, Z.; Lu, H.; Wu, C.; Liang, J. Protection method for submarine cable detection and exposed suspension problem in Qiongzhou straits. Telecom Pow. Technol. 2019, 36, 60–61+63. [Google Scholar]
  5. Zhu, J.; Ren, B.; Dong, P.; Chen, W. Vortex-induced vibrations of a free spanning submarine power cable. Ocean Eng. 2023, 272, 113792. [Google Scholar] [CrossRef]
  6. Sumer, B.M.; Jensen, H.R.; Mao, Y.; Fredsøe, J. Effect of lee-wake on scour below pipelines in current. J. Waterw. Port Coast. Ocean. Eng. 1988, 114, 599–614. [Google Scholar] [CrossRef]
  7. Chiew, Y.M. Prediction of maximum scour depth at submarine pipelines. J. Hydraul. Eng. 1991, 117, 452–466. [Google Scholar] [CrossRef]
  8. Mastbergen, D.R.; Vandenberg, J.H. Breaching in fine sands and the generation of sustained turbidity currents in submarine canyons. Sedimentology 2003, 50, 625–637. [Google Scholar] [CrossRef]
  9. Dey, S.; Singh, N.P. Clear-water scour depth below underwater pipelines. J. Hydro-Env. Res. 2007, 1, 157–162. [Google Scholar] [CrossRef]
  10. Dey, S.; Singh, N.P. Clear-water scour below underwater pipelines under steady flow. J. Hydraul. Eng. 2008, 134, 588–600. [Google Scholar] [CrossRef]
  11. Liang, D.; Cheng, L. Numerical study of scour around a pipeline bundle. Proc. Inst. Civil Eng. Mar. Eng. 2008, 161, 89–95. [Google Scholar] [CrossRef]
  12. Yang, L.; Guo, Y.; Shi, B.; Kuang, C.; Xu, W.; Cao, S. Study of scour around submarine pipeline with a rubber plate or rigid spoiler in wave conditions. J. Waterw. Port Coast. Ocean Eng. 2012, 138, 484–490. [Google Scholar] [CrossRef]
  13. Li, Y.; Ong, M.C.; Fuhrman, D.R.; Larsen, B.E. Numerical investigation of wave-plus-current induced scour beneath two submarine pipelines in tandem. Coast. Eng. 2020, 156, 103619. [Google Scholar] [CrossRef]
  14. Guan, D.; Hsieh, S.C.; Chiew, Y.M.; Low, Y.M.; Wei, M. Local scour and flow characteristics around pipeline subjected to vortex-induced vibrations. J. Hydraul. Eng. 2020, 146, 04019048. [Google Scholar] [CrossRef]
  15. Liu, M.M.; Jin, X.; Wang, L.; Yang, F.; Tang, J. Numerical investigation of local scour around a vibrating pipeline under steady currents. Ocean Eng. 2021, 221, 108546. [Google Scholar] [CrossRef]
  16. Huang, J.; Yin, G.; Ong, M.C.; Myrhaug, D.; Jia, X. Numerical investigation of scour beneath pipelines subjected to an oscillatory flow condition. J. Mar. Sci. Eng. 2021, 9, 1102. [Google Scholar] [CrossRef]
  17. Cui, F.; Du, Y.; Hao, X.; Peng, S.; Bao, Z.; Peng, S. Experimental study on local scour and related mechanical effects at river-crossing underwater oil and gas pipelines. Adv. Civ. Eng. 2021, 2021, 6689212. [Google Scholar] [CrossRef]
  18. Li, B.; Ma, H. Scouring mechanism of suspended and partially-buried pipelines under steady flow. Coast. Eng. 2022, 177, 104201. [Google Scholar] [CrossRef]
  19. Najafzadeh, M.; Oliveto, G. Scour propagation rates around offshore pipelines exposed to currents by applying data-driven models. Water 2022, 14, 493. [Google Scholar] [CrossRef]
  20. Zhu, Y.; Xie, L.; Wong, T.; Su, T. Development of three-dimensional scour below pipelines in regular waves. J. Mar. Sci. Eng. 2022, 10, 124. [Google Scholar] [CrossRef]
  21. Ma, H.; Li, B. CFD-CGDEM coupling model for scour process simulation of submarine pipelines. Ocean Eng. 2023, 271, 113789. [Google Scholar] [CrossRef]
  22. Hu, K.; Bai, X.; Vaz, M.A. Numerical simulation on the local scour processing and influencing factors of submarine pipeline. J. Mar. Sci. Eng. 2023, 11, 234. [Google Scholar] [CrossRef]
  23. Yang, B.; Gao, F.; Wu, Y. Experimental study on local scour of sandy seabed under submarine pipeline in unidirectional currents. Eng. Mech. 2008, 25, 206–210. [Google Scholar]
  24. Cheng, Y.; Wang, X.; Luo, W.; Huang, X.; Lyu, X. Experimental study of local scour around a downstream inclined pile under combined waves and current. Adv. Eng. Sci. 2021, 53, 64–71. [Google Scholar]
  25. Lu, Y.; Zhou, L.; Shen, X. Different turbulence models for simulating a liquid-liquid hydro cyclone. J. Tsinghua Univ. 2001, 41, 105–109. [Google Scholar]
  26. Yun, D.H.; Kim, Y.T. Experimental study on settlement and scour characteristics of artificial reef with different reinforcement type and soil type. Geotext. Geomembr. 2018, 46, 448–454. [Google Scholar] [CrossRef]
Figure 1. Three-dimensional finite element model of local scouring of semi-exposed submarine cable.
Jmse 11 01349 g001
Figure 2. Validation model.
Jmse 11 01349 g002
Figure 3. Scouring terrain under different mesh sizes.
Jmse 11 01349 g003
Figure 4. Scouring terrain around semi-exposed submarine cable (scour for 5 h).
Jmse 11 01349 g004
Figure 5. Variation of scouring terrain around semi-exposed submarine cable adapted to time.
Jmse 11 01349 g005
Figure 6. Shear velocity changes in the scouring process.
Jmse 11 01349 g006
Figure 7. Influence of sediment’s critical Shields number θcr on local scouring around semi-exposed submarine cable: (a) θcr = 0.02; (b) θcr = 0.03; (c) θcr = 0.04; (d) θcr = 0.05; (e) θcr = 0.06; and (f) θcr = 0.07.
Jmse 11 01349 g007
Figure 8. Influence of sediment density ρs on local scouring around semi-exposed submarine cable: (a) ρs = 1550 kg/m3; (b) ρs = 1600 kg/m3; (c) ρs = 1650 kg/m3; (d) ρs = 1700 kg/m3; (e) ρs = 1750 kg/m3; and (f) ρs = 1800 kg/m3.
Jmse 11 01349 g008
Figure 9. Influence of ocean current velocity v on local scouring around semi-exposed submarine cable: (a) v = 0.35 m/s; (b) v = 0.40 m/s; (c) v = 0.45 m/s; (d) v = 0.50 m/s; (e) v = 0.55 m/s; and (f) v = 0.60 m/s.
Jmse 11 01349 g009
Figure 10. Influence of different parameters on spanning time of the semi-exposed submarine cable: (a) Sediment critical Shields number; (b) Sediment density; and (c) Ocean current velocity.
Jmse 11 01349 g010
Table 1. Key parameters of numerical simulation.
ParameterValue
Sediment Diameter8.5 × 10−5 m
Sediment Density1650 kg/m3
Sediment Critical Shields Number0.05
Fluid Density1000 kg/m3
Fluid Viscosity0.01 kg/(m·s)
Gravitational Acceleration−9.81 m/s2
Disclaimer/Publisher’s Note: The statements, opinions and data contained in all publications are solely those of the individual author(s) and contributor(s) and not of MDPI and/or the editor(s). MDPI and/or the editor(s) disclaim responsibility for any injury to people or property resulting from any ideas, methods, instructions or products referred to in the content.

