Article

Influence of Guide Vane Opening on the Runaway Stability of a Pump-Turbine Used for Hydropower and Ocean Power

1
College of Engineering, China Agricultural University, Beijing 100083, China
2
ANDRITZ (China) Ltd., Beijing 100004, China
3
College of Water Resources and Civil Engineering, China Agricultural University, Beijing 100083, China
4
Beijing Engineering Research Center of Safety and Energy Saving Technology for Water Supply Network System, Beijing 100083, China
5
State Key Laboratory of Hydroscience and Engineering, Tsinghua University, Beijing 100084, China
6
Department of Energy and Power Engineering, Tsinghua University, Beijing 100084, China
*
Author to whom correspondence should be addressed.
J. Mar. Sci. Eng. 2023, 11(6), 1218; https://doi.org/10.3390/jmse11061218
Submission received: 25 April 2023 / Revised: 22 May 2023 / Accepted: 7 June 2023 / Published: 13 June 2023
(This article belongs to the Special Issue Advancement in the Multiphase Flow in Fluid Machinery)

Abstract

:
Runaway is a common phenomenon in pump-turbines for hydropower and ocean power, accompanied by strong instability, which can easily lead to accidents. This study reveals the stability during the runaway process of a pump-turbine, mainly exploring the phenomenon of guide vane rejection happening in transition conditions when dealing with hydropower or ocean power. Through model experiments and computational fluid dynamics numerical simulations, the pressure pulsation when reaching runaway was compared under different guide vane opening angles. The amplitude of pressure pulsation measured in the experiment increases with the increase in guide vane opening, but there are also local changes in size and peak. The simulation results show that when the guide vane opening angle is 12 degrees, the vortex flow in the area between the guide vane and the runner of the unit increases, leading to instability. When the opening angle of the guide vane is between 12 and 20 degrees, the vortex flow intensity does not change much and the distribution becomes uniform, resulting in a decrease in the amplitude of pressure fluctuations. The pulsation of the flow field causes a dissipation of flow energy. Relationships can be found among velocity field, vortex intensity, and entropy production. This study is of great significance for ensuring the stable operation of pump-turbines.

1. Introduction

Turbomachinery is widely used in hydropower and ocean power (including wave energy, tidal energy, and ocean current power). The runaway condition is one of the most important conditions of turbomachinery. With the increasing demand for grid stability and the gradual increase in the use of new energy, water turbines have been used for large-scale energy storage, forming pump-turbine units [1,2]. They can be used to store hydropower and ocean power or release power grid demand, playing a role in peak shaving, frequency modulation, phase modulation, and emergency backup in the power grid [3,4,5].
For hydro-turbines and pump-turbines, runaway usually occurs after load rejection [6,7]. Load rejection can be divided into active and passive modes [8]. When the power provided by the power grid exceeds the system requirements, the unit actively unloads some unimportant loads to improve the power supply quality of the power grid [9]. When a unit malfunctions or trips, the unit passively disconnects from the power grid, causing the unit to lose load [10]. If the flow-regulating mechanism of the unit malfunctions, such as when the guide vanes refuse to close, the speed of the flow passage will continue to rise. When the hydraulic torque and friction loss torque reach equilibrium, the rotational speed reaches its maximum limit, which is called runaway [11,12]. Pump-turbines start and stop very frequently, and load rejection is also frequent [13,14]. At present, pump-turbines with a head of 400~600 m have the strongest economic benefits and are most widely used [15]. The proportion of low specific-speed Francis runners with narrow and long blade channels is the highest. The strong centrifugal force generated by this type of runner during rotation makes the centripetal flow more unstable during the runaway process [16]. Therefore, the runaway process and the instability it brings require special attention.
Many researchers have studied the runaway process of pump-turbines. Fu et al. [17] analyzes the pulsation behavior and mechanism of a pump-turbine during a runaway transition caused by the pump power’s interruption. Backflow near the runner inlet and the cavitation in the runner and draft tube would cause instability. Rezghi et al. [18] investigated the unstable behavior of a pump-turbine at runaway. From a systematic perspective, important influencing factors have been fully explored. The impact of flow pulsation on the stability of runaway has been fully explained. Zhang et al. [19] studied the influence of guide vane geometry on the pump-turbine’s runaway instability. The stability is improved by restraining the bad flow at the runner outlet and draft tube inlet. Nicolet et al. [20] discussed the transient behavior of a pump-turbine power plant at runaway. They discussed the impact of rotational inertia on the stability of the unit runaway and analyzed the pressure pulsations related to both the rigid and elastic water column modes. Zeng et al. [21] studied the runaway instability of pump-turbines in S-shaped regions considering water compressibility. In-depth research on the instability of the unit caused by the S region was conducted and proposed new stability criteria. It also demonstrated the hydraulic instability characteristics in the runaway process.
In general, since runaway is an equilibration under the limit state, the process of competing between hydraulic torque and frequency loss torque becomes very complex under the uncertainty of turbulence [22]. The pressure pulsation characteristics of the flow field become extremely complex and will trigger alternating changes in the force on the runner and shaft system. At this point, the torque of the runner fluctuates around 0, and the speed fluctuates around the runaway speed, indicating a strong operational risk [23]. In order to clarify the impact of guide vane rejection on the flow stability of the unit in the runaway state, it is necessary to further analyze the pulsation characteristics of the runaway flow field under different guide vane opening angles.
In this study, the runaway hydraulic stability of a model pump-turbine is investigated. The pressure pulsations are experimentally studied for different guide vane opening angle cases. To explore the internal flow mechanism, computational fluid dynamics is used to evaluate the flow pattern and give the reason for the difference in pressure pulsation under the influence of guide vane angle. This article provides a scientific reference for preventing runaway-caused damage.

2. Parameters of Pump-Turbine

This study focuses on a reversible Francis pump-turbine, whose prototype unit is suitable for the head range of 400 to 500 m. At a speed of 375 r/min, the unit provides approximately 350 MW of output. In this study, a scaled-down model test was conducted on the unit. At the model scale, the diameter of the high-pressure side of the runner Dhi is 554 mm and the diameter of the low-pressure side of the runner Dlow is 280 mm. The rotational speed is increased to 1100 r/min (nd) and the runaway test speed is 400~630 r/min (nra). The specific speed nq is calculated as
n q = n d Q d H d 3 / 4
where Hd is 52.9 m and Qd is 0.62 m3/s in the model scale. Therefore, nq is about 34.6, which is a relatively low specific speed. The runner blade number is 9, the guide vane blade number is 22, and the stay vane blade number is also 22.

3. Model Test Method

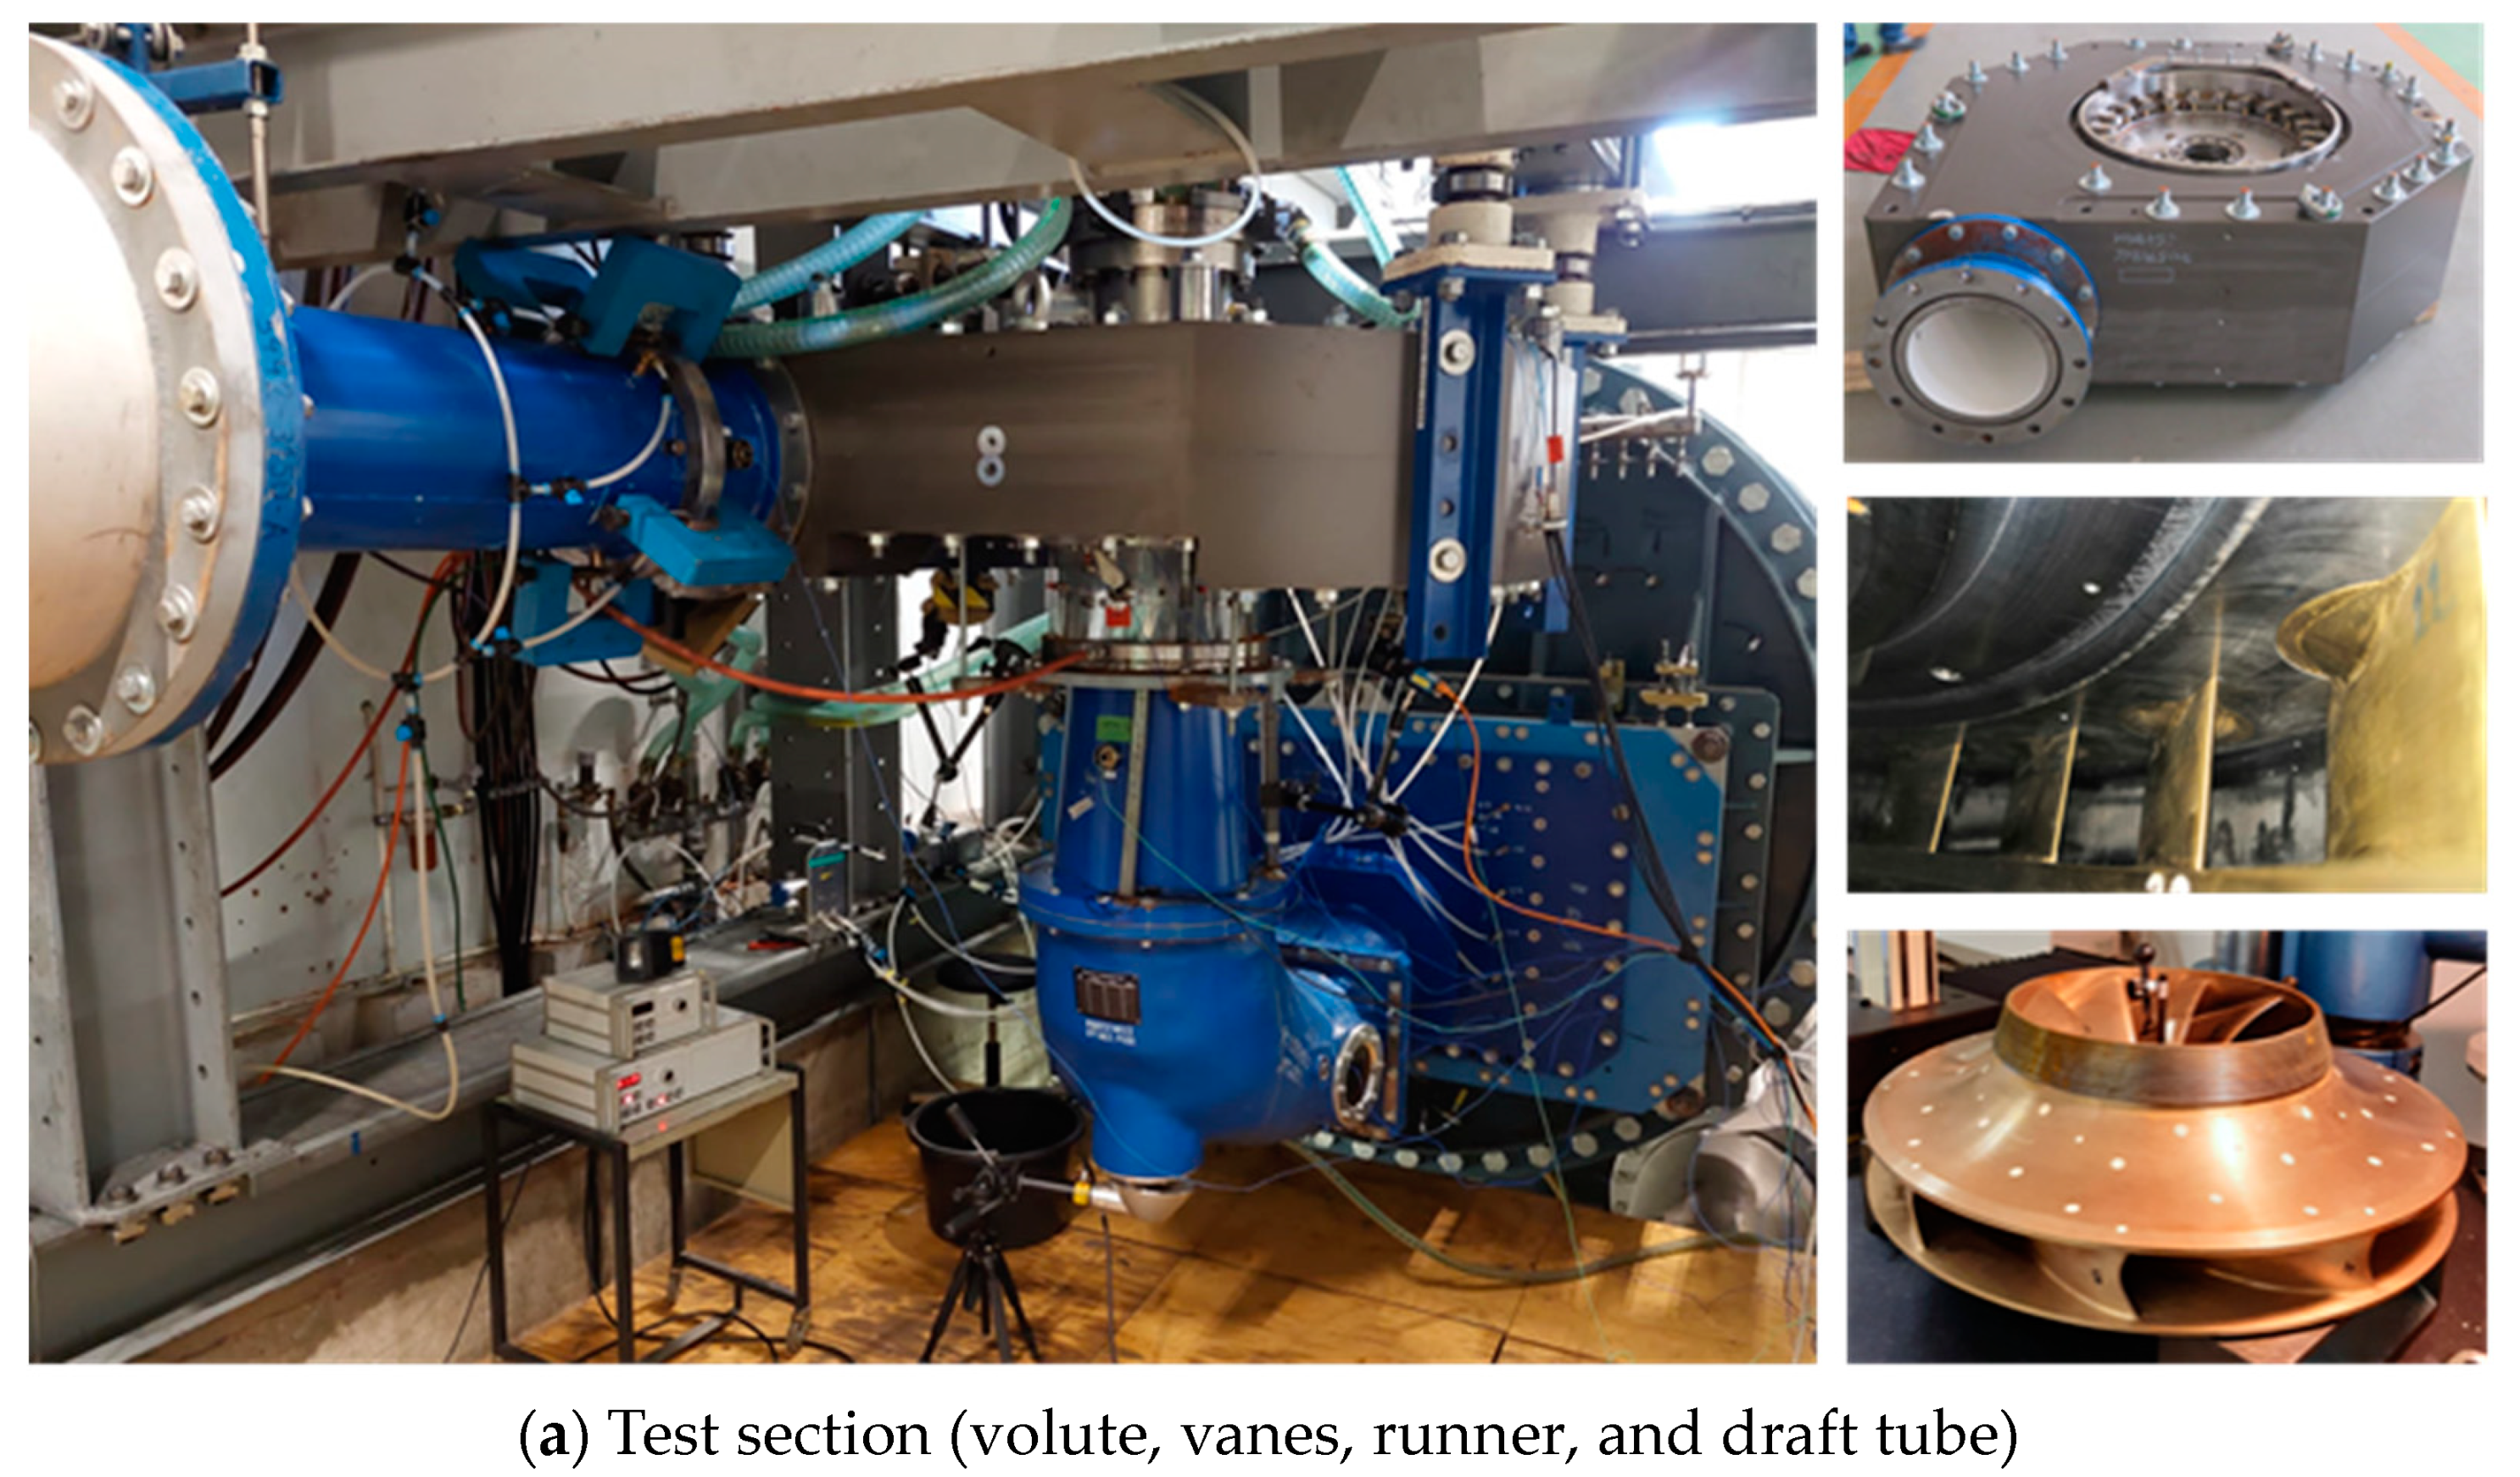
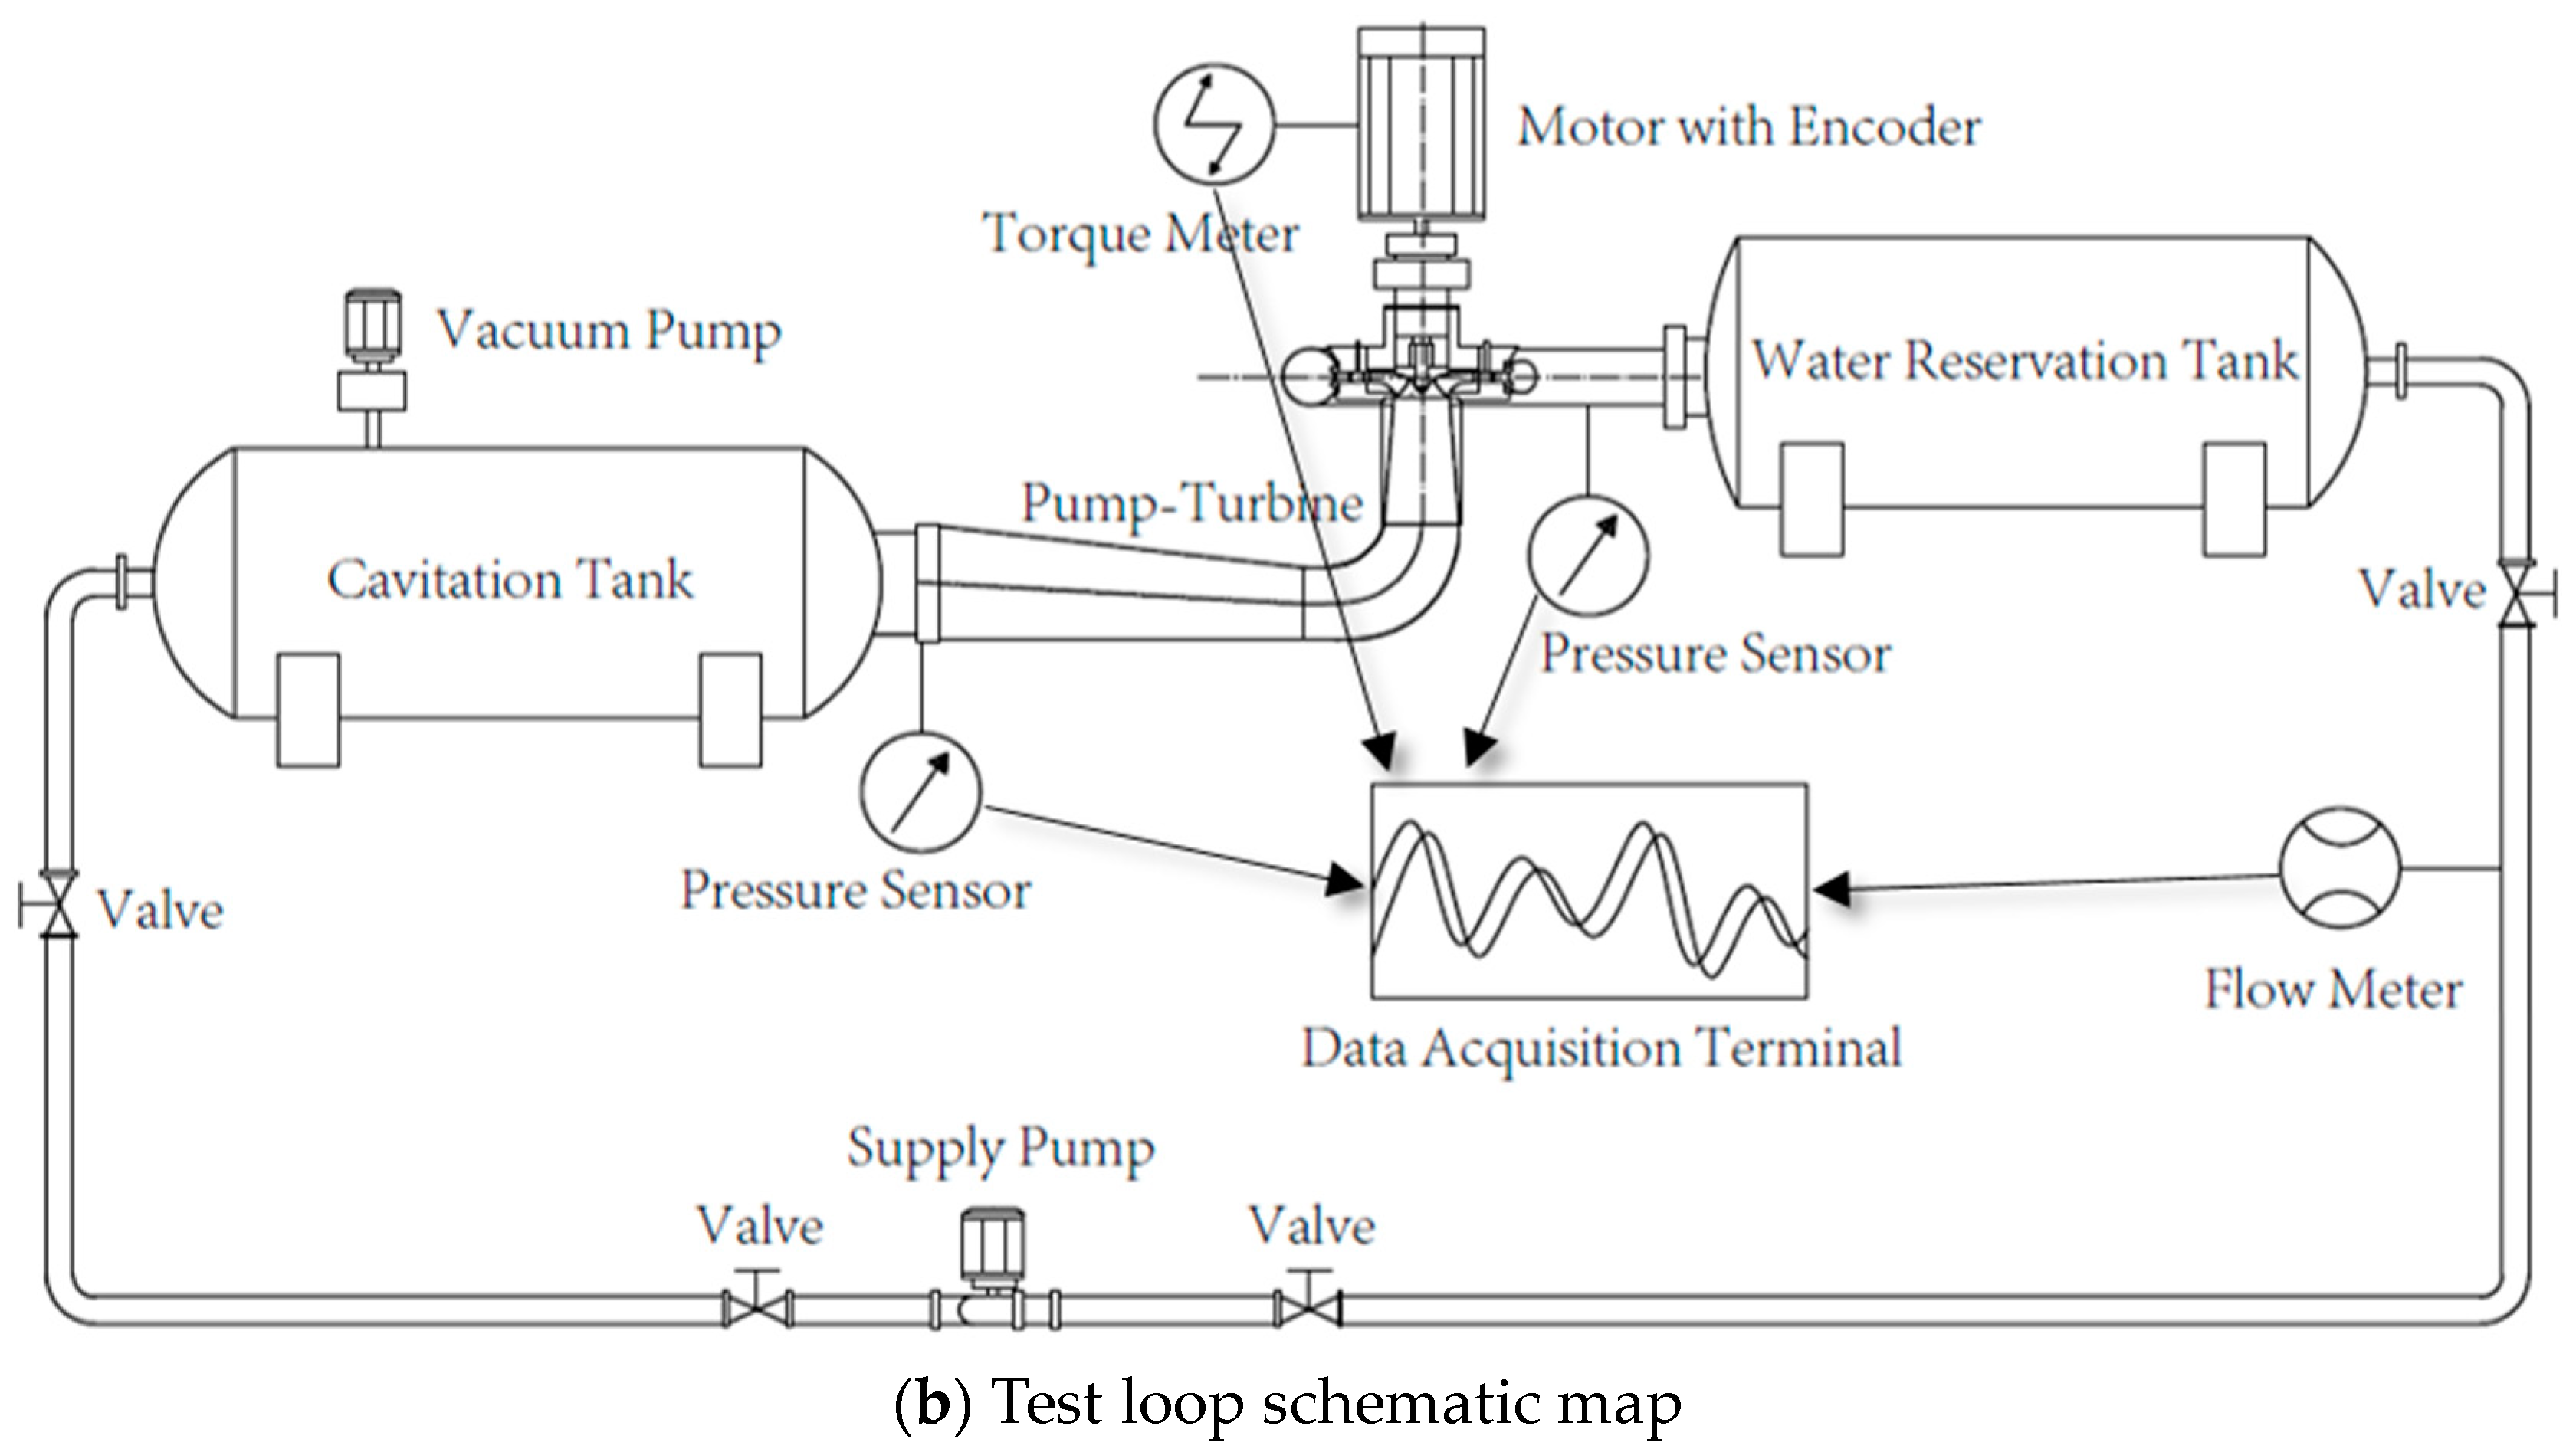
3.1. Hydraulic Test Rig and Apparatus

The model scale pump-turbine is tested on the rig shown in Figure 1 for performance checking before acceptance. We used a closed hydraulic machinery test rig in which the test section (pump-turbine model) is set between two tanks. A supply pump is used for the flow circulation. A pressure sensor is used to measure the pressure difference between turbine inlet and outlet for calculating the head H. The flow meter is set on the loop for flow rate Q; the electro-magnetic flow meter is used here. The power of pump-turbine P is measured by a torque meter (M) and a speed encoder (ωr) and calculated by P = r. The unit rotational speed n11 and unit flow rate Q11 can be determined by
n 11 = n D l o w H
Q 11 = Q D l o w 2 H
The corresponding guide vane opening angle α is measured using an angle sensor to accurately determine the working condition.
Figure 1. Test rig and test section and apparatus.
Jmse 11 01218 g001aJmse 11 01218 g001b

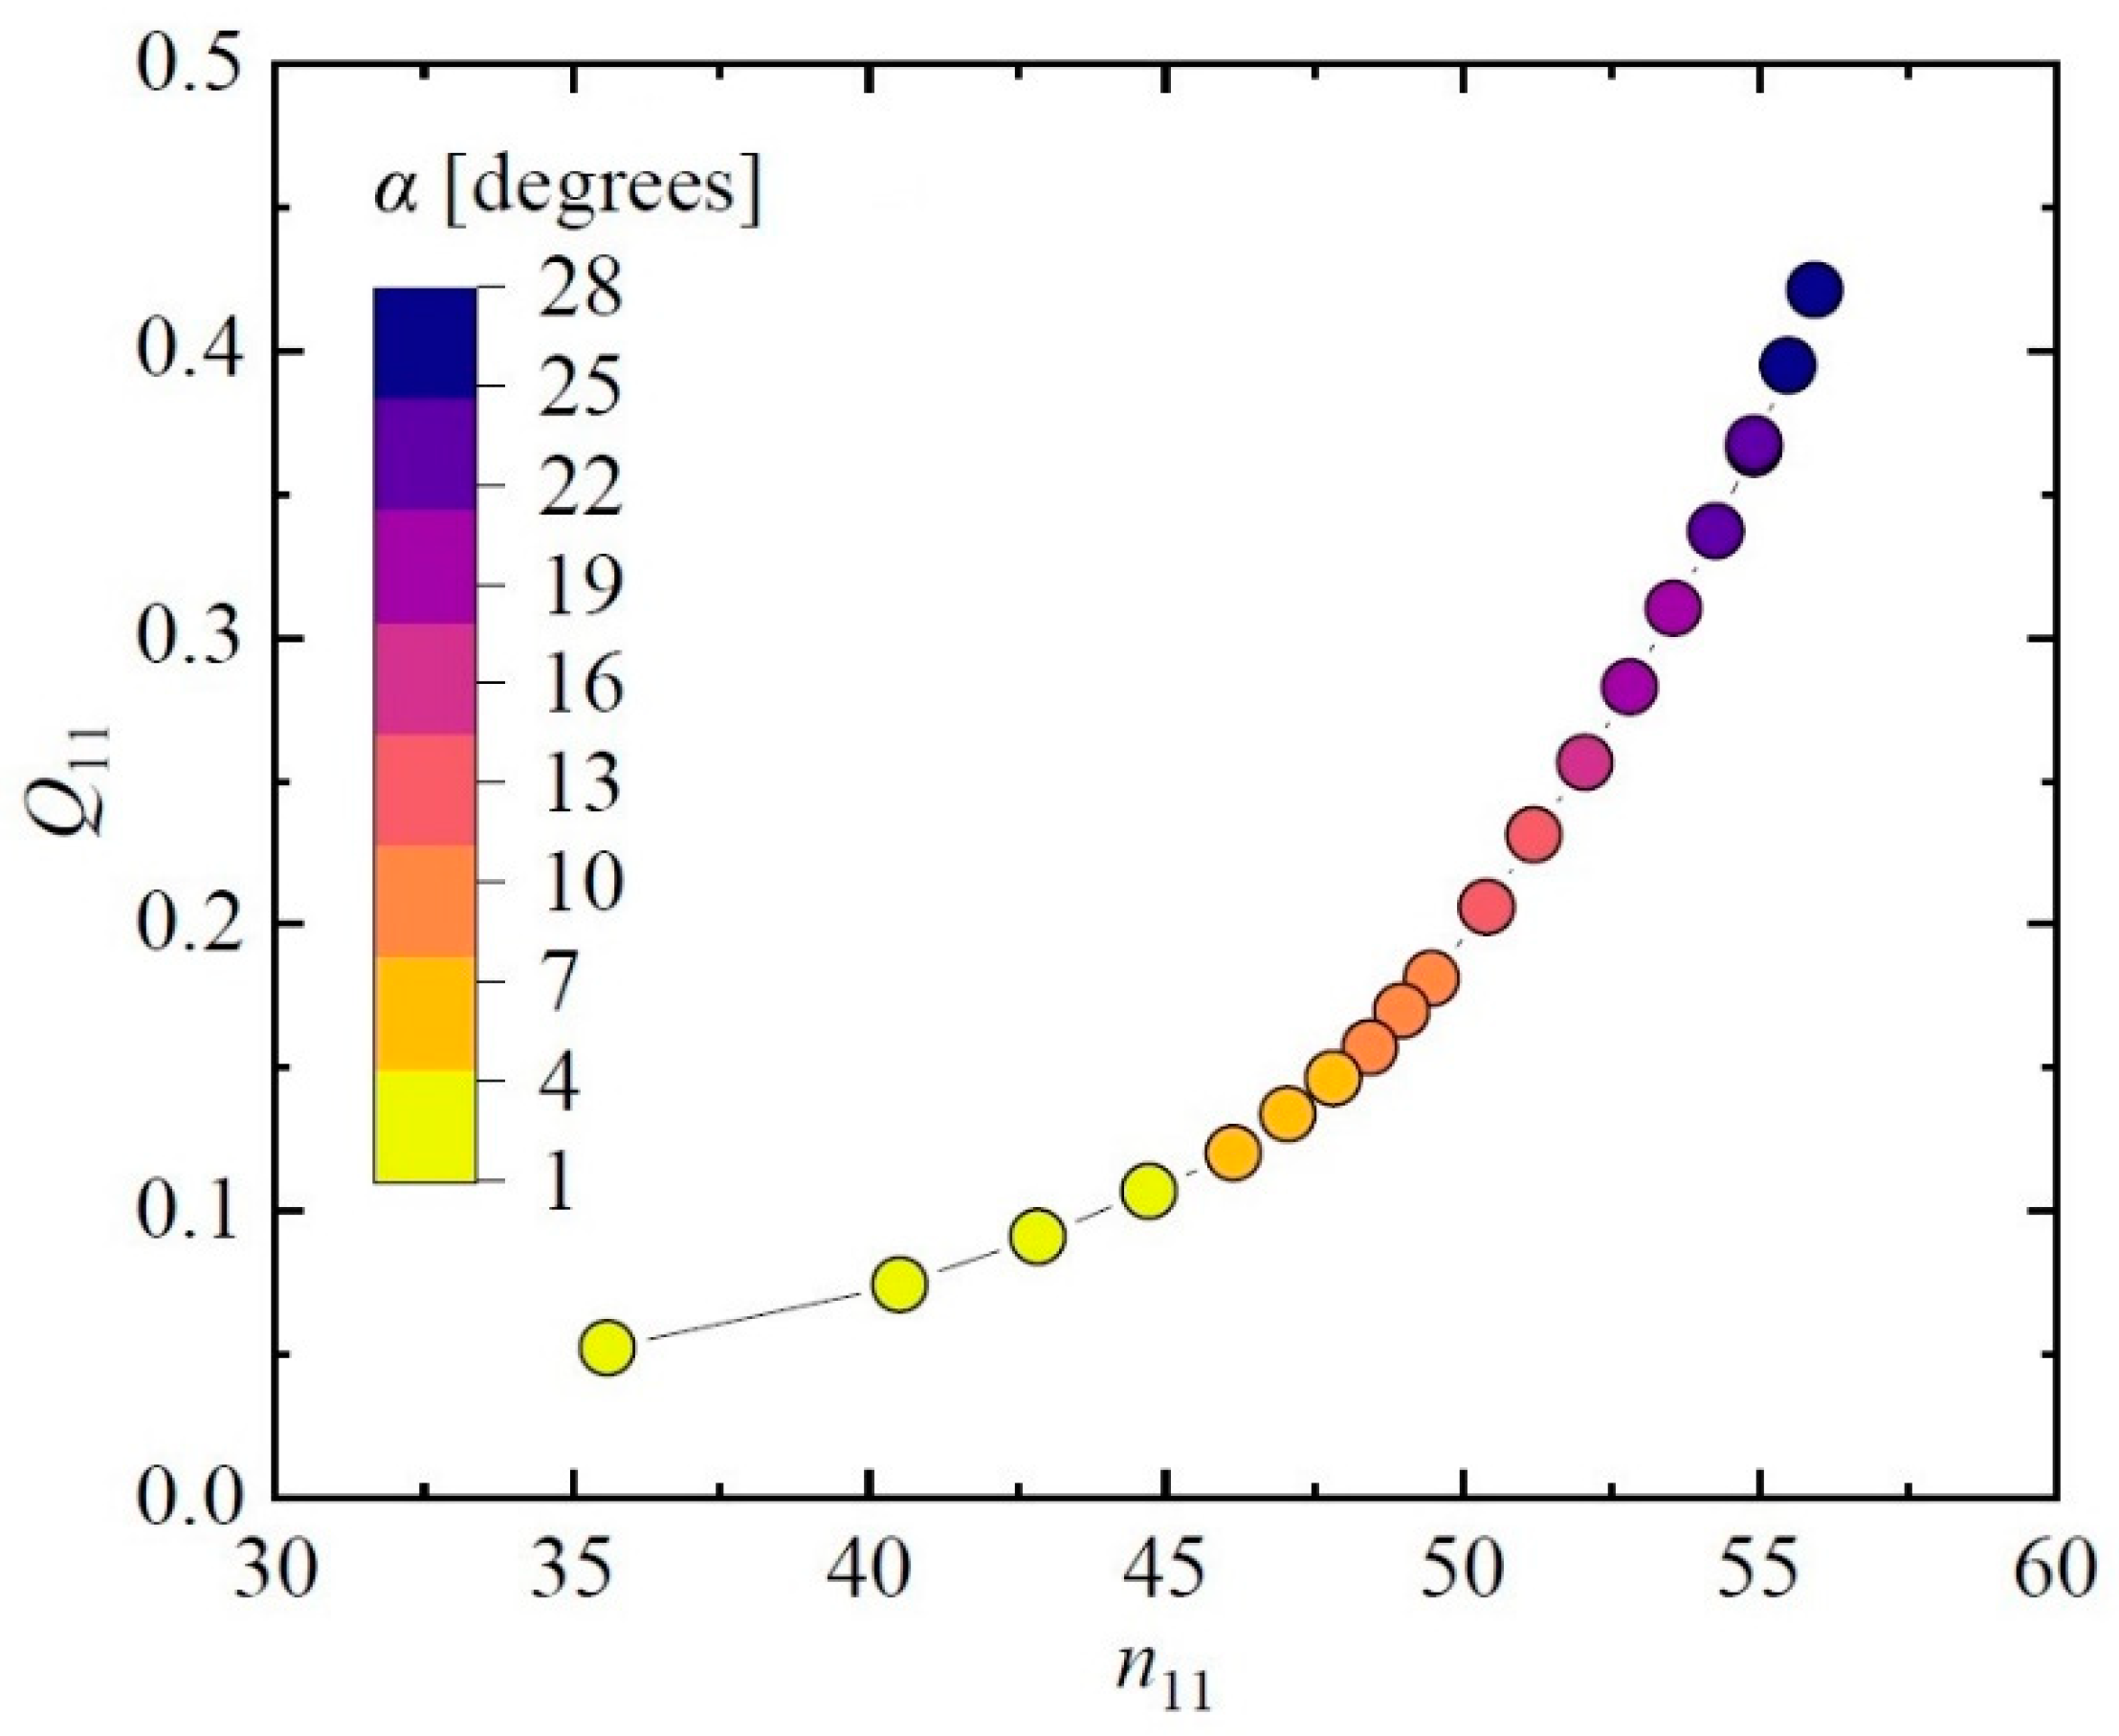
3.2. Test Strategy of Runaway Point

The runaway in prototype operation is the automatic increase and stabilization of the runner speed when the guide vanes refuse to adjust. Unlike this, the runaway in a model test requires a fixed guide vane opening angle. At the same time, the motor is adjusted and the runner speed is controlled to monitor the changes in torque. When the torque approaches 0 N·m, attention is paid to observing its variation. If the torque is positive, the speed is reduced. If the torque is negative, the speed is increased. When the torque of the runner fluctuates by no more than ±1 N·m around 0 N·m and remains stable for more than 3 s, the current parameters such as n, H, Q, and P are recorded, and n11 and Q11 are calculated based on Dlow. Figure 2 shows the runaway points measured in the model test; the guide vane opening angles of 1~28 degrees are considered. Table 1 lists the details of the points.

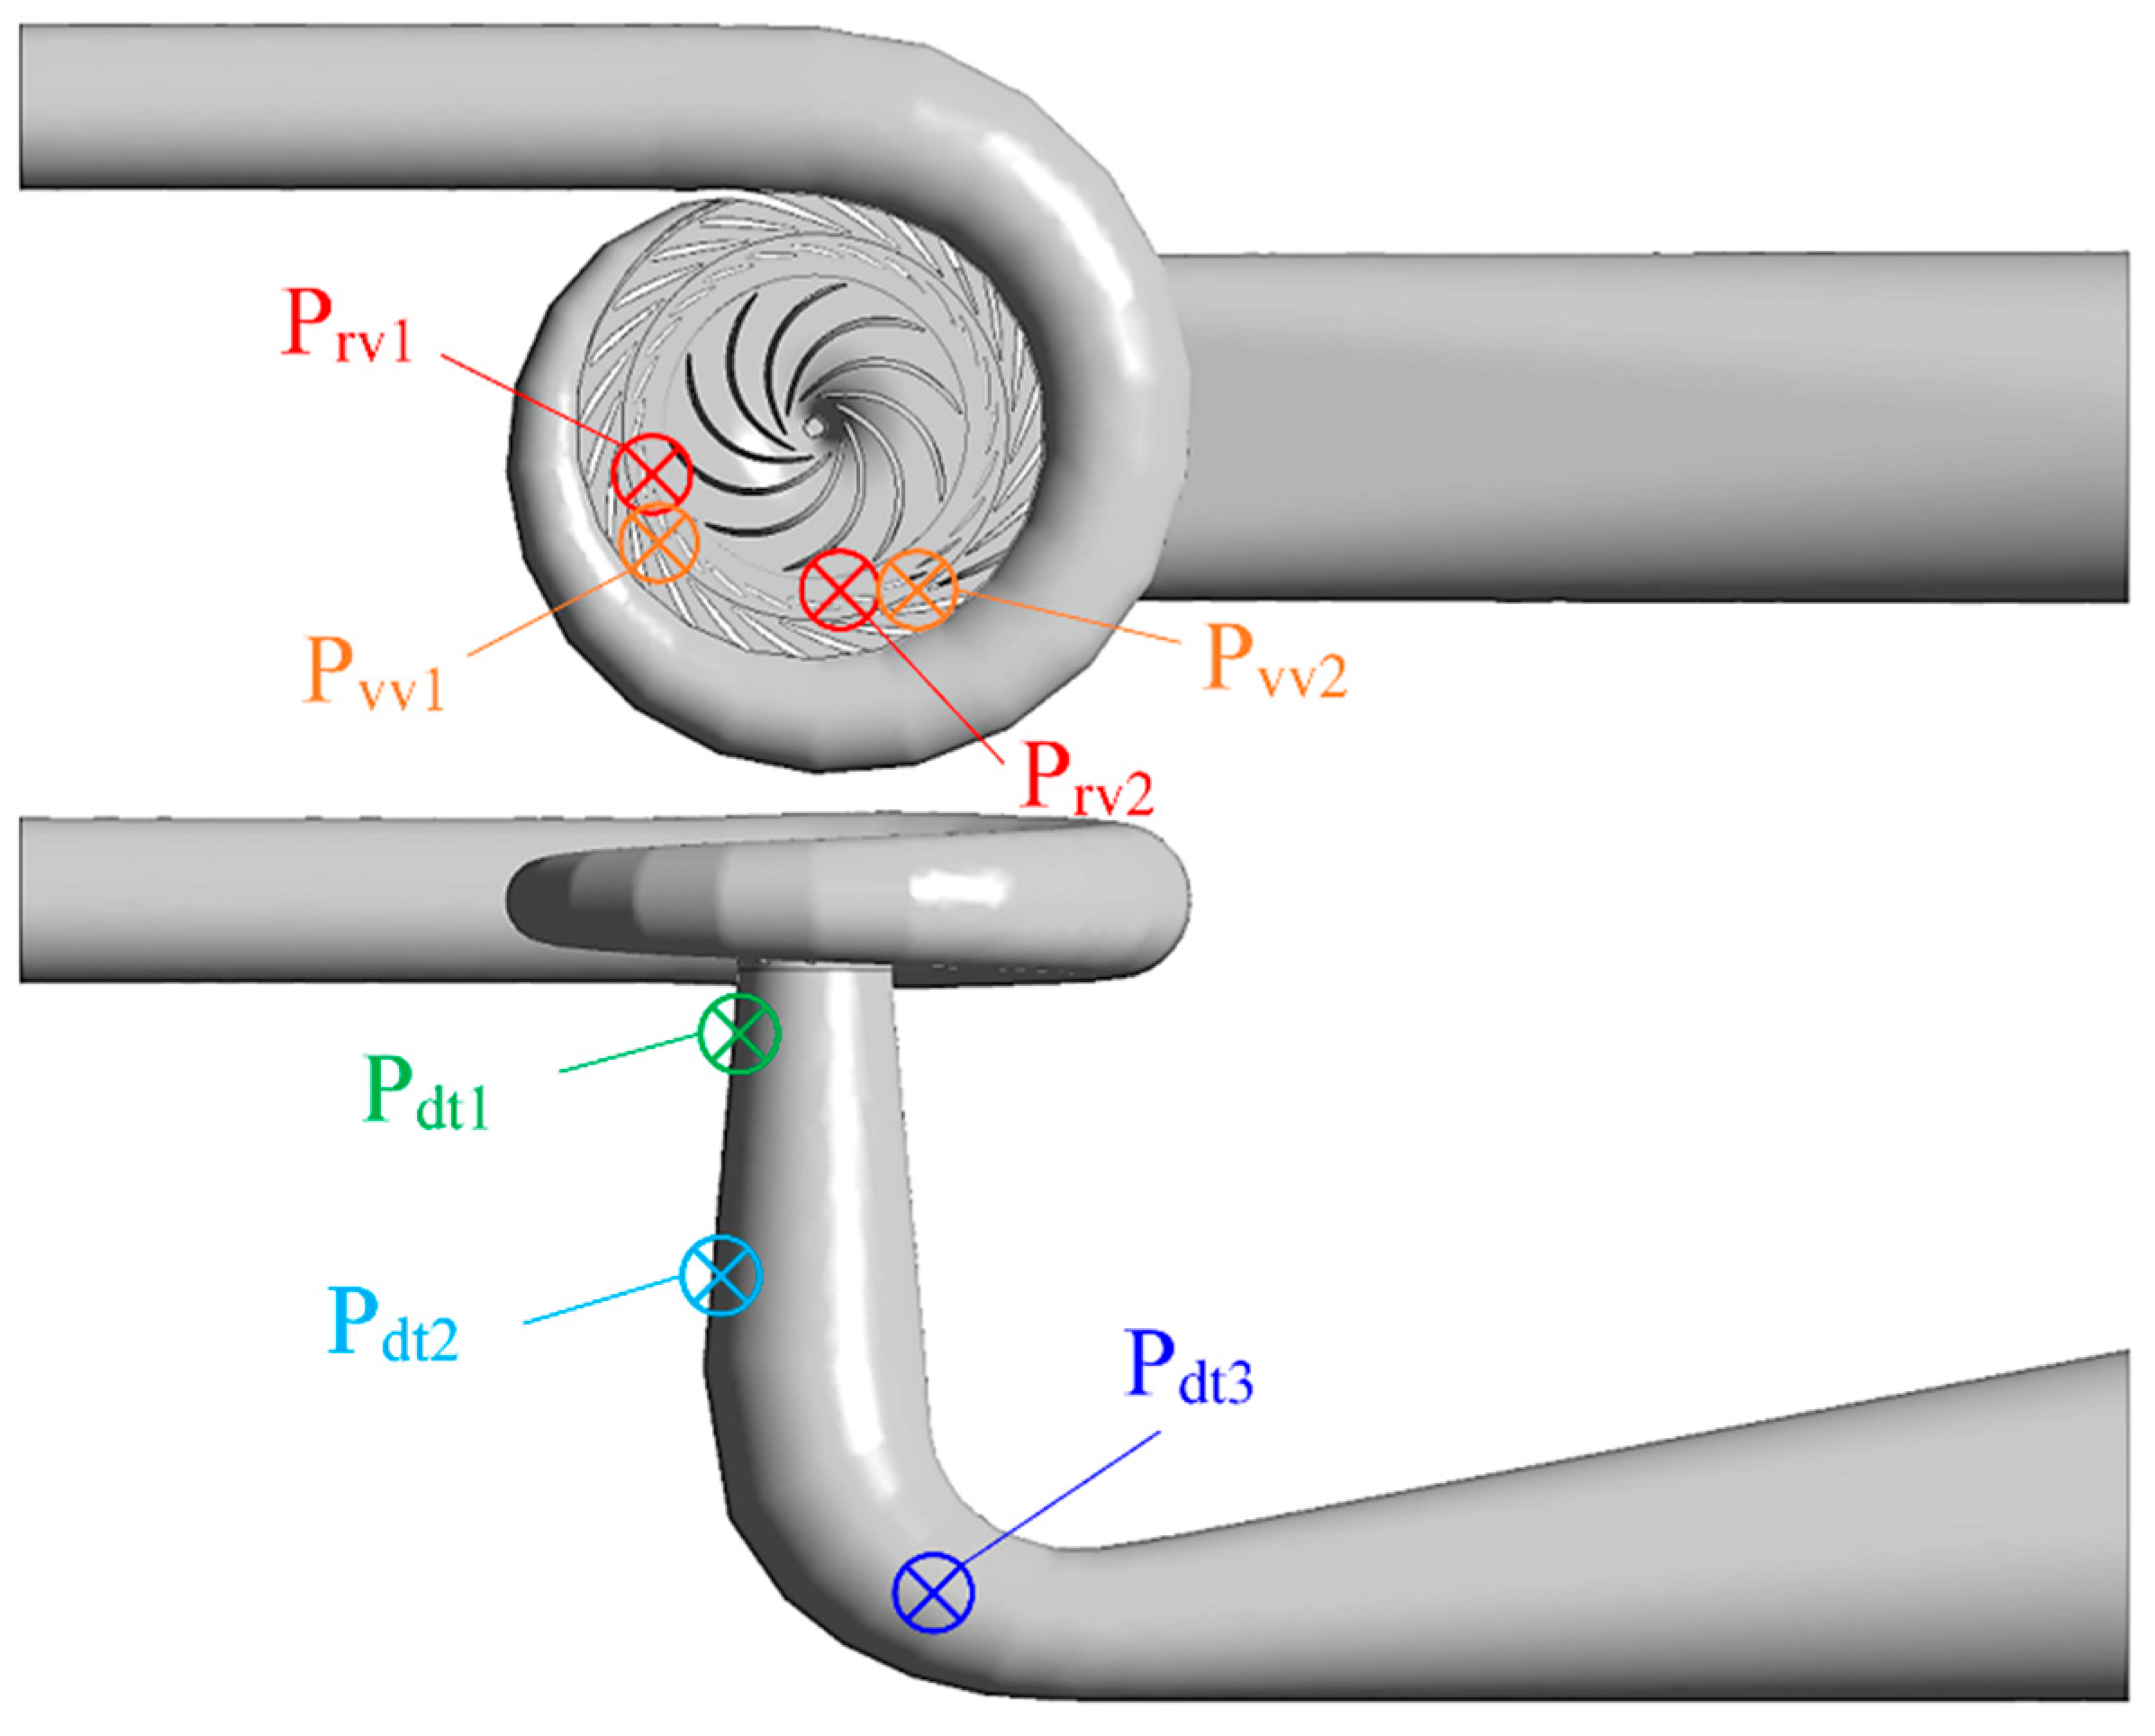
3.3. Positions of Pressure Pulsation Measurement

The measurement of pressure pulsation relies on dynamic pressure sensors and PCB signal amplifiers, both of which have an accuracy of 1%. A total of 7 measuring points are arranged on the model pump-turbine, including Pvv1 and Pvv2 points between the stay vane and the guide vane, Prv1 and Prv2 points between the guide vane and the runner, Pdt1 points adjacent to the outlet of the draft tube and the runner, Pdt2 points in the middle of the straight section of the draft tube, and Pdt3 points in the elbow section of the draft tube. The specific locations of these monitoring points are shown in Figure 3.

4. CFD Method

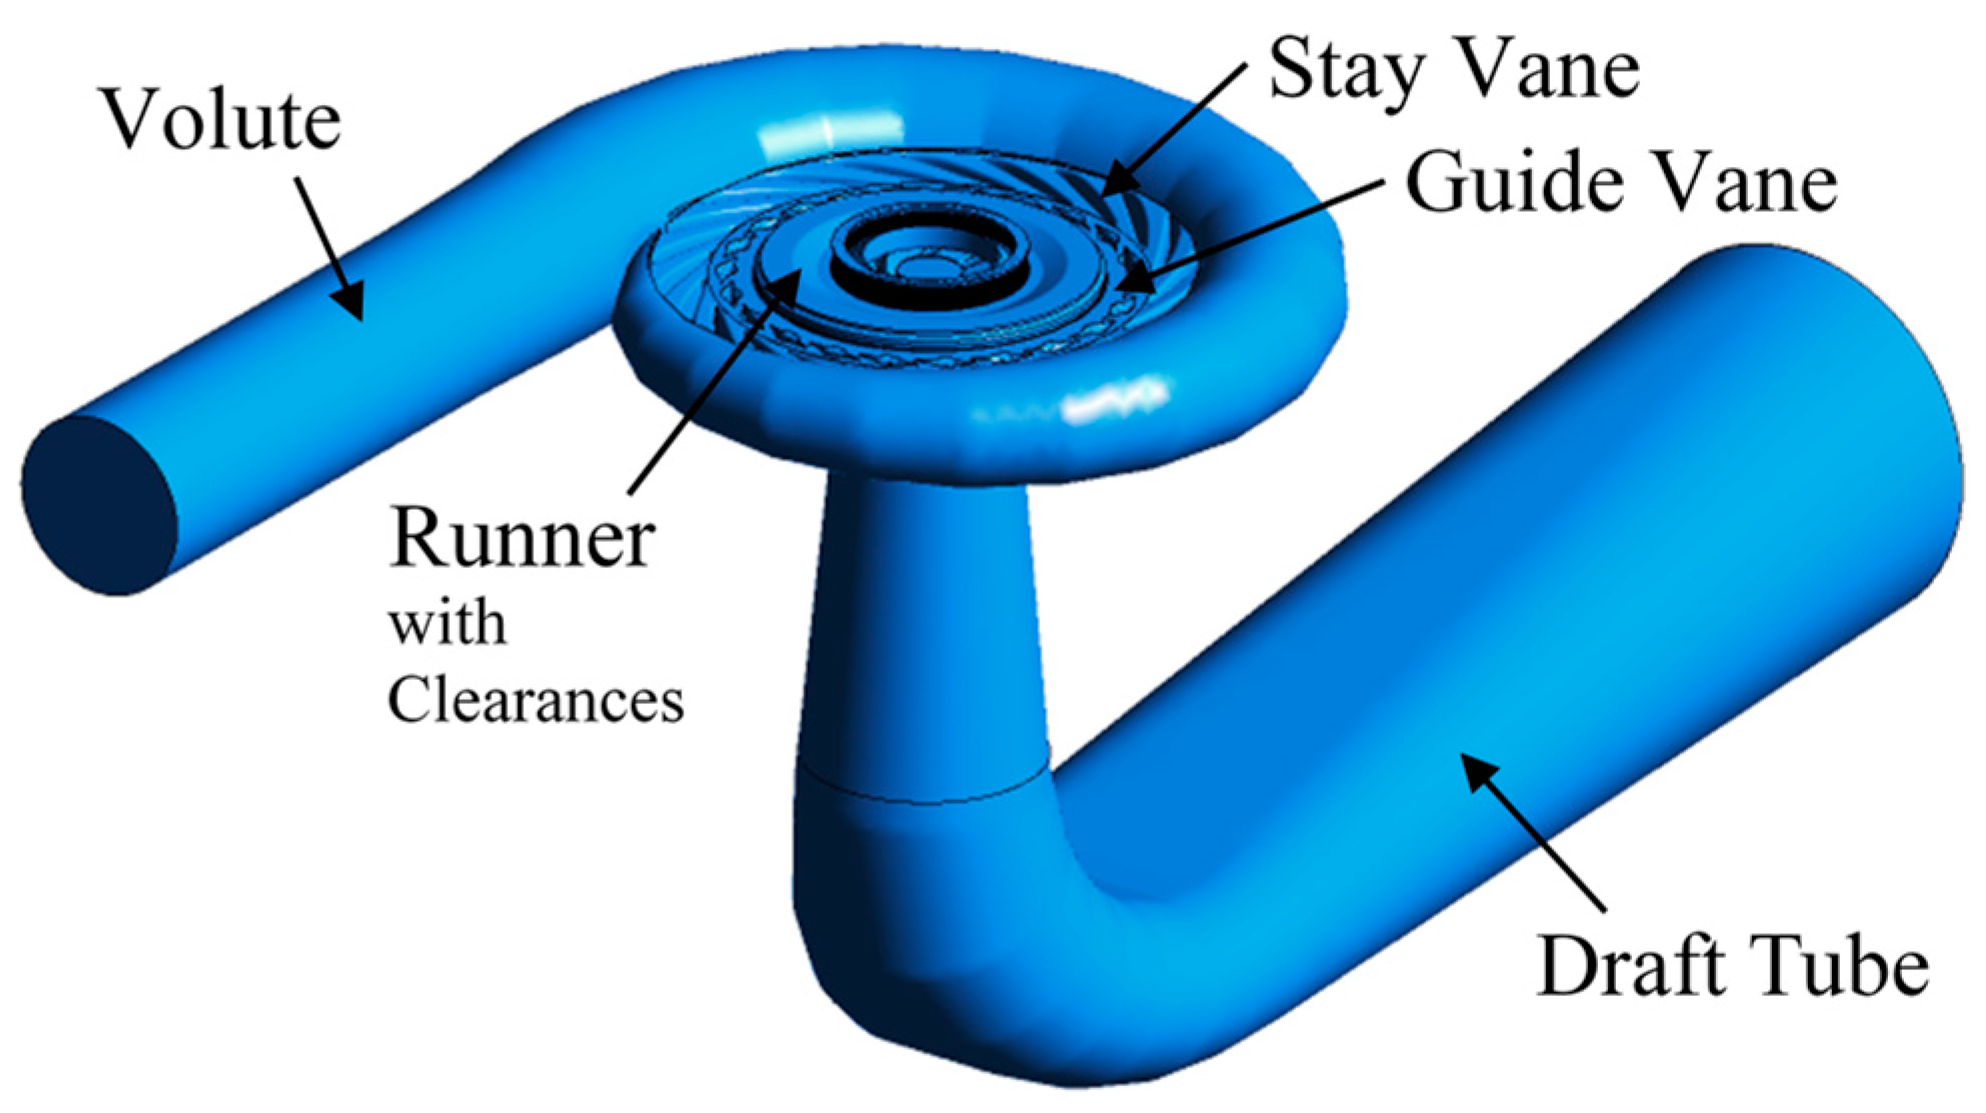
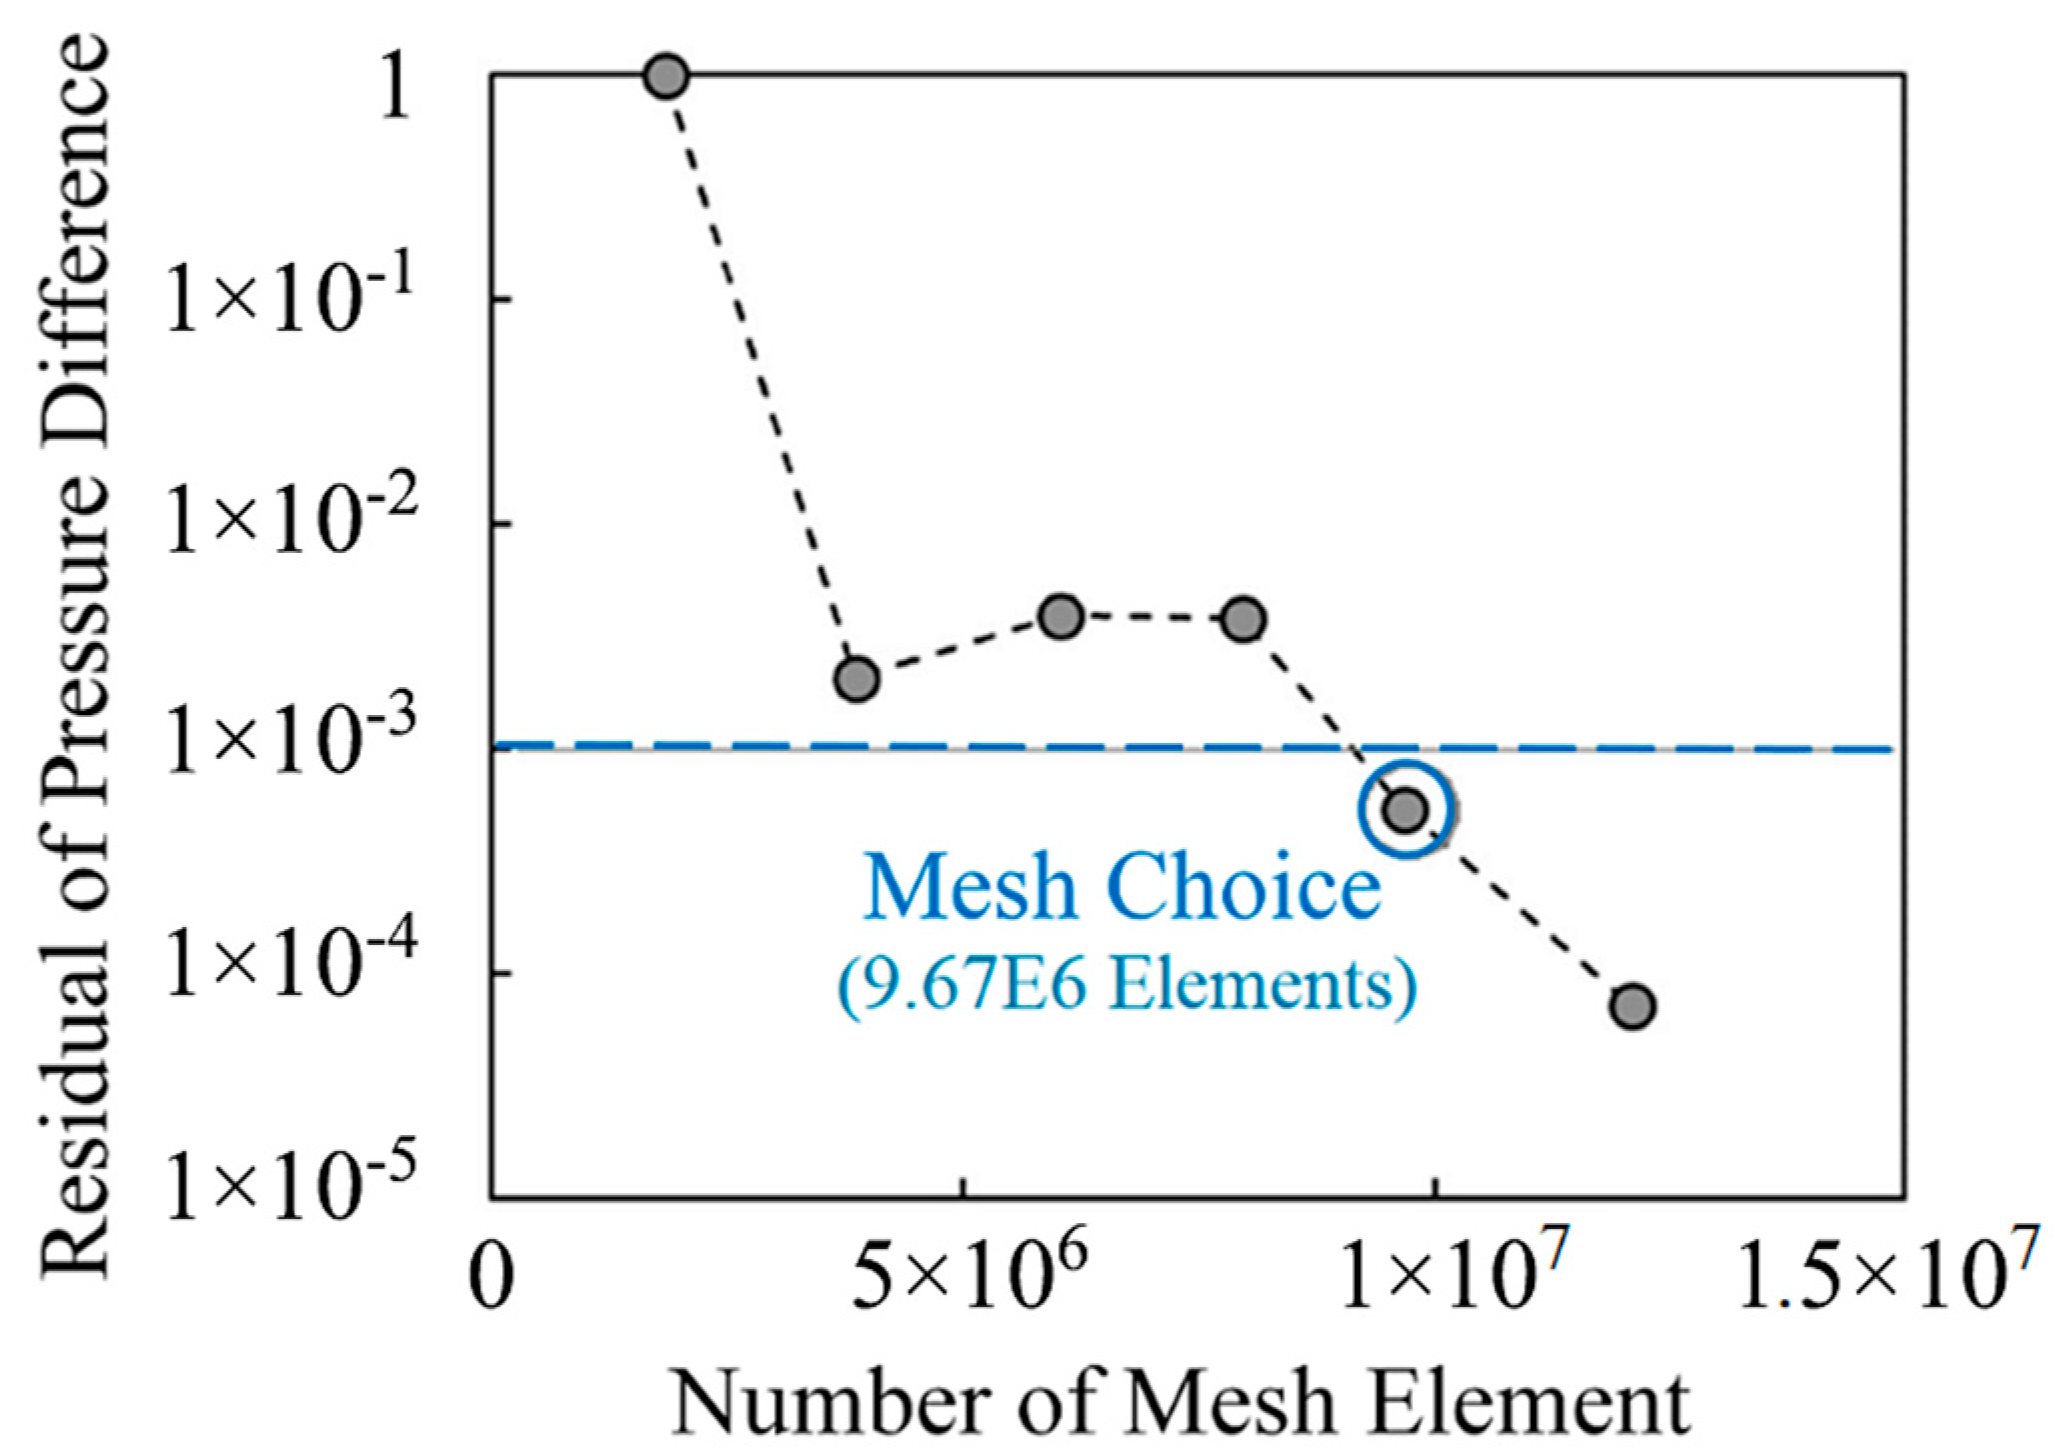
4.1. Fluid Domain and Mesh

To analyze the flow field in a pump-turbine which is not visible in the model test, computational fluid dynamics (CFD) is used in this study. Figure 4 shows the domain used in CFD including volute, stay vane, guide vane, runner, and draft tube. The mesh is created for CFD simulation with size independence check. The residual of pressure difference between volute inlet and draft tube outlet is used as the criterion. Finally, a mesh scheme with 9,668,956 elements is chosen because the residual becomes less than 0.001 as shown in Figure 5. With this mesh solution, it is expected to achieve a good balance between computing resource consumption and accuracy.

4.2. Setup of CFD Simulation

In this CFD simulation, it is necessary to seek runaway points under different guide vane openings. ANSYS CFX, which is stable and widely used as a commercial software, is used for the CFD code. For turbulence simulation, the Shear Stress Transport model [24] is used as the turbulence model to close the time-averaged Reynolds-averaged Navier-Stokes equation. The basic setting remains unchanged; that is, the medium is 25 °C water, and the pressure reference value is 1 atmospheric pressure. Cavitation is not considered in this case because it does not happen in the model test due to the high-pressure environment. The speed is set to a value between 400~630 r/min and corresponds to the model test. The assignment is achieved by setting the runner as the rotational domain. In order to allow the fluid to enter the computational domain of the unit, the inlet boundary of the volume is given as a flow-rate-type inlet, which actually specifies the velocity and direction at the boundary. The outlet side of the draft tube is given pressure, with a relative static pressure value of 0 Pa. All walls have no-slip wall type boundaries. The data transfer between different computing domains relies on the interface type of the general grid interface. In order to compare the magnitude of pressure fluctuations, the CFD simulation adopts an unsteady type. A total of 1800 steps are calculated for each runner revolution (time step depends on the actual rotational speed); each step requires 10–20 iterations, and the convergence criterion is that the residual of both the continuity equation and momentum equation is less than 0.00001. In this study, the advection scheme is high-resolution and the turbulence numerics are also high-resolution.

5. Results and Analysis

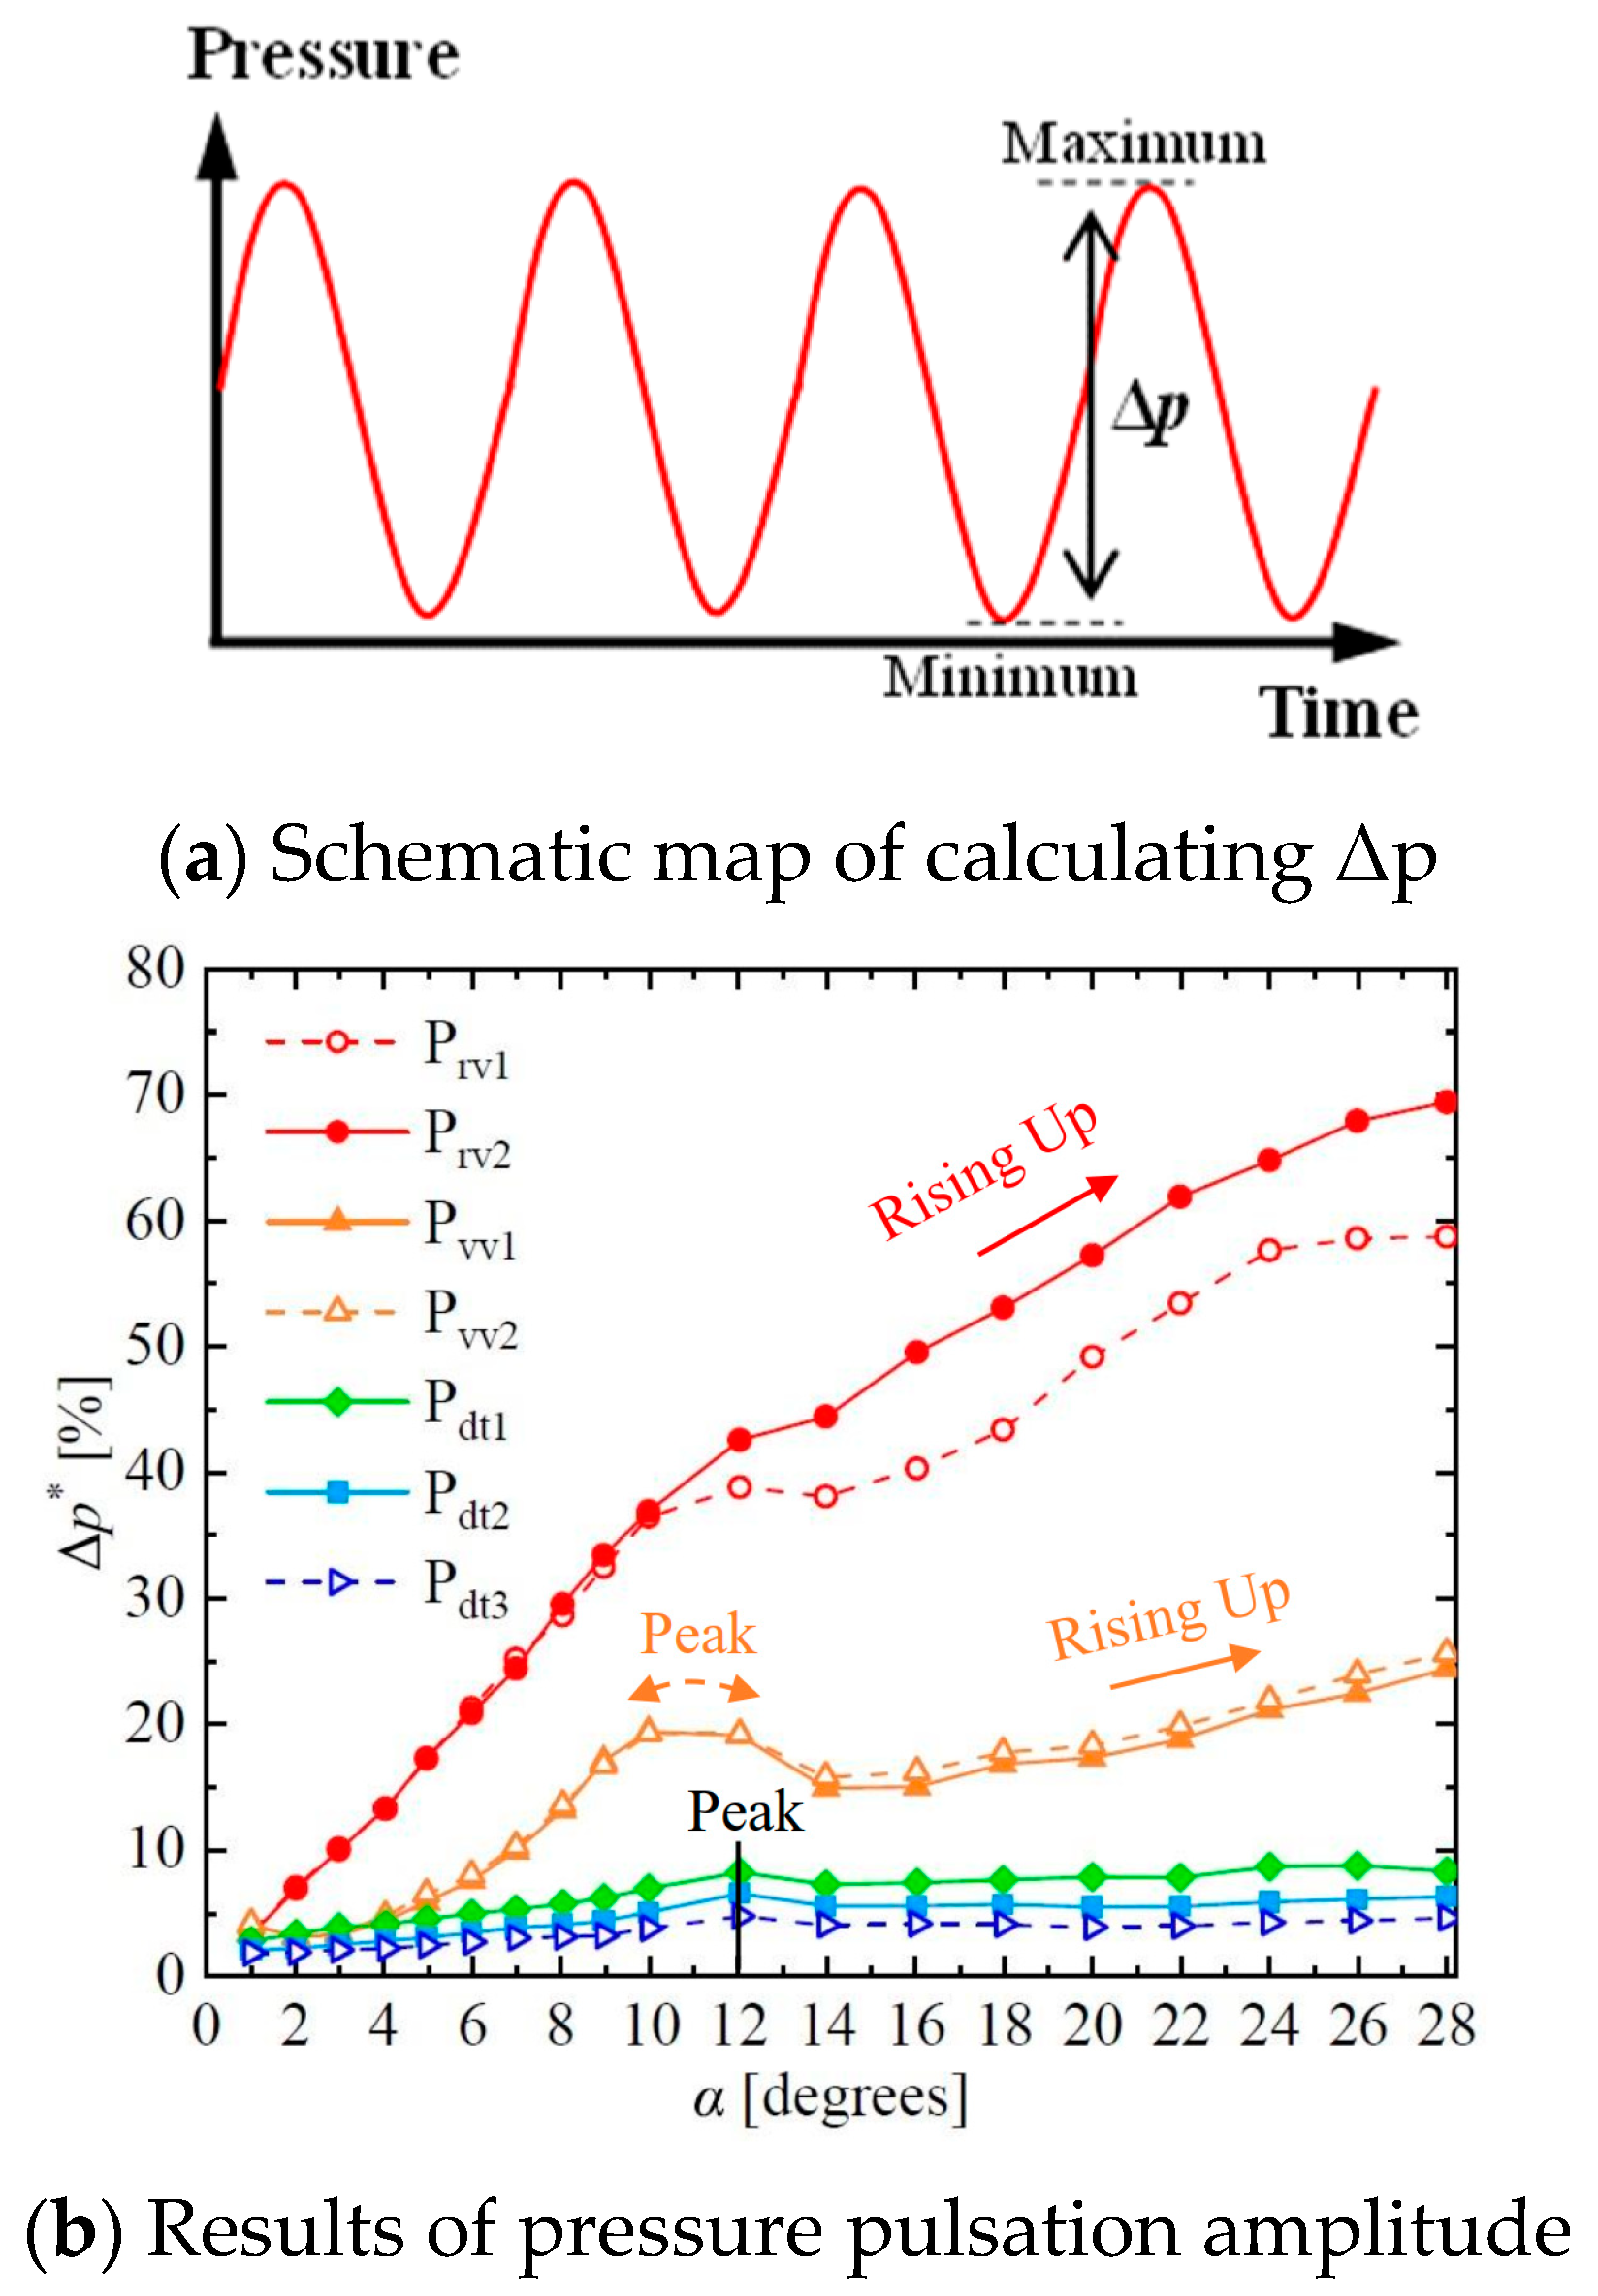
5.1. Pressure Pulsation Intensity by Guide Vane Opening

According to the common testing and analysis methods for pressure pulsation in hydraulic machinery [25,26,27], measurements were based on MICROSENSOR’s MPM489 pressure transmitter; its accuracy is 0.5%, the pressure range is −0.1~100 MPa, the output signal is 4–20 mA, and the sampling frequency is 800 Hz. The pressure pulsation amplitude by model test is shown in Figure 6, where the relative pulsation amplitude Δp* is defined as
Δ p * = Δ p ρ g H
where Δp is the pressure pulsation amplitude at a specific point and can be calculated as illustrated in Figure 6a. H is the head of the pump-turbine:
H = p i n p o u t ρ g
where pin and pout are the pressures at the pump-turbine volute inlet and the draft tube outlet, respectively. This represents the percentage of the pressure pulsation value at this point relative to the head. In this study, the 97% confidence level was used to analyze the amplitude of pressure pulsation, removing the influence of accidental factors.
From Figure 6, it can be seen that at points Prv1 and Prv2 in the vane region between the guide vane and the runner, the amplitude of pressure pulsation gradually increases with the increase in the guide vane opening angle α. When the opening angle of the guide vane increases to 28 degrees, the relative value of pressure pulsation can even reach 60–70%. At points Pvv1 and Pvv2 in the vaneless region between the guide vane and the stay vane, the amplitude of pressure pulsation shows a peak at a guide vane opening angle within the range of 10–12 degrees. At this peak, the amplitude of pressure pulsation can reach about 20%. Then, the amplitude of the pressure pulsation experienced a slight drop and then rose again, reaching about 25% at a guide vane opening angle of 28 degrees. For the three points in the draft tube, when the guide vane opening angle is 12 degrees, the amplitude of pressure fluctuation also has a peak. As the opening angle of the guide vane increases, the pressure pulsation decreases and then rebounds, but the relative amplitude does not exceed 10%. In general, the pressure pulsation is strongest in the vane region between the guide vane and runner, followed by the vane region between the guide vane and the stay vane, and weaker in the draft tube. In the draft tube, the farther away from the runner, the weaker the pressure pulsation.

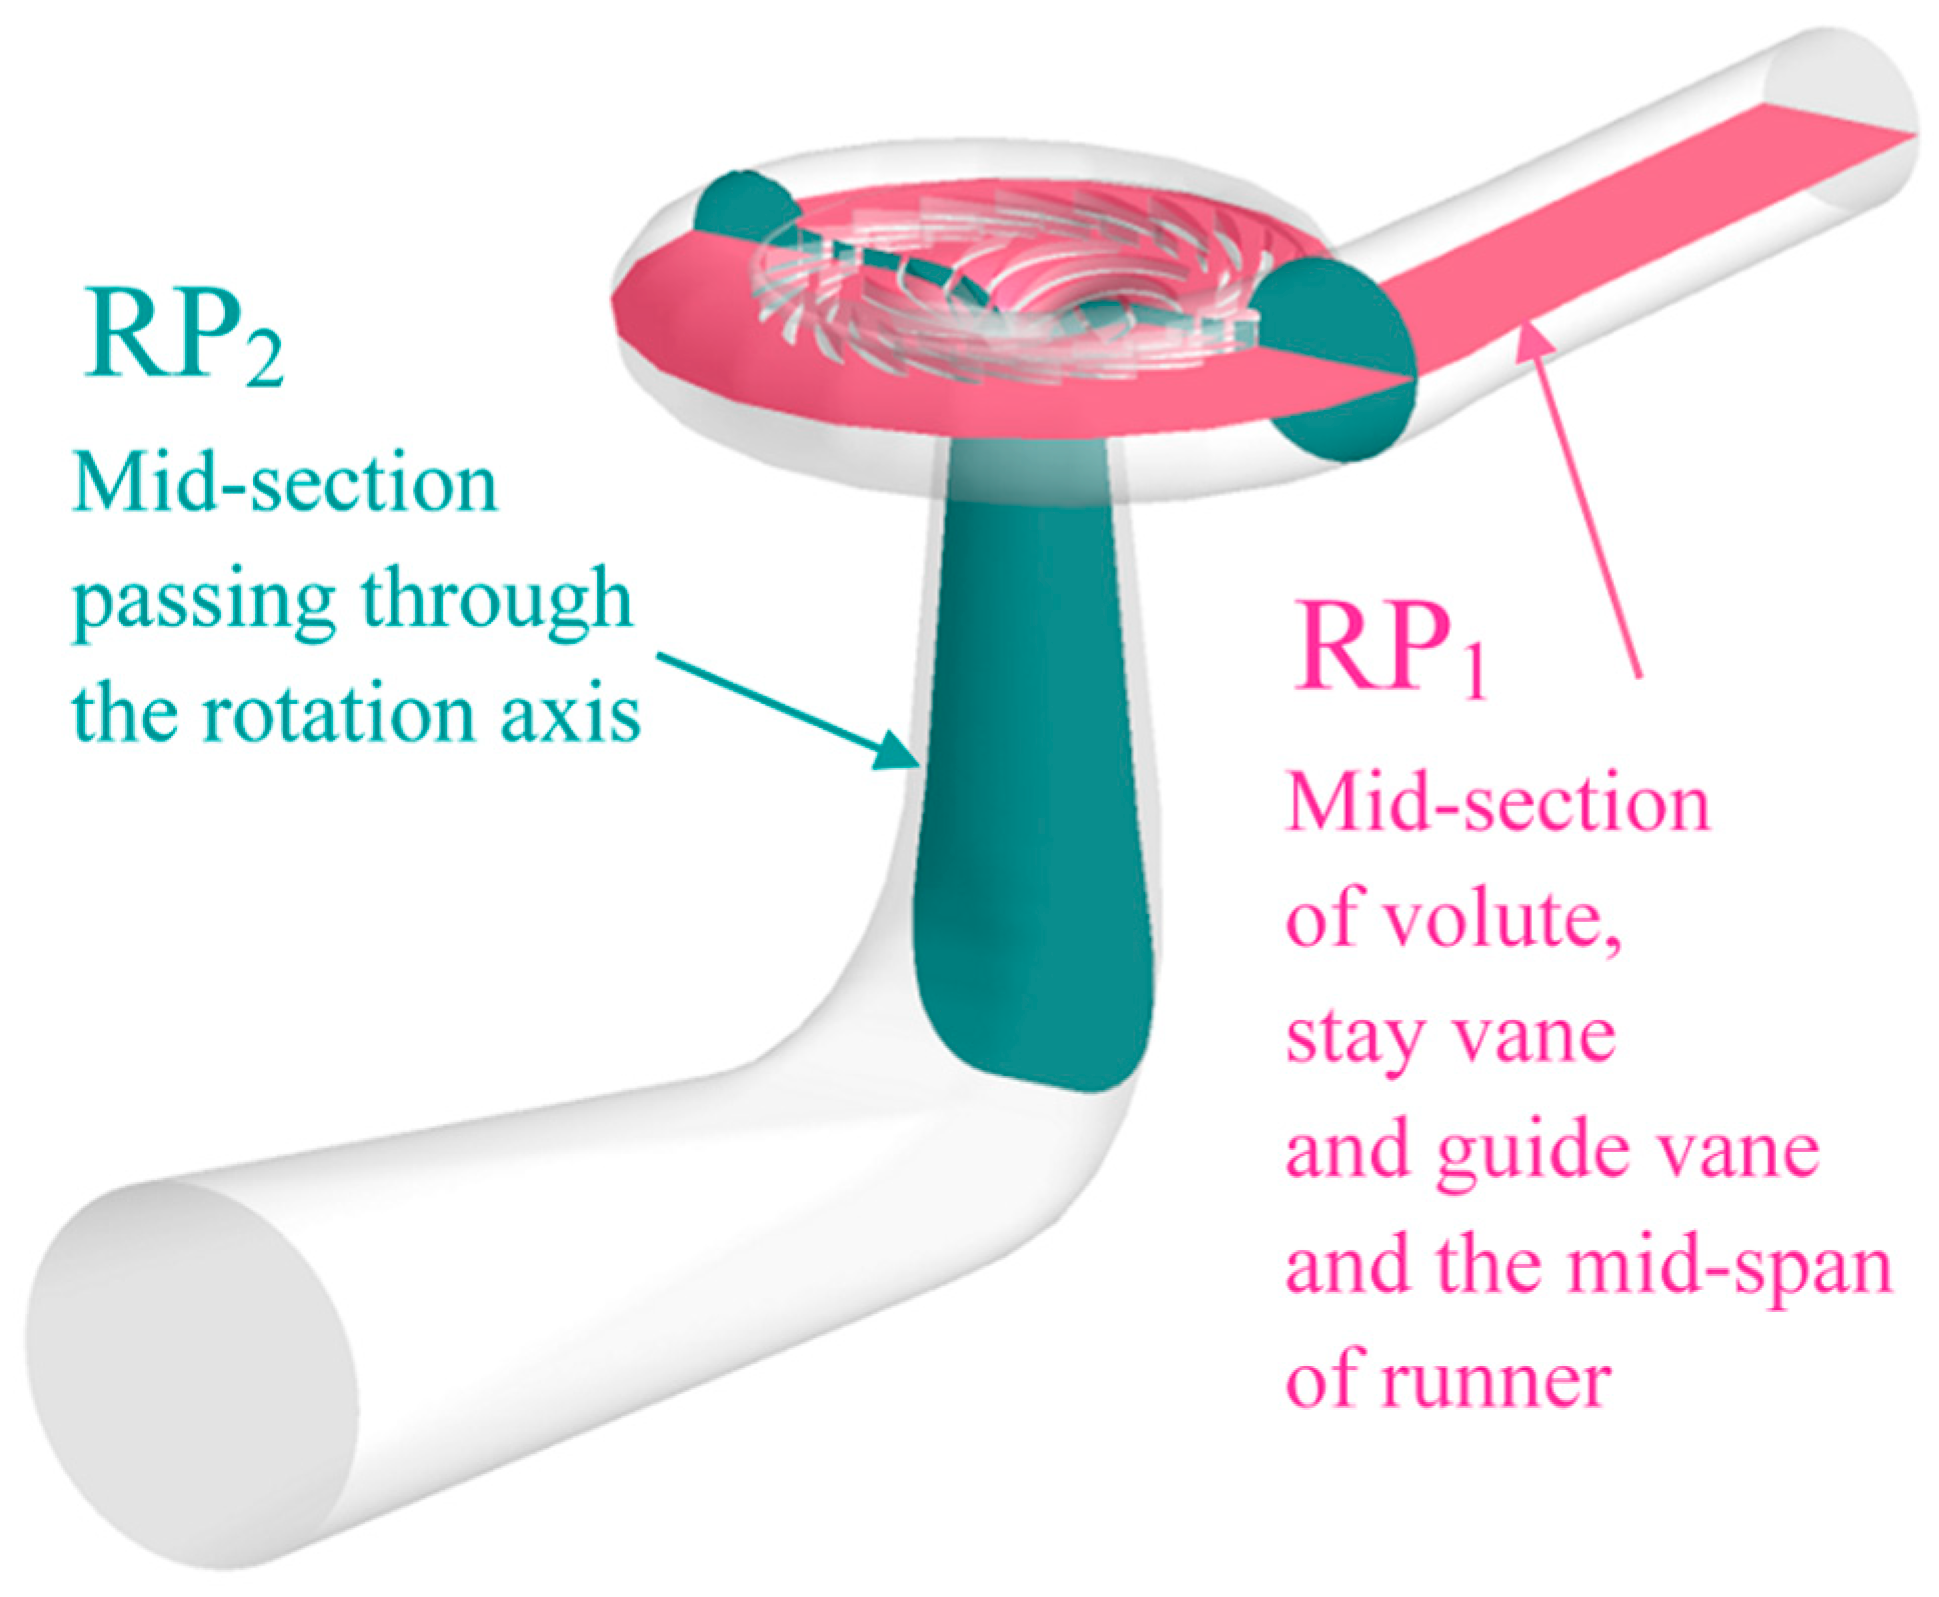
5.2. Reference Plotting Positions

To understand the flow mechanism in the pump-turbine, two reference plotting positions are set in pump-turbine flow passages as shown in Figure 7. Reference position 1 (RP1) is the mid-section of the volute, stay vane, and guide vane perpendicular to the rotation axis and mid-span of the runner. Reference position 2 (RP2) is the mid-section passing through the runner rotation axis.

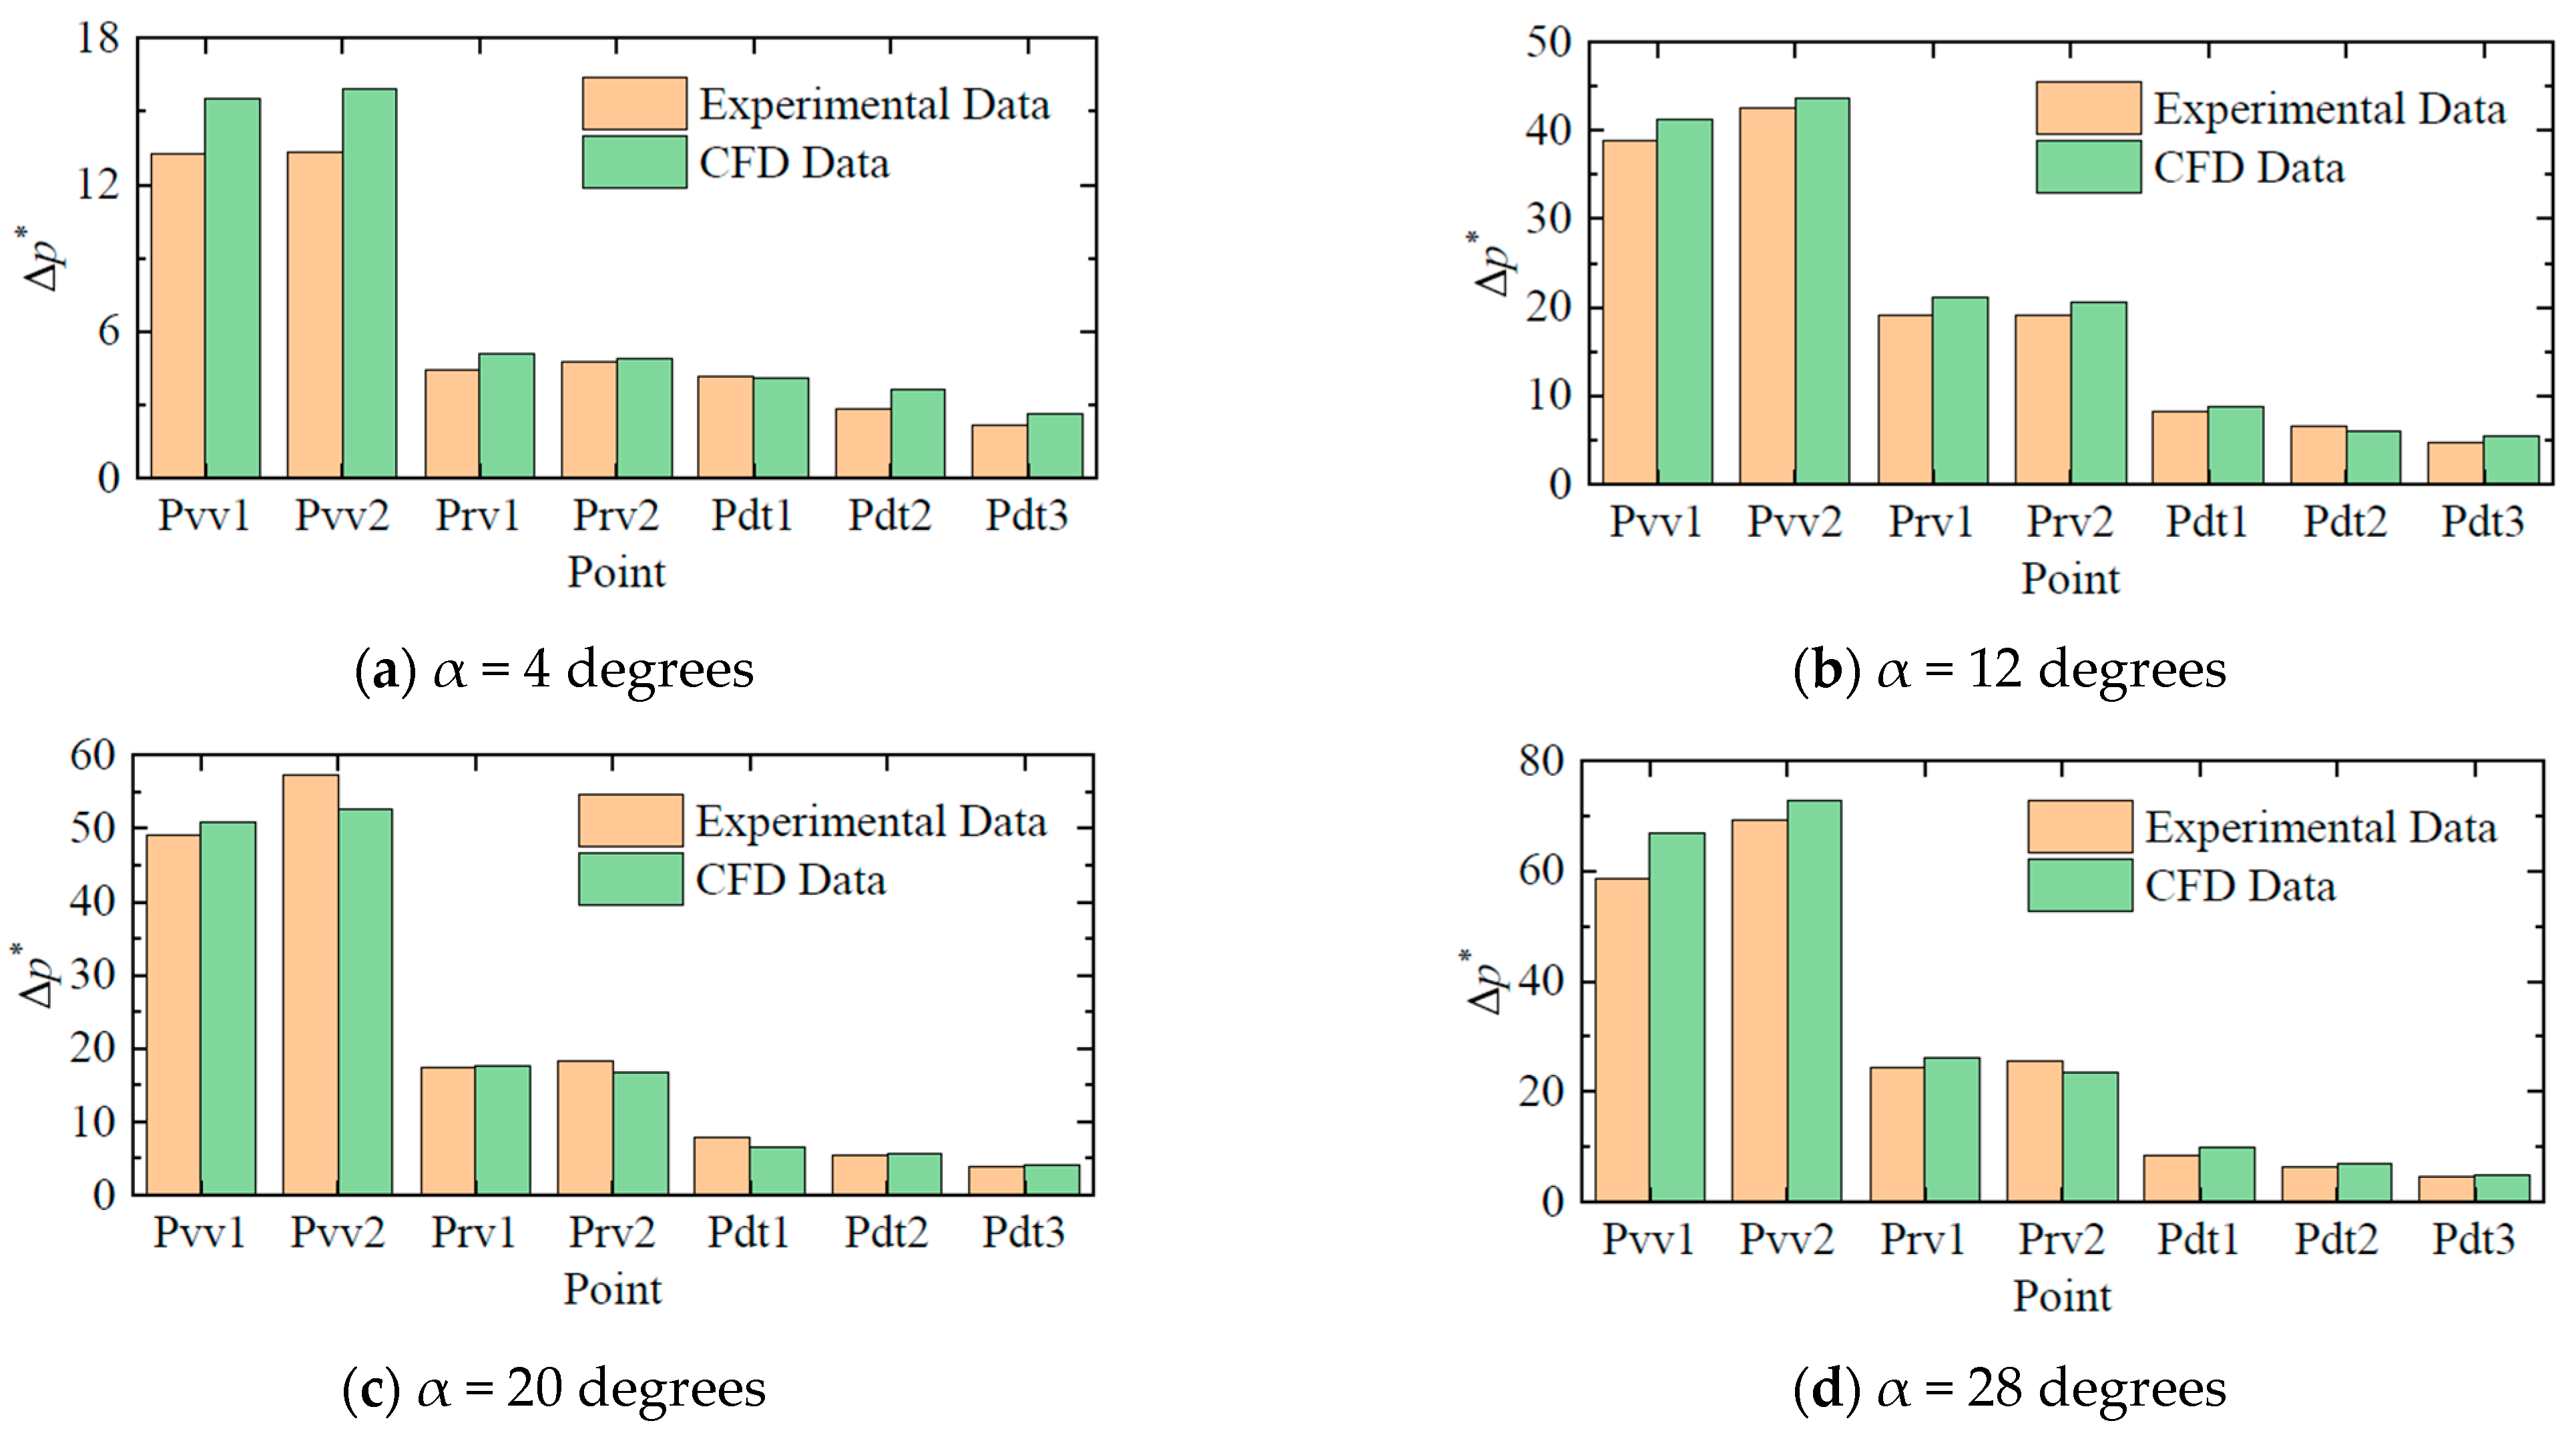
5.3. Experimental-Numerical Comparison of Pressure Pulsation Intensity

Four different guide vane opening conditions were compared, including the α cases of 4, 12, 20, and 28 degrees, covering the cases of weak, medium, strong, and local peak of pressure pulsation. Figure 8 shows the comparison of pressure pulsation amplitude between experimental values and CFD values at Prv1, Prv2, Pvv1, Pvv2, Pdt1, Pdt2, and Pdt3 points, respectively, and the 97% confidence level was still used. It can be seen that CFD simulation accurately predicts the amplitude of pressure pulsation, which can assist in the analysis of subsequent sections.

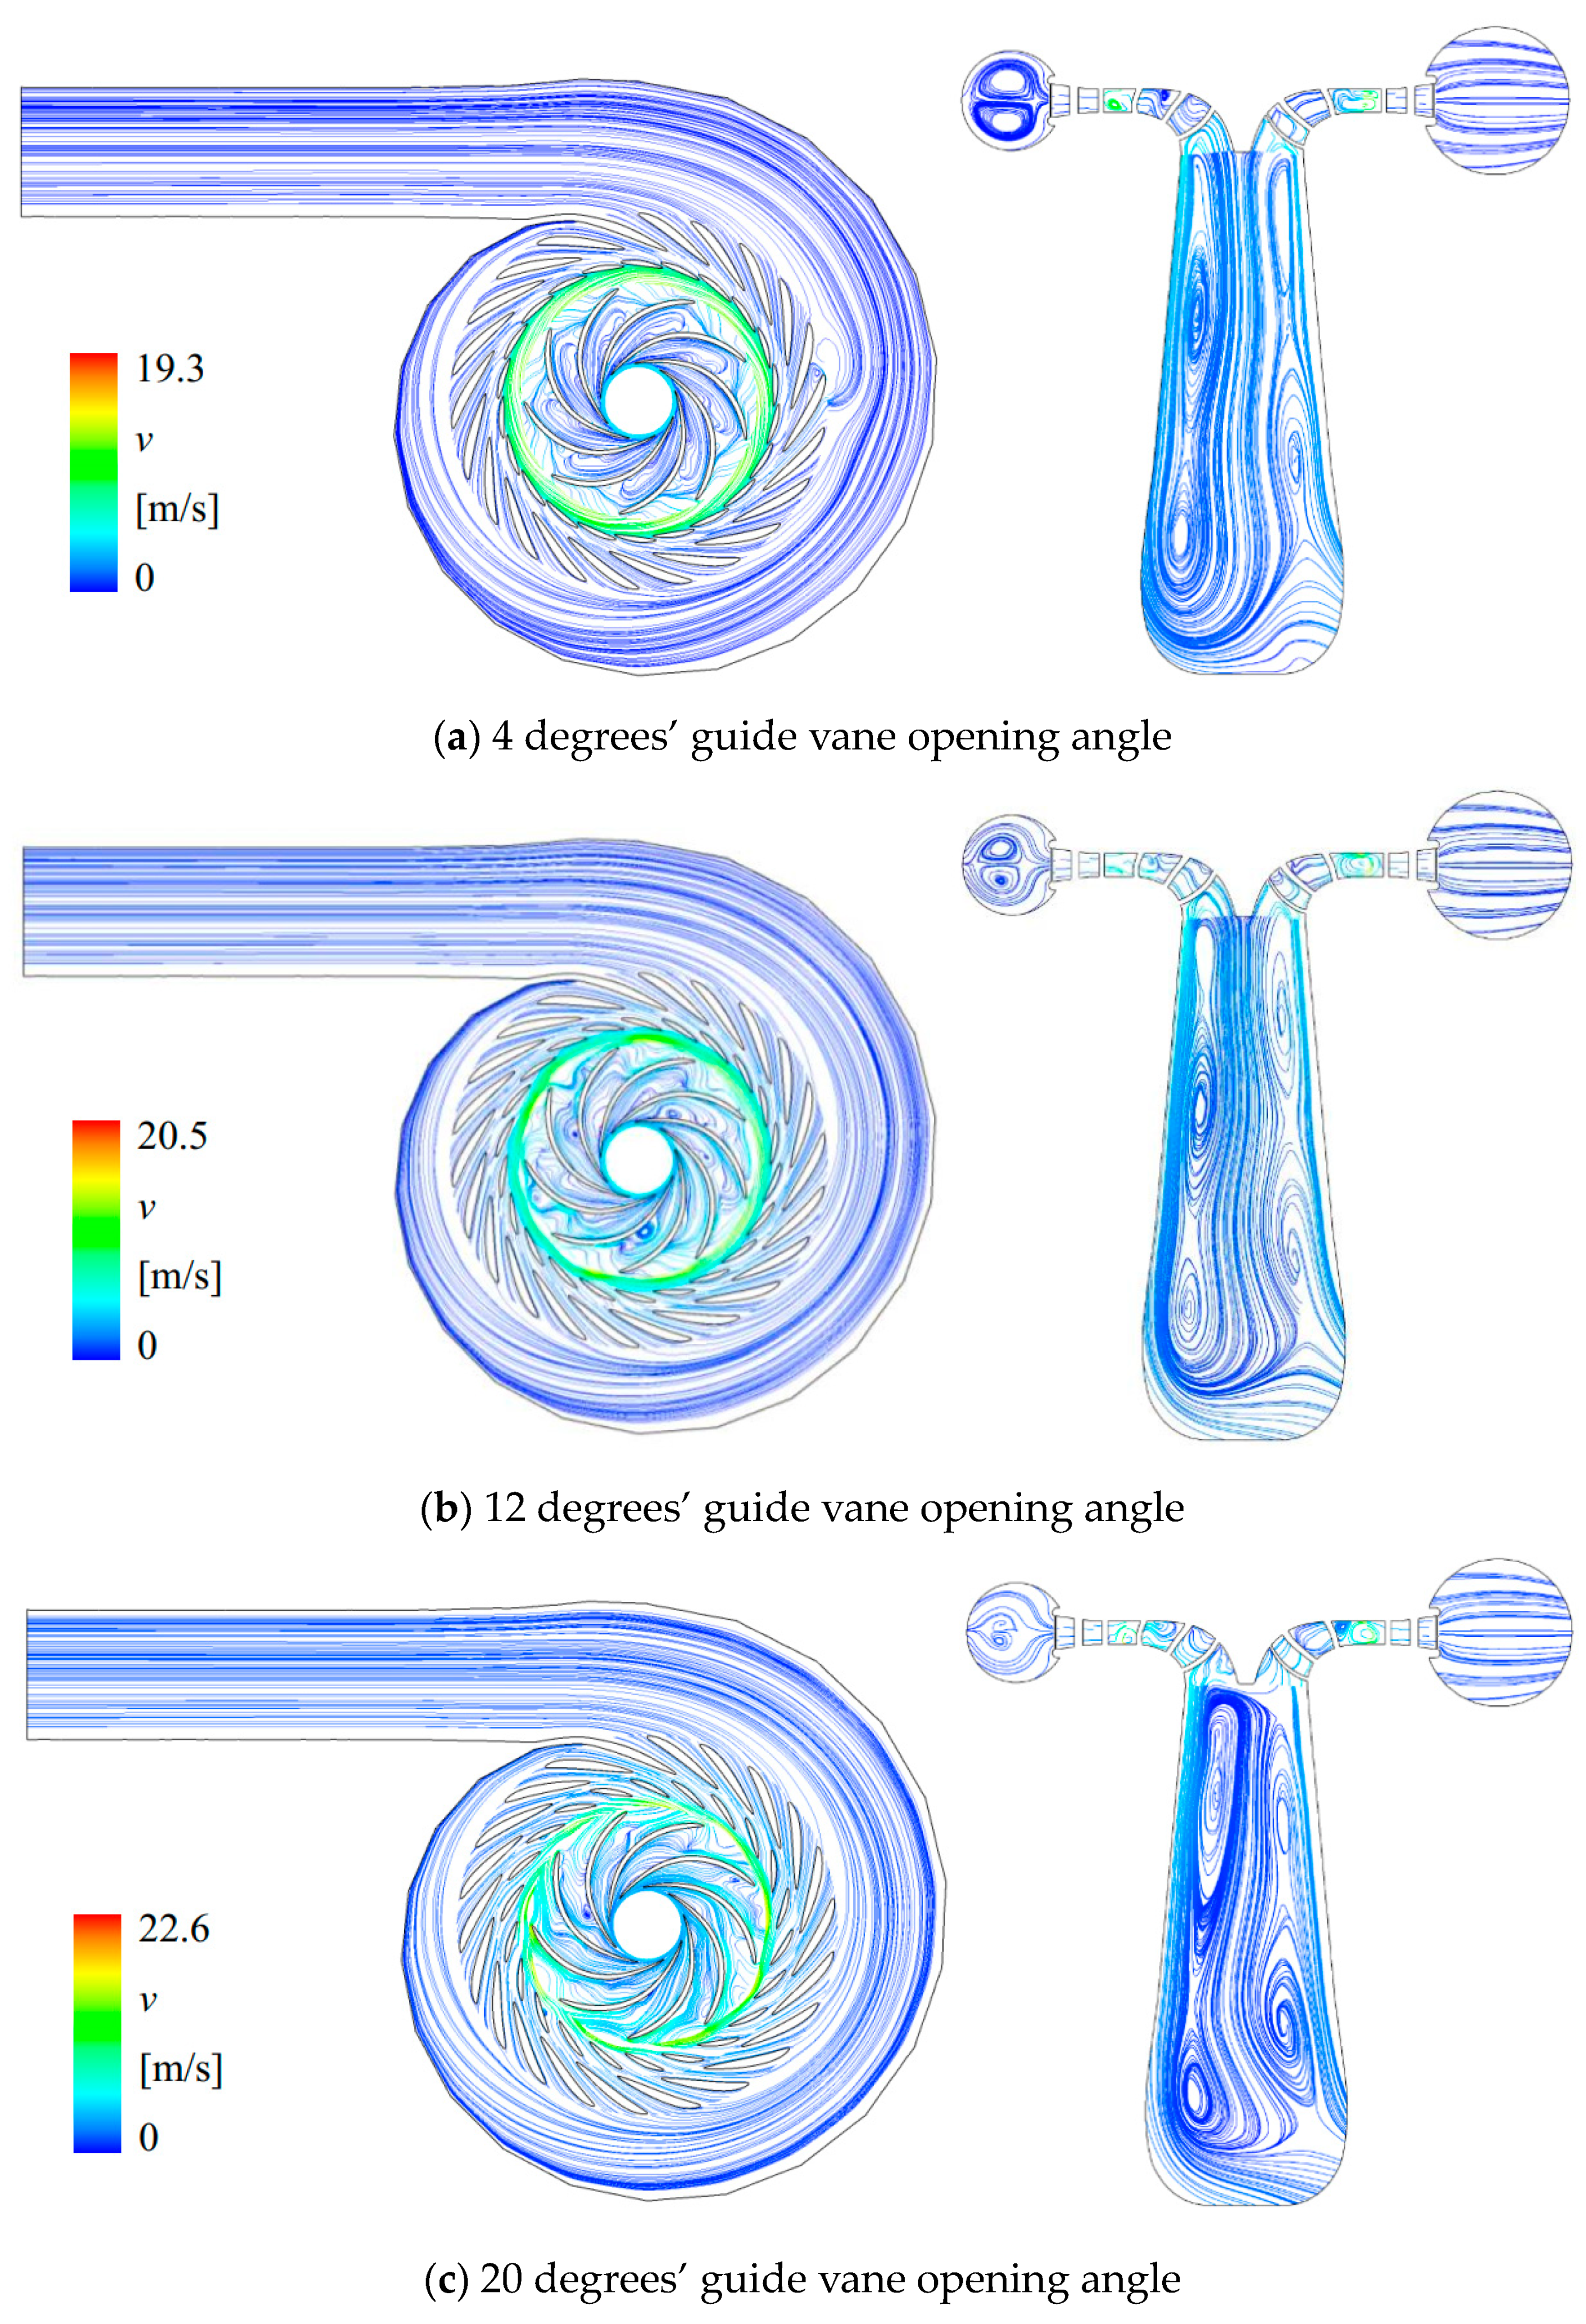
5.4. Internal Flow Pattern in Pump-Turbine

Figure 9 shows the flow pattern distribution rule in the pump-turbine, which can reveal the local flow pattern and judge whether there are vortex, back flow, and secondary flow structures. When the guide vane opening angle is 4 degrees, the flow pattern in the volute, stay vane, and guide vane on RP1 is smooth. There are uniformly distributed large eddies inside the runner. The flow inside the volute on RP2 is symmetrical along the centerline, and there are many large vortexes inside the draft tube. The velocity between runner and guide vane is relatively high, reaching a maximum of 19.3 m/s. When the guide vane opening angle is 12 degrees, the flow pattern in the volute, stay vane, and guide vane on RP1 is still good. There are vortexes inside the runner, but their distribution is uneven, occupying a portion of the flow channel. The flow inside the volute on RP2 is symmetrical along the centerline, and there are many large vortexes inside the draft tube, which is similar to that at 4 degrees. The velocity between runner and guide vane is still high, and the maximum velocity increases to 20.5 m/s. When the guide vane opening angle is 20 degrees, the vortex flow inside the runner on RP1 becomes the flow dominated by the transverse secondary flow. The flow inside the volute on RP2 is symmetrical along the centerline, and there are many large vortexes inside the draft tube, which is similar to that at 4 degrees and 12 degrees. The maximum velocity between runner and guide vane further increases to 22.6 m/s. When the opening angle of the guide vane is 28 degrees, the flow inside the runner on RP1 becomes dominated by vortexes, and the distribution of vortexes is uneven. There is still a large vortex in the draft tube on RP2. The maximum velocity between runner and guide vane further increases to 27.0 m/s.

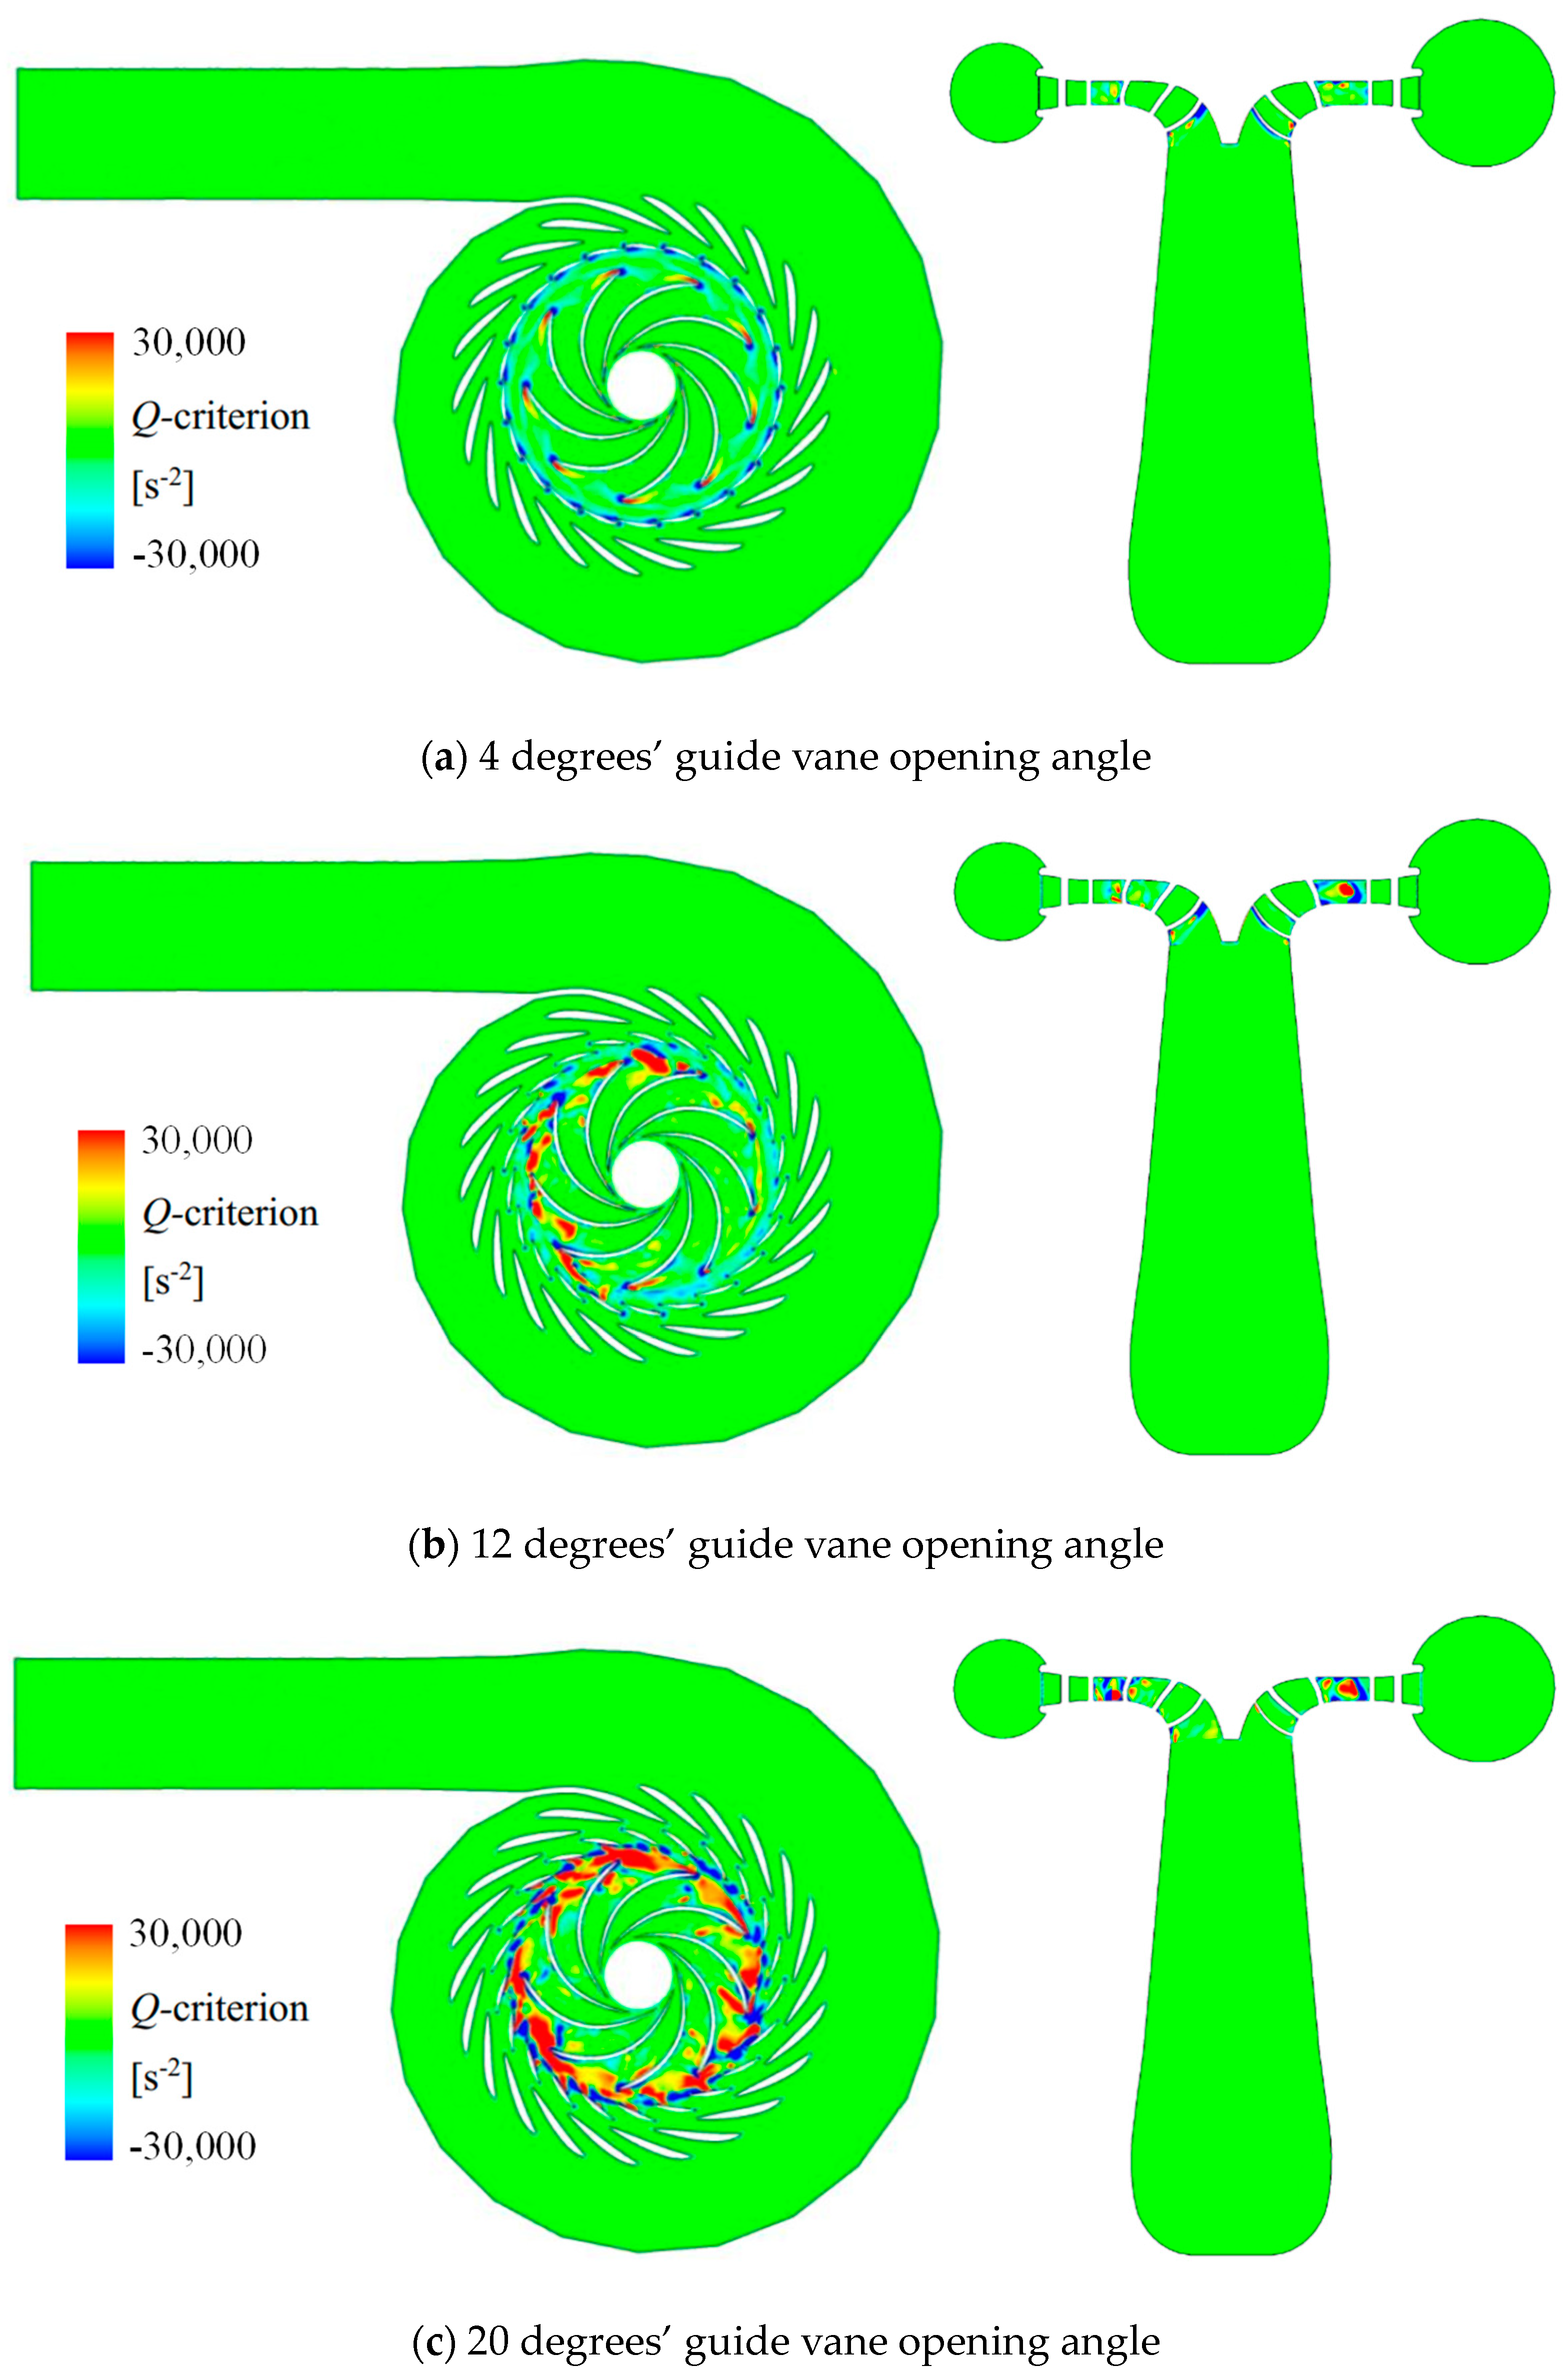
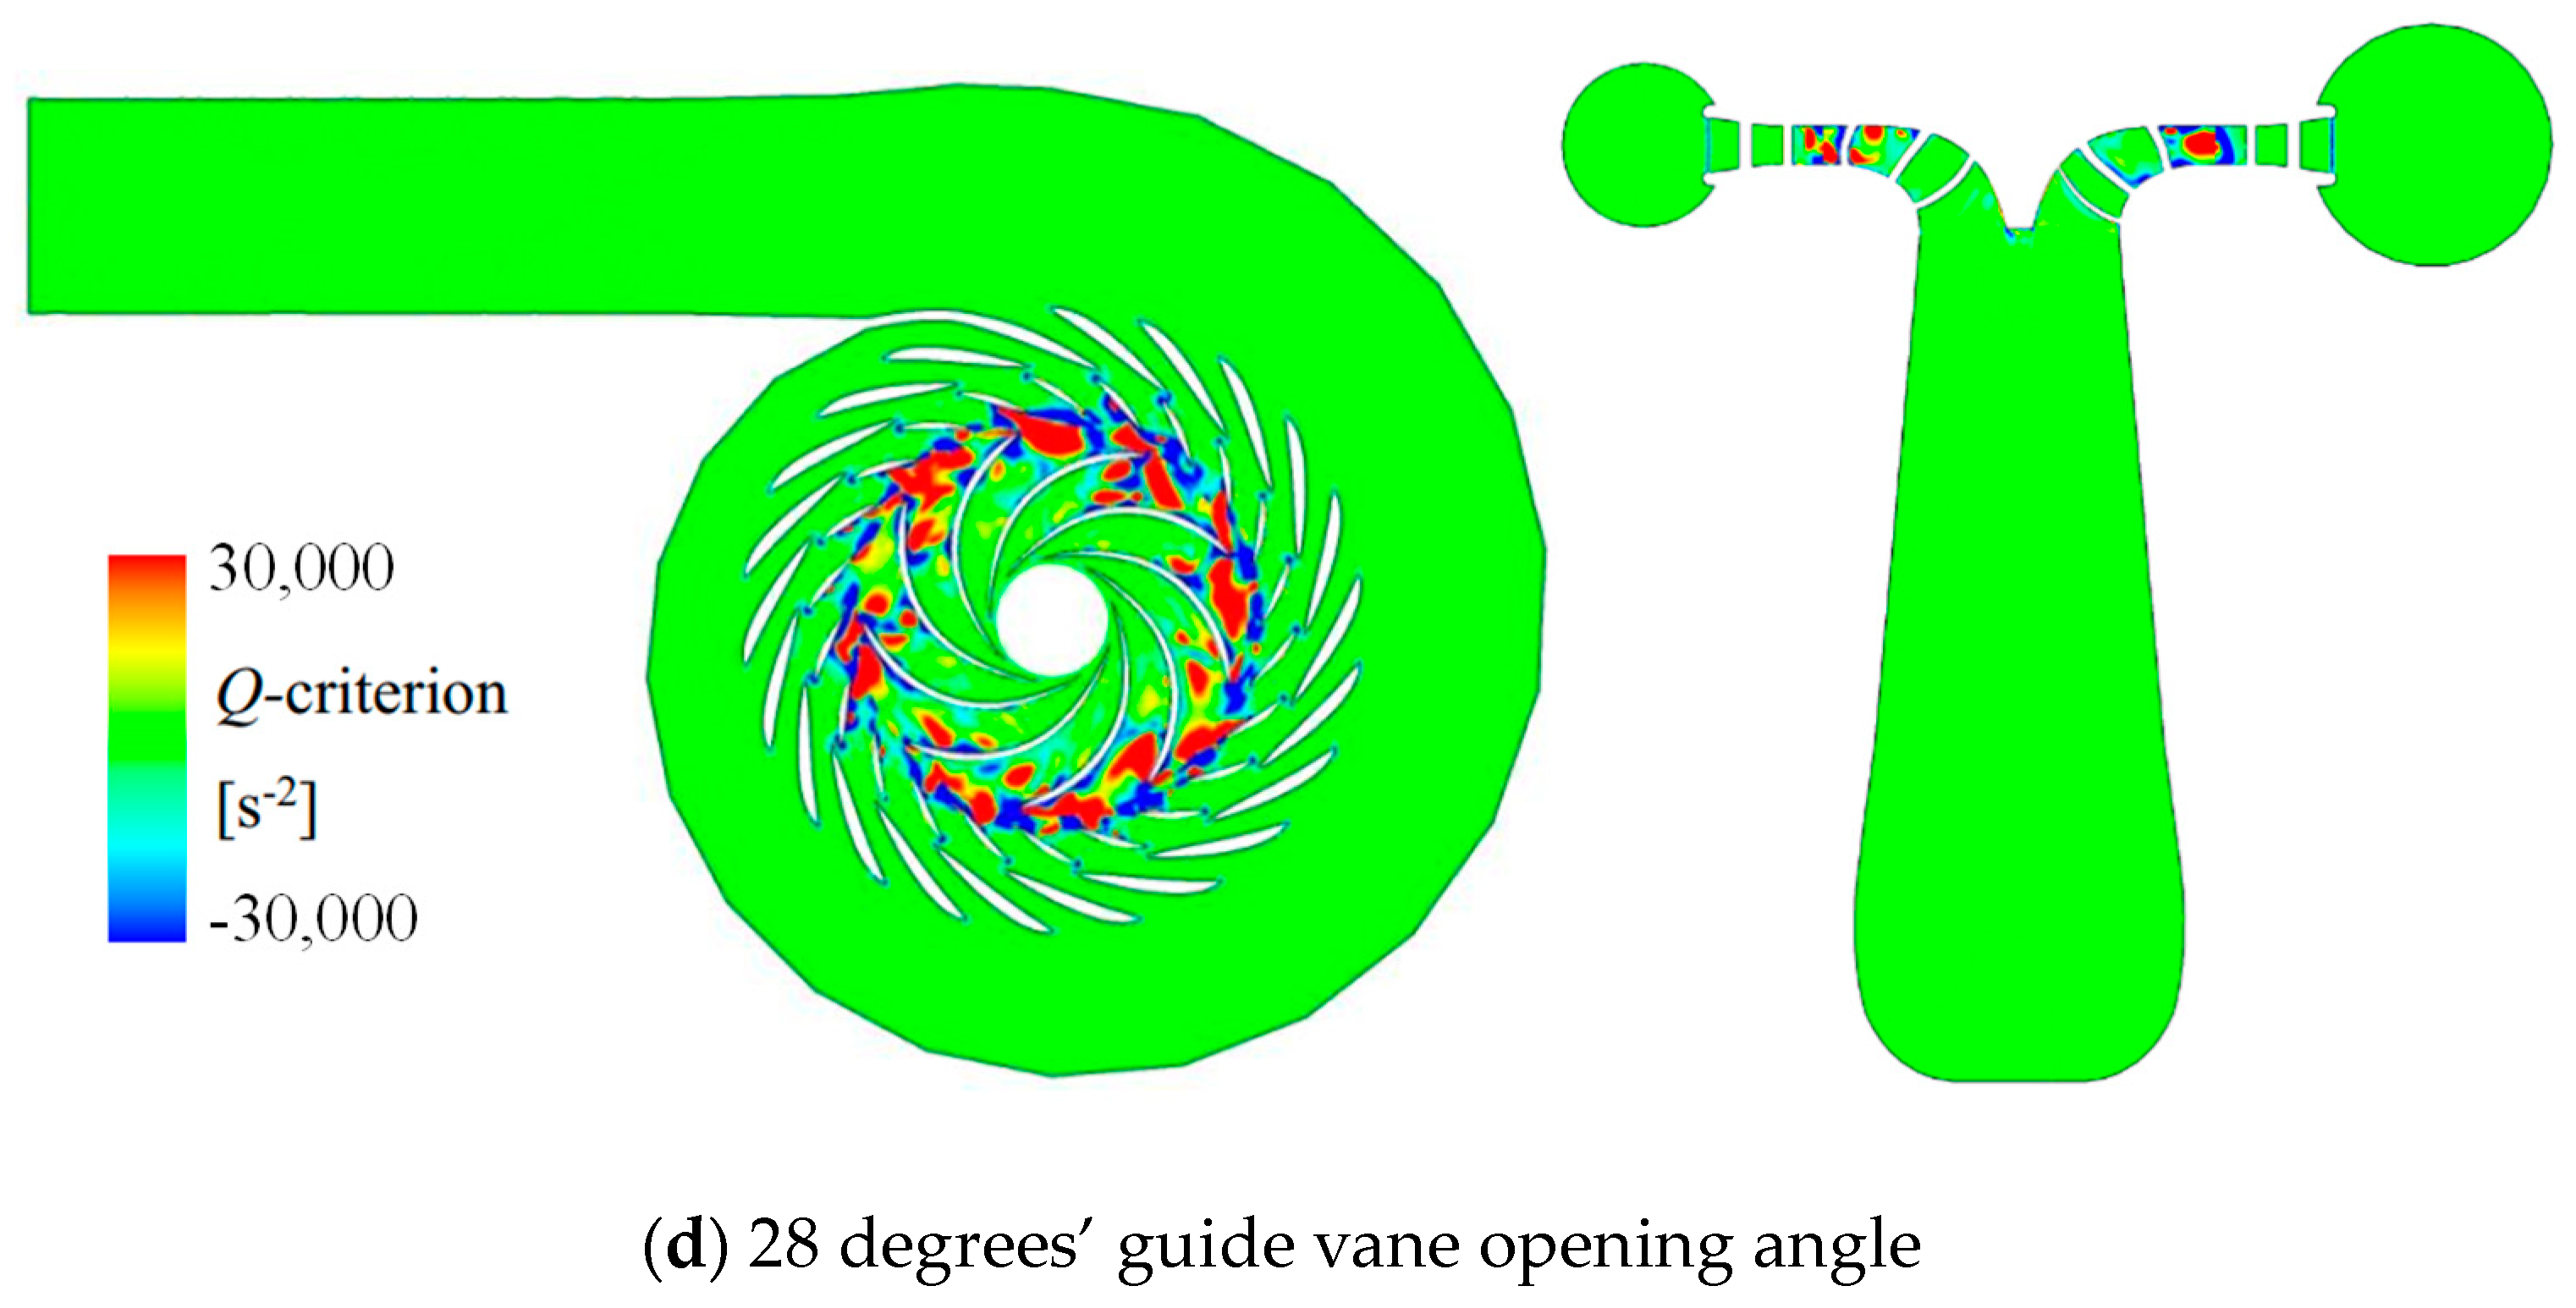
5.5. Vortex Intensity in Pump-Turbine

The Q-criterion is often used for vortex identification and is closely related to the velocity gradient tensor [28]. The velocity gradient is decomposed into strain rate tensor S and rotation rate tensor Ω as
S = 1 2 [ u i x j + u j x i ]
Ω = 1 2 [ u i x j u j x i ]
The value of Q is defined as the second invariant of the velocity gradient tensor, representing the region dominated by vorticity, or vice versa:
Q = 1 2 [ Ω F 2 S F 2 ]
Figure 10 shows the vortex distribution pattern based on the Q-criterion on RP1 and RP2. When the opening of the guide vane is at 4 degrees, there are strong positive or negative Q values at the trailing edge of the guide vane and the leading edge of the runner. The distribution area is relatively limited. When the opening of the guide vane is at 12 degrees, the strong positive or negative Q value areas at the trailing edge of the guide vane and the leading edge of the runner expand, and are mainly distributed on the side with smaller cross-sectional area of the volute, forming strong non-uniformity. When the opening angle of the guide vane increases to 20 degrees, the strong positive or negative Q value areas at the trailing edge of the guide vane and the leading edge of the runner do not change much, but are evenly distributed throughout the circumference. When the opening of the guide vane is at 28 degrees, the strong positive or negative Q value areas at the trailing edge of the guide vane and the leading edge of the runner further increase and have already extended into the runner blade channel. It can be seen that the strength of vortexes seems to be related to the amplitude of pressure pulsation, and the strong and uneven distribution of vortexes may be the key to causing pressure pulsation.

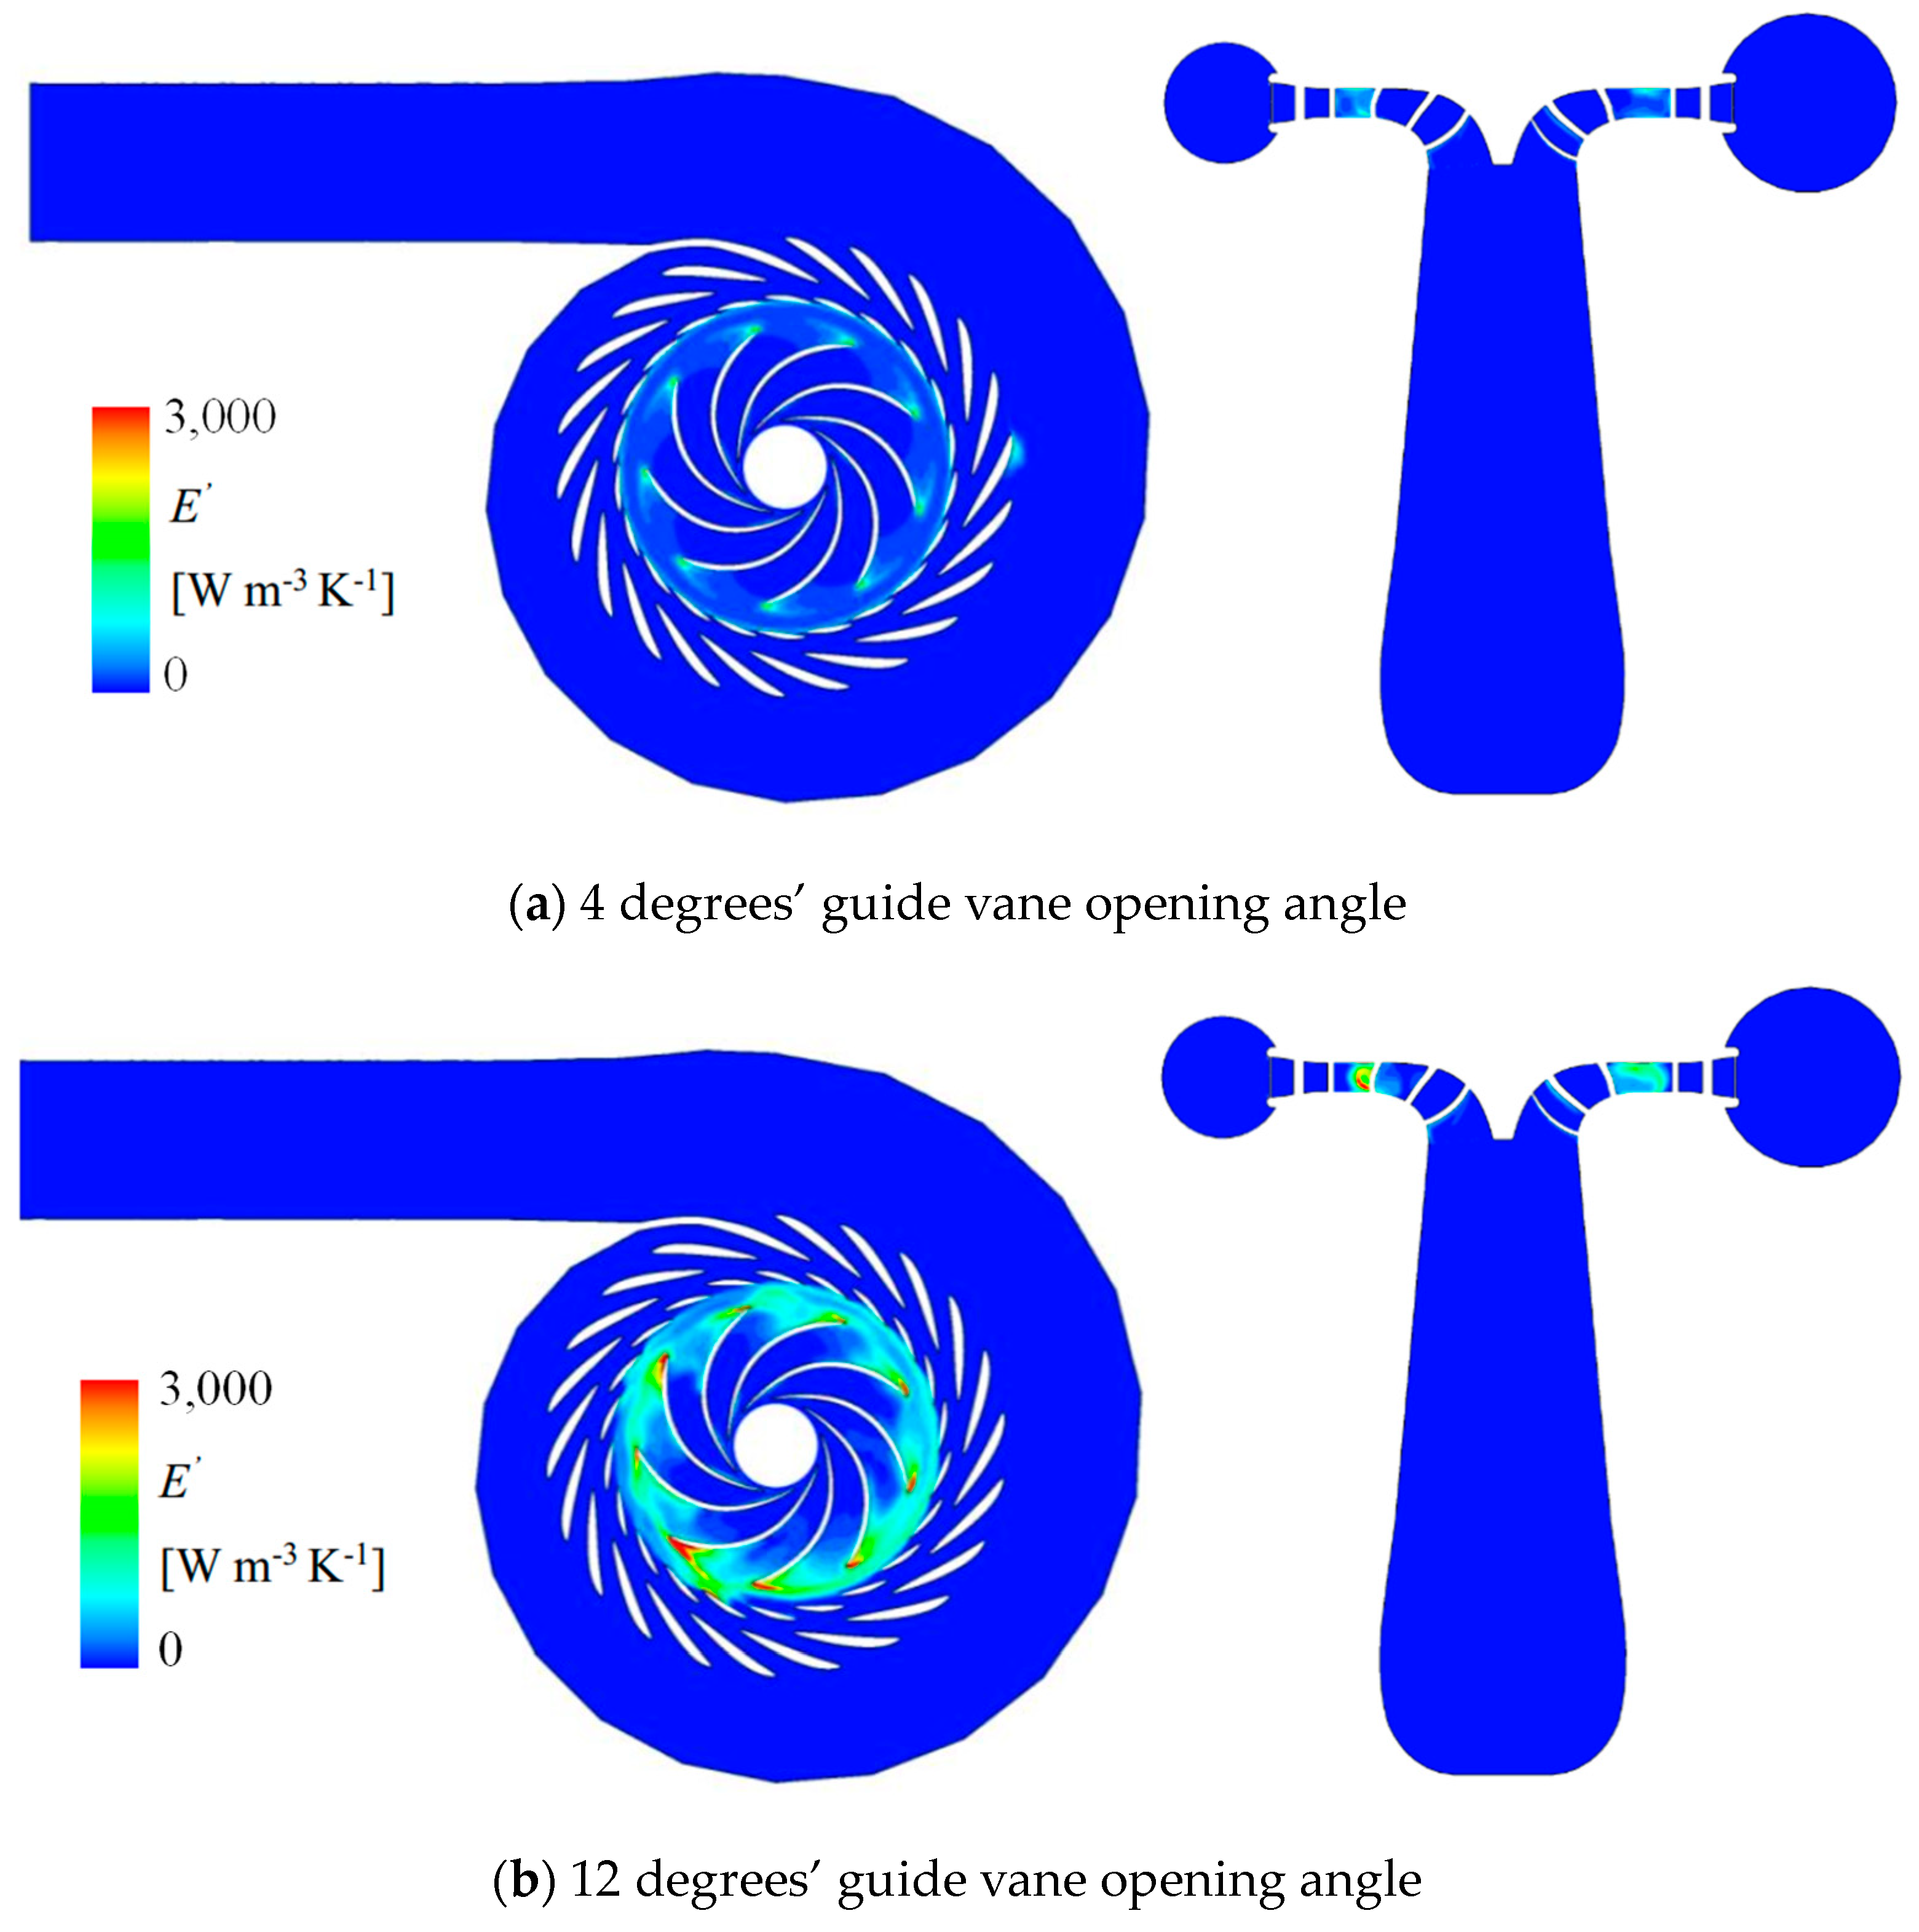
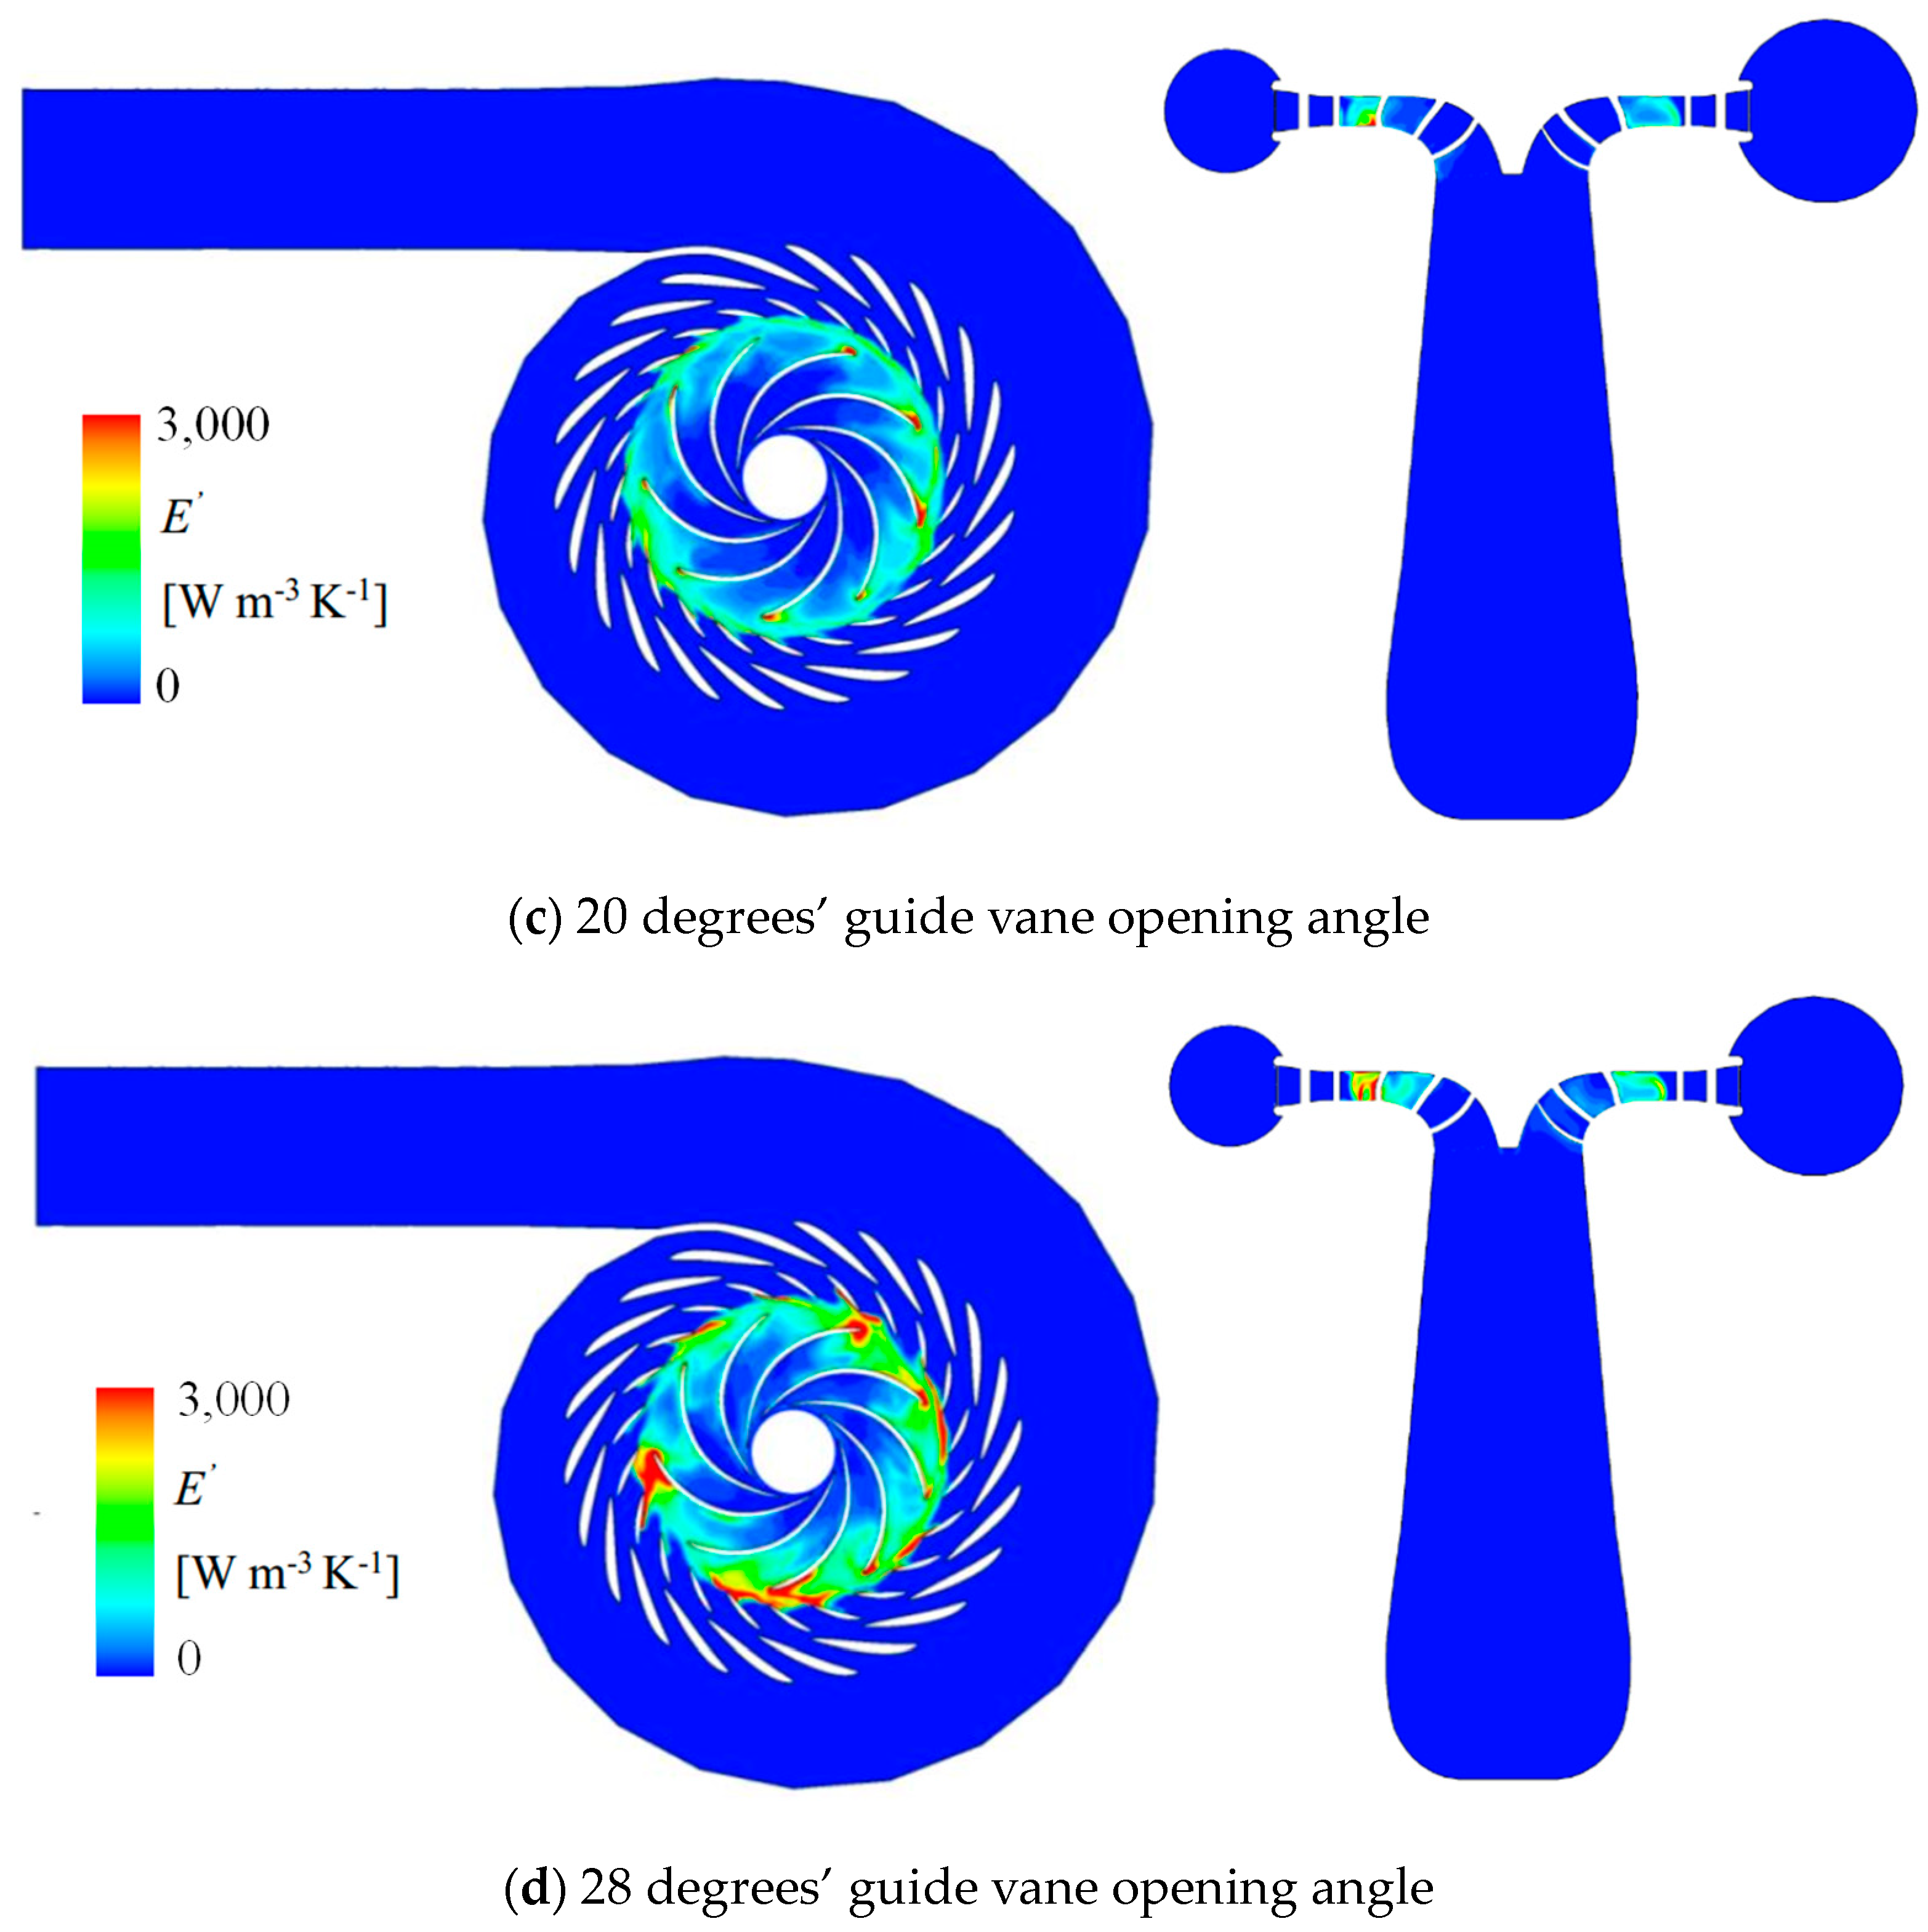
5.6. Entropy Production in Pump-Turbine

Herwig et al. [29] provided an entropy production method for quantitatively calculating the flow energy dissipation. The energy dissipation is particularly treated as term Eloss and term Edisp and can be calculated as time-averaged and pulsating terms when using the RANS method.
E = E l o s s   + E d i s p   = T [ ( S p c ¯ ) + ( S p c ) ] + T [ ( S p d ¯ ) + ( S p d ) ]
where  S p c ¯ and  S p c are the sub-terms of entropy production caused by energy loss, and  S p d ¯ and  S p d are the sub-terms of entropy production caused by energy dissipation. These sub-terms can be calculated based on the turbulent flow field:
S p c ¯ = λ t T 2 [ ( T ¯ x ) 2 + ( T ¯ y ) 2 + ( T ¯ z ) 2 ]
S p c = λ t T 2 [ ( T x ) 2 ¯ + ( T y ) 2 ¯ + ( T z ) 2 ¯ ]
S p d ¯ = μ T ¯ [ 2 ( u ¯ x ) 2 + 2 ( v ¯ y ) 2 + 2 ( w ¯ z ) 2 + ( u ¯ y + v ¯ x ) 2 + ( u ¯ z + w ¯ x ) 2 + ( v ¯ z + w ¯ y ) 2 ]
S p d = μ T ¯ [ 2 ( u x ) 2 ¯ + 2 ( v y ) 2 ¯ + 2 ( w z ) 2 ¯ + ( u y + v x ) 2 ¯ + ( u z + w x ) 2 ¯ + ( v z + w y ) 2 ¯ ]
where x, y, z are coordinate components. This entropy production-based method considers the variation of velocity and temperature during the flow process. It may be helpful in analyzing the reason for local strong flow-flow and flow-wall interaction [30,31].
Figure 11 shows the Flow energy dissipation in pump-turbine. When the opening of the guide vane is at 4 degrees, the position with strong energy dissipation is located in the area between the guide vane and the runner. Among them, the leading edge of the runner blade is the strongest, and the maximum value of E′ is about 1000 W/(m3K). When the opening of the guide vane is at 12 degrees, the position with strong energy dissipation is still located in the area between the guide vane and the runner. The maximum value of E′ at the leading edge of the runner blade can reach over 3000 W/(m3K). When the opening of the guide vane is at 20 degrees, the energy dissipation in the area between the guide vane and the runner is still strong. However, the area where the E′ on the leading edge of the runner blade exceeds 3000 W/(m3K) is actually smaller than when the guide vane opening is at 12 degrees. When the opening angle of the guide vane increases to 28 degrees, the area of the E′ on the leading edge of the runner blade exceeding 3000 W/(m3K) significantly increases. From the perspective of entropy production rate, according to the second law of thermodynamics, a decrease in fluid mechanical energy transforms into an increase in internal energy. Therefore, the stronger E′ represents a decrease in flow velocity and an increase in temperature, which is closely related to the pulsation of the flow field.

6. Discussion

This study is based on model experiments or model-scale numerical simulation analysis. In the model scale, experiments were conducted to find a point with a torque of 0 by adjusting the supply pump based on the fixed rotational speed of a rotor given by the motor. In fact, during the runaway process of the prototype pump-turbine, the fluid enters the runner uncontrollably, causing the runner speed to increase to a maximum limit value. At this point, the torque is 0, and the corresponding speed needs to be tested to determine it. Compared between the two situations, the model scale refers to a relatively stable state driven by the runner, while the prototype scale refers to a state where the rotational speed repeatedly fluctuates slightly under the flow’s driving. There may be differences in dynamics between the two, as shown in Figure 12. The components in velocity triangle [32] are the rotational linear velocity of runner U, relative flow velocity W, absolute flow velocity V, and meridional absolute velocity Vm. Vm is equal to Q/A, where Q is flow rate and A is flow passing area. Both the runner’s acceleration and the flow rate’s decreasing will make the runner to lose motivation and become runaway. There may also be some differences in the characteristics of pressure pulsation and force (including motive force and drag force), which need to be further studied and explored in future research.

7. Conclusions

Based on this research on pump-turbines for hydropower and ocean power, the conclusions of this study can be drawn as the following three points:
(1)
Under the runaway condition, there is a certain regularity in the strength of pressure pulsation inside the unit, which is clearly reflected through the pressure pulsation amplitude at a 97% confidence level. Firstly, the area between the runner and guide vane is the strongest. Secondly, the area between the guide vane and the stay vane is the second strongest, only lower than in the area between the runner and the guide vane. The amplitude of pressure pulsation in the draft tube increases with the distance away from the runner. It can be seen that the runner is the cause of strong pressure pulsation.
(2)
Within the guide vane opening angle range of 1 to 28 degrees, as the guide vane opening increases, the pressure pulsation mainly shows an upward trend, but there are also local pulsations and peaks. When the opening of the guide vane is small, the pressure pulsation caused by runaway is less than 5% even in the area between the runner and the guide vanes. When the opening of the guide vane increases to 12 degrees, a local peak appears, and the amplitude of pressure pulsation can reach 40~50%. When the opening of the guide vane is at 28 degrees, the pressure pulsation is very intense, with an amplitude of nearly 70%, making operation very dangerous.
(3)
From the streamlined distribution, it can be seen that the cause of pressure pulsation may be related to the uneven distribution of vortexes. Especially the uneven distribution of vortexes inside the runner can lead to local peaks in pressure pulsation. From the vortex identification method based on the Q-criterion, it can be seen that pressure pulsation is related to the uniformity of vortex distribution at the inlet circumference of the runner. The pulsating flow field leads to the dissipation of flow energy, causing changes between mechanical energy and internal energy.
In general, the results of this study can provide a scientific reference for the investigation of accident causes and stability improvement of pump-turbines under runaway conditions.

Author Contributions

Conceptualization, D.Z. and W.Y.; methodology, R.T.; software, R.T.; validation, D.Z., W.Y. and W.G.; formal analysis, W.G.; investigation, D.Z.; resources, Z.W.; data curation, W.G.; writing—original draft preparation, D.Z.; writing—review and editing, W.Y.; visualization, R.T.; supervision, Z.W.; project administration, Z.W.; funding acquisition, R.T. All authors have read and agreed to the published version of the manuscript.

Funding

This research was funded by the Open Research Fund Program of State Key Laboratory of Hydroscience and Engineering (No. sklhse- 2022-E-01).

Data Availability Statement

The data presented in this study are available on request from the corresponding author.

Acknowledgments

We acknowledge the Open Research Fund Program of State Key Laboratory of Hydroscience and Engineering (No. sklhse- 2022-E-01). We also acknowledge the technical support of Ruofu Xiao and Yongyao Luo.

Conflicts of Interest

The authors declare no conflict of interest.

References

  1. Vagnoni, E.; Andolfatto, L.; Guillaume, R. Interaction of a rotating two-phase flow with the pressure and torque stability of a reversible pump-turbine operating in condenser mode. Int. J. Multiph. Flow 2018, 111, 112–121. [Google Scholar] [CrossRef]
  2. Tao, R.; Song, X.; Ye, C. Pumped storage technology, reversible pump turbines and their importance in power grids. Water 2022, 14, 3569. [Google Scholar] [CrossRef]
  3. Hu, W.; Wang, Z.; Fan, H. Grid synchronization of variable speed pump-turbine units in turbine mode. Renew. Energy 2021, 173, 625–638. [Google Scholar]
  4. Bidgoli, M.A.; Yang, W.; Ahmadian, A. DFIM versus synchronous machine for variable speed pumped storage hydropower plants: A comparative evaluation of technical performance. Renew. Energy 2020, 159, 72–86. [Google Scholar] [CrossRef]
  5. Wang, C.; Wang, D.; Zhang, J. Experimental study on isolated operation of hydro-turbine governing system of Lunzua hydropower station in Zambia. Renew. Energy 2021, 180, 1237–1247. [Google Scholar] [CrossRef]
  6. Trivedi, C.; Cervantes, M.J.; Gandhi, B.K. Transient pressure measurements on a high head model Francis turbine during emergency shutdown, total load rejection, and runaway. J. Fluids Eng. 2014, 136, 121107. [Google Scholar] [CrossRef]
  7. Sun, L.; Guo, P.; Yan, J. Transient analysis of load rejection for a high-head Francis turbine based on structured overset mesh. Renew. Energy 2021, 171, 658–671. [Google Scholar] [CrossRef]
  8. Betz, A. Introduction to the Theory of Flow Machines; Pergamon Press: Oxford, UK, 1966. [Google Scholar]
  9. Peng, J.; Zhang, J.; Cui, X. On-the-spot Research on load-rejection transient of the Francis turbine installation in the Shiban hydropower plant. J. China Agric. Univ. 2002, 4, 48–53. [Google Scholar]
  10. Wen, F.; You, J.; Chen, H. Influence of ball valve closing on runaway process of pump-turbine based on CFD. Water Resour. Power 2018, 36, 170–174. [Google Scholar]
  11. Nicolet, C.; Alligne, S.; Kawkabani, B. Stability study of Francis pump-turbine at runaway. In Proceedings of the 3rd IAHR International Meeting of the Workshop on Cavitation and Dynamic Problems in Hydraulic Machinery and Systems, Brno, Czech Republic, 14–16 October 2009. [Google Scholar]
  12. Chen, Z.; Jiang, Z.; Chen, S.; Zhang, W.; Zhu, B. Experimental and numerical study on flow instability of pump-turbine under runaway conditions. Renew. Energy 2023, 210, 335–345. [Google Scholar] [CrossRef]
  13. Fu, X.; Li, D.; Wang, H. Influence of the clearance flow on the load rejection process in a pump-turbine. Renew. Energy 2018, 127, 310–321. [Google Scholar] [CrossRef]
  14. Bi, H.; Chen, F.; Wang, C. Analysis of dynamic performance in a pump-turbine during the successive load rejection. IOP Conf. Ser. Earth Environ. Sci. 2021, 774, 012152. [Google Scholar] [CrossRef]
  15. Wang, H.; Qin, D.; Wei, X. Hydraulic research and development of splitter runner of Francis pump turbine in HEC. Hydropower Pumped Storage 2016, 2, 38–43. [Google Scholar]
  16. Tao, R.; Zhou, X.; Xu, B. Numerical investigation of the flow regime and cavitation in the vanes of reversible pump-turbine during pump mode’s starting up. Renew. Energy 2019, 141, 9–19. [Google Scholar] [CrossRef]
  17. Fu, X.; Li, D.; Wang, H. Hydraulic fluctuations during the pump power-off runaway transient process of a pump turbine with consideration of cavitation effects. J. Hydrodyn. 2021, 33, 1162–1175. [Google Scholar] [CrossRef]
  18. Rezghi, A.; Riasi, A. Sensitivity analysis of transient flow of two parallel pump-turbines operating at runaway. Renew. Energy 2016, 86, 611–622. [Google Scholar] [CrossRef]
  19. Zhang, F.; Fang, M.; Pan, J. Guide vane profile optimization of pump-turbine for grid connection performance improvement. Energy 2023, 274, 127369. [Google Scholar] [CrossRef]
  20. Nicolet, C.; Alligne, S.; Kawkabani, B. Unstable operation of Francis pump-turbine at runaway: Rigid and elastic water column oscillation modes. In Proceedings of the IAHR 24th Symposium on Hydraulic Machinery and Systems, Foz do Iguassu, Brazil, 27–31 October 2008. [Google Scholar]
  21. Zeng, W.; Yang, J.; Guo, W. Runaway instability of pump-turbines in S-shaped regions considering water compressibility. J. Fluids Eng. 2015, 137, 051401. [Google Scholar] [CrossRef]
  22. Cavazzini, G.; Covi, A.; Pavesi, G. Analysis of the unstable behavior of a pump-turbine in turbine mode: Fluid-dynamical and spectral characterization of the S-shape characteristic. J. Fluids Eng. 2016, 138, 021105. [Google Scholar] [CrossRef]
  23. Zhang, F.; Xiao, R.; Zhu, D. Pressure pulsation reduction in the draft tube of pump turbine in turbine mode based on optimization design of runner blade trailing edge profile. J. Energy Storage 2023, 59, 106541. [Google Scholar] [CrossRef]
  24. Menter, F.; Kuntz, M.; Langtry, R. Ten years of industrial experience with the SST turbulence model. Turbul. Heat Mass Transf. 2003, 4, 625–632. [Google Scholar]
  25. Mos, D.C.; Muntean, S.; Bosoic, A.I.; Tanasa, C.; Susan-Resiga, R. Experimental investigation of the unsteady pressure field in decelerated swirling flow with 74° sharp heel elbow. J. Phys. Conf. Ser. 2017, 813, 012046. [Google Scholar] [CrossRef]
  26. Spence, R.; Amaral-Teixeira, J. Investigation into pressure pulsations in a centrifugal pump using numerical methods supported by industrial tests. Comput. Fluids 2008, 37, 690–704. [Google Scholar] [CrossRef]
  27. Bosoic, A.I.; Tanasa, C. Experimental study of swirling flow from conical diffusers using the water jet control method. Renew. Energy 2020, 152, 385–398. [Google Scholar] [CrossRef]
  28. Zhan, J.; Li, Y.; Wai, W.O. Comparison between the Q criterion and Rortex in the application of an in-stream structure. Phys. Fluids 2019, 31, 121701. [Google Scholar]
  29. Herwig, H.; Kock, F. Direct and indirect methods of calculating entropy generation rates in turbulent convective heat transfer problems. Heat Mass Transf. 2007, 43, 207–215. [Google Scholar] [CrossRef]
  30. Tao, R.; Wang, Z. Comparative numerical studies for the flow energy dissipation features in a pump-turbine in pump mode and turbine mode. J. Energy Storage 2021, 41, 102835. [Google Scholar] [CrossRef]
  31. Zhu, D.; Tao, R.; Xiao, R. Large eddy simulation of the flow energy dissipation in the blade channels of a stalled pump impeller. J. Power Energy 2022, 236, 1227–1235. [Google Scholar] [CrossRef]
  32. Yan, W.; Zhu, D.; Tao, R.; Wang, Z. Analysis of the flow energy loss and Q-H stability in reversible pump turbine as pump with different guide vane opening angles. Water 2022, 14, 2526. [Google Scholar] [CrossRef]
Figure 2. Runaway points measured in model test.
Jmse 11 01218 g002
Figure 3. Positions of pressure pulsation measurement points.
Jmse 11 01218 g003
Figure 4. Flow domain used in CFD simulation.
Jmse 11 01218 g004
Figure 5. Mesh check for CFD simulation.
Jmse 11 01218 g005
Figure 6. Pressure pulsation amplitude at different points.
Jmse 11 01218 g006
Figure 7. Reference plotting positions set in pump-turbine.
Jmse 11 01218 g007
Figure 8. Comparison of pressure pulsation amplitude between experimental values and CFD values.
Jmse 11 01218 g008
Figure 9. Streamlines in pump-turbine.
Jmse 11 01218 g009aJmse 11 01218 g009b
Figure 10. Vortex identification based on Q-criterion in pump-turbine.
Jmse 11 01218 g010aJmse 11 01218 g010b
Figure 11. Flow energy dissipation in pump-turbine.
Jmse 11 01218 g011aJmse 11 01218 g011b
Figure 12. Comparison of the process of the runner from normal operation to runaway.
Jmse 11 01218 g012
Table 1. Details of the runaway points.
Condition No.α [Degrees]n11Q11Shaft Torque [N·m]
C01135.5980.052−0.85
C02240.5260.074−0.37
C03342.8490.091−0.52
C04444.7240.1070.20
C05546.1440.120−0.77
C06647.0630.134−0.55
C07747.8190.146−0.54
C08848.4470.157−0.79
C09948.9710.170−0.15
C101049.4830.181−0.65
C111250.4090.206−0.32
C121451.2080.231−0.40
C131652.0720.256−0.83
C141852.8220.283−0.00
C152053.5610.3100.00
C162254.2670.337−0.37
C172454.9110.3680.00
C182655.4810.395−0.32
C192855.940.421−0.32
Disclaimer/Publisher’s Note: The statements, opinions and data contained in all publications are solely those of the individual author(s) and contributor(s) and not of MDPI and/or the editor(s). MDPI and/or the editor(s) disclaim responsibility for any injury to people or property resulting from any ideas, methods, instructions or products referred to in the content.

