Article

Experimental Study of Mechanical Properties and Fracture Characteristics of Conglomerates Based on Mohr–Coulomb Criteria

1
State Key Laboratory of Petroleum Resources and Prospecting, China University of Petroleum (Beijing), Beijing 102249, China
2
The Unconventional Oil and Gas Institute, China University of Petroleum (Beijing), Beijing 102249, China
3
College of Marine Science and Technology, China University of Geosciences, Wuhan 430074, China
*
Author to whom correspondence should be addressed.
J. Mar. Sci. Eng. 2023, 11(6), 1219; https://doi.org/10.3390/jmse11061219
Submission received: 8 May 2023 / Revised: 2 June 2023 / Accepted: 8 June 2023 / Published: 13 June 2023
(This article belongs to the Special Issue High-Efficient Exploration and Development of Oil & Gas from Ocean)

Abstract

:
Gravel is one of the main factors affecting the mechanical properties of conglomerates, which plays a decisive role in crack propagation. In this paper, taking the conglomerate of the Baikouquan Formation in Mahu Sag of Xinjiang as the research object, a three-dimensional model of the conglomerate is constructed by the discrete element numerical simulation method, and the triaxial compression experiment under different confining pressures is simulated. The mechanical properties and fracture morphology of conglomerate are analyzed with gravel content as a variable and verified by laboratory tests. In this simulation, with the increase of gravel content, the compressive strength of the conglomerate decreases, angle of internal friction decreases, and the fractures show different forms. The results show that the gravel morphology, spatial location, and gravel content have an impact on the mechanical properties of the conglomerate. The gravel content affects the formation process of the dominant fracture surface by controlling the distance between gravels so as to control the internal friction angle and it is the main controlling factor for the mechanical properties of the conglomerate. Gravel cracks initiate at the edge of gravel. Stress controls the formation of main cracks under low gravel content, and the influence of gravels under high gravel content makes cracks more discrete and complex.

1. Introduction

Increasing attention is being paid to the exploitation of unconventional reservoirs, including mainly shale, dense sandstone, and conglomerate reservoirs [1]. Fractures in conglomerates differ markedly from shale fractures in morphology and genesis [2]. The conglomerate reservoirs of the Triassic Baikouquan Formation and Permian Wuerhe Formation are mainly put into development in Mahu Oilfield, Junggar Basin, and Xinjiang [2,3]. The conglomerate reservoirs are characterized by complex lithology, lateral variation blocks, strong heterogeneity, large particle size differences between different lithologies, and obvious differences in mechanical properties due to their fan delta sedimentary environment. Therefore, it is difficult to clarify the mechanical properties of conglomerate reservoirs [4,5,6,7,8].
Acoustic experiments, mechanical experiments, and numerical simulation experiments are currently the main methods used to study the mechanical properties and fracture characteristics of the Mahu aggregate reservoir. The uniaxial compression test results show that the conglomerate has significant brittle failure characteristics, and the failure mode is mainly splitting failure. The compressive strength decreases with the increase in gravel content [9,10,11,12]. The indentation hardness test shows that with the increase of gravel particle size, the compressive strength of the conglomerate increases and the elastic modulus decreases logarithmically, and the heterogeneity also increases. Gravel has an effect on the fracture toughness and acoustic characteristics of conglomerates. Under high gravel content, the fracture is complex and bifurcated, the bending degree is high [13], the ultrasonic waveform is seriously disturbed, and the wave velocity increases with the increase in gravel content or gravel size [14,15].
Through the analysis of the fracture morphology of conglomerates, it is concluded that the fracture propagation mode of conglomerate mainly includes the types of crossing gravel, bypassing gravel, embedding, stopping gravel, and being attracted to gravel, mainly expanding around gravel [16,17,18]. Fracturing fracture morphology is affected by both stress state and gravel characteristics, and cementation surface strength is the dominant factor for the diversion and extension of hydraulic fractures [19,20,21]. Under the low principal stress difference, the hydraulic fracture is more likely to deflect. With the increase in gravel content, the tortuosity of the fracture also increases. The high-strength gravel can inhibit the fracture from penetrating the gravel and strengthen the overall tensile strength of the conglomerate, which may lead to high fracture pressure. At the same time, the size and arrangement of gravel also affects the expansion of hydraulic fractures. When the size of the gravel is larger, the shielding ability of the fracture is stronger. In the case of a disorderly arrangement of gravel, the fracture deflection is more obvious, and the fracture shape is more complicated [22,23,24,25,26].
The current research shows that the mechanical properties of conglomerates are affected by factors such as gravel particle size, gravel content, cementation between gravel and cement, and the support mode of the conglomerate [27,28]. However, the influence of specific gravel shape and spatial position has not been studied. The specific influence mechanism of gravel content is not clear, and the crack propagation process is not clear. In this paper, based on PFC discrete element numerical simulation software, a three-dimensional mechanical model of conglomerate suitable for the study area is established by correcting the actual mechanical results for the conglomerate of Baikouquan Formation in Mahu Sag, Junggar Basin, Xinjiang. The uniaxial compression test simulation and triaxial compression simulation under different confining pressures are carried out to study the influencing factors and mechanisms of conglomerate mechanical properties and fracture propagation processes, which provide support for reasonable transformation and development countermeasures under different reservoir characteristics.

2. Experimental Methods and Numerical Models

2.1. Triaxial Compression Experiments Based on Moorcullen’s Criterion

The study area is the conglomerate reservoir of the Baikouquan Formation in the Mahu Depression of the Junggar Basin, Xinjiang. The target reservoir was used as a specimen to analyze the conglomerate properties, and Figure 1a,b shows that the conglomerate specimens have diverse compositions, interspersed distribution of conglomerates and miscellaneous bases, uneven distribution of conglomerate grain size, and complex compositions. Digitization of the specimens can yield parameters such as conglomerate content, conglomerate grain size distribution, and conglomerate roundness. The stress-strain curves shown in Figure 1c can be obtained by uniaxial and triaxial compression experiments on the specimen conglomerate specimens, and the mechanical parameters such as compressive strength, elastic modulus, and Poisson’s ratio can be obtained by analyzing and processing the stress-strain curves.
The Moorcullen criterion can explain the mechanical behavior of a rock during compression. According to the Moorcullen strength criterion, a rock is damaged when it is in a state of ultimate stress, i.e., when the shear stress on one side exceeds the ultimate shear stress it can withstand. When the two principal stresses σ1 and σ3 acting at a point in the rock are known, the positive stress σ and the shear stress τ in any plane can be derived from Equation (1). In the plane right-angle coordinate system, the curve of Equation (1) as shown in Figure 1d is a circle, i.e., the Mohr stress circle. A series of Mohr stress circles can be plotted by performing the strength curves of the rock under different stress states as shown in Figure 1e, and the line tangent to these Mohr stress circles is the damage envelope, whose expression is expressed by Equation (2). According to the damaged envelope, parameters such as cohesion C and internal friction angle φ of different conglomerates can be obtained, through which the mechanical properties of conglomerates can be analyzed.
( σ σ 1 + σ 3 2 ) 2 + τ 2 = σ 1 + σ 3 2 2
τ = C + σ tan φ
where σ is the normal stress, MPa. τ is the shear stress, MPa. σ1 and σ3 are principal stress, MPa. C is cohesion, MPa. φ is the internal friction angle, °.
By the Moorcullen criterion in rock mechanics to know the microscopic rupture conditions for the interface of the shear stress to reach the shear strength of damage, and in the plane of the normal and main stress σ1 tilt β angle, the normal stress and shear stress as shown in Equations (3) and (4), combined with Equation (2) and the introduction of the Moorcullen rupture criterion to obtain the damage criterion Equation (5), Equation (5) in the plane of the main stress of σ1 and σ3 is a straight line, then the uniaxial compressive strength σc as shown in Equation (6), that is, in the case of the same cohesion uniaxial compressive strength is proportional to the rupture interface dynamic friction coefficient μ.
σ = σ 1 + σ 3 2 + σ 1 σ 3 2 cos 2 β
τ = σ 1 σ 3 2 sin 2 β
σ 1 μ 2 + 1 μ σ 3 μ 2 + 1 + μ = 2 C
σ c = 2 C μ 2 + 1 + μ
β = π 2 1 2 tan 1 1 μ
β = π 4 + 1 2 φ
where β is the failure angle, °. μ is the dynamic friction coefficient. σ c is the uniaxial compressive strength, MPa.

2.2. Linear Parallel Bond Model

Due to the high randomness of conglomerate specimen gravel distribution, variable shape, and uneven particle size distribution, it is not easy to quantify the mechanical properties of conglomerates, and these problems can be effectively solved by means of numerical simulations. The numerical particle flow simulation software PFC is able to characterize the mechanical properties of rocks under the microscopic action of particles and has better results for the simulation of conglomerates, which are multicomponent rocks [29,30,31].
In the numerical particle flow simulation program, the macroscopic mechanical properties of the model are controlled by the microscopic contact properties. The linear parallel bonding model provides the mechanical behavior of two interfaces, one equivalent to the linear model for infinitesimal interfaces and the other for parallel bonding. The contact force of the linear model consists of a linear force and a damping force, determined by the normal stiffness kn, the tangential stiffness ks, and the friction coefficient μ; the damping force is determined by the normal damping ratio βn, and the tangential damping ratio βs (Figure 2a), it does not resist relative rotation, and slip is accommodated by imposing a Coulomb limit on the shear force. The parallel bonding model acts in parallel with the linear model to transfer forces and moments between the contacting particles (Figure 2b). Unlike the linear model, the parallel bonding model resists the relative rotation between particles and its behavior is linear elastic until the strength limit is exceeded and the bond breaks, making it unbonded. If the parallel bonding model is activated when the surface gap of the object gs ≤ 0, the bond breaks when it exceeds the strength limit, as shown in Figure 2c,d the particles will produce translation or rotation between them, at which point the parallel bonding model is equivalent to the linear model.
The forces and displacements are established by Equation (9) for the linear model and by Equation (10) for the linear parallel bond model. In the linear model, the contact force is composed of linear force and dashpot force, and the contact moment is 0. While in the linear parallel model, parallel-bond forces are added, and the parallel-bond forces allow the model to transfer moments. In total, there are four types of energy in the linear parallel bond model: strain energy, slip energy, damping energy, and bond-building strain energy, where strain energy is stored in the linear spring (Equation (11)), slip energy is the total energy consumed by frictional slip (Equation (12)), the dot product of the slip component and the average linear shear force occurring during the timestep gives the increment of slip energy. The slip energy remains equal to zero until the bond breaks. Damping energy is the total energy consumed by the damper (Equation (13)), and strain energy, slip energy, and damping energy are stored in the linear model plane; bond strain energy is stored in the bond parallel bond spring.
F c = F l + F d , M c = 0
F c = F l + F d + F ¯ , M c = M ¯
E k = 1 2 F n l 2 k n + F n l 2 k s
E μ = E μ 1 2 F s l 0 + F s l Δ δ s μ
E β = E β F d δ Δ t
where Fc is the contact force, N. Fl is the linear force, N. Fd is the dashpot force, N. Mc is the contact moment, N·m. F ¯ is the parallel-bond force, N. M ¯ is the parallel-bond moment, N·m. Ek is the strain energy, N·m/pa. F n l is the linear normal force, N. F s l is the linear shear force, N. k n is the normal stiffness, N/m. k s is the shear stiffness, N/m. Eμ is the slip energy, N·m/pa. F s l 0 is the linear shear force at the beginning of the timestep, N. Δ δ s μ is the slip component of relative shear-displacement increment, m. Eβ is the dashpot energy, N·m/pa. δ is the relative translational velocity, m/s. Δ t is the time step, s.

2.3. 3D Numerical Model of Conglomerate

Although the mechanical properties of the conglomerate have been studied with the help of numerical simulation methods, they are only limited to the two-dimensional space state, while the distribution of conglomerates in three-dimensional space is more random and the influence on the mechanical properties of conglomerates is more complicated, so it is necessary to construct a three-dimensional numerical model of the conglomerate to study the mechanical properties of the conglomerate.
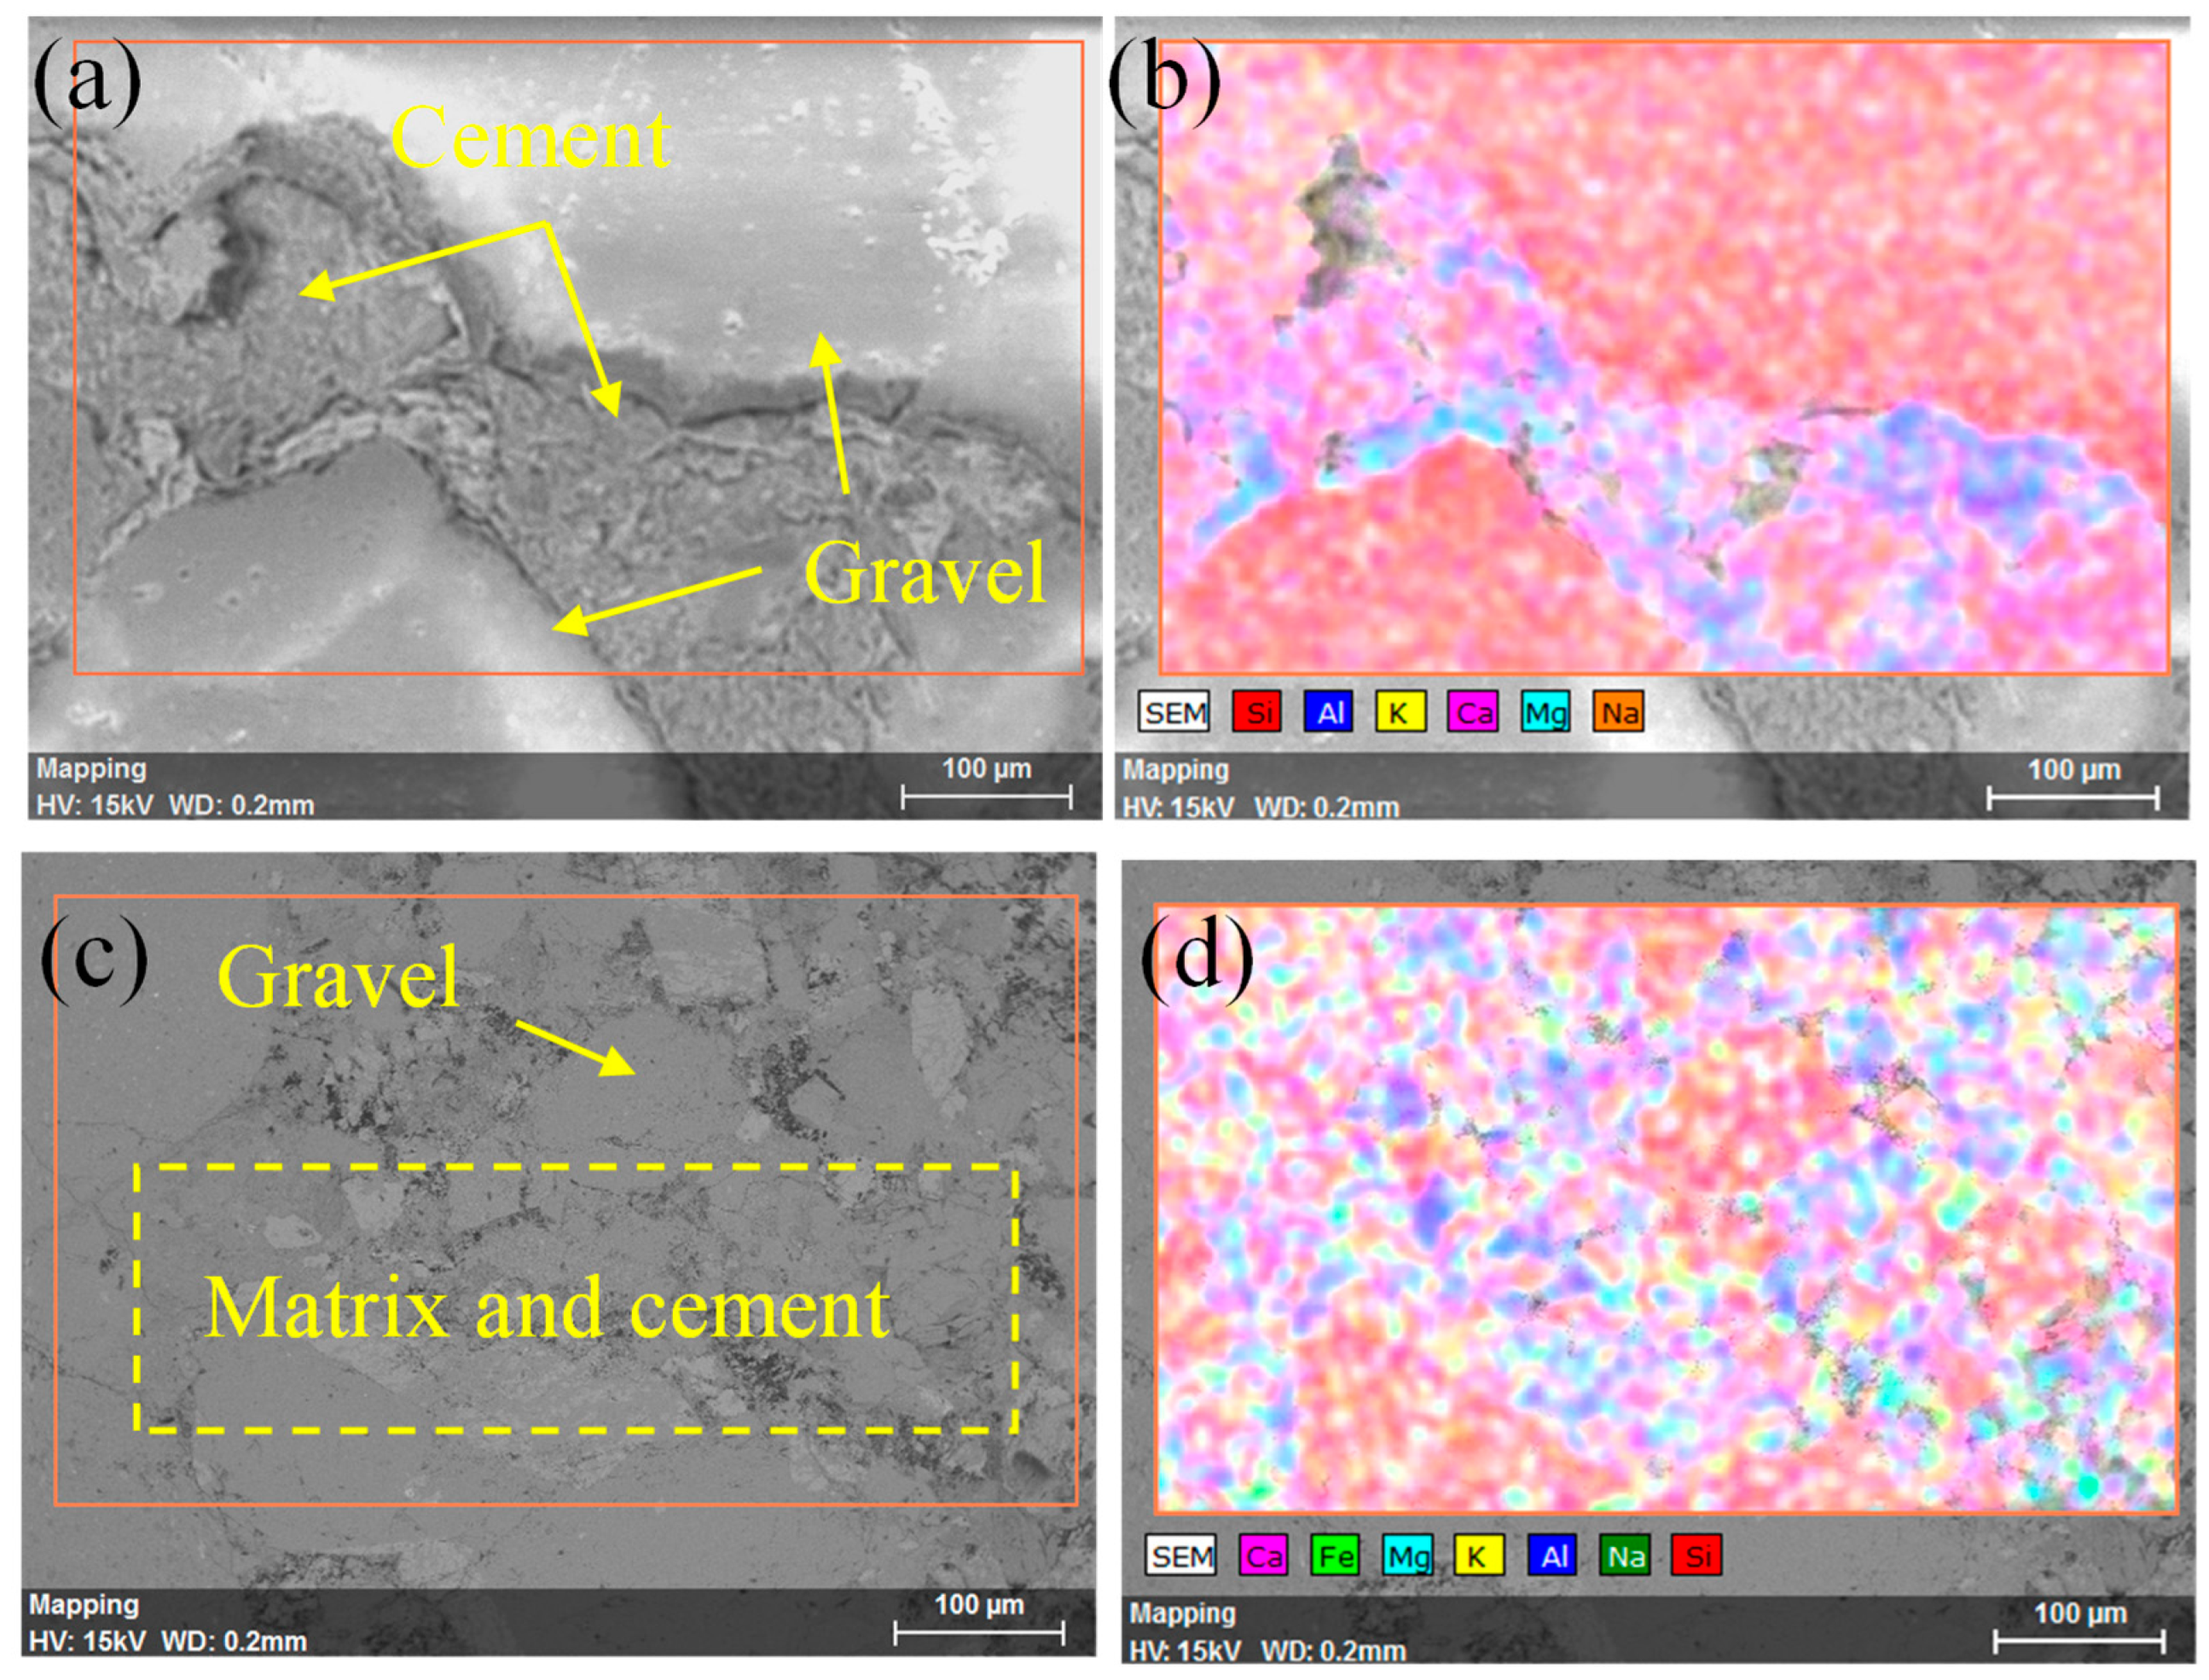
Before constructing the three-dimensional numerical simulation of the conglomerate, microstructural and elemental analyses of the conglomerate specimens were first performed by scanning electron microscopy to determine the basic compositional form of the conglomerate. The results show that the conglomerate is mainly composed of conglomerate, heterogeneous base, and cement, and different conglomerates are supported in different ways, with heterogeneous base particles supported at low conglomerate content as shown in Figure 3c, and particles supported at high conglomerate content as shown in Figure 3a. The elemental analysis of Figure 3b,d shows that the cement is mainly distributed at the edge of the gravels, with a small amount in the heterogeneous base. The elemental content of the cement is dominated by Al and Ca elements, and some K, Mg, and Na elements are present. The type of cementation is clayey cementation, and the elemental differences between the gravel and the cement are obvious, with clear boundaries. From the scanning electron microscopy results, it can be concluded that the conglomerate is a three-phase composite material composed of a conglomerate, heterogeneous base, and weak cementation surfaces distributed at the edge of the conglomerate.
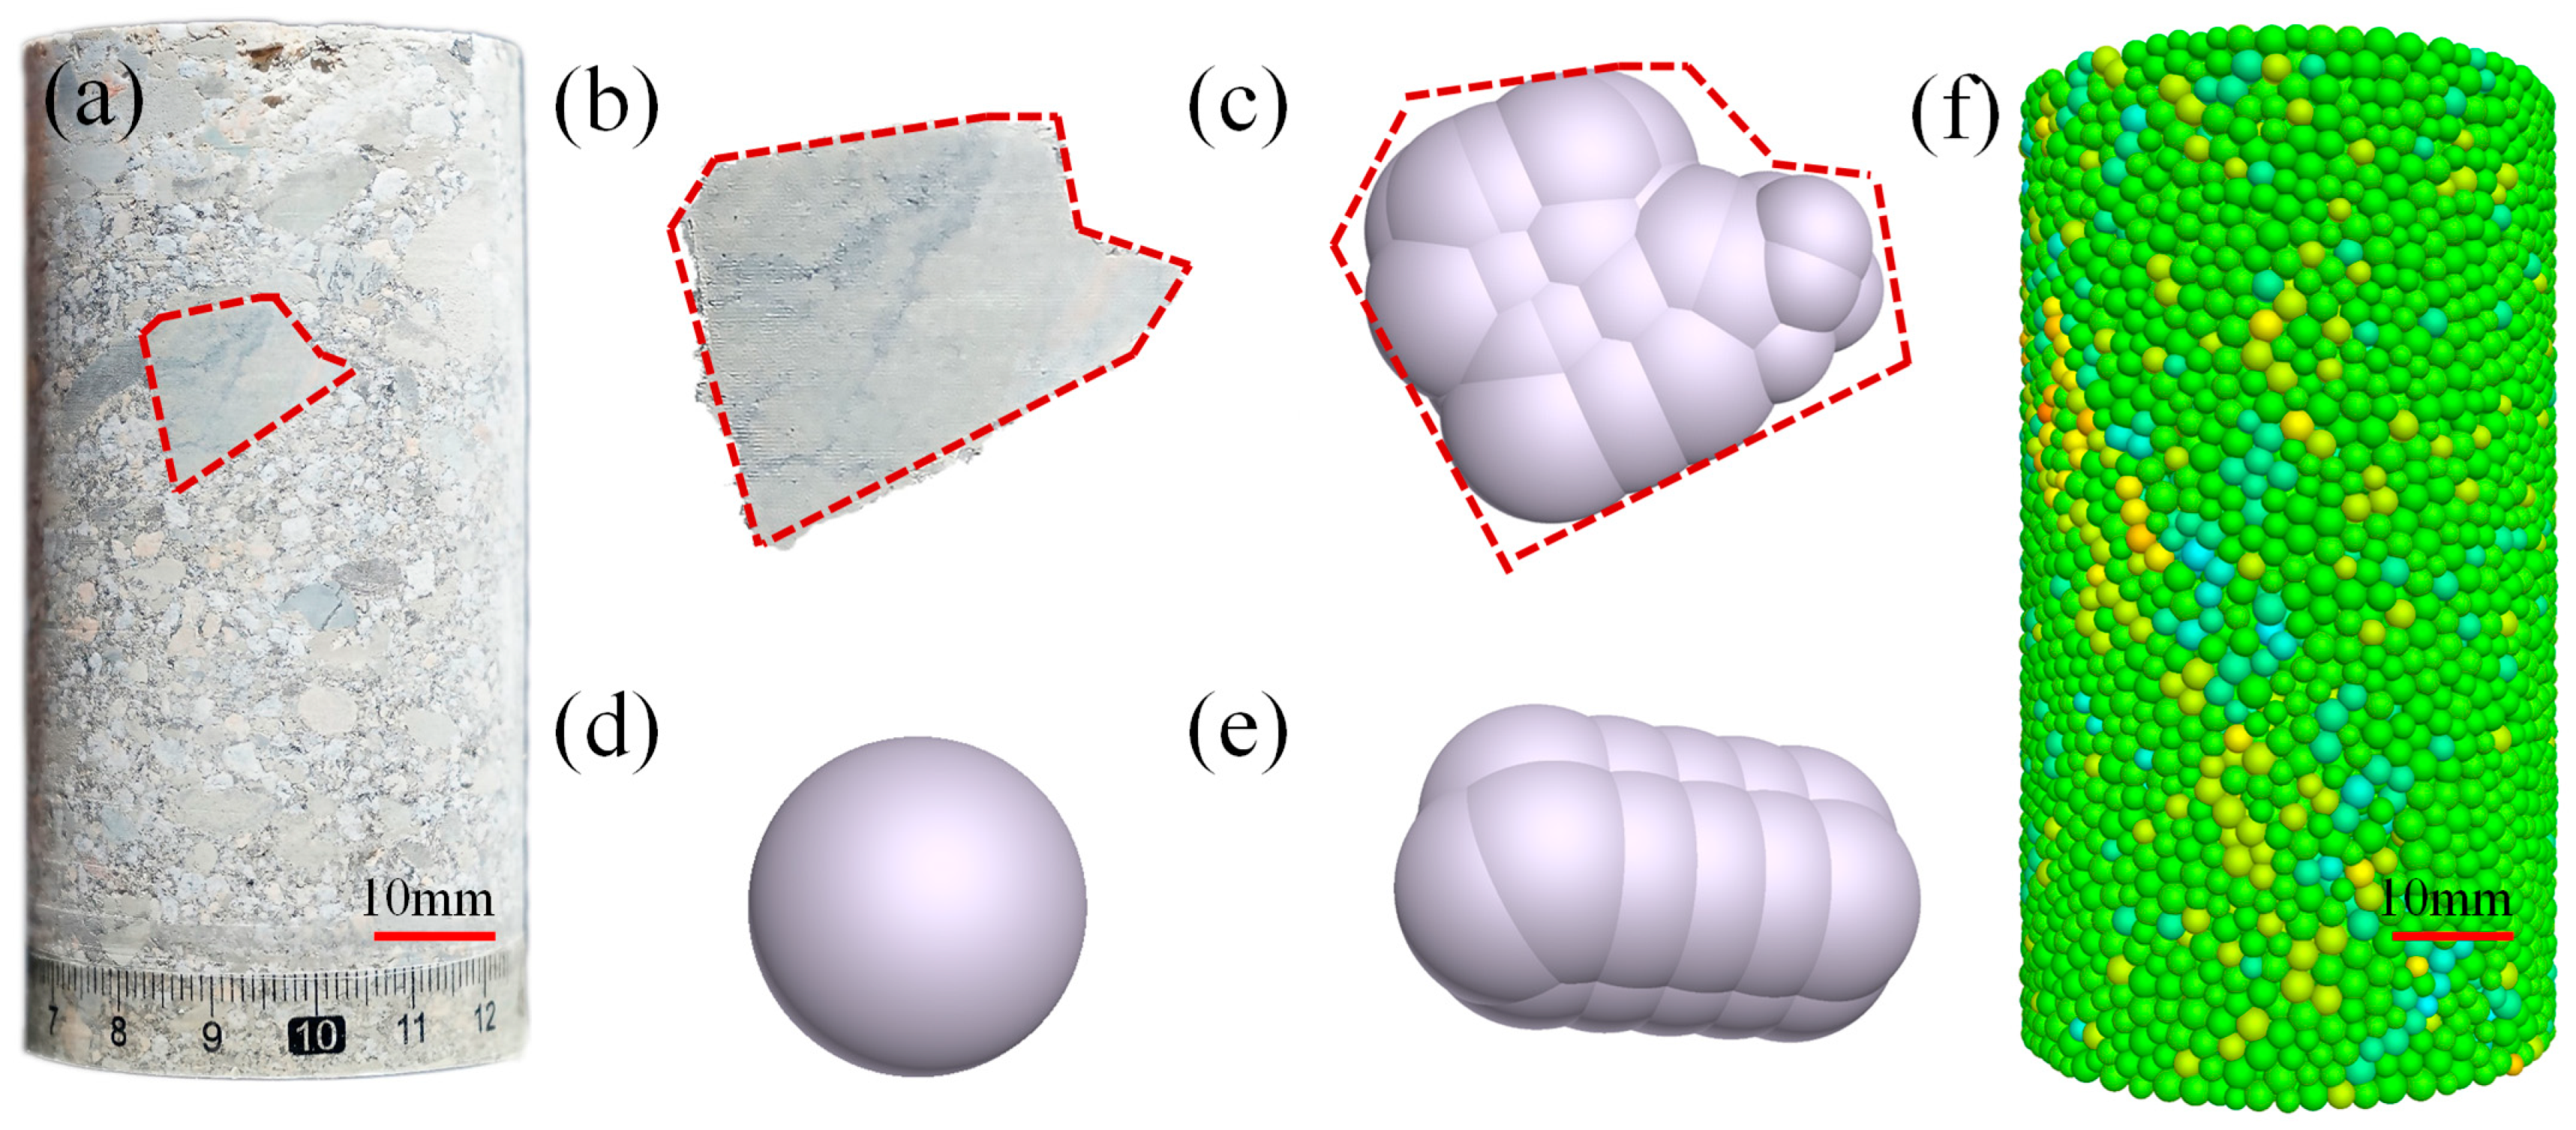
Based on the component analysis of the conglomerate specimens, the conglomerate is modeled in 3D in Figure 4 using the particle flow software PFC. A two-dimensional image of the actual conglomerate (b) was extracted from the actual specimen taken (a) and reconstructed into a cubic conglomerate (c) using small diameter particles for stacking in three dimensions according to (b). To study the effect of different shapes of gravels on the mechanical properties of conglomerates, spherical conglomerate (d) and chain conglomerate (e) were constructed, and finally a conglomerate 3D model (f) with a diameter of 50 mm and a height of 100 mm was generated. The conglomerate model (f) simulates the gravel by particle clusters, the generated spheres simulate the matrix, the contact between gravel and gravel, matrix and matrix is simulated by a linear model, and the cementation surface between gravel and matrix is simulated by a linear parallel bonding model. Using gravel content and morphology as variables, the study generated conglomerate models with different gravel contents. The following issues were considered in the construction of the conglomerate model: (1) the particle clump diameter of the simulated conglomerate is 5 times that of the matrix spheres, considering the size effect and computational efficiency; (2) the sphere accumulation in the restricted space cannot fill the whole space, and it is known that the density of sphere accumulation in the cylinder is related to the space extent, sphere diameter, sphere gradation, and arrangement according to the theory of densest accumulation [32,33,34]. The gravels were generated by controlling the number of clumps generated to quantify the gravel content; (3) to avoid local stress effects due to gravels generated at the model boundary, the clumps were generated inside the model by numerical modeling to simulate the mechanical behavior of the gravels under load. The model parameters are shown in Table 1.

3. Results

3.1. Experimental Results of Conglomerate

The gravel content of the taken conglomerate specimens was statistically analyzed, and then uniaxial compression experiments were performed to obtain the stress-strain curves shown in Figure 5a. The curves show that the elastic phase of the stress-strain curve is longer when the gravel content is 4.23%, and the conglomerate as a whole shows brittle characteristics; when the gravel content is 56.8%, the conglomerate stress-strain curve as a whole is smoother, the crack stabilization growth phase is longer, and the conglomerate as a whole shows plastic characteristics. Figure 5b shows that the compressive strength of the conglomerate decreases with increasing gravel content from 0 to 56.8%, with an overall negative correlation. The results of uniaxial compression experiments with different gravel contents show that the mechanical properties of conglomerates with different gravel contents vary greatly, and the gravel content is the main controlling factor of the mechanical properties of conglomerates.
According to the uniaxial compression test results of conglomerates, specimens with 25–30% conglomerate content were selected for triaxial compression experiments under different confining pressures, and the stress-strain curves shown in Figure 5c were obtained. The curves show that the surrounding pressure obviously changes the morphology of the stress-strain curve, and the plastic characteristics of the conglomerate are more obvious. By linearly solving the data obtained in Figure 5c, the cohesive force of the conglomerate with 25–30% gravel content is 5.39 MPa and the internal friction angle is 29.29°, and the Mohr stress circle and damage envelope, shown in Figure 5d, are made. However, it is difficult to control the gravel content of the specimens under different confining pressures, gravel arrangement, and spatial locations, which leads to some errors in the calculated results in physics experiments. Therefore, the quantitative expression of the gravel quantity and spatial location with the help of the numerical simulation method is needed to specifically study the effect of gravel content on the mechanical properties of conglomerates, which will be analyzed in Section 3.2.2.
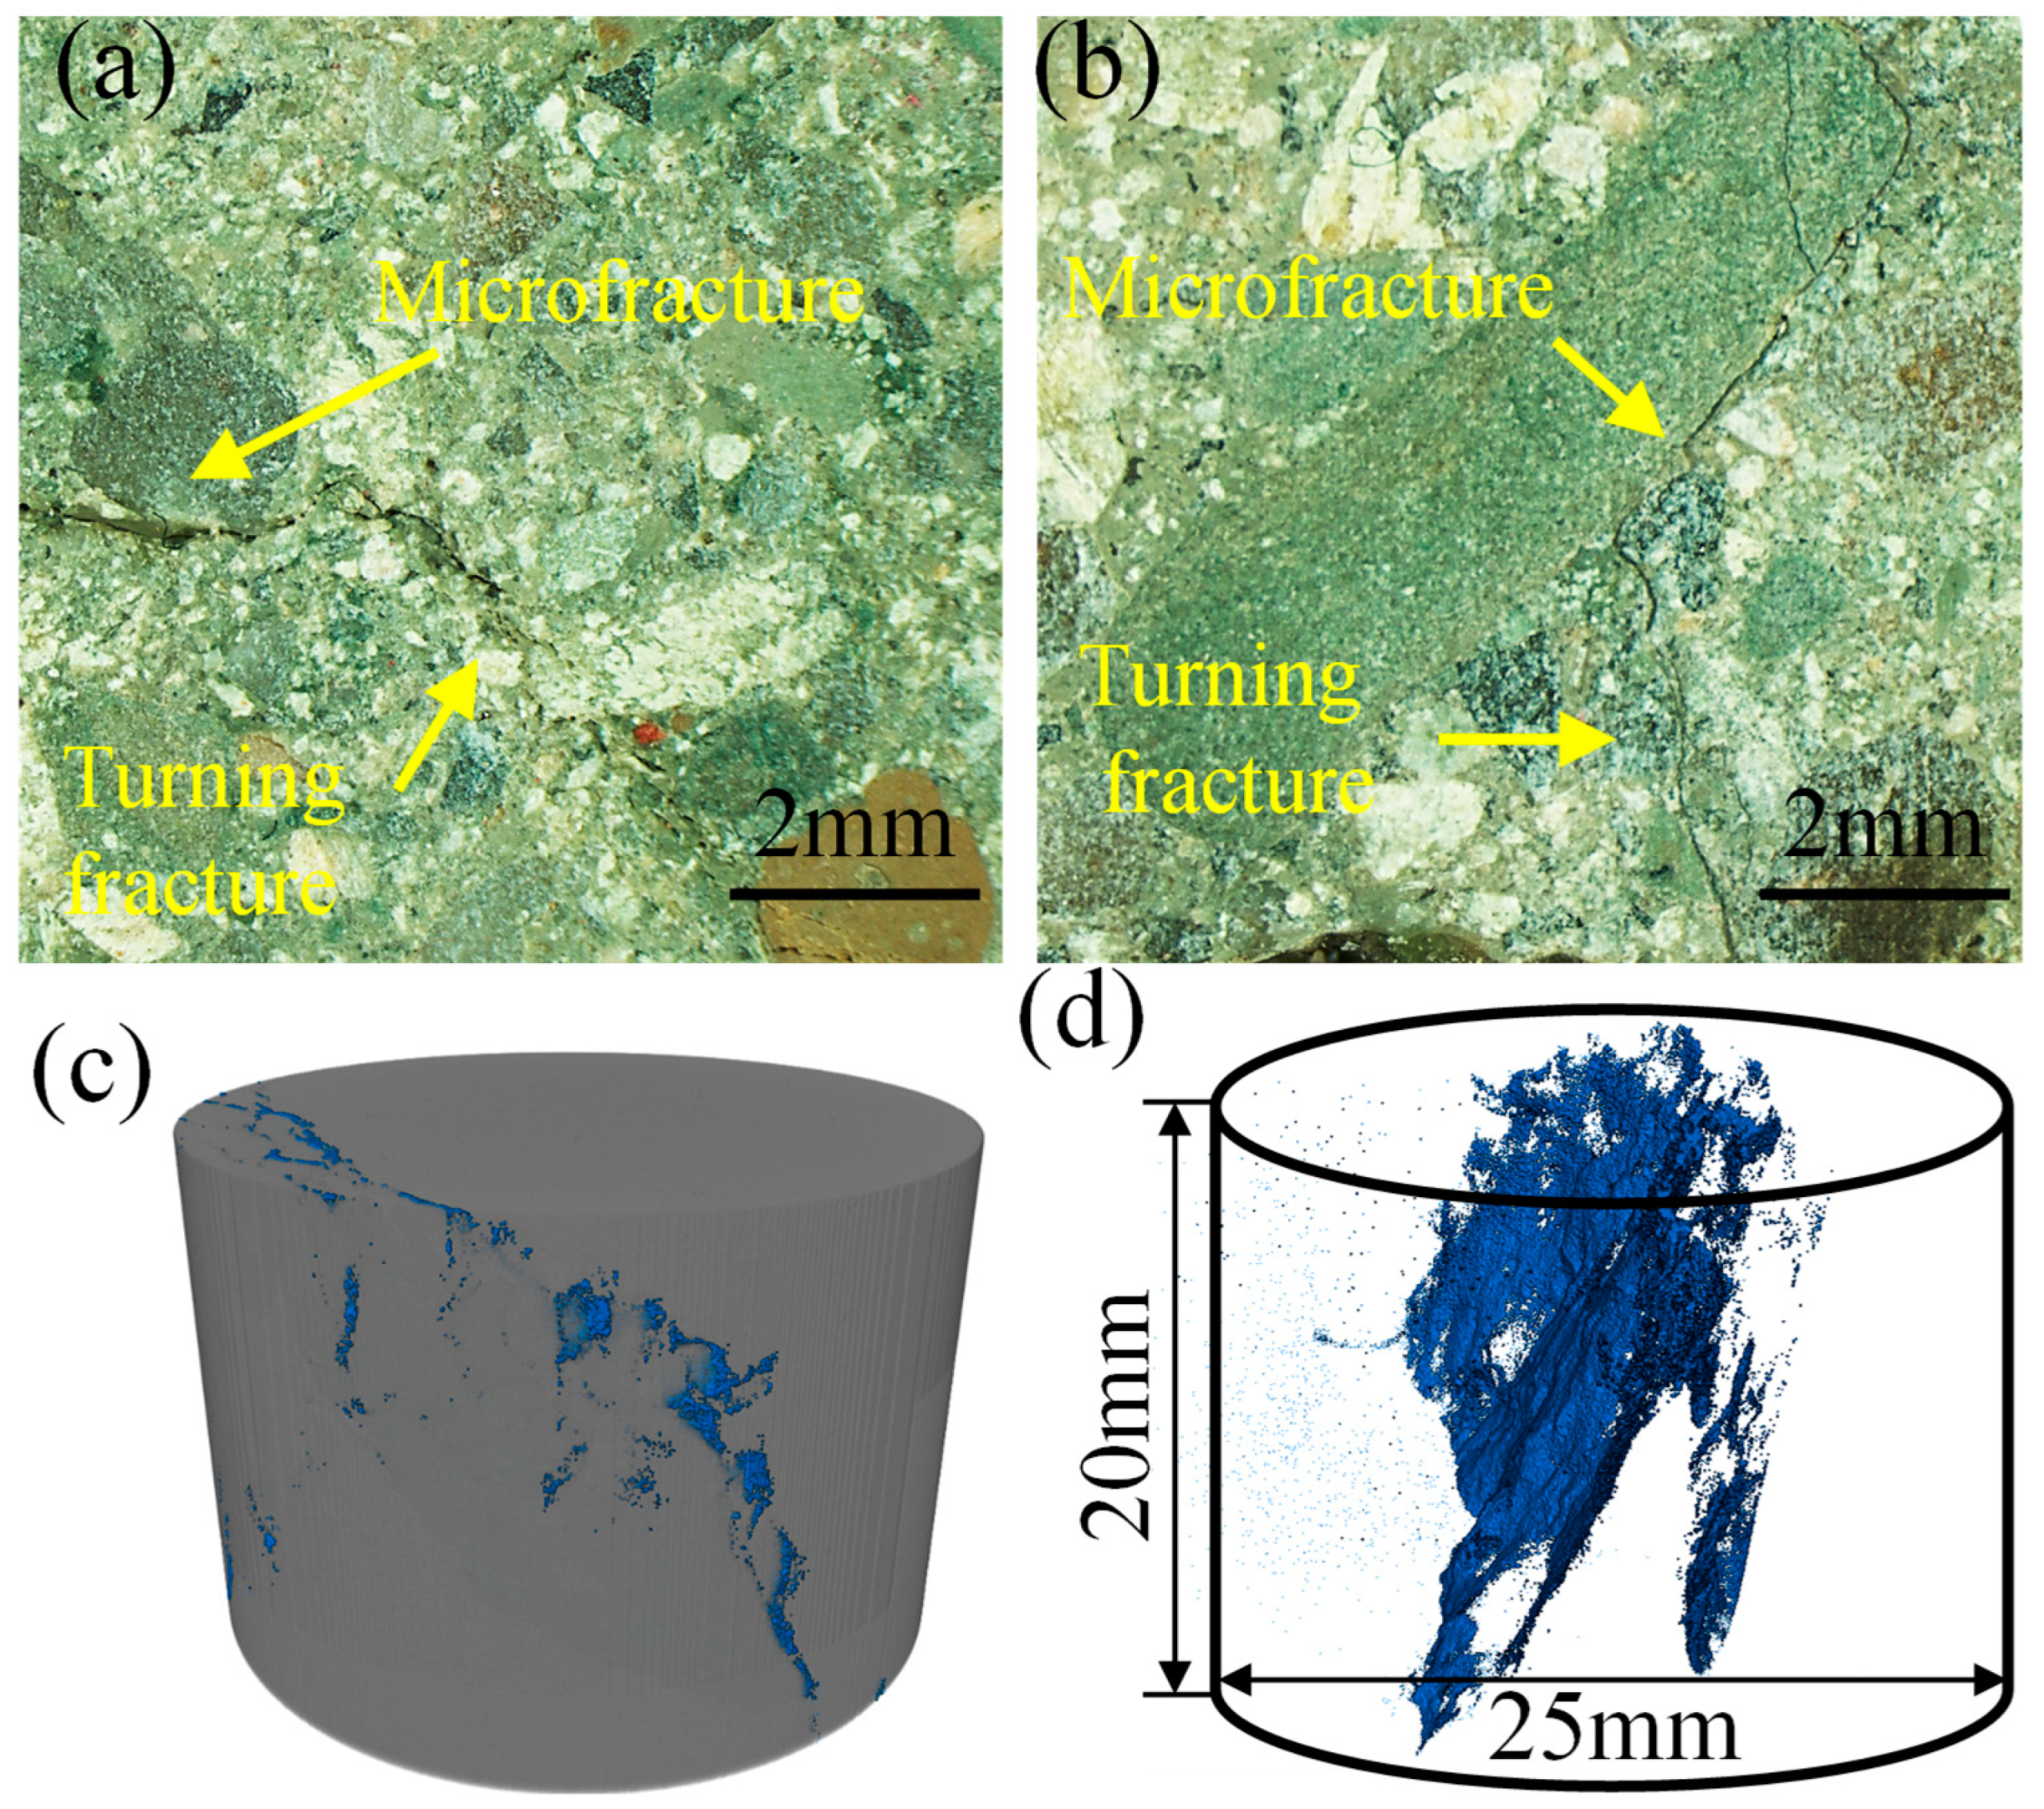
In order to analyze the fractures in the conglomerate after the above tests, the conglomerate fractures were carved by microscopy as shown in Figure 6, and reconstructed by CT scanning method. Figure 6a shows that the microfractures extend mainly at the edge of the conglomerate and in the miscellaneous base and that the fractures extending in the miscellaneous base will be affected by other conglomerates and will turn at a large turn of nearly 90°. By performing CT scans after experiments on the above gravels with 25–30% gravel content, followed by noise reduction and 3D reconstruction of the fractures, the results show that the fracture morphology of the gravels with low gravel content is an inclined main fracture. Considering the time cost, the fracture size of the 3D reconstruction is small compared to the core size, but the overall fracture morphology is similar to the reconstructed fracture morphology according to the self-similarity of fractal theory.

3.2. Numerical Simulation Results of Conglomerate

The results of physical experiments indicate that the mechanical properties of the conglomerate vary for different gravel contents, with cracks produced by compression being at the edge of the conglomerate and subject to turning by the spacing of the conglomerate. However, the gravel content of the conglomerate is difficult to standardize in physical experiments and the spatial location and shape of the conglomerate is difficult to characterize. In this section, we investigate the mechanical properties of the conglomerate in three dimensions by quantitatively characterizing the conglomerate content with the help of a three-dimensional conglomerate model established by discrete element numerical simulation methods.

3.2.1. Effect of Gravel Morphology and Spatial Location on Mechanical Behavior

To study the effect of gravel morphology on the mechanical properties of conglomerate, uniaxial compression tests were conducted on the spherical, square, and chain conglomerate models shown in Figure 4 to simulate and study the effect of conglomerate morphology on the mechanical properties of conglomerates, and the experimental results showed that the compressive strength of the spherical conglomerate model was 77.75 MPa, the compressive strength of the square conglomerate model was lower at 76.53 MPa, and the compressive strength of the chain conglomerate model was 77.8 MPa. The compressive strength of the chain gravel model is related to the angle between the model axis and the stress direction, with 77.8 MPa for the 90° model, 76.9 MPa for the 45° model, and 74.7 MPa for the 0° model. The compressive strength of the chain gravel model can be equated to a “prefabricated fracture” containing a weak cementation surface, which increases with the increase of the axis angle and stress direction.
The stress state around different conglomerate shapes is demonstrated by slicing the 3D conglomerate model as shown in Figure 7 The chain conglomerate in Figure 7a shows a significant stress concentration at the end of the long axis, making it more susceptible to destabilization and thus cracking at this point. In Figure 7b, the stress state around the block gravel is more uniform than the chain gravel, with stress concentrations at the upper and lower ends of the stress loading direction. In Figure 7c, high stresses are observed around the spherical gravels. The results indicate that the weak cementation surface around the gravel tends to produce stress concentrations in this region, but the shape of the gravel changes the area of stress concentration. In general, the stress concentrations around the less rounded gravel are more directional. Although the 3D gravel model constructed in this paper can provide a more realistic description of the force state of differently shaped gravels, however, compared with the force of the actual gravels in Figure 6, the interaction between gravels of different sizes cannot be effectively described due to the grading problem in the model. Overall, the conglomerate model in this paper is still able to effectively represent the mechanical behavior and fracture extension characteristics of the conglomerate.

3.2.2. Effect of Gravel Content on Mechanical Behavior

From the above study, it is known that the shape of the gravel produces stress concentrations and the gravel spacing affects the expansion of cracks between gravels, both of which affect the mechanical properties of the conglomerate. In practical problems, the gravel shape is mostly polygonal, and the gravel spacing problem is expressed in terms of gravel content. In this section of the study, the conglomerate mechanical properties are investigated using square-shaped conglomerate as the base conglomerate model and conglomerate uniaxial compression tests with conglomerate content as a variable.
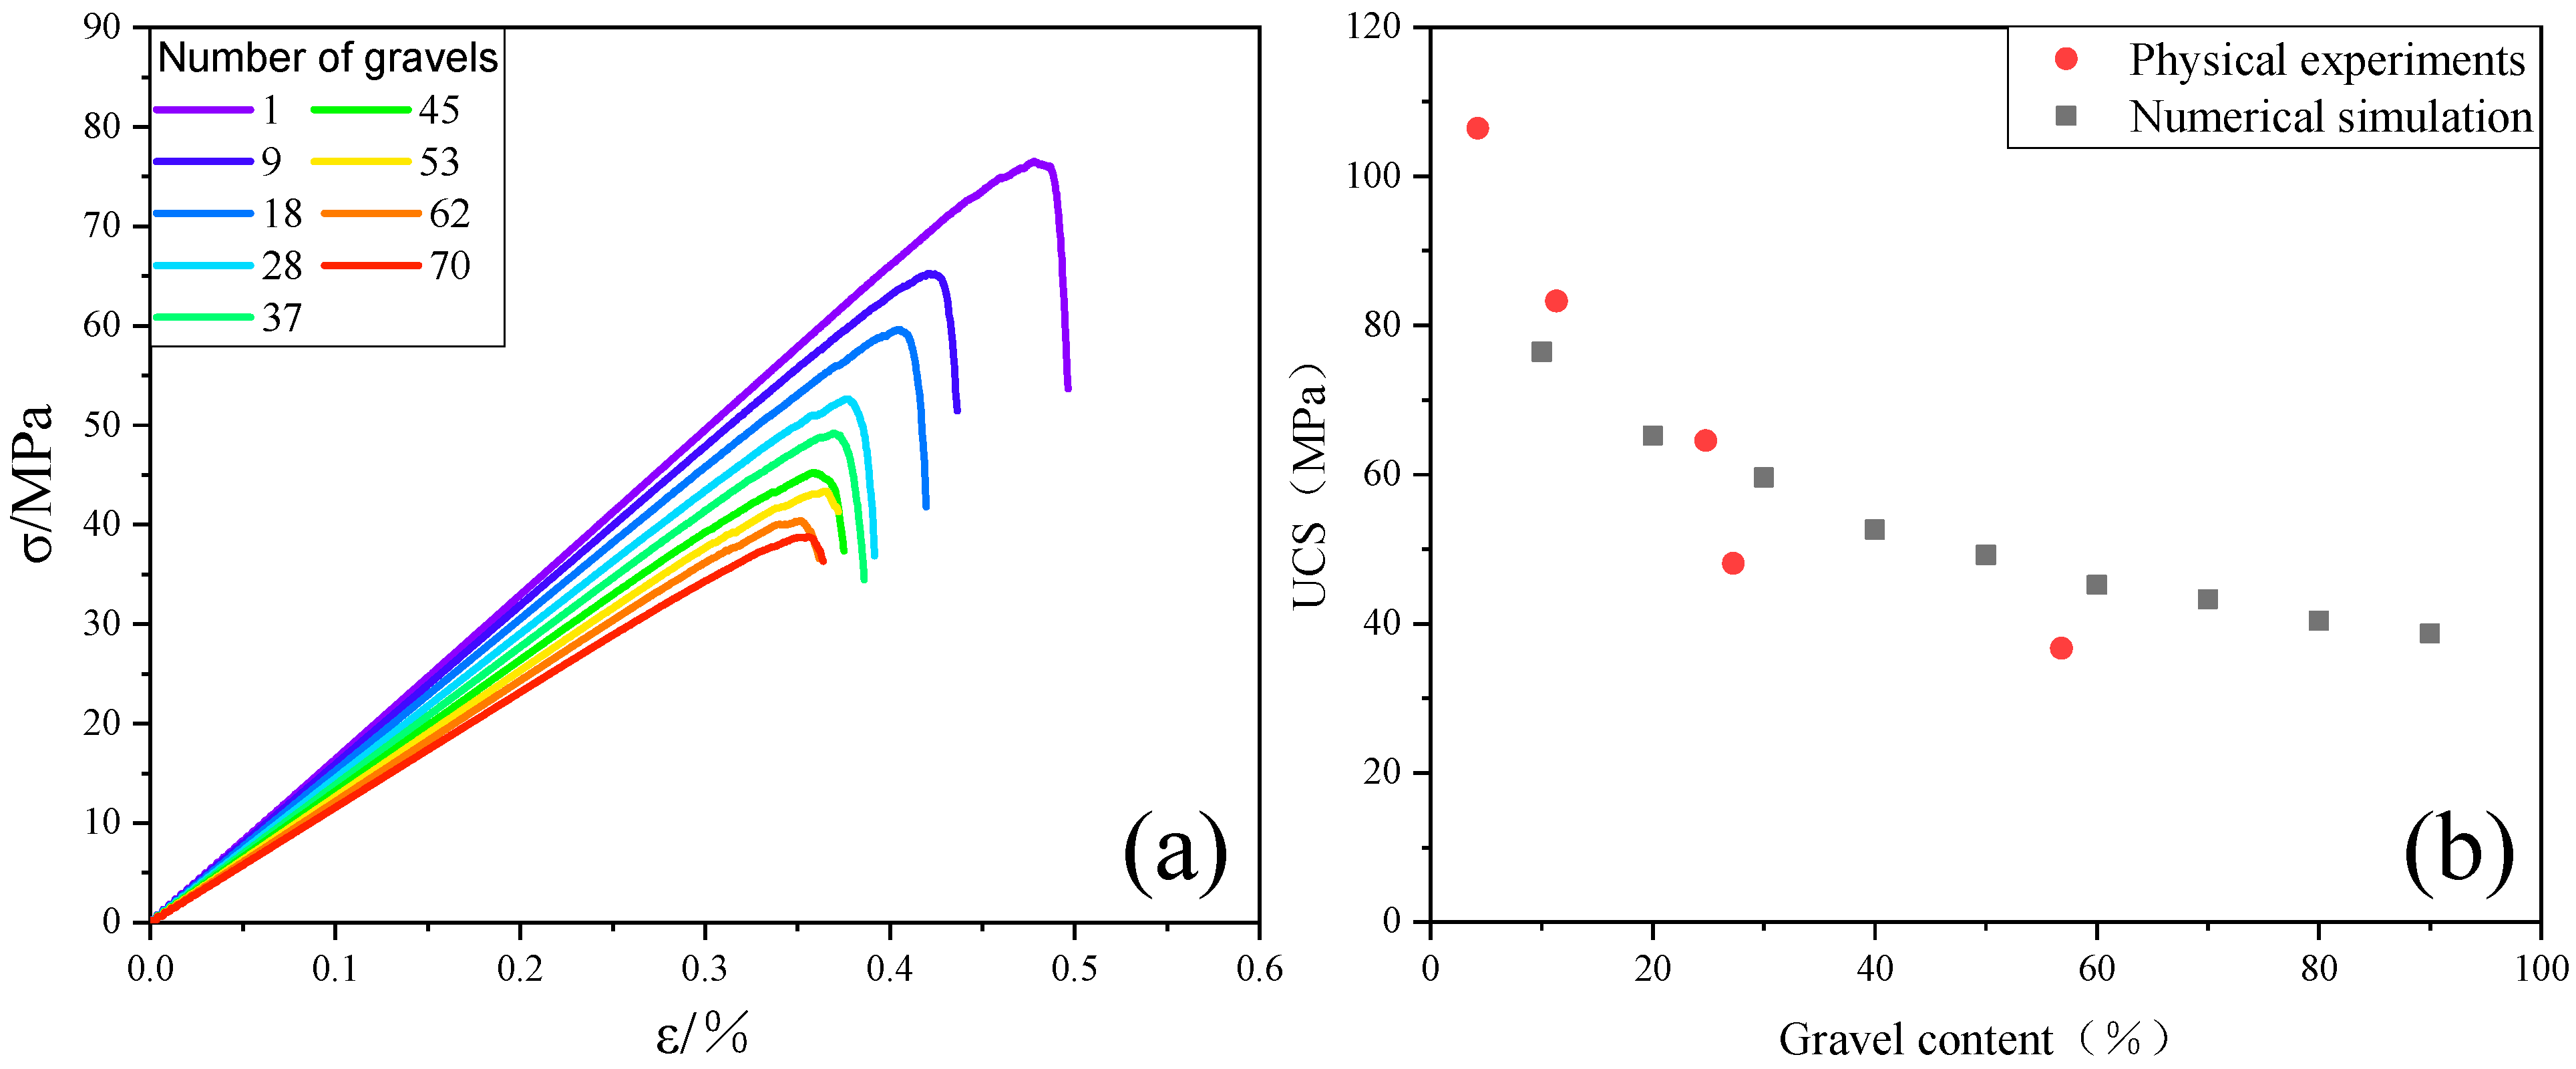
Based on the principles of constructing a conglomerate model in Section 2, conglomerate models with the number of conglomerates of 9, 18, 27, 37, 46, 54, 65, 71, and 79 are constructed to represent conglomerate contents of 10%, 20%, 30%, 40%, 50%, 60%, 70%, 80%, and 90%, respectively, and their stress-strain curves are shown in Figure 8a. The results of physical and numerical simulation experiments are presented in Figure 8b, which show that the compressive strength of the conglomerate decreases with increasing gravel content. The results of the physical experiments and the results of the s numerical simulation experiments are in agreement, proving that the model can effectively simulate the mechanical property changes and fracture morphology of the gravels under complex gravel conditions.
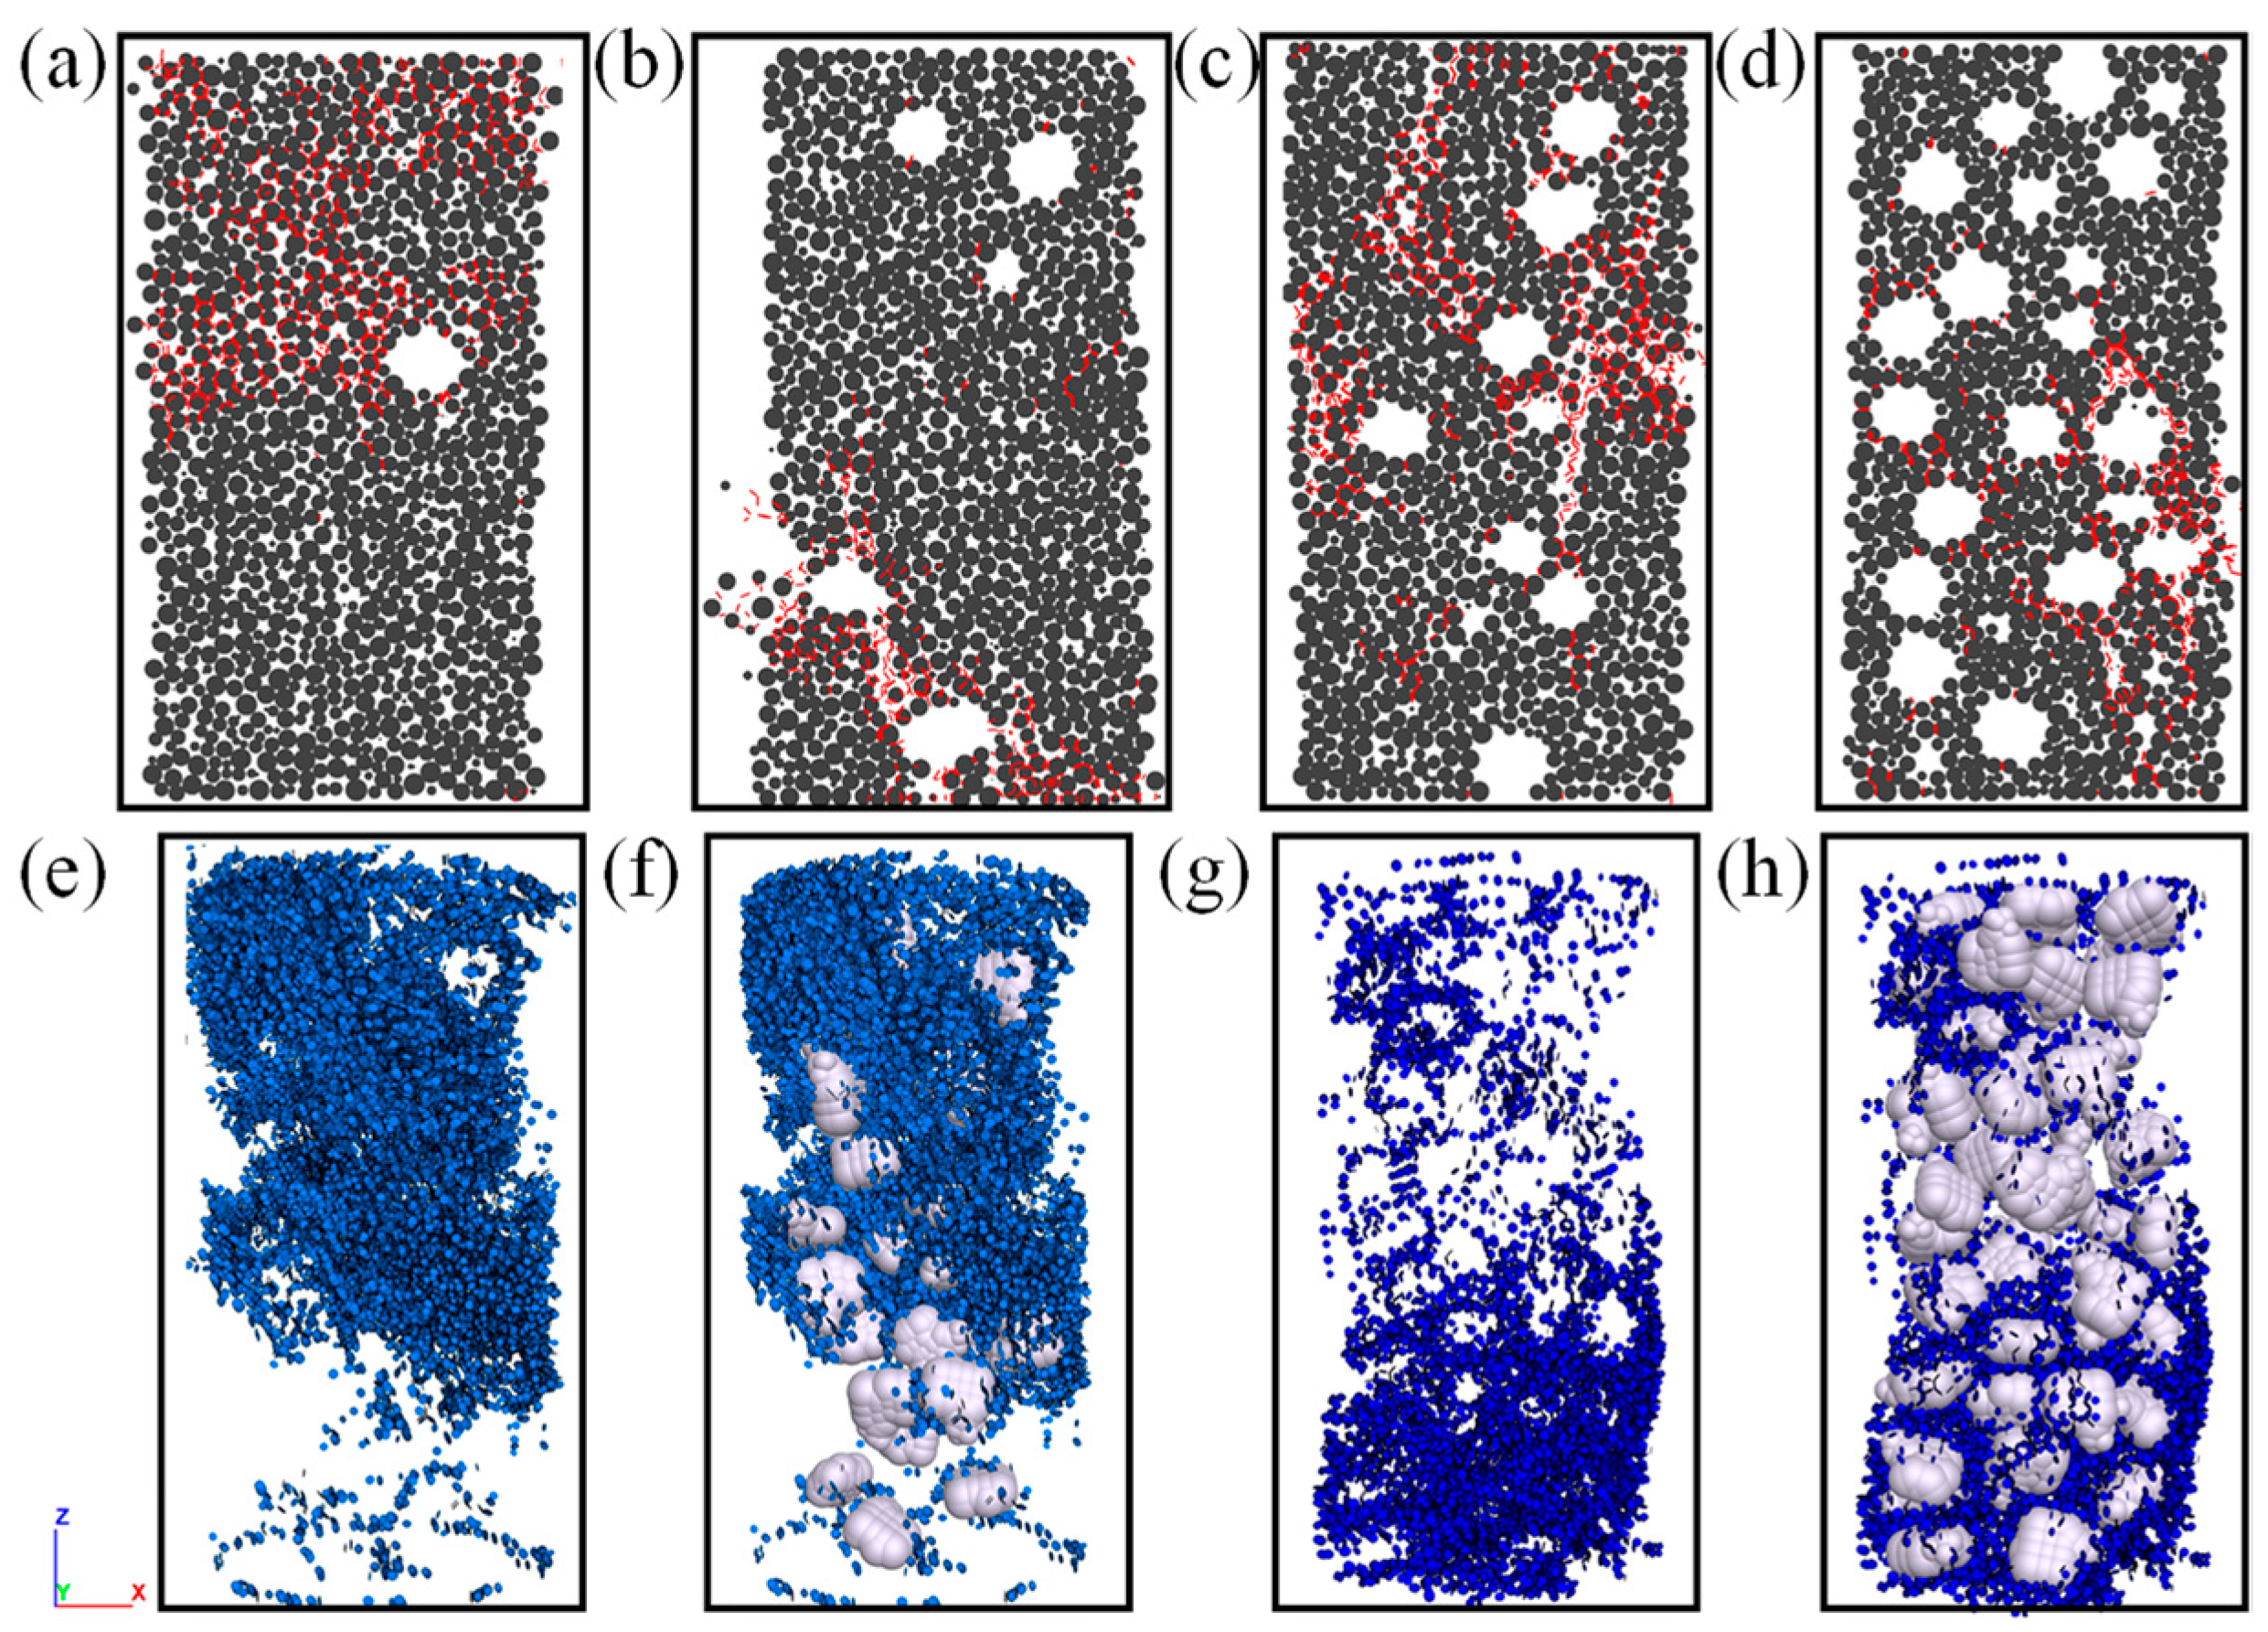
By monitoring the formation of cracks during uniaxial compression and recording their spatial locations, the two-dimensional crack slices shown in Figure 9a–d and the three-dimensional crack images shown in Figure 9e–h were obtained. From the two-dimensional fracture slices, it can be seen that the fractures mainly extend along the gravel edge (Figure 9a) and intertwine in the miscellaneous base to form the main fracture (Figure 9b). When the gravel content is high (Figure 9c,d), the fractures intertwine in the miscellaneous base and it is difficult to form the main fracture, but the overall fracture pattern is more complex. The presence of only one gravel but fractures clustered at the upper end of the conglomerate in Figure 9a is due to the fact that only one gravel is contained in this profile in the two-dimensional fracture slice diagram; there are still gravels at other locations in the actual space and the generation of these fractures is influenced by the other gravels. Figure 9b shows that the gravel located at the edges of the model will create cracks and preferentially break, thus affecting the overall strength. From the 3D fracture image, it can be observed more clearly that the fractures extend along the gravel edges and that the fractures are able to form a main fracture pattern at lower gravel contents (Figure 9e,f) and a more complex fracture pattern at higher gravel contents (Figure 9g,h).

3.2.3. Effect of Surrounding Pressure on the Mechanical Behavior of Gravels

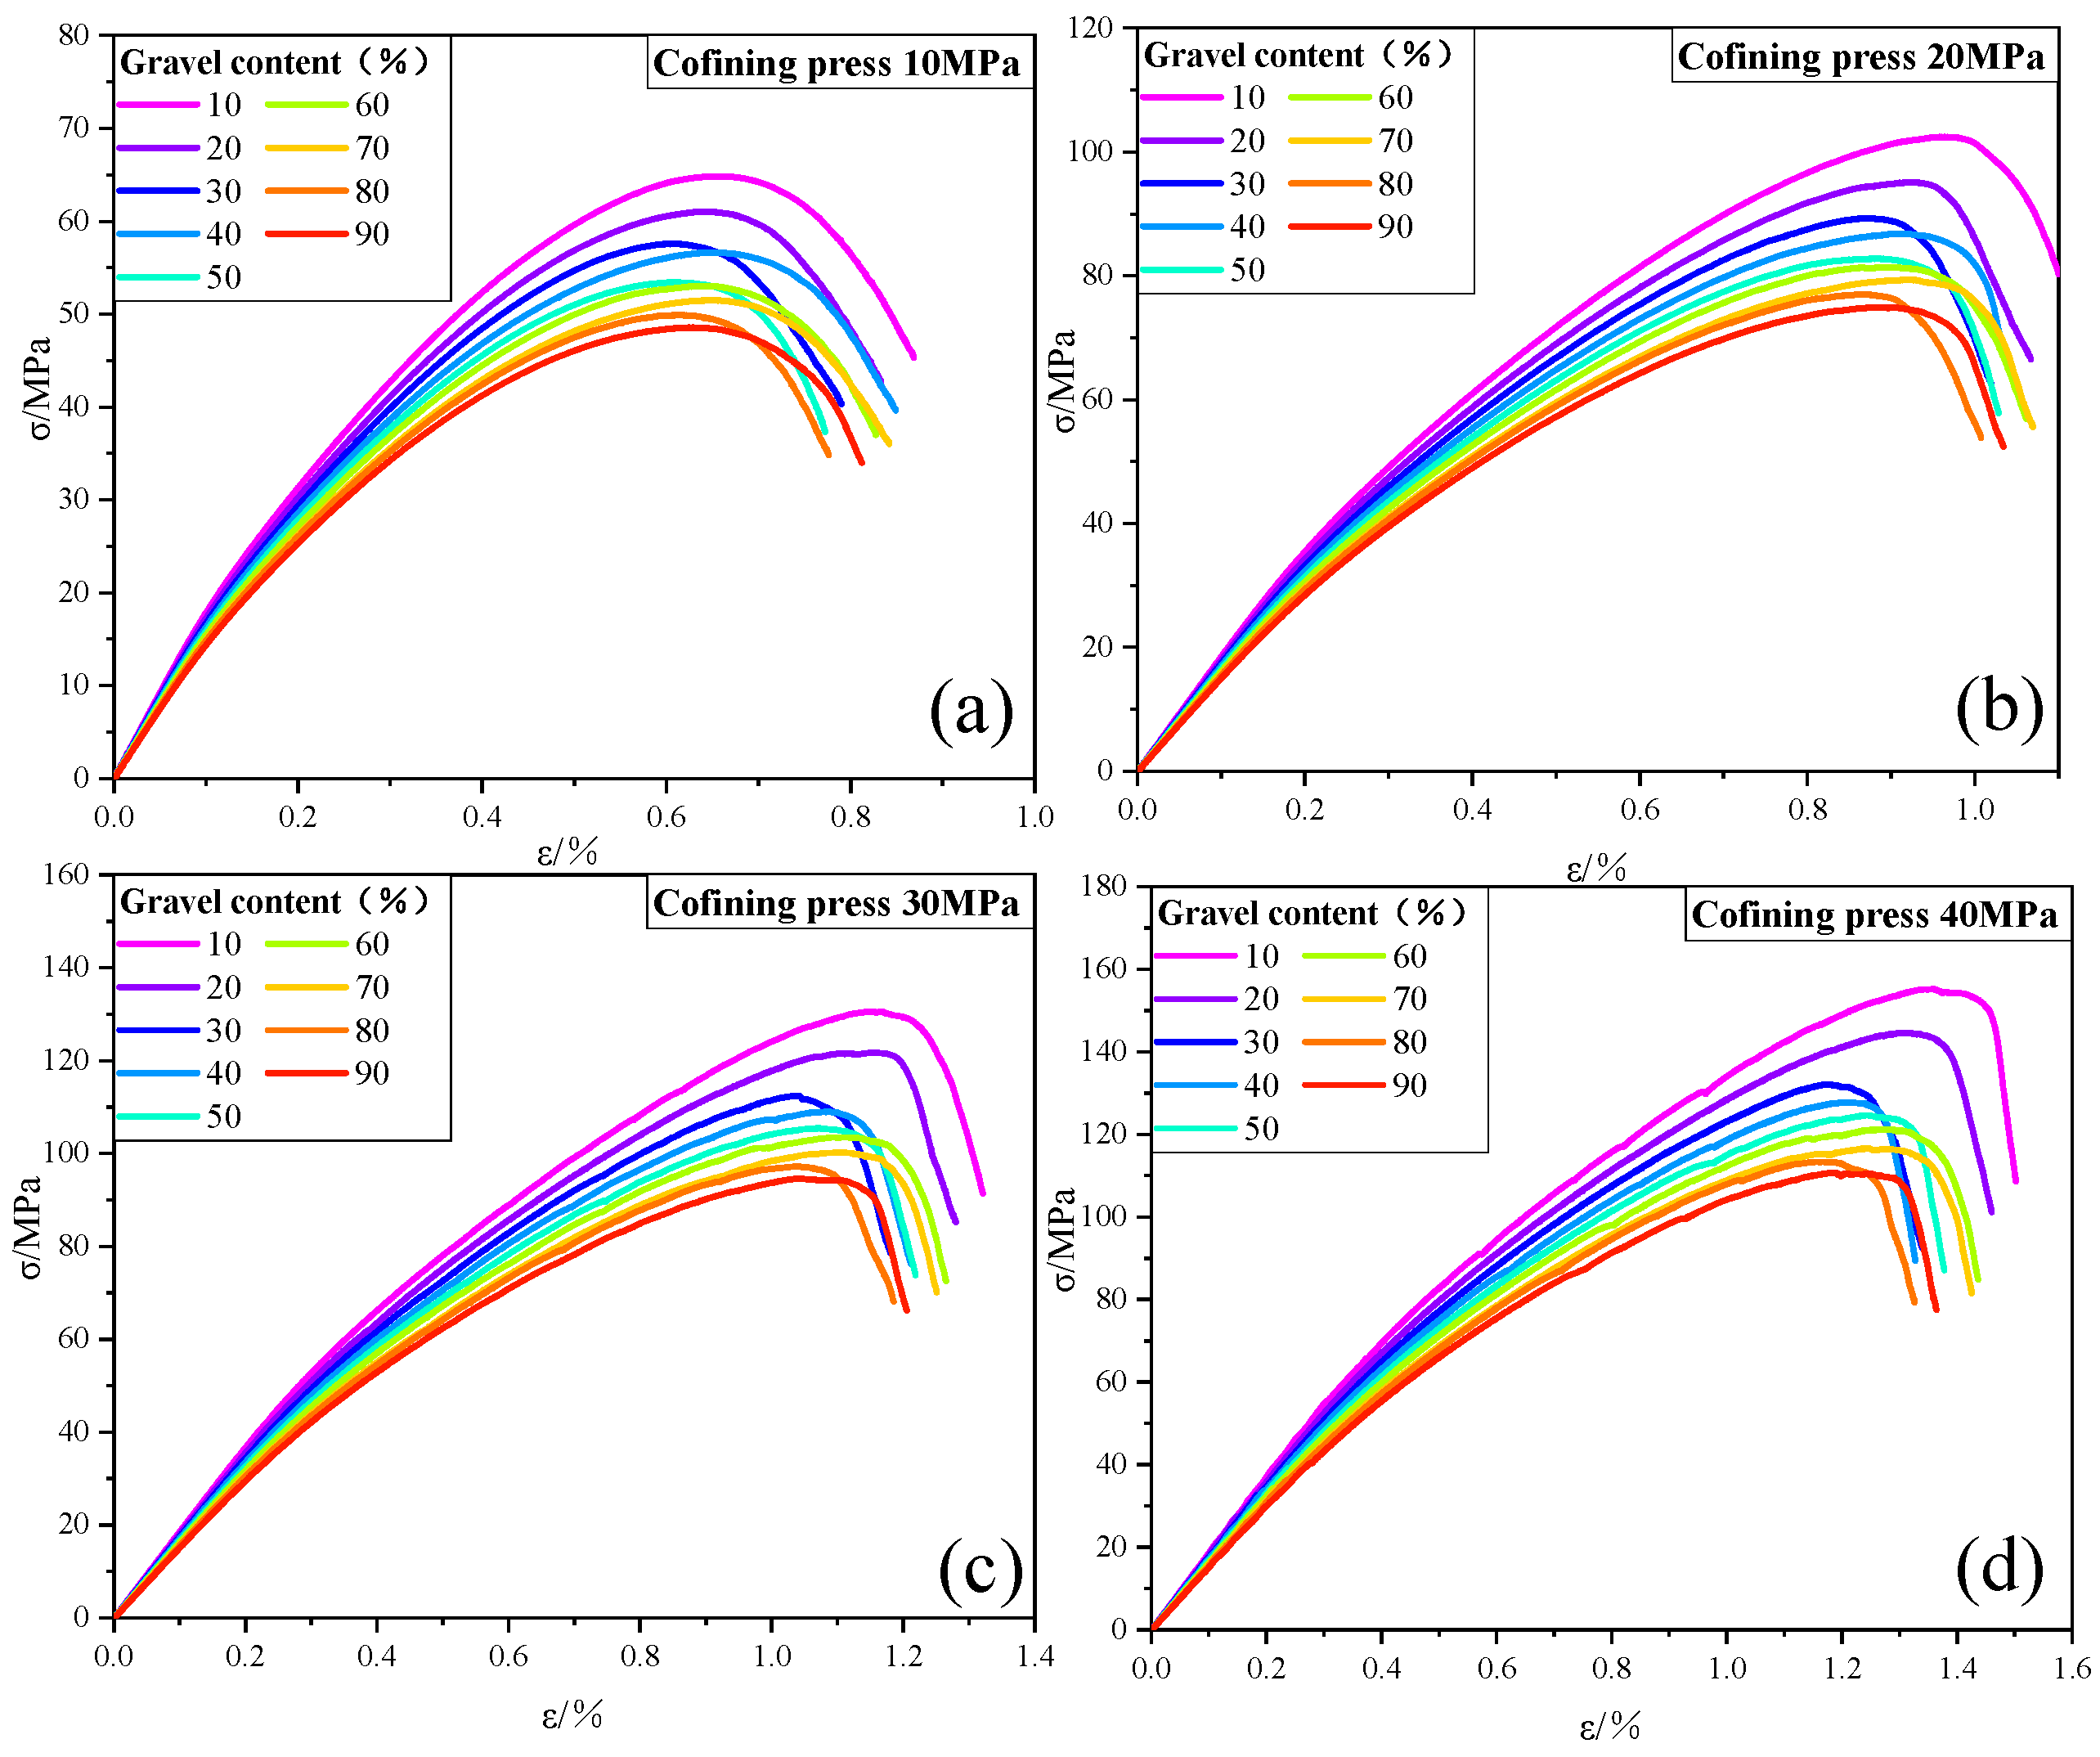
From the above study, the gravel content has a large influence on the mechanical properties of conglomerates. In this section, the conglomerate model constructed in Section 3.2.2 is simulated in triaxial compression tests at 10 MPa, 20 MPa, 30 MPa, and 40 MPa peritectic pressure with the gravel content as the variable, and the stress-strain curves with different gravel contents under different peritectic pressure conditions are obtained as shown in Figure 10. In general, as the surrounding pressure increases, the compressive strength of the conglomerate increases while its peak point strain becomes larger, the initial rupture point appears earlier, the rupture process zone is larger, and the plastic characteristics are more obvious. The compressive strength of the conglomerate decreases with the increase of the number of conglomerates under different confining pressure conditions, which is the same as the results shown in Figure 5 and Figure 8. In the case of high surrounding pressure (Figure 10c,d), the compressive strength of the conglomerate is significantly higher when the gravel content is 10% and 20% than in other cases and decreases steadily with increasing gravel content when the gravel content is greater than 30%.
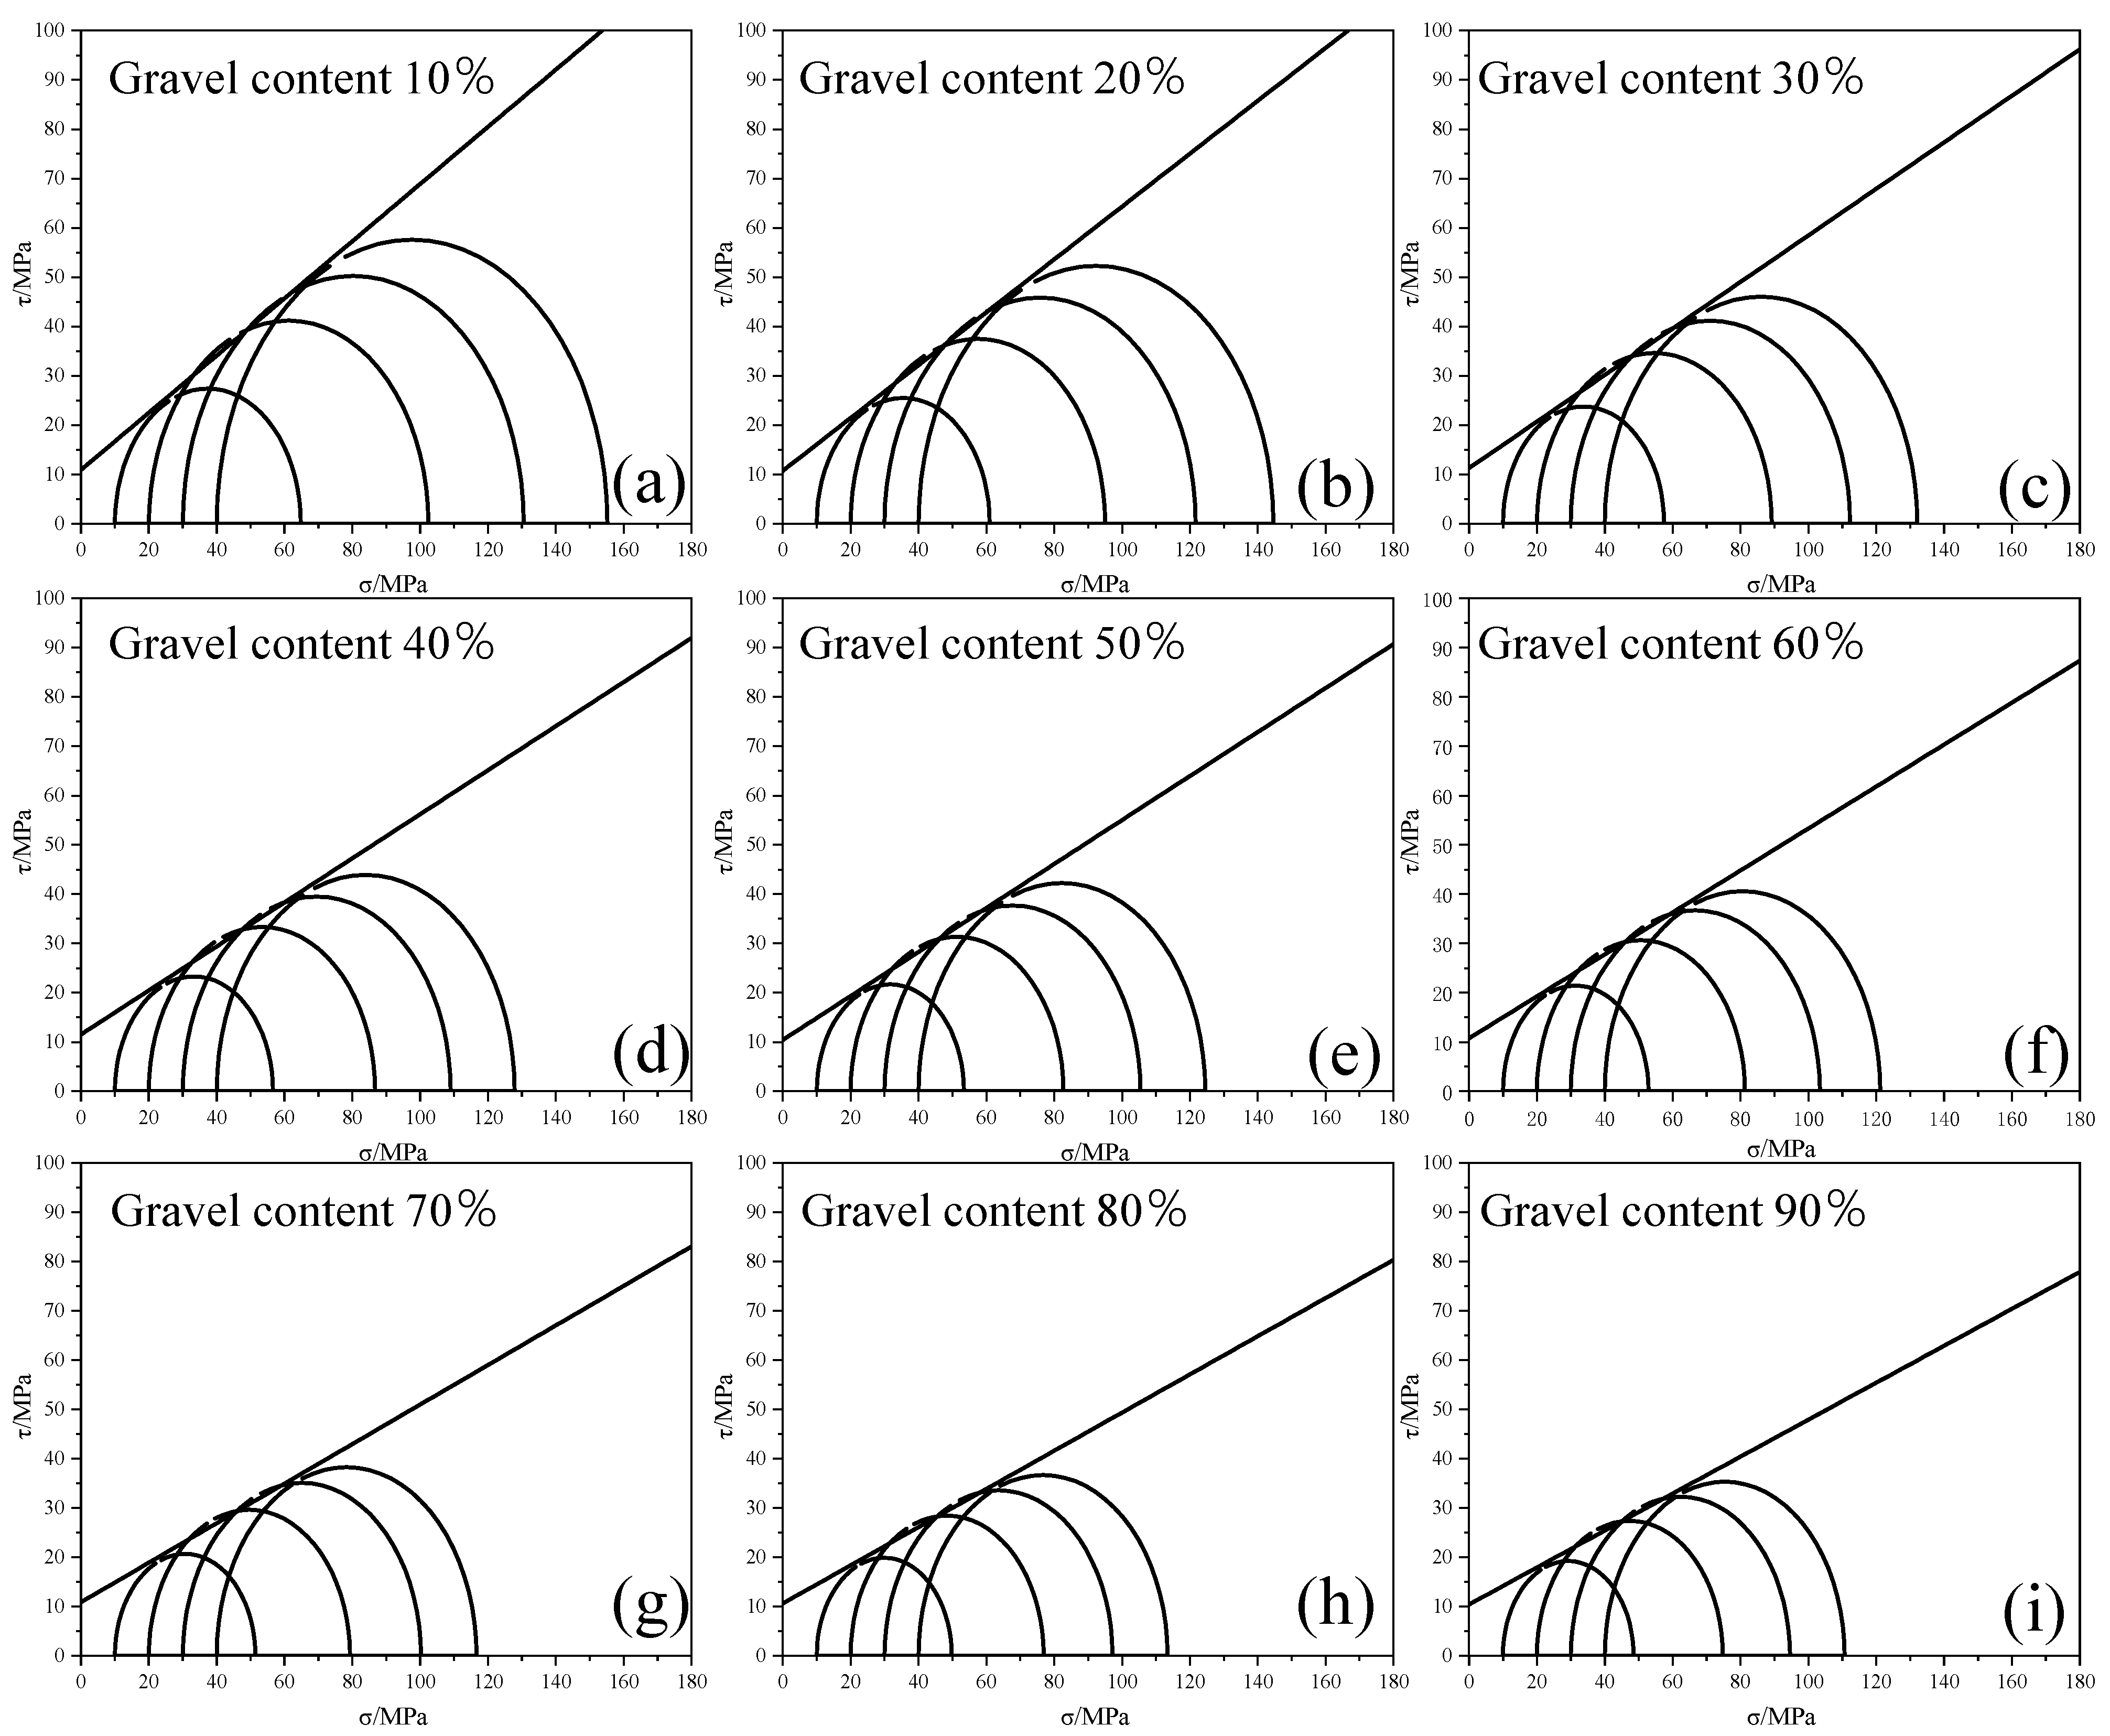
The results of the above enclosing pressure experiments were solved by planning to obtain the Mohr stress circle and its damage envelope for different gravel contents shown in Figure 11. The mechanical parameters are tabulated as shown in Table 1, and the results show that the cohesive force ranges from 10.41 to 11.52 MPa for different gravel contents, with little change in cohesive force, and the internal friction angle ranges from 20.54° to 30.12°, and the internal friction angle decreases gradually with the increase of gravel content. It can be seen from Figure 11 that when the gravel content is 10% and 20%, the slope of the damaged envelope (internal friction angle) is significantly larger than in the other cases.
The above data showed that the data with gravel content of 10% and 20% deviated from the other data by a large amount. The standard deviation of the data is used as a measure of the amount of deviation, and by processing the data in Table 2, the standard deviation of the data for the angle of internal friction with different gravel contents is 3.01 when the gravel content of 10% and 20% is included, and 1.61 when the two sets of data are not included. The standard deviation of the data for the compressive strength of the conglomerate at different envelope pressures is similar and will not be repeated here. The results indicate that the mechanical properties of the conglomerate at 10% and 20% gravel content are significantly different from the other cases and that the 30% gravel content is the cut-off point for the mechanical properties of the conglomerate.

4. Discussion

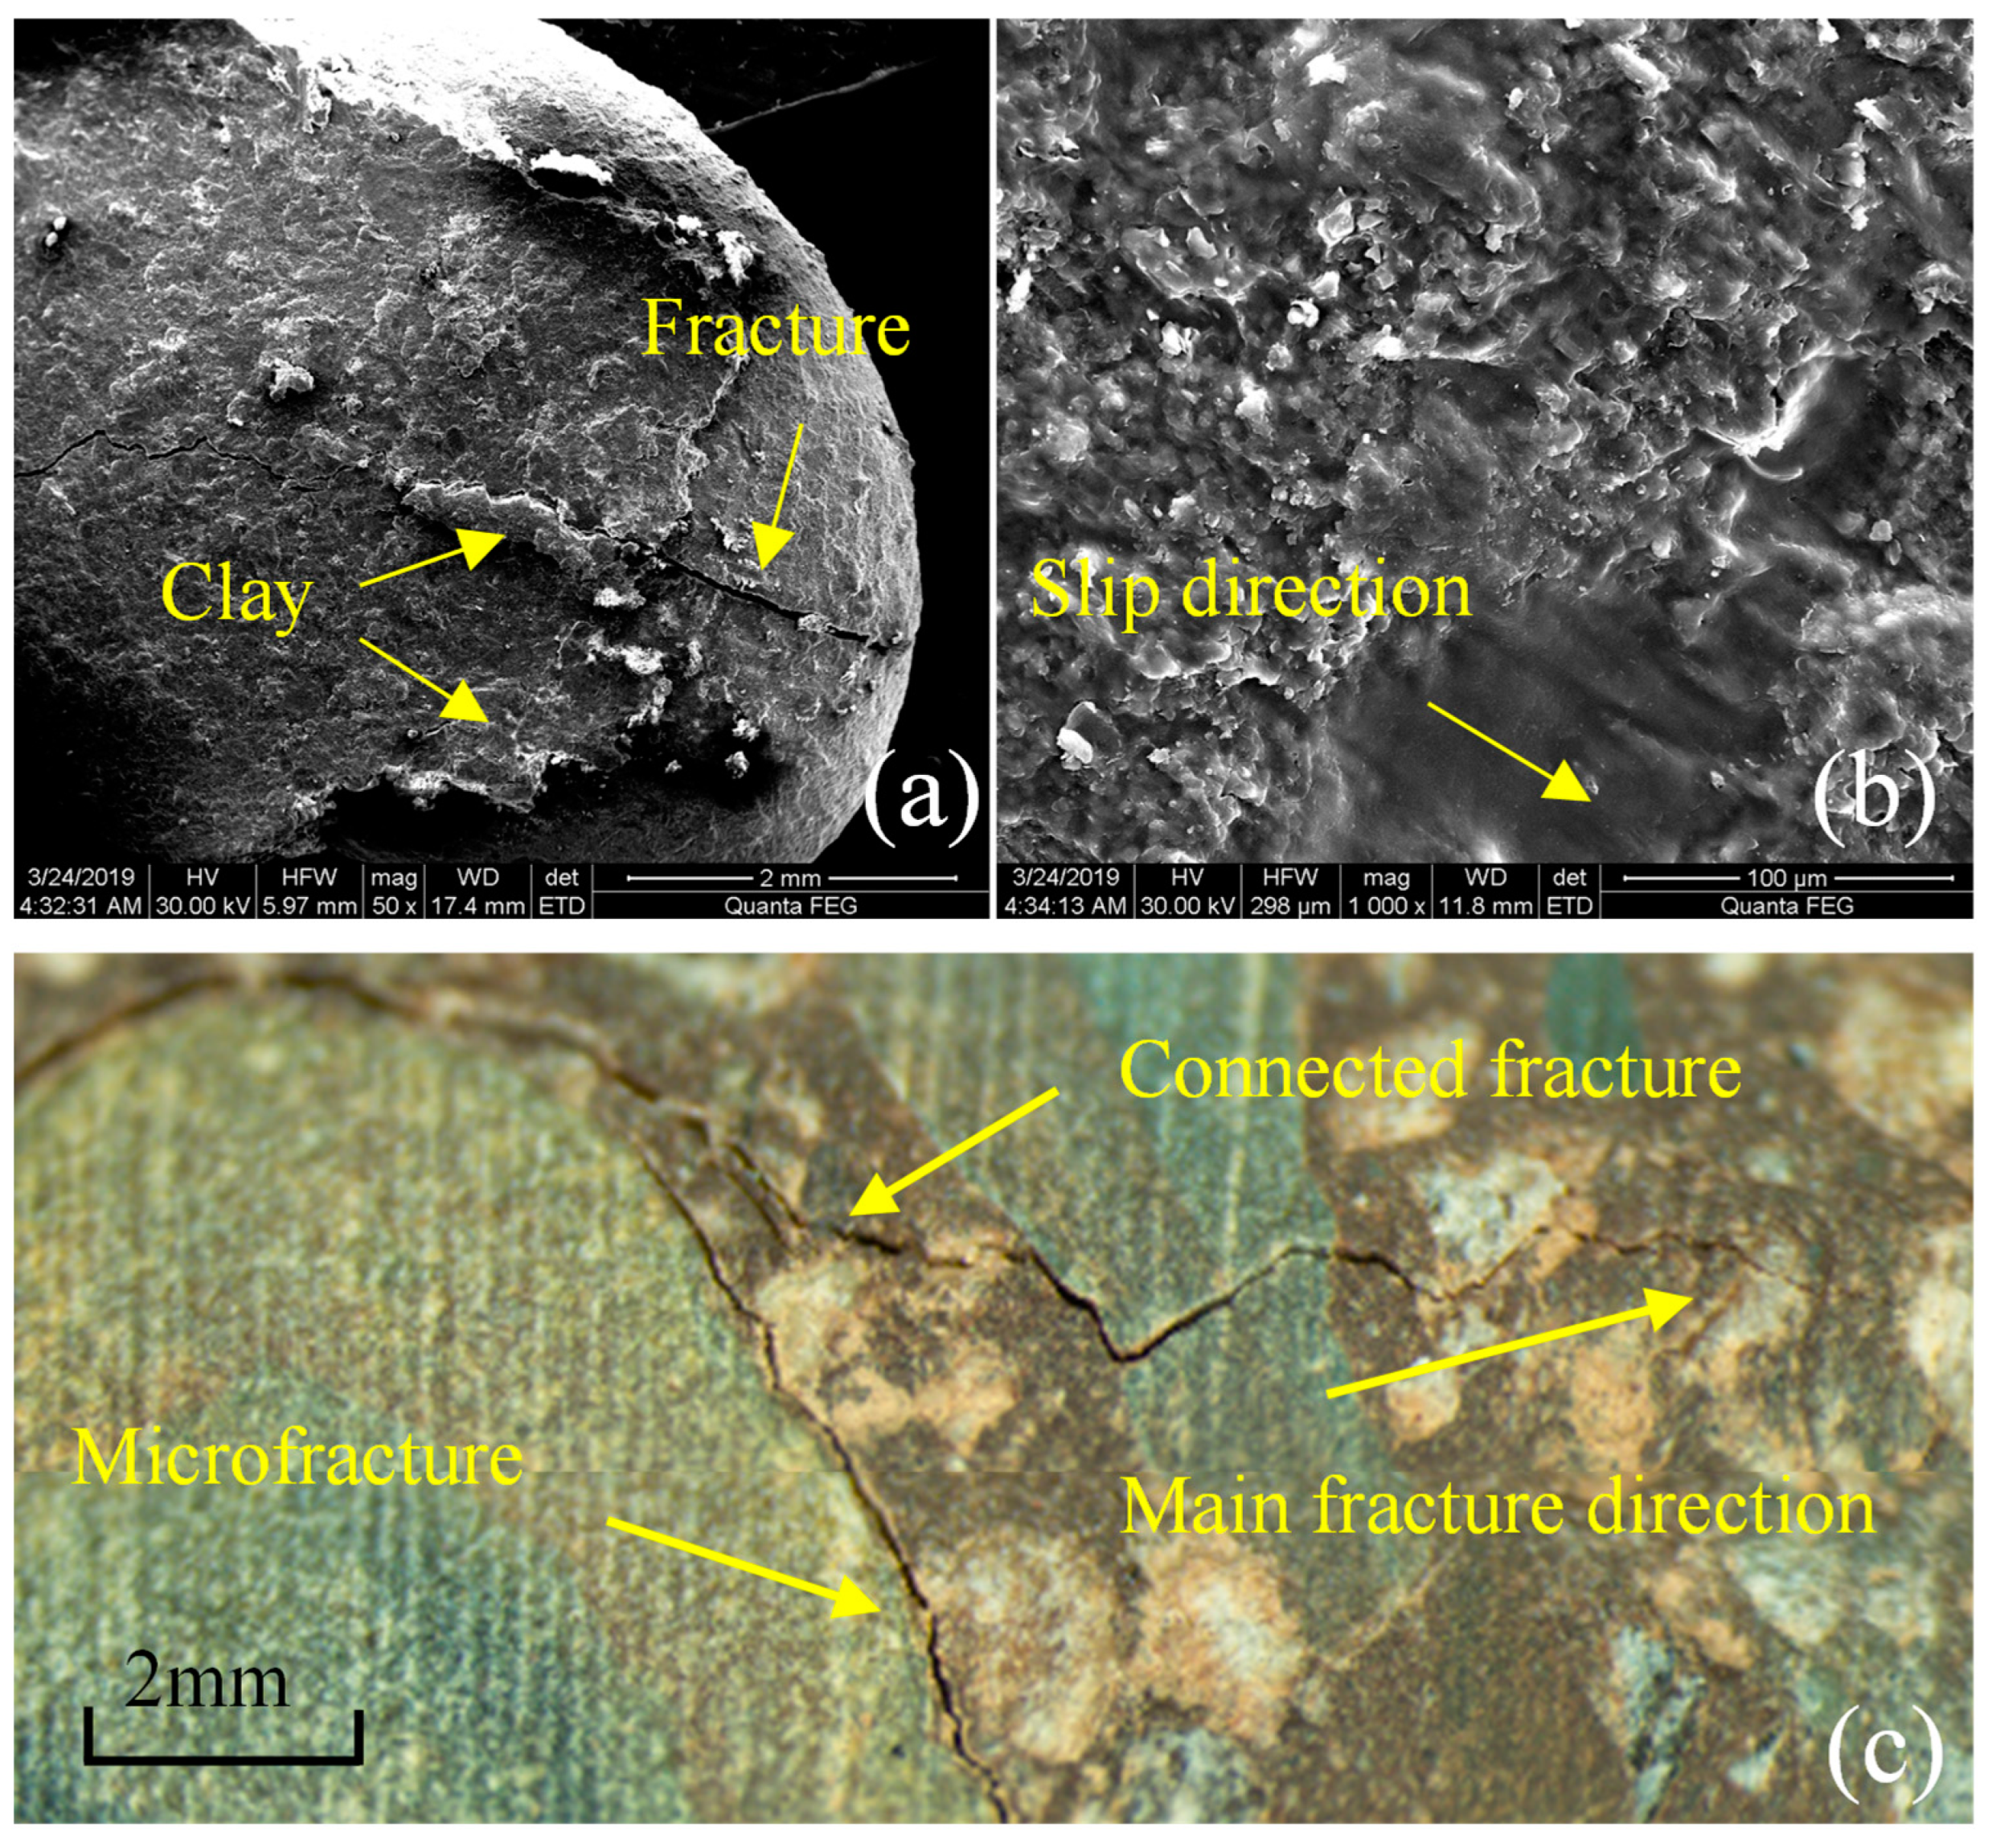
The conglomerate first passes through the compaction phase during compression, then enters the elastic phase, and next enters the critical microfracture development phase, when damage has occurred at the microscopic level, but the rock still has load-bearing capacity at the macroscopic level. The results of physical experiments (Figure 6) and numerical simulations (Figure 9) demonstrate that microfractures in the three-phase conglomerate model with gravel, heterogeneous base, and weak cementation surface are more likely to be generated in the weak cementation surface, which has the lowest strength, while the microfractures generated in the cementation surface are essentially a frictional behavior. Figure 12a shows the clayey minerals on the surface of the conglomerate being compressed and deformed after the damage, while Figure 12b shows the direction of clay frictional deformation on the gravel surface. As shown in Figure 6 and Figure 9, when microcracks are formed at the edge of the gravel, the further expansion of the cracks is influenced by the gravel, as shown in Figure 12c when microcracks are created at both gravel edges, they will communicate with each other to create new cracks, and when the two gravels are close enough, the priority of the creation of new cracks will be greater than the priority of the stress action, which makes the direction of the connecting cracks deviate from the main crack direction.
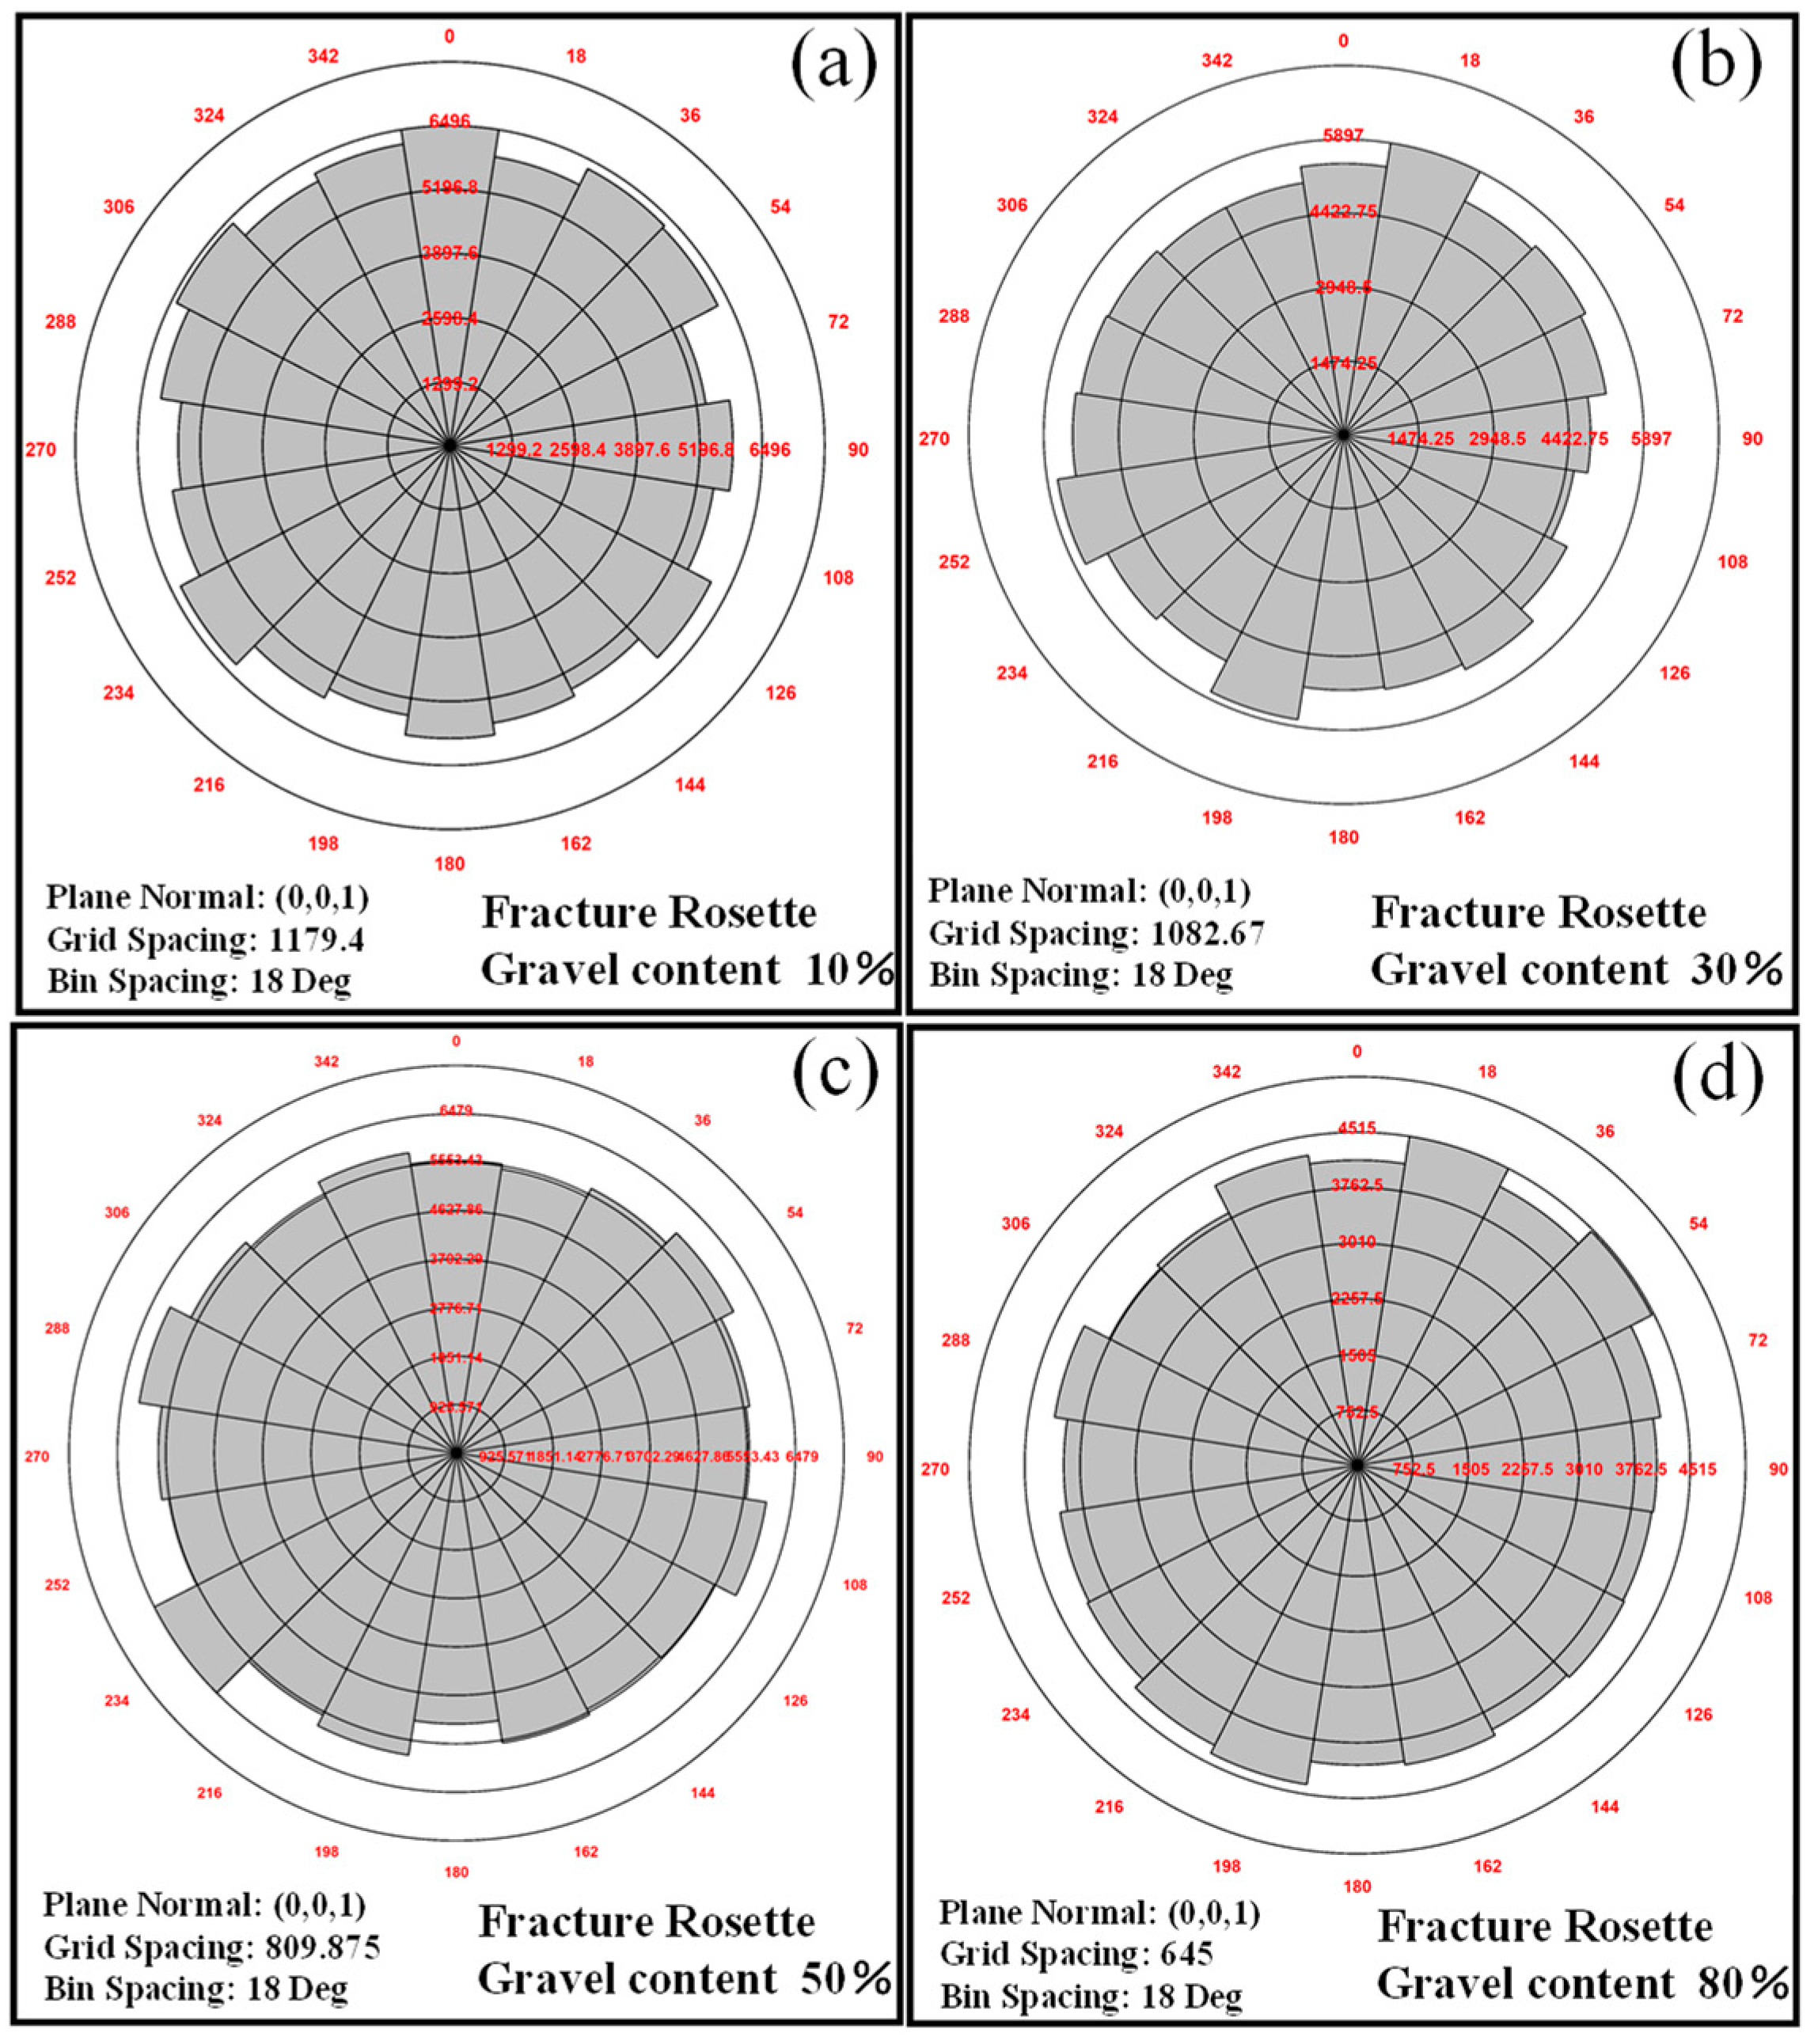
When the gravel content is high enough, the gravel spacing will be smaller so that the microfractures around different gravels will communicate with each other to produce new microfractures, these microfractures deviate from the main fracture direction thus making the overall fracture pattern more complex, shown in Figure 13, the difference between the maximum and minimum value of the fracture number at 10% gravel content. As shown in Figure 13, the difference between the maximum and the minimum number of cracks at 10% gravel content is 1179.4, and the difference decreases gradually with the increase of gravel content, and the difference is only 645 when the gravel content is 80%, i.e., it is difficult to form the main cracks at low gravel content under high gravel content, but the formed cracks are more uniform and more complex.
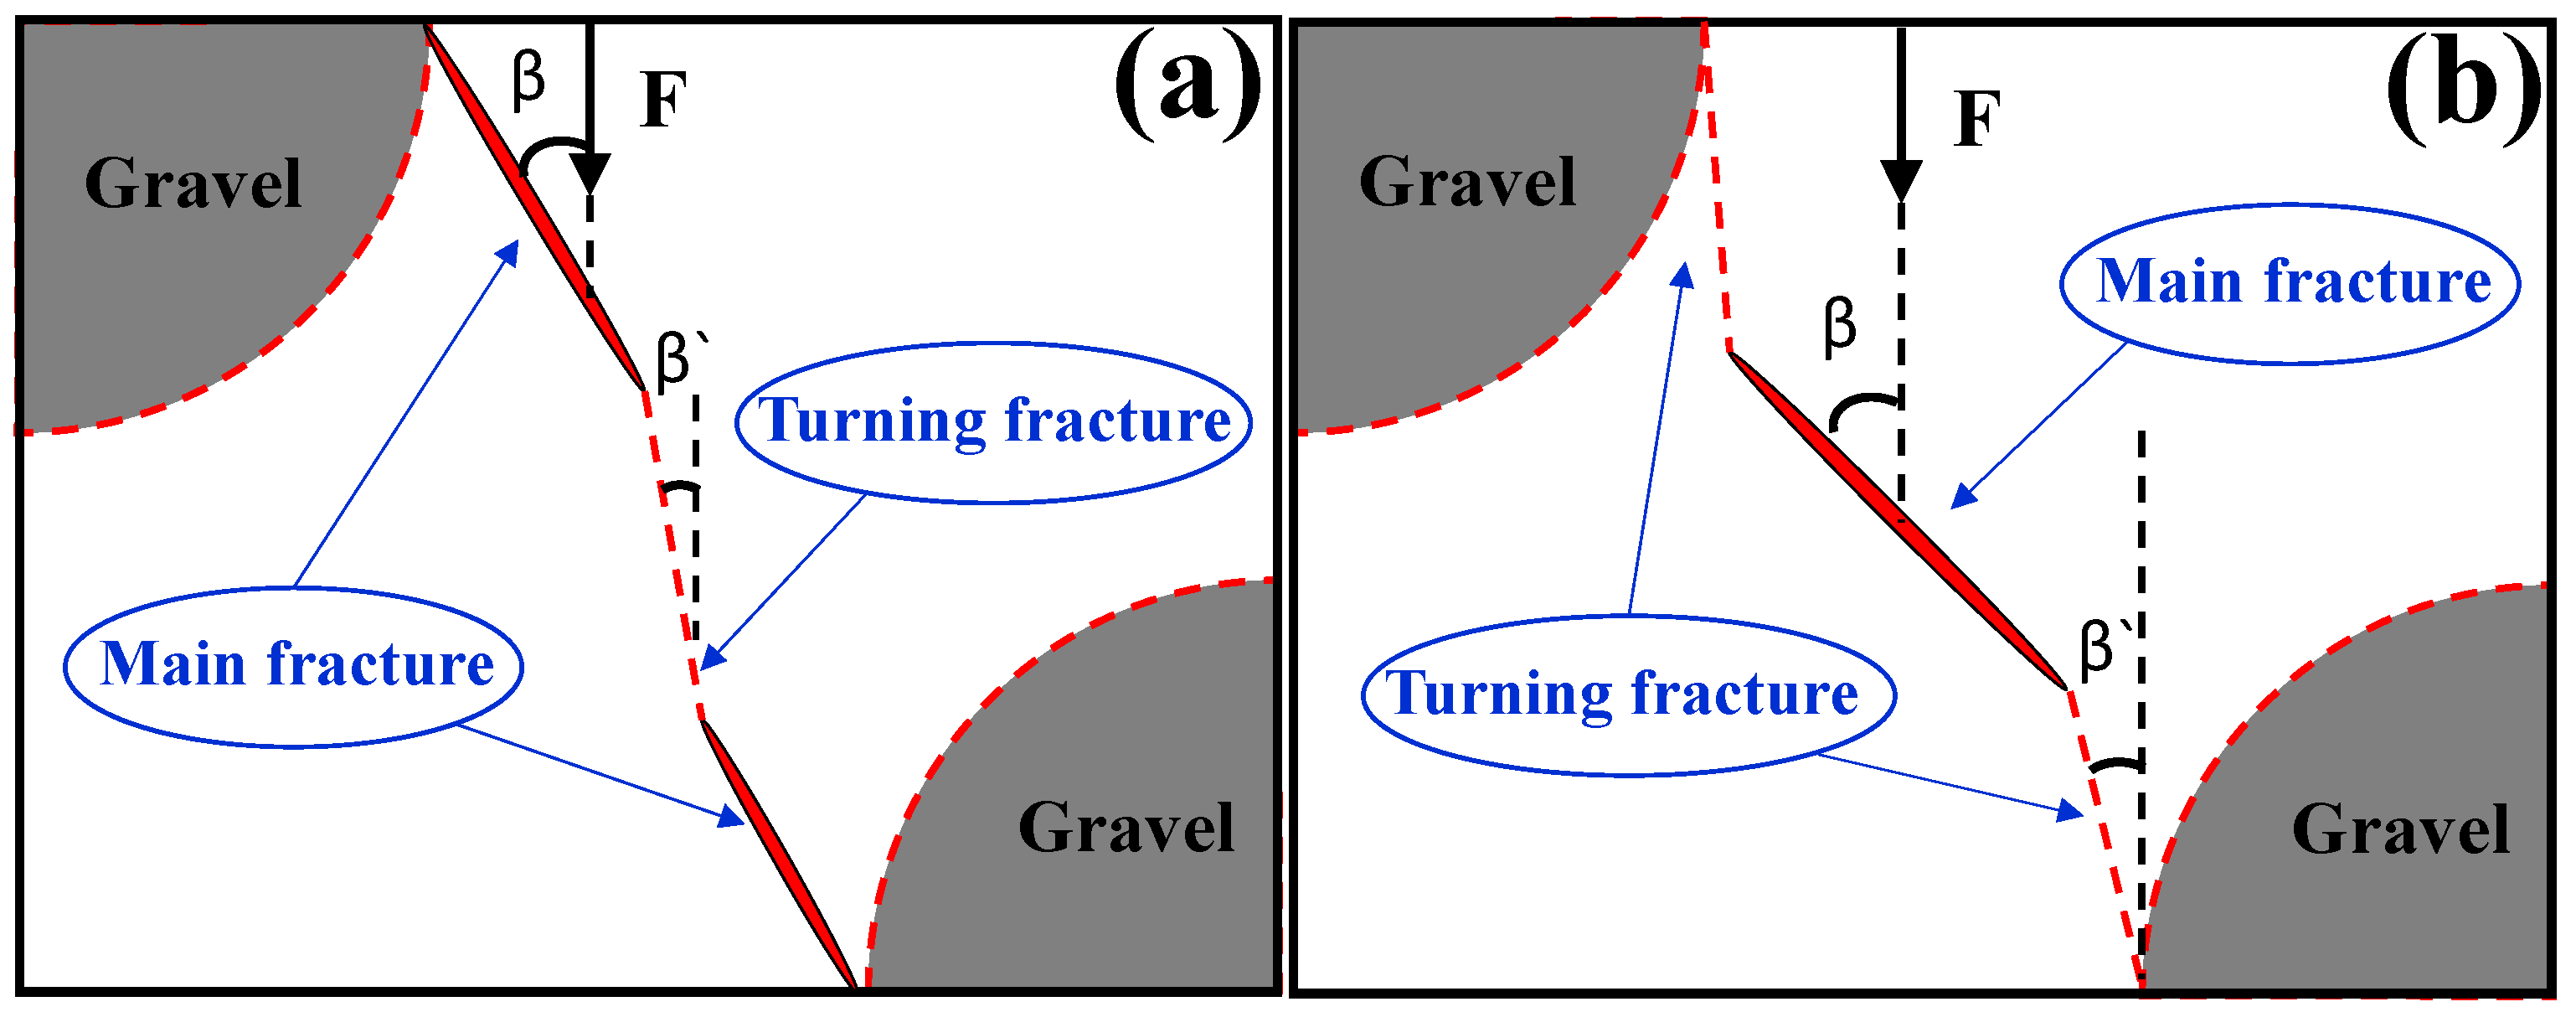
From the above analysis, it is known that the microfracture starts at the edge of the gravel first, and the fracture is affected by the spacing of the gravel in the process of further expansion. In general, as shown in Figure 14a, when the main fracture with rupture angle β expands along the edge of the gravel, a turn occurs during expansion due to the attraction between the fractures, i.e., the phenomenon shown in Figure 6a; when the main fracture with rupture angle β is created in the miscellaneous base as shown in Figure 14b, the path turns during expansion due to the obstruction of the gravel, i.e., the phenomenon shown in Figure 12c. The angle of the rupture angle β` of the new fracture formed in both cases is varied by the gravel spacing, and as the gravel content increases, the closer the gravel spacing is, the smaller the newly generated rupture angle β` is.
The rupture angle β when rupture occurs can be obtained from Equations (2) and (3) by associating Equation (7), and the relationship between rupture angle β and internal friction angle φ can be obtained according to the concept of kinetic friction coefficient Equation (8), that is, the rupture angle is proportional to the internal friction angle. From this, it can be seen that as the gravel content increases leading to closer gravel spacing—thus making the rupture angle β` smaller for the newly generated cracks, leading to a decrease in the overall internal friction angle of the rock—the kinetic friction coefficient decreases and the compressive strength decreases.

5. Conclusions

Conglomerates are affected by complex components such as gravel, and their mechanical behavior is more complex. In this paper, the mechanical properties of conglomerates and their fracture morphology are investigated by indoor physical experiments combined with numerical simulation methods, and the results show that:
(1) The physical experimental results show that the uniaxial compressive strength of conglomerate gradually decreases with increasing gravel content and that gravel content is the main controlling factor of conglomerate mechanical properties;
(2) This paper constructs a fine three-dimensional conglomerate model based on the particle flow discrete element program, which can effectively simulate the conglomerate with complex particle composition and its mechanical behavior;
(3) The numerical simulation results show that the mechanical properties of conglomerates are influenced by the shape of conglomerates and their spatial location. The lower the roundness of the conglomerate, the lower the compressive strength, and the smaller the angle between the long axis of the bar conglomerate and the stress direction, the lower the compressive strength. The lower the roundness of the gravel, the lower the stress concentration at the angular points. As the angle between the long axis of the gravel and the stress direction decreases, the stress concentration at the end face of the gravel becomes more obvious, and the energy accumulated in the stress concentration and the gravel content work together to form a rupture between the gravels more easily, thus lowering the strength of the gravel;
(4) With the increase of gravel content, the internal friction angle of gravel gradually decreases. As gravel content increases, the angle of internal friction decreases. Gravel content influences the formation of the dominant fracture surface by controlling the gravel spacing, which in turn controls the magnitude of the angle of internal friction to influence the compressive strength of the conglomerate;
(5) The conglomerate fracture starts at the edge of the conglomerate, with stress controlling the fracture pattern to form the dominant fracture at low conglomerate content and the influence of the conglomerate at high conglomerate content making the fracture more discrete and complex. With the increase of gravel content, the fractures starting at the edge of the gravel are more likely to communicate with each other during the expansion process, and the high gravel content makes the microfractures at the edge of the gravel develop in large numbers so that it is difficult to form the main fracture, and the fracture pattern is discrete and complex.

Author Contributions

Conceptualization, P.L. and Y.S.; methodology, M.M.; software, S.L.; validation, P.L; formal analysis, M.M.; investigation, Y.Z.; resources, Y.S.; data curation, Q.C.; writing—original draft preparation, P.L.; writing—review and editing, S.L.; visualization, Y.Z. and P.L.; supervision, M.M.; project administration, Y.S. All authors have read and agreed to the published version of the manuscript.

Funding

This research was funded by [The Strategic Cooperation Technology Projects of CNPC and CUPB] grant number [ZLZX2020-01].

Institutional Review Board Statement

Not applicable.

Informed Consent Statement

Not applicable.

Data Availability Statement

The data presented in this study are available on request from the corresponding author.

Conflicts of Interest

The authors declare no conflict of interest.

Nomenclature

σnormal stress, MPa
τshear stress, MPa
σ1, σ3principal stress, MPa
Ccohesion, MPa
φinternal friction angle, °
Fccontact force, N
Fllinear force, N
Fddashpot force, N;
Mccontact moment, N·m
F ¯ parallel-bond force, N
M ¯ parallel-bond moment, N·m
Ekstrain energy, N·m/pa
F n l linear normal force, N
F s l linear shear force, N
k n normal stiffness, N/m
k s shear stiffness, N/m
Eμslip energy, N·m/pa
( F s l ) 0 linear shear force at the beginning of the timestep, N
Δ δ s μ slip component of relative shear-displacement increment, m
Eβdashpot energy, N·m/pa
δ relative translational velocity, m/s
Δ t time step, s
βfailure angle
μdynamic friction coefficient
σ c uniaxial compressive strength, MPa

References

  1. Meng, M.; Ge, H.; Shen, Y.; Ji, W.; Wang, Q. Rock Fabric of Tight Sandstone and Its Influence on Irreducible Water Saturation in Eastern Ordos Basin. Energy Fuels 2023, 37, 3685–3696. [Google Scholar] [CrossRef]
  2. Zhang, Y.; Ge, H.; Zhao, K.; Liu, S.; Zhou, D. Simulation of pressure response resulted from non-uniform fracture network communication and its application to interwell-fracturing interference in shale oil reservoirs. Geomech. Geophys. Geo-Energy Geo-Resour. 2022, 8, 114. [Google Scholar] [CrossRef]
  3. Jia, C.Z.; Zou, C.N.; Yang, Z.; Zhu, R.K.; Chen, Z.X.; Zhang, B.; Jiang, L. Significant progress of continental petroleum geology theory in basins of Central and Western China. Pet. Explor. Dev. 2018, 45, 546–560. [Google Scholar] [CrossRef]
  4. Li, G.X.; Qin, J.H.; Xian, C.G.; Fan, X.; Zhang, J.; Ding, Y. Theoretical understandings, key technologies and practices of tight conglomerate oilfield efficient development: A case study of the Mahu oilfield, Junggar Basin, NW China. Pet. Explor. Dev. 2020, 47, 1275–1290. [Google Scholar] [CrossRef]
  5. Wei, J.; Liao, H.L.; Wang, H.J.; Chen, J.; Li, N.; Liang, H.; Liu, C.; Zhang, D.; Teng, Z. Experimental investigation on the dynamic tensile characteristics of conglomerate based on 3D SHPB system. J. Pet. Sci. Eng. 2022, 213, 110350. [Google Scholar] [CrossRef]
  6. Yu, X.H.; Zhai, J.H.; Tan, C.P.; Zhang, L.; Li, X.L.; Gao, Z.P. Conglomerate Lithofacies and Origin Models of Fan Deltas of Baikouquan Formation in Mahu Sag, Junggar Basin. Xinjiang Pet. Geol. 2014, 35, 619–627. [Google Scholar]
  7. Zhang, C.M.; Wang, X.L.; Zhu, R.; Qu, J.H.; Pan, J.; An, Z.Y. Litho-Facies Classification of Baikouquan Formation in Mahu sag, Junggar Basin. Xinjiang Pet. Geol. 2016, 37, 606–614. [Google Scholar]
  8. Zhang, C.M.; Song, X.M.; Wang, X.J.; Wang, X.; Zhao, K.; Shuang, Q.; Li, S. Origin and depositional characteristics of supported conglomerates. Pet. Explor. Dev. 2020, 47, 292–305. [Google Scholar] [CrossRef]
  9. Li, J.R.; Duan, K.; Meng, H.; Wang, J.; Zhang, Q.; Wang, L. On the Mechanical Properties and Failure Mechanism of Conglomerate Specimens Subjected to Triaxial Compression Tests. Rock Mech. Rock Eng. 2022, 56, 973–995. [Google Scholar] [CrossRef]
  10. Liu, X.J.; Xiong, J.; Liang, L.X.; You, X.C. Rock Mechanical Characterisitics and Fracture Propagation Mechanism of Sandy Conglomerate Reservoirs in Baikouquan Formation of Mahu Sag. Xinjiang Pet. Geol. 2018, 39, 83–91. [Google Scholar]
  11. Luo, S.L.; Ge, H.K.; Wang, J.B.; Zhou, W.; Shen, Y.; Liu, P.; Liu, J. Numerical simulation study on the crack propagation of conglomerate. R. Soc. Open Sci. 2021, 8, 202178. [Google Scholar] [CrossRef]
  12. Wang, J.B.; Ge, H.K.; Liu, J.T.; Shen, Y.; Zhang, Z.; Luo, S.; Liu, D. Effects of Gravel Size and Content on the Mechanical Properties of Conglomerate. Rock Mech. Rock Eng. 2022, 55, 2493–2502. [Google Scholar] [CrossRef]
  13. Liu, J.T.; Ge, H.K.; Zhang, Z.X.; Wang, X.; Wang, J. Influence of mechanical contrast between the matrix and gravel on fracture propagation of glutenite. J. Pet. Sci. Eng. 2022, 208, 109639. [Google Scholar] [CrossRef]
  14. Han, X.H.; Zhang, H.; Guo, J.X.; Li, J.; Fang, T. Controlling factors on elastic wave velocities of conglomerate—Experimental and theoretical study. J. Pet. Sci. Eng. 2022, 209, 109837. [Google Scholar] [CrossRef]
  15. Liu, J.T.; Ge, H.K.; Mou, S.B.; Wang, X.; Wang, J. Characterization of meso-structure of glutenite reservoirs by ultrasonic characteristics and the velocity heterogeneity. J. Pet. Sci. Eng. 2022, 208, 109436. [Google Scholar] [CrossRef]
  16. Li, N.; Zhang, S.C.; Ma, X.F.; Zou, Y.S.; Chen, M.; Li, S.H.; Zhang, Y.N. Experimental study on the propagation mechanism of hydraulic fracture in glutenite formations. Chin. J. Rock Mech. Eng. 2017, 36, 2383–2392. [Google Scholar]
  17. Liu, P.; Ju, Y.; Ranjith, P.G.; Zheng, Z.; Chen, J. Experimental investigation of the effects of heterogeneity and geostress difference on the 3D growth and distribution of hydrofracturing cracks in unconventional reservoir rocks. J. Nat. Gas Sci. Eng. 2016, 35, 541–554. [Google Scholar] [CrossRef]
  18. Ma, X.F.; Zou, Y.S.; Li, N.; Chen, M.; Zhang, Y.; Liu, Z. Experimental study on the mechanism of hydraulic fracture growth in a glutenite reservoir. J. Struct. Geol. 2017, 97, 37–47. [Google Scholar] [CrossRef]
  19. Chen, C.F.; Wang, J.; Yu, T.X.; Li, Y.; Zou, Y.S.; Ma, X.F.; Liu, L. Proppant Migration Law in Fractures of Conglomerate Reservoirs of Wuerhe Formation in Mahu Sag. Xinjiang Pet. Geol. 2021, 42, 559–564. [Google Scholar]
  20. Gao, Y.; Zhang, W.; Qin, J.H.; Liang, L.X.; Zhang, J. Numerical Simulation of the Effect of Gravel on the Mechanical Characteristics of Sand Conglomerate. Sci. Technol. Eng. 2021, 21, 1745–1751. [Google Scholar]
  21. Zhang, W.; Gao, Y.; Liang, L.X. Rock mechanics characteristics of conglomerate reservoir and its effects on fracturing treatment. Fault-Block Oil Gas Field 2021, 28, 541–545. [Google Scholar]
  22. He, X.D.; Ma, J.X.; Liu, G.; Shi, S.Z.; You, J.; Wu, J.T. Analysis of Rock Mechanics and Assessments of Hydraulic Fracture Network in Conglomerate Reservoirs of Mahu Oilfield. Xinjiang Pet. Geol. 2019, 40, 701–707. [Google Scholar]
  23. Rui, Z.H.; Guo, T.K.; Feng, Q.; Qu, Z.; Qi, N.; Gong, F. Influence of gravel on the propagation pattern of hydraulic fracture in the glutenite reservoir. J. Pet. Sci. Eng. 2018, 165, 627–639. [Google Scholar] [CrossRef]
  24. Wang, S.; Qin, J.H.; Yang, X.P.; Li, X.S.; Zhang, Y.; Wang, Y.W. Stress Simulation of Vertical Hydraulic Fracture Propagation Mechanism in Tight Conglomerate Reservoirs of Mahu Area. Xinjiang Pet. Geol. 2020, 41, 193–198. [Google Scholar]
  25. Yu, Z.C.; Wang, Z.Z.; Jiang, Q.P.; Wang, J.; Feng, Y.; Zheng, J.; Baffour, B.A. Evaluation of low permeability conglomerate reservoirs based on petrophysical facies: A case study from the Triassic Baikouquan Formation, northern Mahu Sag, Junggar Basin, China. J. Pet. Sci. Eng. 2022, 219, 111082. [Google Scholar] [CrossRef]
  26. Zou, Y.S.; Shi, S.Z.; Zhang, S.C.; Yu, T.; Tian, G.; Ma, X.; Zhang, Z. Experimental modeling of sanding fracturing and conductivity of propped fractures in conglomerate: A case study of tight conglomerate of Mahu sag in Junggar Basin, NW China. Pet. Explor. Dev. 2021, 48, 1383–1392. [Google Scholar] [CrossRef]
  27. Li, G.; Shu, L.; Jian, X.; Li, Z.; Wang, Z.H. Numerical Simulation for Mechanical Properties of Conglomerate Based on Irregular Particles. Sci. Technol. Eng. 2022, 22, 8660–8665. [Google Scholar]
  28. Luo, P.; Li, Y.M.; Jiang, Y.S.; Li, Y. Research on micro-morphology characteristics of hydraulic fractures for conglomerate reservoir. Pet. Geol. Recovery Effic. 2013, 20, 103–106. [Google Scholar]
  29. Li, H.; Yang, C.H.; Ma, H.L.; Shi, X.; Zhang, H.; Dong, Z. A 3D grain-based creep model (3D-GBCM) for simulating long-term mechanical characteristic of rock salt. J. Pet. Sci. Eng. 2020, 185, 106672. [Google Scholar] [CrossRef]
  30. Li, L.C.; Li, G.; Meng, Q.M.; Wang, H.; Wang, Z. Numerical simulation of propagation of hydraulic fractures in glutenite formation. Rock Soil Mech. 2013, 34, 1501–1507. [Google Scholar]
  31. Yu, D.H.; Xu, K.T.; Che, H.; Zhang, D.W.; Liu, G.H.; Ma, X.F. Numerical simulation on hydraulic fracture propagation in glutenite reservoir based on microscopic damage multiphase coupling. Oil Drill. Prod. Technol. 2016, 38, 352–358. [Google Scholar]
  32. Chan, H.-K. Densest columnar structures of hard spheres from sequential deposition. Phys. Rev. E 2011, 84, 050302. [Google Scholar] [CrossRef] [PubMed] [Green Version]
  33. Mughal, A.; Chan, H.K.; Weaire, D. Phyllotactic Description of Hard Sphere Packing in Cylindrical Channels. Phys. Rev. Lett. 2011, 106, 115704. [Google Scholar] [CrossRef] [PubMed] [Green Version]
  34. Pickett, G.T.; Gross, M.; Okuyama, H. Spontaneous Chirality in Simple Systems. Phys. Rev. Lett. 2000, 85, 3652–3655. [Google Scholar] [CrossRef]
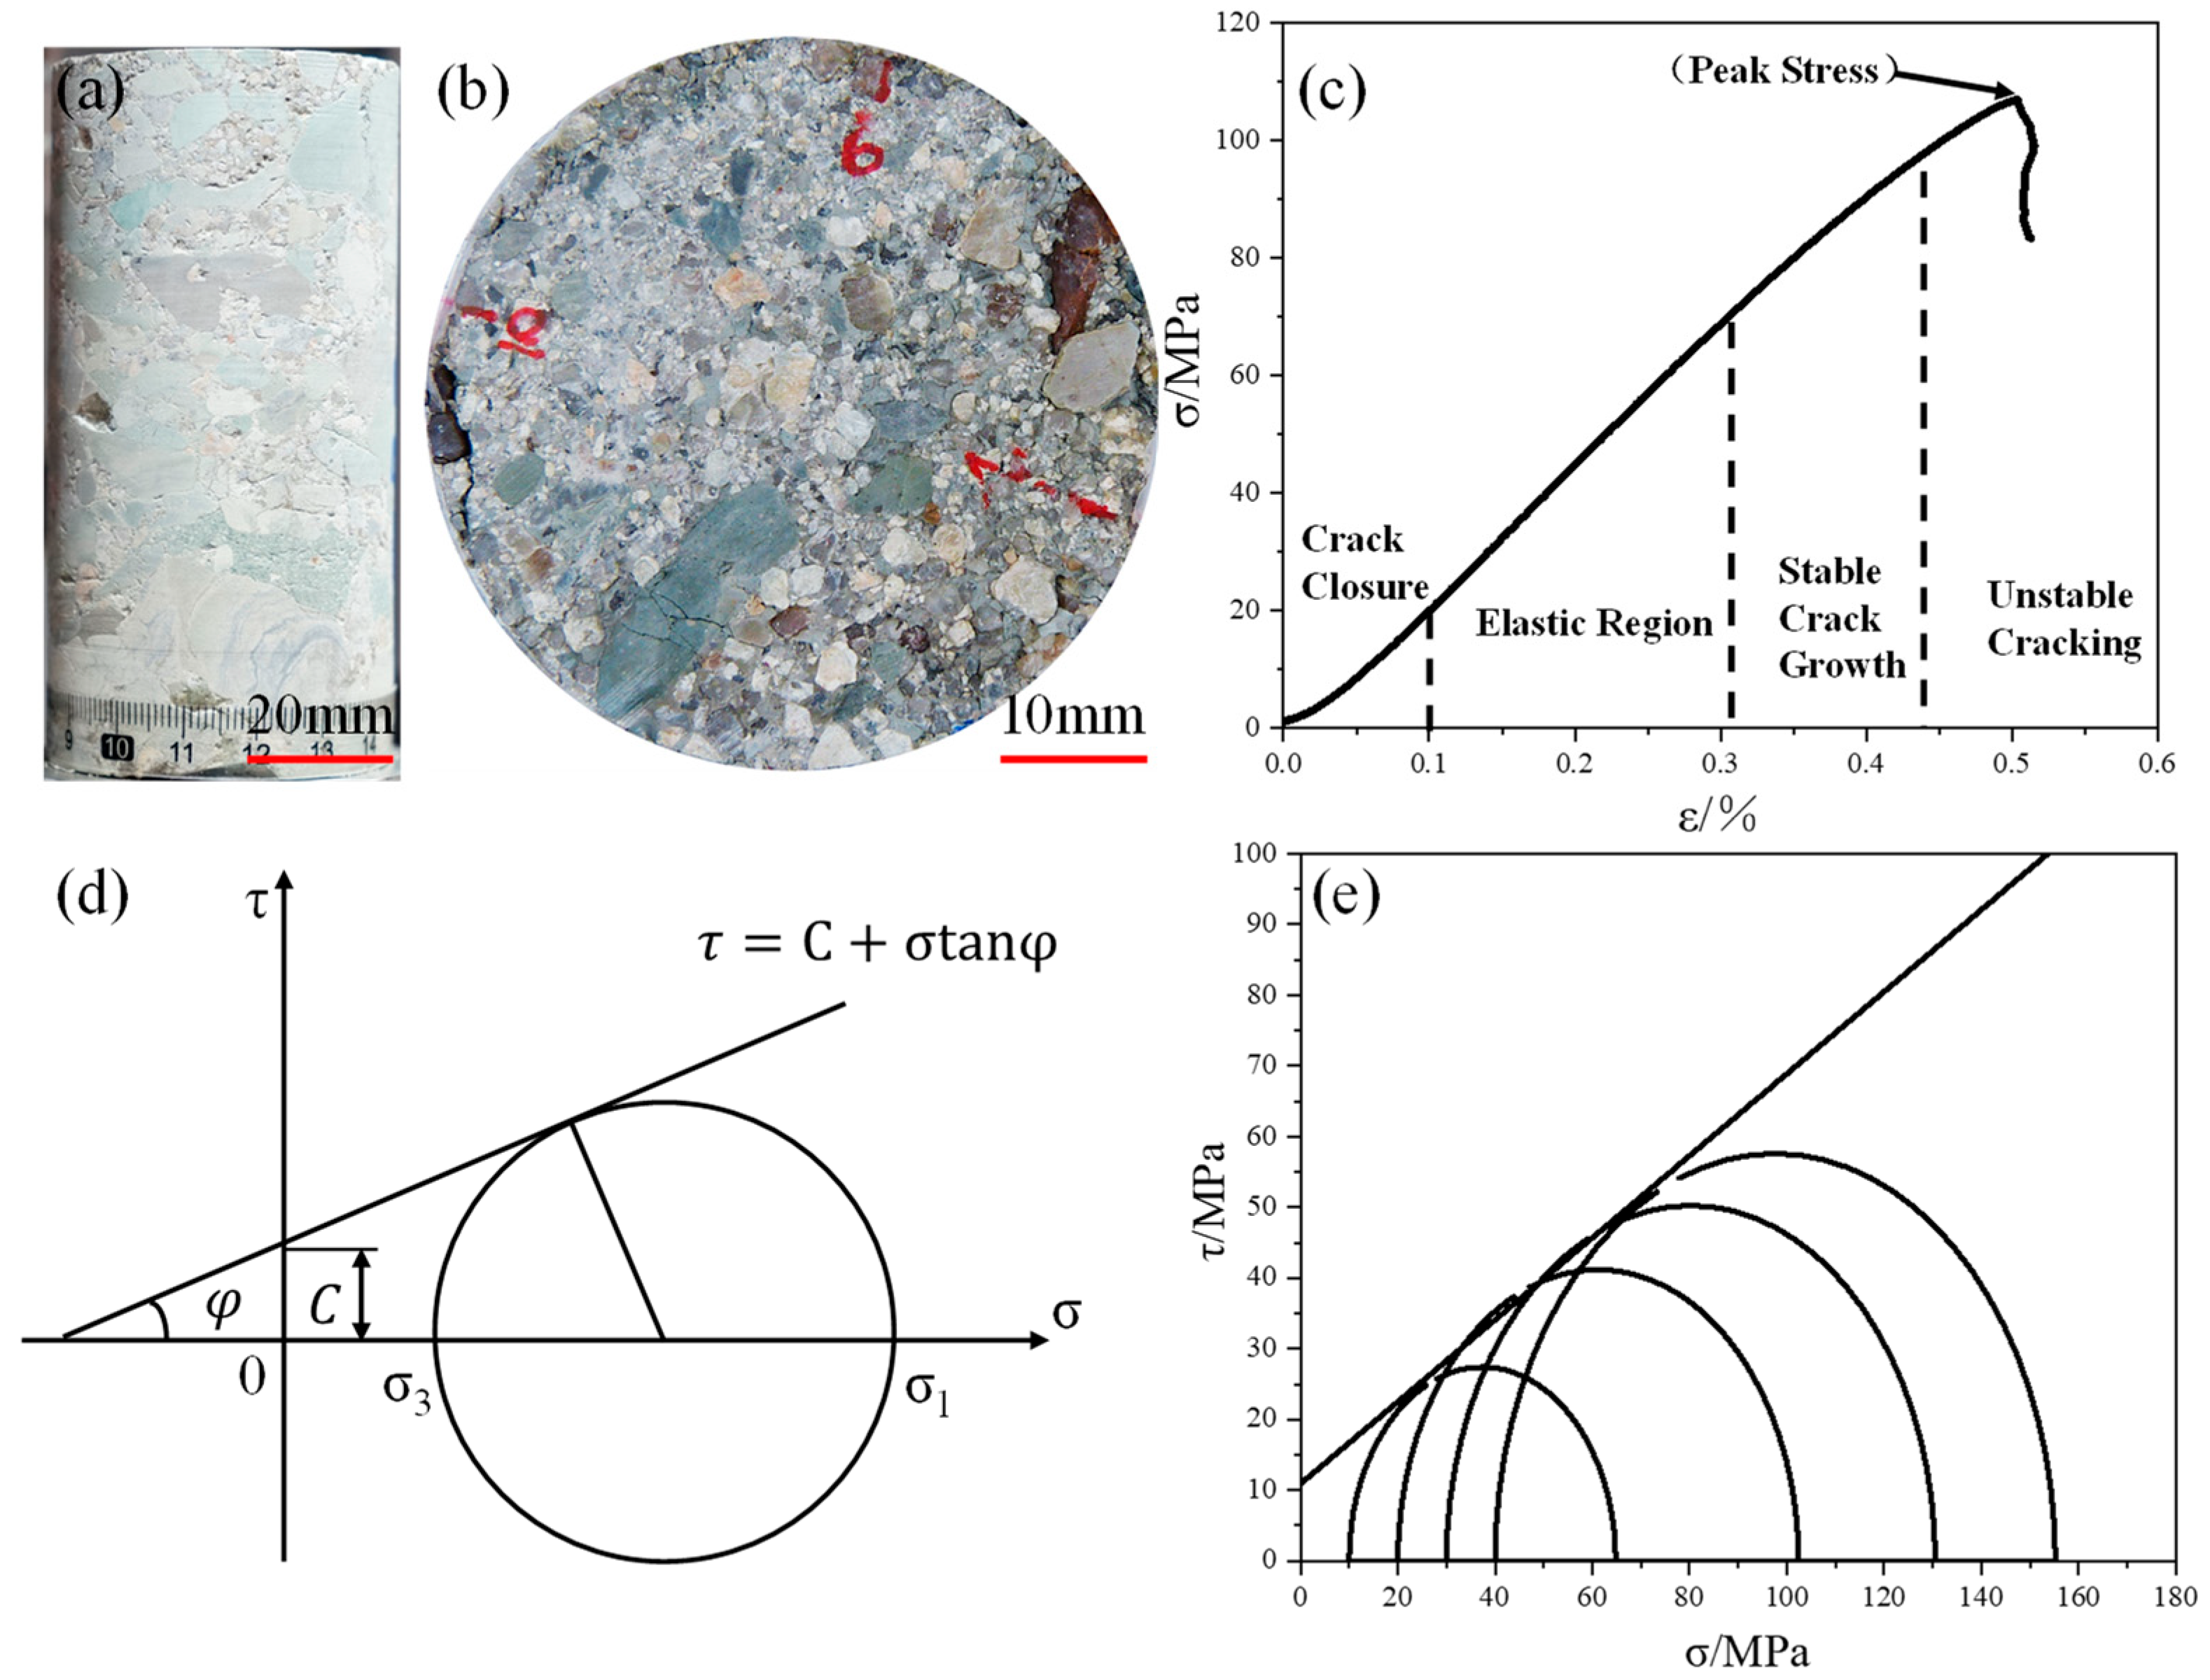
Figure 1. Conglomerate specimens and typical stress-strain curves.(a) Side view of conglomerate specimen; (b) End view of conglomerate samples; (c) Typical stress-strain curve; (d) Mohr stress circle; (e) Mohr stress circle under different confining pressure.
Jmse 11 01219 g001
Figure 2. Rheological components (a,b) and behavior (c,d) of the linear model and linear parallel bond model.
Jmse 11 01219 g002
Figure 3. Electron microscope scan of conglomerate (a,c) and its corresponding elemental analysis (b,d).
Jmse 11 01219 g003
Figure 4. The conglomerate specimen (a),real gravel (b) and numerical model of conglomerates (f) and different shapes of gravel models (ce).
Jmse 11 01219 g004
Figure 5. (a) Stress-strain curves of uniaxial compression physical experiments on conglomerates; (b) Relationship between gravel content and UCS; (c) Stress-strain curves of conglomerate triaxial compression physical experiments; (d) Mohr stress circle.
Jmse 11 01219 g005
Figure 6. Physical experimental fractures under microscope (a,b) and CT scan (c,d) in conglomerate.
Jmse 11 01219 g006
Figure 7. Gravel edge stress diagram with chain gravel (a), block gravel (b), and spherical gravel (c).
Jmse 11 01219 g007
Figure 8. Stress-strain curve of numerical simulation. (a) Stress-strain curves at different gravel contents; (b) Relationship between gravel content and UCS.
Jmse 11 01219 g008
Figure 9. Numerical simulation of 2D crack image (ad) and 3D crack image (eh).
Jmse 11 01219 g009
Figure 10. Stress-strain curves for different gravel contents under different confining pressures. (a) Stress-strain curve under 10 MPa circumferential pressure; (b) Stress-strain curve under 20 MPa circumferential pressure; (c) Stress-strain curve under 30 MPa circumferential pressure; (d) Stress-strain curve under 40 MPa circumferential pressure.
Jmse 11 01219 g010
Figure 11. Mohr stress circle and damaged envelope. (a) Mohr stress circle with 10% gravel content; (b) Mohr stress circle with 20% gravel content; (c) Mohr stress circle with 30% gravel content; (d) Mohr stress circle with 40% gravel content; (e) Mohr stress circle with 50% gravel content; (f) Mohr stress circle with 60% gravel content; (g) Mohr stress circle with 70% gravel content; (h) Mohr stress circle with 80% gravel content; (i) Mohr stress circle with 90% gravel content.
Jmse 11 01219 g011
Figure 12. Conglomerate fracture map at different scales. (a,b) Electron microscope scan of conglomerate; (c) Conglomerate diagram under optical microscope.
Jmse 11 01219 g012
Figure 13. Fracture rosette diagram for different gravel contents. (a) Fracture rosette diagram with 10% gravel content; (b) Fracture rosette diagram with 20% gravel content; (c) Fracture rosette diagram with 30% gravel content; (d) Fracture rosette diagram with 40% gravel content.
Jmse 11 01219 g013
Figure 14. Conglomerate fracture rupture process diagram. (a) The first type of fracture rupture process; (b) The second type of fracture rupture process.
Jmse 11 01219 g014
Table 1. Table of model parameters.
Contact PropertyEffective Young’s Modulus (Pa)Tensile Strength(Pa)Cohesion
(Pa)
Friction Coefficient
Ball to ball1 × 1091 × 1071 × 1070.57
Ball to clump1 × 1061 × 1065 × 1060.3
Table 2. Table of mechanical parameters for different gravel contents.
Gravel Content (%)102030405060708090
UCS (MPa)Confining Stress10 MPa64.86157.556.653.452.951.449.848.5
20 MPa102.49589.286.782.781.379.376.974.8
30 MPa130.5121.7112.3109105.4103.4100.297.294.6
40 MPa155.2144.6132.1127.8124.5121.2116.6113.4110.7
C (MPa)10.910.711.2511.5210.4110.7510.8910.6410.43
Φ (°)30.12128.1925.2724.0824.0523.0521.8521.1620.54
Disclaimer/Publisher’s Note: The statements, opinions and data contained in all publications are solely those of the individual author(s) and contributor(s) and not of MDPI and/or the editor(s). MDPI and/or the editor(s) disclaim responsibility for any injury to people or property resulting from any ideas, methods, instructions or products referred to in the content.