Abstract
In recent years, fuzzy dispersion entropy (FDE) has been proposed and used in the feature extraction of various types of signals. However, FDE can only analyze a signal from a single time scale during practical application and ignores some important information. In order to overcome this drawback, on the basis of FDE, this paper introduces the concept of multiscale process and proposes multiscale FDE (MFDE), based on which an MFDE-based feature extraction method for ship-radiated noise is proposed. The experimental results of the simulated signals show that MFDE can reflect the changes in signal complexity, frequency, and amplitude, which can be applied in signal feature extraction; in addition, the measured experimental results demonstrate that the MFDE-based feature extraction method has a better feature extraction effect on ship-radiated noise, and the highest recognition rate is 99.5%, which is an improvement of 31.9% compared to the recognition rate of a single time scale. All the results show that MFDE can be better applied to the feature extraction and identification classification of ship-radiated noise.
1. Introduction
With the improvement of comprehensive national power, the exploration of oceans has increased. Ships are one of the most important carriers in ocean activities [1,2,3], and the feature extraction and identification of ship-radiated noise emitted by these vessels is of crucial concern in hydroacoustic research [4,5]. However, by the complex marine environment and sound production principles, ship-radiated noise collected in both air and underwater media exhibits non-stationary, non-Gaussian, and nonlinear characteristics [6,7,8,9,10,11], and the traditional methods of processing noise signals cannot effectively process it. Therefore, this paper investigates a method that can effectively analyze ship-radiated noise in response to this issue.
In recent years, many scholars have studied feature extraction methods related to ship-radiated noise. Among them, Ni Jun Shuai et al. [12] proposed a method based on deep learning that extracts the features of ship-radiated noise by analyzing its spectral characteristics, Mel-frequency cepstrum coefficient, and power spectrum characteristics. Li Yu Xing et al. [13] proposed a feature extraction method of ship-radiated noise based on variational mode decomposition (VMD) and center frequency. Hu Wei Wen [14] proposed a feature extraction method of the ship-radiated signal based on wavelet energy spectrum. Li Guo Hui et al. [15] proposed a feature extraction method of ship-radiated noise based on regenerated phase-shifted sinusoid-assisted empirical mode decomposition (EMD), mutual information, and differential symbolic entropy. Xu Yuan Chao [16] proposed a method for the special diagnosis of ship-radiated noise based on bi-logarithmic scale spectrum and convolutional network. However, most of these methods are based on time and frequency domain angles, which is insufficient in the actual signal feature extraction and can only reflect the information from one scale.
Entropy is a nonlinear dynamical index [17,18] that has been widely used in recent years for various applications including ship-radiated noise feature extraction, by virtue of its ability to provide a measure of the uncertainty and irregularity of nonlinear signals [19,20,21,22,23,24], and many scholars have improved entropy in various aspects in order to improve its performance. In 2002, Bandt and Pompe [25] proposed the concept of permutation entropy (PE) for describing the complexity of time series and chaotic dynamical systems, which is also widely used in various types of hydroacoustic signal feature extraction due to its simpler algorithm, faster computation, and better noise immunity. To overcome the problem that entropy is constrained by data length in the calculation, Richman et al. [26] proposed the concept of sample entropy (SE) in 2014, which is able to reduce the calculation error in the case of more data loss and has less impact on the data calculation results compared to other entropies [27]. In 2016, Mostafa Rostaghi and Hamed Azami [28] proposed the concept of dispersion entropy (DE) to address the loss of amplitude information in PE and the long computation time of SE in long signals, achieving outstanding results in ship-radiated noise feature extraction. In 2022, Mostafa Rostaghi et al. [29] also combined DE and fuzzy affiliation function to propose the concept of fuzzy DE (FDE), which uses a fuzzy affiliation function to reduce the information loss of the original signal in the calculation process, but it has not been applied to the analysis of ship-radiated noise.
However, FDE is analyzed at a single time scale when the signal is distributed in multiple scales, and there is a risk that signal information from other scales will be missed when the analysis is performed only from a single scale [30]. In order to obtain the complexity of signals at different time scales, the concept of multiscale is introduced in this paper [30,31,32,33] combined with FDE. Then, a new concept of multiscale FDE (MFDE) is proposed to obtain the complexity of analyzed signals at different scales. In addition, based on MFDE, we propose a new ship-radiated noise feature extraction method, and its various performances are verified by simulation and realistic signals experiments, respectively.
The main contributions of this paper are as follows: on the basis of FDE, coarse granulation processing is introduced for the first time, and MFDE is proposed, which can obtain more features and extract more useful information than FDE; in addition, a MFDE-based ship-radiated noise feature extraction method is proposed, which achieves accurate recognition of different types of ships.
The overall structure of this paper is as follows: Section 2 details the calculation steps of DE, FDE, and MFDE and the steps of the MFDE-based feature extraction method; Section 3 verifies the availability of FDE by means of several sets of simulated signals and investigates the effect of different parameter variations on the entropy value of MFDE; Section 4 explores the effectiveness of MFDE for the feature extraction and recognition of ship-radiated noise under different features; Section 5 summarizes the whole article.
2. Theory and Method
2.1. Dispersion Entropy
DE is an index to measure the complexity of time series, which is often used as a feature for time series feature extraction. The detailed calculation steps of the DE for a specific time series can be described as:
Step 1: Use the normal cumulative distribution function (NCDF) to normalize the series and obtain a new series . The NCDF is described as follows:
where and , respectively, represent the mean and variance of the sequence X.
Step 2: Map the series to a new series through the round function. The calculation formula is described as follows:
where is the number of classes and is the -th element of , whose interval is an integer between 1 to .
Step 3: Given embedding dimension and time delay , the phase space reconstruction of the is performed based on the following method:
Step 4: Obtain each embedding vector that corresponds to one dispersion mode :
Step 5: Calculate the probability of each dispersion mode according to the following equation:
where is the number of embedding vectors mapped to .
Step 6: Calculate the DE value of the sequence :
Step 7: Normalize the DE value as follows:
2.2. Fuzzy Dispersion Entropy
Aiming at the problem that fuzzy entropy renders the calculation value of the original short signal unreliable, the concept of fuzzy membership is introduced to replace the round function method of DE. The calculation process of FDE is described as follows:
Step 1: The time series is processed by NCDF to obtain , and the steps of NCDF are the same as in Equation (1).
Step 2: Apply the following function to a linear transformation of series :
where is the number of classes and is the -th element of .
Step 3: Use the fuzzy membership function to fuzzy treat sequence ; different intervals will also correspond to different functions, as follows for the fuzzy functions used in this study:
Step 4: Given the embedding dimension and time delay , the embedding vector can be obtained by phase space reconstruction according to the following formula:
Step 5: Calculate the membership degree of each phase space reconstruction component to obtain the membership degree of each dispersion mode:
Step 6: Compute the probability of each dispersion mode. The process is described as follows:
where denotes the summary of the membership degrees of the dispersion mode .
Step 7: Calculate FDE according to the theory of Shannon entropy. The calculation formula is as follows:
Step 8: Normalize the FDE value as follows:
2.3. Multiscale Fuzzy Dispersion Entropy
In order to retain as much time series information as possible while reducing data length and computation time, this study introduces the concept of coarse granulation based on the FDE and proposes the MFDE, as well as the specific process, as follows:
Step 1: Coarse granulation processing is applied to the time series, and the series is decomposed into a new subsequence by setting different scales, where the coarse granulation formula is described as follows:
where is scale factor and is the new subseries with scale factor . When , the new subseries is the same as the original series.
Step 2: Calculate the FDE value of the subseries according to the steps in Section 2.2. The final formula is described as follows:
2.4. The Proposed Ship-Radiated Noise Feature Extraction Method
Based on the MFDE proposed in Section 2.3, we propose a feature extraction method for ship-radiated noise with the following steps:
Step 1: Input different types of ship-radiated noise and select the same number of samples in each signal, while the number of sample points in each sample is kept the same.
Step 2: Calculate the MFDE values of the selected samples at scales as the dataset and label these values according to the ship-radiated noise.
Step 3: Randomly select 60% of the samples as the training set from the dataset and the remaining 40% as the test set.
Step 4: Introduce the k-nearest neighbor (KNN) classifier to classify the dataset starting from features (with an initial value of 1 for ) and calculate the classification recognition rate under the current number of features based on the classification results.
Step 5: Add 1 to the number of selected features and repeat the experiment in Step 4 until the classification recognition rate is satisfactory or the number of features is equal to .
It should be noted that the ratio of the training and test sets selected in this paper is 3:2 based on the previous studies [21]. Figure 1 shows the flow chart of the proposed feature extraction method.
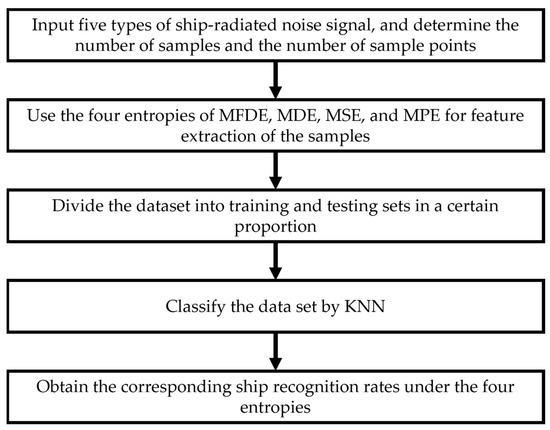
Figure 1.
The flow chart of the proposed feature extraction method.
3. Simulation Signal Feature Extraction Analysis
In this section, we mainly verify the performance of FDE at multiple scales by some simulation signals and discuss the parameter selection in FDE and the simulated signals, including Gaussian white noise, amplitude-modulated chirp signal, and various noise.
3.1. Gaussian White Noise Simulation Experiment
In this experiment, Gaussian white noise is used to compare the FDE and DE value changes in the sequence length. Gaussian white noise is a random signal of a power spectral density to be constant. In this section, 50 groups of Gaussian white noise with different lengths are chosen for the comparison experiments, and the length of the time series is also increased from 100 to 1000 in intervals of 100. Then, the FDE and DE values of these Gaussian white noise are calculated at scales of 2 and 5, respectively, and the rest of the parameters, including and , are all set to 3. Figure 2 shows the multiscale results of the FDE and DE of Gaussian white noise at different lengths.
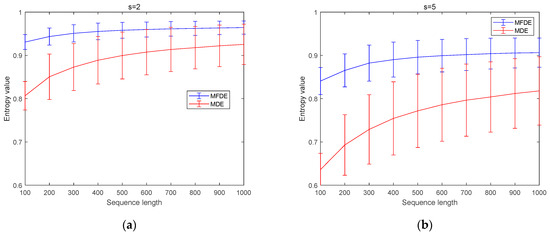
Figure 2.
Multiscale results of FDE and DE of Gaussian white noise at different lengths (a) = 2; (b) = 5.
From Figure 2, we can observe that, no matter = 2 or = 5, as the length of Gaussian white noise increases, the values of both MFDE and MDE tend to be closer to 1, indicating that the longer the length of the time series, the more information can be extracted. Further, it should be noted that MFDE is closer to 1 than DE, which means that MFDE can better reflect the complexity of the signal; in addition, in terms of stability, the standard deviation of MFDE is also smaller compared with MDE, regardless of the length of the signal, which indicates that MFDE is more stable in terms of entropy value compared with MDE. In conclusion, the entropy value of FDE is more stable than that of DE at multiple scales, and it can reflect the complexity of the signal more effectively.
3.2. Amplitude-Modulated Chirp Signal Simulation Experiment
This experiment is conducted by amplitude-modulated chirp signal to compare the sensitivity of FDE to changes in the frequency and amplitude of time series at multiple scales. The amplitude-modulated chirp signal is generated by cosine amplitude modulation debugging, and its frequency and amplitude will change continuously with time, and its equation is as follows:
where is the chirp signal, with a frequency increasing from an initial 5 Hz to a final 30 Hz. is the carrier amplitude and is the frequency of the debugging signal. Set ,. Figure 3 shows the amplitude-modulated chirp signal domain waveform; its length is 20 s, and the sampling frequency is 1000 Hz.
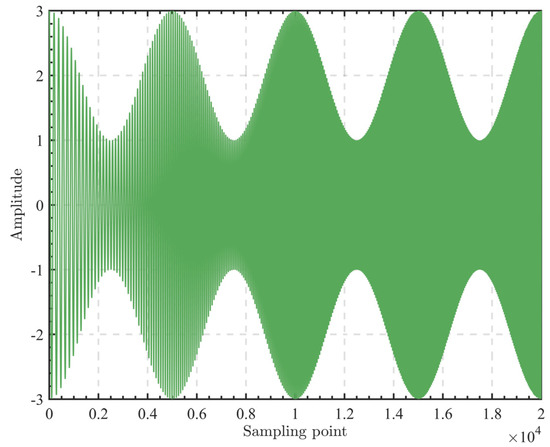
Figure 3.
Amplitude-modulated chirp signal domain waveform (1000 Hz).
As can be seen from the Figure 3, the frequency of the signal becomes increasingly faster as time increases, while the maximum amplitude shows a trend of oscillation. In this experiment, a sliding window of length 1 s is set up, and the distance of each slide is 0.1 s, which means that there is a 90% overlap between adjacent sliding windows. In this way, a total of 190 windows can be obtained, and the FDE and DE values of these windows are calculated, where the parameters and are all set to 3. Figure 4 shows the FDE and DE variation curves of amplitude-modulated chirp signal at multiple scales; = 2 and = 5 are chosen in this experiment.
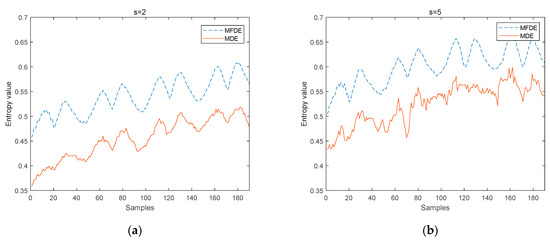
Figure 4.
FDE and DE variation curves of amplitude-modulated chirp signal at multiple scales: (a) = 2; (b) = 5.
It can be seen from Figure 4 that the curves of MFDE and MDE show a growing trend, regardless of whether = 2 or = 5, corresponding to the ever-faster frequency of the time domain waveform in Figure 3, indicating that both MFDE and MDE can detect the frequency change of the time series with each other; in addition, the amplitude change of MFDE is more stable compared to MDE at each , and in the case of = 5, the amplitude change of MDE is haphazard and difficult to effectively respond to the amplitude change of the amplitude-modulated chirp signal, indicating that MFDE is more accurate in detecting the amplitude change of the time series compared to MDE. In short, FDE can detect the frequency and amplitude changes of time series at multiple scales and is better compared to DE.
3.3. Various Noise Simulation Experiments
The above comparison experiments mainly verify the various types of capabilities of MFDE in detecting dynamic changes in time series. In this subsection, we introduce various types of noise and demonstrate the influence of parameters by comparing their differentiation capabilities under different combinations of parameters. Where white noise has equal energy spectral distribution, blue noise and pink noise have higher energy spectral distribution in the low and high frequency range, respectively.
First, we discuss the embedding dimension in the MFDE calculation process, which controls the number of elements contained in the pattern and has a great influence on the entropy value. Twenty groups of white, blue, and pink noise, each with a length of 5000 sample points, are randomly selected to calculate their MFDE values, where the number of categories = 3; the time delay = 1; the embedding dimension is chosen in order of 2, 3, 4, 5, and 6; and the scale changes from 1 to 20 in increments of 1. Figure 5 shows the MFDE of three types of noise with different embedding dimensions and scales.
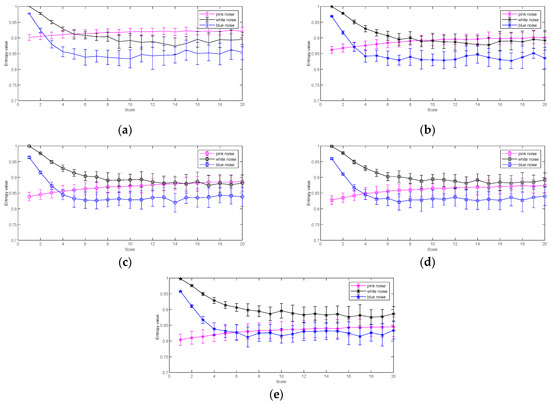
Figure 5.
MFDE of three types of noise with different embedding dimensions and scales: (a) = 2; (b) = 3; (c) = 4; (d) = 5; (e) = 6.
From Figure 5, we can observe that regardless of the embedding dimension, the MFDE values of the pink noise show an increasing trend as the embedding dimension increases, while the entropy values of the remaining two types of noise show the opposite trend; in terms of separability, except for = 2, the separability of the three types of noise in the remaining subgraphs is similar, and the three types of noise can be distinguished at low scales, but it is difficult to distinguish at high scales; in terms of stability, the standard deviations at different embedding dimensions are also similar, and all of them become progressively larger as the scale increases. Therefore, we can conclude that the standard deviation has little effect on the MFDE value, and we suggest that should be an integer between 3 and 6.
Next, we focus on the effect of another important parameter, which is . As the category, controls the range of element values and has a great influence on the entropy value. The overall experimental procedure is the same as the embedding dimension experiment, where the embedding dimension is fixed to 3; the time delay ; is chosen to be 3, 4, 5, 6, 7, and 8; and the scale is increased from 1 to 20 in increments of 1. Figure 6 shows the MFDE of three types of noise with different categories and scales.
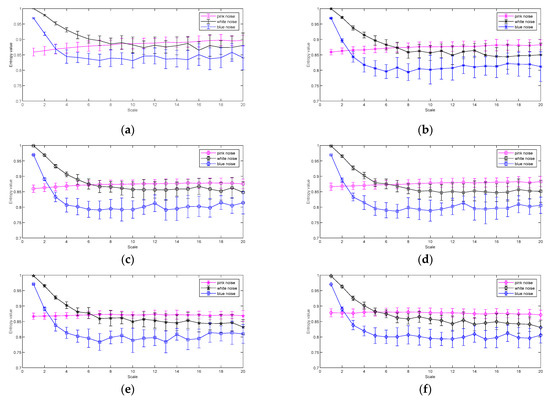
Figure 6.
MFDE of three types of noise with different categories and scales: (a) = 3; (b) = 4; (c) = 5; (d) = 6; (e) = 7; (f) = 8.
From Figure 6, it can be seen that with the increase in scale, the trend of the MFDE of each category of noise is the same as Figure 5. Further, with the increase in the number of categories, the MFDE values of each category of noise do not change much. In addition, with the same , the standard deviation of MFDE becomes gradually larger with the increase in scale. In brief, the change in the number of categories has no significant effect on MFDE, and the smaller the scale, the more stable the MFDE; thus, we suggest that the number of categories can be taken as an integer between 3 and 8.
In summary, we suggest that in MFDE, is taken from 3 to 6 and is taken from 3 to 8; further, it is important to note that regardless of whether or is set smaller, the time consumption will be shorter. On the contrary, setting them larger requires greater computational resources but may produce stronger separability.
4. Experiments for Ship-Radiated Noise
4.1. Introduction of the Ship-Radiated Noise and Experimental Parameter Setting
In this section, we compare the recognition rates of four entropies in the classification of ship-radiated noise under different scale and scale combinations, using them to verify the application capability of MFDE in the feature extraction and classification recognition of ship-radiated noise. The four types of entropies and their parameter combinations chosen are set as follows: MFDE (, , ); MDE (, , ); MSE (, , ); and MPE (, ). In addition, five types of ship-radiated noise are selected for comparison in this section, including Cruise Ship Underwater Recording, State Ferry Hydrophone Recording, Freighter Hydrophone Recording, Small Diesel Engine Hydrophone Recording, and Outboard Engine Whine and Acceleration, naming them SHIP I, SHIP II, SHIP III, SHIP IV, and SHIP V, respectively, all with a sampling frequency of 44.1 kHz; more details can be found in [34].
4.2. Single Feature Analysis Experiment
This subsection focuses on the feature extraction effect of FDE on various types of ship-radiated noise at a single scale. For each ship-radiated noise, 300 samples are selected, each consisting of 2048 non-overlapping sampling points. Figure 7 shows the feature distribution of MFDE at 10 scales.
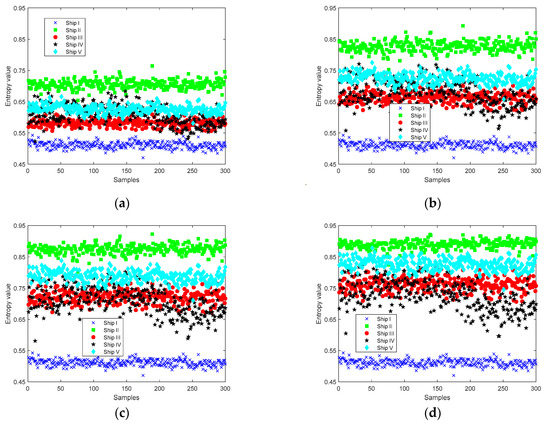
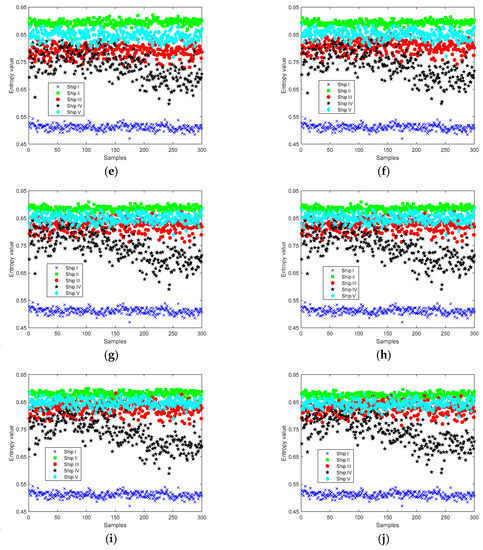
Figure 7.
Feature distribution of MFDE at 10 scales. (a) s = 1; (b) ; (c) ; (d) ; (e) ; (f) ; (g) ; (h) ; (i) ; (j) .
It can be seen from Figure 7 that as the scale increases, the degree of confusion of the signals increases, except for Ship I, and the differentiation effect is better at low scale; at scale 1, some samples of Ship I are difficult to distinguish from Ship IV, but as the scale increases, the differentiation effect of these two types of noise increasingly improves. The experimental results show that the entropy feature performs better at low scales; this is because single scale time series are longer and contain more information, but combining different scales can distinguish the easily confused ship-radiated noise.
To further study the effect of MFDE on ship-radiated noise classification at different single scales, we introduce the ship-radiated noise feature extraction method in Section 2.4 and use the features under each type of entropy single scale as the input. Table 1 shows the recognition rate of different entropy under different single features.

Table 1.
Recognition rate of different entropy under different single features.
As can be seen from Table 1, the recognition of the ship-radiated noise improves first and then decreases as the scale increases, with the highest recognition rates of 81%, 71.83%, 73.83%, and 76% for MFDE, MDE, MSE, and MPE, respectively. In the case of a single feature, the average recognition rate of MFDE is the highest among the four types of entropy. In addition, MFDE always has the highest recognition rate for five types of ship under different scale factors compared to the other four entropies. In summary, the proposed MFDE has a stronger feature extraction ability and a higher recognition rate of ship-radiated noise in the case of a single feature.
4.3. Double-Number Feature Analysis Experiment
Although the recognition rate of MFDE is the highest with a single feature, it only reaches 81%, and the recognition effect is not obvious. This experiment compares the feature extraction ability and recognition rate of MFDE, MDE, MSE, and MPE for ship-radiated noise under the condition of combining double-number features, and further studies the ability of MFDE for ship-radiated noise analysis. Due to the high number of scale combinations under the double-number feature, in this experiment, only the scale combinations under the highest recognition rate are analyzed. Figure 8 shows the feature distribution of four types of entropy under the double-number feature.
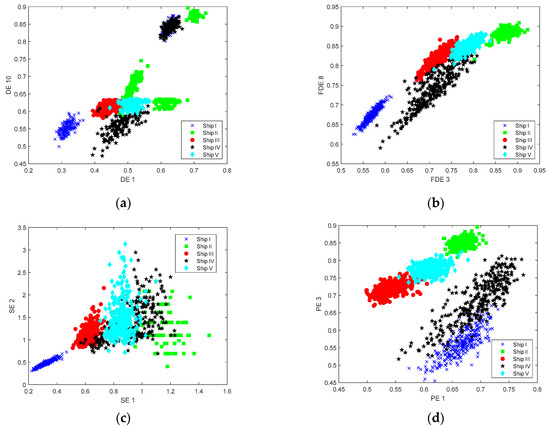
Figure 8.
Feature distribution of four types of entropy under double-number feature. (a) MDE; (b) MFDE; (c) MSE; (d) MPE.
As can be seen from Figure 8, the entropy distribution of MFDE has the lowest degree of confounding at the condition of the highest recognition rate, and the interval between the entropy of various types of ships is more obvious; in the entropy distribution plots of MDE, MSE, and MPE, each type of signal has different degrees of confounding. The experimental results show that MFDE has better feature extraction than other entropies.
To further explore their classification recognition results, we use the feature extraction method in Section 2.4 to classify the ship-radiated noise, where the input is the double-number features. Table 2 shows the highest recognition rate of double-number features. It can be seen from Table 2 that MFDE achieves the highest recognition rate of 99% when the scale combinations are 2 and 9; in contrast, the recognition rates for MDE and MSE are 93.83% and 90.67%, respectively, and the lowest recognition rate for MPE is 64.83%. The experimental results show that the average recognition rate of all four types of entropy under the double-number feature is further improved compared with the single-number feature; the recognition rate of MFDE is still the highest among the four types of entropy, which proves the advantage of MFDE under double-number features for applying the feature extraction and classification recognition of ship-radiated noise.

Table 2.
Highest recognition rate of double-number features.
4.4. Triple-Number Feature Analysis Experiment
In order to further improve the classification recognition rate of ship-radiated noise and thus highlight the feature extraction effect of MFDE more intuitively, based on the double-number features, this experiment conducts a comparative experiment on triple-number feature extraction. This experiment still demonstrates the advantages of MFDE by comparing the feature extraction ability and ship-radiated noise recognition rate of MFDE with other three entropies (MDE, MSE, and MPE). Moreover, since there are more combinations of triple-number features compared to double-number, this experiment only analyzes the scale combinations at the highest recognition rate. Figure 9 shows the feature distribution of four types of entropy under triple-number features.
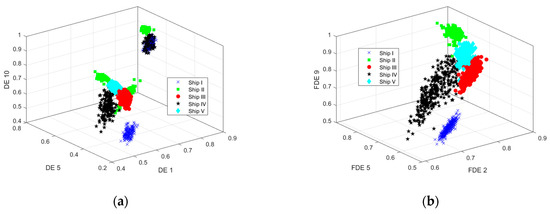
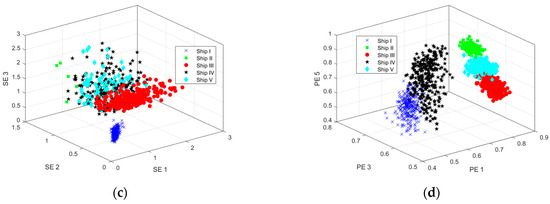
Figure 9.
Feature distribution of four types of entropies under triple-number features. (a) MDE; (b) MFDE; (c) MSE; (d) MPE.
As can be seen from Figure 9, the interval between the various types of ship-radiated noise of MFDE is more obvious with the highest recognition rate, and the overlap between the signals is lower, while there are different degrees of overlap between the various types of signals of MDE, MSE, and MPE. The experimental results show that MFDE has a better feature extraction effect and stronger differentiability than the other three entropies.
To further explore the classification recognition performance of MFDE, we use the three-number features as input to the ship-radiated noise feature extraction method. Table 3 shows the highest recognition rate of triple-number features. As can be seen from Table 3, the highest recognition rate of MFDE reaches 99.5% under the scale combinations of 2, 5, and 9, while the recognition rates of MDE and MPE are 97.67% and 90.67%, respectively; the recognition rate of MSE is the lowest at 45.17%. The experimental results show that the recognition rates of all four entropies under the triple-number feature are further improved compared with the double-number feature; meanwhile, the recognition rate of MFDE is still the highest among the four entropies, which proves the advantage of MFDE in the application of ship-radiated noise feature extraction and classification recognition under the triple-number feature.

Table 3.
Highest recognition rate of triple-number features.
Figure 10 shows the recognition rate of three types of entropy under different numbers of features. From Figure 10, it can be seen that the entropy recognition rates of three types of MFDE, MDE, and MPE increase, and MSE decreases as the number of features increases; moreover, the recognition rate of MFDE is the highest for all numbers of features, which reflects better complementarity between features at different scales in MFDE. The results further demonstrate that MFDE performs best for the feature extraction and classification recognition of ship-radiated noise.
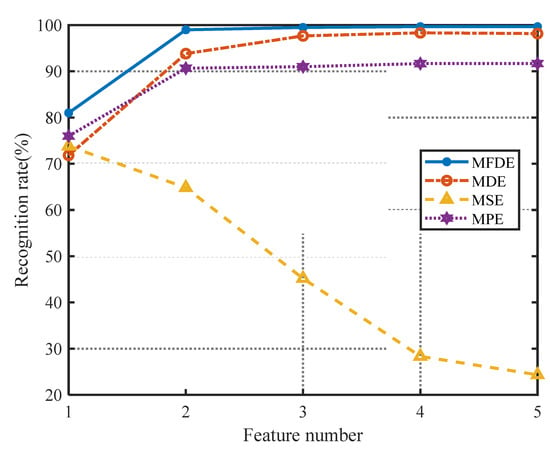
Figure 10.
Recognition rate of three types of entropy under different numbers of features.
5. Conclusions
In this paper, an improved time series complexity analysis method based on FDE is proposed, called MFDE, which combines the calculation method of FDE and the process of coarse granulation to obtain multiscale features. In addition, based on MFDE, we propose a new ship-radiated noise feature extraction method, with the main conclusions as follows:
The experiment of the simulated signals show that comparing the MDE, the MFDE at different scales can better reflect the change in time series complexity and has better sensitivity to the signal and better feature extraction ability; the realistic experiments show that compared to feature extraction based on methods other than commonly used entropy, MFDE-based feature extraction methods have the highest recognition rate for ship-radiated noise under a different number of features, and the highest recognition rate is 99.50% for ship-radiated noise under triple-number features, indicating that the MFDE-based feature extraction method has better performance in the feature extraction and classification of ship-radiated noise; we also expect that MFDE can be applied to other types of signal analysis.
In addition, MFDE relies on the length of the signal, which leads to a decrease in performance and stability when analyzing shorter signals. Therefore, how to reduce or even eliminate the impact of signal length on MFDE is our future research direction.
Author Contributions
Y.L. (Yuxing Li): conceptualization, methodology, software, writing—original draft. Y.L. (Yilan Lou): data curation, writing––review and editing, software. L.L.: visualization, funding acquisition. S.Z.: investigation, supervision. All authors have read and agreed to the published version of the manuscript.
Funding
This research was funded by the National Natural Science Foundation of China (grant no. U2034209) and the Natural Science Foundation of Shaanxi Province (grant no. 2022JM-337).
Institutional Review Board Statement
Not applicable.
Informed Consent Statement
Not applicable.
Data Availability Statement
The datasets analyzed during the current study are available from the corresponding author on reasonable request.
Conflicts of Interest
The authors declare no conflict of interest.
References
- Li, Y.; Tang, B.; Jiao, S. SO-slope entropy coupled with SVMD: A novel adaptive feature extraction method for ship-radiated noise. Ocean Eng. 2023, 280, 114677. [Google Scholar] [CrossRef]
- Fredianelli, L.; Bolognese, M.; Fidecaro, F.; Licitra, G. Classification of Noise Sources for Port Area Noise Mapping. Environments 2021, 8, 12. [Google Scholar] [CrossRef]
- Fredianelli, L.; Nastasi, M.; Bernardini, M.; Fidecaro, F.; Licitra, G. Pass-by Characterization of Noise Emitted by Different Categories of Seagoing Ships in Ports. Sustainability 2020, 12, 1740. [Google Scholar] [CrossRef]
- Bernardini, M.; Fredianelli, L.; Fidecaro, F.; Gagliardi, P.; Nastasi, M.; Licitra, G. Noise Assessment of Small Vessels for Action Planning in Canal Cities. Environments 2019, 6, 31. [Google Scholar] [CrossRef]
- Fernandes, J.D.V.; De Moura, N.N.; de Seixas, J.M. Deep Learning Models for Passive Sonar Signal Classification of Military Data. Remote Sens. 2022, 14, 2648. [Google Scholar] [CrossRef]
- Urick, R.J. Principles of Underwater Sound, 3rd ed.; McGraw-Hill: New York, NY, USA, 1983. [Google Scholar]
- Musha, T.; Shinohara, A. Evaluation of ship radiated noise level from near-field measurements. Appl. Acoust. 1993, 40, 69–78. [Google Scholar] [CrossRef]
- Yoon, J.; Ro, Y.; Chun, J. Effective analysis technique of unstable acoustic signature from ship radiated noise. J. Acoust. Soc. Am. 2001, 109, 2296–2297. [Google Scholar] [CrossRef]
- Yang, S.; Li, Z.; Wang, X. Ship recognition via its radiated sound: The fractal based approaches. J. Acoust. Soc. Am. 2002, 112, 172–177. [Google Scholar] [CrossRef]
- Badino, A.; Borelli, D.; Gaggero, T.; Rizzuto, E.; Schenone, C. Airborne noise emissions from ships: Experimental characterization of the source and propagation over land. Appl. Acoust. 2016, 104, 158–171. [Google Scholar] [CrossRef]
- Siddagangaiah, S.; Li, Y.; Guo, X.; Chen, X.; Zhang, Q.; Yang, K.; Yang, Y. A Complexity-Based Approach for the Detection of Weak Signals in Ocean Ambient Noise. Entropy 2016, 18, 101. [Google Scholar] [CrossRef]
- Ni, J.; Zhao, M.; Hu, C. Multi-feature fusion classification of ship radiated noise based on deep learning. Tech. Acoust. 2020, 39, 366–371. [Google Scholar]
- Li, Y.; Li, Y.; Chen, X.; Yu, J. Feature extraction of ship-radiated noise based on VMD and center frequency. J. Vib. Shock. 2018, 37, 213. [Google Scholar]
- Weiwen, H.U.; Bingcheng, Y.; Peng, Y.; Liping, J. Modeling Method for Feature of Ship Radiated Noise Based on Wavelet Power Spectrum. J. Syst. Simul. 2007, 19, 4025–4027. [Google Scholar]
- Li, G.; Yang, Z.; Yang, H. Feature Extraction of Ship-Radiated Noise Based on Regenerated Phase-Shifted Sinusoid-Assisted EMD, Mutual Information, and Differential Symbolic Entropy. Entropy 2019, 21, 176. [Google Scholar] [CrossRef] [PubMed]
- Xu, Y.; Cai, Z.; Kong, X. Classification of Ship Radiated Noise Based on Bi-Logarithmic Scale Spectrum and Convolutional Network. J. Electron. Inf. Technol. 2022, 44, 1947–1955. [Google Scholar]
- Costa, M.; Peng, C.K.; Goldberger, A.L.; Hausdorff, J.M. Multiscale entropy analysis of human gait dynamics. Phys. A Stat. Mech. Appl. 2003, 330, 53–60. [Google Scholar] [CrossRef]
- Porta, A.; Guzzetti, S.; Montano, N.; Furlan, R.; Pagani, M.; Malliani, A.; Cerutti, S. Entropy, entropy rate, and pattern classification as tools to typify complexity in short heart period variability series. IEEE Trans. Biomed. Eng. 2001, 48, 1282–1291. [Google Scholar] [CrossRef]
- Li, Y.; Geng, B.; Tang, B. Simplified coded dispersion entropy: A nonlinear metric for signal analysis. Nonlinear Dyn. 2023, 111, 9327–9344. [Google Scholar] [CrossRef]
- Li, H.; Du, W.; Fan, K.; Ma, J.; Ivanov, K.; Wang, L. The Effectiveness Assessment of Massage Therapy Using Entropy-Based EEG Features Among Lumbar Disc Herniation Patients Comparing with Healthy Controls. IEEE Access 2020, 8, 7758–7775. [Google Scholar] [CrossRef]
- Li, Y.; Jiao, S.; Geng, B. Refined composite multiscale fluctuation-based dispersion Lempel–Ziv complexity for signal analysis. ISA Trans. 2023, 133, 273–284. [Google Scholar] [CrossRef]
- Shannon, C.E. A Mathematical Theory of Communication. Bell Syst. Tech. J. 1948, 27, 379–423. [Google Scholar] [CrossRef]
- Li, Y.; Tang, B.; Geng, B.; Jiao, S. Fractional Order Fuzzy Dispersion Entropy and Its Application in Bearing Fault Diagnosis. Fractal Fract. 2022, 6, 544. [Google Scholar] [CrossRef]
- Chen, W.; Wang, Z.; Xie, H.; Yu, W. Characterization of Surface EMG Signal Based on Fuzzy Entropy. IEEE Trans. Neural Syst. Rehabil. Eng. 2007, 15, 266–272. [Google Scholar] [CrossRef]
- Bandt, C.; Pompe, B. Permutation Entropy: A Natural Complexity Measure for Time Series. Phys. Rev. Lett. 2002, 88, 174102. [Google Scholar] [CrossRef]
- Richman, J.S.; Randall, M.J. Physiological time-series analysis using approximate entropy and sample entropy. Am. J. Physiol. Heart Circ. Physiol. 2000, 278, H2039. [Google Scholar] [CrossRef] [PubMed]
- Pincus, S.M. Approximate entropy as a measure of system complexity. Proc. Natl. Acad. Sci. USA 1991, 88, 2297–2301. [Google Scholar] [CrossRef]
- Rostaghi, M.; Azami, H. Dispersion Entropy: A Measure for Time-Series Analysis. IEEE Signal Process. Lett. 2016, 23, 610–614. [Google Scholar] [CrossRef]
- Rostaghi, M.; Khatibi, M.M.; Ashory, M.R.; Azami, H. Fuzzy Dispersion Entropy: A Nonlinear Measure for Signal Analysis. IEEE Trans. Fuzzy Syst. 2021, 30, 3785–3796. [Google Scholar] [CrossRef]
- Zhang, X.; Zhang, M.; Wan, S.; He, Y.; Wang, X. A bearing fault diagnosis method based on multiscale dispersion entropy and GG clustering. Measurement 2021, 185, 110023. [Google Scholar] [CrossRef]
- Costa, M.; Goldberger, A.L.; Peng, C.K. Multiscale Entropy Analysis of Complex Physiologic Time Series. Phys. Rev. Lett. 2002, 89, 068102. [Google Scholar] [CrossRef]
- Costa, M.; Goldberger, A.L.; Peng, C.K. Multiscale entropy analysis of biological signals. Phys. Rev. E Stat. Nonlinear Soft Matter Phys. 2005, 71, 021906. [Google Scholar] [CrossRef] [PubMed]
- Humeau-Heurtier, A.; Wu, C.-W.; Wu, S.-D. Refined Composite Multiscale Permutation Entropy to Overcome Multiscale Permutation Entropy Length Dependence. IEEE Signal Process. Lett. 2015, 22, 2364–2367. [Google Scholar] [CrossRef]
- National Park Service. Available online: https://www.nps.gov/glba/learn/nature/soundclips.htm (accessed on 20 January 2023).
Disclaimer/Publisher’s Note: The statements, opinions and data contained in all publications are solely those of the individual author(s) and contributor(s) and not of MDPI and/or the editor(s). MDPI and/or the editor(s) disclaim responsibility for any injury to people or property resulting from any ideas, methods, instructions or products referred to in the content. |
© 2023 by the authors. Licensee MDPI, Basel, Switzerland. This article is an open access article distributed under the terms and conditions of the Creative Commons Attribution (CC BY) license (https://creativecommons.org/licenses/by/4.0/).