Abstract
The organic-rich shale of the Permian Taiyuan Formation (TYF) and Shanxi Formation (SXF) in the Southern North China Basin (SNCB) is considered a potential shale gas source. The shale was formed in a marine-continental transitional sedimentary environment, which has rarely been studied, with the enrichment mechanisms of organic matter (OM) remaining unclear. This study investigated the controlling factors and enrichment mechanisms of OM by analyzing the total organic carbon (TOC) content, paleoclimate, paleoproductivity, sedimentation rate, redox, and paleosalinity. The TOC of the TYF ranged from 0.92 to 7.43 wt.%, with an average of 2.48 wt.%, which was higher than that of the SXF (TOC = 0.36–5.1 wt.%, average of 1.68 wt.%). These geochemical indices suggest that both the TYF and SXF were deposited in warm and humid paleoclimates, with relatively high biological productivity and sedimentation rates. During the deposition process, the TYF experienced frequent transgression and regression events, leading to an enhancement of water reducibility, a relatively high sedimentation rate, reduced OM oxidation, and rapid deposition of OM, which were conducive to the preservation of OM. Moreover, a high biological productivity increased respiratory oxygen consumption in the water column, which could lead to OM accumulation. However, the regression event experienced by the SXF reduced the paleoproductivity and sedimentation rate and increased water oxidation, leading to a decrease in OM. The main controlling factors for the enrichment of OM in the TYF and SXF were the sedimentation rate, paleoproductivity, and redox conditions, thus establishing the enrichment models for OM in the TYF and SXF. This study is conducive to understanding shale enrichment mechanisms and guiding shale gas exploration.
1. Introduction
Organic-rich shale is not only a source rock of high-quality conventional oil and gas reservoirs but also a focus of shale oil and gas exploration. It can record important paleoclimatic and paleoenvironmental information (such as paleotemperature, paleoredox, and paleoproductivity) relating to when it is deposited, thus possessing significant value from a scientific research perspective [1,2,3]. Furthermore, as noted above, study of organic-rich shale also contributes critical information to oil and gas exploration activities, including both understandings of source rock in conventional petroleum systems [4] and of reservoir rock in unconventional shale gas and shale oil systems [5], and is critical to the evolving understanding of potentially exploitable gas hydrate resources [6,7]. Currently, significant progress has been made in marine and continental shale gas research; however, there is little research on marine-continental transitional shale gas. Marine-continental transitional facies are widely distributed in China, often with multiple lithologies coexisting and rapid changes in lithofacies, and the source and composition of organic matter are complex [8]. Therefore, compared with marine or terrestrial strata, they have distinct characteristics and are a potentially important area of unconventional oil and gas exploration in China.
The accumulation of organic matter (OM) is a complex physicochemical process [9,10]. Previous studies have shown that owing to the complex geological, oceanographic, and climatic histories, it is impossible for a single factor to explain OM accumulation in a sedimentary environment [11]. The accumulation and preservation of OM are controlled and affected by paleoclimate, paleoproductivity, sedimentation rate, redox, and paleosalinity [12,13,14]. Generally, elemental geochemistry [2] and organic geochemistry [15] are used to qualitatively reconstruct paleoenvironment [16,17,18]. Several redox-sensitive elements (such as V, U, and Ni) and their ratios (such as U/Th, V/Cr, Ni/Co, and V/(V + Ni)) have been widely used to explain ancient redox conditions [2,19]. Important geochemical indicators that qualitatively characterize paleoclimate include the chemical index of alteration (CIA) and the C-value [20,21,22].
Factors controlling OM enrichment in marine environments have been widely studied. From different influence mechanisms, they can be divided into the “productivity model” and the “conservation model” [23,24]. In the productivity model, organic matter input is the main reason for its enrichment. In the preservation model, it is believed that the factors of high salinity and anoxic sedimentary environments are the main conditions for the enrichment of organic matter. Unlike marine shale, marine-continental transitional shale is deposited in a sea-and-land interaction environment, with rapid facies changes on the plane, and complex enrichment mechanism of OM, leading to large differences in OM enrichment factors between marine shale and marine-continental transitional shale.
The SNCB is the largest sedimentary basin in China. The Permian is widely distributed and well developed, and its sedimentary types are diverse and rich in biological fossils [25]. The main strata of shale gas in the SNCB are the TYF and SXF, and the shale kerogen is generally type III [26,27]. There are few studies on Permian shale in the SNCB; the geological conditions are complex, and the sedimentary and tectonic evolution are changeable [25]. Presently, the amount of research on shale gas in this area is low [25], and an OM enrichment model has not been established, restricting the objective evaluation of shale gas resources in the basin [28].
This study measured and analyzed TOC, major elements, trace elements, and rare-earth elements to reconstruct the paleoclimate, paleoproductivity, sedimentation rate, paleoredox, and paleosalinity of the Permian TYF and SXF in the SNCB to reveal the enrichment mechanisms of OM in the SNCB, which provide an important basis for shale exploration in this area.
2. Geological Background
Located south of the North China Block and its southern margin (Figure 1), the SNCB is mainly controlled by the structure of the Qinling–Dabian orogenic belt [29]. From the distribution characteristics of the Mesozoic and Cenozoic in the basin, the SNCB is divided from north to south into five structural units: the Kaifeng Depression, the Taikang Uplift, the Zhoukou Depression, the Bengbu Uplift, and the Xinyang Hefei Depression (Figure 1) [29,30,31].
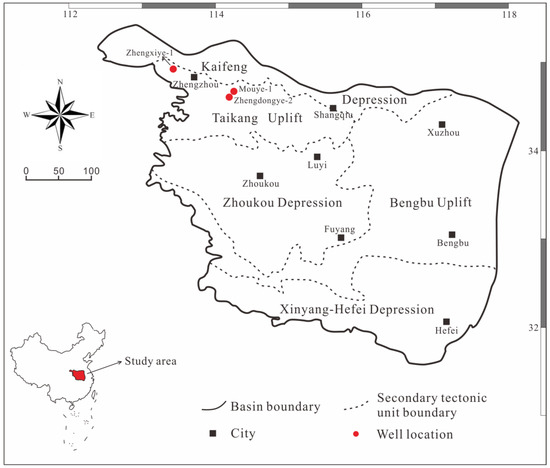
Figure 1.
Simplified structural block map of the SNCB with investigated well location.
From the Late Ordovician to the Middle Carboniferous, the SNCB was uplifted due to the Caledonian movement. Owing to long-term weathering and denudation, most parts of the region lack Upper Ordovician, Silurian, Devonian, and lower Carboniferous strata [31,32]. Subsequently, Lower Permian marine-continental transitional strata were immediately deposited on the Upper Ordovician limestone [32]. Controlled by regional tectonic movements, the sedimentation process can be subdivided into three stages. First, Late Carboniferous seawater invaded from the northeast to southwest, forming a unified North China epicontinental sea basin. In this environment, the thickness of the Early Permian sediments is 30–175 m. Second, the collision between the North China and Siberian plates caused large-scale tectonic movement and regression from north to south. The main sedimentary environment in the Permian was a shallow water delta, which transitioned from the epicontinental sea through regression. Finally, the North China plate was uplifted again by compression during the Late Permian, resulting in the complete withdrawal of seawater from the North China platform and the formation of a continental sedimentary environment [26,31,32,33]. In general, the sedimentary environment of the North China platform from the Early to the Late Permian experienced both marine-continental transitional and lacustrine environments.
The Mouye-1 (MY1) well, drilled in 2014, was the first shale gas exploration well in the SNCB, and shale gas was found in the Upper Paleozoic strata. The Weican-1 well, drilled in the same year, encountered OM-rich shale with a cumulative thickness of 465 m in the Shihezi, TYF, SXF, and Benxi Formations. The Zhengxiye-1 (ZXY1) well, drilled in 2015, also saw good shale gas in the Permian SXF and TYF [34,35]. As of July 2020, the MY1, Zhengdongye-2 (ZDY2), and ZXY1 wells had been drilled northwest of the SNCB to explore for shale gas (Figure 1) [35]. The shale thicknesses in the TYF of the MY1, ZDY2, and ZXY1 wells are 54 m, 31 m, and 12 m, respectively, and the thicknesses of the SXF are 44 m, 14 m, and 16 m, respectively. From the cores, it is apparent that the lithology of the TYF is mainly grayish black mudstone, dark gray limestone, grayish black sandstone, dark gray sandstone, and dark gray shale, with thin layers of siltstone, coal lines, and barrier coastal facies. The lithology of the SXF is dominated by grayish black mudstone, carbonaceous mudstone, silty mudstone, fine sandstone, and sandstone, which are delta facies (Figure 2).
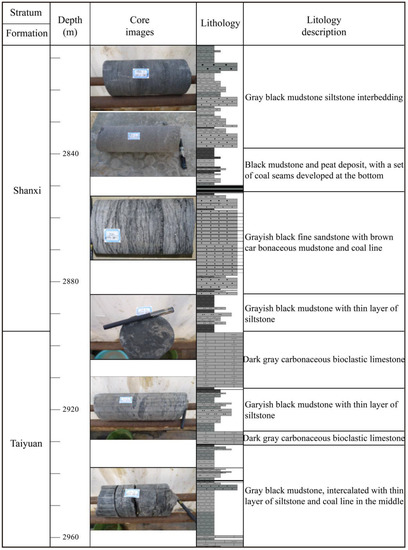
Figure 2.
The stratigraphic column of the Lower Permian Shanxi and Taiyuan Formations (MY1 well) in the Southern North China Basin. (The stratigraphic column data mainly come from core logging and later artificial correction based on the core).
3. Sampling and Methods
Overall, 62 core samples (39 from MY1, 16 from ZDY2, and 7 from ZXY1) were selected from the study area, including 33 samples from the TYF and 29 samples from the SXF. The samples from Well MY1 included both TYF and SXF. The samples from Well ZDY2 were mainly from the TYF, while those from Well ZXY1 were mainly from the SXF. The lithology is mainly shale with a small amount of coal. The TOC content, major elements (ME), trace elements (TE), and rare-earth elements (REE) of all samples were measured and analyzed.
3.1. TOC Analysis
First, powder with the size of 200 meshes was treated using chemical methods in accordance with the Chinese Standard GB/T19145-2003, and then the sample (100 mg) was treated with 5% HCl for 24 h to remove the inorganic carbon component. Finally, a Leco® CS744 analyzer (Equipment source: LECO, St. Joseph, MI, USA) was used to measure the organic carbon content with an accuracy of ±0.5%.
3.2. Major Element Analysis
The primary elements (Si, Al, Fe, K, Na, Ca, Mg, Mn, Ti, and P) were tested using the XRF (X-ray fluorescence) method. The XRF tester was a Rigaku ZSX-100e. To mix the organic matter-removed sample (powder) and Li2B4O7 evenly, they were poured into a platinum crucible, placed in a high-frequency heating-dissolving machine, and heated to 1150 °C. The melted mixed sample was poured onto a glass sheet and finally placed into an XPF instrument for testing.
3.3. Trace and Rare-Earth Element Analysis
The TE and REE contents were measured using an Agilent 7500a inductively coupled plasma mass spectrometer (ICP-MS), with an analysis error lower than 5%. The sample (powder) with the removed OM was subjected to acid dissolution (HF/HNO3/HClO4 = 2:2:1). The treated samples were then heated in a pressure-tight Teflon bomb at 200 °C for 48 h, and the resulting liquid was analyzed using inductively coupled plasma mass spectrometry (ICP-MS). The analytical procedures followed the Chinese National Standards GB/T 14506.1~14-2010 (2010) and GB/T 14506.30-2010 (2010).
4. Results
4.1. TOC
The TOC content of the TYF shale was 0.92–7.43 wt.%, with an average of 2.48 wt.% and a median of 2.24 wt.%. The TOC of coal was 54.45–66.55 wt.%, with an average of 60.5 wt.%. Approximately 51.52 wt.% of the samples were >2 wt.%, which indicates a good source rock [4] (Table 1; Figure 3). The TOC of the SXF shale was 0.36–5.1 wt.%, with an average of 1.68 wt.% and a median of 1.73 wt.%, and the TOC of coal was 58.95–61.29 wt.% (average of 60.5 wt.%), of which approximately 35.48 wt.% of the samples were greater than 2 wt.% (Table 1; Figure 3). Overall, the TOC content of the Lower Permian shale in the SNCB is relatively high, with the TOC content of the shale in the TYF being higher than that in the SXF.

Table 1.
ME contents (wt%) of the TYF and SXF in the SNCB.
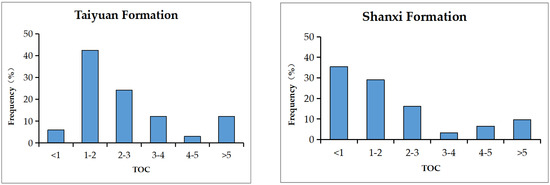
Figure 3.
TOC—frequency distribution histogram of the TYF and SXF.
4.2. Major Elements
The primary ME oxides of the TYF and SXF shale samples were SiO2, Al2O3, TFe2O3, K2O, CaO, MgO, MnO, Na2O, TiO2, and P2O5. The main ME oxides of the TYF were SiO2, Al2O3, TFe2O3, K2O, and CaO, and their contents ranged from 0.34 to 66.51 wt.% (average of 48.1 wt.%), from 0.19 to 28.61 wt.% (average of 19.27 wt.%), from 0.01 to 12.44 wt.% (average of 4.78 wt.%), from 0.02 to 6.84 wt.% (average of 4.45 wt.%), from 0.1 to 28.96 wt.% (average of 2.63 wt.%), respectively. The main ME oxides of the SXF were SiO2, Al2O3, K2O, and TFe2O3, and their contents ranged from 0.58 to 60.61 wt.% (average of 47.23 wt.%), from 0.55 to 33.71 wt.% (average of 23.12 wt.%), from 0.02 to 11.18 wt.% (average of 5.74 wt.%), and from 0.01 to 22.52 wt.% (average of 3.96 wt.%), respectively (Table 1). In general, the TYF and SXF are rich in SiO2 and comprise siliceous mudstone and argillaceous and siliceous shales (Figure 4).
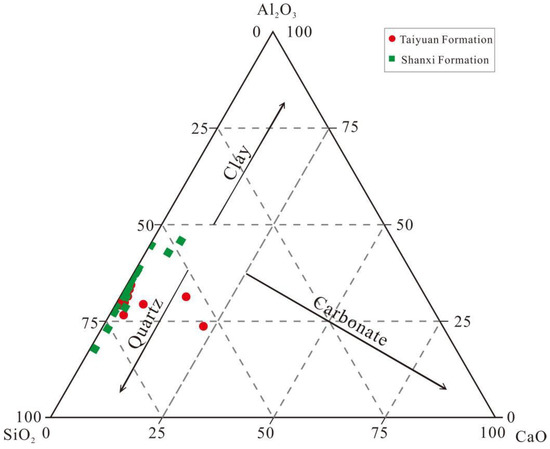
Figure 4.
SiO2−Al2O3−CaO ternary diagram for the TYF and SXF shale samples from the MY1 well.
4.3. Trace Elements
The enrichment factor (EF) values can be used to establish the degree of TE enrichment [16]. The equation for EF is as follows:
where X is the content of TEs in minerals or rocks, and Y is the content of TEs in the corresponding basic rocks.
EF = X/Y
For the TYF, TFs with obvious enrichment (EF > 1) included Sr (EF = 0.47–14.99, average of 1.58), Cr (EF = 0.58–3.63, average of 1.14), and TEs with deficit (EF < 1) were V, Co, Ni, Ba, Cu, and Zn (Table 2). For the SXF, Ni, Co and Cr showed obvious enrichment (EF > 1), which included EF (Ni) = 0.23–18.35, with an average of 2.21, EF (Co) = 0.35–3.04, with an average of 1.86, and EF (Cr) = 0.08–3.04, with an average of 1.07 (Table 2). The TES showing deficits (EF < 1) were V, Sr, Cu, and Zn. As shown in Figure 5, compared with the SXF, the shale samples from the TYF show higher EF values in most TEs, except for Co, Ni, and Ba, and the TYF is obviously enriched with Cr and Sr.

Table 2.
TE contents of the TYF and SXF in the SNCB.
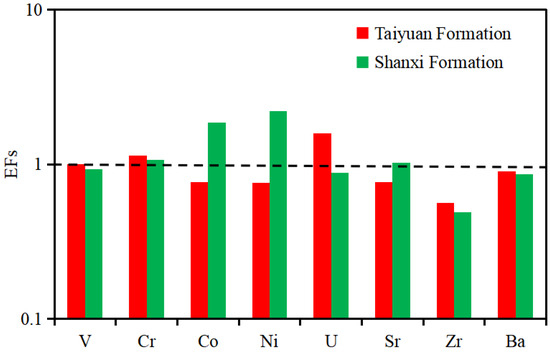
Figure 5.
EF diagram of selected TEs for the TYF and SXF shales. The horizontal line (EF = 1) separates the enrichment (above the line) or depletion (below the line) of an element.
4.4. Rare-Earth Elements
REEs and their related parameters for the TYF and SXF in the study area are listed in Table 3. Total rare-earth concentration of the shale in the TYF (ΣREE) ranged from 90.31 to 381.436 ppm, with an average of 224.36 ppm; the range of ΣREE in the SXF was 206.12–376.104 ppm, with an average of 304.21 ppm (Table 3). The average REE concentrations of the shale samples from the TYF and SXF were higher than those of the North American shale composite (NASC, 173.21 ppm) [36] and the post-Archean average Australian shale (PAAS, 184.77 ppm) [37] (Table 3).

Table 3.
REE contents (ppm) of the TYF and SXF in the SNCB.
As shown in the diagram of the PASS-normalized REE distribution patterns (Figure 6), the two curves show nearly the same trend, which may indicate that the REEs of the shale samples from the TYF and SXF come from similar sources. The REE distribution patterns have the characteristics of a relatively flat LREE (from La to Gd) and HREE (from Tb to Lu). The range of L/H (LREE/HREE) for the TYF shale was 10.04–25.36, with an average of 15.96. The L/H (LREE/HREE) of the SXF shale ranged from 12.34–19.99, with an average of 16.04 (Table 2). Ce anomaly (δ Ce) and Eu anomaly (δ Eu) was defined as δCe = CeN/(LaN × PrN)1/2 and δEu = EuN/(SmN × GdN)1/2, respectively [37]. The range of δ Ce and δ Eu for the TYF shale was 0.62–1.15 (average of 0.92) and 0.54–1.26 (average of 0.97), respectively; the δ Ce and δ Eu of the SXF shale ranged from 0.85 to 1.08 (average of 0.99) and from 0.66 to 1.34 (average of 0.98), respectively (Table 3), indicating that the Ce and Eu anomalies for the TYF and SXF shale were weakly negative.
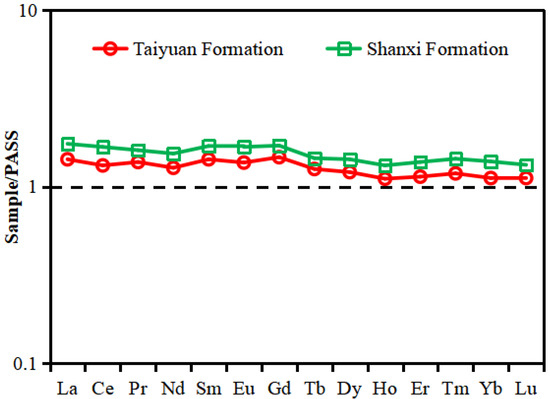
Figure 6.
PASS-normalized REE distribution patterns of the TYF and SXF shale samples [37].
5. Discussion
5.1. Paleoclimate
Paleoclimate can affect parent rock weathering, erosion, and sediment transport, and ultimately control the input of terrestrial nutrients and sediment into an ocean [38,39]. The CIA is a typical parameter for reconstructing paleoclimatic conditions [20,21] and for judging the degree of paleoweathering [40,41].
The formula is as follows:
CIA = 100 × Al2O3/(Al2O3 + CaO* + Na2O + K2O)
The MEs used in the calculations are converted into mole fractions. CaO* is CaO in silicate, that is, the mole fraction of CaO in the whole rock minus the chemically deposited CaO. For CaO* correction, we used
CaO* = CaO − (10/3 × P2O5)
After correction, the mole number of CaO* is the minimum value of Na2O and CaO [42].
Previous studies have shown that the greater the CIA value, the greater the chemical alteration and the climate changes to warmer and wetter conditions. When the CIA value ranges from 50 to 65, the degree of petrochemical weathering is low, indicating a cold and arid climate; when the CIA value ranges from 65 to 85, the degree of petrochemical weathering is medium, indicating a semi-arid and semi-humid climate; and when the CIA value ranges from 85 to 100, the degree of petrochemical weathering is high, indicating a warm and humid climate [20,40]. The CIA range of the TYF shale samples was 74.12–90.02, with an average of 85.58; The CIA range of the SXF shale samples was 80.49–95.03, with an average of 84.88 (Table 4). The paleoclimate and weathering degree of a source rock can be clarified by using the Al2O3−(CaO* +Na2O)−K2O ternary diagram (Figure 7). Both the TYF and SXF indicate a warm and humid paleoclimate with moderate to strong weathering (Figure 7 and Figure 8).

Table 4.
Paleoenvironmental condition analysis.
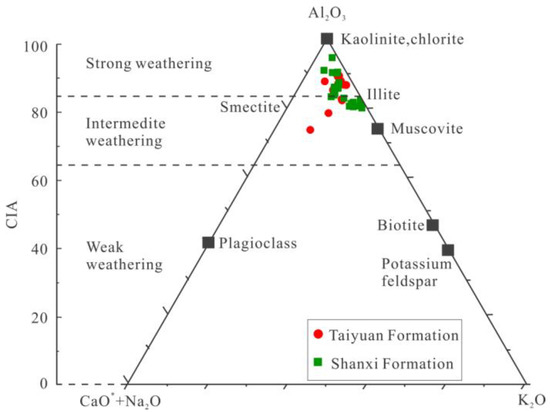
Figure 7.
Ternary diagram of molecular proportions Al2O3 − (CaO* + Na2O) − K2O. The left side shows the CIA scale. The TYF and SXF shale samples display intermediate to strong weathering [20,40].
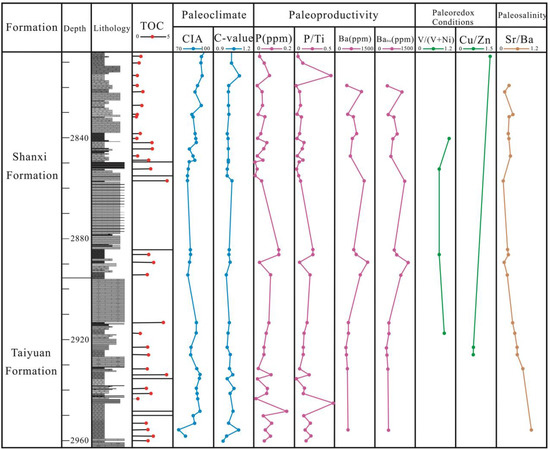
Figure 8.
Stratigraphic distributions of TOC, paleoclimate indicators (CIA and C-value), paleoproductivity-related proxies (P, P/Ti, Ba, and Babio), paleoredox indexes (V/(V + Ni) and Cu/Zn), and paleosalinity (Sr/Ba and Ca/(Ca + Fe)) in the core of the MY1 well.
The C-value, which is a ratio of transition metals to alkali elements, is also a common proxy for paleoclimate and is defined by the following formula [22]:
C-value = Σ(V + Ni + Mn + Fe + Cr + Co)/Σ(Ca + Mg + Ba + Sr + Na + K),
When the C-value < 0.4, it indicates a cold and arid climate; when the C-value range is 0.4–0.6, it indicates a semi-humid semi-arid climate; and when the C-value > 0.6, it indicates a warm and humid climate [21,22]. In this study, the C-value of the TYF shale samples ranged from 0.91 to 1.08, with an average of 1.01; the C-value of the SXF shale samples ranged from 0.99 to 1.09, with an average of 1.01 (Table 4). Based on the C-value results, the TYF and SXF were deposited in a warm and humid paleoclimate, which was conducive to the accumulation of OM (Figure 8, Figure 9 and Figure 10).
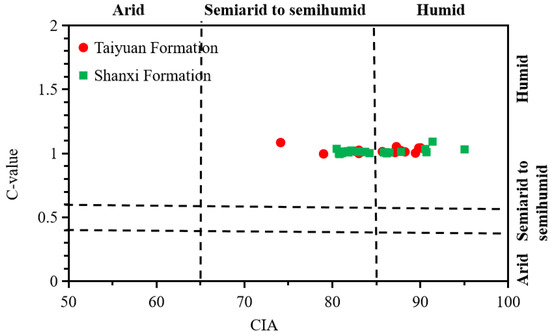
Figure 9.
CIA versus C-value of shale from the TYF and SXF.
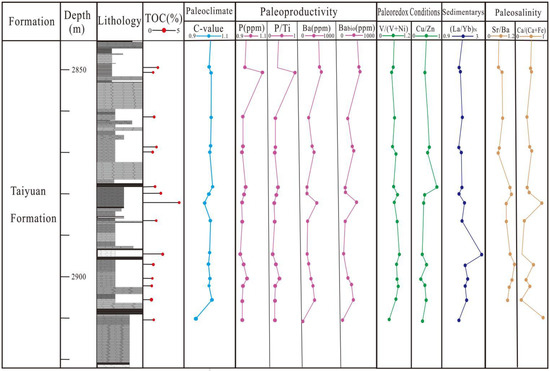
Figure 10.
Stratigraphic distributions of TOC, paleoclimate indicators (C-value), paleoproductivity-related proxies (P, P/Ti, Ba, and Babio), paleoredox indicators (V/(V + Ni and Cu/Zn), sedimentation rate ((La/Yb)N), and paleosalinity indicators (Sr/Ba and Cu/(Cu + Zn)) in the core of the ZDY2 well.
The above paleoclimate indicators (CIA and C-value) collectively indicate that the SNCB experienced a warm and humid paleoclimate during the TYF and SXF deposition period (Figure 7, Figure 8 and Figure 9). Moreover, there are no obvious differences in the CIAs and C-values for the TYF and SXF shale samples (Figure 8).
5.2. Paleoproductivity
Paleoproductivity, which is affected by water nutrients and biological activities, is a major factor in the accumulation of OM in sediments. Al, Fe, P, Ba, Cu, Zn, Ca, and Mn can be used to estimate the primary productivity [43,44]. However, firm restrictions exist for the selection of elements. P and Ba are commonly used to qualitatively assess biological productivity [2,16,17]. The elements Ba and P provide an effective assessment of the degree of primary productivity [16,17,43]. Ba is preserved as barite, while P is related to algal development [2,17].
Ba is generally combined with SO42− and exists in sediments or water bodies in the form of barite (BaSO4). Barium in sediments can be divided into terrestrial, hydrothermal, and biological sources [45]. However, only the source of Ba (Babio) accurately reflects the level of primary productivity. It is necessary to extract abiotic elements from the total elements before evaluating the primary productivity [46,47]. Schroeder et al. [47] proposed Babio’s applicable formula as follows:
where Alsample and Basample are the Al and Ba contents of the measured samples, respectively, and (Ba/Al) alusilicate = 0.0075 is a correction factor, which is used to exclude the influence of barium in terrigenous aluminosilicates. Some scholars have also used Ti instead of Al as a correction factor [48].
Babio = Batotal − Baalusilicate = Basample − Alsample × (Ba/Al)alusilicate
As shown in Figure 8, the Babio content of the TYF shale samples is 136.98–1376.11 ppm, with an average of 507.71 ppm (Table 4), while the Babio content of the SXF shale samples is 446.89–1355.71 ppm, with an average of 828.38 ppm (Table 4), indicating that the primary productivity of the SXF is higher than that of the TYF. The value of La/Ce in ancient seawater is 2.8, which is much lower than that in the hydrothermal sediments. The value of La/Ce in hydrothermal sediments is only 0.25; in comparison, the value in normal sea water is usually greater than one. The La/Ce ratio of the shale samples in the TYF is less than 1, ranging from 0.44 to 0.82, with an average value of 0.54; the La/Ce ratio of shale samples in the SXF ranges from 0.45 to 0.56, with an average value of 0.51. This indicates that the shale was affected by strong hot-water sedimentation during the deposition process and is the product of the mixture of hot-water sedimentation and normal seawater sedimentation. Because of the influence of hydrothermal deposition in the study area, it was not appropriate to use Babio to judge the paleoproductivity.
The element ratios, P/Ti, Cu/Ti, P/Al, and Cu/Al, are not affected by the supply of terrigenous clastic sediments and can indicate biological productivity [14,49,50]. A higher ratio suggests a higher level of paleoproductivity [51]. The P/Ti of the TYF shale samples ranges from 0.02 to 1.83 (average of 0.24) (Table 4), which is slightly higher than the P/Ti value of PAAS (0.12 [37]), indicating that biological productivity is relatively high. The range of P/Ti of the SXF shale samples is 0.02–0.45 (average of 0.11) (Table 4), which is slightly lower than PAAS, indicating that the paleoproductivity level is medium. According to the P/Ti value, the primary productivity of the TYF is higher than that of the SXF (Figure 8 and Figure 11).
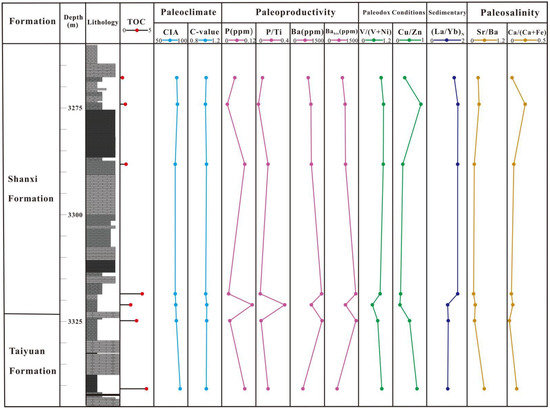
Figure 11.
Stratigraphic distributions of TOC, paleoclimate indicators (CIA and C-value), paleoproductivity-related proxies (P, P/Ti, Ba, and Babio), paleoredox indicators (V/(V + Ni) and Cu/Zn), sedimentation rate ((La/Yb)N), and paleosalinity indicators (Sr/Ba) in the core of the ZXY1 well.
5.3. Sedimentation Rate
OM enrichment is affected by sedimentation rate to some extent [48,52]. A low sedimentation rate and sustained residence time of sediments in a water column would lead to significant differences between LREE and HREE, which can be characterized using the (La/Yb)N ratio and normalized REE distribution curve [52,53,54,55]. The degree of REE fractionation and distribution patterns can be used to establish the sedimentation rate [52,53]. REEs exist in water in combination with debris and suspended solids. Owing to the different residence times in water, the degree of REE fractionation is different [54,55]. When the sedimentation rate is low, REEs have sufficient time to be adsorbed by clay minerals, resulting in a high degree of fractionation, and when the sedimentation rate is high, the situation is the opposite, meaning the sedimentation rate can be deduced from the degree of REE fractionation. Since (La/Yb)N is a reliable indicator of the degree of REE fractionation, when the value of (La/Yb)N is close to one, it indicates a high sedimentation rate and a low degree of REE fractionation, and when the (La/Yb)N value is greater than or less than one, it indicates a low sedimentation rate and a high degree of REE fractionation [56,57]. Besides that, a weak differentiation would lead to a flat REE distribution curve in sediments [54]. As shown in Figure 6, the REE distribution curve trends of the TYF and SXF are relatively gentle, indicating that the shale sedimentation rate was relatively stable during the deposition of the TYF and SXF. The (La/Yb)N value range of the TYF is 0.99–2.6, with an average of 1.27, while the (La/Yb)N value of the SXF ranges from 1.01 to 1.53, with an average of 1.33, showing a relatively high sedimentation rate (Table 4). Because the sedimentation rate of the TYF is closer to one, its sedimentation rate is higher than that of the SXF (Figure 10 and Figure 11). The high sedimentation rate of the TYF shortens the contact time between OM and bacteria, which is conducive to the preservation of OM in oxic water.
5.4. Paleoredox Conditions
TEs, such as the metallic elements U, Th, V, Cr, Ni, Cu, and Zn, are sensitive to the redox environment of water bodies because their solubility is controlled by the redox state of water bodies [19]. U, V, Cr, Ni, Cu, Zn, and other elements are easily soluble in water when the water body provides an oxidizing environment, but they are not soluble in water under reducing conditions [2]. When the water body is an oxygen-poor environment, it is enriched in sediments and almost does not migrate. This provides an indication of ancient water environment and can be used to judge the oxidation–reduction environment of its water body [2,19]. In this study, V/(V + Ni) and Cu/Zn were used to determine the redox conditions of the sedimentary environment.
When the value of V/(V + Ni) is greater than 0.6, it indicates an anoxic environment; when the value of V/(V + Ni) is between 0.46 and 0.6, it indicates a dysoxic sedimentary environment; and when the V/(V + Ni) value is less than 0.46, it indicates an oxygen deposition environment [58,59]. When the Cu/Zn value is less than 0.21, it indicates an anoxic environment; when Cu/Zn ranges from 0.21 to 0.63, it indicates a dysoxic environment; and when the value is greater than 0.63, it indicates an oxic sedimentary environment [2,60]. The V/(V + Ni) value of the TYF samples was between 0.45 and 0.91, with an average of 0.77, while the V/(V + Ni) value of the SXF samples was between 0.47 and 1, with an average of 0.76 (Table 4), indicating that the paleosedimentary environment of both the TYF and SXF was dysoxic–anoxic (Figure 10, Figure 11 and Figure 12). The Cu/Zn value of the TYF samples ranged from 0.13 to 0.7, with an average of 0.34, while the Cu/Zn value of SXF samples was between 0.2 and 1.27, with an average of 0.48 (Table 4), indicating a dysoxic–anoxic environment (Figure 10, Figure 11 and Figure 12). The values of V/(V + Ni) and Cu/Zn show that the SNCB was in a dysoxic–anoxic environment during the TYF and SXF periods (Figure 12), while the reducibility of the sedimentary environment of the TYF was slightly greater than that of the SXF.
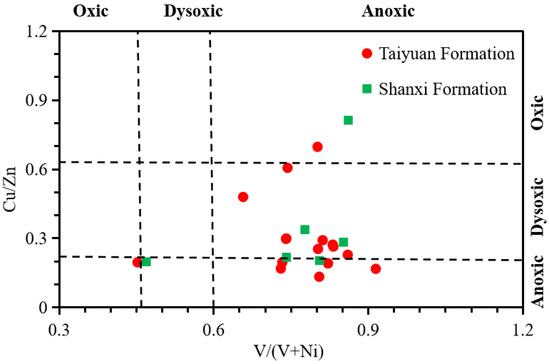
Figure 12.
A diagram of V/(V + Ni) versus Cu/Zn of the shale samples from the TYF and SXF.
5.5. Paleosalinity
The Sr/Ba ratio is an important index for judging the salinity of ancient water. Sr is more soluble in water than Ba, meaning Sr migrates further into water, and the Sr/Ba ratio can indirectly reflect continental and marine sediments [60,61,62,63,64]. A Sr/Ba value less than 0.5 indicates a freshwater environment; a value of 0.5–1.0 indicates a brackish water environment; and a value greater than 1.0 suggests a saline water environment [43]. The Sr/Ba value of the TYF samples ranged from 0.21 to 5.31, with an average of 0.78 (Table 4), indicating a freshwater–brackish water environment; the Sr/Ba value of the SXF samples ranged from 0.18 to 0.44, with an average of 0.29 (Table 4), indicating a freshwater environment, implying that the TYF belonged to marine-continental transitional facies while the SXF was continental (Figure 8, Figure 10 and Figure 13).
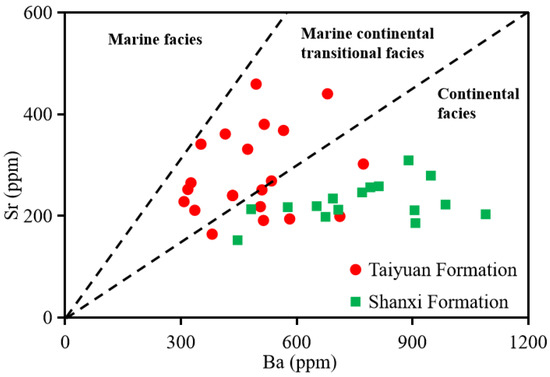
Figure 13.
A diagram of Sr/Ba of the shale samples from the TYF and SXF [43].
Moreover, Ca/(Ca + Fe) can be used to reflect the salinity level of a water body [11,65]. Generally, the Ca/(Ca + Fe) ratio in a seawater environment is greater than 0.8, the ratio in a marine-continental transitional environment is 0.4–0.8, and the ratio in a continental freshwater environment is less than 0.4 [66]. The Ca/(Ca + Fe) value of the TYF ranged from 0.02 to 0.98, with an average of 0.26, indicating that the sedimentary environment was freshwater–brackish water, while the Ca/(Ca + Fe) value of the SXF ranged from 0.02 to 0.35, with an average of 0.11, indicating that the sedimentary environment was fresh water (Table 4, Figure 8 and Figure 10). The change in the paleosalinity indices (Sr/Ba and Ca/(Ca + Fe)) both show that the paleosalinity of the TYF is higher than that of the SXF, and that OM is more easily preserved in saline water environments with higher salinity.
5.6. Controlling Factors and Formation Mechanisms of OM Accumulation
OM enrichment is usually affected by many factors, such as primary productivity, redox, paleosalinity, and sedimentation rate, which are complex physical and chemical processes [9,16,18,65]. According to the paleosedimentary environmental indicators, the paleoclimate conditions of the TYF and SXF in the SNCB were similar, both of which were deposited in a warm and humid environment, with relatively high biological productivity and sedimentation rates. Furthermore, the paleosalinity of the TYF and SXF was low during the deposition period, with the environment dominated by a dysoxic–anoxic set of circumstances belonging to marine-continental transitional and continental facies.
From the cross diagram of TOC and the above geochemical indexes (Figure 14), it can be observed that for the TYF and SXF, TOC has a clear correlation with paleoproductivity (P/Ti) (Figure 14a), sedimentation rate ((La/Yb)N) (Figure 14b), and redox index (Cu/Zn) (Figure 14c), and a weak correlation with paleosalinity (Sr/Ba) (Figure 14d) and paleoclimate (C-value and CIA) (Figure 14e,f), indicating that the main controlling factors of the enrichment of OM in the TYF and SXF are paleoproductivity, sedimentation rate, and redox conditions, while paleoclimate and paleosalinity have relatively little impact on OM accumulation. The correlation between the TOC content of the TYF and these three indicators was better than that of the SXF, indicating that the OM concentration of the TYF was higher (Figure 14).
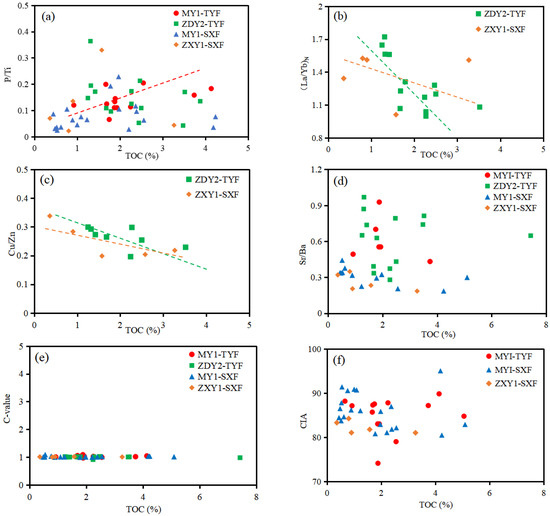
Figure 14.
Correlations between TOC contents and productivity index (P/Ti), sedimentation rate index (La/Yb)N, redox index (Cu/Zn), paleosalinity (Sr/Ba), and paleoclimate (C-value, CIA): (a) TOC vs. P/Ti; (b) TOC vs. (La/Yb)N; (c) TOC vs. Cu/Zn; (d) TOC vs. Sr/Ba; (e) TOC vs. C-value; and (f) TOC vs. CIA.
Using the study of the paleoclimate, paleoproductivity, sedimentation rate, redox, and paleosalinity of the TYF and SXF, an OM enrichment model of the Permian TYF and SXF in the SNCB was developed (Figure 15). Two large-scale transgressions occurred in the early and late stages of TYF sedimentation, while the middle stage was the regression stage [67]. Overall, the TYF sea level decreased. The frequent transgression and regression events led to low-energy hydrodynamic conditions, enhanced the reduction of the water body, increased the salinity, reduced the decomposition of OM, and saved more OM. At the same time, the relatively high deposition rate shortened the residence time of aerobic bacteria in OM, reducing the decomposition of OM (Figure 15). Moreover, a high biological productivity increased respiratory oxygen consumption in the water column, leading to OM accumulation. However, during the deposition of the SXF, the seawater retreated from the SNCB and the lithofacies transitioned from marine to continental. The increase in terrestrial input led to a gradual decrease in salinity; the sedimentary environment changed from an anoxic environment to a poor-oxygen environment, and there was a decrease in paleoproductivity and sedimentation rate, which were not conducive to the deposition and preservation of OM and also reduced TOC. Both the TYF and SXF were deposited in a warm and humid paleoclimate, which was conducive to the growth and proliferation of plants and provided favorable conditions for the later formation of coal seams (Figure 15). In summary, the OM-rich shale of the TYF and SXF in the SNCB is not determined by a single factor but is due to the interaction of many factors, such as paleoproductivity, sedimentation rate, and redox, all of which directly or indirectly affect OM enrichment.

Figure 15.
Organic matter enrichment model of the TYF and SXF in the SNCB.
6. Conclusions
1. The TYF and SXF were both deposited in warm and humid environments, with relatively high productivity and sedimentation rates. Moreover, the TYF and SXF were mainly characterized by dysoxic–anoxic environments, belonging to marine-continental transitional and continental facies.
2. The TYF shale mainly developed in a dysoxic–anoxic water environment, with a relatively high sedimentation rate, which reduced the oxidation of OM, caused OM to settle rapidly, and was conducive to OM accumulation. In addition, the high biological productivity increased respiratory oxygen consumption in the water column, leading to OM accumulation. However, the regression event of the SXF reduced the paleoproductivity and sedimentation rate, resulting in a decrease in OM.
3. An OM enrichment model of the TYF and SXF is established. This study is conducive to understanding shale enrichment mechanisms and guiding shale gas exploration in the region. The study could also have broader, global implications for its contributions to the general understanding of shales formed in marine-continental transitional environments.
Author Contributions
Literature search: Y.W. and X.C.; Figure: Y.W. and K.F.; Study design: Y.W., Z.H. and L.W.; Data collection: X.C., K.F. and Z.H.; Data analysis: Y.W.; Data interpretation: Y.W.; Writing: Y.W.; Supervision: X.C. and K.F.; Writing—Review & Editing: Z.H. and L.W. All authors have read and agreed to the published version of the manuscript.
Funding
The National Natural Science Foundation of China (41702152), Special Grant of China Postdoctoral Science Foundation (2018T110124), Foundation of State Key Laboratory of Petroleum Resources and Prospecting, China University of Petroleum, Beijing (PRP/open-1808), and Research on Exploration and Demonstration of Shale Gas in Henan Province (151100311000).
Institutional Review Board Statement
Not applicable.
Informed Consent Statement
Not applicable.
Data Availability Statement
Data supporting the results can be found in the manuscript text, tables, and figures.
Acknowledgments
This work was co-supported by the National Natural Science Foundation of China (41702152), the Special Grant of China Postdoctoral Science Foundation (2018T110124), the Foundation of State Key Laboratory of Petroleum Resources and Prospecting, the China University of Petroleum, Beijing (PRP/open-1808), and the Research on Exploration and Demonstration of Shale Gas in Henan Province (151100311000).
Conflicts of Interest
The authors declare that they have no conflict of interest.
References
- Zhang, S.; Wang, X.; Wang, H.; Bjerrum, C.J.; Hammarlund, E.U.; Costa, M.M.; Connelly, J.N.; Zhang, B.; Su, J.; Canfield, D.E. Sufficient oxygen for animal respiration 1,400 million years ago. Proc. Natl. Acad. Sci. USA 2016, 113, 1731–1736. [Google Scholar] [CrossRef] [PubMed]
- Tribovillard, N.; Algeo, T.J.; Lyons, T.; Riboulleau, A. Trace metals as paleoredox and paleoproductivity proxies: An update. Chem. Geol. 2006, 232, 12–32. [Google Scholar] [CrossRef]
- Burton, Z.F.M.; Moldowan, J.M.; Magoon, L.B.; Sykes, R.; Graham, S.A. Interpretation of source rock depositional environment and age from seep oil, east coast of New Zealand. Int. J. Earth Sci. 2019, 108, 1079–1091. [Google Scholar] [CrossRef]
- Peters, K.E.; Cassa, M. Chapter 5: Applied source rock geochemistry. In The Petroleum System—From Source to Trap; Magoon, L.B., Dow, W.G., Eds.; American Association of Petroleum Geologists Memoir 60: Tulsa, OK, USA, 1994; Volume 14, pp. 93–120. [Google Scholar]
- Jarvie, D.M.; Hill, R.J.; Ruble, T.E.; Pollastro, R.M. Unconventional shale-gas systems: The Mississippian Barnett Shale of north-central Texas as one model for thermogenic shale-gas assessment. AAPG Bull. 2007, 91, 475–499. [Google Scholar] [CrossRef]
- Johnson, J.E.; Phillips, S.C.; Torres, M.E.; Pinero, E.; Rose, K.K.; Giosan, L. Influence of total organic carbon deposition on the inventory of gas hydrate in the Indian continental margins. Mar. Pet. Geol. 2014, 58, 406–424. [Google Scholar] [CrossRef]
- Burton, Z.F.M. Sediment organic contents required for gas hydrate formation: A survey of published basin and hydrocarbon system models. Fuels 2022, 3, 280–287. [Google Scholar] [CrossRef]
- Zou, C.; Zhu, R.; Chen, Z.Q.; Ogg, J.G.; Wu, S.; Dong, D.; Qiu, Z.; Wang, Y.; Wang, L.; Lin, S.; et al. Organic-matter-rich shales of China. Earth Sci. Rev. 2019, 189, 51–78. [Google Scholar] [CrossRef]
- Lash, G.G.; Blood, D.R. Organic matter accumulation, redox, and diagenetic history of the Marcellus Formation, southwestern Pennsylvania, Appalachian basin. Mar. Pet. Geol. 2014, 57, 244–263. [Google Scholar] [CrossRef]
- Liu, W.; Yao, J.; Tong, J.; Qiao, Y.; Chen, Y. Organic matter accumulation on the Dalong Formation (Upper Permian) in western Hubei, South China: Constraints from multiple geochemical proxies and pyrite morphology. Palaeogeogr. Palaeoclimatol. Palaeoecol. 2019, 514, 677–689. [Google Scholar] [CrossRef]
- He, J.; Ding, W.; Jiang, Z.; Jiu, K.; Li, A.; Sun, Y. Mineralogical and chemical distribution of the Es3L oil shale in the Jiyang Depression, Bohai Bay Basin (E China): Implications for paleoenvironmental reconstruction and organic matter accumulation. Mar. Pet. Geol. 2017, 81, 196–219. [Google Scholar] [CrossRef]
- Harris, N.B.; Freeman, K.H.; Pancost, R.D.; White, T.S.; Mitchell, G.D. The character and origin of lacustrine source rocks in the Lower Cretaceous synrift section, Congo Basin, west Africa. AAPG Bull. 2004, 88, 1163–1184. [Google Scholar] [CrossRef]
- Wu, J.; Liang, C.; Hu, Z.; Yang, R.; Xie, J.; Wang, R.; Zhao, J. Sedimentation mechanisms and enrichment of organic matter in the Ordovician Wufeng Formation-Silurian Longmaxi Formation in the Sichuan Basin. Mar. Pet. Geol. 2019, 101, 556–565. [Google Scholar] [CrossRef]
- Zeng, S.; Wang, J.; Fu, X.; Chen, W.; Feng, X.; Wang, D.; Song, C.; Wang, Z. Geochemical characteristics, redox conditions, and organic matter accumulation of marine oil shale from the Changliang Mountain area, northern Tibet, China. Mar. Pet. Geol. 2015, 64, 203–221. [Google Scholar] [CrossRef]
- Moldowan, J.M.; Sundararaman, P.; Schoell, M. Sensitivity of biomarker properties to depositional environment and/or source input in the Lower Toarcian of SW-Germany. Org. Geochem. 1986, 10, 915–926. [Google Scholar] [CrossRef]
- Ding, J.H.; Zhang, J.C.; Huo, Z.P.; Shen, B.; Shi, G.; Yang, Z.; Li, X.; Li, C. Controlling Factors and Formation Models of Organic Matter Accumulation for the Upper Permian Dalong Formation Black Shale in the Lower Yangtze Region, South China: Constraints from Geochemical Evidence. ACS Omega 2021, 6, 3681–3692. [Google Scholar] [CrossRef]
- Schmitz, B.; Charisi, S.D.; Thompson, E.I.; Speijer, R.P. Barium, SiO2 (excess), and P2O5 as proxies of biological productivity in the Middle East during the Palaeocene and the latest Palaeocene benthic extinction event. Terra Nova 1997, 9, 95–99. [Google Scholar] [CrossRef]
- Abart, F.R.; Wagreich, M.; Gier, S.; Ahmed, M.S.; Sami, M. Late Campanian Climatic-Continental Weathering Assessment and Its Influence on Source Rocks Deposition in Southern Tethys, Egypt. Minerals 2023, 13, 160. [Google Scholar]
- Francois, R.A. Study on the regulation of the concentrations of some trace metals (Rb, Sr, Zn, Pb, Cu, V, Cr, Ni, Mn and Mo) in Saanich Inlet Sediments, British Columbia, Canada. Mar. Geol. 1988, 83, 285–308. [Google Scholar] [CrossRef]
- Nesbitt, H.; Young, G.M. Early Proterozoic climates and plate motions inferred from major element chemistry of lutites. Nature 1982, 299, 715–717. [Google Scholar] [CrossRef]
- Zhang, B.; Cheng, W.; Zhang, Q.; Li, Y.; Sun, P.; Fathy, D. Occurrence Patterns and Enrichment Influencing Factors of Trace Elements in Paleogene Coal in the Fushun Basin, China. ACS Earth Space Chem. 2022, 6, 3031–3042. [Google Scholar] [CrossRef]
- Qiu, X.; Liu, C.; Mao, G.; Deng, Y.; Wang, F.; Wang, J. Major, trace and platinum-group element geochemistry of the Upper Triassic nonmarine hot shales in the Ordos basin, Central China. Appl. Geochem. 2015, 52, 42–52. [Google Scholar] [CrossRef]
- Harris, N.B. The Deposition of Organic-Carbon-Rich Sediments: Models, Mechanisms, and Consequences; SEPM Society for Sedimentary Geology: Tulsa, OK, USA, 2005. [Google Scholar]
- Murphy, A.E.; Sageman, B.; Hollander, D.J.; Lyons, T.W.; Brett, C.E. Black shale deposition and faunal overturn in the Devonian Appalachian Basin: Clastic starvation, seasonal water-column mixing, and efficient biolimiting nutrient recycling. Paleoceanography 2000, 15, 280–291. [Google Scholar] [CrossRef]
- Teng, J.; Liu, Y. Analysis of distribution, storage potential and prospect for shale oil and gas in China. Prog. Geophys. 2013, 28, 1083–1108. [Google Scholar]
- Dang, W.; Zhang, J.; Tang, X.; Chen, Q.; Han, S.; Li, Z.; Du, X.; Wei, X.; Zhang, M.; Liu, J.; et al. Shale gas potential of Lower Permian marine-continental transitional black shales in the Southern North China Basin, central China: Characterization of organic geochemistry. J. Nat. Gas Sci. Eng. 2016, 28, 639–650. [Google Scholar] [CrossRef]
- Liang, Q.; Zhang, X.K.; Tian, J.; Sun, X.; Chang, H. Geological and geochemical characteristics of marine-continental transitional shale from the Lower Permian Taiyuan Formation, Taikang Uplift, southern North China Basin. Mar. Pet. Geol. 2018, 98, 229–242. [Google Scholar] [CrossRef]
- Peng, Y. The Shale Gas Accumlation Conditions of Taiyuan Formation in Southern North China Basin; China University of Geosciences: Beijing, China, 2020. [Google Scholar]
- Huo, Z.P.; Zhang, J.C.; Li, P.; Tang, X.; Yang, X.; Qiu, Q.; Dong, Z.; Li, Z. An improved evaluation method for the brittleness index of shale and its application—A case study from the southern north China basin. J. Nat. Gas Sci. Eng. 2018, 59, 47–55. [Google Scholar] [CrossRef]
- Xu, H.L.; Zhao, Z.J.; Lu, F.L.; Yang, Y.; Tang, Z.; Sun, G.; Xu, Y. Tectonic evolution of the Nanhuabei area and analysis about its petroleum potential. Geotect Metallog. 2004, 28, 450–463. [Google Scholar]
- Yu, H.; Lv, F.; Guo, Q.; Lu, W.; Wu, J.; Han, S. Proto-sediment basin types and tectonic evolution in the southern edge of North China Pla. Earth-Sci. Rev. 2005, 27, 111–117. [Google Scholar]
- Zhou, X.; Ni, C.; Yang, F. The Paleozoic prototype basins and their tectonic deformation in North China and their controlling effects upon hydrocarbon accumulation. Pet. Nat. Gas Geol. 2010, 31, 779–794. [Google Scholar]
- Diao, Y.; Wei, J.; Li, Z.; Cao, H.; Li, X. Late carboniferous-early permian sequence stratigraphy and paleogeography in the southern North China Basin. Acta Geol. Sin. 2011, 35, 88–94. [Google Scholar]
- Zhang, M.Q. Controlling Factor for Shale Enrichment of the Permian Shale in Southern North China Basin; China University of Geosciences: Beijing, China, 2016. [Google Scholar]
- Huo, Z.P.; Gao, J.; Zhang, J.C.; Zhang, D.; Liang, Y. Role of overlying and underlying limestones in the natural hydraulic fracturing of shale sections: The case of marine–continental transitional facies in the Southern North China Basin. Energy Rep. 2021, 7, 8711–8729. [Google Scholar] [CrossRef]
- Haskin, L.A.; Wildeman, T.R.; Haskin, M.A. An accurate procedure for the determination of the rare earths by neutron activation. J. Radioanal. Chem. 1968, 1, 337–348. [Google Scholar] [CrossRef]
- Taylor, S.R.; McLennan, S.M. The Continental Crust: Its Composition and Evolution; Blackwell Scientific Publications: Oxford, UK, 1985; pp. 117–140. [Google Scholar]
- Bonis, N.R.; Ruhl, M.; Kürschner, W. Climate change driven black shale deposition during the end-Triassic in the western Tethys. Palaeogeogr. Palaeoclimatol. Palaeoecol. 2010, 290, 151–159. [Google Scholar] [CrossRef]
- Burton, Z.F.M.; McHargue, T.; Kremer, C.H.; Bloch, R.B.; Gooley, J.T.; Jaikla, C.; Harrington, J. Peak Cenozoic warmth enabled deep-sea sand deposition. Sci. Rep. 2023, 13, 1276. [Google Scholar] [CrossRef] [PubMed]
- Fedo, C.M.; Nesbitt, H.W.; Young, G.M. Unraveling the effects of potassium metasomatism in sedimentary rocks and paleosols, with implications for paleoweathering conditions and provenance. Geology 1995, 23, 921–924. [Google Scholar] [CrossRef]
- Price, J.R.; Velbel, M.A. Chemical weathering indices applied to weathering profiles developed on heterogeneous felsic metamorphic parent rocks. Chem. Geol. 2003, 202, 397–416. [Google Scholar] [CrossRef]
- McLennan, S.M.; Hemming, S.R.; McDaniel, D.K.; Hanson, G.N. Geochemical approaches to sedimentation, provenance, and tectonics. Spec. Pap. Geol. Soc. Am. 1993, 284, 21–40. [Google Scholar]
- Chen, H.; Tang, D.; Chen, S.; Tang, S. Geochemical characteristics of mudstones from the lower cretaceous strata of the Jixi Basin, NE China: Implications for organic matter enrichment. Int. J. Coal Geol. 2021, 249, 103904. [Google Scholar] [CrossRef]
- Brumsack, H.J. The trace metal content of recent organic carbon-rich sediments; implications for Cretaceous black shale formation. Palaeogeogr. Palaeoclimatol. Palaeoecol. 2006, 232, 344–361. [Google Scholar] [CrossRef]
- Dymond, J.; Suess, E.; Lyle, M. Barium in Deep-Sea Sediment: A Geochemical Proxy for Paleoproductivity. Paleoceanography 1992, 7, 163–181. [Google Scholar] [CrossRef]
- Shen, J.; Schoepfer, S.D.; Feng, Q.; Zhou, L.; Yu, J.; Song, H.; Wei, H.; Algeo, T.J. Marine productivity changes during the end-Permian crisis and Early Triassic recovery. Earth Sci. Rev. 2015, 149, 136–162. [Google Scholar] [CrossRef]
- Schroeder, J.; Murray, R.W.; Leinen, M.S.; Pflaum, R.; Janecek, T.R. Barium in equatorial Pacific carbonate sediment: Terrigenous, oxide, and biogenic associations. Paleoceanography 1997, 12, 125–146. [Google Scholar] [CrossRef]
- Ibach, L.E.J. Relationship between sedimentation rate and total organic carbon content in ancient marine sediments. AAPG Bull. 1982, 66, 170–188. [Google Scholar]
- Algeo, T.J.; Maynard, J.B. Trace-element behavior and redox facies in core shales of Upper Pennsylvanian Kansas-type cyclothems. Chem. Geol. 2004, 206, 289–318. [Google Scholar] [CrossRef]
- Wu, Z.; Zhao, X.; Wang, E.; Pu, X.; Lash, G.; Han, W.; Zhang, W.; Feng, Y. Sedimentary environment and organic enrichment mechanisms of lacustrine shale: A case study of the Paleogene Shahejie Formation, Qikou Sag, Bohai Bay Basin. Palaeogeogr. Palaeoclimatol. Palaeoecol. 2021, 573, 110404. [Google Scholar] [CrossRef]
- Pan, Y.; Huang, Z.; Li, T.; Guo, X.; Xu, X.; Chen, X. Environmental response to volcanic activity and its effect on organic matter enrichment in the Permian Lucaogou Formation of the Malang Sag, Santanghu Basin, Northwest China. Palaeogeogr. Palaeoclimatol. Palaeoecol. 2020, 560, 110024. [Google Scholar] [CrossRef]
- Tyson, R.V. Sedimentation rate, dilution, preservation and total organic carbon: Some results of a modelling study. Org. Geochem. 2001, 32, 333–339. [Google Scholar] [CrossRef]
- Sageman, B.B.; Murphy, A.E.; Werne, J.P.; Ver Straeten, C.A.; Hollander, D.J.; Lyons, T.W. A tale of shales: The relative roles of production, decomposition, and dilution in the accumulation of organic-rich strata, Middle–Upper Devonian, Appalachian basin. Chem. Geol. 2003, 195, 229–273. [Google Scholar] [CrossRef]
- Ruhlin, D.E.; Owen, R.M. The rare earth element geochemistry of hydrothermal sediments from the East Pacific Rise: Examination of a seawater scavenging mechanism. Geochim. Cosmochim. Acta 1986, 50, 393–400. [Google Scholar] [CrossRef]
- Murray, R.W.; Brink, M.B.T.; Gerlach, D.C.; Russ, G.P.; Jones, D. Rare earth, major, and trace elements in chert from the Franciscan Complex and Monterey Group, California: Assessing REE sources to fine-grained marine sediments. Geochim. Cosmochim. Acta 1991, 55, 1875–1895. [Google Scholar] [CrossRef]
- Tenger; Liu, W.; Xu, Y.; Chen, J. Comprehensive geochemical identification of highly evolved marine carbonate rocks as hydrocarbon-source rocks as exemplified by the Ordos Basin. Sci. China Ser. D 2006, 49, 384–396. [Google Scholar] [CrossRef]
- Doner, Z.; Kumral, M.; Demirel, I.H.; Hu, Q. Geochemical characteristics of the Silurian shales from the central Taurides, southern Turkey: Organic matter accumulation, preservation and depositional environment modeling. Mar. Pet. Geol. 2019, 102, 155–175. [Google Scholar] [CrossRef]
- Hatch, J.R.; Leventhal, J.S. Relationship between inferred redox potential of the depositional environment and geochemistry of the Upper Pennsylvanian (Missourian) Stark Shale Member of the Dennis Limestone, Wabaunsee County, Kansas, U.S.A. Chem. Geol. 1992, 99, 65–82. [Google Scholar] [CrossRef]
- Li, W.; Li, X.; Ding, Q.; Chen, S.; Zhang, J. Geochemical characteristics and paleoenvironment of Cretaceous Jiufotang Formation in Xiushui Basin, northern Liaoning. Glob. Geol. 2019, 38, 154–161. [Google Scholar]
- Mei, S. Application of rock chemistry in the study of Presinian sedimentary environment and the source of Uranium mineralization in Hunan Province. Land Resour. Her. 1988, 7, 25–31. [Google Scholar]
- Ye, L.; Qi, T.; Peng, H. Depositional environment analysis of Shanxi formation in Eastern Ordos Basin. Acta Sedimentol. Sin. 2008, 26, 202–210. [Google Scholar]
- Fu, J.; Deng, X.; Wang, Q.; Li, J.; Qiu, J.; Hao, L.; Zhao, Y. Densification and hydrocarbon accumulation of Triassic Yanchang Formation Chang 8 Member, Ordos Basin, NW China: Evidence from geochemistry and fluid inclusions. Pet. Explor. Dev. 2017, 44, 48–57. [Google Scholar] [CrossRef]
- Xiao, J. Geochemical Indicators of Sedimentary Environments—A Summary. Earth Environ. 2011, 39, 405–414. [Google Scholar]
- Wang, P.W.; Chen, Z.L.; Li, X.J. Geochemical characteristics and environmental significance of Dengying formation of Upper Sinian in Qiannan Depression. Geoscience 2011, 25, 1059–1065. [Google Scholar]
- Liu, C.; Liu, K.; Wang, X.; Wu, L.; Fan, Y. Chemostratigraphy and sedimentary facies analysis of the Permian Lucaogou Formation in the Jimusaer Sag, Junggar Basin, NW China: Implications for tight oil exploration. J. Asian Earth Sci. 2019, 178, 96–111. [Google Scholar] [CrossRef]
- Guo, L.; Zhang, S.; Xie, X.; Zhong, S.; Huang, C.; Chen, B. Geochemical characteristics and organic matter enrichment of the Dongyuemiao member mudstone of Lower Jurassic in the Western Hubei-Eastern Chongqing. Sci. J. Earth Sci. 2017, 42, 1235–1246. [Google Scholar]
- Shang, B.H.; Ni, Y.; Song, H.; Liu, S.; Zhang, L. Sequence stratigraphic framework of Late Paleozoic coal measures and their sedimentary evolution in Henan, Yprovince. Coal Geol. Explor. 2012, 40, 1–5. [Google Scholar]
Disclaimer/Publisher’s Note: The statements, opinions and data contained in all publications are solely those of the individual author(s) and contributor(s) and not of MDPI and/or the editor(s). MDPI and/or the editor(s) disclaim responsibility for any injury to people or property resulting from any ideas, methods, instructions or products referred to in the content. |
© 2023 by the authors. Licensee MDPI, Basel, Switzerland. This article is an open access article distributed under the terms and conditions of the Creative Commons Attribution (CC BY) license (https://creativecommons.org/licenses/by/4.0/).