Abstract
Miniaturized detection devices in the ocean generally experience problems such as short endurance and unreliable power supplies. This article aimed to develop a dynamic ocean temperature difference energy collection device to capture ocean temperature difference energy and provide objective electricity for stable detection devices. The main focus was to conduct experimental research on the effectiveness of a dynamic ocean temperature difference energy power generation device. During the research process, the fact that ammonia gas in a working fluid is easy to liquefy and vaporize was utilized. By utilizing the increase in seawater temperature during the floating process of the device, it vaporized and drove the turbine to rotate for power generation. In the structural design, multiple sets of small air chambers were creatively proposed, which could effectively control the air pressure and improve the stability of the airflow. By charging the airflow to impact the turbine, multiple sets of power generation fans were used to form a stable current. Further, the buoyancy of the device could be changed by adding phase change materials between the air chamber and the device shell, and the temperature difference between the two ends of the phase change materials could be used to change the electron density of the material to form a weak current. In this experimental study, concepts such as the structural design of multiple small gas chambers, miniaturization of energy collection devices, compensation power generation of phase change materials, and application scenarios of devices combined with Argo buoys were all proposed for the first time. The results of this experimental study indicate that the overall power generation of the device is about 2A, and its maximum output power amplitude is about 22 W. The cyclic thermal efficiency of the power generation device can be increased from +0.19% to +0.88%. The development of this thermoelectric power generation device can provide a considerable stable power supply for ocean observation devices, especially the buoy device represented by Argo, which can extend the endurance of deep-sea exploration devices.
1. Introduction
The ocean is the world’s most prominent solar collector and energy storage system. Developing marine energy resources to adjust the world’s energy structure to ease energy tension has far-reaching strategic significance. Ocean energy is rich in variety, has vast reserves, and is clean and pollution-free. In the past, solar, wind, and wave energy have been extensively studied [1,2,3,4]. It is worth mentioning that ocean temperature difference energy is also a basic form of ocean energy, with many application prospects.
The concept of ocean thermal energy can be traced back to the OTEC (Ocean Thermal Energy Conversion) concept proposed by French physicist D’Arsonval in the late 19th century, which states that the natural temperature difference between surface and deep water in the ocean is a potential energy source that can be utilized. Theoretically, energy can be extracted if there is a temperature difference. Based on the large scale of the ocean, temperature difference energy generation is one of the most promising ocean energy technologies [5,6]. Usually, this vision is realized by using the thermal gradient between the warm surface seawater and the cold deep seawater to generate electricity. However, there are still problems, such as large heat exchange areas, high construction costs, and low efficiency (efficiency is only about 3% as of now) [7,8]. The current utilization of oceanic temperature difference energy is mainly concentrated on land rather than underwater. It exists mainly in the form of large land-based stations, which adopt the heat exchange method of deep-water pumps to extract deep cold seawater and submersible pumps to extract hot surface seawater to realize the circulation for oceanic temperature difference energy [9]. In general, current thermoelectric power generation technology pursues practical benefits, exchanging small energy for considerable energy for large-scale heat exchange. Therefore, the main method of utilizing ocean thermoelectric energy is shore-based, large-scale thermoelectric power generation equipment, which can generate power up to kW and MW levels. The development and application scenarios of small-scale thermoelectric power generation devices, specifically in the field of ocean exploration equipment, are almost non-existent internationally. In this article, we propose to study a miniaturized dynamic ocean temperature difference energy generation device, which mainly applies to ocean exploration equipment represented by Argo. The power generation principle of the device is based on the Kalina cycle [10,11,12,13]. In the early 1980s, Kalina proposed a new family of thermodynamic power cycles using an ammonia–water mixture as the working fluid, and this kind of cycle configuration was named the Kalina cycle, which miniaturizes the volume of the device, innovates the design of the internal structure of the device, and creatively adds phase change compensation materials for auxiliary power generation, which can improve the power generation efficiency while realizing the self-floating and self-sinking of the device.
2. Some of the Problems That Device Miniaturization Can Solve
2.1. Self-Sinking/Floating Problem
The utilization of ocean thermal energy is mainly concentrated on land rather than underwater, so the integration of underwater detection devices and thermal power generation devices is of great significance for future ocean strategies [14]. If the self-sinking and self-floating processes during the dynamic movement of underwater devices can be achieved, it is of great significance for the energy conservation of the device. For this purpose, we designed a dynamic ocean thermoelectric power generation device based on phase change compensation. By adding phase change materials, the volume of phase change material changes during solid–liquid phase transition increases, further altering the buoyancy of the device and achieving the self-floating and self-sinking of the device. At the same time, phase change materials can utilize the temperature difference between the two ends for power generation or form local temperature differences to compensate for power generation, achieving the self-generation of equipment during buoyancy and diving, providing power for ocean observation and extending the duration of detection devices.
2.2. Device Connection and Power Supply Issues
Taking the Argo buoy (Figure 1) as an example, the range of motion of the Argo buoy is precisely between surface seawater and deep seawater, which is well correlated with the application scenarios of thermoelectric power generation devices. Therefore, consider the scenario of connecting the power generation device to the Argo buoy. The integrated device can reduce the installation failure rate and be more suitable for deep-sea environments. Most existing buoys use expensive lithium batteries for power supply, and the power of the lithium batteries themselves is limited. When the power is depleted, it is difficult to recover Argo buoys. Therefore, most Argo buoys will disappear into the vast sea after their power is depleted. The loss of Argo buoys in the ocean can also cause ocean pollution. Therefore, developing a small dynamic ocean temperature difference energy generation device that is connected to the Argo buoy and continuously provides electricity to it can increase the range of the Argo buoy, enabling the device to continue to gain power without damage, thus improving its service life [15].
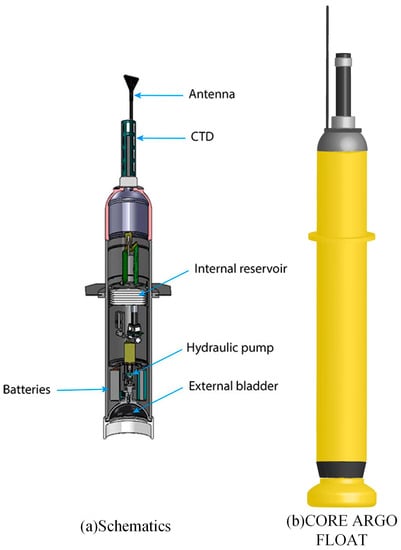
Figure 1.
Argo buoy (images from https://www.argo.ucsd.edu, accessed on 2 March 2023).
3. The Principle of the Device
3.1. Principles
One of the core features of this device is its ability to generate electricity by using the ocean temperature difference energy. The main components include an evaporator, condenser, turbine, and working fluid pump. The Kalina cycle [11] in the unit is shown in Figure 2.
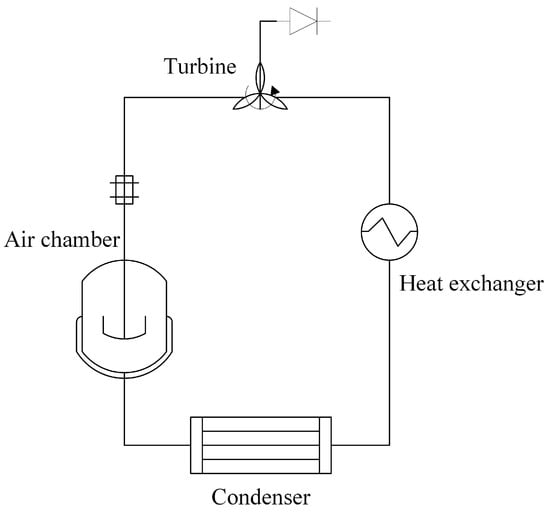
Figure 2.
Improved Kalina cycle.
At present, the primary design purpose of the worldwide ocean temperature differential energy power generation system is to use the seawater along a land-based station to generate large amounts of power, and the current ocean temperature differential energy power generation system is established chiefly along the coast and is a large power station [16]. The design purpose of the ocean temperature difference energy generation device introduced in this paper is mainly to provide additional power for ocean exploration devices such as the Argo buoy, so the device is small. The corresponding structure is relatively simple, as shown in Figure 3; the upper part is the Argo buoy model, and the lower part is a small dynamic temperature difference energy generation device.
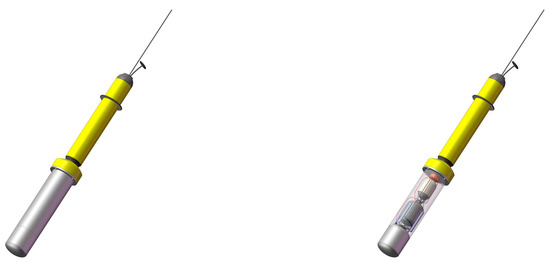
Figure 3.
Device design drawing.
The device uses the Kalina cycle. From the structure and principle of the device, we can see that the device is not a traditional Kalina cycle but is innovated and improved according to the actual environment. The device uses concentrated ammonia water in the pressurized environment as the working medium. Compared with the steam Rankine cycle and pure ammonia cycle, it is more suitable for the temperature of the marine environment. The temperature of phase transition can be controlled by pressure, which is easier to adjust according to the actual application scenario. The efficiency of the sub-cycle system is not high but can reduce the pressure drop loss. In this paper, the selected work fluid is concentrated ammonia, which has the characteristics of easy liquefaction and gasification and has good thermal properties and stability [17,18]. By using the device in the process of floating on the sea’s surface, the seawater temperature rises to gasify and drive the turbine rotation to generate electricity. The power generation device structure schematic diagram is shown in Figure 3. In the structural design, through the design of multiple small air chamber structures, the air pressure can be better controlled to improve airflow stability and through the airflow push multiple groups of power generation fans to form a stable current. Further, adding phase change materials equipped with a hydraulic bladder can change the buoyancy to realize the upward and downward diving of the device. In contrast, the phase change materials can assist the phase change of airflow to improve power generation efficiency.
3.2. Solutions
Based on the phenomena that the temperature difference between different layers of ocean water (in the South China Sea) is significant, and that the surface water is much warmer than the deep water (the seawater thermocline is shown in Figure 4, and the water temperature at a depth of 2000 m underwater is approximately 3 °C; the sea surface water temperature is about 28 °C. The relevant data of the thermocline used in the figure come from http://www.argo.org.cn and are publicly available) (access on 2 March 2023) [19,20], the vertical temperature difference of the ocean is used to generate electricity. The three gas chambers in the device are named, from bottom to top, the first gas chamber (labeled as 2 in Figure 5), the second gas chamber (labeled as 3 in Figure 5), and the third gas chamber (labeled as 6 in Figure 5).
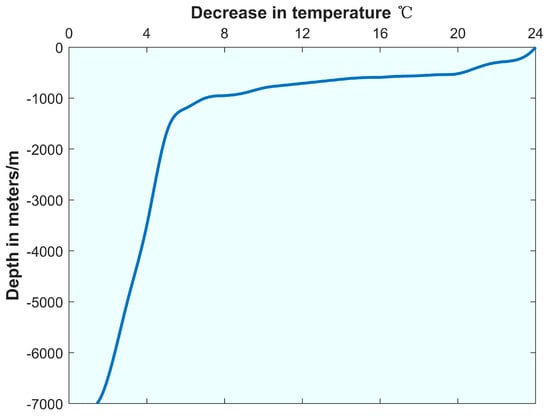
Figure 4.
Seawater thermocline.
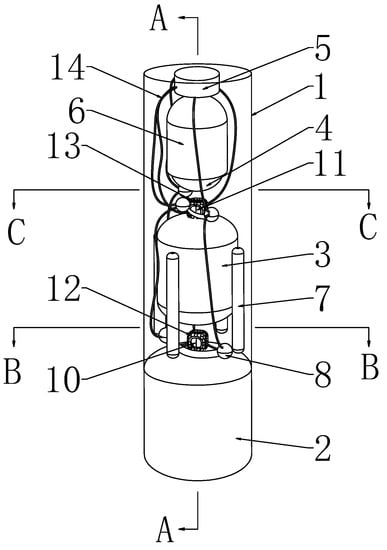
Figure 5.
Detailed structure of power generation unit. 1—External shell of the device 2—First gas chamber 3—Second gas chamber 4—Third gas chamber 5—Battery 6—Power generation module 7—Hydraulic sac 8—Turbine 10—Control integration Unit one 11—Control integration Unit two 12—1 Integrated fixed bracket 13—2 Integrated fixed bracket 14—Wire A-A direction B-B direction C-C direction.
Firstly, we provide volume data for three different chambers in the device.The data are shown in Table 1.

Table 1.
Volume data from three different chambers.
The gas chambers are composed of two parts: the first part is a cylinder, placed in the middle of the chamber, and the second part is an ellipsoid, which is divided into two equal semiellipsoids, placed at both ends of the cylinder.
When the device is placed in the ocean, its trajectory is fitted to the trajectory of the Argo buoy in the ocean, even though its trajectory is the same as the Argo buoy’s trajectory. As described above, by connecting this dynamic miniaturized power generation device to the Argo buoy, the ocean water temperature slowly increases as the overall device moves upward from 2000 m underwater. Due to the excellent thermal conductivity of the unique shell of the first gas chamber and its direct contact with seawater at the lower end of the exposed shell, the increase in seawater temperature as a heat source will lead to a gradual increase in the working gas temperature in the first gas chamber. When the temperature reaches the critical point of vaporization of concentrated ammonia water, ammonia gas will overflow from the concentrated ammonia water in large quantities. A large amount of ammonia gas will generate a high-pressure gas mass, and the air pressure in the first gas chamber will increase. The pressure sensor probe in the first gas chamber monitors the pressure inside the first gas chamber in real-time. It transmits the original pressure change signal to the integrated control unit (labeled 12 in Figure 5) between the first and second gas chambers. The pressure monitoring system inside the integrated control unit compares the pressure value with the preset value in real-time. When the real-time pressure inside the first chamber reaches the preset value, the switch control system causes the air pressure valve at the ventilation pipe’s air inlet to open, and the first chamber is connected to the second chamber. The pressurized airflow drives the power generation fan to rotate rapidly until the maximum speed is reached, generating stable magnetic power for a while.
The wind power generation system in the integrated control unit controls the fan. It conducts the alternating current generated by the fan set through the wire to the filter, which is then processed and connected to the battery. As the whole device floats, the seawater temperature gradually rises, and the vaporization rate of concentrated ammonia overflows faster and faster. The first and second air chambers are connected, and air pressure gradually rises. When the pressure sensor located between the second gas chamber and the third gas chamber senses that the pressure inside the second gas chamber reaches a preset value, the switch control system in the second integrated control unit (labeled 13 in Figure 5) causes the air pressure valve located in the air inlet of the ventilation tube to open. The second gas chamber is connected to the third gas chamber, the gas from the second gas chamber moves through the ventilation tube into the third gas chamber, and via the same principle, the air flow drives the turbine located between the second gas chamber and third gas chamber. At this time, the gas flow rate also enables the power generation fan to reach the maximum speed, and the integrated control unit controls the current generated to be rectified and transmitted to the battery for storage via an electric wire.
Different pressure preset values trigger the two control integration units in the pressure monitoring system in the air pressure valve switch. According to the specific data for the initial setting, this device integration unit is in the experimental pressure sensor pressure range of 0.35–0.6 MPa; depending on the specific ambient temperature, it was set to 0.5 MPa in the later experiments.
As the whole device rises, the phase change material also generates electricity. As the device floats and the seawater temperature rises, the temperature of the phase change material heats up. It rises, and the temperature of the temperature difference energy module surrounded by the phase change material decreases. Here, it is proposed that the temperature of the part surrounded by the phase change material is relatively constant, while the temperature of the part not surrounded by the phase change material changes with the seawater and forms a temperature difference with the area not surrounded by the phase change material. The temperature difference in the South China Sea is up to 25 °C, which can generate considerable electricity. The current generated by the temperature difference in the phase change material and the current generated in the above magnetic power generation device is grouped to form a stable current for storage in the battery after tuning, voltage transformation, and integration.
When the above device reaches the surface position of the ocean, the hydraulic bladder inside the device contracts under the preset command of the sensor, and the gravity balance block inside it (marked as 7 in Figure 6) moves down to change the center of gravity of the whole device. In contrast, the hydraulic bladder releases the gas to realize the increase in the device’s density. The device sinks under the action of its weight, and the partial schematic diagram of the device structure is shown in Figure 6. During the sinking process, the control integration unit controls all the air pressure valves to close, opens the corresponding condensation return switch, and the overflowing ammonia gas enters the condensation return tube. As the device dives, the temperature of seawater drops, and the heat exchange is completed through the heat conduction of the shell; after the device reaches the deep water, the low temperature of seawater cools the ammonia gas in the condensation return tube and turns it back into liquid to be injected into the first gas chamber. At the same time, the phase change material changes from heat absorption to exothermic, and the temperature difference between the area on one side of the module surrounded by the phase change material increases, forming a temperature difference with the area on the side not surrounded by the phase change material, generating current, which is tuned, transformed, and integrated to form a stable current that travels into the battery for storage, constituting an overall cycle.
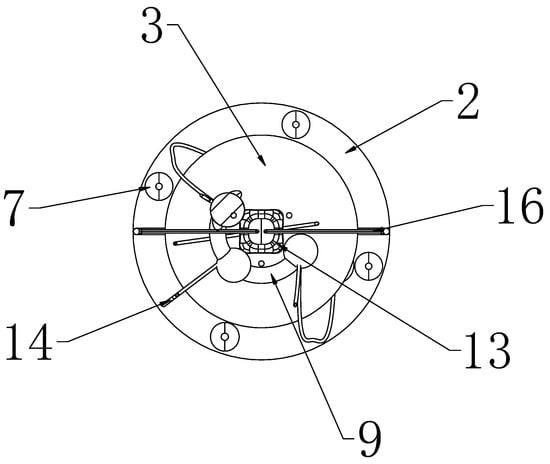
Figure 6.
Partial schematic diagram of the device structure. 2—First gas chamber 3—Second gas chamber 7—Hydraulic sac 9—Gas pipeline 13—Integrated fixed bracket 14—Wire 16—Condensate return line.
When the whole device reaches the deep-water layer 2000 m underwater, the volume of the four hydraulic bladders becomes more extensive, increasing the contact with seawater and generating buoyancy, making the whole device rise under the action of buoyancy. The device is calculated to make the water’s density close to that of the seawater. The device rises again to make the fluid work material vaporize again, repeating the above power generation process. The phase change material also performs temperature difference power generation, generating electric current into power, which is then stored. Repeatedly, the fluid in the closed-circuit vaporization/evaporation, expansion, and pressure impact the power generation, condensation, and recovery of a series of processes. This process is considered to have no energy consumption, or the closed-case energy consumption is slower at least, so that the reaction continues, can extend the buoy’s range and service life, facilitate the recovery of the buoy, and reduce marine litter pollution.
If the entropy per unit mass of ammonia gas at the vent pipe x is set to S, the gas constant is set to Rg, and the total enthalpy per unit gas is set to h0. Based on the gas components at this location, the corresponding function of the gas temperature T and the entropy per unit mass of gas S is T = f (s), and the corresponding function of the enthalpy per unit mass of gas h and the temperature T is h = g (T) (cited from Yasuyuki Ikegami, Takeshi Yasunaga et al. [18]).
When the ammonia gas mass expands to a pressure P and ambient pressure P0, the kinetic energy per unit of gas is Ek, and the temperature T at this time is
The enthalpy per unit mass of gas at this point is
Ek is calculated as:
where the expression for the thermal cycle η is
where P is the output power of the turbine, Pw is the input power of the working gas, and q is the heat flow rate.
There are no other power losses in this device in an ideal environment. In the actual experiment, the power loss of the sensor control unit was considered separately and set to Pv. The expression of the thermal cycle ηl of the device is
4. Device Characteristics Analysis
The warm surface seawater exchanges energy with the working medium in the generator and makes the working medium completely change into a gas state. The heat absorption of the working medium from the warm seawater is the heat absorption of the system, according to the law of energy conservation.
The thermal efficiency of the Kalina cycle [14,18] is:
The optimal temperature difference is:
4.1. Effect of Ammonia Gas Mass Pressure on Power Generation Units
The simulated experimental environment was set as follows: the seawater temperature (heat transfer temperature) was 28 °C; the critical value of the two-state temperature after the proportional reconciliation of the phase change material was 5 °C, and the ammonia mass was kept constant; the evaporation temperature was 24.8 °C; the condensation temperature was 6.5 °C; and the concentration of ammonia was 2 mol/L. The volume of the added concentrated ammonia water was 5 L. The ammonia pressure range chosen was from 0.35 to 0.6 MPa, and the thermal efficiency of the system varied with the pressure of the ammonia gas mass, as shown in Figure 7. The variation in system thermal efficiency with the pressure of ammonia gas mass is shown in Figure 7.
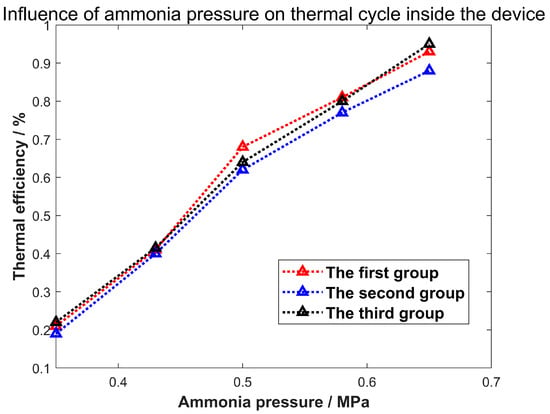
Figure 7.
System thermal efficiency change law.
From Figure 7, it can be seen that the Kalina cycle thermal efficiency of a small temperature differential energy generation unit can be increased from +0.19% to +0.88% under the condition that the evaporation pressure changes from 0.4 MPa to 0.6 MPa for a particular concentration of ammonia, and it can be seen that the pressure of the ammonia gas mass is closely related to the thermal efficiency and efficiency of the Kalina cycle, which has important implications for the limitation of the pressure value of our unit. If the Kalina cycle thermal efficiency is negative, it means that the system’s power generation is not enough to provide the power that is consumed by the system. Where it is always positive, it means that no additional power supply is needed for the power generation of this device.
4.2. Characteristics and Layout of Power Generation Fans
The speed characteristics and corresponding power generation of a single power generation fan are shown in Figure 8.
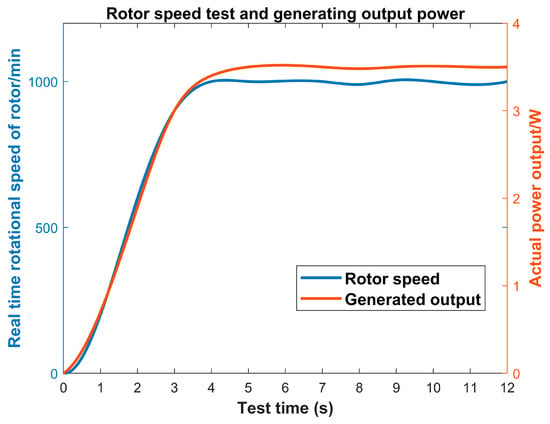
Figure 8.
Test diagram of rotor speed and corresponding power output.
The rotor speed selected for this power generation unit was experimentally tested to reach a full load speed of 1000 revolutions per minute under the airflow action, taking 3 s to reach a speed of 1000 revolutions per minute. The experimental results show that the rotor can last about 186 s at full speed in one cycle. The correlation between power generation and rotor speed is good. On this basis, the power generation capacity of the turbine is studied in this paper.
In the turbine device, the blades of each power generation fan are processed from stainless steel 316, which contains molybdenum, an element which has better resistance to chloride corrosion and heat resistance. This is different from the shell material of the thermoelectric power generation device, stainless steel 316 L. The stainless steel 316 material used for making power generation fan blades has better strength and is more suitable for the internal high-pressure impact environment. The maximum voltage amplitude generated by each rotor inside the turbine ranges from 0 to 12 V. The voltage amplitude changes with the rotor speed, and the output current amplitude ranges from 0 to 0.3 A, which also changes with the rotor speed. Therefore, there is a high correlation between the power generated by each power generation fan and the speed of the rotor. As the current generated in the turbine needs to be rectified and filtered in the future, we are more concerned about the power generation of the turbine, that is, the size of the current.
In an ideal situation, the amount of electricity or power generated after a cycle is related to the number of rotors in the turbine. However, due to a total of three sets of turbines, a maximum of four rotors can be placed in series in each set, so there are 43 = 64 possibilities for their arrangement and combination. We consider the equivalent variation in the number of generating fans in each turbine. In practical applications, we select an equal number of rotors from each chamber for testing. That is, one group of rotors, two groups of rotors, three groups of rotors, or four groups of rotors are used in each of the three turbines. From these 4 sets of test results, if necessary, we can also calculate the remaining 60 sets.
4.3. Data Comparisons
Three sets of turbines were set up between the first gas chamber and the second gas chamber, and four sets of rotors were staggered in each set of turbines. The four sets of rotors were strung together for the test, and similarly, the pressure valve was opened when the ammonia pressure of the first gas chamber was set at 0.5 MPa for this test.
The output power of the four sets of rotors is shown in Table 2, and their cumulative output power is shown in a visual line graph in Figure 9a.

Table 2.
Output power of three sets of turbines between the first and second chambers.
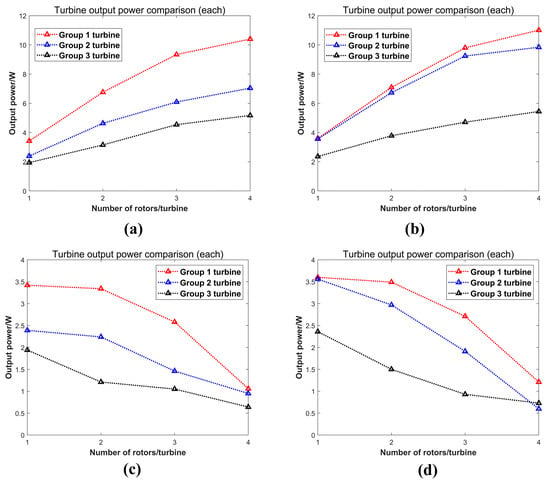
Figure 9.
Output power diagram and differential diagram for two sets of experiments.
When calculating the output power, three sets of turbines were also set between the second and third chambers, with four sets of rotors staggered in each set of turbines. Four sets of rotors were tested in series; similarly, when the ammonia pressure of the first chamber was set to 0.5 MPa, the pressure valve opened.
The output power of the four sets of rotors is shown in Table 3, and their cumulative output power is shown in a visual line graph in Figure 9b.

Table 3.
Output power of three sets of turbines between the second and third chambers.
As shown in Figure 9c,d, we can obtain the output power of each rotor by making a difference. The output power will change with the rotor speed.
Each group of fan generation power reached about 3 W and could light a 12 V/3 W indicator. From three groups of power generation fans, power generation efficiency and airflow energy loss began to be observed. Airflow slowed down, of course, related to front fan blocking and airflow disturbance related.
However, when we compare the turbine between the second and third air chambers with the turbine between the first and second air chambers, we can find that the combined power generation of the turbine between the second and third air chambers is greater than that of the turbine between the first and second air chambers; this follows the experimental expectations, because although the fluid air pressure required when the two air pressure valves are opened is equal, their fluid flow is unequal, and the total fluid flow between the first and second air chambers is significantly greater than that of the first air chamber, which means that the rotor in the turbine between the second and third air chambers spins longer and generates more power for a more extended time, as verified by the difference between the cumulative output power of 26.29 W and 22.61 W.
4.4. Compensation Gain of Phase Change Materials
In the phase change compensation section, we mainly applied inorganic phase change energy storage materials, which have the advantages of high phase change enthalpy, high thermal conductivity, high energy storage density, easy access, and low cost. Mainly used in fields such as solar energy utilization, industrial waste heat recovery, and building material manufacturing, the phase change compensation section adds porous structured fumed silica to disodium hydrogen phosphate dodecahydrate [21]. The results show that adding porous structured fumed silica can reduce the undercooling of composite phase change materials from 14.4 °C to 4.1 °C [22]. The research on phase change compensation also explores the addition of nucleating agents, such as nano graphite powder, multi-walled carbon nanotubes, nano TiO2, and nano Al2O3 (solute) to sodium hydrogen phosphate dodecahydrate (solvent), and then the process of heating and melting them in a 65 °C constant temperature water bath to modify them.
For phase-change-compensated power generation, its phase change materials should be matched to the needs of the environment, and the temperature of its vaporization point is related to the ratio of phase change materials. The power generation of the phase change compensation device is one order of magnitude lower than that of the Kalina cycle; its main function is reflected in the problems of self-floating and self-sinking. The aspect of phase change compensation will also be the focus of our next study. Therefore, its power generation and its gain to the overall device will not be carefully explored here. As shown in Figure 10, this paper only describes its working gain process.
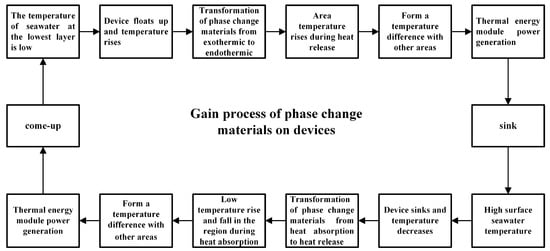
Figure 10.
Working process.
5. Discussion and Conclusions
For the dynamic ocean temperature difference energy generation device based on phase change compensation, by simulating the seawater environment for testing, the overall output power of the device was obtained, the maximum output power being about 26 W. During the ascent, the device will go through 3 cycles with a total output of 4.17 Wh. The dynamic thermoelectric power generation device has been granted a national invention patent. In addition, the thermal efficiency and functional transformation of the device was investigated, and it was shown that the Kalina cycle thermal efficiency of the small-scale temperature difference energy generation device can be increased from +0.19% to +0.88% under the condition that the evaporation pressure changes from 0.4 MPa to 0.6 MPa with a particular concentration of ammonia. Furthermore, by adding phase change materials to change the buoyancy of the device to achieve self-floating and self-sinking, the phase change materials can also form a local temperature difference to compensate for the temperature difference while changing the overall buoyancy of the device to achieve self-power generation during the process of the surfacing and diving of the device, so the development of this temperature difference energy generation device can provide a power supply for ocean observation devices, especially the Argo buoy device. Indeed, this device can extend the endurance of deep-sea exploration devices by 20%. This experimental study is mainly a pioneering exploration of the utilization direction of miniaturized marine thermal energy. The device’s output power cannot be compared with that of large-scale land-based power stations, and there are no public data available for similar-sized installations. The development of this temperature differential energy generation device can provide a power supply for ocean observation devices; after further reducing its volume, it can also be used for underwater vehicles, especially for the Argo buoy devices, which can extend the endurance of deep-sea exploration devices. The development of a device that can provide considerable power for miniaturized ocean exploration equipment in the future is highly significant.
However, the experiments conducted in this paper on the effectiveness of the dynamic ocean temperature difference energy generation device based on phase change compensation have the following limitations:
- The principle prototype, not the complete device, was used in the experiments, and the strength of the principle prototype cannot be adapted to the natural working environment in the South China Sea, such as the pressure found 2000 m underwater.
- The experiment was not conducted following the idea of making the device move in hot and cold seawater. However, we fixed the device in a pool to simulate the working environment of the device by changing the water temperature.
- When measuring the physical quantities, such as the power generation and power of the device, the values were uniformly taken to three decimal places. Overall, the research on the effectiveness of dynamic ocean temperature difference energy generation devices based on phase change compensation is of great significance regarding the provision of a power supply for ocean observation devices and the extension of the endurance of detection devices.
Author Contributions
R.D. conceived of the study, designed the study, and wrote the manuscript. L.D. and J.L. provided guidance on the ideas and mathematical treatment. Z.L., J.Y. and M.H. compiled the experimental data. X.L. assisted in the editing of manuscripts. All authors have read and agreed to the published version of the manuscript.
Funding
This work was supported by the National Key R&D Program for Major Scientific Instruments Special Project: Marine Physical Property Parameter Monitor (Project No. 2018YFF01014100). Project funding of 15.56 million RMB.
Institutional Review Board Statement
Not applicable.
Informed Consent Statement
Not applicable.
Data Availability Statement
Not applicable.
Conflicts of Interest
The authors declare no conflict of interest.
References
- Melikoglu, M. Current status and future of ocean energy sources: A global review. Ocean Eng. 2018, 148, 563–573. [Google Scholar] [CrossRef]
- Rhinefrank, K.; Agamloh, E.; von Jouanne, A.; Wallace, A.; Prudell, J.; Kimble, K.; Aills, J.; Schmidt, E.; Chan, P.; Sweeny, B.; et al. Novel ocean energy permanent magnet linear generator buoy. Renew. Energy 2006, 31, 1279–1298. [Google Scholar] [CrossRef]
- Rehman, S.; Alhems, L.M.; Alam, M.M.; Wang, L.; Toor, Z. A review of energy extraction from wind and ocean: Technologies, merits, efficiencies, and cost. Ocean Eng. 2023, 267, 113192. [Google Scholar] [CrossRef]
- Silva, R.N.; Nunes, M.M.; Oliveira, F.L.; Oliveira, T.F.; Junior, A.B.; Pinto, M.S.S. Dynamical analysis of a novel hybrid oceanic tidal-wave energy converter system. Energy 2023, 263, 125933. [Google Scholar] [CrossRef]
- Liu, L.; Meng, X.; Miao, Z.; Zhou, S. Design of a novel thermoelectric module based on application stability and power generation. Case Stud. Therm. Eng. 2022, 31, 101836. [Google Scholar] [CrossRef]
- Lu, H.; Wang, D.; Li, Y.; Li, J.; Li, X.; Kim, H.; Serikawa, S.; Humar, I. CONet: A Cognitive Ocean Network. IEEE Wirel. Commun. 2019, 26, 90–96. [Google Scholar] [CrossRef]
- Hossain, A.; Azhim, A.; Jaafar, A.B.; Musa, M.N.; Zaki, S.A.; Fazreen, D.N. Ocean thermal energy conversion: The promise of a clean future. In Proceedings of the 2013 IEEE Conference on Clean Energy and Technology (CEAT), Langkawi, Malaysia, 8–20 November 2013; pp. 23–26. [Google Scholar]
- Geng, D.; Gao, X. Thermodynamic and exergoeconomic optimization of a novel cooling, desalination and power multigeneration system based on ocean thermal energy. Renew. Energy 2023, 202, 17–39. [Google Scholar] [CrossRef]
- Heydt, G.T. An assessment of ocean thermal energy conversion as an advanced electric generation methodology. Proc. IEEE 1993, 81, 409–418. [Google Scholar] [CrossRef]
- Kalina, A.I. Generation of Energy by Means of a Working Fluid, and Regeneration of a Working Fluid. United States Patent 4346561, 31 August 1982. [Google Scholar]
- Kalina, A.I. Combined Cycle and Waste Heat Recovery Power Systems Based on a Novel Thermodynamic Energy Cycle Utilizing Low-Temperature Heat for Power Generation; American Society of Mechanical Engineers: New York, NY, USA, 1983; Paper No. 83-JPGC-GT-3; pp. 1–5. [Google Scholar]
- Kalina, A.I. Combined-cycle system with novel bottoming cycle. ASME J. Eng. Gas Turbines Power 1984, 106, 737–742. [Google Scholar] [CrossRef]
- Tiktas, A.; Gunerhan, H.; Hepbasli, A. Single and multigeneration Rankine cycles with aspects of thermodynamical modeling, energy and exergy analyses and optimization: A key review along with novel system description figures. Energy Convers. Manag. X 2022, 14, 100199. [Google Scholar] [CrossRef]
- Herrera, J.; Sierra, S.; Ibeas, A. Ocean Thermal Energy Conversion and Other Uses of Deep Sea Water: A Review. J. Mar. Sci. Eng. 2021, 9, 356. [Google Scholar] [CrossRef]
- Zhang, H.; Ma, X.; Yang, Y. An External Ocean Thermal Energy Power Generation Modular Device for Powering Smart Float. Energies 2022, 15, 3747. [Google Scholar] [CrossRef]
- Soto, R.; Vergara, J. Thermal power plant efficiency enhancement with Ocean Thermal Energy Conversion. Appl. Therm. Eng. 2014, 62, 105–112. [Google Scholar] [CrossRef]
- Chen, F.; Liu, L.; Peng, J.; Ge, Y.; Wu, H.; Liu, W. Theoretical and experimental research on the thermal performance of ocean thermal energy conversion system using the rankine cycle mode. Energy 2019, 183, 497–503. [Google Scholar] [CrossRef]
- Ikegami, Y.; Yasunaga, T.; Morisaki, T. Ocean Thermal Energy Conversion Using Double-Stage Rankine Cycle. J. Mar. Sci. Eng. 2018, 6, 21. [Google Scholar] [CrossRef]
- Kai, W.; Yue, F. Numerical study on the formation of the South China Sea Warm Current I. Barotropic case. Chin. J. Oceanol. Limnol. 2001, 19, 1–9. [Google Scholar] [CrossRef]
- Thirugnana, S.T.; Jaafar, A.B.; Yasunaga, T.; Nakaoka, T.; Ikegami, Y.; Su, S. Estimation of ocean thermal energy conversion resources in the east of Malaysia. J. Mar. Sci. Eng. 2021, 9, 22. [Google Scholar] [CrossRef]
- Xie, N.; Huang, Z.; Luo, Z.; Gao, X.; Fang, Y.; Zhang, Z. Inorganic salt hydrate for thermal energy storage. Appl. Sci. 2017, 7, 1317. [Google Scholar] [CrossRef]
- Peng, S.; Huang, J.; Wang, T.; Zhu, P. Effect of fumed silica additive on supercooling, thermal reliability and thermal stability of Na2HPO4·12H2O as inorganic PCM. Thermochim. Acta 2019, 675, 1–8. [Google Scholar] [CrossRef]
Disclaimer/Publisher’s Note: The statements, opinions and data contained in all publications are solely those of the individual author(s) and contributor(s) and not of MDPI and/or the editor(s). MDPI and/or the editor(s) disclaim responsibility for any injury to people or property resulting from any ideas, methods, instructions or products referred to in the content. |
© 2023 by the authors. Licensee MDPI, Basel, Switzerland. This article is an open access article distributed under the terms and conditions of the Creative Commons Attribution (CC BY) license (https://creativecommons.org/licenses/by/4.0/).