1. Introduction
The size of container vessels is growing, resulting in ULCVs being able to transport over 20,000 TEUs. According to [
1], the number of shipping lines has declined, but the average capacity of container vessels grew by 25% between 2014 and 2018. In 2017, the first vessel of this size entered service: the MOL Triumph, with an overall length of 400 m and a beam of 58.8 m. The ULCV fleet accounted for 18% of the total container capacity in 2017 [
2], and 31% of the total capacity deployed in the second quarter of 2018 [
1].
Until 2019, Hong Kong-based OOCL owned the world’s largest container vessel; the 21,413 TEU ‘OOCL Hong Kong’, launched in 2017. Currently, the world’s largest container vessel is the HMM Algeciras, with 23,964 TEUs, which entered service in April 2020 [
3]. The vessel, with a beam of 61 m, length of 400 m, and a draft of 16.52 m, was the first of seven giants built by the South Korean DSME. These vessels have been named Megamax 24 by [
4], characterized by featuring 24 rows in breadth. French shipping major CMA CGM delivered nine 23,000 TEU container vessels, with the CMA CGM JACQUES SAADE being the world’s largest container vessel powered by LNG [
5]. COSCO has designs for new ULCVs with a 25,000 TEU capacity approved by China’s state-owned shipbuilding company [
6]. Today, there are 139 Megamax vessels ranging from 18,000 to 24,000 TEUs, becoming the standard vessel on many east–west mainlines, based on [
7]. Alphaliner analyzes the Gigamax, a hypothetical container vessel of up to 28,880 TEUs, and weighs the pros and cons of such a design.
Further into the future, a report on container shipping by [
8] mentions the possibility of 50,000 TEU vessels, but probably no bigger, by 2067. In the future, progress in container vessels will probably be much slower than in the past decades. Until demand catches up with supply, there will not be orders for bigger vessels. This will likely occur further ahead, considering that it is also possible to catch up with more vessels of smaller size. Container trade growth has slowed since the financial crisis, but it continues to grow. Ref. [
9] predicted a container fleet growth from 0.25 billion dwt in 2015 to 0.5 billion dwt in 2050. Ref. [
10] predicted a future ULCV of 30,000 TEU by 2025. The results were based on a regression analysis of vessel sizes and the constraints found in port infrastructures and operations regarding waiting times and cargo handling. Ref. [
11] analyzed the growth of container vessel size since the Emma Maersk in 2006 and presented a methodology for forecasting the size of container vessels.
This rapid increase in size is due to mass transportation, which reduces the cost per TEU, allowing for economies of scale. The vessels’ capacity increase improves reliability and reduces shipping costs. This is possible thanks to strategic partnerships between companies and their capability to collect cargo. Ports need to adapt their infrastructures, which are designed to last 100 years or more, based on the uncertainty of the future ULCV, which only has projected lifetimes of 20 years [
10]. The increasing size of these ULCVs poses not only challenges for the design of container cranes, quay walls, and other maritime infrastructure, such as access channels, turning and port basins, and berth pockets, but also for the design of the mooring system, as well as on the operability of cargo handling activity and the safety of staying at berth.
The mooring system, including mooring lines, bollards, and fenders, has to cope with external forces expected in the form of wind, waves, currents, and passing ships on moored ships. As these loads, and therefore potentially also the moored ship motions, are expected to become larger with the increasing size of the container vessel fleet, this can have various negative impacts for ports and marine terminals, including:
Hampering cargo handling operations due to large motions of a moored vessel, resulting in operational downtime of the terminal or lowered terminal productivity. According to [
12], a marine operation encounters downtime if its operational limit is exceeded during project execution. The document provides insights into the available methods for downtime analysis in different categories of marine operations and examines the applicability of a new stochastic model for use in downtime simulations for complex projects. Ref. [
13] presented a tool for predicting met-ocean risks at port areas of operational interest (AOI). AOIs are defined as port areas with the same functional activity, sharing infrastructure typologies and handling equipment, same land use, and exposed homogeneously to physical agents. Ref. [
14] assessed the main approaches to address the operability of berthed vessels and to explore present and future strategies, highlighting the importance of addressing each dock and anchorage in a specific way, broadening field monitoring, and considering the specific perception and experience of all port customers.
Damaging the mooring system due to large loads and endangering the vessel’s crew and terminal personnel. Ref. [
15] developed a risk assessment of major accidents in port areas.
From an operational point of view, there are constraints regarding passing-ship effects on moored vessels. As container vessels grow in size, passing-ship effects become more adverse, hindering loading/unloading operations. This is why it is important to define limits regarding passing distance and speeds for ULCVs in the long term. MARIN developed passing-ship studies for a Panamax moored vessel and a 12,500 TEU passing-ship with a motion limit criteria of 0.15 kN. Limiting conditions were reached at a distance of 75 m and 6.5 knots, without drift angle. The study showed that conditions worsen when there is a drift angle, especially towards the terminal (negative angles).
Additionally, wind also becomes more severe due to the increase in windage area. An example of the effect of wind forces for different wind directions is presented in [
16], which shows that quartering wind directions create the biggest forces on the moored lines, and not the off-quay winds from 90° N (related to quartering larger yaw movements combined with high sway forces).
The adverse impact of the harbor oscillation phenomenon induced by long waves on the normal operation of the port, which in turn affects ship motion and the mooring system, has been established in recent studies such as [
17,
18]. Past research has focused on the analysis of future expected container vessel sizes, based on market conditions, workload limitations at the terminals, and physical limits [
10]. Other studies have examined the motion of moored vessels and the effect of passing ships under current conditions [
19], presented a numerical evaluation of waves generated by passing ships, propagation, and agitation related to harbor downtime management [
20], and studied the sensitivity of the vulnerability of port areas of operational interest to climate change [
21]. However, there is a gap in the literature regarding the quantification of the effect of future ULCVs, both moored and passing with dynamic wind conditions, on the mooring system and operations, which is the focus of the present study. It should be noted that for the present study, neither waves nor infragravity waves have been taken into account as the study zone is a high-sheltered area.
Therefore, this study aims to determine the impact of ULCVs subjected to dynamic wind conditions and passing-ship conditions by performing a Dynamic Mooring Analysis (DMA). In addition to analyzing the limitations of present mooring systems and proposing mitigating measures, this study also explores the potential of new and innovative mooring technologies to address the challenges posed by ULCVs. The use of advanced materials, such as high-strength synthetic ropes and smart mooring systems, is examined as a means to reduce the loads on the mooring equipment and enhance the safety of mooring operations. Furthermore, the study opens the scope to addressing the challenges of ULCVs, considering not only the technical aspects but also the economic and regulatory implications of adopting new mooring technologies, and the potential cost savings and benefits to the wider maritime industry, as well as the regulatory frameworks that would need to be put in place to ensure the safe and effective use of new mooring systems. Overall, this study provides a comprehensive and innovative analysis of the challenges posed by ULCVs and the potential solutions that can be employed to ensure the safe and efficient handling of these vessels at container terminals. By considering the technical aspects of mooring operations, the study offers valuable insights into the future of maritime infrastructure and operations.
The study fills a gap in research as there are no studies that quantify the possible effect of future ULCVs, both moored and passing with dynamic wind conditions, on the mooring system and operations. The study takes into account the impact of dynamic wind conditions and passing-ship conditions on the mooring system, which is a critical aspect that can have various negative impacts for ports and marine terminals, including hampering cargo handling operations, damaging the mooring system, and endangering the vessel’s crew and terminal personnel. The study uses a numerical evaluation of waves generated by passing ships, propagation, and agitation related to harbor downtime management, which helps to assess the impact of passing-ship conditions on the mooring system and operations. The study aims to determine the impact of ULCVs subjected to dynamic wind conditions and passing-ship conditions by performing a sensitivity analysis, which is a robust methodology that can help identify the critical parameters and the range of variations that affect the results. The study is relevant to the industry as it addresses the challenges posed by the increasing size of ULCVs on ports and marine terminals, which require adaptations in infrastructure and operations to ensure safety and efficiency and to improve future port procedures and restrictions related to terminal requests, ship characteristics, and safe mooring protocols.
2. Methodology
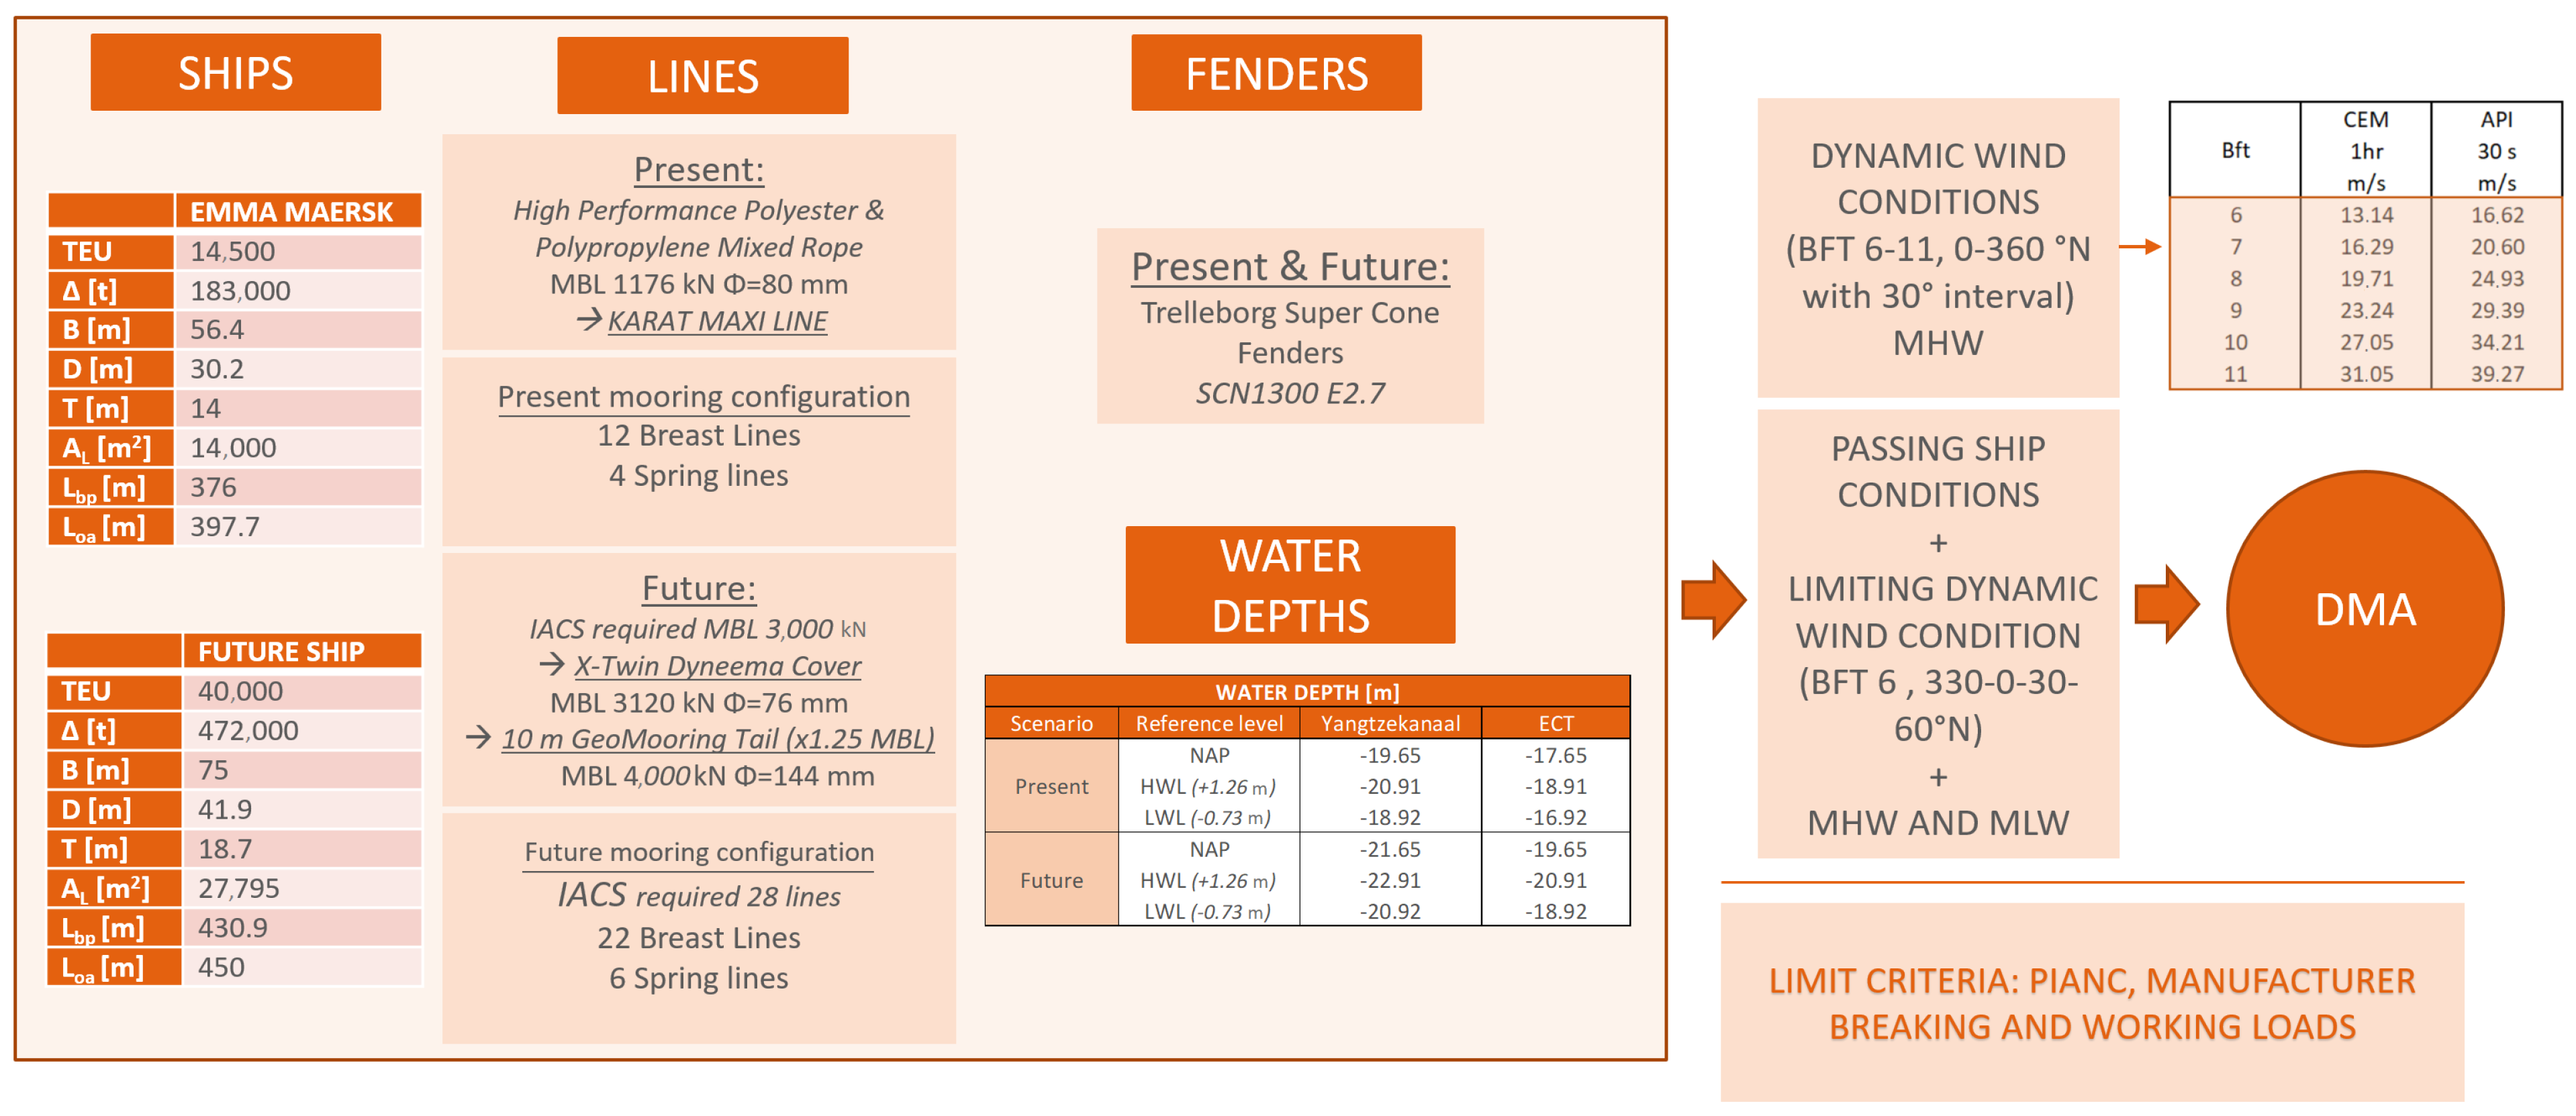
The applied methodology begins by defining the state of the art of the current situation of container vessels and terminals. Future predictions on container vessel sizes and their impacts on port infrastructure, equipment, and operations are studied. Based on this analysis and taking into account the problems of the port, present and future scenarios are prepared regarding container vessel sizes and mooring configurations. The DMA modeling approach is presented in
Figure 1.
In order to perform the DMA, it was necessary to first identify the main geometry of the terminal, as it has a great influence on how exposed the moored vessel is to external forces and how it reacts to them, as shown in [
22]:
Type of quay structure: it is important to know if it is an open or closed structure and the distance to the structure defined by the fenders, as this has an impact on the vessel hydrodynamics (added mass and damping) and also on wind shielding.
Design (high and low) water levels must also be defined in the area as this affects the ship hydrodynamics and the vertical mooring line angles and, therefore, their effectiveness in restraining horizontal moored ship motions.
Port configuration: in order to know how the terminal is affected by waves, currents, wind conditions, and passing-ship conditions.
Then, the applicable mooring system parameters and environmental conditions that may vary in time can be modeled:
Account for the effect of waves on the vessel.
Consider the effect of wind on the vessel.
Analyze the effect of currents on the vessel.
Incorporate the effect of other external forces (e.g., passing-ship effects).
Model the behavior of mooring lines, including hysteresis effects.
Evaluate the impact of fenders, including hysteresis effects.
Study the behavior of chains and anchors.
Wind forces are computed as a function of the (time-varying) wind speed and direction relative to the vessel. Therefore, wind forces include the effect of the vessel’s own motion. Wind conditions are represented with ten randomized realizations (seeds) from an API (American Petroleum Institute) spectrum. Results (vessel motions and mooring system loads) are then averaged over the seeds to obtain more reliable values.
To evaluate the passing-ship effect, passing distance and speed scenarios are obtained through a statistical analysis of AIS (Automatic Identification System) data in the channel in front of the terminal. This data includes all the spatial-temporal tracks of the vessels passing in the channel within a selected time period. It is recommended to study a time range long enough to correctly identify the relevant passing-ship type, size, speed, and distance scenarios. In this study, one year of AIS data were analyzed, which required an efficient algorithm to process the large amount of information.
Passing-ship forces exerted on the moored vessel were obtained with the software ROPES, developed by PMH (Pinkster Marine Hydraulics), for the prediction of vessel–vessel interaction forces in (shallow) water for six degrees of freedom, as described in [
23,
24]. The ROPES computational tool assumes that the pressures originating from the passing ship can be described by double-body 3D potential theory, thus neglecting free surface effects, fluid rotation, and viscous effects. The obtained results proved that ROPES accurately computes the passing forces exerted on the moored vessel. Passing-ship forces are implemented in the DMA as time-varying external forces acting on the vessel at the center of gravity. Signals were repeated five times in simulations of four hours with a slow start of one hour, during which forces slowly increased to avoid sudden impulses at the start of the simulation.
The software SHIP-Moorings (SM), developed by ARCADIS Nederland, was used to perform the DMA. SM simulates the dynamic behavior of a vessel moored to a quay or a jetty, against fenders and secured with mooring lines in a defined pre-tension, or special mooring devices, under conditions of wind, waves, currents, or passing-ship conditions. SM computes motions by solving the equation of motion in six degrees of freedom in the time domain, providing information about the resulting vessel motions and efforts on lines, bollards, and fenders.
where
M is the (6 × 6) inertia matrix.
is the velocity vector with the 6 velocity components.
is the total sum of all external forces acting on the vessel.
F represents the external forces acting on the ship.
M is the inertia matrix of the ship.
A is the added mass coefficient matrix.
C is the hydrostatic restoring matrix.
X represents the ship motions
K is the matrix of retardation functions [
25].
The model is based on a freely-floating ship response previously characterized in the frequency domain by means of a 3D diffraction/radiation panel model [
26].
The model assumes that the x–z plane is a plane of symmetry for the vessel for the definition of the vessel’s inertia and all external forces. It also assumes that the vessel is a rigid body with a constant and fixed mass distribution. The environmental conditions and mooring system parameters are modeled as forces that act on the vessel.
The model provides results in the form of a time series of the three-dimensional motion of the moored vessel (6DoF), as well as tension in the mooring lines and bollards, and compression in the fenders, all based on any type of vessel, loading condition, hull geometry, mooring, and fender configuration. The model is computationally efficient and therefore allows for the rapid execution of a large number of cases within the project. The model is fed by the following data blocks and input variables:
Ship data (previously modeled with a panel model): 3D description of the interaction between the ship and the dock, hydrostatic and mass/inertia properties, coefficients of static flow force (function of angle of attack), dynamic coefficients of flow force (rotational, damping), wind force coefficients (function of angle of attack), hydrodynamic characteristics of added mass, wave force transfer, delay functions, and hydrodynamic and aerodynamic interaction effects in the case of multiple bodies.
Meteorological and oceanographic data: bottom schematization (uniform or variable), current (uniform or variable in time and space), wind (uniform, spectral or variable in time defined by the user), waves (regular or irregular: significant wave height, peak period, frequency spectrum, wave direction, and directional spreading). Easy definition of different realizations of wind and wave time series (seeds).
Mooring data. Mooring lines and fenders can be selected from a database within the program, and additional lines/fenders can be easily added. Mooring data includes: geometry/configuration of fenders, mooring lines and bollards, typology and non-linear characteristics of lines and fenders, material, diameter, initial pre-tension in the lines, friction in the fenders, etc.
Validating the numerical model used for ship moorings is an essential step to ensure the accuracy of the results obtained. One common method used for validation is comparing the numerical model’s results with experimental data. For instance, researchers in [
27] validated the model general equations with experimental data, which involved measuring the forces on the mooring lines of a ship model in a towing tank. They found that the numerical model accurately predicted the forces on the mooring lines. Another method is comparing the numerical model’s results with analytical solutions. Researchers in [
28,
29,
30,
31] validated this set of equations by comparing the model’s results with analytical solutions for a single mooring line under different loading conditions. They found that the numerical model’s results were in good agreement with the analytical solutions. Overall, the validation of numerical models for ship moorings is critical to ensure that the results obtained are accurate and reliable. It is essential to use established validation methods to ensure that the model’s results are in line with real-world scenarios. ARCADIS ship mooring software is developed and maintained by Arcadis—a well-known global design, engineering, and management consulting firm that provides solutions for maritime engineering and infrastructure projects. They have extensive experience in the industry and have worked on many large-scale projects worldwide. It is likely that the software has undergone rigorous testing and validation internally by ARCADIS to ensure its accuracy and reliability.
The limit criteria for motions and loads follow the recommendations from PIANC and the mooring equipment breaking and working loads, as mentioned in references [
32,
33]. These criteria allow evaluating the impacts on operations and the safety of the mooring system.
Based on the conclusions drawn from the comparative DMA performed for two container ships of different sizes, it is possible to determine the main constraints regarding the mooring systems and operations in the long term and propose possible mitigating measures. This analysis will also serve to create practical ideas on how to raise awareness of port customers to the established mooring-related problems and their most effective mitigation measures. Finally, it will help draw general conclusions and recommendations applicable to other terminals.
3. Case Study
This analysis is based on a case study located at the Port of Rotterdam (The Netherlands), presented in
Figure 2, where several container terminals are in operation. The studied terminal is located next to a busy fairway and is exposed to offshore winds coming from the southwest, west, and north. This fairway leads to other container terminals, so the moored vessels are exposed to forces generated by passing ships. The terminal was not originally designed for the current and future ULCV sizes, which is why the Port of Rotterdam wants to determine their impacts and possible measures to take. The main concern is the mooring equipment, specifically, whether the existing bollards would be sufficient for these vessels. This is a problem that many ports are currently dealing with.
The input data were provided by the Port of Rotterdam for the case study at the terminal. The data include the terminal layout, the selected vessels based on the literature review, the mooring system, the environmental conditions, and the passing-ship conditions based on the AIS (Automatic Identification System) analysis results.
The input information was coded for the study, as shown below. Knowing the layout of the port has been relevant in defining the typology of the berthing quay wall, the adjacent depths, and the orientation of the jetty with respect to the incident wind directions. Regarding the study vessel, the provided information has allowed for building the numerical model that represents it geometrically and establishing the position of the bollards and the arrangement of lines required by the numerical tool (see
Figure 3 and
Figure 4). Additionally, the AIS data have been post-processed to define the distances and modal velocities of the vessels sailing in front of the study pier.
As a start, to set up the terminal layout for the DMA, we set a quay wall with a depth of NAP −17.65 m, with a maximum design depth of NAP −19.65 m.
The chosen approach started by defining the future container vessels. Future predictions on container vessel sizes and their impacts on port infrastructure, equipment, and operations were analyzed. Based on the literature review and the recommendations from the Port of Rotterdam, as our case study, a 40,000 TEU vessel was chosen to study possibilities for adapting the port infrastructure for this future ULCV, whose effect was compared to the Emma Maersk vessel as the present vessel example calling at the container terminals.
For the Emma Maersk, the current mooring arrangement was selected, and for the future vessel, the mooring arrangement was defined using International Association of Classification Societies (IACS) criteria [
34,
35].
The minimum breaking strength obtained following the IACS for the Emma Maersk is 1637 kN. However, the current lines being used are 1176 kN. This MBL results in an acceptable wind speed higher than the limit criteria of 21 m/s established by the mentioned guidelines (based on the DMA analysis). Therefore, the 1176 kN was chosen as the MBL. The Emma Maersk would require a total of 16 mooring lines following the IACS guidelines, with an MBL of 1176 kN and a WLL of 588 kN. The lines were separated into 12 breast lines and 4 spring lines, following the current arrangement. A pre-tension of 12.5% of the MBL of the lines was applied following the recommendations from the Port of Rotterdam.
Table 1 summarizes the future vessel characteristics used for the analysis, and
Figure 3 shows the defined mooring arrangement.
The future vessel would require a total of 28 mooring lines following the IACS guidelines, with an MBL of 3000 kN and a WLL of 1500 kN. The lines were separated with the same arrangement as the Emma Maersk, for comparative purposes and based on expert criteria, obtaining 22 breast lines and 6 spring lines. A pre-tension of 12.5% of the MBL of the lines was applied following the recommendations from the Port of Rotterdam.
Table 2 summarizes the future vessel characteristics used for the analysis and
Figure 4 shows the defined mooring arrangement.
Figure 5 shows a summary of the input parameters selected for the Dynamic Mooring Analysis, including vessel sizes, line and fender properties, and water depths. First, the DMA was performed exclusively with dynamic wind conditions ranging from wind classes BFT6 to 11, with 10 min averaged wind velocities from all directions in 30° intervals. Then, passing-ship conditions were analyzed together with wind class upper limit BFT 6 from off-quay directions (330° N–60° N), as this is the limiting operating wind condition when a vessel is passing, following the recommendations from the Port of Rotterdam.
To perform the passing-ship analysis, it is necessary to define the passing distances, speeds, and drift angles. These conditions were selected based on the pilot’s experience, the Port Authority, and the statistical analysis performed with the AIS data. Currently, vessels of the size of the Emma Maersk would not sail closer than 100 m between the moored and passing-ships’ hull. However, to appreciate the variability in passing-ship loads due to passing distance, a 120 m distance case has been chosen as an alternative. For the future vessel, it has been estimated that a distance of 100 m would be too close, and a reasonable minimum distance for this size of vessel could be 120 m instead. Similarly, to analyze the sensitivity due to passing distance, a scenario of 150 m has also been selected.
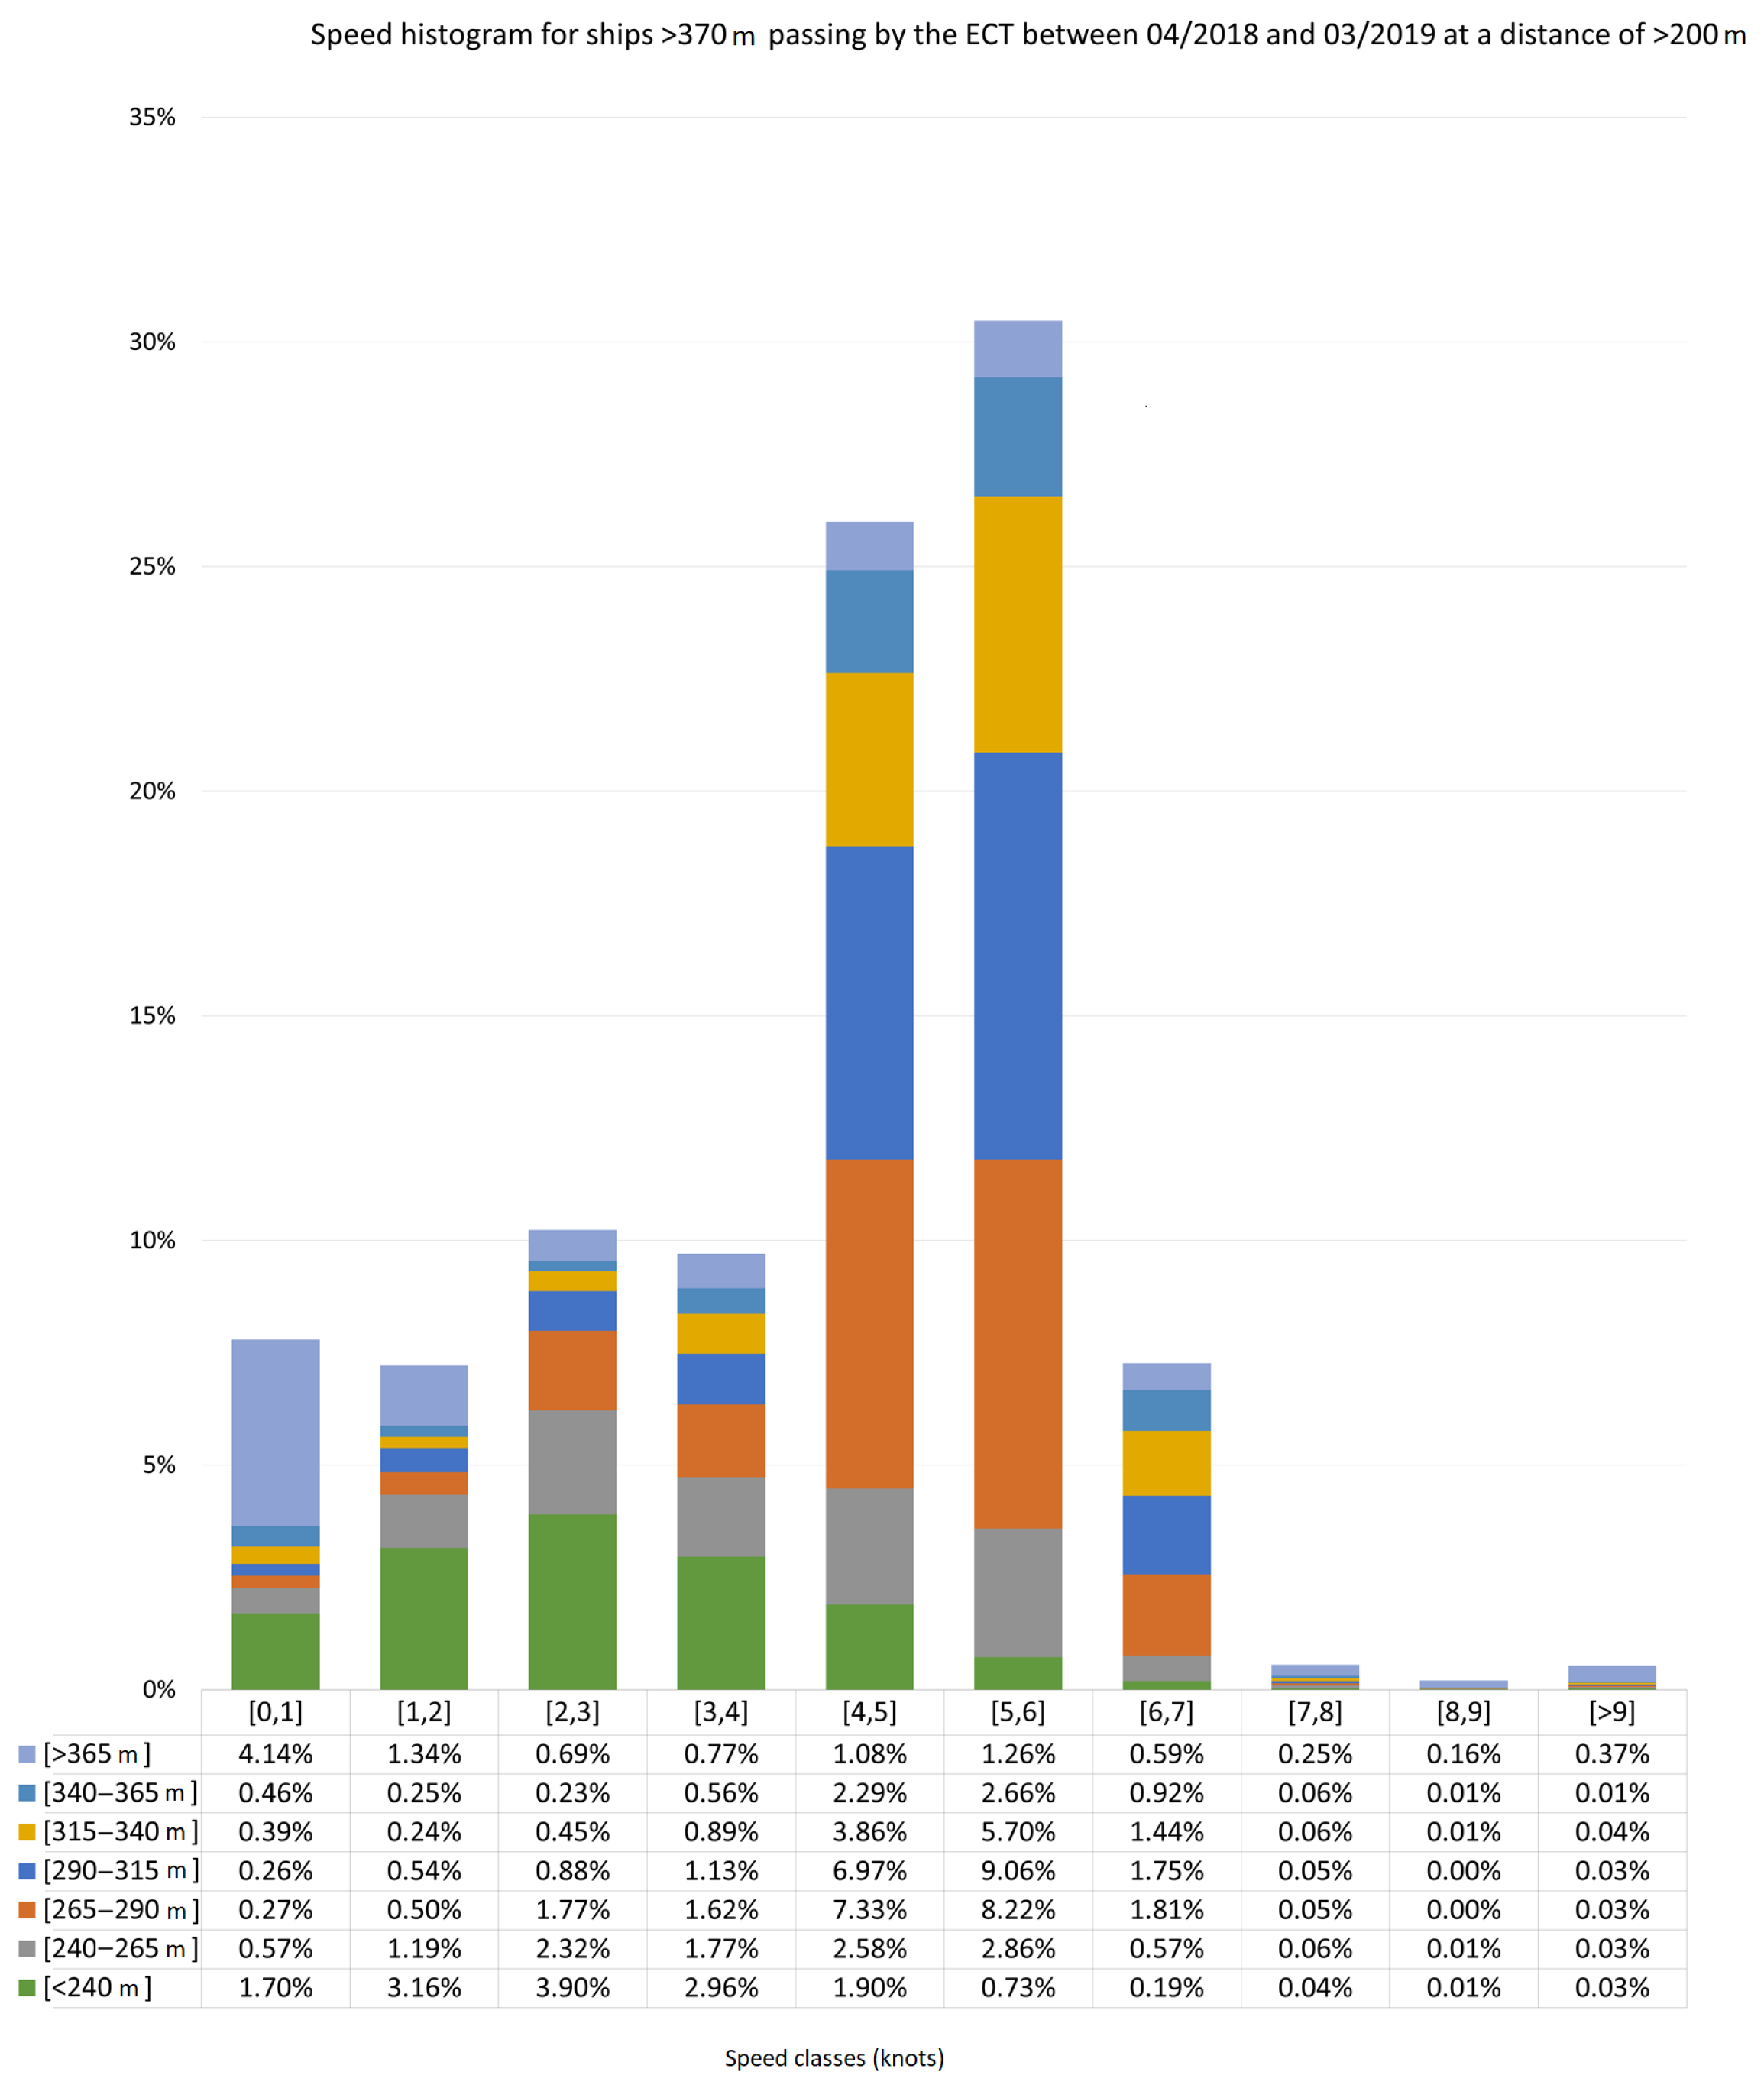
Passing speed scenarios are defined similarly to the passing distance. Currently, vessels of the size of the Emma Maersk would not sail along the channel, based on the pilots’ experience, at a speed faster than 4 knots. However, to appreciate the variability due to passing speed, simulations have also been conducted for 5 knots, both for the Emma Maersk and the future vessel, based on recommendations from the Port of Rotterdam. Besides, this decision can be supported by the AIS data, as shown projected in a map in
Figure 6 and as a histogram in
Figure 7, which demonstrates that most vessels pass at speeds of 4–6 knots.
It was also necessary to determine the water depth for the case study. The scenarios were modeled for Mean Low Water (NAP −0.73 m) and Mean High Water (NAP +1.26 m), obtained from the input data provided by the Port of Rotterdam. This was to appreciate the variability of the results with respect to water levels. Water levels are referenced with respect to NAP, which is the local reference level in the Netherlands. The difference at the terminal between NAP and LAT is 1.05 m; NAP is at −17.65 m and LAT is at 16.60 m.
The last simulations presented in the Dynamic Mooring Analysis included the use of ShoreTension
® modules. These modules pay out an additional mooring line under high tension, reducing motions and loads significantly. They only need electricity for an external hydraulic system during the start of operations [
36]. This is a new and improved mooring configuration recommended by the Port of Rotterdam for obtaining safer mooring conditions at the terminals.
During the wind conditions analysis, the ShoreTension® modules were placed as extra breast lines. During the passing-ship conditions analysis, they were placed as extra spring lines. The reason they are placed in these positions is that during wind scenarios, sway motions are dominant, and the breast lines are the mooring lines with the highest loads. During passing-ship scenarios, surge motions are dominant, and the spring lines are the mooring lines with the highest loads.
4. Test Program
The final test program both for dynamic wind scenarios and passing-ship conditions is presented in
Table 3 and
Table 4. A wind rose was obtained at the terminal based on the measured time series from 1999 to 2018, provided by the wind gauge located at the Noorderpier (
Figure 8). The lower limit of BFT 6 (13.14 m/s hourly wind) and upper limit of BFT 11 (31.05 m/s hourly wind) occurred 14.5% of the time and were considered for the dynamic wind conditions analysis.
5. Results
This section presents the results obtained from the Dynamic Mooring Analysis when comparing the Emma Maersk vessel with the future vessel for dynamic wind condition scenarios and dynamic wind conditions with passing-ship scenarios.
5.1. Dynamic Wind Condition Cases
Figure 9 and
Figure 10 show the significant surge and sway motion results, respectively, for different wind speeds and directions. Operations at the port are affected when significant surge and sway motions reach 0.4 m (indicated by the red lines in the figures), which is considered the limit at which cranes can still work based on PIANC guidelines.
In terms of surge motions, the Emma Maersk reaches the limit at the upper limit BFT 6, and the future vessel reaches its upper limit BFT 8, with a 19 m/s 10 min averaged wind. As for sway, the Emma Maersk reaches the limit even below the upper limit BFT 6, while the future vessel reaches the upper limit BFT 7, with a 15 m/s 10 min averaged wind. Sway motions are more critical than surge motions because they are the main motions influenced by dynamic wind conditions when blowing off the quay. Additionally, the motions on the future vessel are lower because the vessel is moored with more and stronger lines, based on the new IACS guidelines.
The scenarios simulated with ShoreTension® were selected as the first ones that exceeded the limit criteria for both sway and surge in the previous analysis. For the Emma Maersk, the upper limit BFT 7 was selected, and for the future vessel, the upper limit BFT 8 was selected. Only directions between 0° N and 60° N were selected because off-quay quartering directions are the most significant ones based on previous results.
To reduce sway motions and the loads in the mooring system, the Emma Maersk was simulated with two ShoreTension® modules in the breast lines, and the future vessel was simulated with four ShoreTension® modules in the breast lines. As a result, the surge motion was reduced below the limit criteria for both vessels. However, sway was still above the limit for winds coming from 0° N and 30° N, even if the motions were considerably reduced.
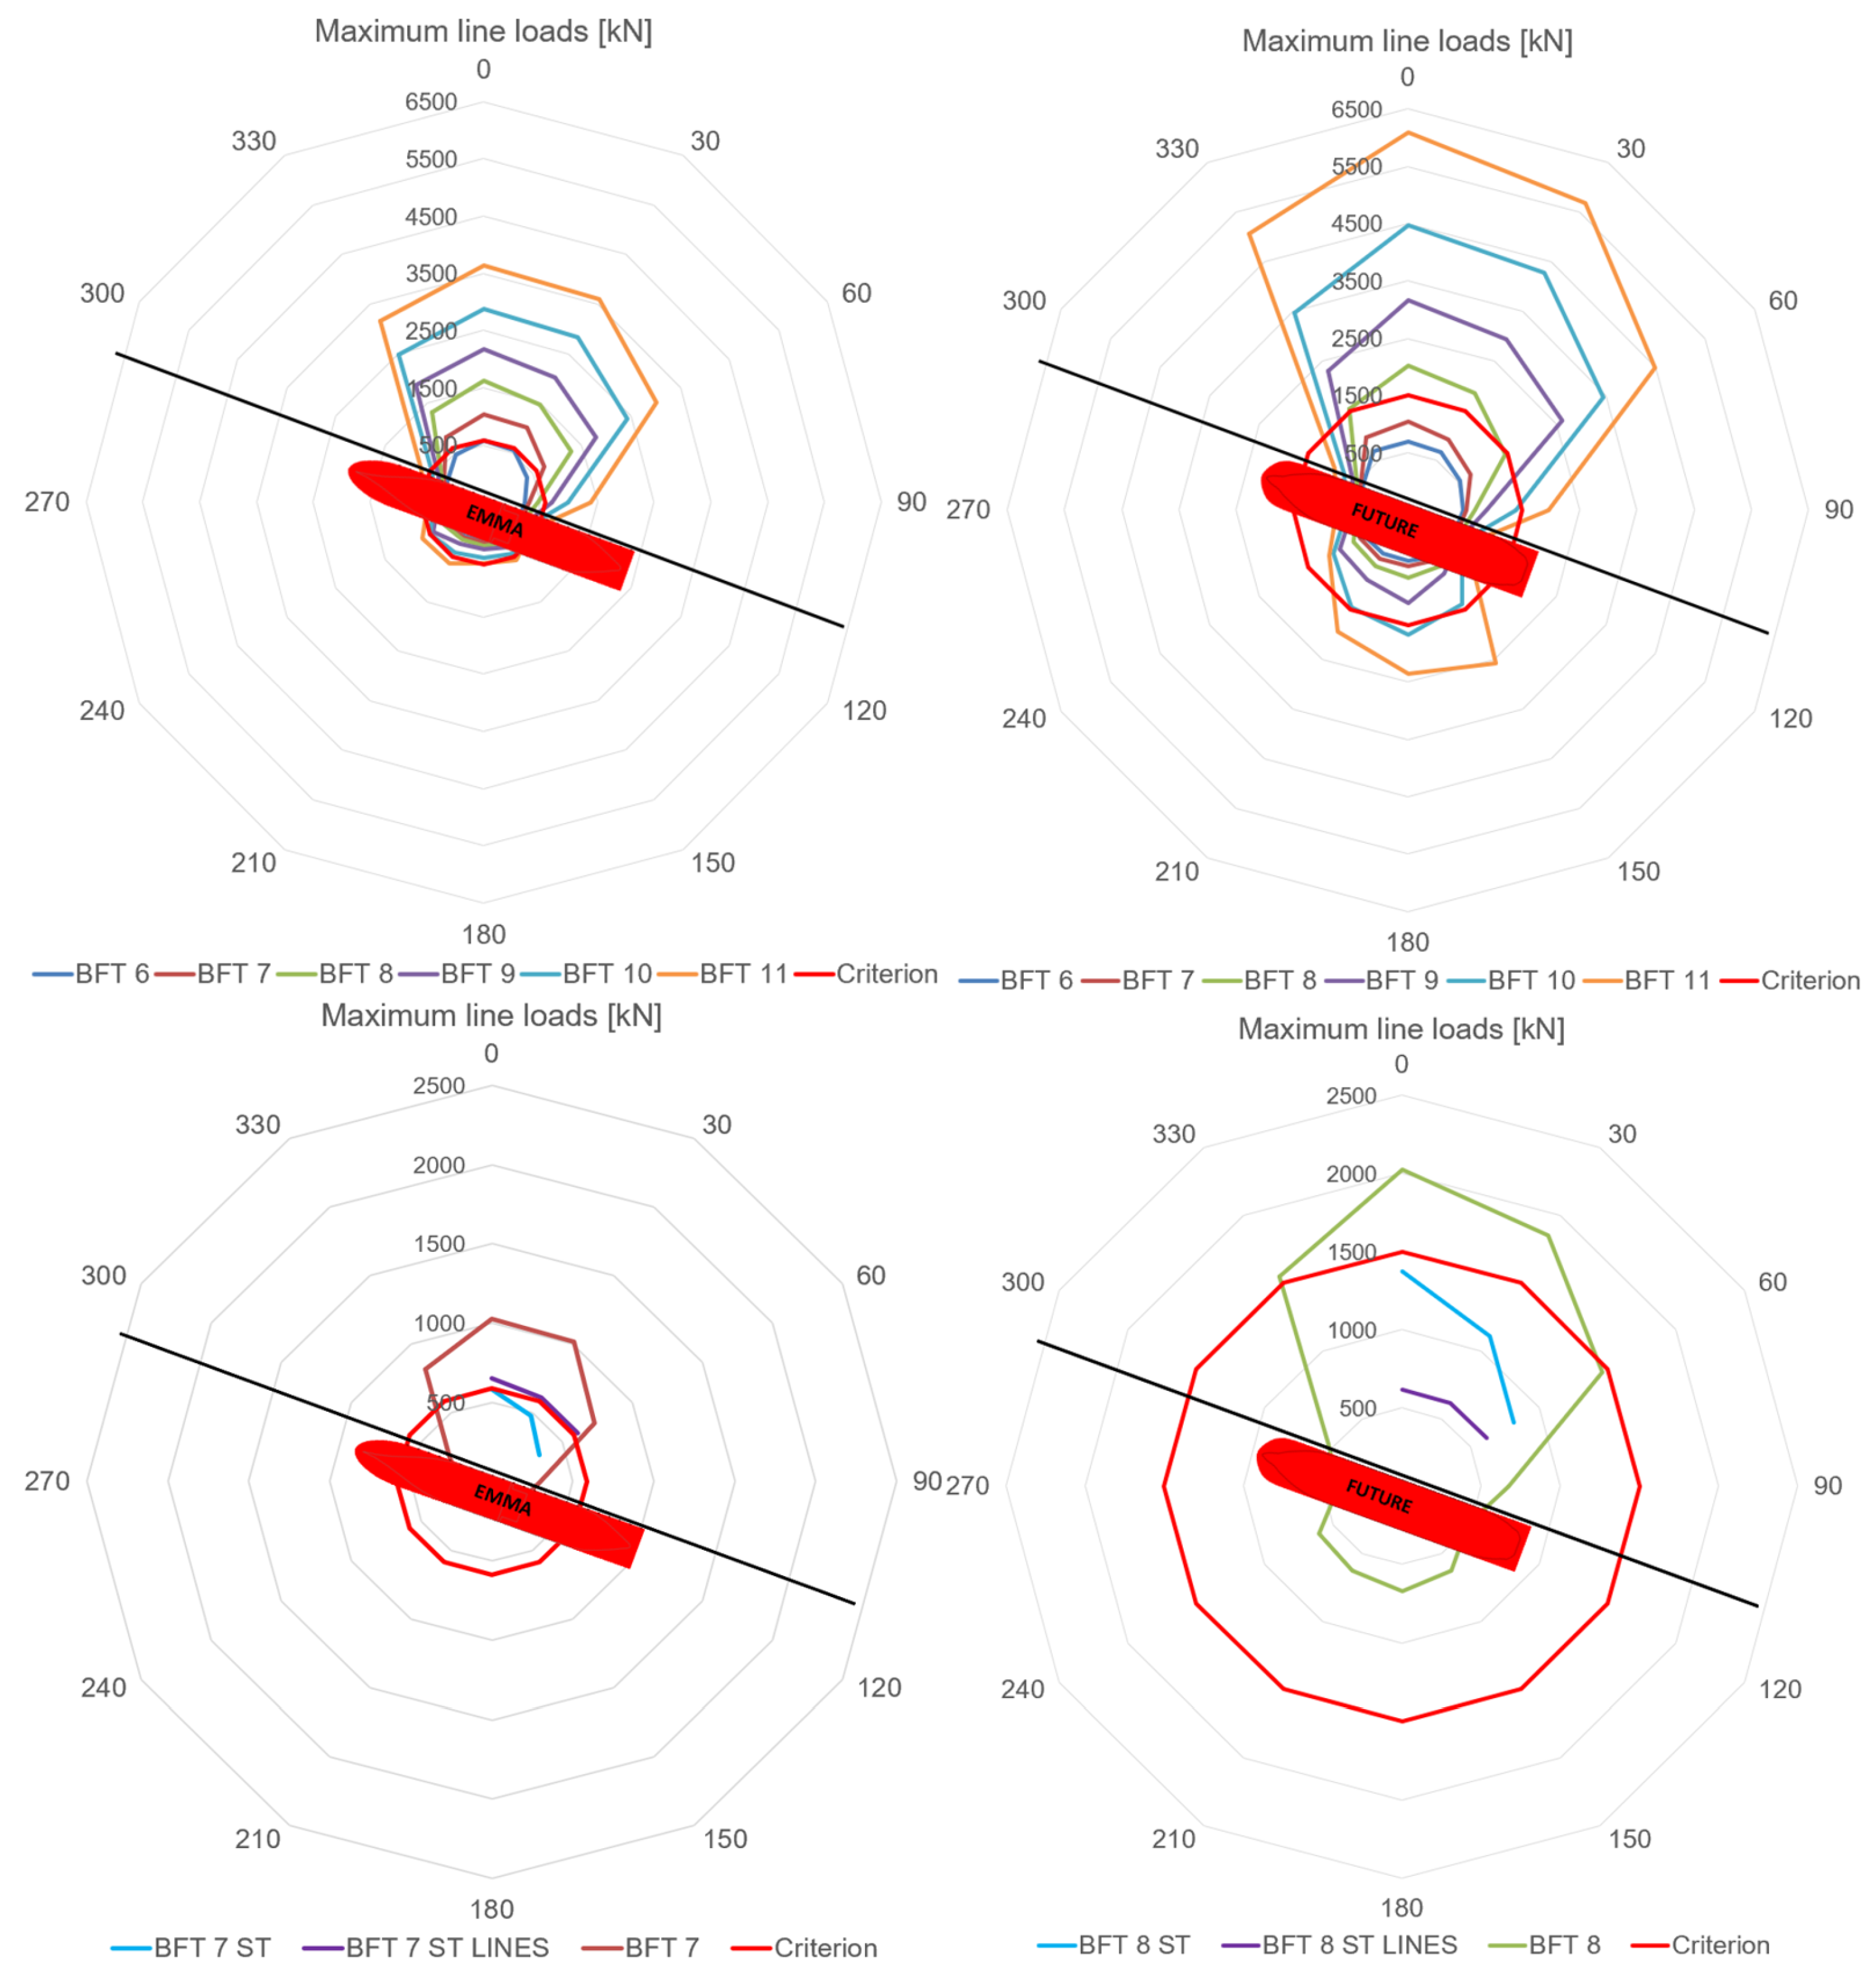
Figure 11 shows the maximum line load results for different wind speeds and directions with and without ShoreTension
® for both vessels. The maximum working load limit for the mooring lines in the Emma Maersk was 590 kN, and for the future vessel, it was 1590 kN, as indicated by the red line in the figures. The limit was reached in the Emma Maersk for the upper limit BFT 6, and for the future vessel, the upper limit was BFT 8. It is noticeable how the loads are higher for the future vessel compared to the Emma Maersk. The future vessel was subjected to higher forces because its windage area is bigger, as shown in
Figure 9. However, the motions were lower for the future vessel because there are more and stronger lines. The increased wind forces on the future vessel are represented in the line loads, which increased considerably compared to the Emma Maersk.
The line loads were represented for the regular scenario and the ShoreTension® scenario. For the latter, the maximum line loads were separated into the regular lines and the ShoreTension® lines. The maximum line loads in the regular lines were reduced below the limit criteria thanks to the ShoreTension® modules. The ShoreTension® lines start with a pre-tension of 12 t and then follow the curve up to 600 kN without paying out of the cylinder. Then, the cylinder pays out (loads stay at 600 kN) until its end. If loads still increase, it acts like a fixed bollard with SWL 150 t. If loads decrease, the cylinder retracts back to 12 t.
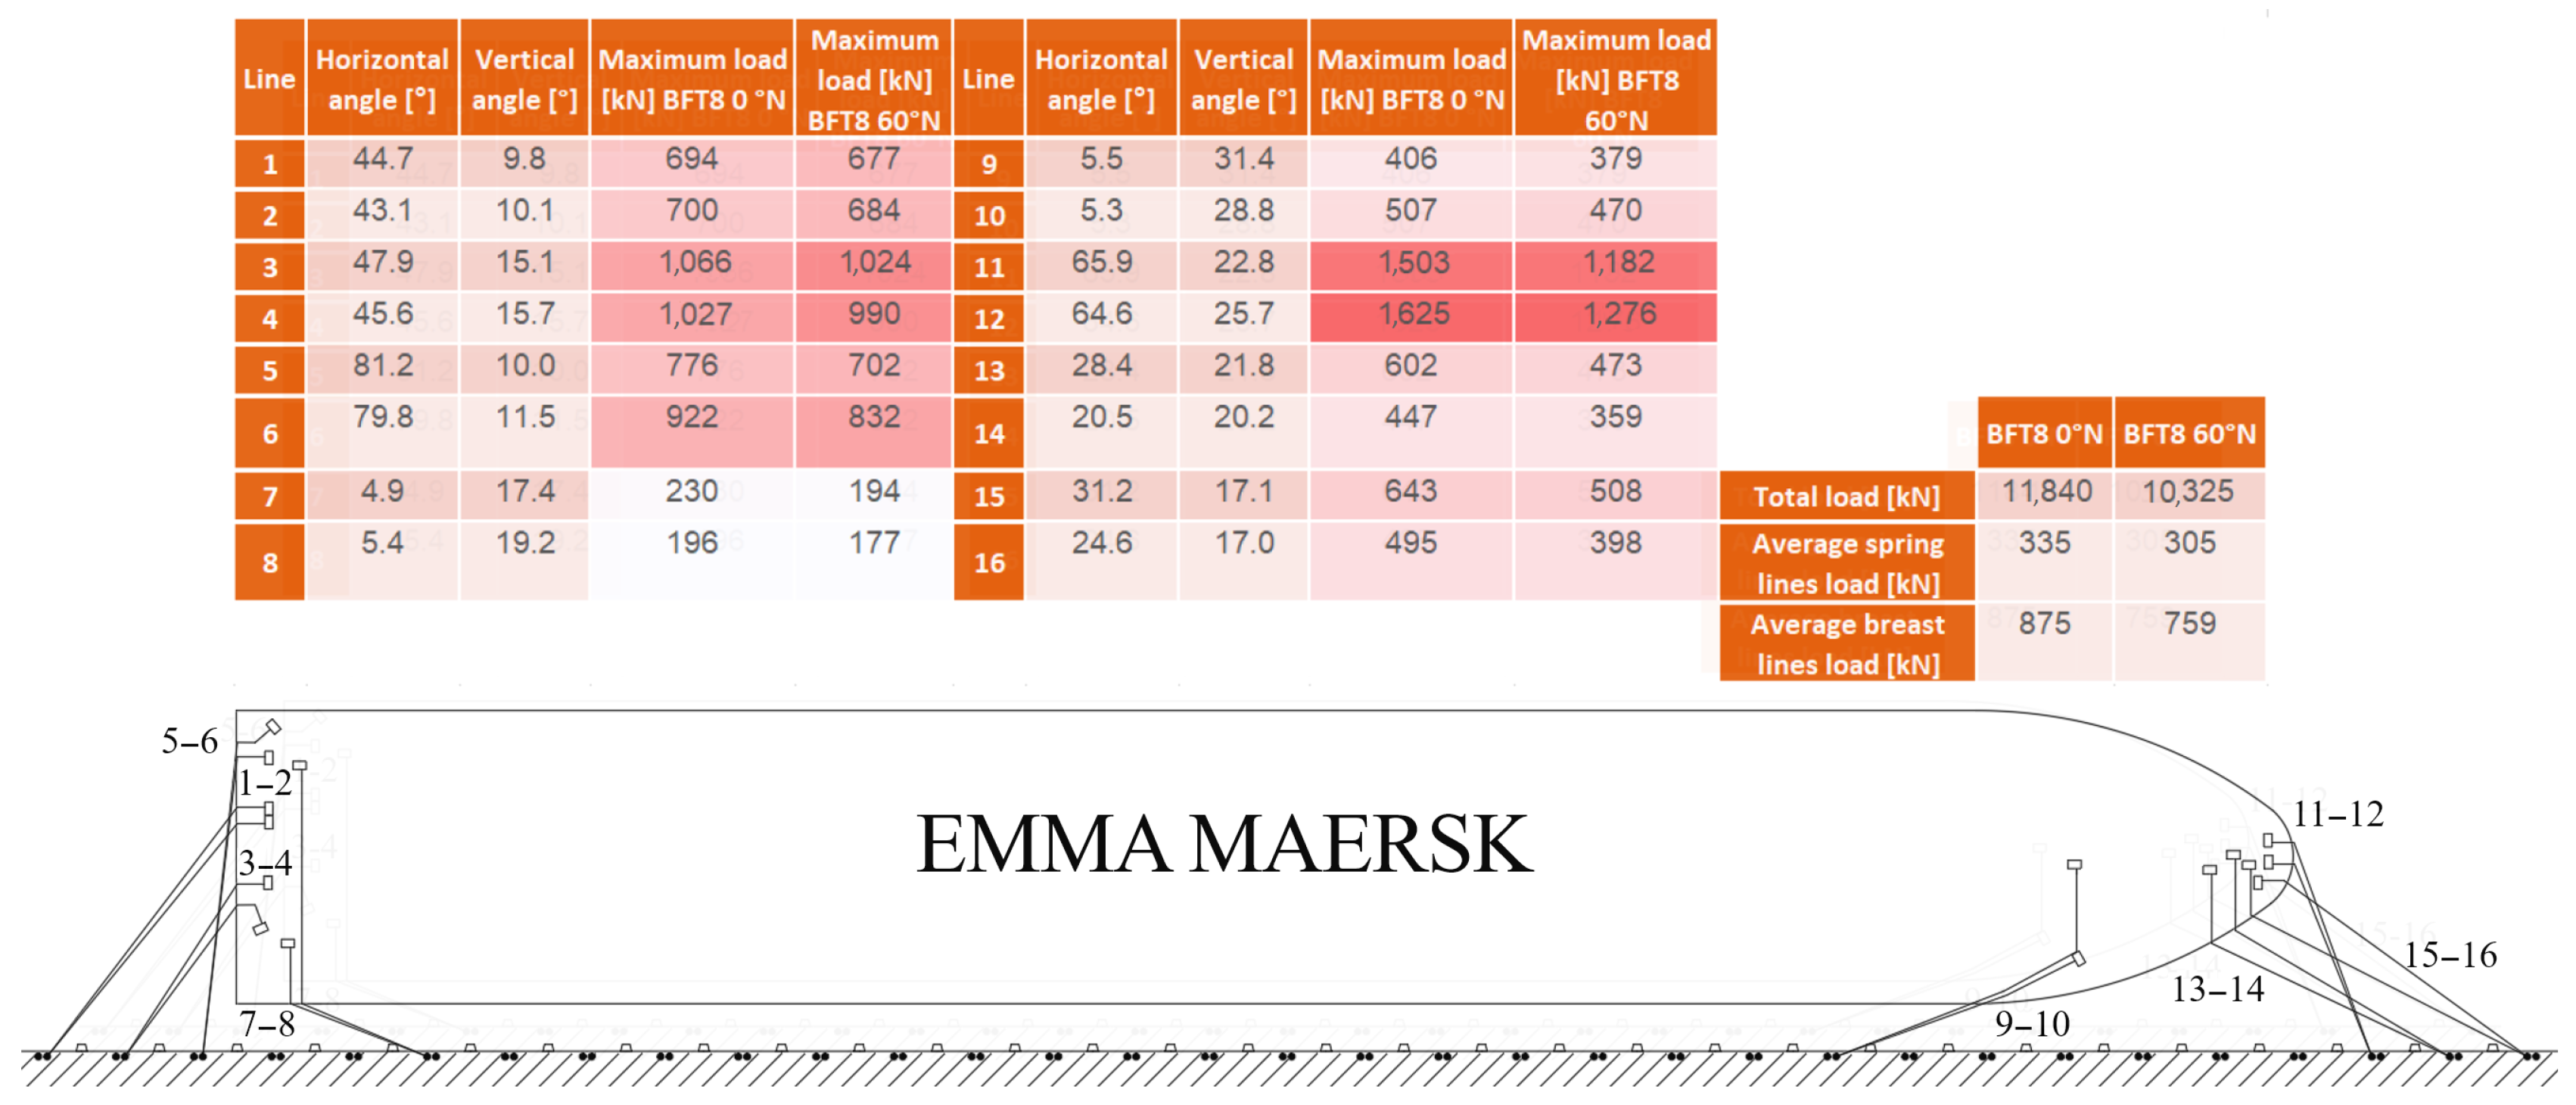
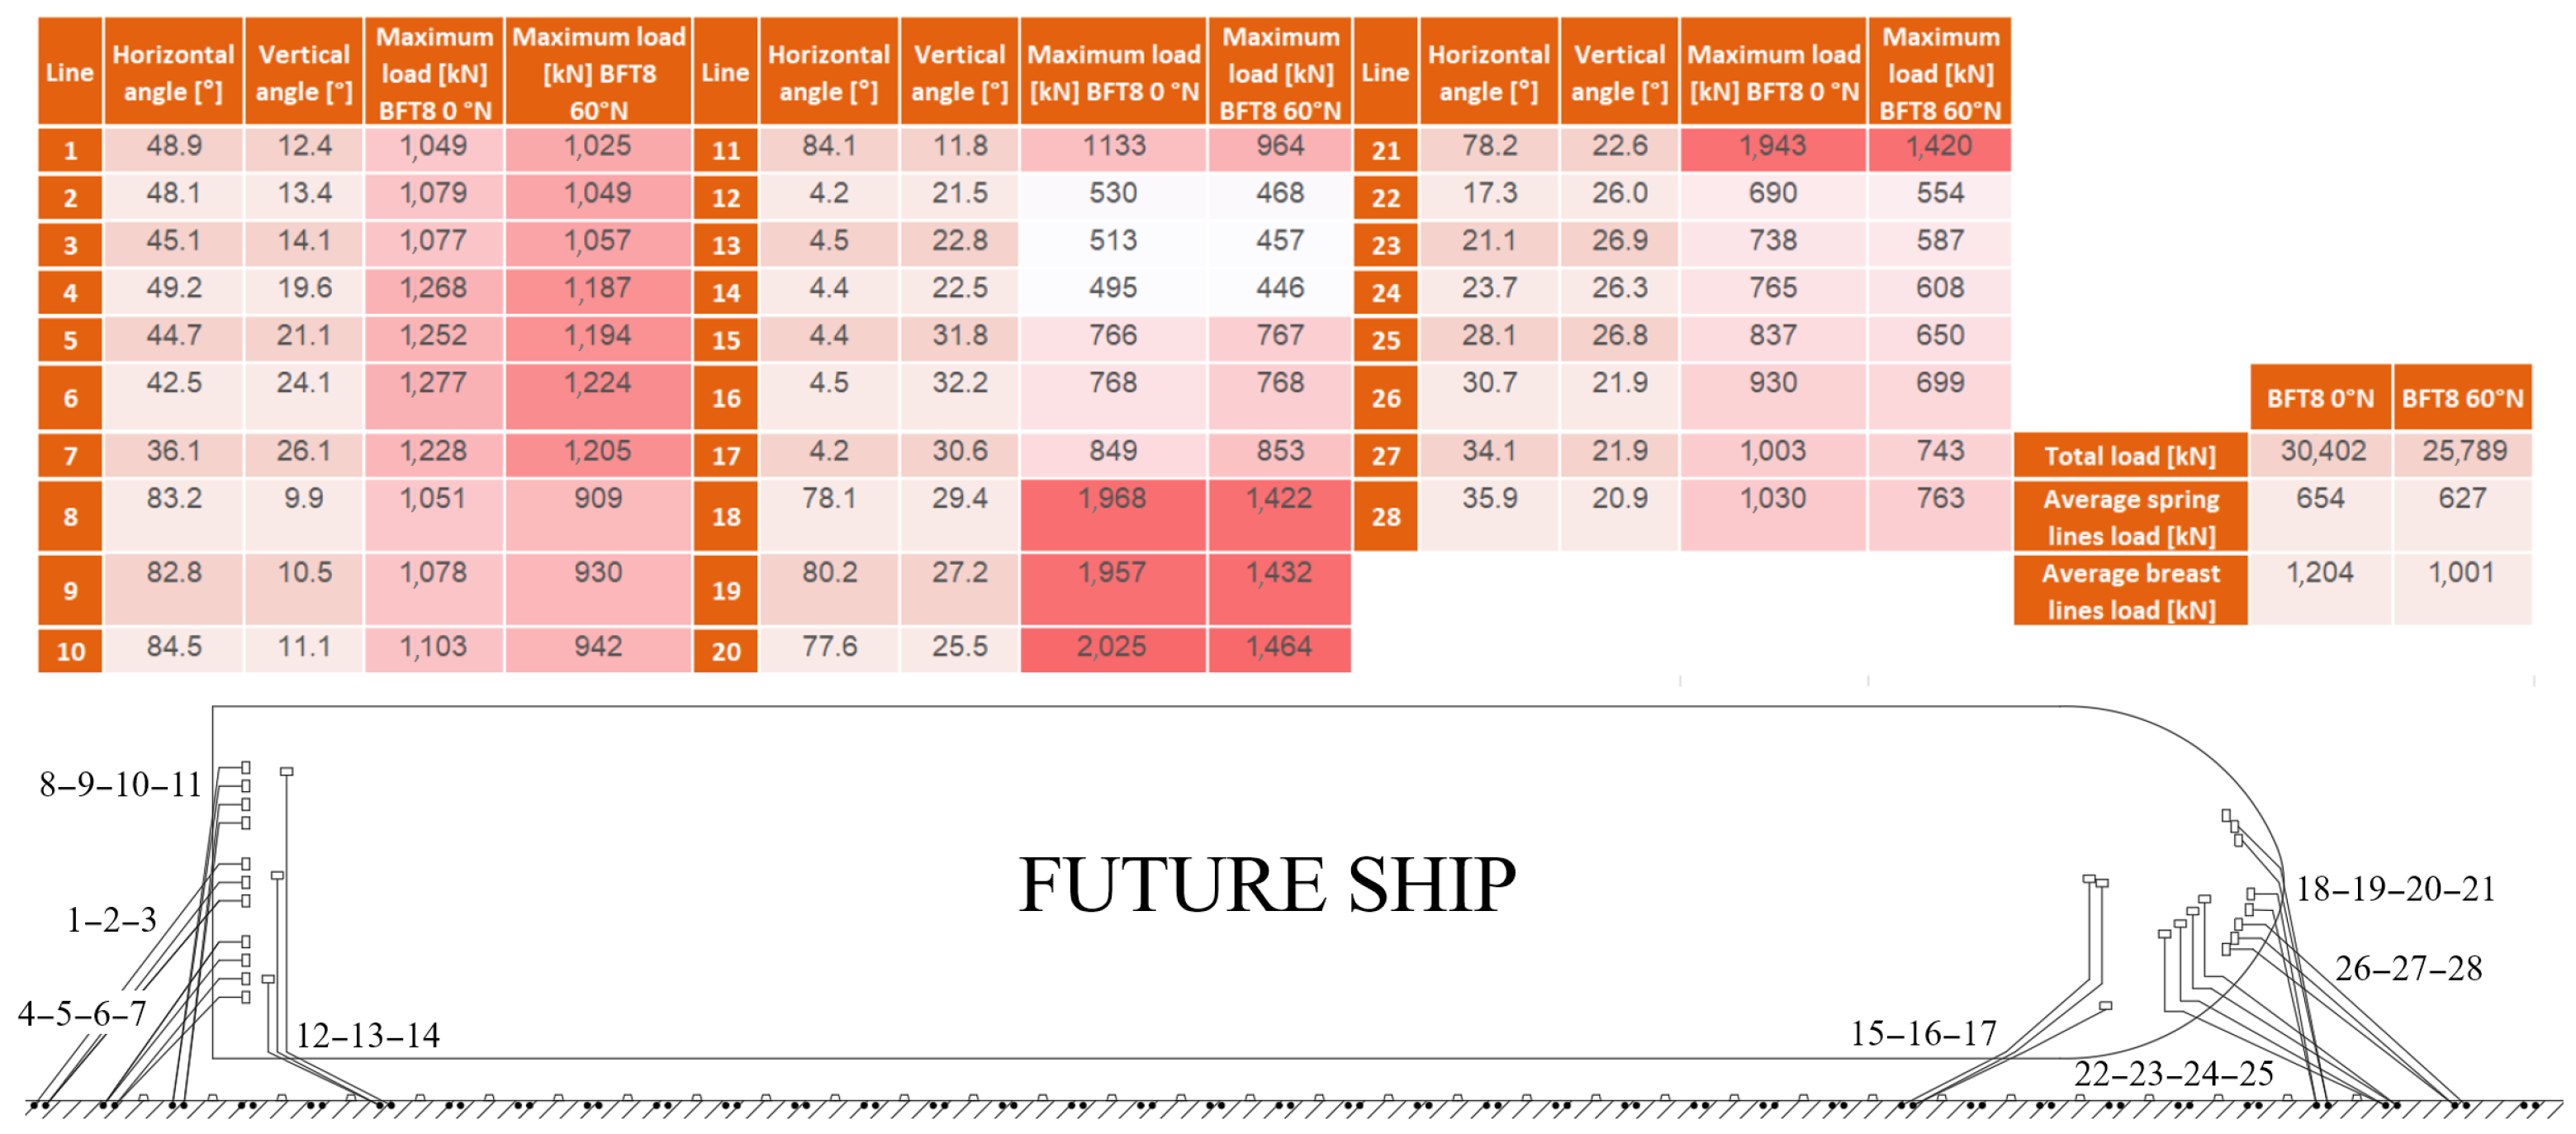
Figure 12 and
Figure 13 show the maximum load in each line for upper limit BFT 8 coming from 0° N and 60° N for the Emma Maersk and the future vessel, respectively. It is important to note that the maximum load in each line does not necessarily occur at the same time, especially for spring and breast lines. These tables do not show the total load on the vessel, but they do give a conservative idea of the maximum loading of the vessel and the differences in loads between the Emma Maersk and the future vessel. For example, at upper limit BFT 8 and 0° N, the Emma Maersk had a total load of 11,840 kN when considering all the lines, while the future vessel had a total load of 30,402 kN when considering all maximum loads in the lines. Furthermore, as the vessels were subjected to dynamic wind conditions, the breast lines have an average maximum load approximately twice that of the spring lines.
It is also noticeable how the crossing lines, which are almost perpendicular to the quay, are much more highly loaded than all other lines. This is because off-quay wind directions increase the loads in the breast lines, especially in those with the largest angles towards the quay. These lines exceed the limit and cause high bollard loads that exceed the limits, as shown in the forthcoming figures.
Figure 14 shows the maximum bollard loads for different wind speeds and directions with and without ShoreTension
® for both vessels. The maximum bollard design load at the terminal was 240 t. This limit was exceeded for both vessels at upper class BFT 8. It is also noticeable that the bollard loads produced by the future vessel at upper limit BFT 8 were considerably higher than those produced by the Emma Maersk.
Bollard loads were represented for the regular scenario and the scenario with ShoreTension®. Moreover, the bollard load in the ShoreTension® case was separated into regular bollards and ShoreTension® bollards. For the Emma Maersk, the load was reduced more below the limit. For the future vessel, the bollard loads exceeded the limit criteria due to the increase in line loads. Thanks to the ShoreTension®, the bollard loads were reduced below the limit except for the winds coming from 0 ° N. The use of ShoreTension® modules could be a solution to ensure safety conditions in the bollards.
As for the maximum fender loads, different wind speeds and directions were studied for both vessels, with and without ShoreTension®. The maximum fender design force was 1890 kN, which was reached for the upper limit BFT 8 in the Emma Maersk and upper limit BFT 7 in the future vessel. The forces created in the fenders by the future vessel were bigger than those in the Emma Maersk. The total force produced by the dynamic wind was higher in the future vessel because its windage area is larger, as was also concluded for the bollard loads and line loads.
In the Emma Maersk, the loads were below the limit, but they were reduced even further with the use of ShoreTension®. For the future vessel, the loads exceeded the limit for winds coming from 210° N and 240° N. These directions were not simulated with ShoreTension®, but based on the results from 0–60° N, they would likely be reduced below the limit with the use of ShoreTension®.
5.2. Passing-Ship with Dynamic Wind Condition Cases
Passing-ship results were simulated without wind and with the limiting dynamic wind condition BFT6. The results in the first figure show the Emma Maersk vessel passing and moored and in the second one, the future vessel passing and moored. Scenarios 1–4 and 9–12 correspond to Mean High Water conditions and scenarios 5–8 and 13–16 correspond to Mean Low Water conditions. This information is detailed in
Table 5.
The lines most loaded during passing-ship conditions were the spring lines, as the main motion was surge. This is why ShoreTension® modules were placed in the spring lines for both vessels, with two modules in the Emma Maersk and four modules in the future vessel.
The selected scenarios to simulate with ShoreTension® were the ones that exceeded the limit criteria in the regular scenarios. In the Emma Maersk, limits were exceeded for scenario 3, passing at 100 m at 5 knots during MHW, and scenario 7, passing at 100 m at 5 knots during MLW. In the future vessel, only scenario 15, passing at 120 m at 5 knots during MLW, exceeded the limit criteria.
Figure 15 and
Figure 16 present the maximum surge and sway motions produced during passing scenarios for the described cases. Operations at the port were affected when maximum surge motions reached 1 m and sway motions reached 0.3 m (black lines in the figures), based on PIANC guidelines. Similar to dynamic wind scenarios, when applying passing-ship forces with dynamic wind conditions, the motions in the Emma Maersk were bigger than in the future vessel. However, when there were just passing-ship forces, the motions in the future vessel were bigger.
Passing-ship has a bigger effect on surge than on sway, as can be seen in the scenarios without wind. Wind conditions worsen the scenarios at MHW, as the windage area is bigger due to less sheltering from the quay wall, and passing-ship conditions worsen the motions in MLW when there is less water volume due to smaller under-keel clearance.
Surge motions without wind were generally higher for the future vessel. When mixing wind and passing-ship conditions, the future vessel was more affected by passing-ship forces, which made surge motions slightly higher in MLW. This conclusion could not be made for the Emma Maersk. Surge motions were considerably worse when increasing passing speed than when reducing passing distances. This effect could be clearly observed for both the Emma Maersk and the future vessel in the surge motions.
Sway motions in the Emma Maersk were bigger in MHW, and for the future vessel, they were bigger in MLW as the latter was more affected by passing-ship forces. Subjected to both passing-ship and wind conditions, the Emma Maersk presented much bigger sway motions than the future vessel. However, when analyzing passing-ship conditions exclusively without wind, sway motions were worse for the future vessel as passing-ship effects are more relevant in the future vessel.
Figure 17 presents the maximum line load results for both the Emma Maersk and the future vessel in the scenarios described. The Emma Maersk exceeded the working load limit in scenarios 3 and 7, which were analyzed with ShoreTension
®. In both cases, the vessel was passing at 100 m and 5 knots with upper limit BFT 6 wind speeds coming from 0° N, one at MHW and the other at MLW. For the future vessel, the working load limit was exceeded in scenario 15, passing at 120 m and 5 knots at MLW with upper limit BFT 6 wind speeds coming from 0° N. Although motions were generally lower for the future vessel, except for the case of passing-ship with no wind, the maximum line loads were always greater for the future vessel.
Figure 18 presents the bollard load results for the Emma Maersk and the future vessel in the described scenarios. Following the same trend as the mooring lines, the future vessel showed the highest bollard loads for both cases of dynamic wind conditions with passing-ship and the case with only passing-ship conditions. The bollard design load was never exceeded for the Emma Maersk, but was exceeded for case 15 in the future vessel, which was passing at 120 m and 5 knots with upper limit BFT 6 wind speeds coming from 0° N while moored.
Figure 18 presents the bollard load results for the Emma Maersk and the future vessel in the described scenarios. Following the same trend as the mooring lines, the future vessel had the highest bollard loads for both the cases of dynamic wind conditions with passing-ship and the case with only passing-ship conditions. The bollard design load was never exceeded in the Emma Maersk. In the future vessel, it was exceeded in case 15, when the future vessel was moored and passing at 120 m at 5 knots with upper limit BFT 6 wind speeds coming from 0° N.
As for the fender load results, the design limit was never reached in the Emma Maersk cases. However, in the future vessel, the limit was reached in case 15, when the future vessel was moored and passing at 120 m at 5 knots with upper limit BFT 6 wind speeds coming from 330, 0, and 30° N. Fender loads were higher for the future vessel than for the Emma Maersk.
ShoreTension® scenarios were simulated for the scenarios from the previous section that exceeded the limit criteria. The lines most loaded during passing-ship conditions were the spring lines, as the main motion was surge. This is why the ShoreTension® modules were placed in the spring lines for both vessels, with two ShoreTension® modules in the Emma Maersk and four ShoreTension® modules in the future vessel.
In the Emma Maersk, limits were exceeded for scenarios 3, when passing at 100 m at 5 knots during MHW, and 7, when passing at 100 m at 5 knots during MLW. In the future vessel, only case 15, when passing at 120 m at 5 knots during MLW, exceeded the limit criteria.
It can be concluded from the results that surge motions were considerably reduced, mainly for the Emma Maersk, which was exposed to the biggest surge motions. Line loads and bollard loads did not present significant changes, and even if they were reduced in some scenarios, bollard loads still exceeded the limit in the case of the future vessel.
Figure 19 and
Figure 20 present the results for the maximum surge and sway motions in the Emma Maersk and the future vessel for the mentioned scenarios. It is noticeable for both vessels that surge motions were reduced below the limit, except for case 3 with upper limit BFT6 coming from 60° N, which still exceeded the limit criteria. Sway motions were not reduced, which seems reasonable as the ShoreTension
® modules were placed in the spring lines, and they mainly reduced surge motions.
The line loads were slightly reduced but did not present significant changes. This is because they present the maximum load among all the lines and the ShoreTension® modules were just placed in the spring lines, mainly reducing surge motions. Therefore, the maximum load represented correspond to the breast lines, which maintain their loads, in the same way as the sway motions were maintained. In the Emma Maersk, the line number 10, which is a spring line, was loaded in the regular scenario till 448 kN and in the ShoreTension® it was reduced to 295 kN, while the loads in the breast lines remained similar. In the future vessel, the line 17, which is a spring line, was loaded till 820 kN and with the ShoreTension® it was reduced to 725 kN, while the loads in the breast lines remained similar.
The bollard loads did not present either significant changes, just a slight reduction, as with the maximum line loads. The bollards which were loaded the most were the ones corresponding to the breast lines, which resulted in similar loads when placing ShoreTension® modules in the spring lines.
As for the fender loads, in the Emma Maersk the loads did not reach the limit criteria. However, in the future vessel the fender loads reached its design limit criteria 1893 kN.
Table 6 presents a summary of the maximum vessel motions and loads with the use of ShoreTension
® modules among all wind directions and scenarios and for the no-wind scenarios. With no wind, both motions and loads were higher for the future vessel. For upper limit BFT6, motions were higher for the Emma Maersk while loads were higher for the future vessel.
6. Mitigating Measures
Based on the obtained results and conclusions from the analysis, difficulties have been identified as a consequence of the increasing size of container vessels at terminals located next to busy fairways. The main challenge identified is the high loads in the bollards, fenders, and lines, which may compromise the safety at the terminals. This section aims to present possible mitigating measures to solve this problem. When loads in the mooring lines and bollards exceed the design limits, it requires re-adapting the terminal infrastructure, and therefore, it represents a significant investment by the port. The following mitigating measures are presented:
The simulated 60 t ShoreTension® modules.
The future development of a 100 t ShoreTension® module.
Extra lines.
New mooring arrangement with uncrossed lines.
Tugs on the side of the vessel.
Leaving the port.
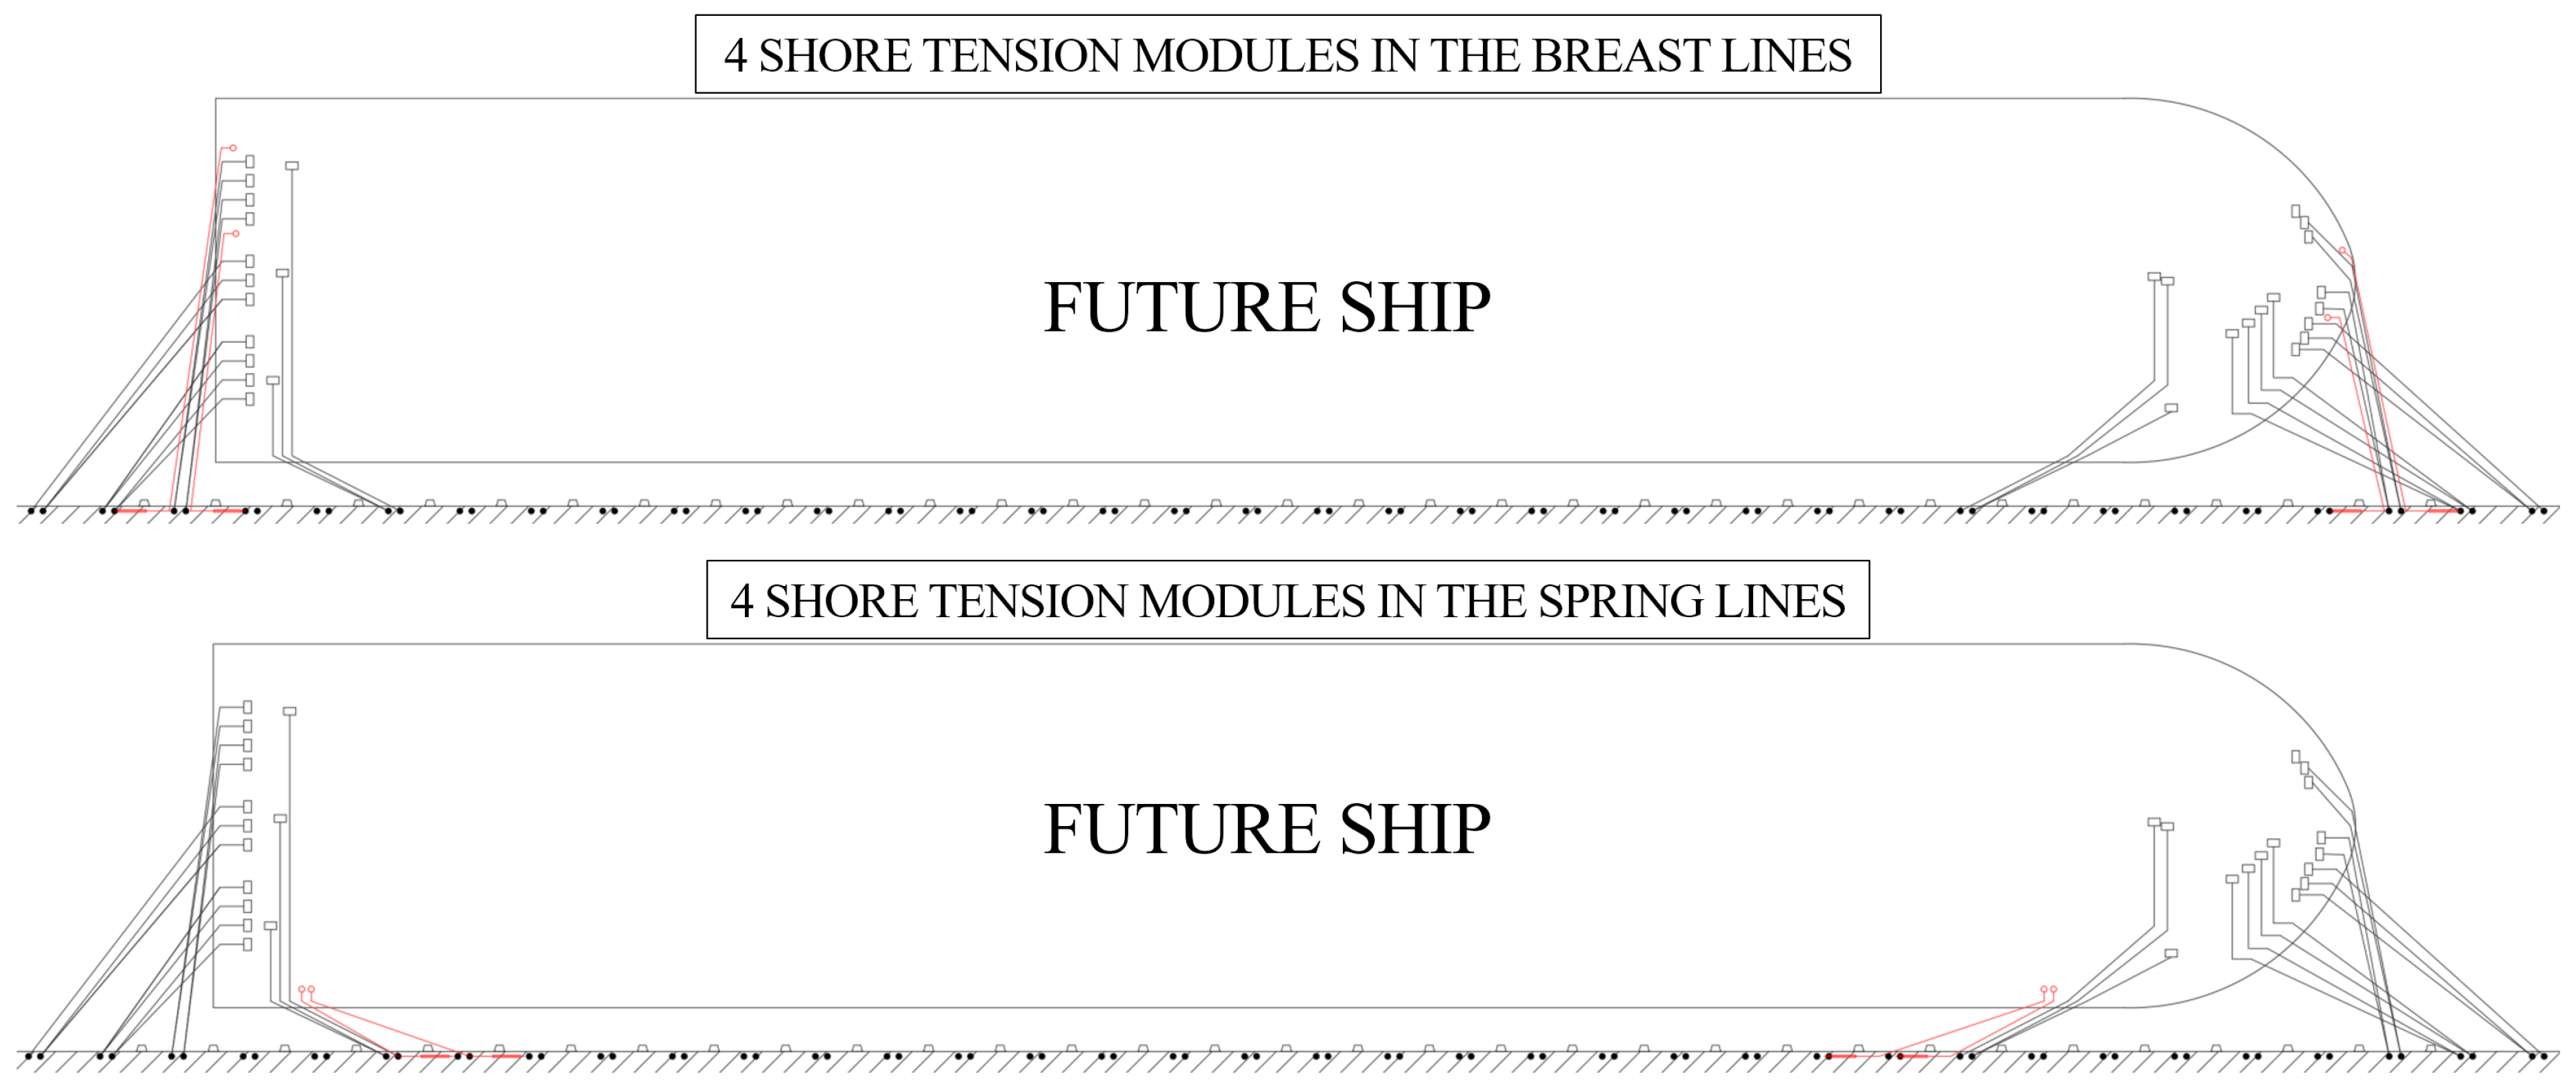
Based on the results, adding 60 t ShoreTension
® modules as extra lines to the regular mooring arrangement could be a mitigating measure. Regarding dynamic wind conditions, this mitigating measure reduces almost completely the loads and motions for upper limit BFT 8 wind below the limit criteria. As for the passing-ship cases, the surge motions are also considerably reduced below the limit.
Figure 21 and
Figure 22 show the mooring configuration with the 60 t ShoreTension
® modules, depicted as red lines in the figures. For wind conditions, the modules were placed in the breast lines, and for passing-ship conditions, they were placed in the spring lines, for both the Emma Maersk and the future vessel.
The disadvantage of using the 60 t ShoreTension
® is that extra lines need to be added to the mooring arrangement at the terminal, and potentially more bollards may be required. Although not simulated in the present analysis, a future 100 t ShoreTension
® module may be a solution as each ShoreTension
® line could replace two regular lines, reducing the number of lines required from 28 to 20 and simultaneously reducing the loads and motions. This conclusion is based on the significant reduction in loads and motions observed with the use of the 60 t ShoreTension
®, but it should be further investigated. The 100 t ShoreTension
® is an option that could solve problems related to high loads in future ULCVs, according to experts’ opinions from ShoreTension
®. Further studies on this future ShoreTension
® would be useful once more information is available, in order to determine its effects on ULCV motions and loads.
Figure 23 and
Figure 24 show the mooring configuration with this mitigating measure applied to the future vessel in order to save space at the terminal, with red lines in the figures.
Another mitigating measure could be to add more mooring lines. However, this would worsen the space problem at the terminal since more bollards would require more quay length. Regarding the mooring arrangement, it was shown that the highest loads were obtained in the lines that cross. To optimize the mooring arrangement, another mitigating measure could be to study a mooring arrangement with uncrossed lines, as shown in
Figure 25. This would reduce the loads in the crossing lines in exchange for higher motions.
In the event of an emergency with exceptionally high loads and motions, tugs can be used on the side of the vessel to push it towards the terminal and ensure safety conditions. However, this measure should only be used in extreme circumstances due to the emissions it produces and its negative impact on the environment. In the worst-case scenario, if the mooring system or equipment is at risk of being damaged, the vessel should leave the port.
7. Conclusions
The study highlights the trend of increasing container vessel sizes over the past few decades and how this trend is expected to continue in the coming years. The largest container vessel as of 2021 is the HMM Algeciras, which has a length of 400 m, a width of 61 m, and a capacity of 23,964 TEUs. McKinsey’s report suggests that container vessels could reach up to 50,000 TEUs by 2067, although it is unlikely that they will be any larger than that. With the emergence of ultra-large container vessels (ULCVs), ports must adapt their dry and wet infrastructures to accommodate these larger ships. This will require new best practices such as stronger lines, bollards, and fenders, deeper terminals and channels, wider stocking areas, better hinterland connections, and the use of mitigating measures to reduce loads in the mooring system, such as ShoreTension®. All of these requirements for ULCVs will modify container shipping networks.
The Port of Rotterdam is concerned about the safety of vessels due to improper mooring practices. Safe mooring practices, such as proper mooring arrangements, winch management, pre-tension, and types and numbers of lines per bollard, are not always followed. Port customers may not always be familiar with the effects of bad mooring arrangements, and line management on board and pre-tensions may not always be maintained at a good level. A sensitivity analysis revealed that motions and loads increase when pre-tension is reduced, which may lead to unsafe conditions at ports. This fact reinforces the importance of correct line tension management.
To identify problems in the mooring system loads and motions, a dynamic motion analysis (DMA) was performed for dynamic wind and passing-ship conditions comparing the Emma Maersk and the future vessel. The DMA results showed that the Emma Maersk vessel presented higher motions than the future vessel when analyzing dynamic wind conditions individually and together with passing conditions. New guidelines indicate that a vessel such as the Emma Maersk needs 164 t lines, but in practice, only 118 t are used according to the old guidelines. This is an indicator that the use of old guidelines leads to an underestimation of required line strength. With stronger lines and, in turn, higher pre-tension, motions would be lower. The new guidelines state that 164 t is safe until wind speeds of 25 m/s (30 s gust), which is about the upper limit of BFT 8. Line loads exceed the working load limit (WLL), which is 50% of 164 t, between BFT 7 and 8, similar to the future vessel. As 118 t is used in the simulations, it should be fine until 21.2 m/s, which is the upper limit of BFT 7. Loads exceed the WLL between 6 and 7 BFT, a similar trend as for the future vessel, which should be fine until BFT 8 but exceeds the WLL between BFT 7 and 8. This justifies the relevance of applying new guidelines.
However, the loads on bollards, fenders, and lines increase considerably for the future vessel, compromising safety conditions at the terminal with the present bollards and fenders. The bollards reach their safe working load (240 t) between upper limit BFT7 and 8, and the fenders reach the upper limit BFT8 for both vessels. For a passing ship, the design loads are exceeded for the future.
Finally, efforts to share and implement best practices on how to moor vessels effectively sometimes miss their target. The strength of the mooring configuration is only as strong as its weakest link. Research efforts and investments can be made, but if the vessel is not moored correctly in practice, it will still be unsafe and hinder mooring conditions. All port customers should be familiar with the correct line arrangement on board, the sufficient line pre-tension, and the consequences if procedures are not followed correctly. As ships’ operations become more critical at ports, it becomes increasingly important to demand more requirements from the vessel’s crew to ensure safety and compliance with schedules, such as speaking a common language such as English.


