Article

Study of the Master Bay Plan Problem Based on a Twin 40-Foot Quay Crane Operation

1
Institute of Logistics Science and Engineering, Shanghai Maritime University, Shanghai 201306, China
2
School of Science, Shanghai Maritime University, Shanghai 201306, China
*
Author to whom correspondence should be addressed.
J. Mar. Sci. Eng. 2023, 11(4), 807; https://doi.org/10.3390/jmse11040807
Submission received: 17 March 2023 / Revised: 3 April 2023 / Accepted: 8 April 2023 / Published: 10 April 2023
(This article belongs to the Special Issue Recent Scientific Developments in Port Logistics)

Abstract

:
During the process of container ship transportation, the berthing time cost of the ship in port is extremely important. Container allocation and quay crane (QC) operation greatly affect the berthing time. Currently, few scholars have combined import/export container allocation and QC operation, making it urgent to study ship stowage and QC collaboratively. In this paper, a mixed-integer programming model is established for the ship multi-port master bay plan problem (MP-MBPP), based on the operation of twin 40-foot QCs. The aim of this model is to minimize container rehandling and the time required for twin 40-foot QCs operation movement. A variety of new stowing strategies have been designed, and the improved coded particle swarm optimization algorithm (PSO) is used to optimize the position of double-bays, reducing the number and distance of QC movements and minimizing ship berthing time. By comparing the impact of different stowage rules on ship berthing time through examples, verification shows that the proposed stowage model and solving algorithm can obtain optimized solutions. Under the same initial conditions, the double-bay stowage based on the twin 40-foot QCs can improve operation efficiency by at least 20.3%, compared to the single-bay with ordinary QC, verifying the effectiveness of the proposed method.

1. Introduction

With the rapid development of international trade, maritime transport has become the primary mode of transportation, expanding in scale [1]. In 2022, the shipping industry faced numerous challenges, such as high prices and container shortages. Factors such as the COVID-19 pandemic, supply chain crisis, and geopolitical issues led to varying degrees of congestion in international container hub ports, highlighting their status as global logistics hubs [2,3,4,5,6,7,8,9,10]. Container terminals are the primary sites for the sea-land transfer in the container transport process, and developing efficient vessel stowage plans with the scheduling of quay cranes (QCs) is an important factor for terminals to ensure their competitiveness [11].
One of the main factors for evaluating the efficiency of container terminals is the berthing time, which is composed of the loading and unloading time of container ships and the moving time of quay cranes (QCs). Among them, the shift of containers is composed of the number of loading and unloading and the number of rehandling, which is also called overstowage. The moving distance and frequency of QC operation affect the moving time of cranes. These two factors belong to the stowage planning problem (SPP) and crane split problem (CSP), respectively, and are highly related, making them of great significance in improving the productivity of container terminals. In the SPP, QCs are used to transfer containers from container ships, and they are one of the most expensive equipment at container terminals. The SPP can determine the distribution of containers on the ship, which directly affects the utilization of QCs. Conversely, the use of QCs also affects the berthing time, which is one of the objectives of the SPP [12].
In some cases, container ships may have up to 10 cranes allocated to a single port. However, berthing time can still be long due to underutilized cranes. Therefore, the SPP must consider the configuration of QC for each visiting port and take into account the utilization of QC, aiming to minimize the time of loading and unloading and reduce berthing time as much as possible [13]. The integration of SPP and CSP can improve the efficiency of operational instructions and ultimately increase the efficiency of container terminals. Ideally, minimizing berthing time relies on maintaining stable QC operational efficiency, which requires cranes to avoid idle states as much as possible and to have fewer moving frequencies and shorter moving distances. Therefore, developing an optimal stowage plan to reduce berthing time is crucial. In this paper, we optimize the master bay of container vessels based on twin 40-foot QCs operations to minimize berthing time.
This paper investigates the master bay plan problem for container ships, taking into account the influence of twin 40-foot QCs equipment on the shipping route. The research employs standard container sizes of 20-foot and 40-foot for loading, with the objectives of minimizing the number of containers rehandled and the QC movement time for each port in the shipping route while adhering to constraints for container ship loading and QC operations. Several double-bay allocation strategies and loading rules based on twin 40-foot QCs are proposed, and a new encoding mode for particle swarm optimization (PSO) is designed to optimize double-bays.

2. Literature Review

There have been many research studies on ship stowage conducted by numerous scholars. Iris [14] reviewed the literature studies on ship loading, which combined loading sequence and scheduling to improve the efficiency of ship loading and unloading. The review contains most of the relevant literature before 2015, which provided a theoretical basis for subsequent research by scholars.
In this section, we analyze existing research related to the content of this paper. The research can be divided into two categories: the master bay plan problem and ship stowage with QC operations.

2.1. Master Bay Plan Problem

In terms of the master bay plan problem (MBPP), the following scholars have conducted relevant research on the stowage problem.
Wilson [15] proposed a staged approach to efficiently develop a stowage plan for the entire ship’s route. By adding heuristic rules to the objective function, optimal stowage solutions were obtained. However, due to the low efficiency of mathematical programming, only local optimal results were obtained. Pacino [16] proposed a two-stage method to generate an approximate optimal stowage with the objective of minimizing the number of rehandling. The study used the CPLEX solver to solve the master bay plan problem (MBPP) under a mixed loading strategy. Ambrosino [17] solved the container loading problem by evaluating an exact 0–1 linear programming model in his research. The author proposed a method to improve this method, which included heuristic pre-processing and pre-filling processes, and also allowed some constraints of the exact model to be relaxed, while ensuring that the important maritime performance indicator of loading and unloading efficiency is minimized as the goal of the stowage plan. In a subsequent study [18,19], the author proposed that the effectiveness of the stowage plan is related to the order of loading and unloading operations; the author expanded the MBPP to the multi-port main berth plan (MP-MBPP) problem, which considers the impact of hatch covers on stowage. A new hybrid integer programming model was established with the objective of minimizing the time that the ship stays in port, and this model can solve the stowage plan for ultra-large vessels in a short time.
In addition, Ting [20] proposed a container bay allocation model that considered the conflicting goals of carrier capacity contribution and agent satisfaction, as well as the fuzzy constraints of cargo transportation demand and weight uncertainty. A fuzzy multi-objective programming method was used to establish a model for allocating container slots on ocean-going liner container ships, and an interactive fuzzy multi-objective linear programming with fuzzy parameters was used to solve this problem. Bilican [21] considered the master bay planning phase of the container stowage problem (CSP) and developed a mixed integer linear programming (MILP) formulation that maximizes the reduction in total costs associated with the overloading count and the bending moment, while keeping the stress factors within permissible limits during multi-port navigation. Li et al. [22] studied the container liner shipping stowage planning problem, focusing on 20-foot and 40-foot general containers, and solved the MBPP problem using a greedy random adaptive search algorithm based on heuristic algorithms. Ambrosino [23] addressed the problem of stowage planning for container ships in the presence of hazardous containers. The author proposed a new procedure based on the principles used in the International Maritime Dangerous Goods (IMDG) code for loading containers in ship services, which aimed to assist shipping line coordinators (SLCs) in optimizing the available space allocated to each alliance member.
The above-mentioned scholars simply studied the MBPP of container ships, considered the structural constraints of ships, and established the MBPP model with the goal of minimizing the number of rehandling containers or the shortest berthing time. However, they neglected the influence of QC operation and did not maximize QC efficiency to minimize berthing time.

2.2. Collaborative Scheduling of Ship Stowage and QC

During the process of container ship loading and unloading, ship stowage and QC are closely related. The following scholars have studied these two problems.
When it comes to quay crane scheduling, many scholars study it together with berth allocation, such as Iris. Iris [24] proposed novel set partitioning models to improve the performance of the set partitioning formulations, and introduced several variable reduction techniques. Furthermore, the study analyzed the effects of different discretization schemes and the impact of using a time-variant or invariant quay crane allocation policy. Another study [25] aimed at developing a recoverable robust optimization approach for the weekly berth and quay crane planning problem. In order to build systematic recoverable robustness, a proactive baseline schedule with reactive recovery costs has been suggested. Moreover, a mathematical model and an adaptive large neighborhood-based heuristic framework are presented to solve the novel problem.
Wilson [26] proposed a method for generating a multi-port transportation container ship stowage plan while considering the maximization problem of the number of ordinary QCs that operate in parallel at each port. Sciomachen [27] proposed a heuristic algorithm based on the relationship between the MBPP and the three-dimensional packing problem to solve an optimization model with the objectives of minimizing loading and unloading time and maximizing the utilization rate of QCs. Lee [28] considered the loading and unloading priority of each bay to determine the loading and unloading sequence of the QC assigned to a container ship. A mixed integer planning model was provided for the considered problem and a genetic algorithm (GA) was proposed to obtain an approximate optimal solution. Shen [29] developed a container group-bay allocation planning model based on advances planning to optimize terminal costs in order to minimize rehandling, crane movement, and target weight gaps while satisfying both shipowners and container terminals. To solve this problem, a GA-A* hybrid algorithm was used.
Iris [30] presented the loading problem of flexible container ships in port container terminals and proposed various modeling enhancements and mathematical models to obtain strong lower bounds. An improved greedy random adaptive search program was proposed to solve this problem. Pacino [31] focused on stowage planning and the problem of assigning containers to positions in a vessel, and presented a new variation of the stowage planning problem, which includes block stowage and crane intensity strategies. A new algorithm based on the large neighborhood search was proposed, which can solve all cases in a short time.
Azevedo [32] proposed a framework for solving the 3D stowage planning problem for container ships in combination with the QC scheduling problem. The two problems are interrelated and combined, demonstrating the application of the metaheuristic. Chang [12] combined the load planning and crane assignment problems to minimize the total berthing time for each port visited during the voyage. A new mathematical model was developed to cover a wide range of operational and structural constraints for both allocation planning and crane operations. An improved genetic algorithm based on a new allocation strategy encoding model, which includes container grouping and operation strategies, was designed to solve the problem. Penalty operations were also introduced to solve infeasible solutions.
Research on MP-MBPP has rarely considered the operation of twin 40-foot QCs for loading and unloading, and the container types are relatively limited, making it difficult to adapt to the trend of updating and upgrading large port handling equipment.
This paper constructed a novel double-bay stowage model and various strategies by considering the requirements of twin 40-foot QCs for loading and unloading, while minimizing the number of rehandling containers and the QC moving time as the overall objectives. An improved encoding of particle swarm optimization (PSO) is designed to optimize the position of double-bays to reduce the number and distance of QC movements and minimize ship berthing time. The feasibility of loading strategies that satisfy the requirements of twin 40-foot QCs is verified through a stowage algorithm based on heuristic rules. The effectiveness of the model is also validated.

2.3. Problem Description

2.3.1. Master Bay Plan Problem

The Master Bay Plan Problem (MBPP) refers to a pre-stowage plan that involves the allocation of containers on board a vessel for the entire voyage. It is created by the shipping company. Containers to be shipped are grouped into similar container groups based on size, destination port, and cargo type, and then distributed to different bays according to certain stowage principles and optimization objectives to achieve an optimal layout of containers on the ship [33]. The main purpose is to ensure that all export containers at each port on the route can be loaded so that loading areas can be assigned in advance for export containers at each port. This can minimize or reduce the handling of containers at intermediate ports during the voyage, shorten the berthing time of container ships, and improve operational efficiency. The pre-stowage plan does not specify the exact location of a specific container, as this is done by the terminal during SPP.

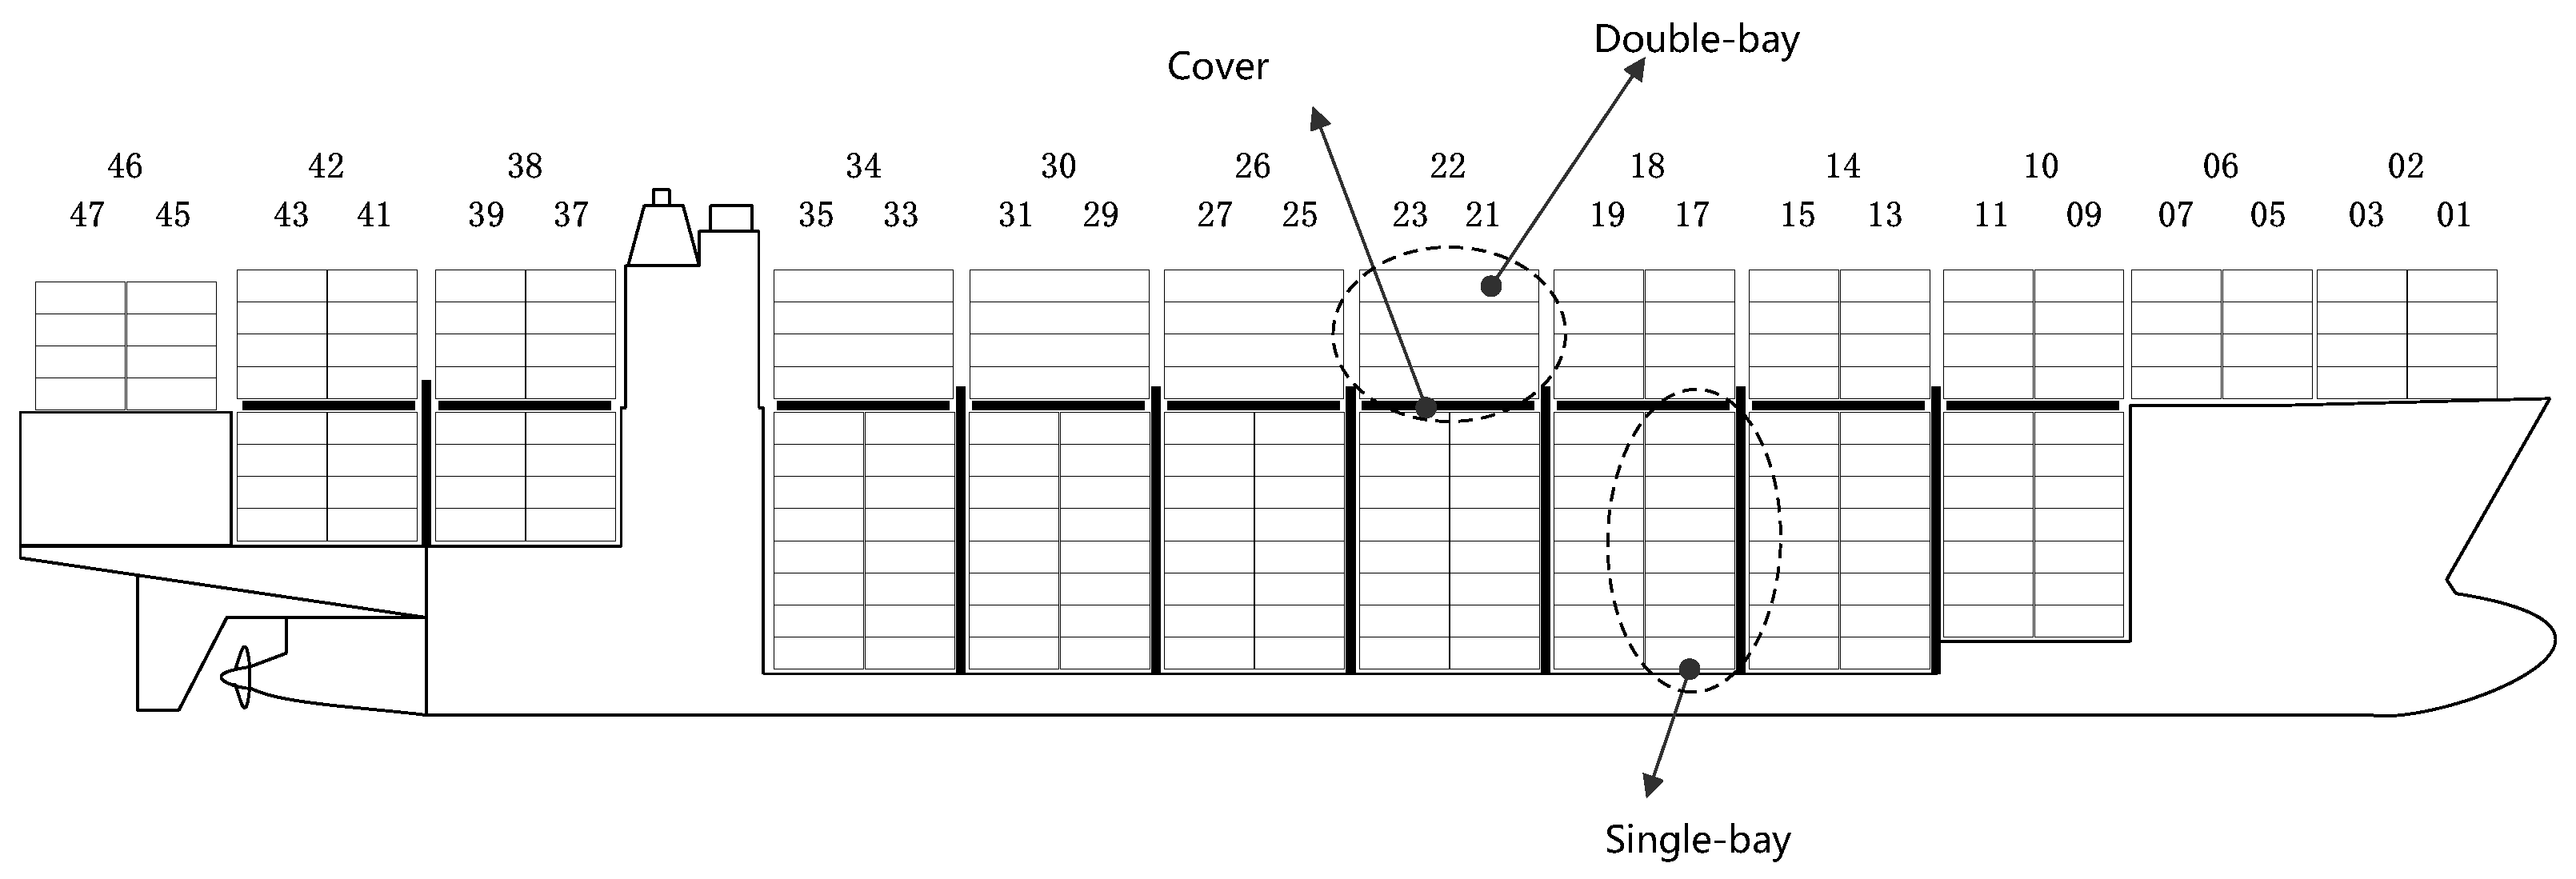
2.3.2. Container Ship

Container ships are vessels designed for container transportation; the layouts of ships vary due to differences in their engine rooms, accommodations, and hull shapes [34]. Figure 1 shows the structure of a sample container ship, which is divided into equally sized sections called bays. Odd-numbered bays are generally denoted by consecutive odd numbers (e.g., 01, 03, 05, etc.), while even-numbered bays are denoted by even numbers located between odd-numbered bays (e.g., 02, 06, 10, etc.). Each bay consists of rows and tiers separated by hatch covers between the hold and the deck. To describe the location of a container, a three-dimensional matrix is introduced, where each element corresponds to a slot in the container ship. One slot represents the capacity of one twenty-foot equivalent unit (TEU), which is twenty feet long. Two slots can accommodate one forty-foot equivalent unit (FEU), which is forty feet long, or two twenty-foot containers. These slots are also called container cells [15].
As shown in Figure 1, 20-foot containers are stowed in odd-numbered bays, while 40-foot containers are stowed in even-numbered bays. Two consecutive odd-numbered bays can be combined to form an even-numbered bay. Therefore, if a 40-foot container is placed in an even-numbered bay, the two odd-numbered bays together form an even-numbered bay that cannot be used for 20-foot containers.
This study uses a double-bay, which consists of two single bays as the basic unit for container stowage planning. Two 20-foot containers in the same container group are considered as a 40-foot container, and the 40-foot quay crane (QC) can be used for simultaneous container loading and unloading operations. Combining two double 20-foot container groups can meet the requirements for the twin 40-foot QC operation.

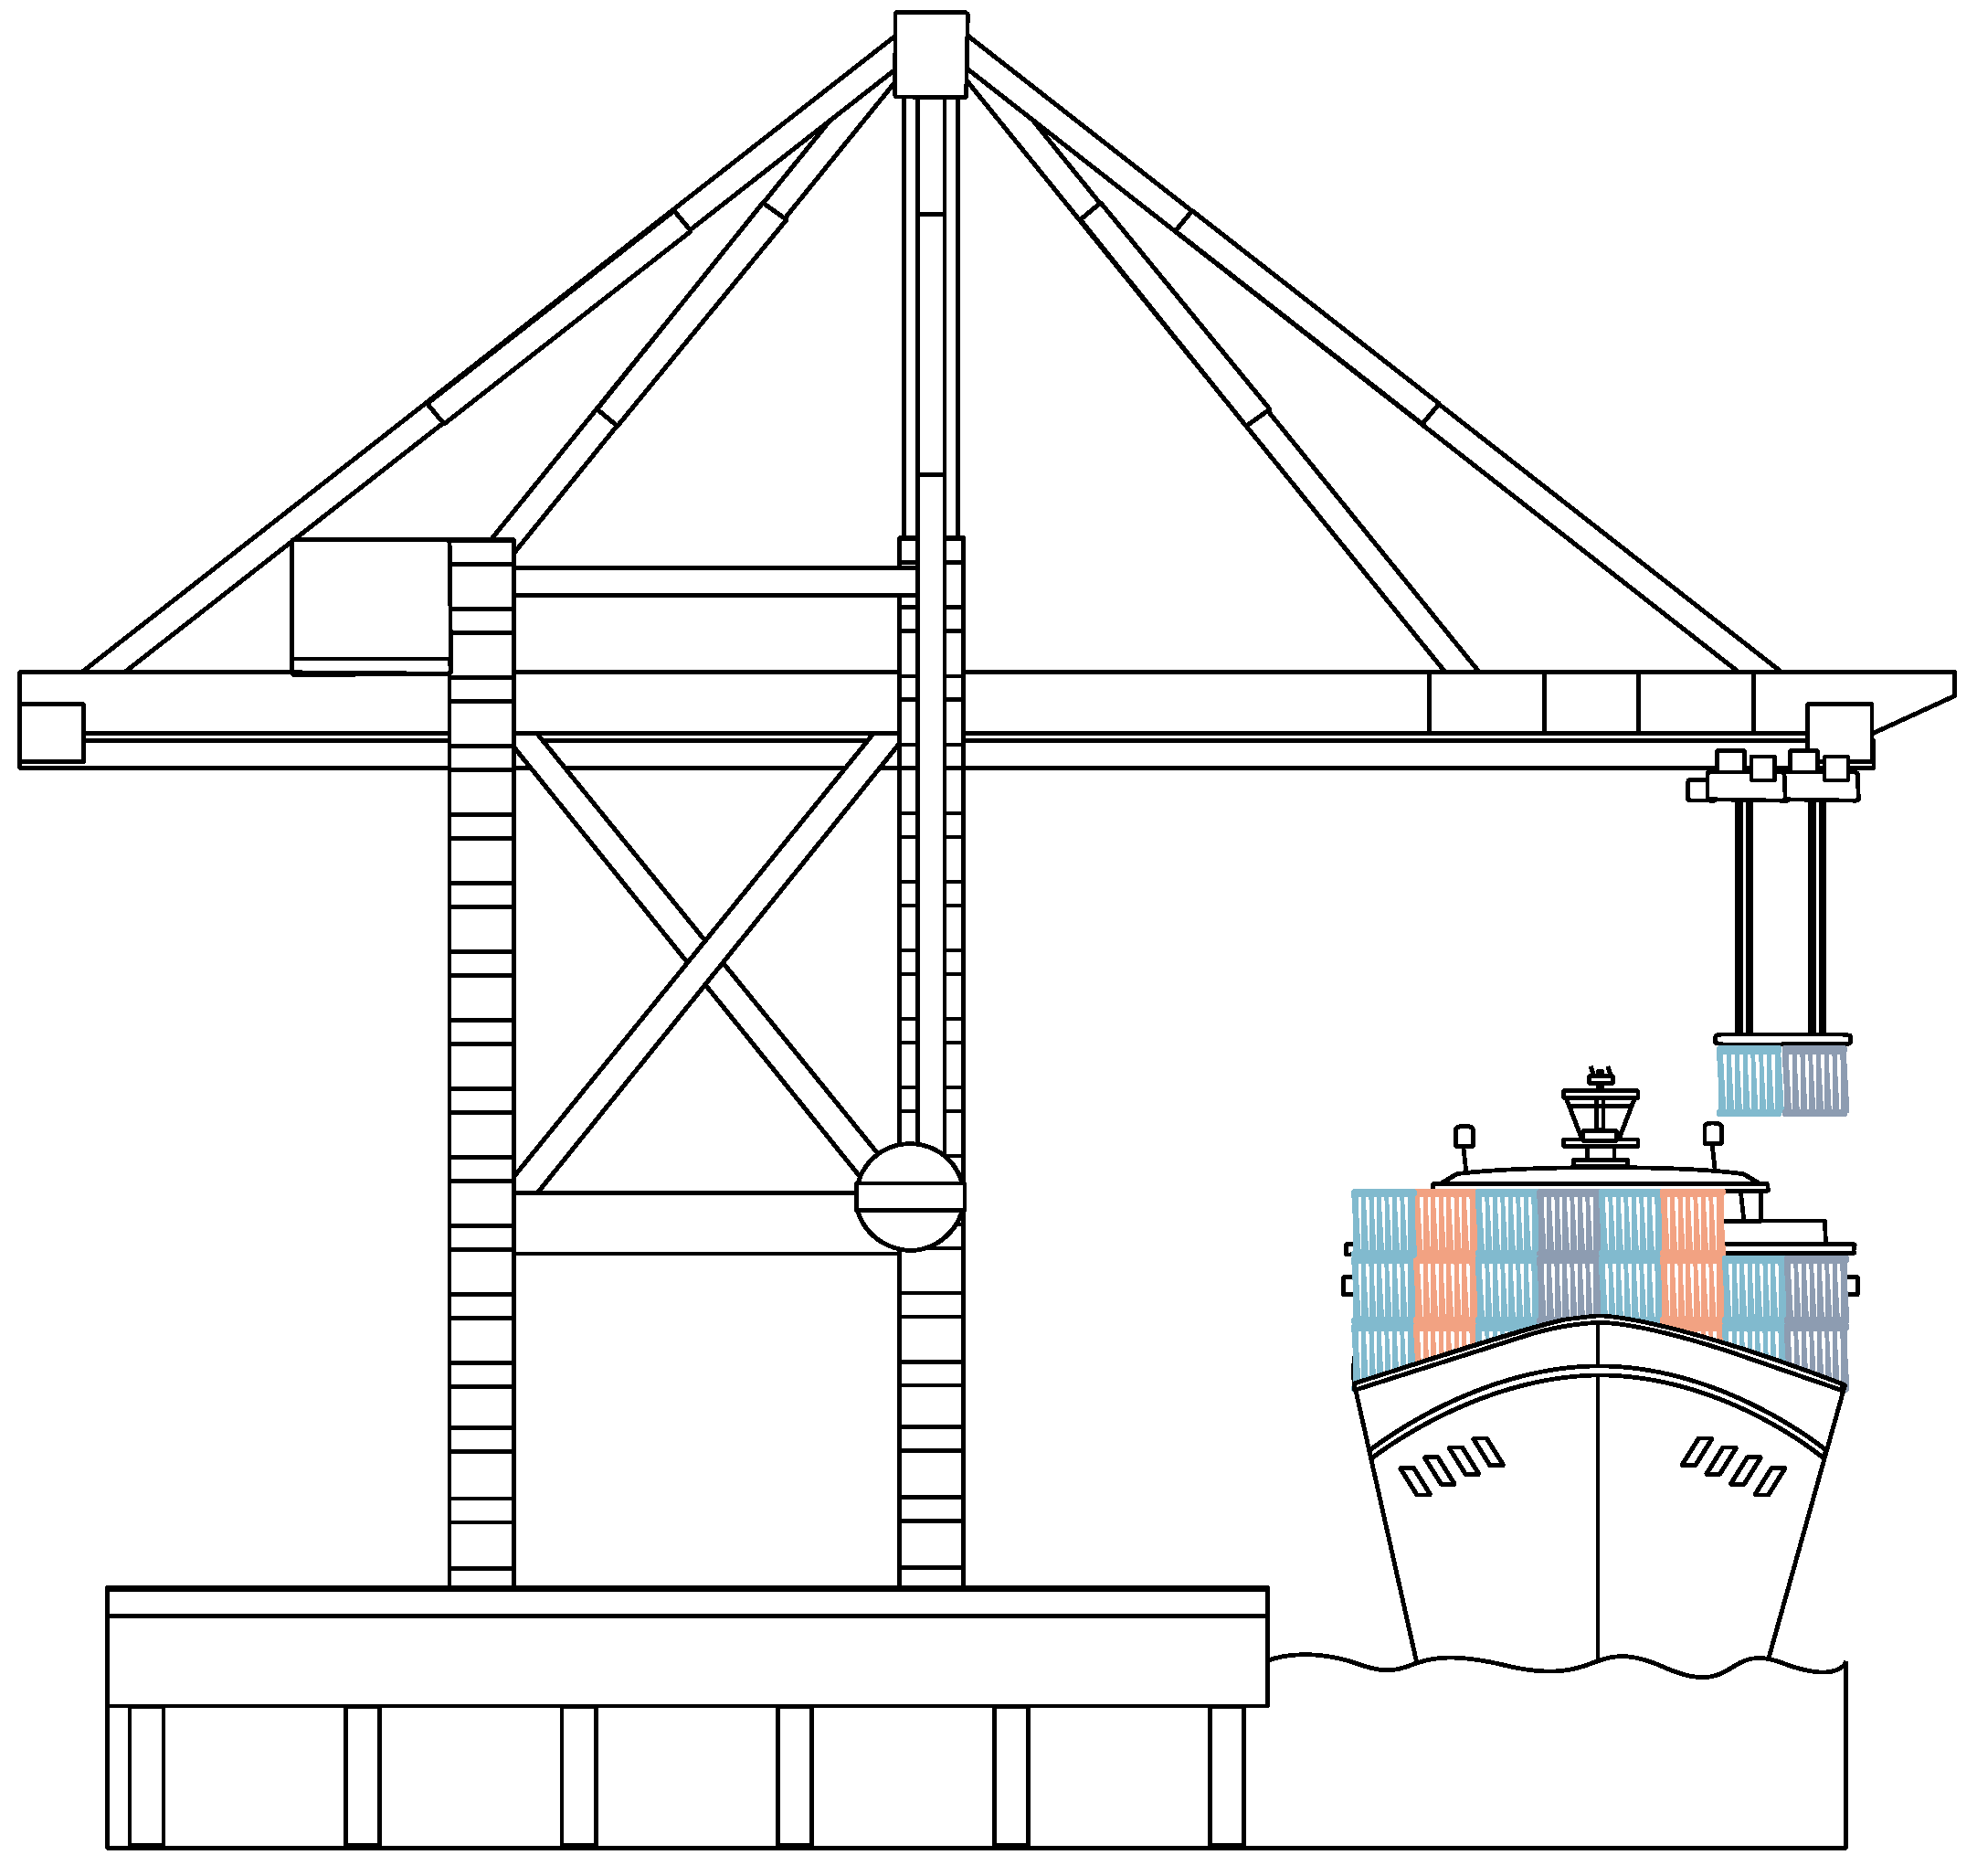
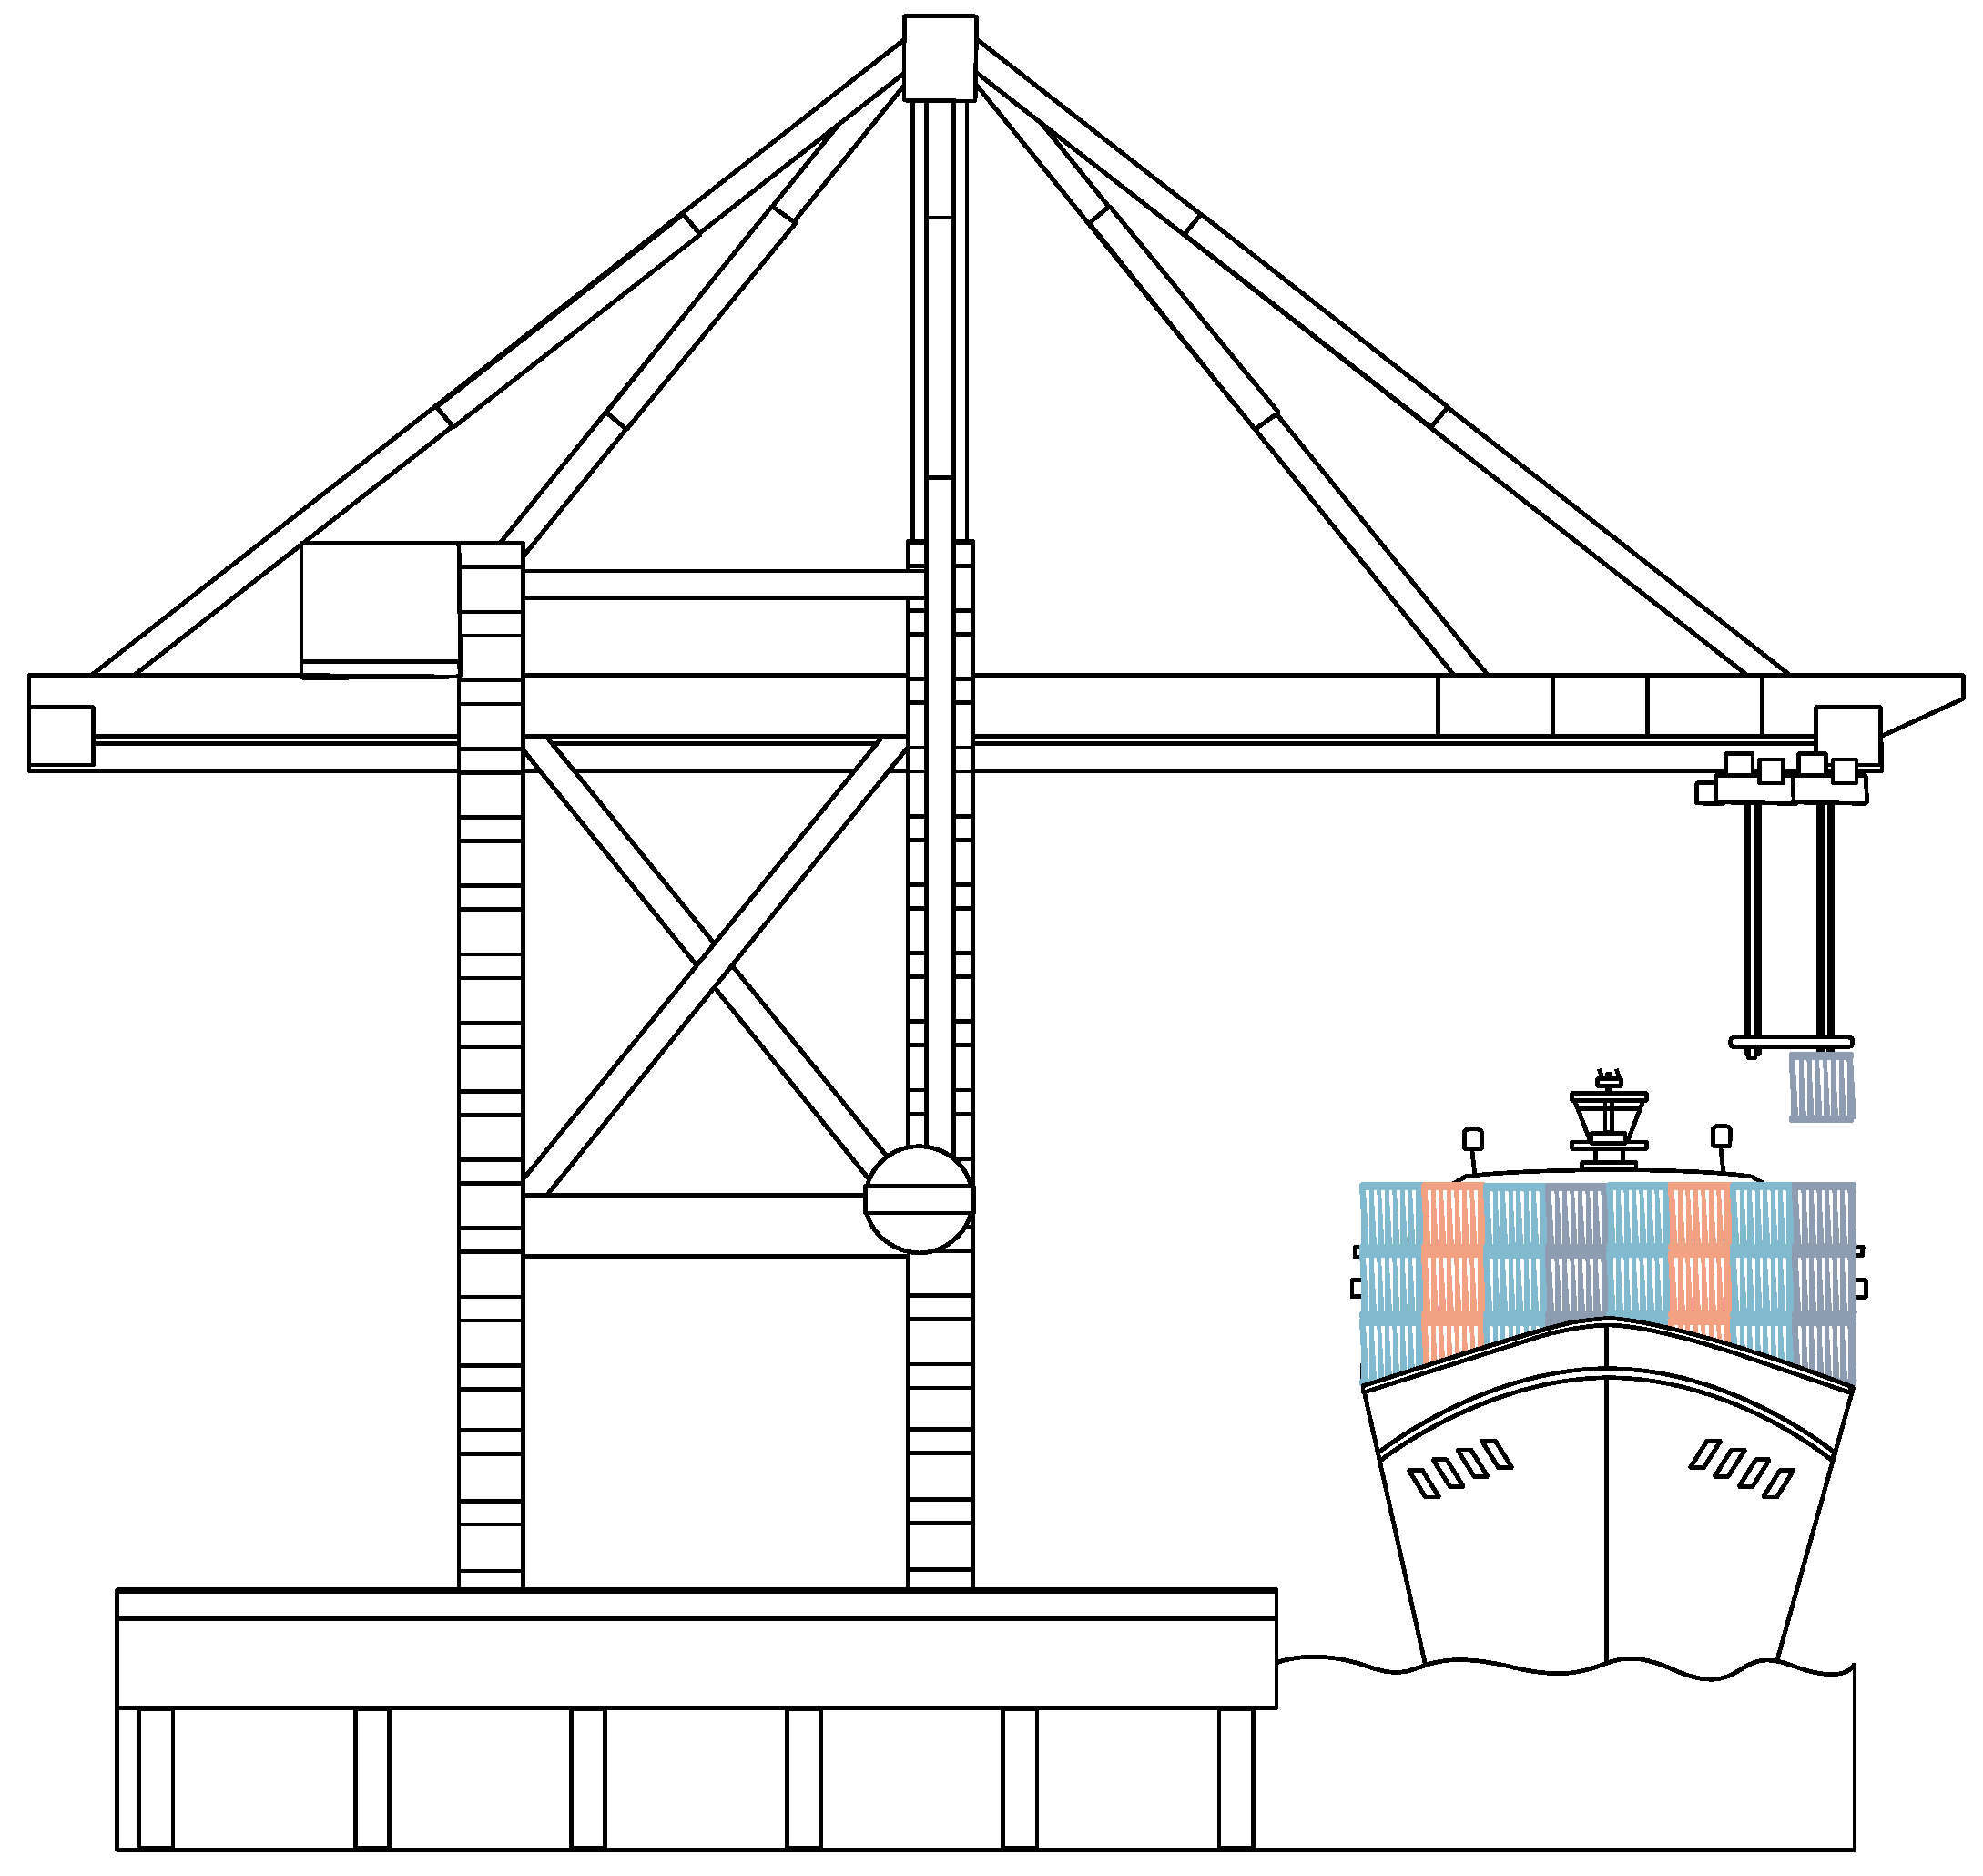
2.3.3. Twin 40-Foot QC

Twin 40-foot QCs are designed with two hoists capable of picking up one 40-foot container, two 20-foot containers, or one 20-foot container (for end-to-end loading and unloading) by extending the hoist. When the ship’s loading situation is favorable, both hoists are used simultaneously, allowing two 40-foot containers to be loaded or unloaded at once, as shown in Figure 2. If the hoist positioning also meets the requirements, up to four 20-foot containers can be loaded or unloaded at once. In theory, the loading or unloading of two 40-foot containers or four 20-foot containers can be completed in one operation, which can significantly reduce ship turnaround time and improve terminal loading and unloading efficiency. To fully leverage the efficiency of twin 40-foot QCs the common operating scenarios for the dual hoists should be utilized as much as possible, while avoiding wasting time by frequently adjusting the hoists for other scenarios [35]. However, due to limitations inherent to twin 40-foot QCs, it cannot simultaneously load two 40-foot containers into two slots on different tiers of the container ship at the same time, as shown in Figure 3.
Although twin 40-foot QCs can accelerate terminal operations, they also pose greater demands on the container ship loading plan. This paper proposes a stowage strategy and model that is suitable for twin 40-foot QC loading and unloading in multi-port operations, which can accommodate twin 40-foot QC loading and unloading at ports and is also compatible with normal QC operations.

2.3.4. Rehandling Operation

Figure 4 shows the stowage of a double-bay and the numbers in the chart indicate the destination port of the containers. When the vessel arrives at Port 2, all of the containers on tiers 86 and 84 need to be unloaded, but there are containers loaded on top with destinations at Port 3. In this case, the QC needs to unload the containers for Port 3 first, and then unload the containers for Port 2. After unloading is completed, the containers for Port 3 need to be reloaded back onto the container ship. This type of operation is called a rehandling operation [12].
In general, rehandling is unavoidable, but ports have increasingly focused on how to effectively reduce it. A high-quality stowage plan can minimize the amount of rehandling while ensuring the safe navigation of the vessel, thereby maximizing the economic benefits of all parties involved.

3. Materials and Methods

3.1. MP-MBPP Model

3.1.1. Assumption

The MP-MBPP model is established based on the following assumptions:
1
The attribute information of the containers to be loaded and unloaded at each port of call on the route is known, such as the type, size, destination port, and quantity of the containers.
2
The structure of the container ship is known, including the number of bays, the capacity of each bay, the bay number, etc.
3
Only standard 20-foot and 40-foot containers are considered, and oversize, refrigerated, and dangerous containers are ignored.
4
The ship only loads at the origin port and unloads at the destination port.
5
At any given time, all containers to be loaded on the ship must not exceed the maximum loading capacity of the ship in terms of weight, and the total quantity of containers should not exceed the maximum number of container slots on the ship.
6
Starting from the bow, every two adjacent bays form a double-bay, and both can accommodate 40-foot containers.
7
The average additional loading and unloading time caused by container rehandling is represented as t e , the time required for the crane to move one bay distance is t b , and the average time required for the crane to load or unload a container is t c .
8
The cranes are uniform and are twin 40-foot QCs.

3.1.2. Sets

  • B: Index set of single bays, b B
  • F: Index set of double-bays, f F , F B
  • O: Index set of double-bay serial numbers, o O
  • P: Index set of ports, i , j P
  • R: Index set of columns in the bay, r R
  • L: Index set of tiers in the bay, l L
  • L 1 : Subset of tiers in the bay, when c f b r t i j = 0
  • C: Index set of containers in the route, c C
  • Q: Index set of QCs, q Q
  • T: Index set of ship berthing times, t T

3.1.3. Parameters

  • n f : Number of slots in the double-bay f, f F
  • n f b : Number of slots in the single-bay b of the double-bay f, f F , b B
  • n f i j : Number of slots assigned to the container groups from the origin port i to the destination port j in the double-bay f, f F , i , j P
  • n f i j 20 : Number of 20-foot slots assigned to the container groups from the origin port i to the destination port j in the double-bay f, f F , i , j P
  • n f i j 40 : Number of 40-foot slots assigned to the container groups from the origin port i to the destination port j in the double-bay f, f F , i , j P
  • n f b i j 20 : Number of 20-foot slots assigned to the container groups from the origin port i to the destination port j in the single bay b of the double-bay f, f F , b B , i , j P
  • n f b i j 40 : Number of 40-foot slots assigned to the container groups from the origin port i to the destination port j in the single bay b of the double-bay f, f F , b B , i , j P
  • n i j : Number of containers from the origin port i to the destination port j, i , j P
  • n i j 20 : Number of 20-foot containers from the origin port i to the destination port j, i , j P
  • n i j 40 : Number of 40-foot containers from the origin port i to the destination port j, i , j P
  • a f b j : Number of vacant slots of the single bay b in the double-bay f when arriving at the port j, f F , b B , j P
  • f q t : Denotes the double-bay where the QC q is located at the moment of t, t T , q Q
  • n f q t : Denotes the number of double-bays where the QC q is located at the moment of t, t T , q Q , f F
  • o f q t : Denotes the serial number of the double-bay where the QC q is located at the moment of t, t T , q Q , f F , o O
  • n q t : Denotes the number of containers that the QC q is loading or unloading at time t, t T , q Q

3.1.4. Variables

  • x t f i j : x t f i j = 1 , if the double-bay f is assigned to containers from the origin port i to the destination port j at moment t, otherwise x t f i j = 0 , t T , f F , i , j P
  • x t f b i j : x t f b i j = 1 , if the single bay b in the double-bay f is assigned to containers from the origin port i to the destination port j at moment t, otherwise x t f b i j = 0 , t T , f F , b B , i , j P
  • x t f b r i j : x t f b r i j = 1 , if the column r of the single bay b in the double-bay f is assigned to containers from the origin port i to the destination port j at moment t, otherwise x t f b r i j = 0 , t T , f F , b B , r R , i , j P
  • x t f b r l : x t f b r l = 1 , if the tier l in column r of the single bay b in the double-bay f is assigned at moment t, otherwise x t f b r l = 0 , t T , f F , b B , r R , l L
  • x t f b r l i j : x t f b r l i j = 1 , if the tier l in column r of the single bay b in the double-bay f is assigned to containers from the origin port i to the destination port j at moment t, otherwise x t f b r l i j = 0 , t T , f F , b B , r R , l L , i , j P
  • x t f b r l c : x t f b r l c = 1 , if the tier l in column r of the single bay b in the double-bay f is assigned to a container c at moment t, otherwise x t f b r l c = 0 , t T , f F , b B , r R , l L , c C
  • x t f b r l c 20 : x t f b r l c 20 = 1 , if the tier l in column r of the single bay b in the double-bay f is assigned to a 20-foot container c at moment t, otherwise x t f b r l c 20 = 0 , t T , f F , b B , r R , l L , c C
  • x t f b r l c 40 : x t f b r l c 40 = 1 , if the tier l in column r of single-bay b in the double-bay f is assigned to a 40-foot container c at moment t, otherwise x t f b r l c 40 = 0 , t T , f F , b B , r R , l L , c C
  • d f b r l i j : d f b r l i j = 1 , if l > l " & i > i " & j < j " , otherwise d f b r l i j = 0 , f F , b B , r R , l , l " L , i , i " , j , j " P

3.1.5. Objective & Constraints

The pre-stowage plan is aimed at minimizing the amount of rehandling and the time taken for QC movements, which are represented as additional costs in the functions associated with the loading and unloading process of the vessel.
m i n y = f F b B r R l L L 1 d f b r l i j · x f b r l · t e + q Q t T ( f q t f q t 1 ) · 2 · t b
f F n f i j · x t f i j = n i j 20 + 2 · n i j 40 , t T , f F , i , j P
n i j = n i j 20 + n i j 40 , i , j P
a f 1 = n f , f F
a f j = n f i < j , i P j " j , j " P n f i j " · x t f i j " , t T , f F , j P , j > 1
a f j + i < j , i P n f i j · x t f i j j < j " , j " P n f j j " · x t f j j " , t T , f F ; j P , j > 1
x t f b r l x t f b r j " , t T , f F ; b B ; r R ; l j " L
i f x t f b r j " c 20 = 1 , x t f b r l c 20 = 1 , t T , f F , b B , r R , 1 l < j " L , c C
c C x t f b r l c 1 , t T , f F , b B , r R , l L
i f x t f b r l c 20 = 1 , x t f b " r l c " 40 = 0 , t T , f F , r R , l L , c , c " C
i f x t f b r l c 40 = 1 , x t f b " r l c 40 = 1 , t T , f F , r R , l L , c C
f F , b B , r R , l L x t f b r l c 40 2 , t T , c C
f F , b B , r R , l L x t f b r l c 20 1 , t T , c C
| o f q 1 t o f q 2 t | > 4 , t T , f F , q 1 , q 2 Q , o O
o f q 1 t + 1 < o f q 2 t + 1 , i f o f q 1 t < o f q 2 t , o t h e r w i s e o f q 1 t + 1 > o f q 2 t + 1 , t T , f F , q 1 , q 2 Q , o O
n f q t 1 , t T , q Q
n q t = x t f b r l i j + x t f b " r l i j + x t f b ( r + 1 ) l i j + x t f b ( r + 1 ) l i j , t T , f F , r R , l L , i , j P
Constraint (2) ensures that all containers in the route can be loaded onto the ship; constraint (3) indicates that containers from the origin port i to the destination port j are composed of 20-foot and 40-foot containers; constraint (4) indicates that the ship is empty when it arrives at port 1; constraint (5) calculates the number of vacant slots in the double-bay of the vessel after departure from port j 1 ; constraint (6) states that the number of loaded containers in the double-bay at port j cannot exceed the remaining slots in the bay after unloading containers; constraint (7) ensures that there is no suspended loading area during the loading process; constraint (8) ensures that the loading area for 20-foot containers is not above that for 40-foot containers. As there are no slots available in the center of a 40-foot container to secure containers, 20-foot containers cannot be placed on top of 40-foot containers to avoid container tilting. However, a 40-foot container can be loaded on top of two 20-foot containers.
Constraint (9) indicates that only one container can be loaded in any slot on the ship at any moment; constraint (10) indicates that when a 20-foot container is assigned to the l column of the r layer of a double-bay f slot at moment t, the adjacent single-bay slot cannot be loaded with a 40-foot container; constraint (11) indicates that a 40-foot container occupies two adjacent single-bay slots in a double-bay slot; constraint(12) indicates that at any moment, any one 40-foot container occupies, at most, one double-bay slot; constraint (13) indicates that, at any moment, any one 20-foot container occupies, at most, one single-bay slot.
Constraint (14) requires that different QCs operate at least one bay apart from each other, while constraint (15) represents the non-cross constraint of QCs. Constraint (16) states that a QC can only perform loading and unloading operations at one double-bay, and constraint (17) specifies that the twin 40-foot QCs are limited and cannot load and unload two 40-foot containers simultaneously in two bays on different levels of the container ship.

3.2. Stowage Strategies and Solution Algorithm

This paper proposes an optimized decision-making approach for double-bay allocation in the master bay plan problem based on the operation of twin 40-foot QCs. To investigate the impact of loading and unloading port sequences on stowage efficiency, a corresponding solution algorithm is designed. A heuristic rule-based stowage algorithm is used to verify the feasibility of the loading strategy for twin 40-foot QCs. Furthermore, a particle swarm optimization algorithm is introduced to further optimize the allocation of double-bays. Prior to this, it is assumed that when planning to allocate containers of different sizes to the same double-bay at different loading or unloading ports, no rehandling will be required if the upper slots of the double-bay have already been assigned to containers shipped from Port A to Port B, and any container that meets any of the following conditions can be planned into the slots without causing rehandling:
1
The origin of the container is the same as Port A, and the destination is before Port B;
2
The destination of the container is the same as Port B, and the origin is after Port A;
3
The loading and unloading ports of the container are both before Port B;
4
The loading and unloading ports of the container are both after Port A.

3.2.1. New Strategies of MP-MBPP

In this section, the containers for the entire route are grouped using the master bay stowage strategy; the allocation of double-bays for different container groups and container numbers is determined using the following rules and strategies. For the experiments in this paper, the double-bay structure of the container ship remains consistent. Therefore, the container sets can be assigned to non-designated double-bays first, and then the positions of the double-bays can be optimized using the particle swarm optimization algorithm, as in strategy S2.
Step 1: Container grouping. The containers at the current port are grouped according to their destination port and size, with containers having the same destination port placed in the same group.
Step 2: Container set sorting. The container sets are sorted according to the rules of “loading ports from near to far, and destination ports from far to near” and “20-foot container sets first, followed by 40-foot container sets”. Following the sorting rule, it is written as { ( V a 1 , W a 1 , , V 2 1 , W 2 1 ) , ( V a 2 , W a 2 , , V 3 2 , W 3 2 ) , , ( V a a 1 , W a a 1 ) } , where V denotes the 20-foot container group, W denotes the 40-foot container group, a is the number of ports, V a 1 denotes the 20-foot container group with port 1 as the starting port and a as the destination port, and W a 1 denotes the 40-foot container group with port 1 as the starting port and a as the destination port. The first rule ensures that container groups further away from the destination port are loaded earlier. The second rule ensures that, within each sorted destination port container group, the 20-foot container group is loaded earlier.
Step 3: Double-bay sorting. Two strategies, S1 and S2, are proposed for sorting double-bays.
  • Strategy S1: Double-bays are selected sequentially, starting from the center of the ship and moving towards both ends, with non-adjacent bays selected first. After reaching the bow or stern, the remaining double-bays are selected using the same rule from the center of the ship, forming the set of twice-selected double-bays, denoted as { F m / 2 , F m / 2 + 2 , F m / 2 2 , , F 1 , F m , F m / 2 + 1 , F m / 2 1 , } , where [ m / 2 ] is the rounded-up value. This strategy prioritizes safety distance for QC operations and non-crossing constraints by assigning containers with the same destination port to non-adjacent double-bays. This approach aims to balance the workload of the QCs and reduce waiting time.
  • Strategy S2: This strategy does not specify the order of double-bays, but assigns a random number within a certain range to the double-bays where the container group is located. Then, these double-bays are sorted in descending order based on these numbers to obtain the latest position of the double-bays on the ship. Particle swarm optimization is then used for iterative optimization.
Step 4: Container bay allocation. Containers are loaded onto the ship in the order of the loading port and in reverse order of the unloading port. Moreover, 20-foot containers with the same destination port are prioritized, and then the allocation of double-bays for 40-foot containers is planned.
The container groups are assembled at the terminal. Containers are loaded onto ship bays in order using two different rules, R1 and R2.
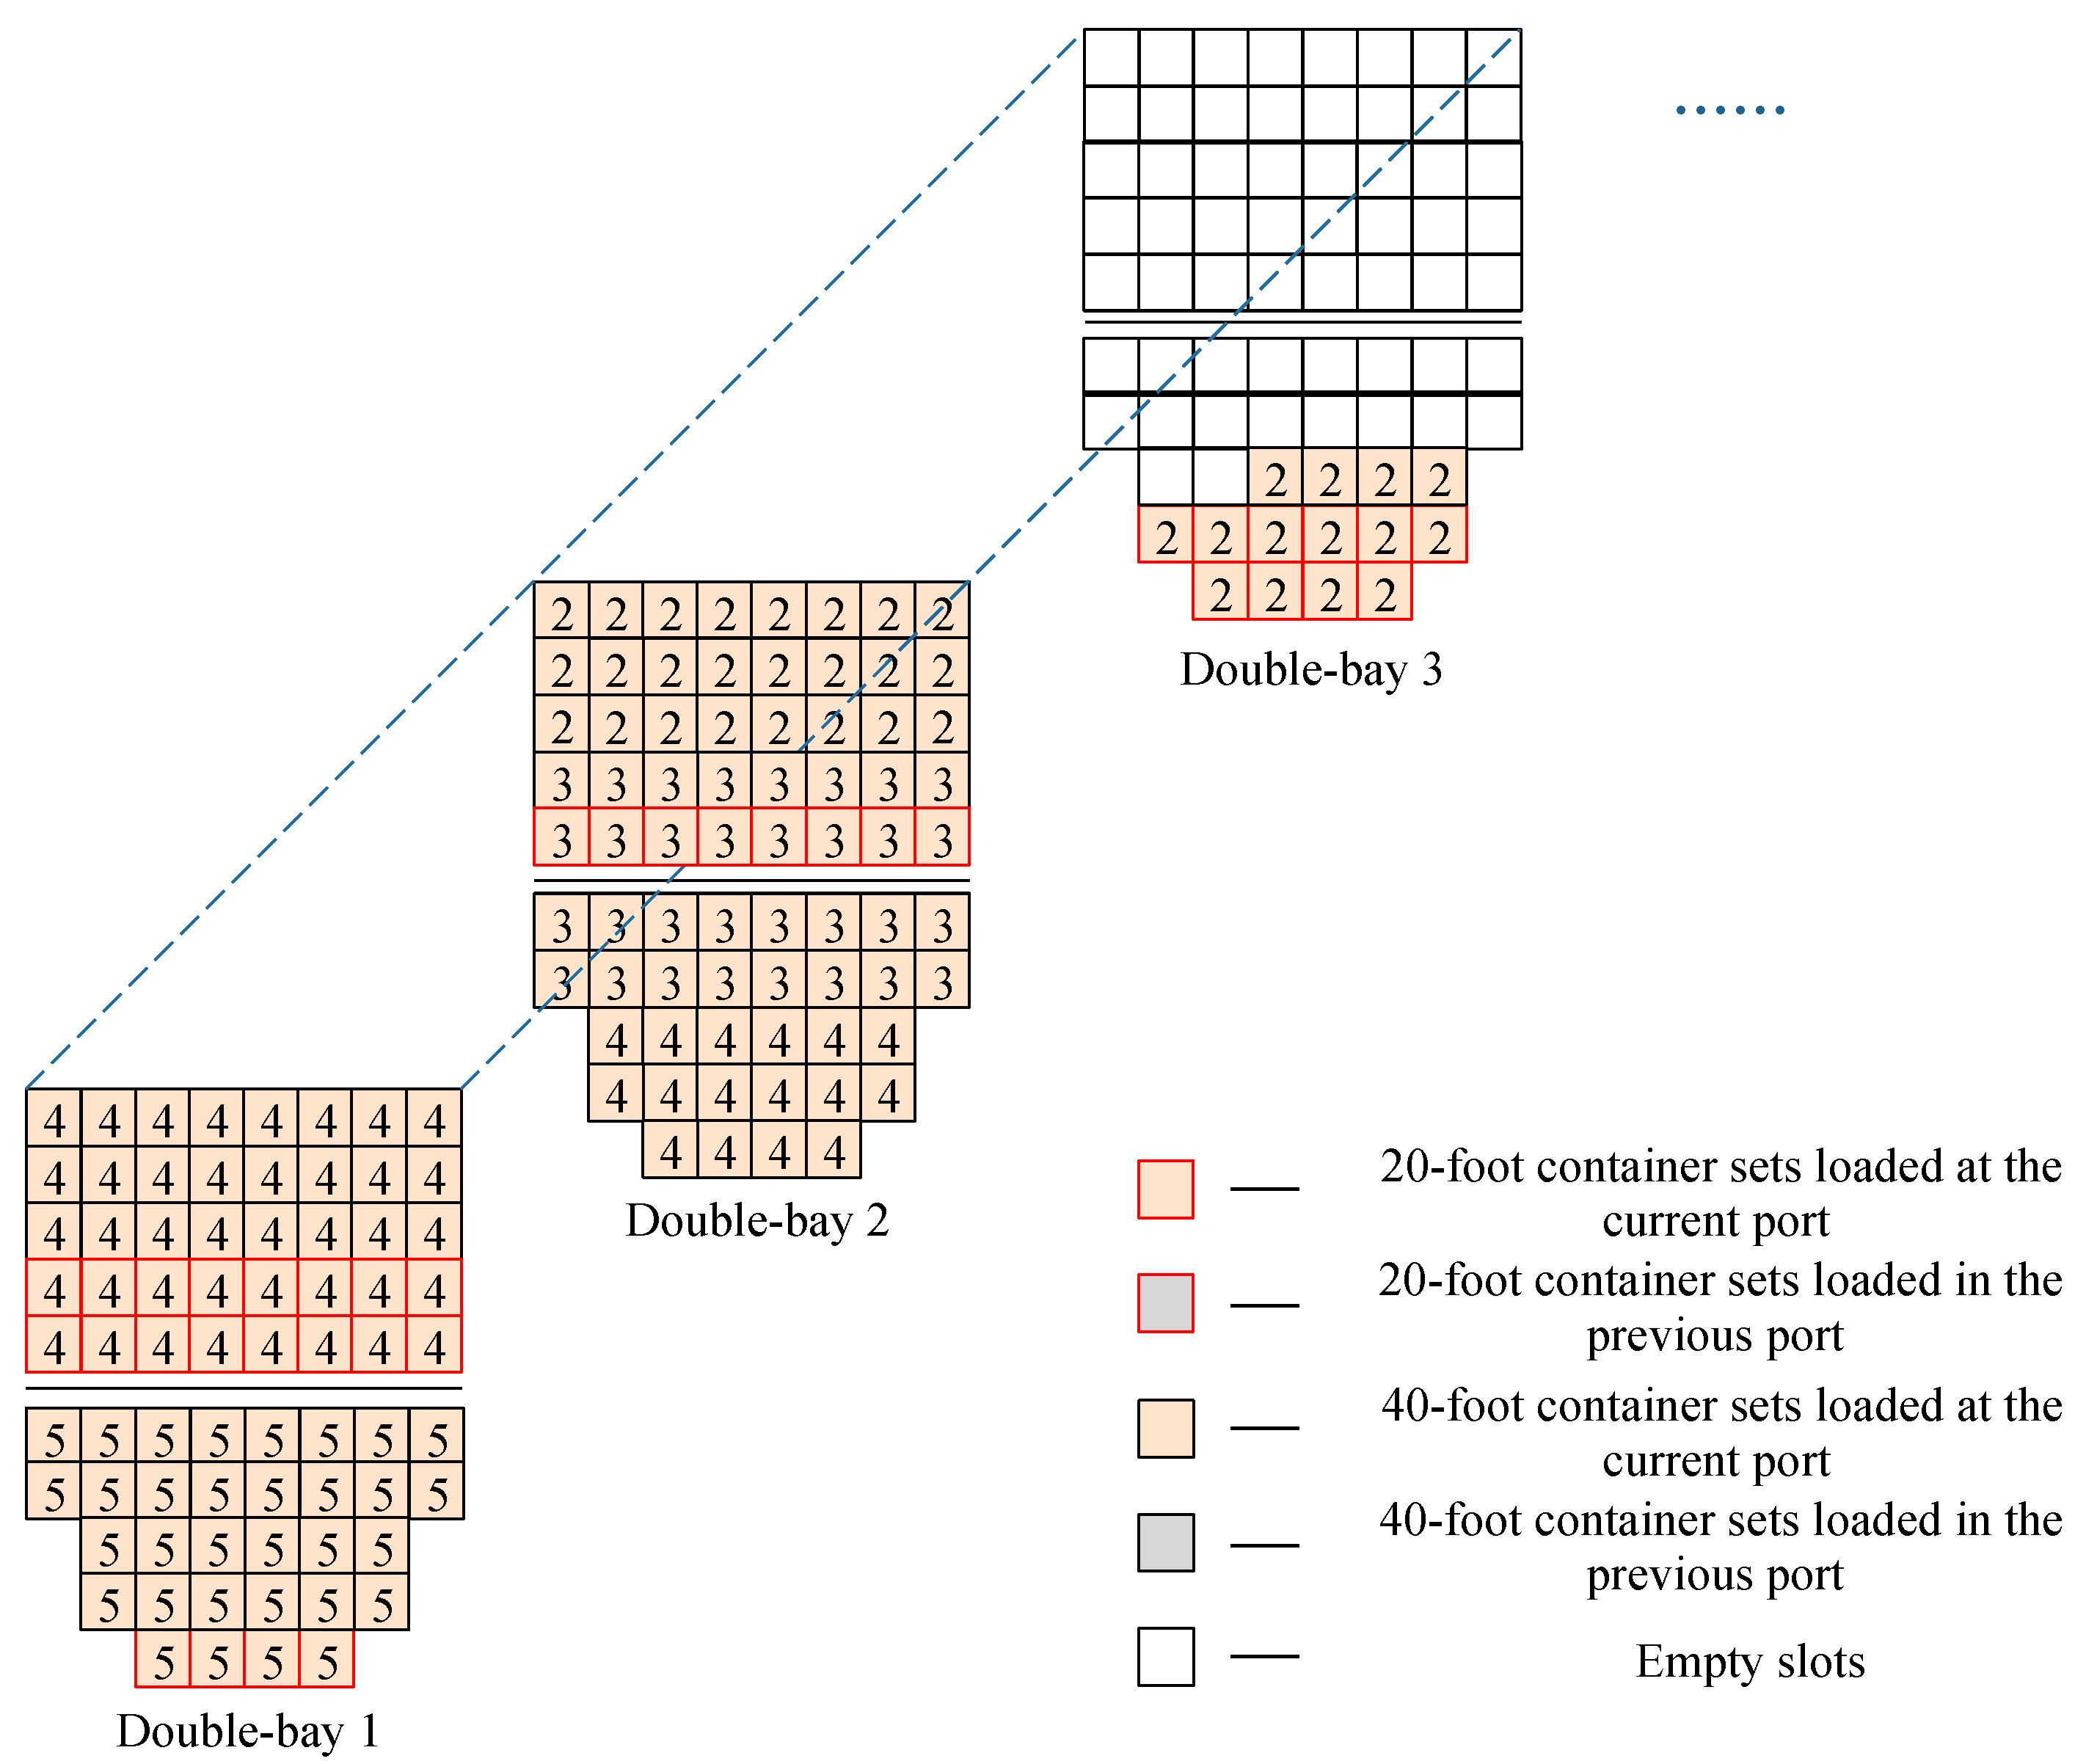
  • Rule R1: This strategy prioritizes non-empty bays with the goal of minimizing the number of occupied bays. Firstly, double-bay 1 is used to load container group V a 1 . If the capacity of double-bay 1 is greater than the number of containers in the group V a 1 , it is used to load container group V a 1 , and then container group W a 1 is selected according to the order of the container group until its capacity or weight limit is exceeded. Then, the next sorted ship double-bay set is considered. This ensures that each double-bay is filled before moving on to the next one.
Figure 5 and Figure 6 illustrate how container groups are loaded into double-bays based on the double-bay arrangement using Rule R1. The numbers on the containers indicate their respective destination ports, while Double-bay 1/2/3 does not represent the double-bay number, but rather the double-bay’s order in the sorted double-bay set. In the loading plan of starting port 1, the first double-bay position gives priority to the loading of the 20-foot and 40-foot container sets of the last destination port 5. According to rule R1, when there is an empty slot in the double-bay position, the container sets of destination port 4 will continue to be selected, and then the corresponding container sets are loaded in reverse order of the destination ports in turn. When the ship arrives at port 2, the QC first unloads the container sets that need to be unloaded at that port; after unloading the containers, the export containers are loaded according to the same stowage rules.
  • Rule R2: Due to the consistent berthing structure of the selected vessel in this paper, the double-bays of the vessel are not sorted before loading the container groups. Instead, specific double-bays are designated for each container group, and the number of containers to be loaded throughout the entire route is determined in advance. According to this rule, the double-bays are loaded in sequence based on the sorting of container groups. Once a double-bay is loaded with a container group, the next double-bay in the set of double-bays on the vessel is considered for other container groups, i.e., ensuring that the 20-foot containers of the destination port can be loaded. In addition, when the destination port of a group of containers is close to the current port in the ranking (under the condition that the loading constraints are satisfied for the empty container slots in the loaded container double-bay), the 40-foot container of the destination port closer to the current loading port is given priority to be loaded.
Figure 7 and Figure 8 illustrate how rule R2 loads container groups (layer by layer from left to right) into the current double-bay.
At port 1, the container set for the last destination port 5 is loaded first. Even if that double-bay is not filled, the next double-bay is selected to load containers for destination port 4. Containers for destination port 3 and destination port 2 are then loaded according to rule R2. If destination port 2 is adjacent to the current port in the port sorting, the containers for port 2 are given priority and unloaded at the next port. At this point, if the number of containers destined for port 2 is less than or exceeds the capacity of a double-bay, the remaining containers will be assigned to any double-bay with available space. If this can be done without requiring the re-handling of containers by the loading and unloading vessel and while satisfying other constraints, containers for other destination ports will also be loaded in the same double-bay to balance the workload of QC operations. The priority is to mix and load containers with the same destination port with containers from other destination ports into the same double-bay position, in order to reduce the time needed to move the QC at the current port.
In port 2, containers with the same destination port are assigned to the same double-bay, with priority, under the condition that the constraints are satisfied, and the rest of the containers are assigned according to rule R2.
It should be noted that, whether in rule R1 or rule R2, there may be a situation where the previous 40-foot containers are loaded and the double-bay is not yet full. Because the 20-foot containers cannot be placed on the 40-foot containers, the loading of the next 20-foot container set cannot continue. At this point, there are two ways of allocation:
1
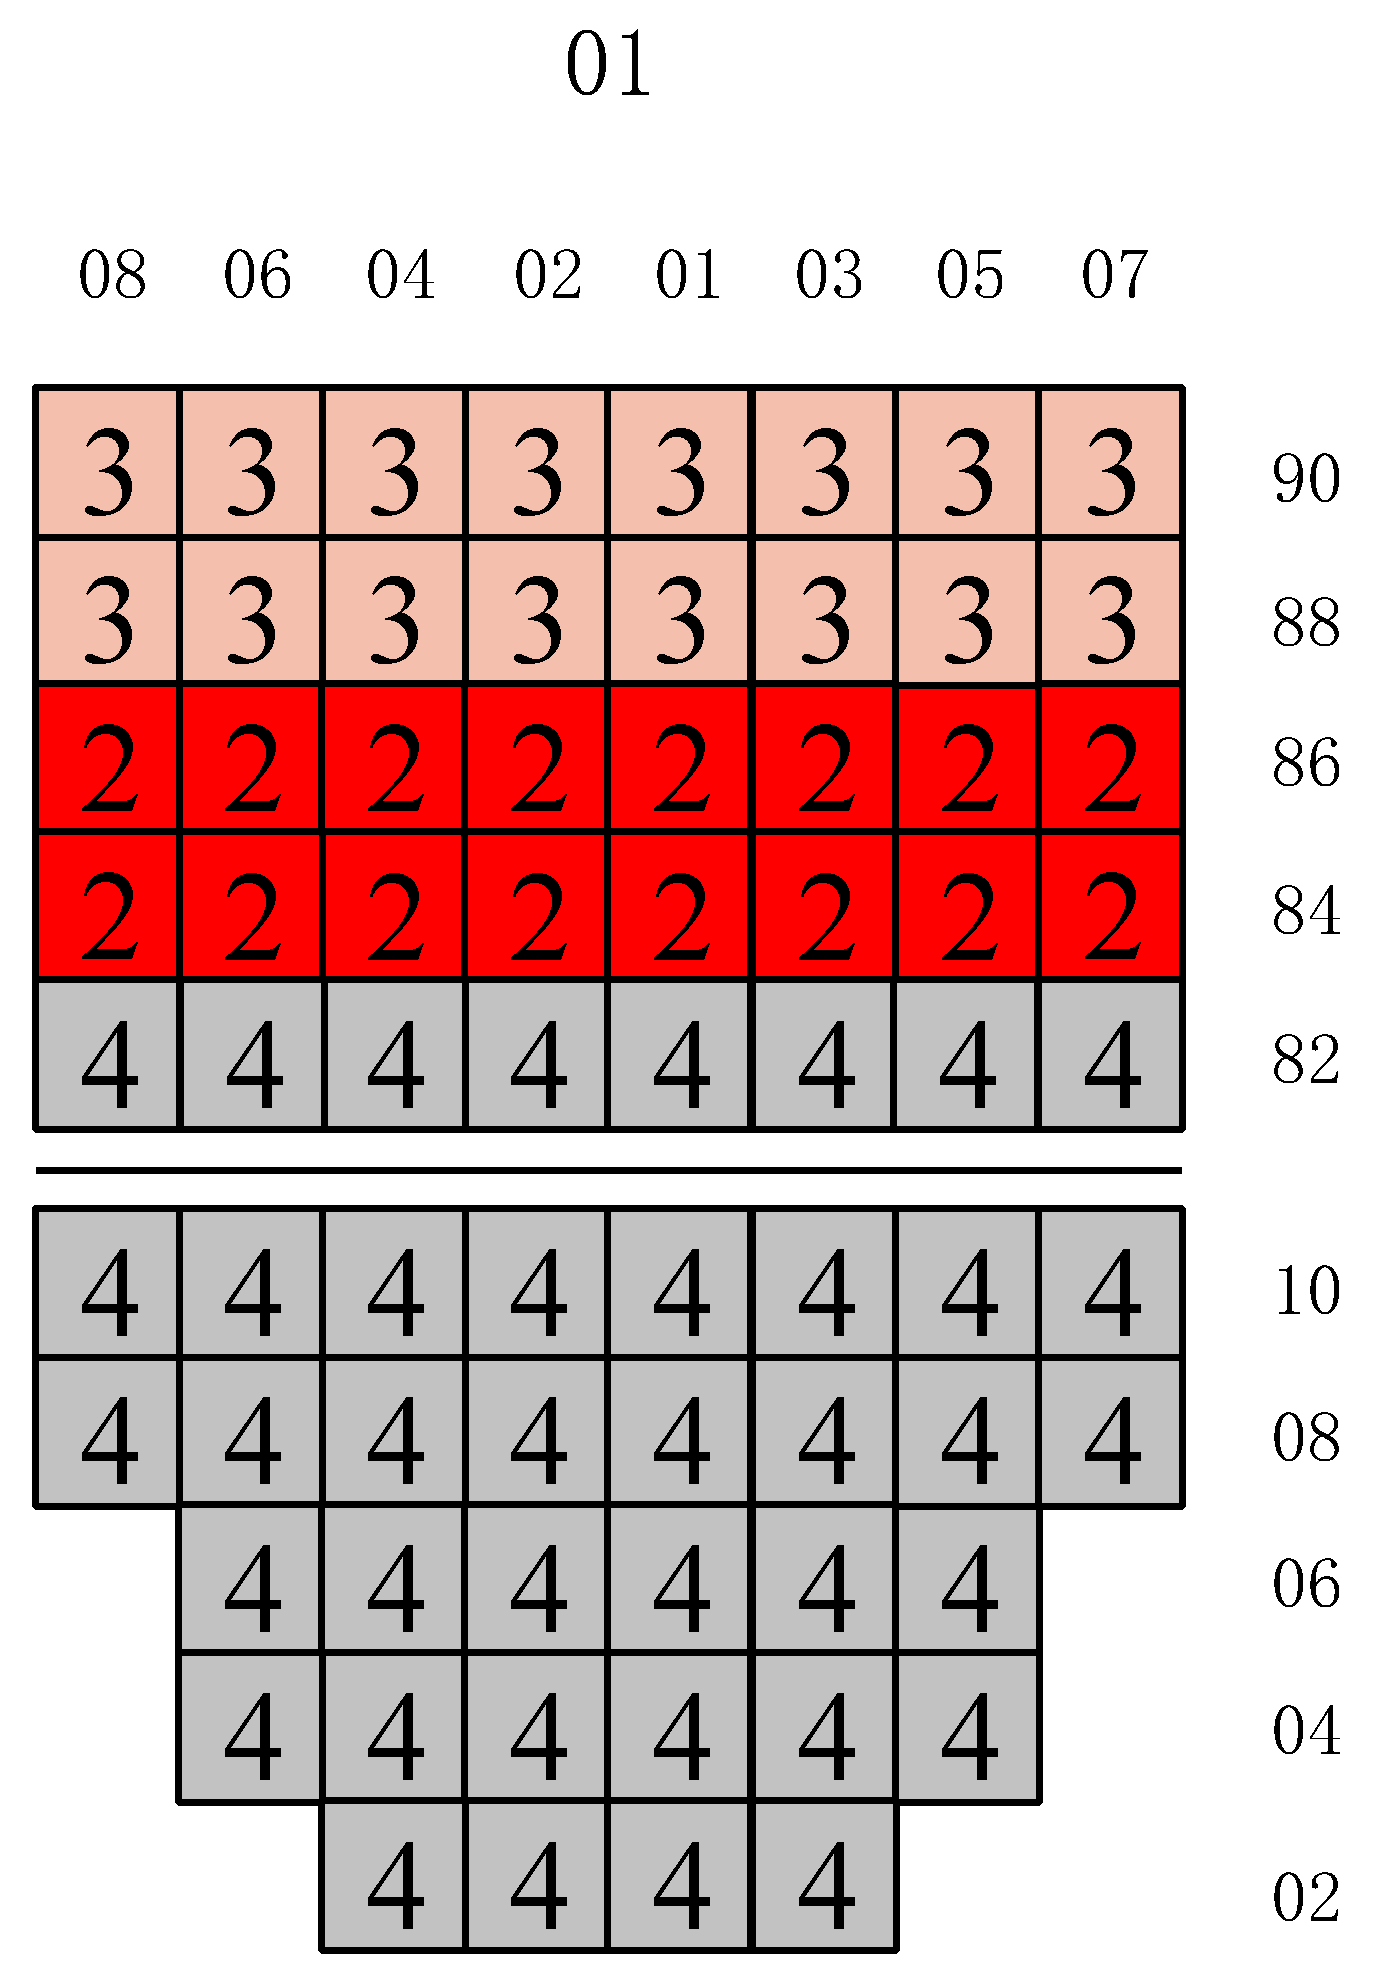
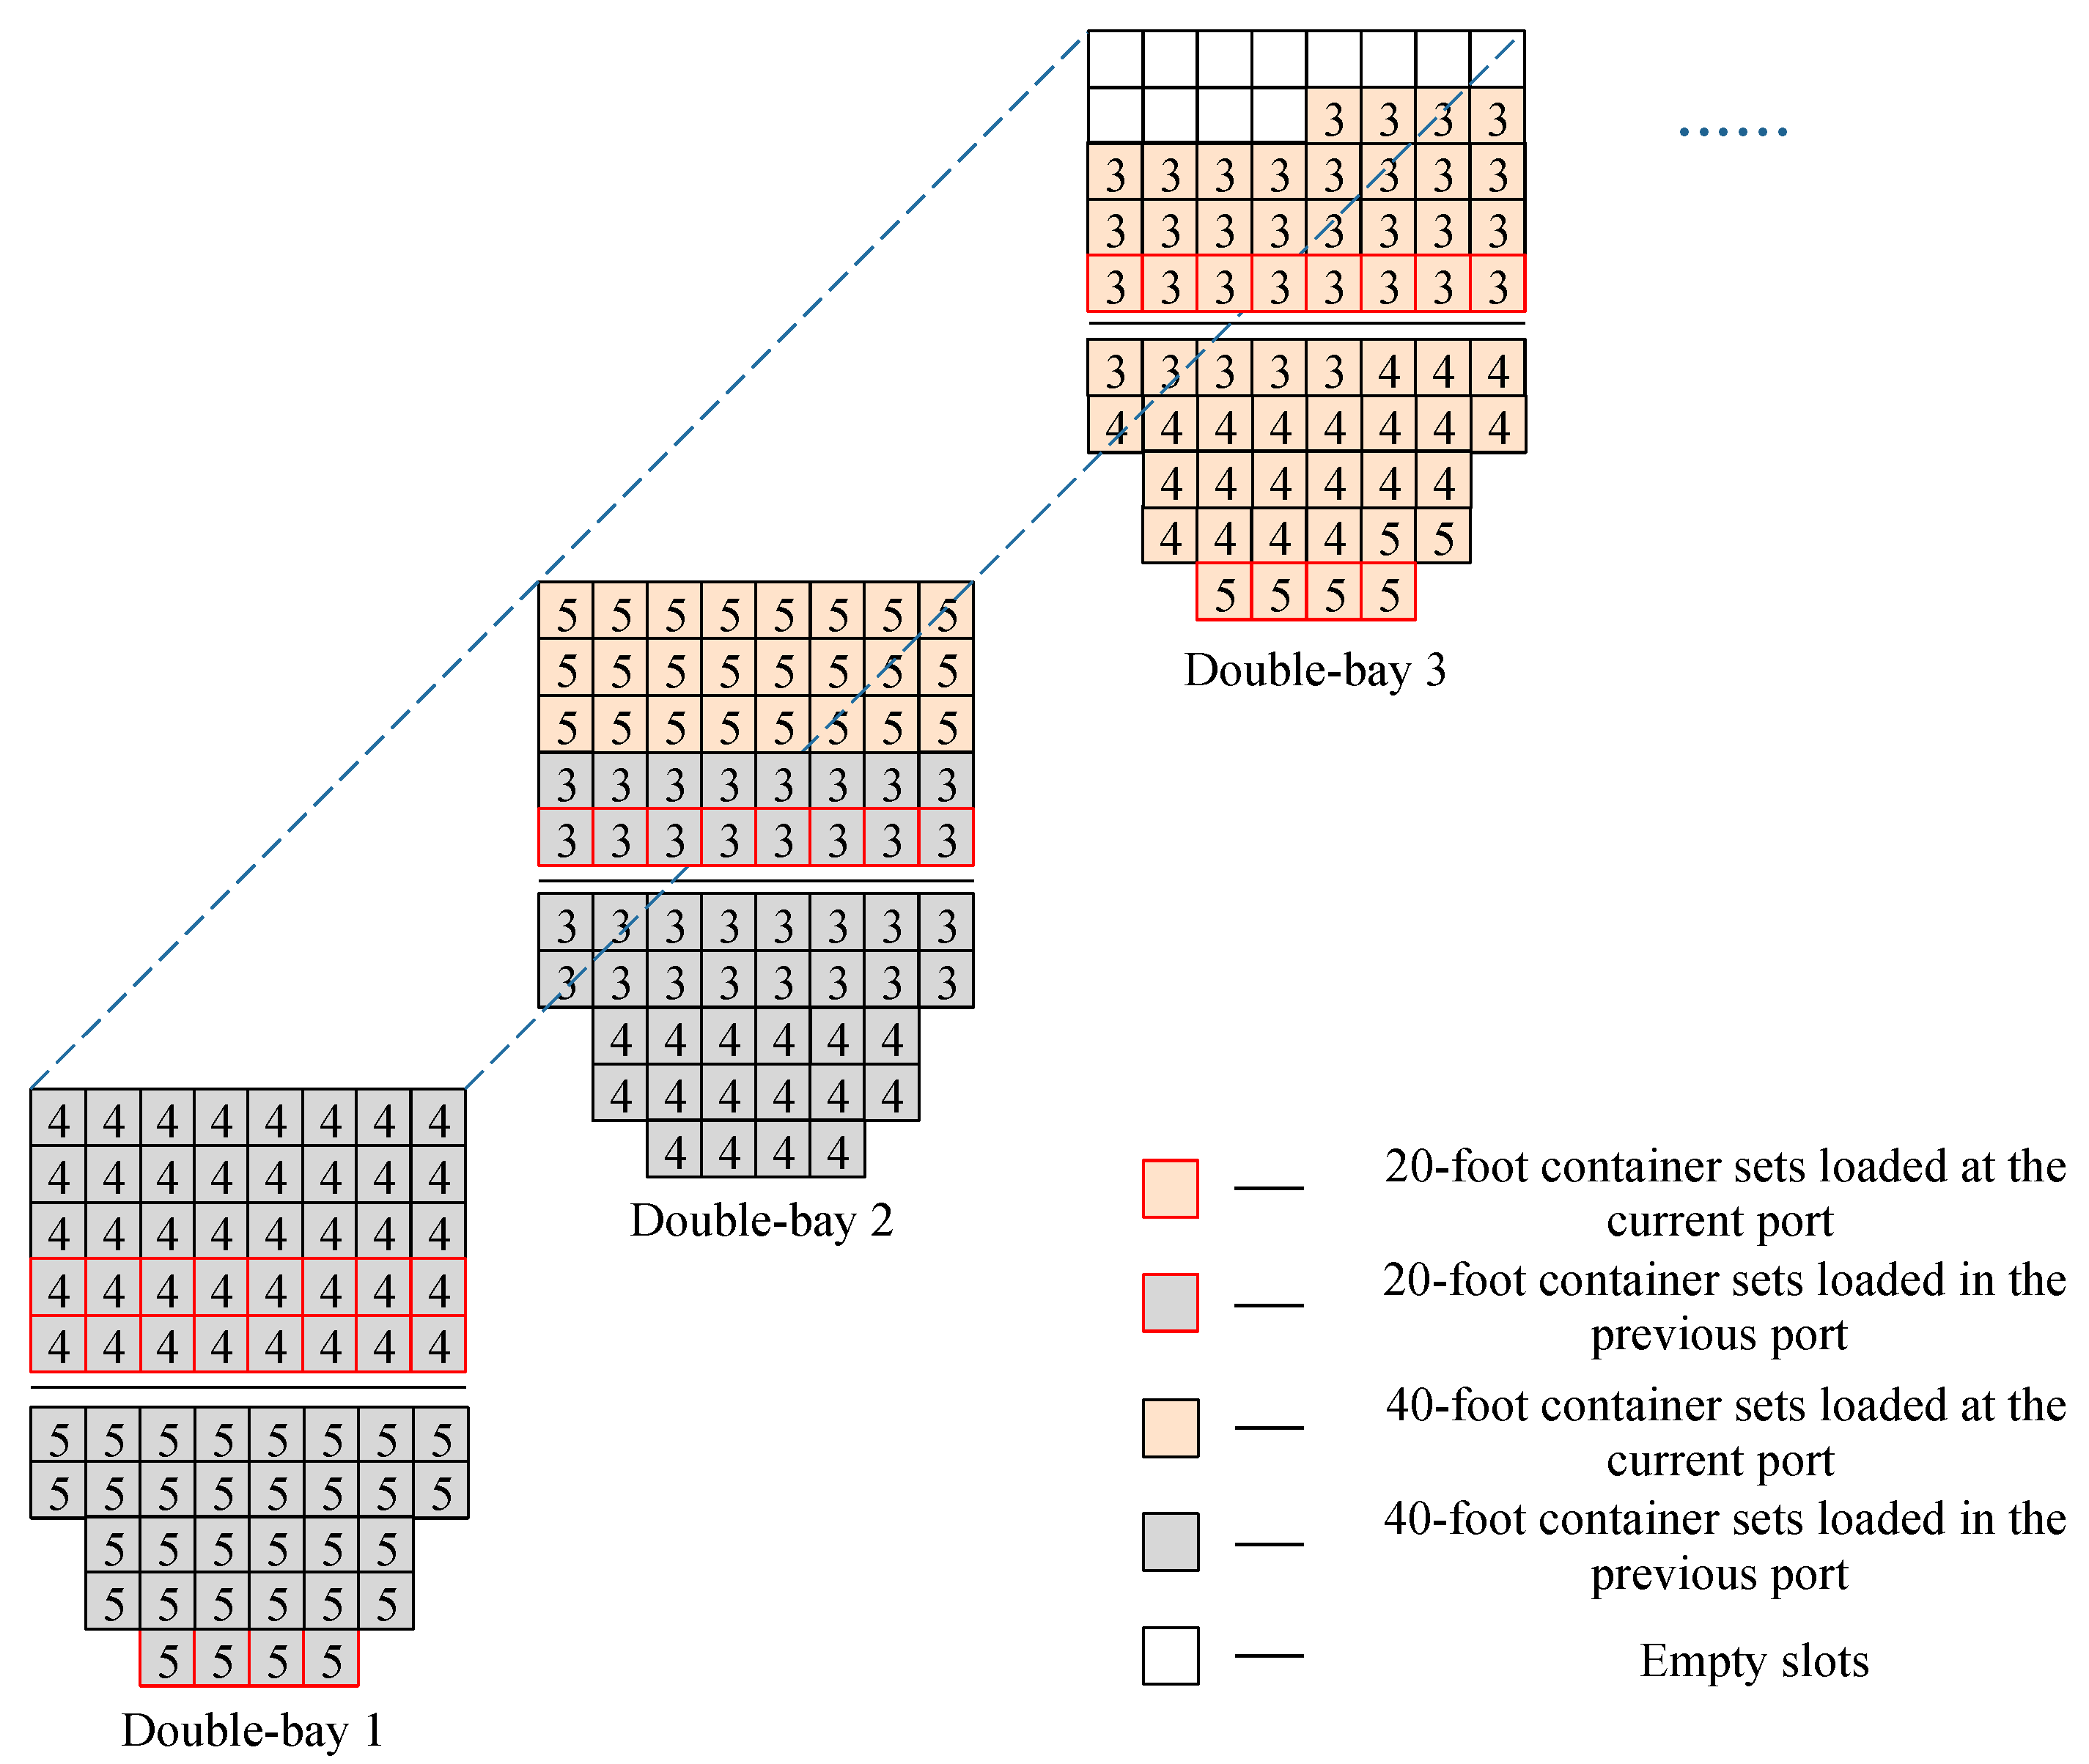
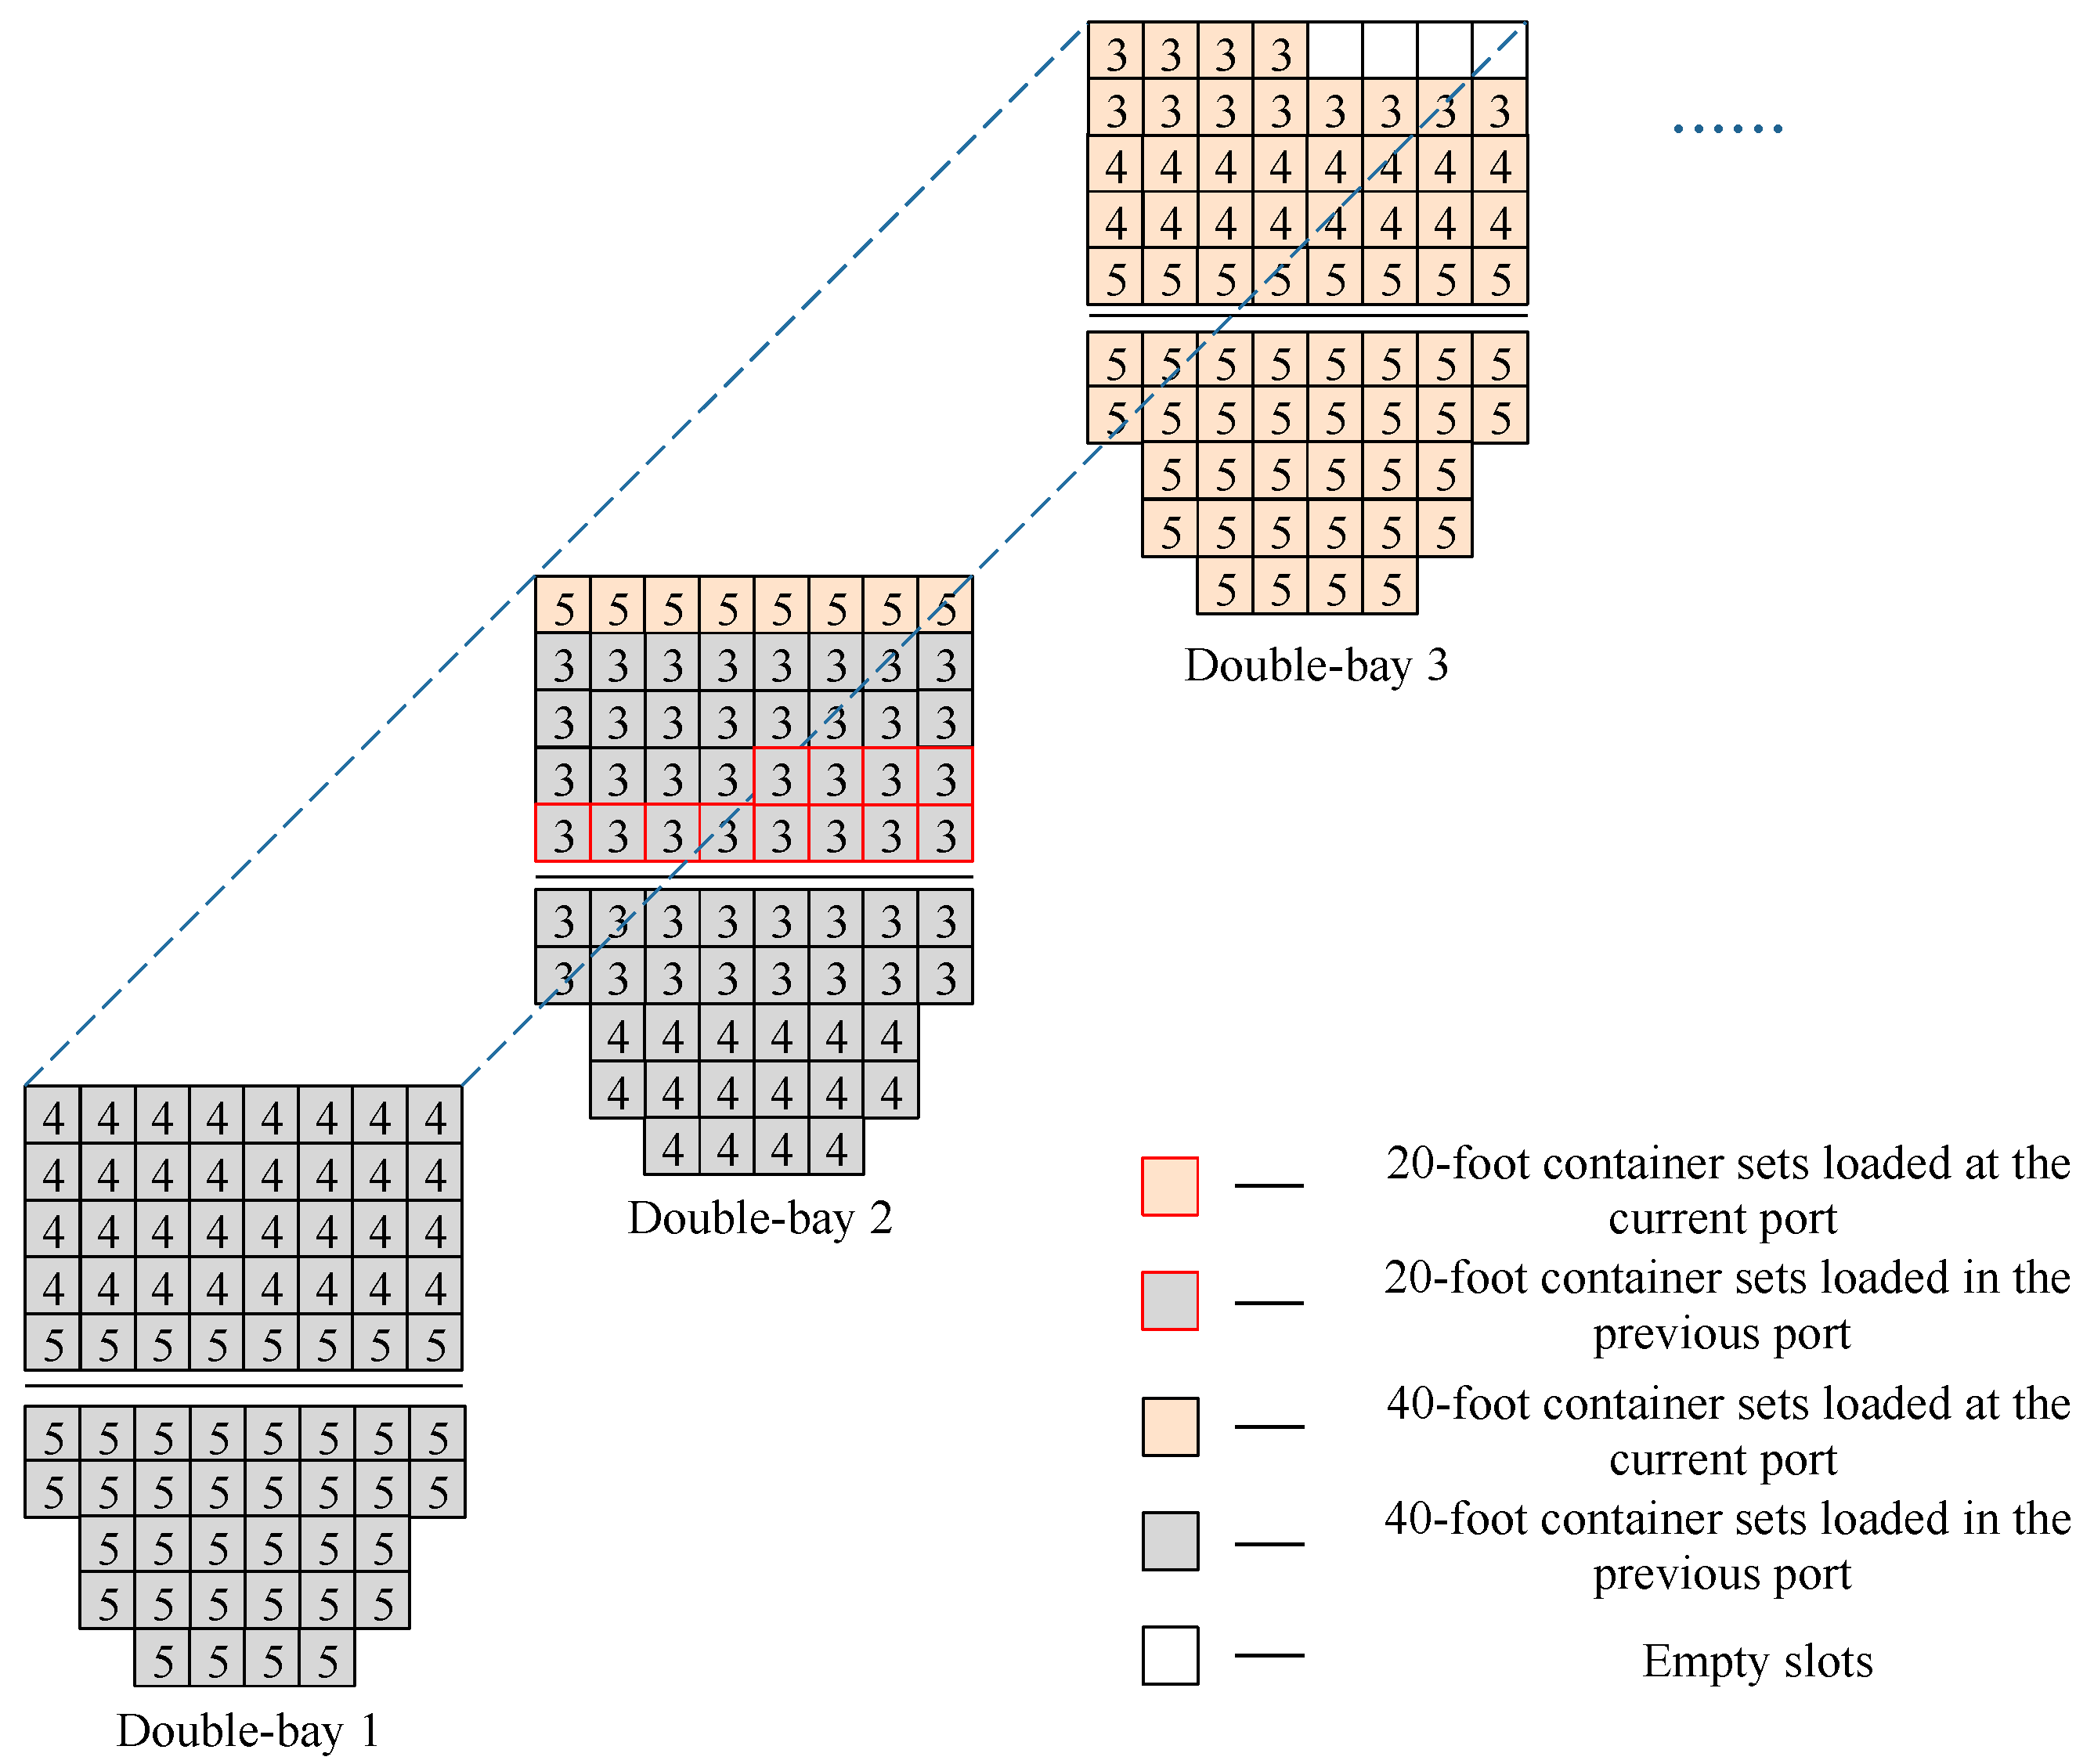
If the lower deck stowage of the previous destination is not fully loaded, the 40-foot container of the subsequent destination is loaded into the hold first, followed by the 20-foot container of the subsequent destination on the deck. As shown in Figure 9, after the ship loads containers with destination port 4, the hold is not yet full, so the 20-foot containers of destination port 3 need to be loaded. However, priority is given to loading 40-foot containers first to partially fill the hold before loading 20-foot containers.
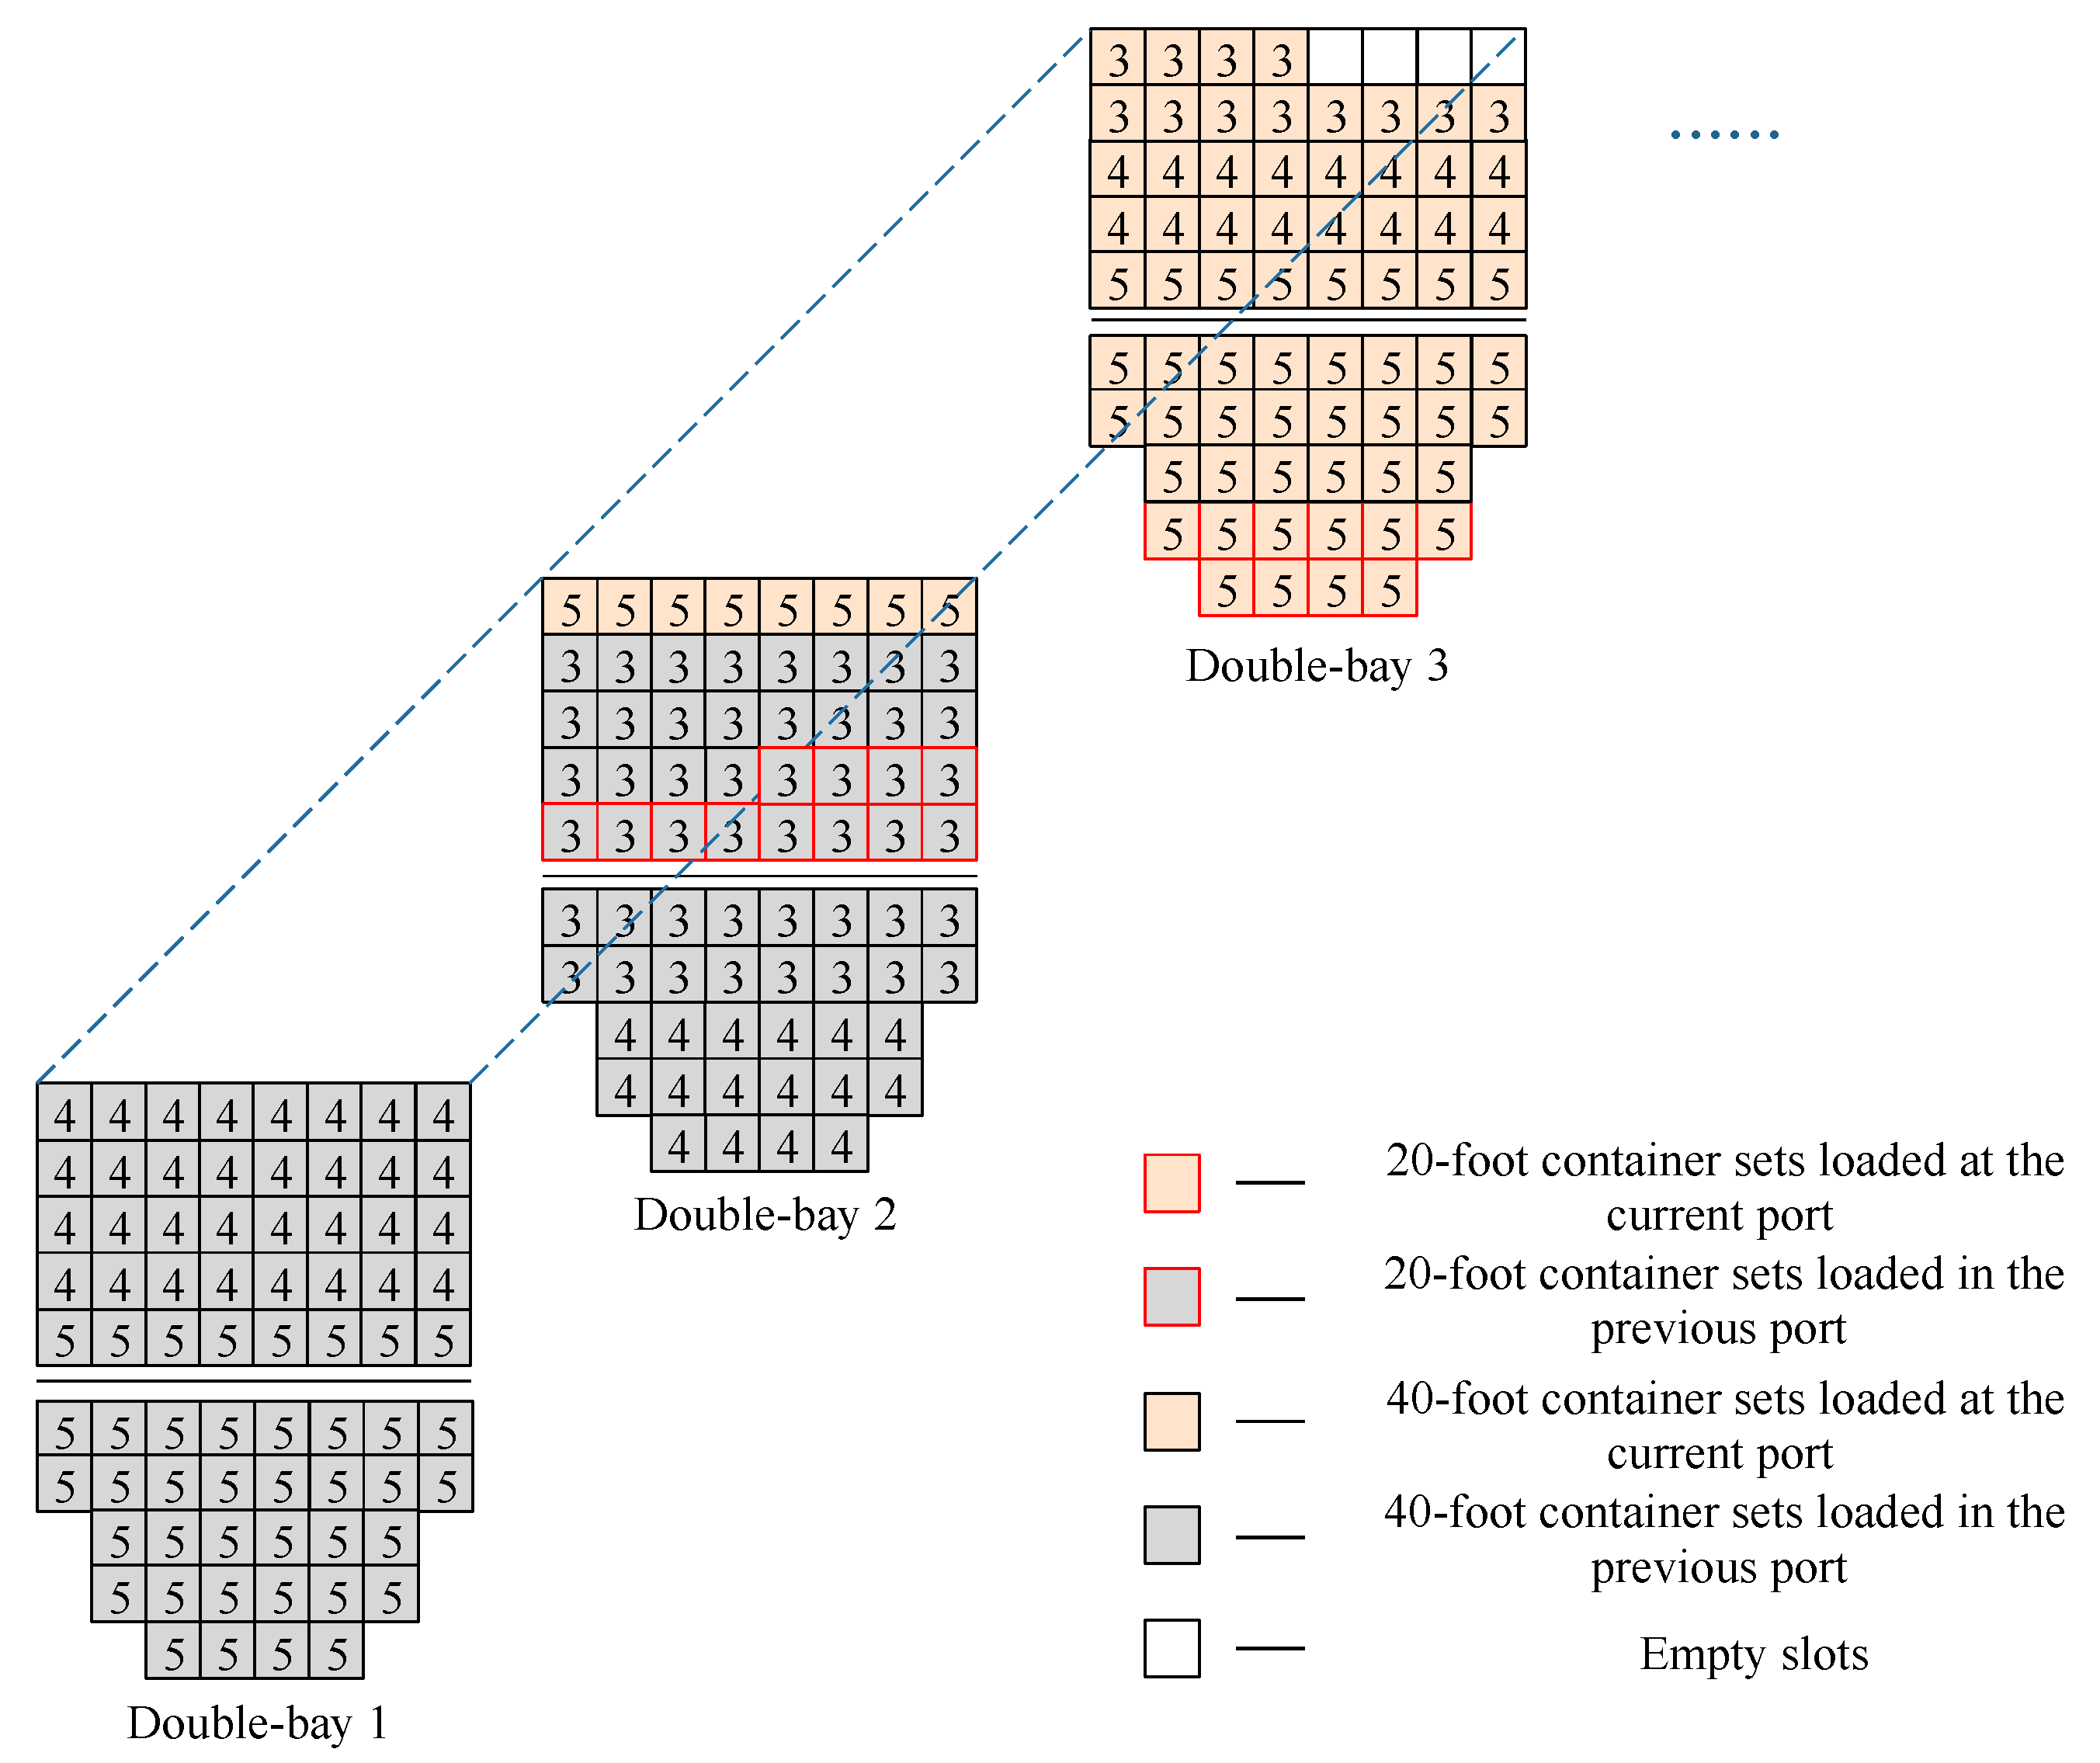
2
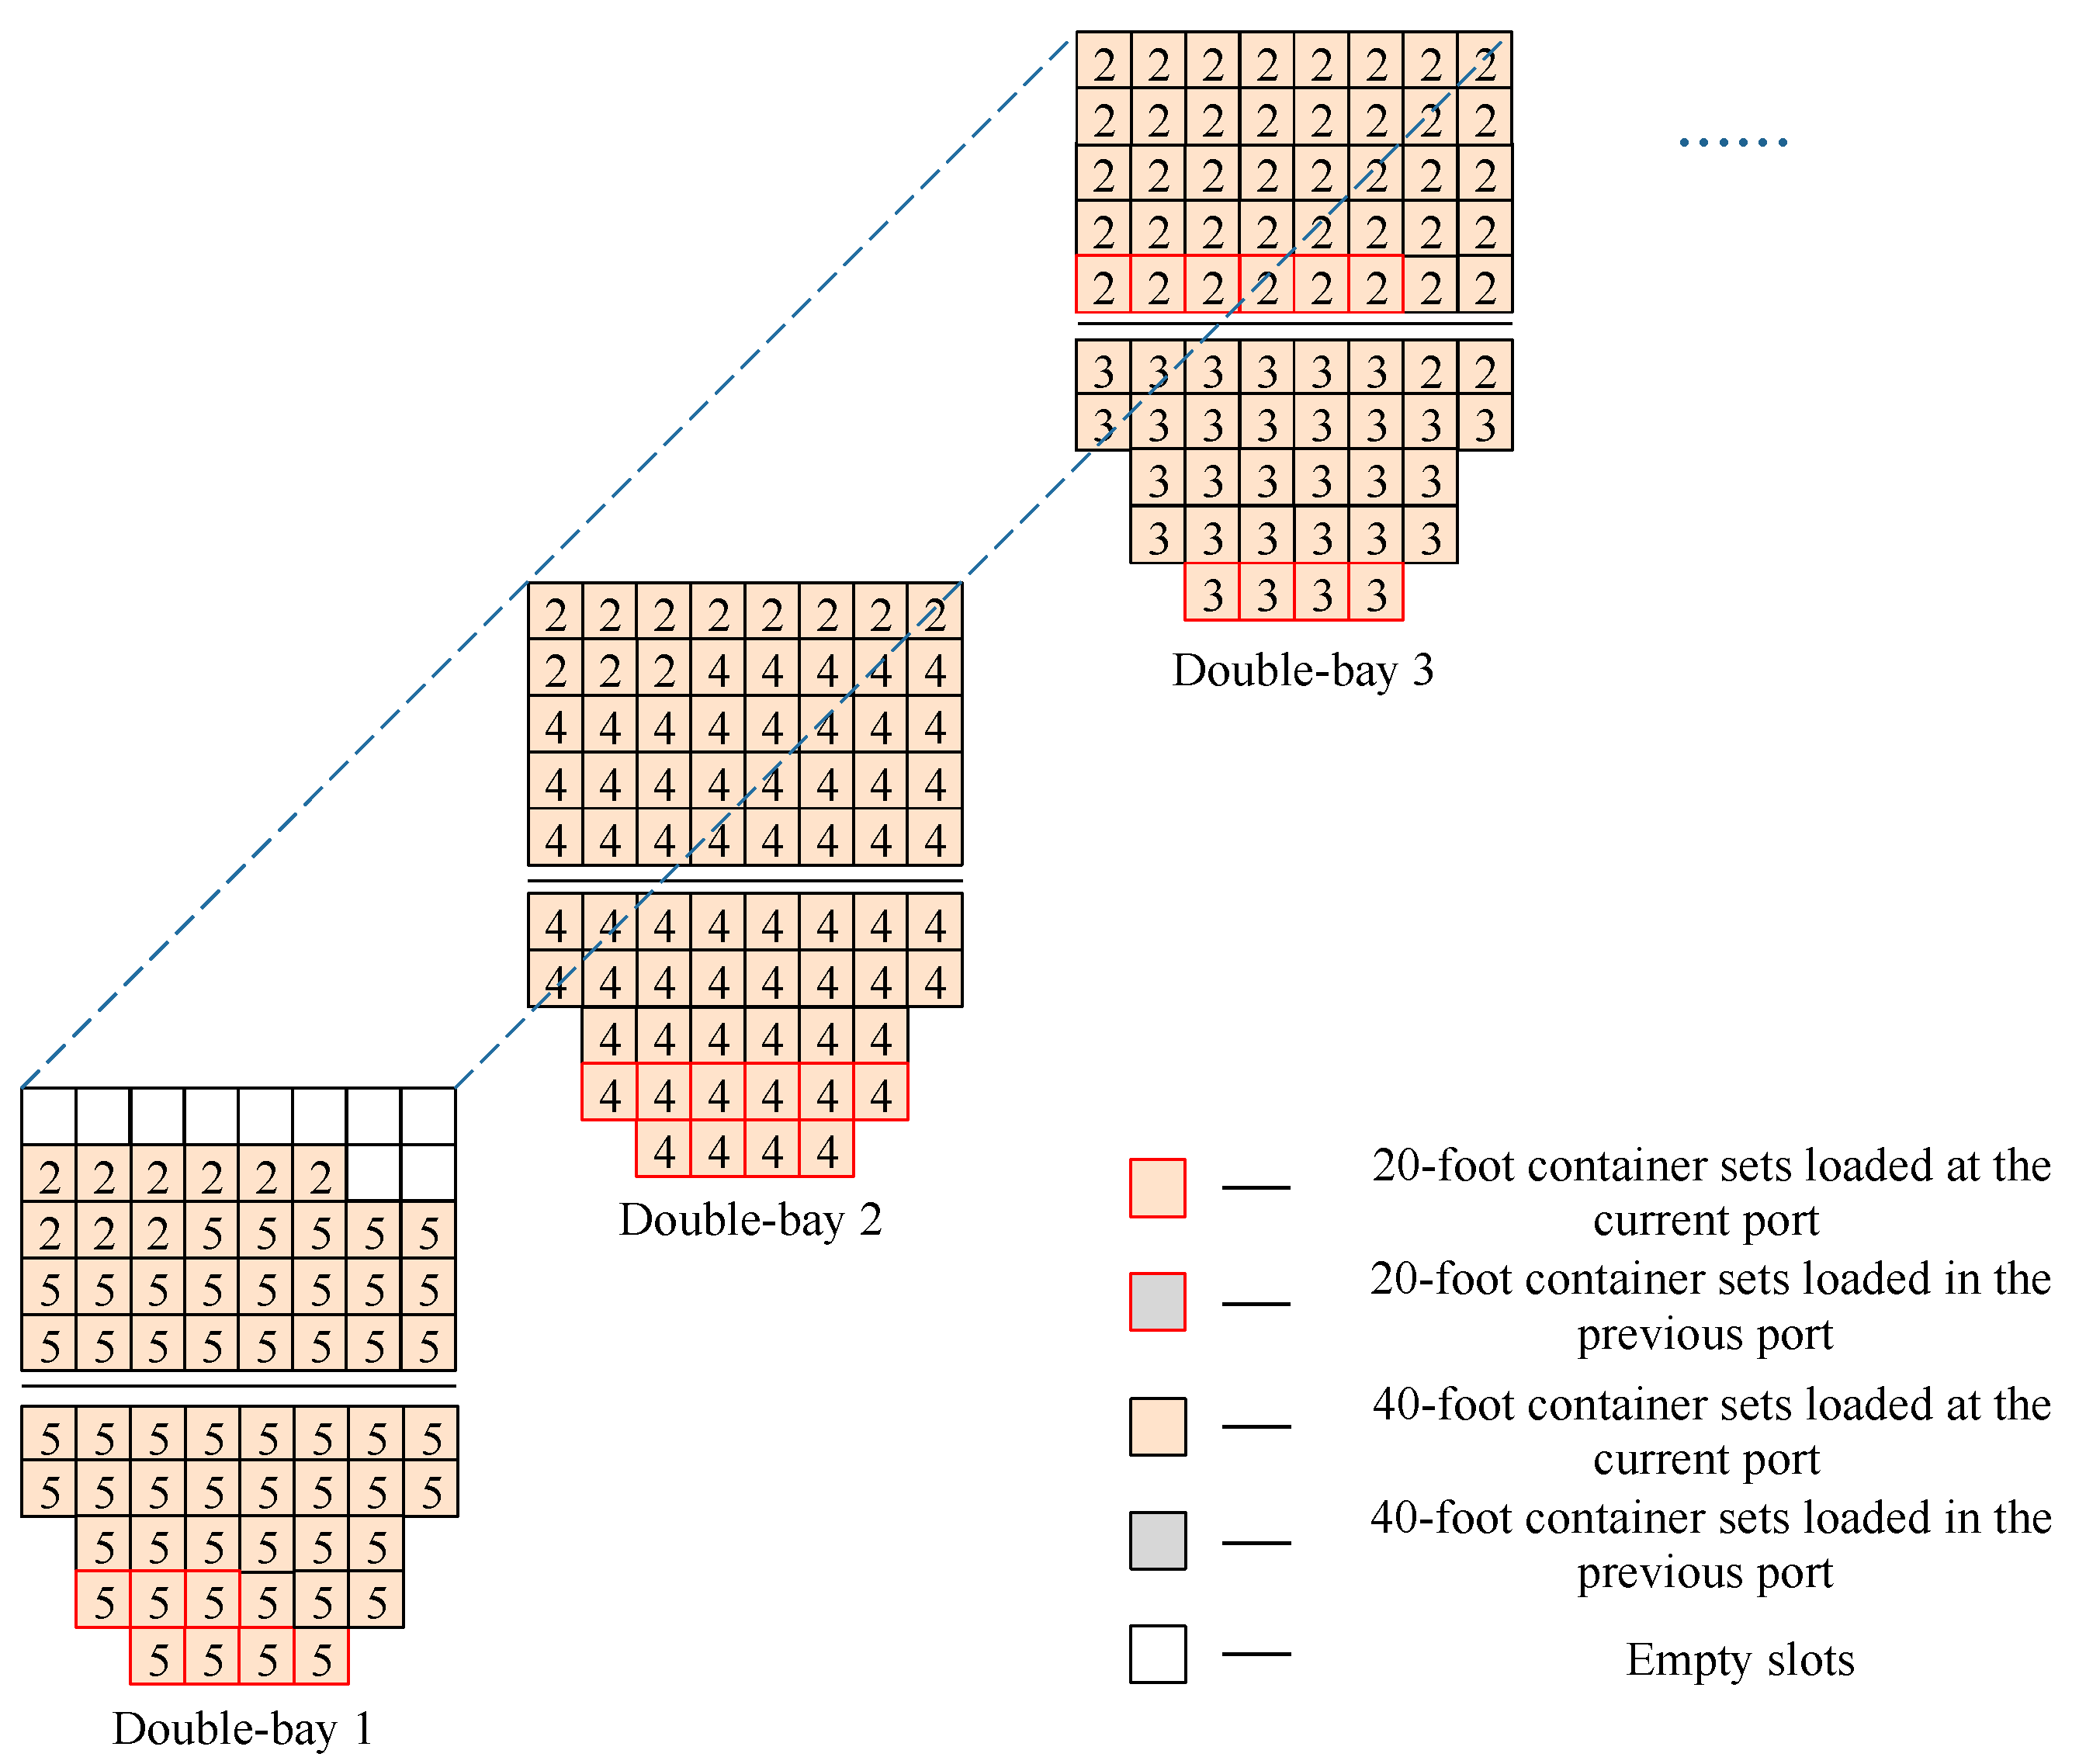
If the upper deck stowage of the previous destination is not fully loaded, the next double-bay in the sorted set of ship double-bays is selected. The 20-foot containers of the subsequent destination are loaded into that double-bay and then loading continues according to rule R1, as shown in Figure 10. At the current port, priority is given to loading the 20-foot containers, but if there is an empty space above the previous double-bay on the upper deck and 40-foot containers have already been loaded on that deck, the next double-bay is selected for loading.
The above is a specific description of the algorithm for container loading strategy. This section considers how to improve the efficiency of loading and unloading operations at berthing ports. Since 20-foot containers cannot be placed on top of 40-foot containers, the loading area for 20-foot containers was planned first to avoid situations where there is no space to place 20-foot containers. Secondly, throughout the entire planning process, the impact of the loading and unloading sequence of ports on the overturning of containers during the loading and unloading operations is considered to avoid container overturning.
A detailed planning method for the 20-foot container area is proposed, which can be divided into two parts: (1) placing the idle slots above the hatch cover, and (2) selecting unused double-bays and placing them in the vessel’s hold. Finally, during the area planning process, containers of the same destination port are distributed on the vessel in a scattered manner, so that multiple QCs can be arranged to operate synchronously during loading and unloading operations at berthing ports, thereby improving the unloading efficiency of the vessel at the port.

3.2.2. Operation of Twin 40-Foot QCs

When loading and unloading containers on container ships, improper QC scheduling can lead to ship mid-ship deflection. Mid-ship deflection occurs when there are more or heavier containers at the ends of the ship than in the middle, which can result in stress problems for the container ship. To prevent mid-ship deflection, this paper proposes a uniform loading and unloading rule:
1
Loading rule: When only loading operations are required at the current port, the assigned QCs will load containers from the center of the ship to the sides.
2
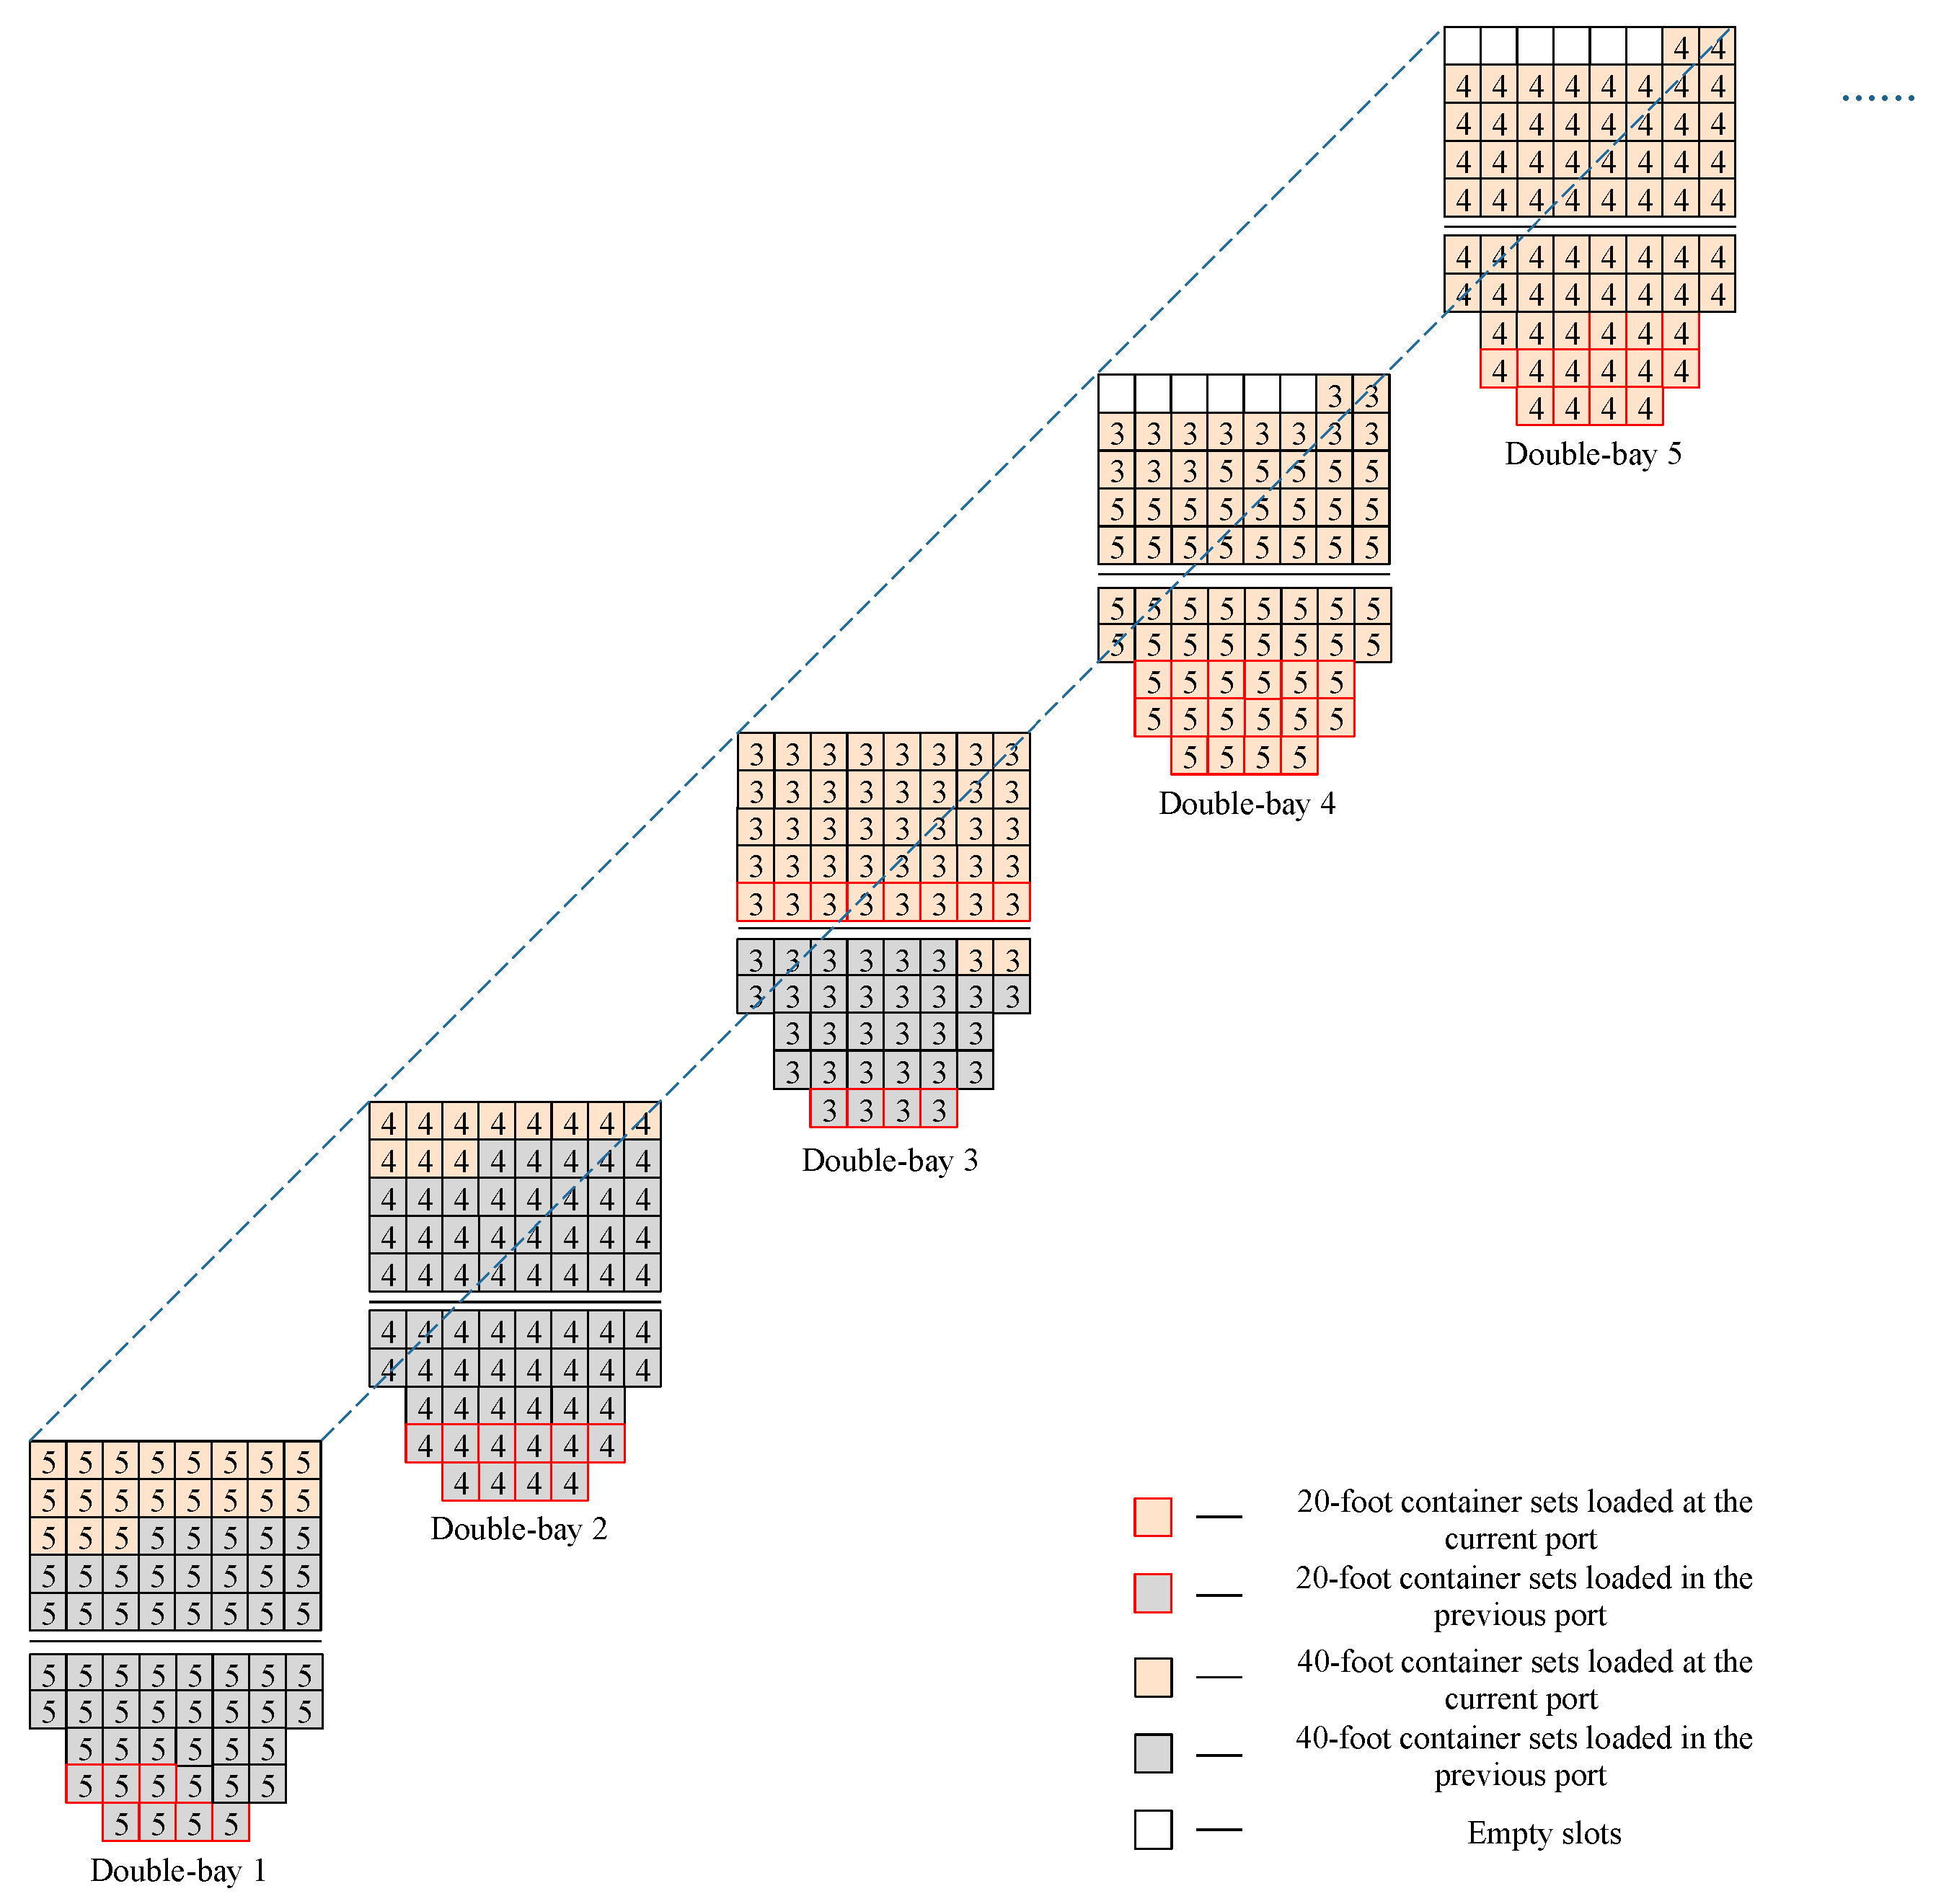
Loading and unloading rule: When both loading and unloading operations are required or only unloading operations are required at the current port, one crane will load and unload containers from the bow to the stern of the ship, while another crane will load and unload containers from the middle to the stern of the ship.
At the same time, the ”Load as you unload” rule is used. Specifically, twin 40-foot QCs are assigned to the double-bays that require unloading; after unloading the imported containers in the double-bay, they will continue to load the exported containers allocated to the same double-bay. After completing the loading and unloading tasks in the double-bay, the twin 40-foot QCs will move to the nearest double-bay to continue loading or unloading operation.

3.2.3. Particle Swarm Optimization

The particle swarm optimization (PSO) algorithm originated from the foraging behavior of birds. It assumes a group of birds searching for food in a random manner within a search area containing only one food source. Initially, all birds are unaware of the location of the food source, but they can estimate the distance to the food source and remember the nearest position to the food source in their flight path. Additionally, they are aware of the closest position to the food source that all birds in the group have passed during their flight paths. Based on both their own experience and the experience of the group, each bird makes a decision on which direction to fly next. Specifically, each bird considers the nearest position to the food source in its own flying path and in the flying path of the entire group to decide where to fly next. This is the fundamental principle of the PSO algorithm, and its basic formulas [36,37] are as follows.
v i d ( t + 1 ) = w · v i d ( t ) + c 1 · r 1 · ( p i d x i d ( t ) ) + c 2 · r 2 · ( p g d x i d ( t ) )
x i d ( t + 1 ) = x i d ( t ) + a · v i d ( t + 1 )
In the formulas, i = 1 , 2 , 3 , ... , N represents the particle number; d = 1 , 2 , 3 , ... , D represents the dimension number of the particle; t represents the iteration number; w is the inertia factor, whose value linearly decreases from 0.9 to 0.4 with the increase in iteration times; c 1 , c 2 are the acceleration constants, which are generally equal to 2; r 1 , r 2 are random numbers in the range of 0 to 1; a is the constraint factor used to control the weight of velocity, which is usually 0.729; v i ( t ) = { v i 1 ( t ) , v i 2 ( t ) , v i 3 ( t ) , ... , v i D ( t ) } represents the flying speed of particle i at iteration t; x i ( t ) = { x i 1 ( t ) , x i 2 ( t ) , x i 3 ( t ) , ... , x i D ( t ) } represents a solution to the optimization problem in a D-dimensional space, corresponding to the position of the ith particle in the tth iteration of the particle swarm; p i = { p i 1 , p i 2 , p i 3 , ... , p i D } represents the best position of the ith particle on all the paths it has traversed, i.e., the position closest to the optimal solution of the objective function during its flying process; p g = { p g 1 , p g 2 , p g 3 , ... , p g D } represents the best position in all paths experienced by all particles (which can be regarded as the best position among all individual best positions).
After assigning the double-bays to different container groups, the optimization of the positions of all double-bays on the ship is performed using particle swarm encoding.
Assuming that the ship has 18 single bays with identical structures, the bay numbers are 01, 03, 07, …, 35. The bays are paired up to form 9 double-bays from bow to stern, numbered as 02, 06, 10, …, 34. In the particle swarm algorithm, the double-bays are encoded as shown in Table 1, all double-bays are sorted from the bow to stern. By comparing the priority of the double-bays in descending order, the set of double-bays in priority order is obtained, as shown in Table 2.
From the above table, it can be seen that before using the particle swarm optimization, the ship’s double-bays positions are ordered as {02, 06, 10, 14, 18, 22, 26, 30, 34}, and the container groups are loaded from double-bay position 02 at the bow to double-bay position 34 at the stern in order. After optimization, the order of double-bays is {18, 26, 30, 02,14, 10, 06, 22, 34}, and according to the optimized sequence, containers are loaded from double-bay 18 to double-bay position 34.
The particle position is used to obtain the prioritized set of double-bays, which determines the new position of the container groups in the ship. The objective function is then calculated to obtain the berthing time for the entire shipping route after loading. The particle swarm algorithm is used to find the optimal solution through the iteration, and the result of the optimal solution is the double-bay position that produces the shortest total berthing time.

4. Computational Results

This paper takes the container loading process at a large container terminal as an example, in which the container ship carries out loading and unloading tasks at seven ports. The ship only loads containers at the first port and unloads containers at the last port, while both loading and unloading operations are conducted at the remaining ports. All tests were conducted on an Intel Core i7-11800H 2.30 GHz processor and 16 GB RAM.
The strategies and rules in the loading algorithm are denoted as S1-R1, S1-R2, S2-R1, and S2-R2. Strategy S2 is implemented using the particle swarm optimization algorithm in PyCharm, and the results generated by rules R1 and R2 are used as input data to obtain the optimal double-bay positions through the iteration with the particle swarm optimization algorithm. The single-bay loading rule is denoted as S. The effectiveness of the double-bay loading rule was verified by comparing four different combinations of strategies and rules, as well as the single-bay loading rule.

4.1. Instance of Shipping Line

The vessel has 28 double bays numbered from 01 to 28, each consisting of two single bays, all with the same structure, a container capacity of 98 TEUs, and a total capacity of 2744 TEUs. The total cargo volume for the entire voyage of the vessel is 3540 TEUs. The number, size, and type of export containers to be loaded at each port of call for berthing are shown in Table 3 and Table 4.
The units in the above tables are expressed in TEU, which stands for twenty-foot equivalent unit, representing a standard 20-foot shipping container. FEU denotes a standard 40-foot container, with 1 FEU equal to 2 TEUs.

4.2. Analysis of Results

In the experiment, the number of QCs is initially set to 2, and the operating efficiency of each QC is constant and the same. The time required for loading or unloading a container by a single QC is 1 minute, and the time required for the crane to move a double-bay distance is 4 minutes. The results of comparing the traditional single-bay stowage with different strategies of stowage planning using double bays as the unit are as follows.

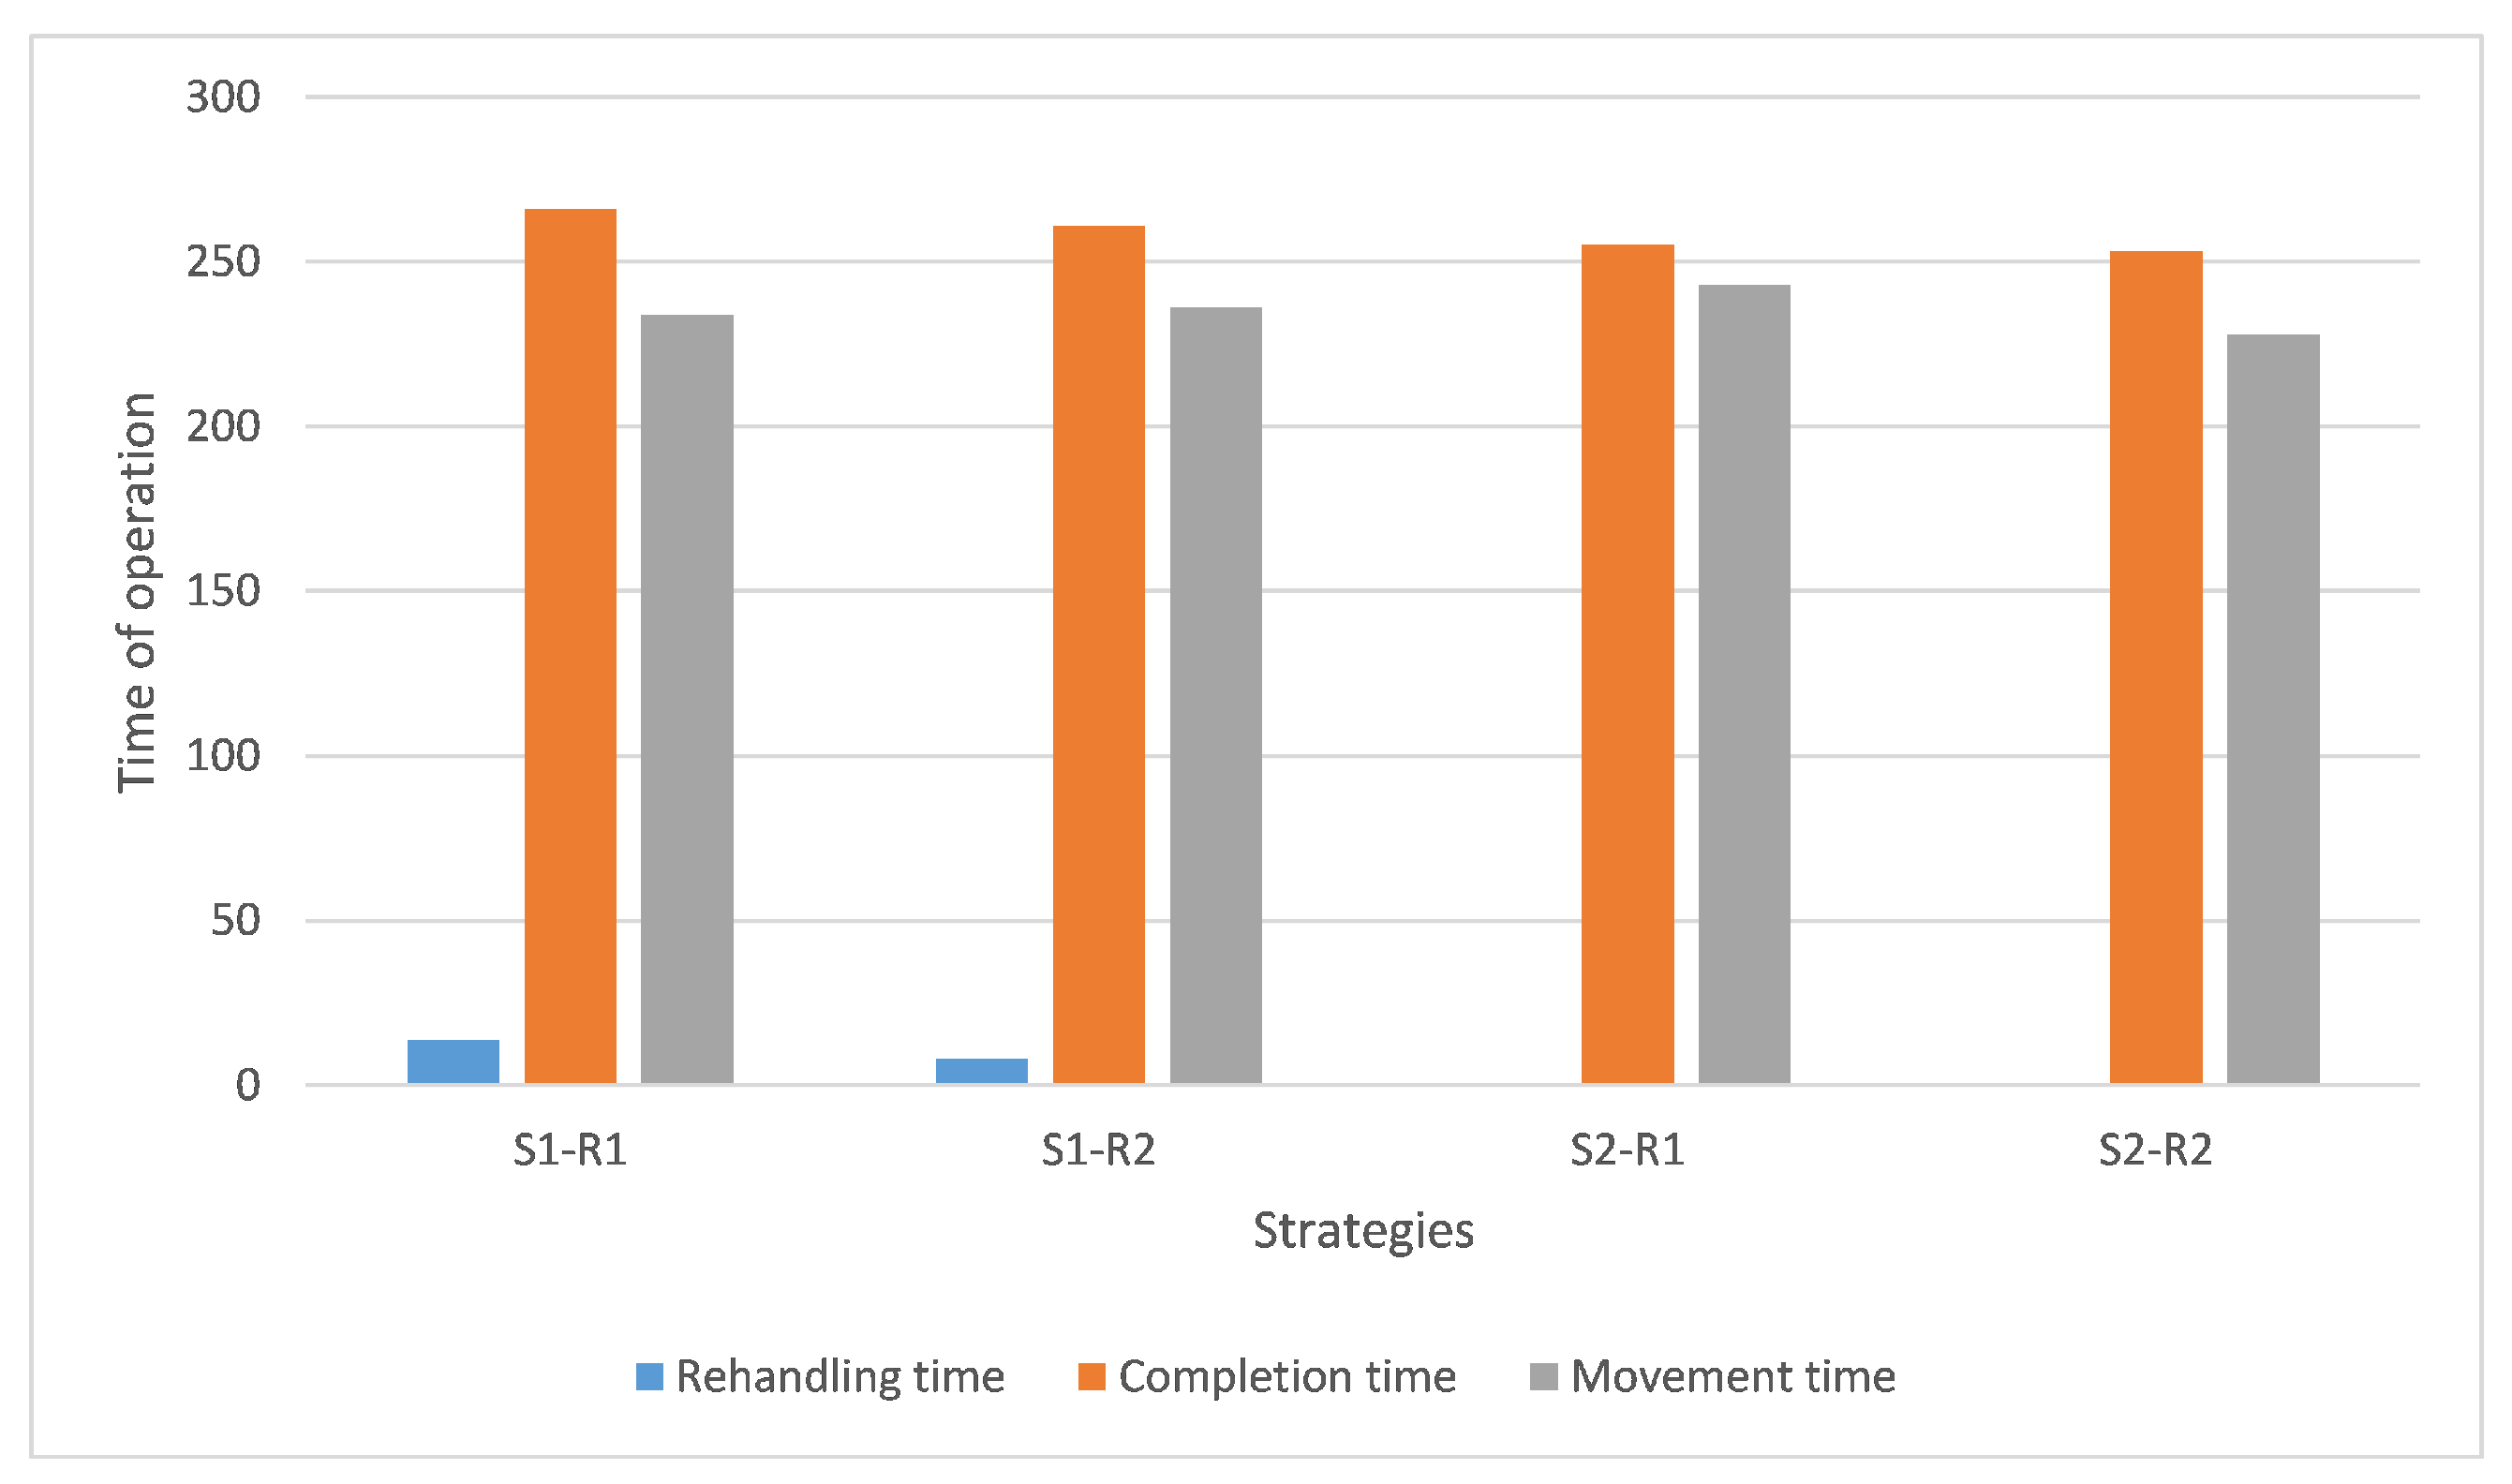
4.2.1. Different Strategies for Double-Bay

In Table 5, max, min, and avg represent the maximum, minimum, and average values of the objective function over 20 consecutive experiments (in minutes), respectively, and gap represents the difference between the results obtained using the four different strategies. The berthing time results for the four different strategy rules are 1129.5 min, 1164.5 min, 1210 min, and 1122 min, respectively.
Figure 11 shows the bar chart of the number of rehandling containers, the time difference between the completion of all QCs along the full route, and the total QC movement times, which are three evaluation indicators produced by the double-bay stowage strategies. The number of rehandling containers represents the number of containers that obstruct the loading or unloading of containers by QCs along the full route. The results show that rehandling containers still occur when using strategy S1 for stowage, and the occurrence of rehandling containers and QC movement increases the completion time of QCs, which in turn increases the berthing time of the ship. Among these, the results obtained using Strategy S2 combined with rule R2 were better and had certain advantages in improving QC efficiency, with less QC movement, 0 rehandling containers, and a more balanced QC workload.
By comparing strategies S1 and S2, it was found that strategy S1 has an advantage in berth planning when the number of containers is high; that is, the overall occupancy rate of container berths is low, as shown in Figure 12. However, the results generated by strategy S1 show that a single destination port container occupies more bays, which increases the unloading time of the QC.

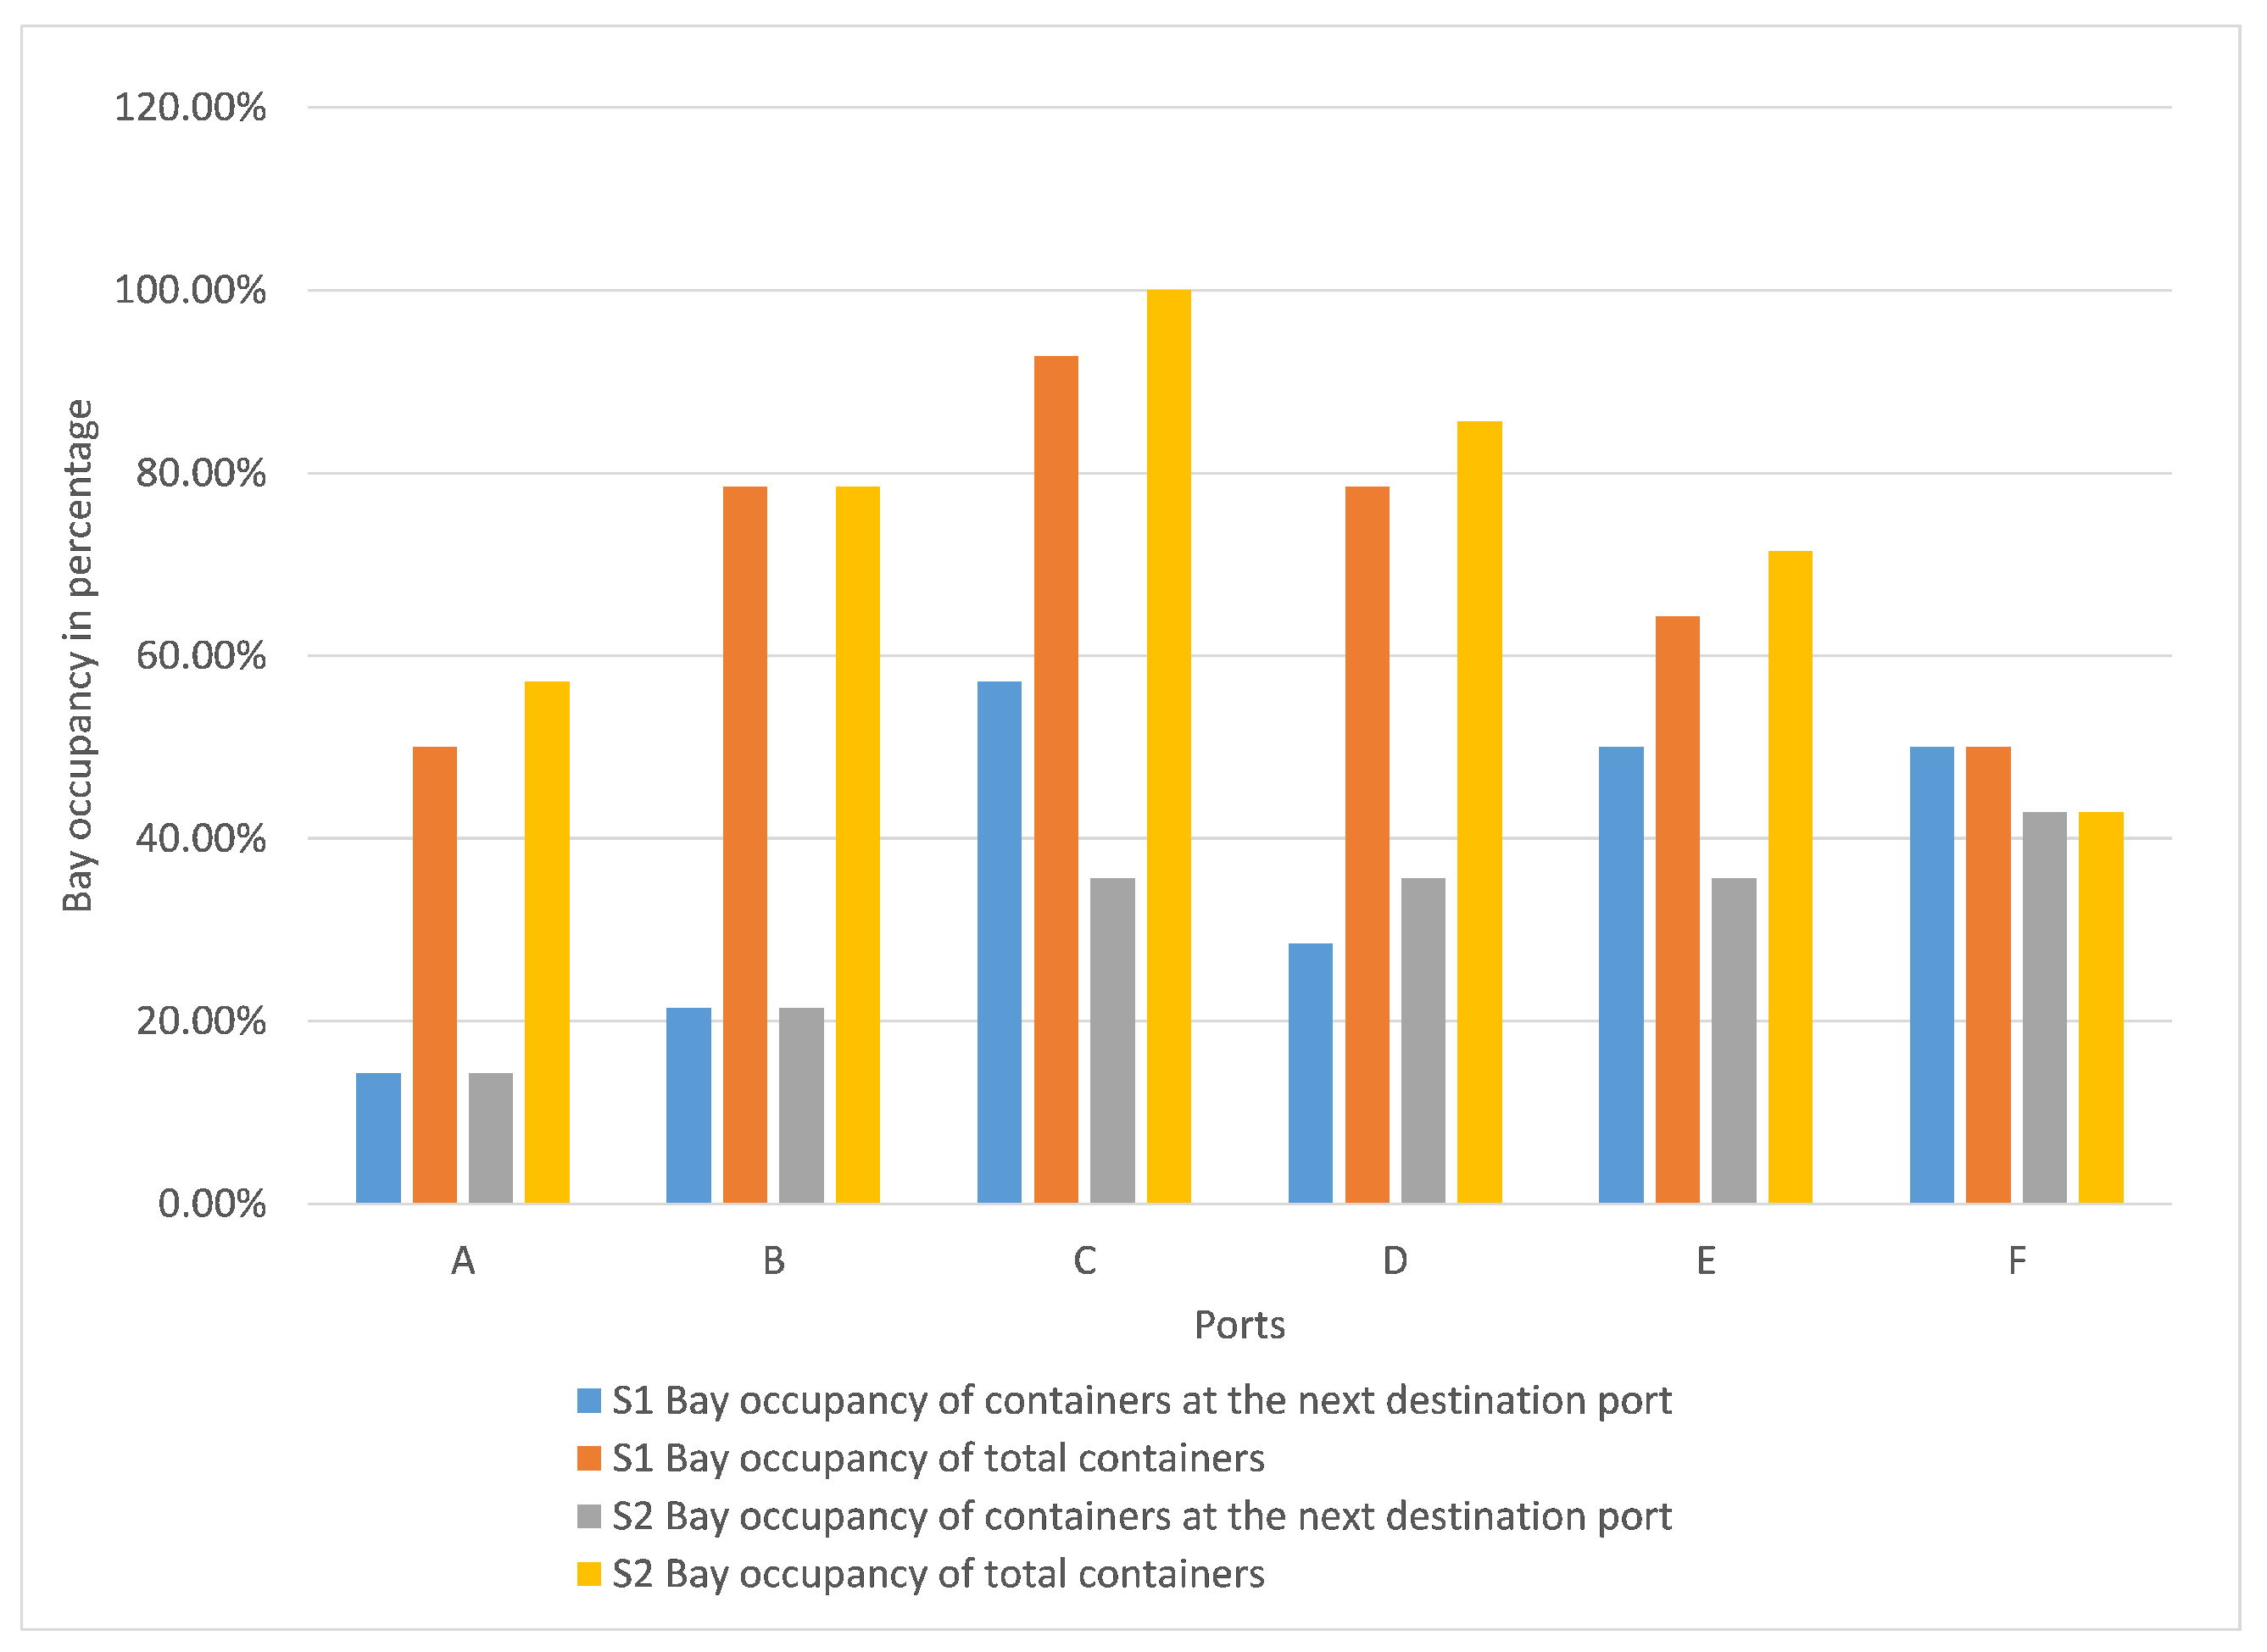
4.2.2. Stowage of the Double-Bay and Single Bay

To demonstrate the performance of the proposed algorithm, a comparative experiment between the S2-R2 method and the traditional single-bay method was conducted using all of the data from the previous section. The productivity of all the port cranes was assumed to be the same. Table 6 and Table 7 present the results of the double-bay S2-R2 rule and the traditional single-bay loading. In the double-bay loading results, the crane movement time accounted for 13.67% of the total berthing time, indicating that crane movement has a certain impact on the berthing time. Table 8 shows that compared with traditional 40-foot crane operations and single-bay loading, using twin 40-foot QCs for double-bay loading of containers improves the efficiency by approximately 58.89%, effectively enhancing the port’s operational efficiency.
In traditional master bay stowage, container loading is mainly based on single-bay allocation, which increases the scattering of containers with the same destination port. When the QC performs loading and unloading operations, the twin 40-foot QCs cannot handle adjacent bays with containers for different destination ports, resulting in low utilization of the twin 40-foot QCs and a significant increase in vessel berthing time. However, the double-bay stowage rule in this paper partially compensates for the shortcomings of single-bay stowage. In double-bay stowage, 20-foot containers are paired and allocated to two adjacent single bays to form a double-bay. This is beneficial for ensuring the working conditions of the twin 40-foot QCs, fully exploiting their working efficiency. Compared to single 40-foot QCs and single-bay stowage, double-bay stowage reduces berthing time by 50.34% to 66.79% at various ports.
Figure 13 and Figure 14 show the variation of QC movement times when strategy S2 uses PSO to optimize the bay position. Figure 13 shows the results of double-bay position allocation and Figure 14 shows the results of single-bay position allocation. The effectiveness of the PSO in the bay position allocation is demonstrated. In the figure, after 100 iterations, the result of the total movement time of the QC tends to a fixed value, which proves that the method in this paper has convergence and conforms to the convergence law of the PSO, and the new bay position ranking is obtained for both single-bay and double-bay placements, respectively. By reducing the movement time of the QC, the berthing time of the ship in the port is further reduced and the terminal operation efficiency is improved. In the case of this paper, the total movement time of the twin 40-foot QCs in the double-bay algorithm is 156 min, and the total movement time in the single-bay algorithm is 136 min.
However, there are also some issues in the process of double-bay allocation. From the above, it is clear that the time for the QC to move in the double-bay algorithm is greater than that in the single-bay algorithm for the same stowage requirements. This is because, when the number of containers is small, using the double-bay concept, a container will occupy two single bays, which will increase the occupancy rate of the bays. As shown in Table 9, after double-bay allocation, containers occupy more bays. Starting from Port C, double-bay allocation occupies 1–3 more single bays than single-bay allocation.
In addition to the aforementioned experiments, this paper increased the number of QCs for traditional single-bay stowage to four, denoted as S-1. The new objective value was obtained and compared again with double-bay stowage based on two twin 40-foot QCs, as shown in Table 10. It can be seen from the table that the efficiency of traditional single-bay stowage significantly improved by increasing the number of QCs. However, double-bay stowage still improved the operational efficiency by at least 20.3%.

5. Conclusions

Based on the operational requirements of twin 40-foot QCs, a double-bay stowage model was established; various master bay strategies were proposed for the first time. In this paper, we studied the effect of QC movement on total berthing time and designed a new encoding method of PSO to optimize the double-bay position. Firstly, we analyzed the operating environment and requirements of twin 40-foot QCs and explored the impact of different containers and cranes on berthing time. Secondly, based on the twin 40-foot QCs operation, we established a mixed integer planning model for multi-port double-bay stowage of ships with the objective of minimizing the number of container rehandling on the route and the time required to move the twin 40-foot QC operation. Finally, we proposed the optimal allocation decision of the double-bay position, designed various new double-bay allocation strategies, and used PSO with a novel encoding mode to optimize the double-bay position where the container group is located to reduce the number of QC movements and distances and minimize the ship berthing time. This improves the loading and unloading efficiency of QC and reduces berthing time. Additionally, we compared the effect of different stowage strategies on ship berthing time by example to verify the effectiveness of the strategies.
The results show that the proposed model and algorithm can provide effective solutions for practical cases. Compared with different stowage strategies, S1-R1 showed better stowage results, respectively, 0.66%, 3.65%, and 7.27% ahead of the other three strategies. When the number of QCs is the same, the difference between double-bay with twin 40-foot QCs and single-bay is 58.89%. This paper has the following main conclusions: (1) The loading scheme solved by the loading model and algorithm can meet the requirement of equipping twin 40-foot QCs. Equipping twin 40-foot QCs for loading and unloading can improve the working efficiency of QCs by at least 20.3% compared to that of ordinary QCs under the same conditions. (2) Optimizing the position of double-bays can further reduce berthing time by reducing the movement time of QCs. (3) When the number of QCs is sufficient, the efficiency of traditional single-bay loading is significantly improved.
In future research, we will consider more strategies in heuristics to provide greater flexibility for improving vessel stability. Additionally, this study only considers the master bay stowage of single structure vessels, while in practice, large container ships have multiple structures and transport requirements for special containers, such as refrigerated, dangerous goods, and out-of-gauge containers. Multiple factors can make the method more suitable for actual shipping requirements. The stowage planning problem addressed in this study will be extended by considering uncertain factors (such as container weight) to more closely reflect actual transport scenarios. Moreover, further research is needed on the specific container stowage and container loading and unloading sequences in combination with yard operations.

Author Contributions

Conceptualization, Y.Y., X.Z., and H.Y.; methodology, H.Y.; software, H.Y.; validation, H.Y.; formal analysis, Y.Y. and X.Z.; investigation, H.Y.; resources, H.Y.; data curation, H.Y.; writing—original draft preparation, H.Y.; writing—review and editing, Y.Y., X.Z., and H.Y.; supervision, Y.Y. and X.Z.; project administration, Y.Y., X.Z. All authors have read and agreed to the published version of the manuscript.

Funding

Project supported by Shanghai Science and Technology Commission Program (No. 23010502100).

Informed Consent Statement

Informed consent was obtained from all subjects involved in the study.

Data Availability Statement

No new data were created or analyzed in this study. Data sharing is not applicable to this article.

Conflicts of Interest

The authors declare no conflict of interest.

References

  1. Le, P.T.W.; Kwon, O.K.; Ruan, X. Sustainability Challenges in Maritime Transport and Logistics Industry and Its Way Ahead. Sustainability 2019, 11, 1331. [Google Scholar] [CrossRef] [Green Version]
  2. Kim, S.; Kim, C. Analysis of the Impact of COVID-19 on Port Operation. J. Korean Navig. Port Res. 2021, 45, 155–164. [Google Scholar]
  3. Sung, L.J.; Hun, P.S. Study on the Recent Global Shipping Environment Change and Domestic Countermeasure. J. Marit. Bus. 2021, 49, 99–122. [Google Scholar]
  4. Tai, Z.; Guo, J.; Guan, Y.; Shi, Q. Impact of COVID-19 on Port Production and Operation Based on System Dynamics: A Case Study of Shanghai Port in China. J. Adv. Transp. 2021, 2021, 9689391. [Google Scholar] [CrossRef]
  5. Beskovnik, B.; Zanne, M.; Golnar, M. Dynamic Changes in Port Logistics Caused by the COVID-19 Pandemic. J. Mar. Sci. Eng. 2022, 10, 1473. [Google Scholar] [CrossRef]
  6. Caballini, C.; Ghiara, H.; Persico, L. Analysis of the impacts of COVID-19 on selected categories of goods passing through the ports of Genoa and Savona, Italy. Case Stud. Transp. Policy 2022, 10, 851–869. [Google Scholar] [CrossRef] [PubMed]
  7. Jin, L.; Chen, J.; Chen, Z.; Yu, B. Impact of COVID-19 on China’s international liner shipping network based on AIS data. Transp. Policy 2022, 121, 90–99. [Google Scholar] [CrossRef]
  8. Kim, B.; Kim, G.; Kang, M. Study on Comparing the Performance of Fully Automated Container Terminals during the COVID-19 Pandemic. Sustainability 2022, 14, 9415. [Google Scholar] [CrossRef]
  9. Yap, W.Y.; Yang, D. Hub port choice and shipping connectivity in Southeast Asia during COVID-19 pandemic: Implications for post-pandemic competition landscape. Marit. Policy Manag. 2022. [Google Scholar] [CrossRef]
  10. Bandyopadhyay, A.; Bhatnagar, S. Impact of COVID-19 on ports, multimodal logistics and transport sector in India: Responses and policy imperatives. Transp. Policy 2023, 130, 15–25. [Google Scholar] [CrossRef]
  11. Medda, F.; Liu, Q. Determinants and strategies for the development of container terminals. J. Product. Anal. 2013, 40, 83–98. [Google Scholar] [CrossRef]
  12. Chang, Y.M.; Hamedi, M.; Haghani, A. Solving integrated problem of stowage planning with crane split by an improved genetic algorithm based on novel encoding mode. Meas. Control 2023, 56, 172–191. [Google Scholar] [CrossRef]
  13. Chen, J.H. A note on: A flexible crane scheduling methodology for container terminals. Flex. Serv. Manuf. J. 2019, 31, 34–40. [Google Scholar] [CrossRef]
  14. Iris, C.; Pacino, D. A Survey on the Ship Loading Problem; Springer International Publishing: New York, NY, USA, 2015; pp. 238–251. [Google Scholar]
  15. Wilson, I.D.; Roach, P.A. Container stowage planning: A methodology for generating computerised solutions. J. Oper. Res. Soc. 2000, 51, 1248–1255. [Google Scholar] [CrossRef]
  16. Pacino, D.; Delgado, A.; Jensen, R.M. Fast generation of near-optimal plans for eco-efficient stowage of large container vessels. In Proceedings of the 2nd International Conference on Computational Logistics, Hamburg, Germany, 19–22 September 2011. [Google Scholar]
  17. Ambrosino, D.; Sciomachen, A.; Tanfani, E. Stowing a containership: The master bay plan problem. Transp. Res. Part Policy Pract. 2004, 38, 81–99. [Google Scholar] [CrossRef]
  18. Ambrosino, D.; Sciomachen, A.; Tanfani, E. A decomposition heuristics for the container ship stowage problem. J. Heuristics 2006, 12, 211–233. [Google Scholar] [CrossRef]
  19. Ambrosino, D.; Paolucci, M.; Sciomachen, A. Experimental evaluation of mixed integer programming models for the multi-port master bay plan problem. Flex. Serv. Manuf. J. 2015, 27, 263–284. [Google Scholar] [CrossRef]
  20. Ting, S.C.; Tzeng, G.H. Bi-criteria approach to container ship slot allocation in liner shipping. Marit. Econ. Logist. 2016, 18, 141–157. [Google Scholar] [CrossRef]
  21. Bilican, M.S.; Evren, R.; Karatas, D.M. A Mathematical Model and Two-Stage Heuristic for the Container Stowage Planning Problem With Stability Parameters. IEEE Access 2020, 8, 113392–113413. [Google Scholar] [CrossRef]
  22. Li, J.; Zhang, Y.; Ji, S.; Zheng, L.; Xu, J. Multi-stage hierarchical decomposition approach for stowage planning problem in inland container liner shipping. J. Oper. Res. Soc. 2020, 71, 381–399. [Google Scholar] [CrossRef]
  23. Ambrosino, D.; Sciomachen, A. A shipping line stowage-planning procedure in the presence of hazardous containers. Marit. Econ. Logist. 2021, 23, 49–70. [Google Scholar] [CrossRef]
  24. Iris, Ç.; Pacino, D.; Ropke, S.; Larsen, A. Integrated Berth Allocation and Quay Crane Assignment Problem: Set partitioning models and computational results. Transp. Res. Part Logist. Transp. Rev. 2015, 81, 75–97. [Google Scholar] [CrossRef] [Green Version]
  25. Iris, Ç.; Lam, J.S.L. Recoverable robustness in weekly berth and quay crane planning. Transp. Res. Part Methodol. 2019, 122, 365–389. [Google Scholar] [CrossRef]
  26. Wilson, I.D.; Roach, P.A.; Ware, J.A. Container stowage pre-planning: Using search to generate solutions, a case study. Knowl. Based Syst. 2001, 14, 137–145. [Google Scholar] [CrossRef]
  27. Sciomachen, A.; Tanfani, E. A 3D-BPP approach for optimising stowage plans and terminal productivity. Eur. J. Oper. Res. 2007, 183, 1433–1446. [Google Scholar] [CrossRef]
  28. Lee, D.H.; Wang, H.Q.; Miao, L.X. Quay crane scheduling with handling priority in port container terminals. Eng. Optim. 2008, 40, 179–189. [Google Scholar] [CrossRef]
  29. Shen, Y.F.; Zhao, N.; Mi, W.J. Group-Bay Stowage Planning Problem for Container Ship. Pol. Marit. Res. 2016, 23, 152–159. [Google Scholar]
  30. Iris, Ç.; Christensen, J.; Pacino, D.; Ropke, S. Flexible ship loading problem with transfer vehicle assignment and scheduling. Transp. Res. Part Methodol. 2018, 111, 113–134. [Google Scholar] [CrossRef] [Green Version]
  31. Pacino, D. Crane Intensity and Block Stowage Strategies in Stowage Planning; Springer International Publishing: New York, NY, USA, 2018; pp. 191–206. [Google Scholar]
  32. Azevedo, A.T.; Neto, L.L.D.; Chaves, A.A.; Moretti, A.C. Solving the 3D stowage planning problem integrated with the quay crane scheduling problem by representation by rules and genetic algorithm. Appl. Soft Comput. 2018, 65, 495–516. [Google Scholar] [CrossRef]
  33. Steenken, D.; Voss, S.; Stahlbock, R. Container terminal operation and operations research—A classification and literature review. OR Spectr. 2004, 26, 3–49. [Google Scholar]
  34. Wang, S.A. Essential elements in tactical planning models for container liner shipping. Transp. Res. Part Methodol. 2013, 54, 84–99. [Google Scholar] [CrossRef] [Green Version]
  35. Jingjing, Y.; Guolei, T.; Da, L. Optimal Number of Quay Cranes in Container Terminals with Twin-40-Feet Quay Cranes. In Proceedings of the 10th International Conference on Computer Modeling and Simulation, Sydney, Australia, 8–10 January 2018. [Google Scholar]
  36. Fan, H.Y. A modification to particle swarm optimization algorithm. Eng. Comput. 2002, 19, 970–989. [Google Scholar] [CrossRef]
  37. Mahfouf, M.; Chen, M.Y.; Linkens, D.A. Adaptive weighted particle swarm optimisation for multi-objective optimal design of alloy steels. In Proceedings of the Parallel Problem Solving from Nature-PPSN VIII: 8th International Conference, Birmingham, UK, 18–22 September 2004; pp. 762–771. [Google Scholar]
Figure 1. Schematic diagram of the container ship.
Jmse 11 00807 g001
Figure 2. Operation of twin 40-foot QCs with the same tier.
Jmse 11 00807 g002
Figure 3. Operation of twin 40-foot QCs with different tiers.
Jmse 11 00807 g003
Figure 4. Diagram of rehandling.
Jmse 11 00807 g004
Figure 5. Stowage results in port 1 with rule R1.
Jmse 11 00807 g005
Figure 6. Stowage results in port 2 with rule R1.
Jmse 11 00807 g006
Figure 7. Stowage results in port 1 with rule R2.
Jmse 11 00807 g007
Figure 8. Stowage results in port 2 with rule R2.
Jmse 11 00807 g008
Figure 9. Method 1.
Figure 9. Method 1.
Jmse 11 00807 g009
Figure 10. Method 1.
Jmse 11 00807 g010
Figure 11. Evaluation index of MP-MBPP.
Jmse 11 00807 g011
Figure 12. Occupancy in bays of strategy S1/S2.
Jmse 11 00807 g012
Figure 13. The convergence graph of double-bay.
Jmse 11 00807 g013
Figure 14. The convergence graph of the single bay.
Jmse 11 00807 g014
Table 1. Bay priority assignment.
The number of Double-Bay020610141822263034
The priority of Bay3.43−2.510.331.379.78−5.328.676.65−7.34
Table 2. Bay position sorting.
The number of Double-Bay182630021410062234
The priority of Bay9.788.676.653.431.370.33−2.51−5.32−7.34
Table 3. Number of 20-foot export containers in each port (unit: TEU).
Cargo Volume (20ft)Destination Ports
BCDEFGTotal
Starting PortsA214303210981392441208
B-58291125126210810
C--4829033080749
D---205234106
E----1200120
F-----165165
Table 4. Number of 40-foot export containers in each port (unit: FEU).
Cargo Volume (40ft)Destination Ports
BCDEFGTotal
Starting PortsA13110061545
B-1016180044
C--46201040
D---040040
E----81018
F-----88
Table 5. Results of different stowage strategies.
StrategiesS1-R1S1-R2S2-R1S2-R2
Max/min1131119512141145
Min/min1128113412061119
Avg/min1129.51164.512101122
Gap/%3.1%7.13%−0.66%
Table 6. Results of the double-bay rule allocation.
QCMovement Time
/min
Loading/Unloading Time
/min
Completion Time
/min
Berthing Time
/min
Port A116130146
224195219219
Port B120101121
216185201201
Port C112152164
224156180180
Port D108787
232108140140
Port E1899107
248791107
Port F120140160
28136144160
Port G132102134
212103115134
Table 7. Results of the single-bay rule allocation.
QCMovement Time
/min
Loading/Unloading Time
/min
Completion Time
/min
Berthing Time
/min
Port A118408426
222419441441
Port B126462488
220287307488
Port C132510542
210341351542
Port D116268284
226172198284
Port E120254274
220294314314
Port F114336350
210392402402
Port G16230236
210294304304
Table 8. Comparison of the berthing times between the single bay and double-bay.
PortsABCDEFGTotal
Single bay/min4414885422843144023042775
Double-bay/min2192011801401071601341141
Difference ratio/%50.3458.8166.7950.765.9260.255.9258.89
Table 9. Comparison of bay occupancy.
PortsABCDEF
Single Bay19/2824/2827/2822/2818/289/28
Double-bay16/2822/2428/2824/2820/2812/28
Table 10. Results after increasing the number of QCs.
StrategiesS-1S1-R1S1-R2S2-R1S2-R2
Max/min15321131119512141145
Min/min15061128113412061119
Avg/min15191129.51164.512101122
Gap/%-−25.6%−23.33%−20.3%−26.13%
Disclaimer/Publisher’s Note: The statements, opinions and data contained in all publications are solely those of the individual author(s) and contributor(s) and not of MDPI and/or the editor(s). MDPI and/or the editor(s) disclaim responsibility for any injury to people or property resulting from any ideas, methods, instructions or products referred to in the content.

