Article

Autonomous Vehicle-Loading System Simulation and Cost Model Analysis of Roll-On, Roll-Off Port Operations

1
Department of Logistics, Korea Maritime and Ocean University, Busan 49112, Republic of Korea
2
KMI-KMOU Cooperative Program, Korea Maritime and Ocean University, Busan 49112, Republic of Korea
*
Author to whom correspondence should be addressed.
J. Mar. Sci. Eng. 2023, 11(8), 1507; https://doi.org/10.3390/jmse11081507
Submission received: 6 July 2023 / Revised: 26 July 2023 / Accepted: 28 July 2023 / Published: 29 July 2023
(This article belongs to the Special Issue Recent Scientific Developments in Port Logistics)

Abstract

:
The gradual commercialization of entirely autonomous vehicles is expected to bring numerous benefits, such as structural transformation in the industry. Specifically, in maritime transportation, automobile terminals that import and export finished autos are seen to transform their current loading system into a CAV (connected automated vehicle)-loading system to accommodate autonomous vehicles. In this study, the impact of introducing a CAV-loading system to a roll-on, roll-off (RORO) ports was investigated. Simulation models were developed to test the performance of the terminal with the CAV-loading system. Then, a cost model was developed to determine the economic benefits of the CAV-loading system. The results in this study revealed that operating costs were reduced by 90%, while terminal operations were significantly improved. In addition, the study revealed that using the CAV-loading system resulted in a 12% reduction in CO2 emissions compared to that using the current loading system. The originality of this study lies in its transformative potential for an industry that heavily relies on human labor and has limited mechanization and automation. This study provides significant implications for incorporating autonomous vehicles in planned automobile terminal operations.

1. Introduction

The speed of industrial transformation in the fourth industrial revolution cannot be ignored [1]. In particular, autonomous vehicles are receiving global attention, and their commercialization is accelerating [2]. International companies are rushing to commercialize Level 4 fully automated driving [3].
Introducing autonomous vehicles will bring many benefits by enabling productive activity on the road, including work, meetings, and leisure [4]. Additionally, traffic accidents caused by human error will be reduced [5]. With the commercialization of autonomous vehicles, the structural transformation of the industry site is deemed inevitable [6]. Specifically, automobile terminals where finished vehicles are imported and exported are likely to use autonomous vehicles during port operations, which is expected to yield many benefits [7].
Meanwhile, 79 million cars are produced yearly, and the global seaborne car trade is becoming more significant [8]. The loading system at the automobile terminal is operated by drivers who move vehicles one by one [9]. Therefore, the loading and unloading process heavily depends on human labor, making it difficult to improve working conditions through mechanization and automation [10]. As a result, its development for automation and mechanization lags behind other terminals, including bulk and container [11].
Many autonomous vehicle companies attempt to develop cars that drive to the vessel and find parking slots [12]. The technologies of autonomous vehicles with which they communicate with one another and with traffic signals, signs, and infrastructure are a fundamental feature of their operation. Therefore, all vehicles in the port can become a CAV that uses any of a number of different communication technologies to communicate with the objects and form a platoon. In other words, an automated loading system can be implemented within roll-on, roll-off (RORO) ports if an infrastructure that supports autonomous vehicles between the terminal and the ship is developed.
Introducing an automated loading system can bring many changes to the current loading system [13]. Reducing the number of operational stages during the loading process at the terminal is one of the significant adjustments that will increase port productivity and efficiency. Specifically, the driver’s return process during the current loading system can be removed as autonomous vehicles can assume the driver’s role [7,14]. Increased terminal productivity will then yield significant benefits, including reduced operating costs and fewer emissions [15]. Therefore, in this study, we introduce the connected automated vehicle (CAV)-loading system to prepare for the upcoming transformation and recommend ways to improve port operations. The aim of this study is to find the increased efficiency, reduced costs, and environmental benefits of the CAV-loading system. Several simulation models were developed to estimate the effect of the CAV-loading system. Then, we applied the cost model developed in the previous study to analyze the economic benefits of the CAV-loading system compared to those of the current loading system. The motivation and originality of this study lie in its transformative potential. The reliance on human labor in the current loading systems limits mechanization and automation. Introducing CAVs revolutionizes the process by automating vehicle movement, optimizing operations, and enhancing productivity. This aligns with the ongoing industrial revolution and the commercialization of autonomous vehicles in the maritime industry. Economically, CAV implementation leads to substantial cost savings, improved profitability, and better resource utilization. Ultimately, this research shapes the future of maritime transportation, fostering efficiency, sustainability, and competitiveness in port operations. The remainder of the paper is structured as follows: Section 2 reviews autonomous vehicles in the port and previous studies on the RORO terminal. We investigated port performance using a series of simulations in Section 3. Section 4 presents the simulation results and the cost model analysis for the overall benefits. Section 5 summarizes the study.

2. Literature Review

2.1. Autonomous Vehicles in the Port

The Fourth Industrial Revolution (Industry 4.0) has led to fast-paced technological advancements, which are placing a pressure on seaports to change the way they operate to manage traffic flows effectively. As a result, there is a growing need to develop an automated port system. Min [16] discussed the transition from conventional port planning to smart port planning in the digital age and Industry 4.0. The author highlighted the advantages of smart port planning, including improved customer response time, increased efficiency, and enhanced collaboration among stakeholders. Specifically, the paper emphasized the significance of autonomous vehicles in optimizing traffic flow and ensuring safety within a smart port environment. While the paper establishes foundational frameworks and protocols for smart port planning, it falls short in providing a practical example illustrating the potential benefits of implementing smart technology in ports. Therefore, as mentioned by the author, it is important for future research to assess the impact of port automation on productivity and performance. Malmborg [17] developed analytical conceptualizing tools to estimate system performance and cost drivers for AVSR systems. These tools provide insights into system performance, cost drivers, and comparisons with traditional AS/RS systems. Analytical conceptualizing tools can be applied to various automated systems. The utilization of analytical conceptualizing tools has the potential to be extended to port systems providing valuable insights into automation and decision-making in that domain.
Gharehgozli et al. [18] discussed the potential of innovative layout designs for next-generation container terminals. The paper indicated that the performance, operational and investment costs, and social and environmental impacts are the crucial factors in selecting suitable layouts. The research identifies key areas of investigation, including optimal configuration, financial feasibility, and the impact of design variables on layout performance. Methodologies including simulation, and queueing network models are suggested for studying various layout designs. Lastly, the paper encourages research efforts to extend beyond container terminals to other types of terminals.
The two papers above discuss the advantages and potential benefits of smart port planning or innovative layout designs, but they provide limited concrete data and case studies. Moreover, as they indicate, it is necessary to broaden the scope of case studies beyond container terminals to examine their applicability and potential benefits in other aspects of port operations, such as productivity and performance. This can be achieved by employing simulation models, which would provide a means to explore different scenarios and evaluate their effects on various areas of port operations.
Wang et al. [19] investigated the alignment between strategic content and process structure in container terminals. They developed a typology that connects strategic positioning with the level of automation and highlights the significance of flexibility in port operations. The findings suggest that proper alignment enhances cost leadership and emphasizes the need to consider market dynamics and projected benefits before implementing service process automation. They also highlighted that, while automation may lead to lower overall costs, it is important to acknowledge that it can be an expensive investment, with the upfront costs only fully realized in the long term.
The studies above provide a comprehensive overview of terminal automation, yet they offer limited specific technology recommendations for implementation and provide less detailed information about cost implications. Therefore, we investigate a more industry-specific analysis that considers the potential benefits of autonomous vehicles including cost-effectiveness, efficiency, and environmental impact with the simulation approach. There are a number of papers that studied using autonomous vehicles in ports. The Society of Automotive Engineers (SAE) defines six levels of autonomous vehicles, ranging from Level 0 to level 5. Level 0 is a non-automated stage in which the driver controls everything, whereas Level 5 is an entirely autonomous stage in which the system drives under all conditions. Level 4, a higher automation level, is expected to be launched after 2030. With the increasing levels of automation in vehicles, various technologies are being developed to enhance the driving experience. For example, Zhu et al. [20] discussed the design and experimental testing of an automotive glazing projection system. This system provides drivers with valuable information under different driving contexts and examines the impact of display areas on driver gaze behavior and information processing. The research and development of autonomous vehicles are progressing, and intelligent vehicles are expected to bring numerous advantages to our everyday lives. One of them is reducing the driver’s role. For example, Kavakeb et al. [21] used FlexSim Simulation to study the impact of deploying intelligent autonomous vehicles (IAVs) in European container terminals. IAVs are autonomous, unmanned transport vehicles that can replace truck drivers. The impact of IAVs was quantified by comparing the operating speed of the truck driver with the operating speed of the IAVs based on the number of times per hour the dock crane moved. The simulation results showed that productivity significantly increases when IAVs and cassettes are used together. In addition, the cost model showed that the economic value of the IAV’s loading system was significantly higher than that of the current loading system.
Bahnes et al. [22] discussed the potential benefits of using intelligent autonomous vehicles (IAVs) in container terminal operations and proposed a cooperative strategy to enhance their performance. The performance of the cooperation system was evaluated through simulation scenarios, and the results show that the implemented cooperation mechanism can significantly improve the handling time of container charging/discharging operations in the terminal. Overall, the proposed system can improve the efficiency and cost-effectiveness of indoor traffic in container terminals. Bae et al. [23] suggested an automated lifting vehicle (ALV)-operating system that connects the operation with other equipment while minimizing the mileage in the container terminal. To improve the efficiency of the ALV-operating system, a new rule suitable for the ALV system was proposed. The simulation with various scenarios showed that when the number of ALVs was increased, terminal productivity increased, but the average driving time of ALVs increased due to congestion, resulting in a decrease in operating efficiency. In other words, when attempting automation using new technology-based transport equipment, it was shown that the bottleneck section should be operated in an appropriate quantity so as not to minimize it.
Since RORO terminals are places where productivity is most affected by human factors, studies have been conducted on the productivity of automobile terminals. As a result, less research has been conducted on their automation compared to that of other terminals, with more research focusing on optimization. The operational stages of the RORO terminal are described in detail by Park et al. [13] and Park et al. [14].
Chen et al. [10] focused on the storage location assignment problem (SLAP) in RORO terminals, aiming to improve ship loading efficiency and efficient storage. The paper proposed a linear 0–1 integer programing model to minimize the dispersion degrees of car groups, representing the centralized layout of cars in the yard. The model considers the loading sequence of cars into a RORO ship and introduces the concept of car groups. The proposed method is evaluated through numerical experiments, demonstrating it can improve car assignment plans for RORO terminal management. The method presented in the paper focuses on leveraging mathematical models and optimization techniques to optimize the utilization of existing resources in RORO terminals.
In other aspects, there have been studies involving empirical and quantitative researches on RORO terminals. They indicated that improving workforce utilization, addressing key determinants of productivity, enhancing worker awareness, improving port facilities and cost reduction are essential for enhancing operational efficiency and the competitiveness of RORO terminals. For example, Seo et al. [9] analyzed the efficiency and productivity of South Korea’s eight largest RORO terminals using data envelopment analysis (DEA). They found that reducing the number of workers had a significant impact on terminal operations, suggesting the need for flexible workforce utilization. Kim et al. [24] studied the automobile loading and unloading system at Pyeongtaek Port, identifying factors such as worker awareness, yard capacity, expertise, and limited working hours as key determinants of terminal productivity. An analysis of variance (ANOVA) was used to compare different groups’ perceptions, revealing issues with worker awareness and background knowledge. Kim [25] assessed the efficiency of Japanese and South Korean automobile terminals using DEA models, while Choi [26] used analytic hierarchy process (AHP) analysis to identify factors for choosing Pyeongtaek Port, highlighting the importance of improving port facilities and reducing costs for enhancing competitiveness. So far, most studies on automobile terminals have focused on the productivity of automobile terminals in terms of human and material factors, such as port sites and port workers, and on recommending policy implications. As a result, there have been few studies to automate the RORO terminal.
In this perspective, the implementation of the CAV-loading system can be considered a potential solution for reducing operating costs and enhancing the quality of port services.

2.2. RORO Terminal Automation

Sun et al. [11] proposed a method for generating safe and efficient semi-automated stowage plans for RORO ships. The proposed method involves a heuristic algorithm for solving the nesting problem, which is a typical optimization problem. The paper also presented a practical method for calculating a ship’s flotation, stability, and strength. Computational tests were carried out on a pure car and truck carrier (PCTC) with a carrying capacity of 3800 R/T to verify the proposed method. The test results showed that the proposed method generated more realistic and efficient stowage plans compared to the traditional manual method. The proposed semi-automated approach to stowage planning for RORO ships reduces the need for manual labor in the planning stage. While Sun et al. [11] and our study attempt to automate RORO terminals’ operations, we have no direct overlap. However, the proposed method in Sun et al. [11] has the potential to be used in conjunction with a CAV-loading system to generate more efficient and optimized stowage plans in the future.
Ahn et al. [27] proposed a method for constructing a cyber-physical system that integrates autonomous vehicles and logistics systems within a port, and demonstrated the implementation of object types and prototype models for this purpose. The paper defined types of interconnect interfaces and objects and demonstrated the feasibility of a prototype that allows for the creation of virtual viewers and SOP objects for Ulsan Port’s car piers and sixth piers. This enables the placement of port structures and other related operations. The object types and prototype models presented in the paper have significant implications. They not only contribute to the construction of intelligent vehicle export and import infrastructure but also to the development of cargo handling scenarios within the port. These models enable the exploration of interconnect scenarios between the port and autonomous vessels, opening up possibilities for enhanced efficiency and coordination in port operations.
Kim et al. [7] designed the export logistic process for Level 4 or 5 fully autonomous vehicles using process mapping. The process mapping analysis identified seven stages where differences occur compared to current logistics processes. According to the analysis, autonomous vehicles can operate independently during production and loading operations, and can navigate through RORO terminals without the assistance of workers. Additionally, these vehicles can be unloaded autonomously upon arrival at the destination port terminal, eliminating the need for additional labor. In conclusion, the authors emphasize that the development and construction of an automated loading/unloading system at RORO ports or terminals is necessary with specific details on how to develop RORO terminals and ship planning systems.
The two papers above explored the feasibility of integrating autonomous vehicles and logistics systems within RORO ports, but still there have been limited discussions on the strategies and use of modeling and analysis approaches to facilitate the implementation of such systems.
Park et al. [13] introduced an automatic guided vehicle to the RORO terminal. Several simulation models were developed based on the current loading system in the car carrier. Additionally, various test scenarios were developed to determine the best automated guided vehicle (AGV) application. The results showed that a system comprising 21 AGVs matched the productivity of the current loading system. Above the maximum number of 40 AGVs, the productivity remained the same while the waiting time within the external ramp increased.
Park et al. [14] investigated the yard size at the RORO terminal and determined the AGV traffic system from the yard. The simulation results showed that the productivity of the current loading system could be matched with 29 AGVs. The result deviated slightly from those of the preliminary study because the previous study did not address the AGV traffic in the yard. Park et al. [13] experimented with the simulation focused on the vessel’s structure considering all AGVs’ movement inside the vessel, so the overall time spent in the yard was less considered.
Only the studies above have proposed automating the operation of the RORO terminal. With the AGV loading system, the loading time was reduced. However, since the maximum speed of AGVs was limited by technology to 10 km per hour, the operational efficiency decreased by a higher amount than that analyzed when AGVs were adopted. However, in the case of autonomous vehicles, the maximum driving speed is the same as that of regular cars, which allows them to go at a far higher speed than AGVs do. In addition, CAVs act as a means of transportation on their own; thus, there is no initial investment in the transport vehicle, such as shuttle vans, and no queues are generated by operating transport vehicles. In other words, the CAV-loading system is more productive and efficient than is the AGV-loading system. Therefore, this study introduces an advanced loading system that uses CAV technology.

2.3. Simulation Approach in RORO Terminals

Simulation has been widely used in many studies to analyze RORO terminals due to their dynamic environment and the presence of various factors that can impact their operations, such as the number of vehicles, loading and unloading times, and traffic flow. Keceli et al. [28] proposed a simulation model for decision support in RORO terminal operations, offering insights into its components and architecture. Iannone et al. [29] developed a flexible simulation model for evaluating the stochastic performances of a RORO terminal’s day-to-day decisions, enabling the assessment of the economic impact of various operation alternatives based on physical and information flows, operation decisions, and cost measures, with a case study on an Italian RORO terminal. Ozkan et al. [30] presented a capacity analysis of RORO terminals through simulation modeling, focusing on key variables such as the number of vehicles, terminal distance, and gates, aiming to provide a theoretical model and analysis for RORO terminal operators and port planners. Then, Muravev et al. [31] compared the scalability of various simulation models and their accuracy in predicting turnover using different simulation programs (Arena and AnyLogic), with a specific focus on RORO terminal operations. This modeling aims to support the selection of a the suitable simulation approach and contribute to the comparison literature. Preston et al. [32] used whole-port discrete-event simulation with Vissim to study the RORO ferry port in the Port of Dover, aiming to manage road traffic effectively and mitigate its impact on the local community, with a focus on a key performance indicator related to traffic queue impacts. Park et al. [13,14] developed a series of simulation models to evaluate the impact of AGVs on the productivity of RORO terminals. The study used Arena software to analyze simulation models of the current loading system and the AGV-loading system under various scenarios. Abourraja et al. [33,34] developed a simulation model to evaluate the handling capacity of a RORO terminal under various flow scenarios, enabling the optimization of operations, identification of bottlenecks, resource planning, and providing a practical ‘playbook’ for operational and strategic decision-making. Belcore et al. [35] developed discrete-event simulation to model the landside operations of a RORO terminal, assessing the impact of managerial decisions on loading, unloading, and storage allocation, and evaluating the economic impact and pollutant emissions of each alternative.
As shown in the above literature, simulation has proven to be a valuable tool in studying and optimizing RORO terminals. Simulation provides a powerful and flexible approach to analyzing RORO terminals, offering valuable insights into their performance, efficiency, and potential for optimization. It supports terminal operators, planners, and researchers in making informed decisions to improve operations and enhance overall terminal productivity. Table 1 displays the main features of the previous studies.
In this study, we advance the simulation models developed in previous studies [13,14] to create a simulation model for the CAV-loading system. The details of the development of the simulation are explained in Section 3.4.2.

3. Simulation Model Development
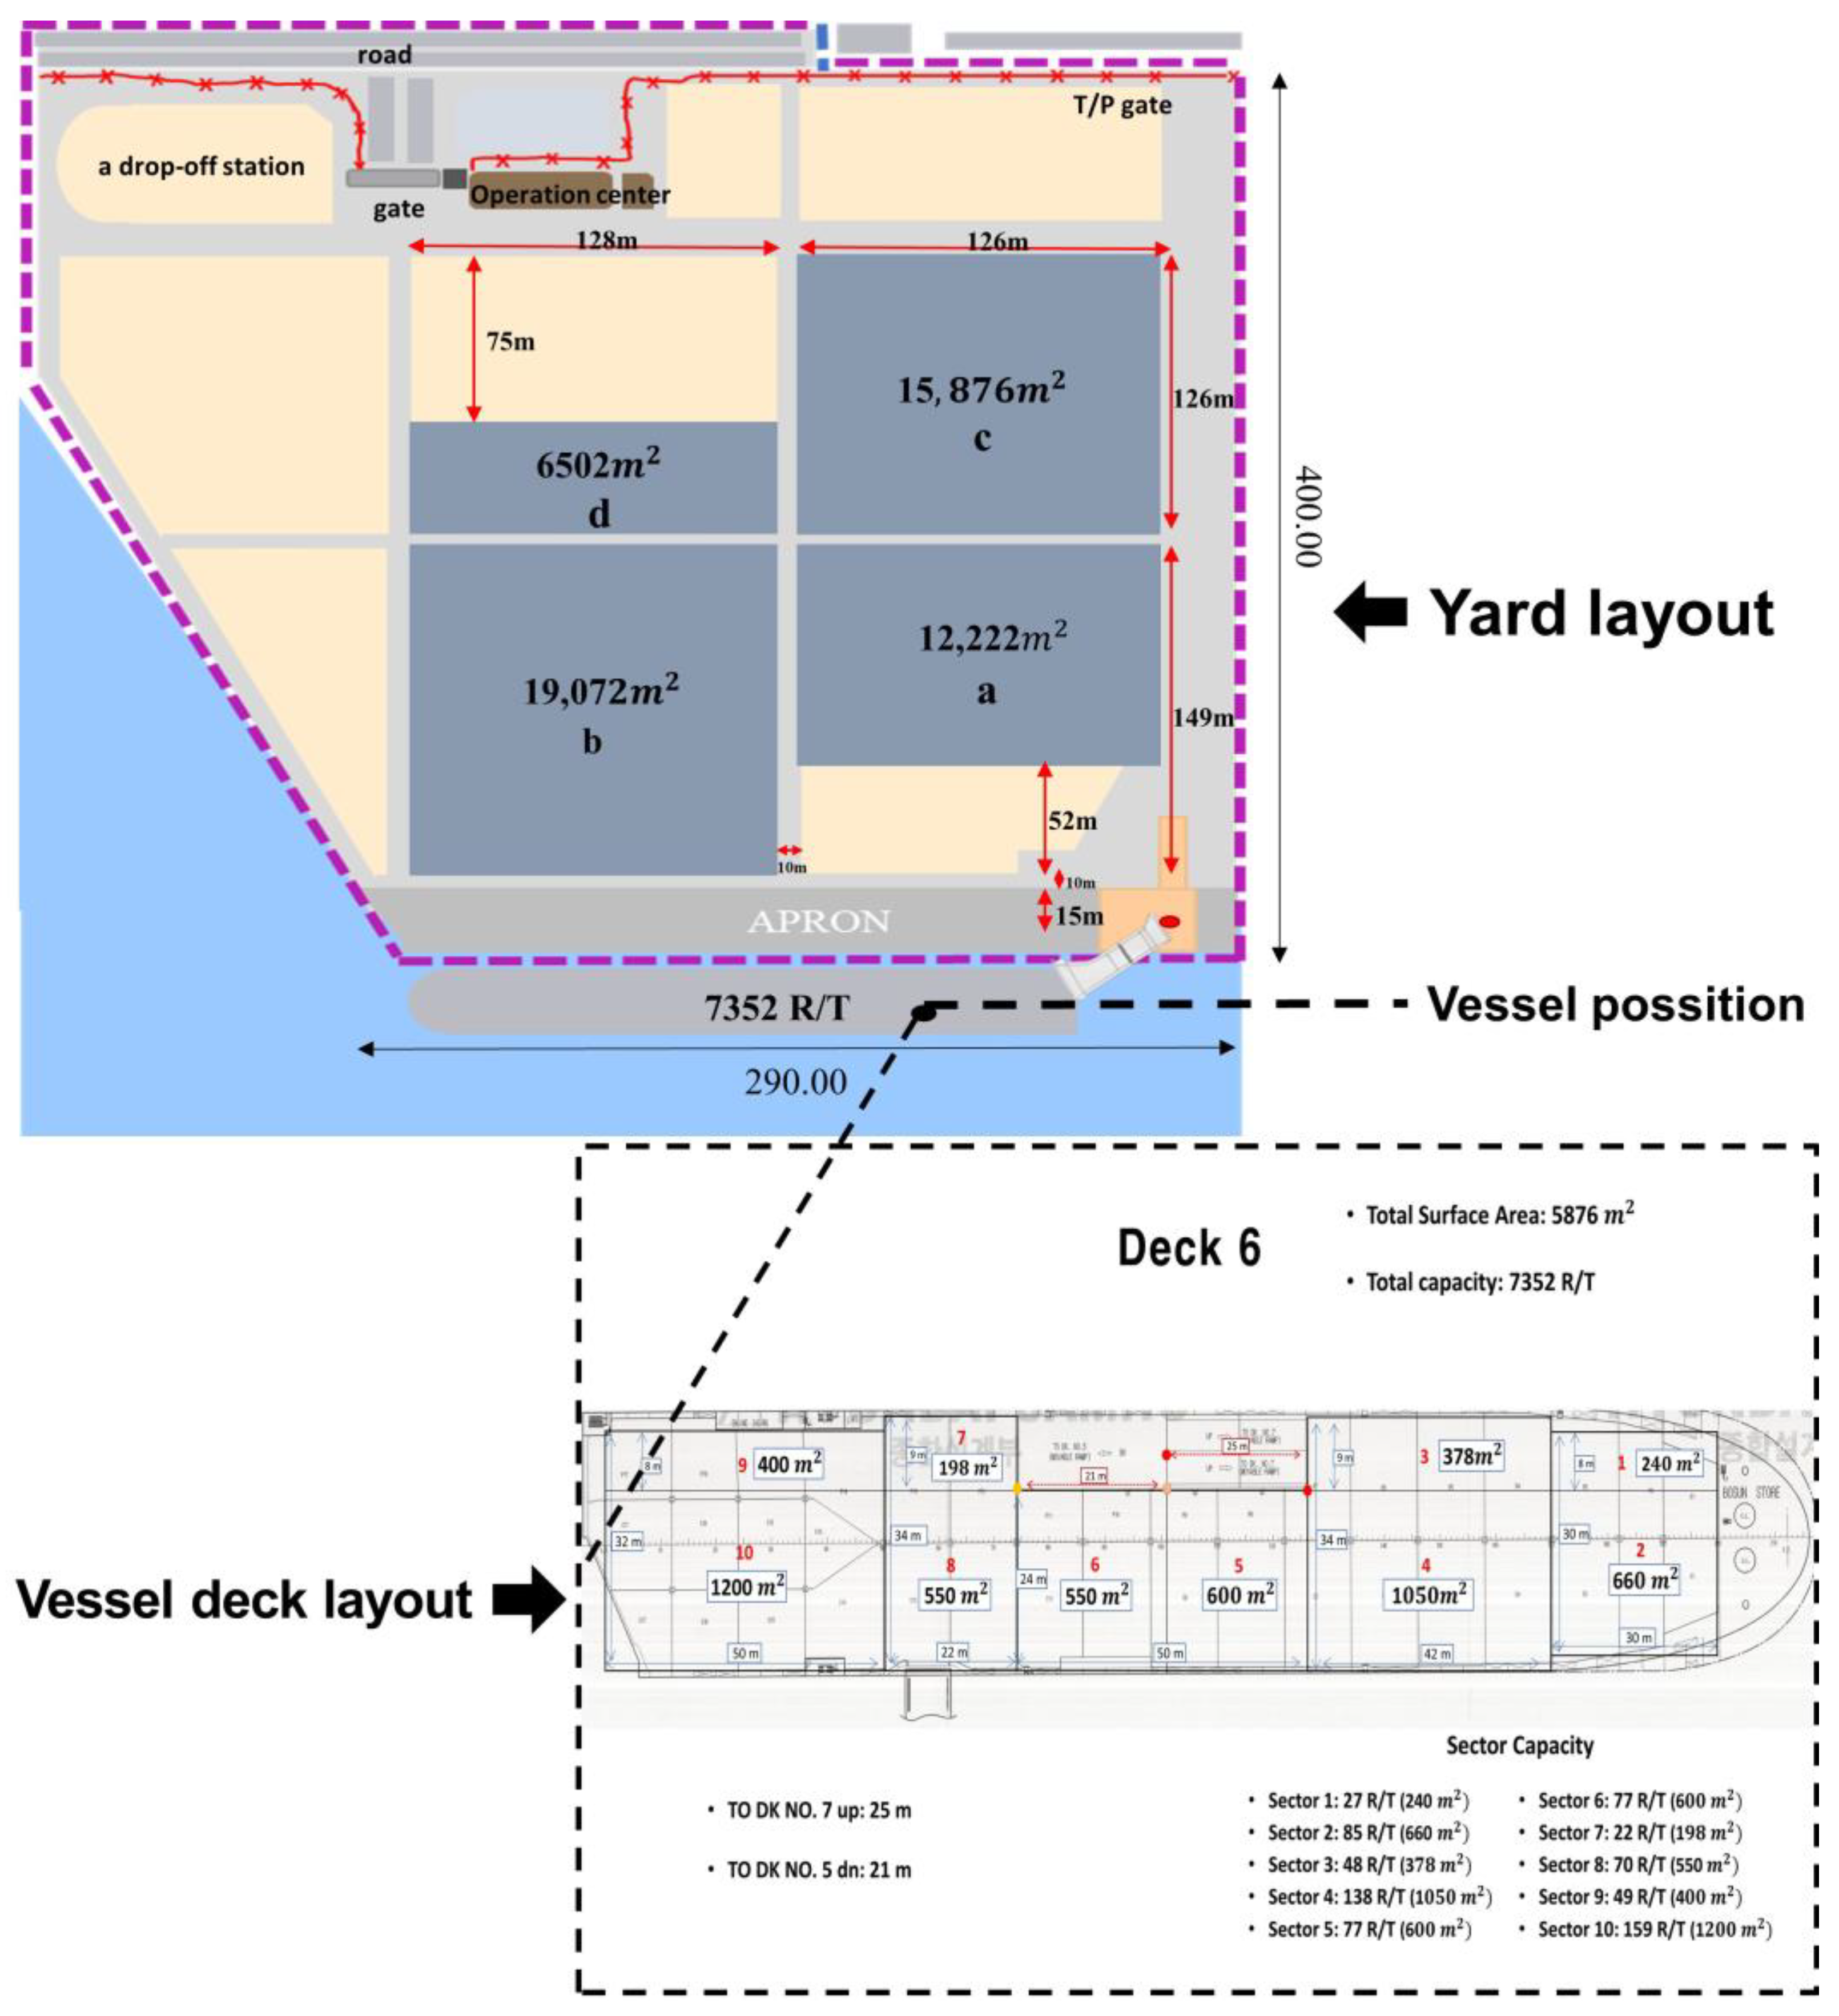
3.1. Case Study

Figure 1 shows the parking allocation in the case study port and the sample deck divisions of the vessel with 13 decks. As a case study port, we have chosen Pyeongtaek Port, the largest automobile import–export gateway in South Korea. The parking area within the premises has been determined to be 6.39 m2 per vehicle, taking into account the space required for maneuvering and parking, for a total of 7353 vehicles. The actual parking space available for vehicles may vary depending on their size and type. However, we use the standard vehicle size to determine the maximum number of vehicles loaded onto a ship [36]. Glovis Splendor, one of the largest deep-sea carriers with a carrying capacity of 7353 R/T, modeled the simulation. The surface of each deck was partitioned into rectangular sections to simulate parking areas. A triangular distribution was used for the simulation, and each unit of the parking area was determined to be 4.125 m wide by 1.550 m long, considering the space needed between each parked car.

3.2. Arrival Distribution

As all 7352 vehicles are positioned differently in the yard, the probability of reaching the next point varies. In RORO terminals, as vehicles are typically parked in rectangular blocks in the yard, there are clearly defined minimum and maximum possibilities for which a vehicle will arrive at the next point. Therefore, we used triangular distribution which is characterized by three parameters (minimum value, maximum value, and mode) to define the transfer of 7352 vehicles from the yard to the vessel.

3.3. Vehicle Speed and Loading Strategy

We referred to the f Handbook: A Practical Guide to Roll-On Roll-Off Cargo Ships to set the vehicle’s speed [36]. As each section of the port has different speed limits, different speeds were applied to each section, as shown in Table 2. In the case of autonomous vehicles, the maximum speed is the same as that of the vehicles in the current loading system. Therefore, the vehicle speed range of the simulation was set to be the same for the current and CAV-loading systems. In addition, the safe following distances for the current and CAV-loading systems were similarly applied.

3.4. Simulation Model

3.4.1. Simulation Assumptions

The following assumptions were made as it was difficult to incorporate every detail into the simulation and to achieve results in line with the research purposes. The following assumptions were made based on the previous studies [13,14]:
  • Due to the large space between deck pillars and their small surfaces, deck pillar surfaces are not considered.
  • Assuming that all 7352 vehicles are loaded, the loading place and loading charges are identical.
  • Stowage plans, which consider the balance of the ship, are lacking details.
  • Vehicles depart from the yard and board the ship simultaneously.
These assumptions were made to facilitate practicality and streamline the analysis of the CAV-loading system. Firstly, deck pillar surfaces were excluded from consideration due to the complexities involved in modeling and simulating these surfaces, allowing the focus to be directed towards factors such as loading time, efficiency, and cost reduction. Secondly, assuming that all vehicles have identical loading places and charges simplifies the analysis and enables a comparative evaluation of the current loading system and the CAV-loading system. Thirdly, the simplified stowage plans were chosen to avoid excessive complexity in the simulation. While a comprehensive and detailed stowage plan is crucial in practical loading operations to maintain ship stability, an even weight distribution, and safe transport, the study focused on aspects such as time and efficiency gains achieved through the implementation of the CAV-loading system. Finally, assuming the simultaneous departure and boarding of vehicles from the yard simplifies the simulation process and allows for a direct comparison between the current loading system and the CAV-loading system. By providing both loading systems with the same departure condition, we eliminates the need to model and account for sequential movements, resulting in a more streamlined analysis of the CAV-loading system’s performance and its effect on overall loading time.
These assumptions strike a balance between simulation details and research objectives, providing valuable insights into the benefits and efficiency improvements of the CAV-loading system.

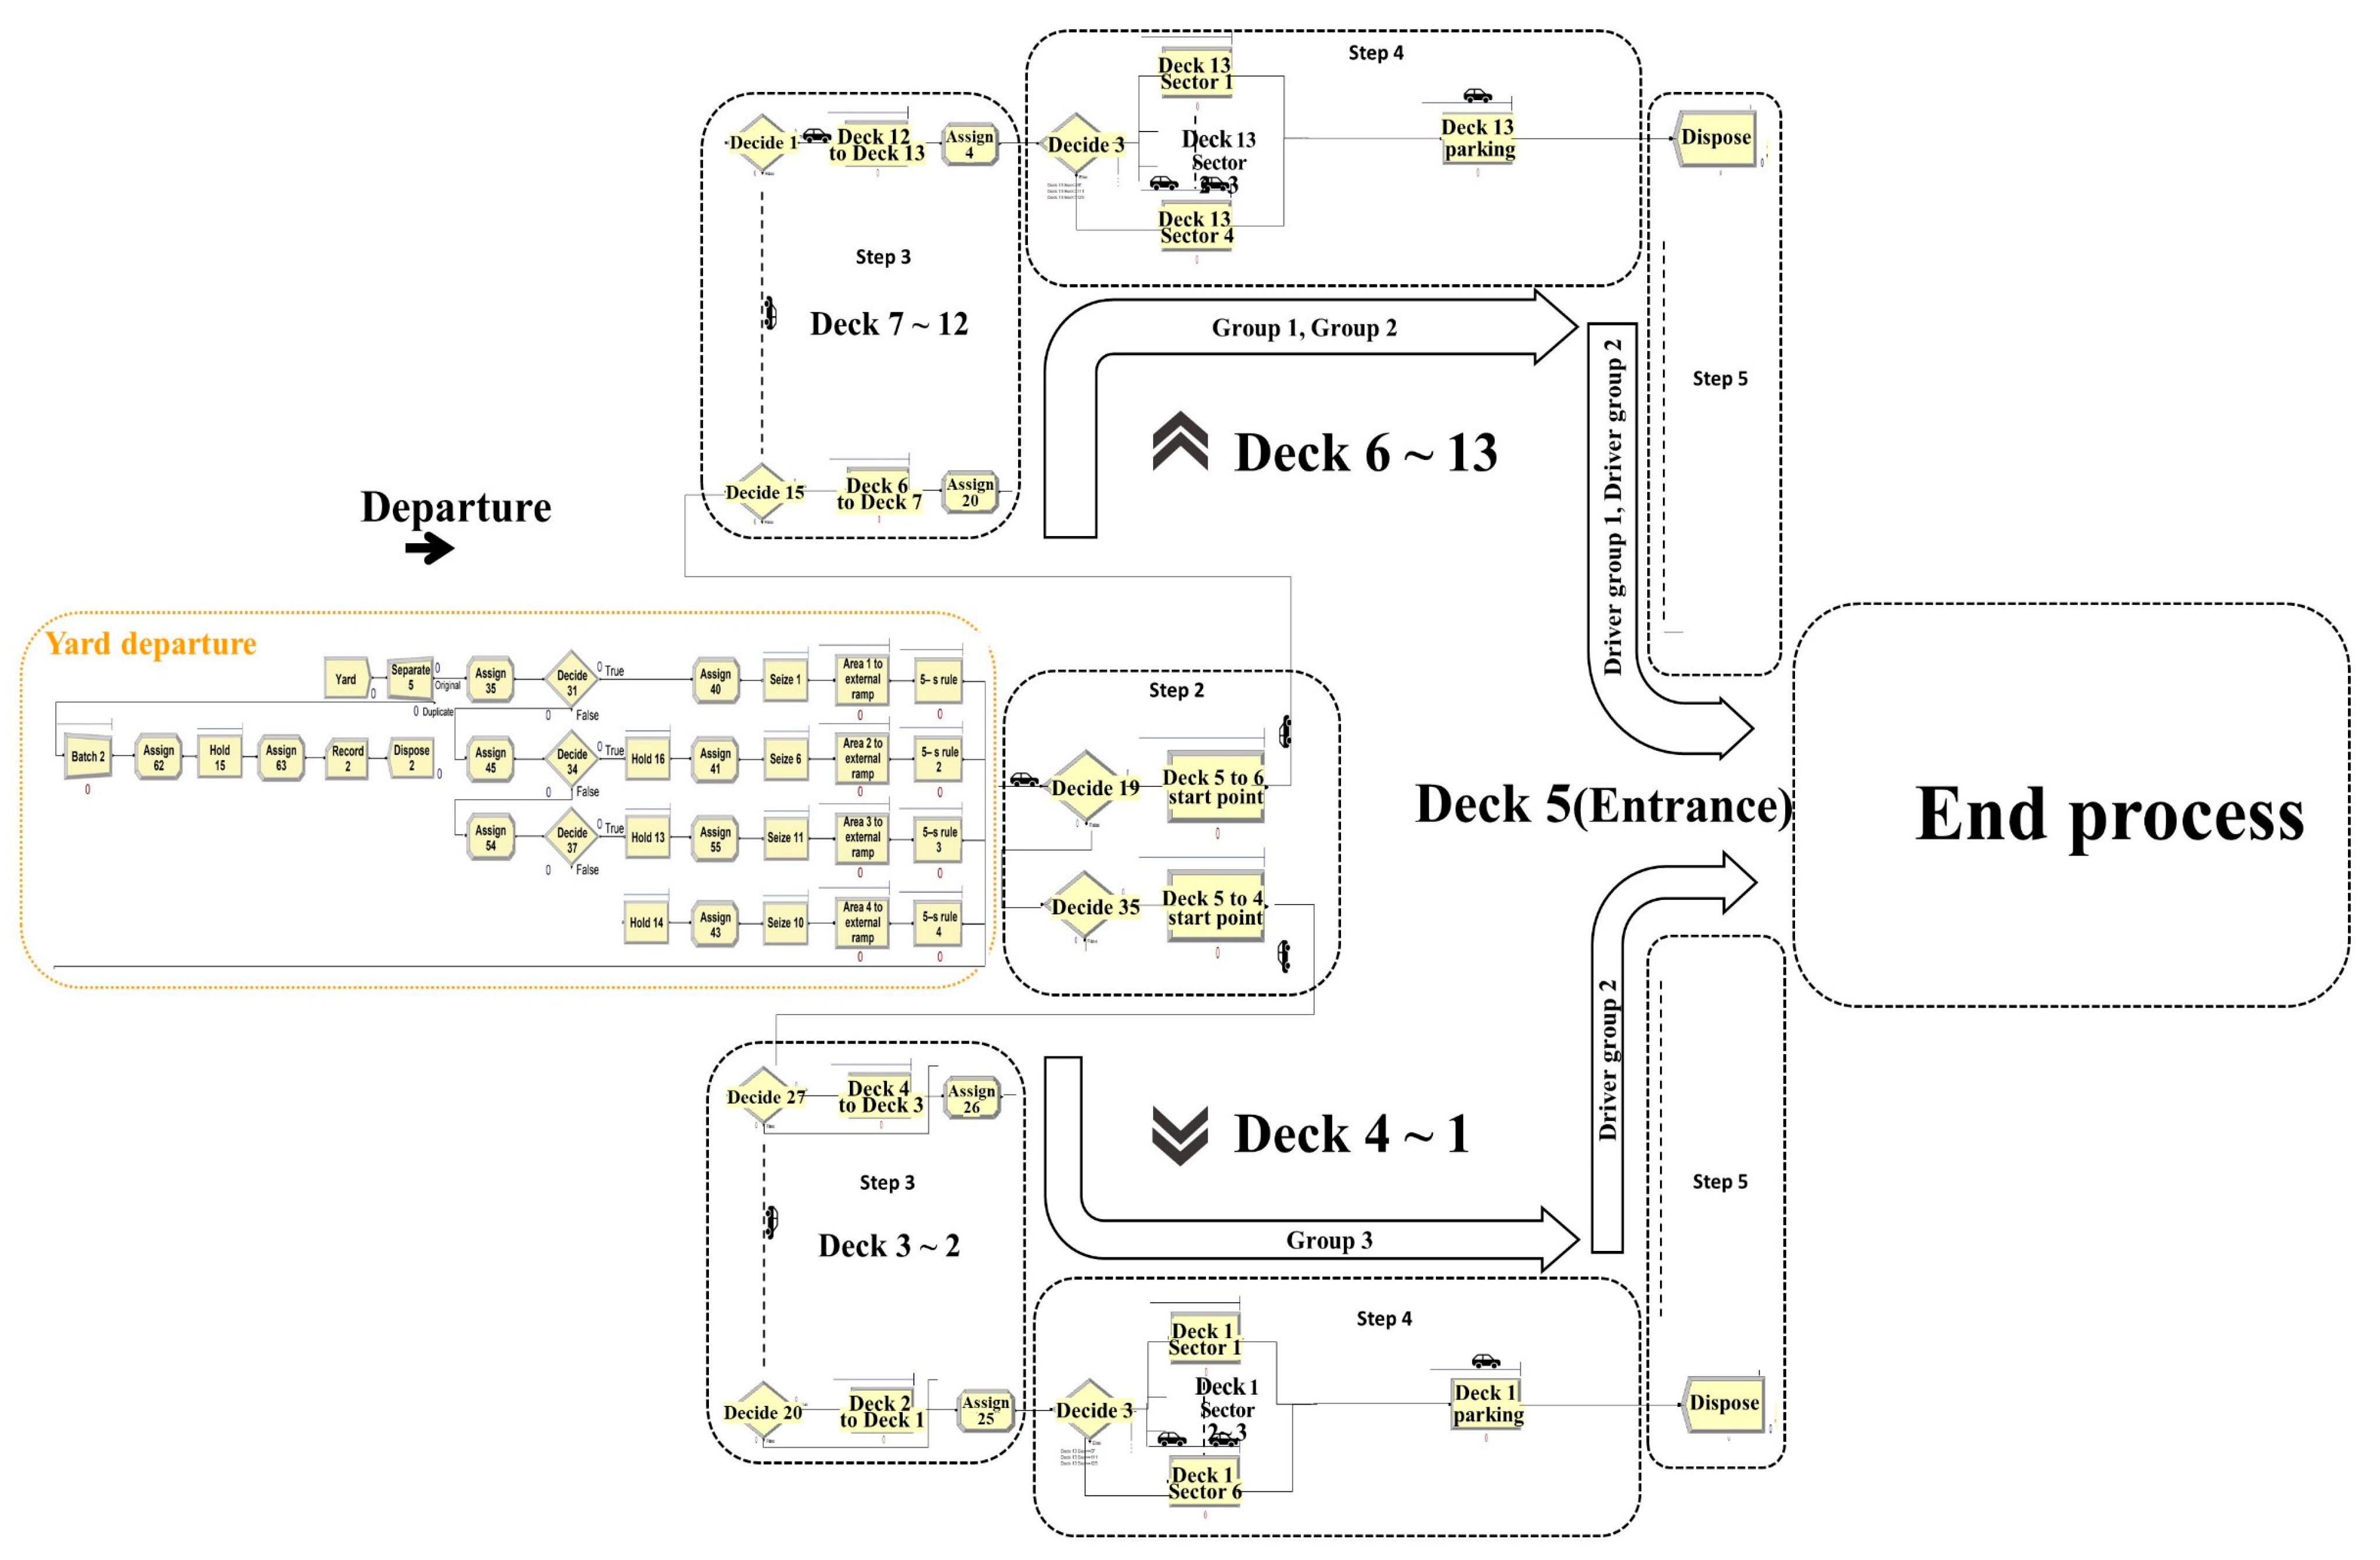
3.4.2. Arena Simulation Models

We developed two simulation models using Arena software. Then, we validated them against the real data from the loading process. Please see the validation results in [14].
A simulation model for a CAV-loading system was developed based on the simulation model of the AGV-loading system designed in the previous study. Park et al. [14] developed a series of simulation models based on the current loading system to test the impact of AGVs. In Park et al. [14], the simulation model incorporates the loading process within the vessel decks and the parking areas. Park et al. [14] investigated the actual yard size at the terminal, and the departure sequence was then determined. In this study, we combined two previous models to create the full version of the simulation model that shows the entire loading system at the RORO terminal. Figure 2 shows the full version of the current loading system. The departure stage developed by Park et al. [14] is integrated with the left box. Additionally, the returning stage is combined with the correct box. Then, the loading process within the vessel decks and the parking areas developed by Park et al. [13] are integrated in the center of the simulation model. Figure 2 shows the entire loading process from the departure to the end. In contrast, Figure 3 shows the full version of the CAV-loading system. Unlike Figure 2, Figure 3 does not include the corporate returning stage, as the CAV-loading system completes the loading process as parking is completed. Please refer to Park et al. [13] and Park et al. [14] with regards to the details of the simulation module.
In this simulation, several modules were utilized to model and control the behavior of entities. The CREATE module initiated entities, representing the arrivals of vehicles or entities into the system. It marked their starting point within the simulation. As entities completed their tasks or processes, the DISPOSE module removed them from the system. The ASSIGN module played a crucial role in assigning values, such as entity type, variables, and attributes, to entities. This module defined specific characteristics and properties for the entities within the simulation. To group entities for specific purposes, the BATCH module was employed. It could temporarily or permanently group entities together. In this simulation, the BATCH module simulated the collection of drivers by a shuttle van or similar scenarios. Entities that were previously grouped using the BATCH module could be separated using the SEPARATE module. This module allowed entities to be individually processed or assigned to different tasks within the simulation. The HOLD module was responsible for queuing entities until specific conditions or signals were met. It controlled the movement and progression of entities within the simulation until certain requirements were fulfilled. The PROCESS module defined the travel time and time consumption within the simulation. It represented the various activities and processes that entities underwent and captured the time required to complete those activities. The DECIDE module, although not explicitly mentioned in the description, is referenced in Figure 2 of the simulation. It was typically used to model decision-making processes, such as dividing vehicles among yard blocks based on specific criteria or rules. The SEIZE module was utilized to allocate and control resources in the simulation. In this simulation, this module ensured that only a limited number of drivers were available at any given time. Lastly, the RELEASE module was responsible for releasing entities from specific processes or tasks. In this simulation, it enabled the start of a new loading process with drivers until all vehicles were loaded.
As shown in Figure 3, depicting the CAV-loading system, the BATCH module was removed as CAVs completed the loading process in the ship as they parked themselves in the parking slots. Also, all autonomous vehicles could operate independently and platoon together to move towards the ship so there was no need for SEIZE module to limit the number of drivers.

4. Simulation Results and Cost Model Analysis

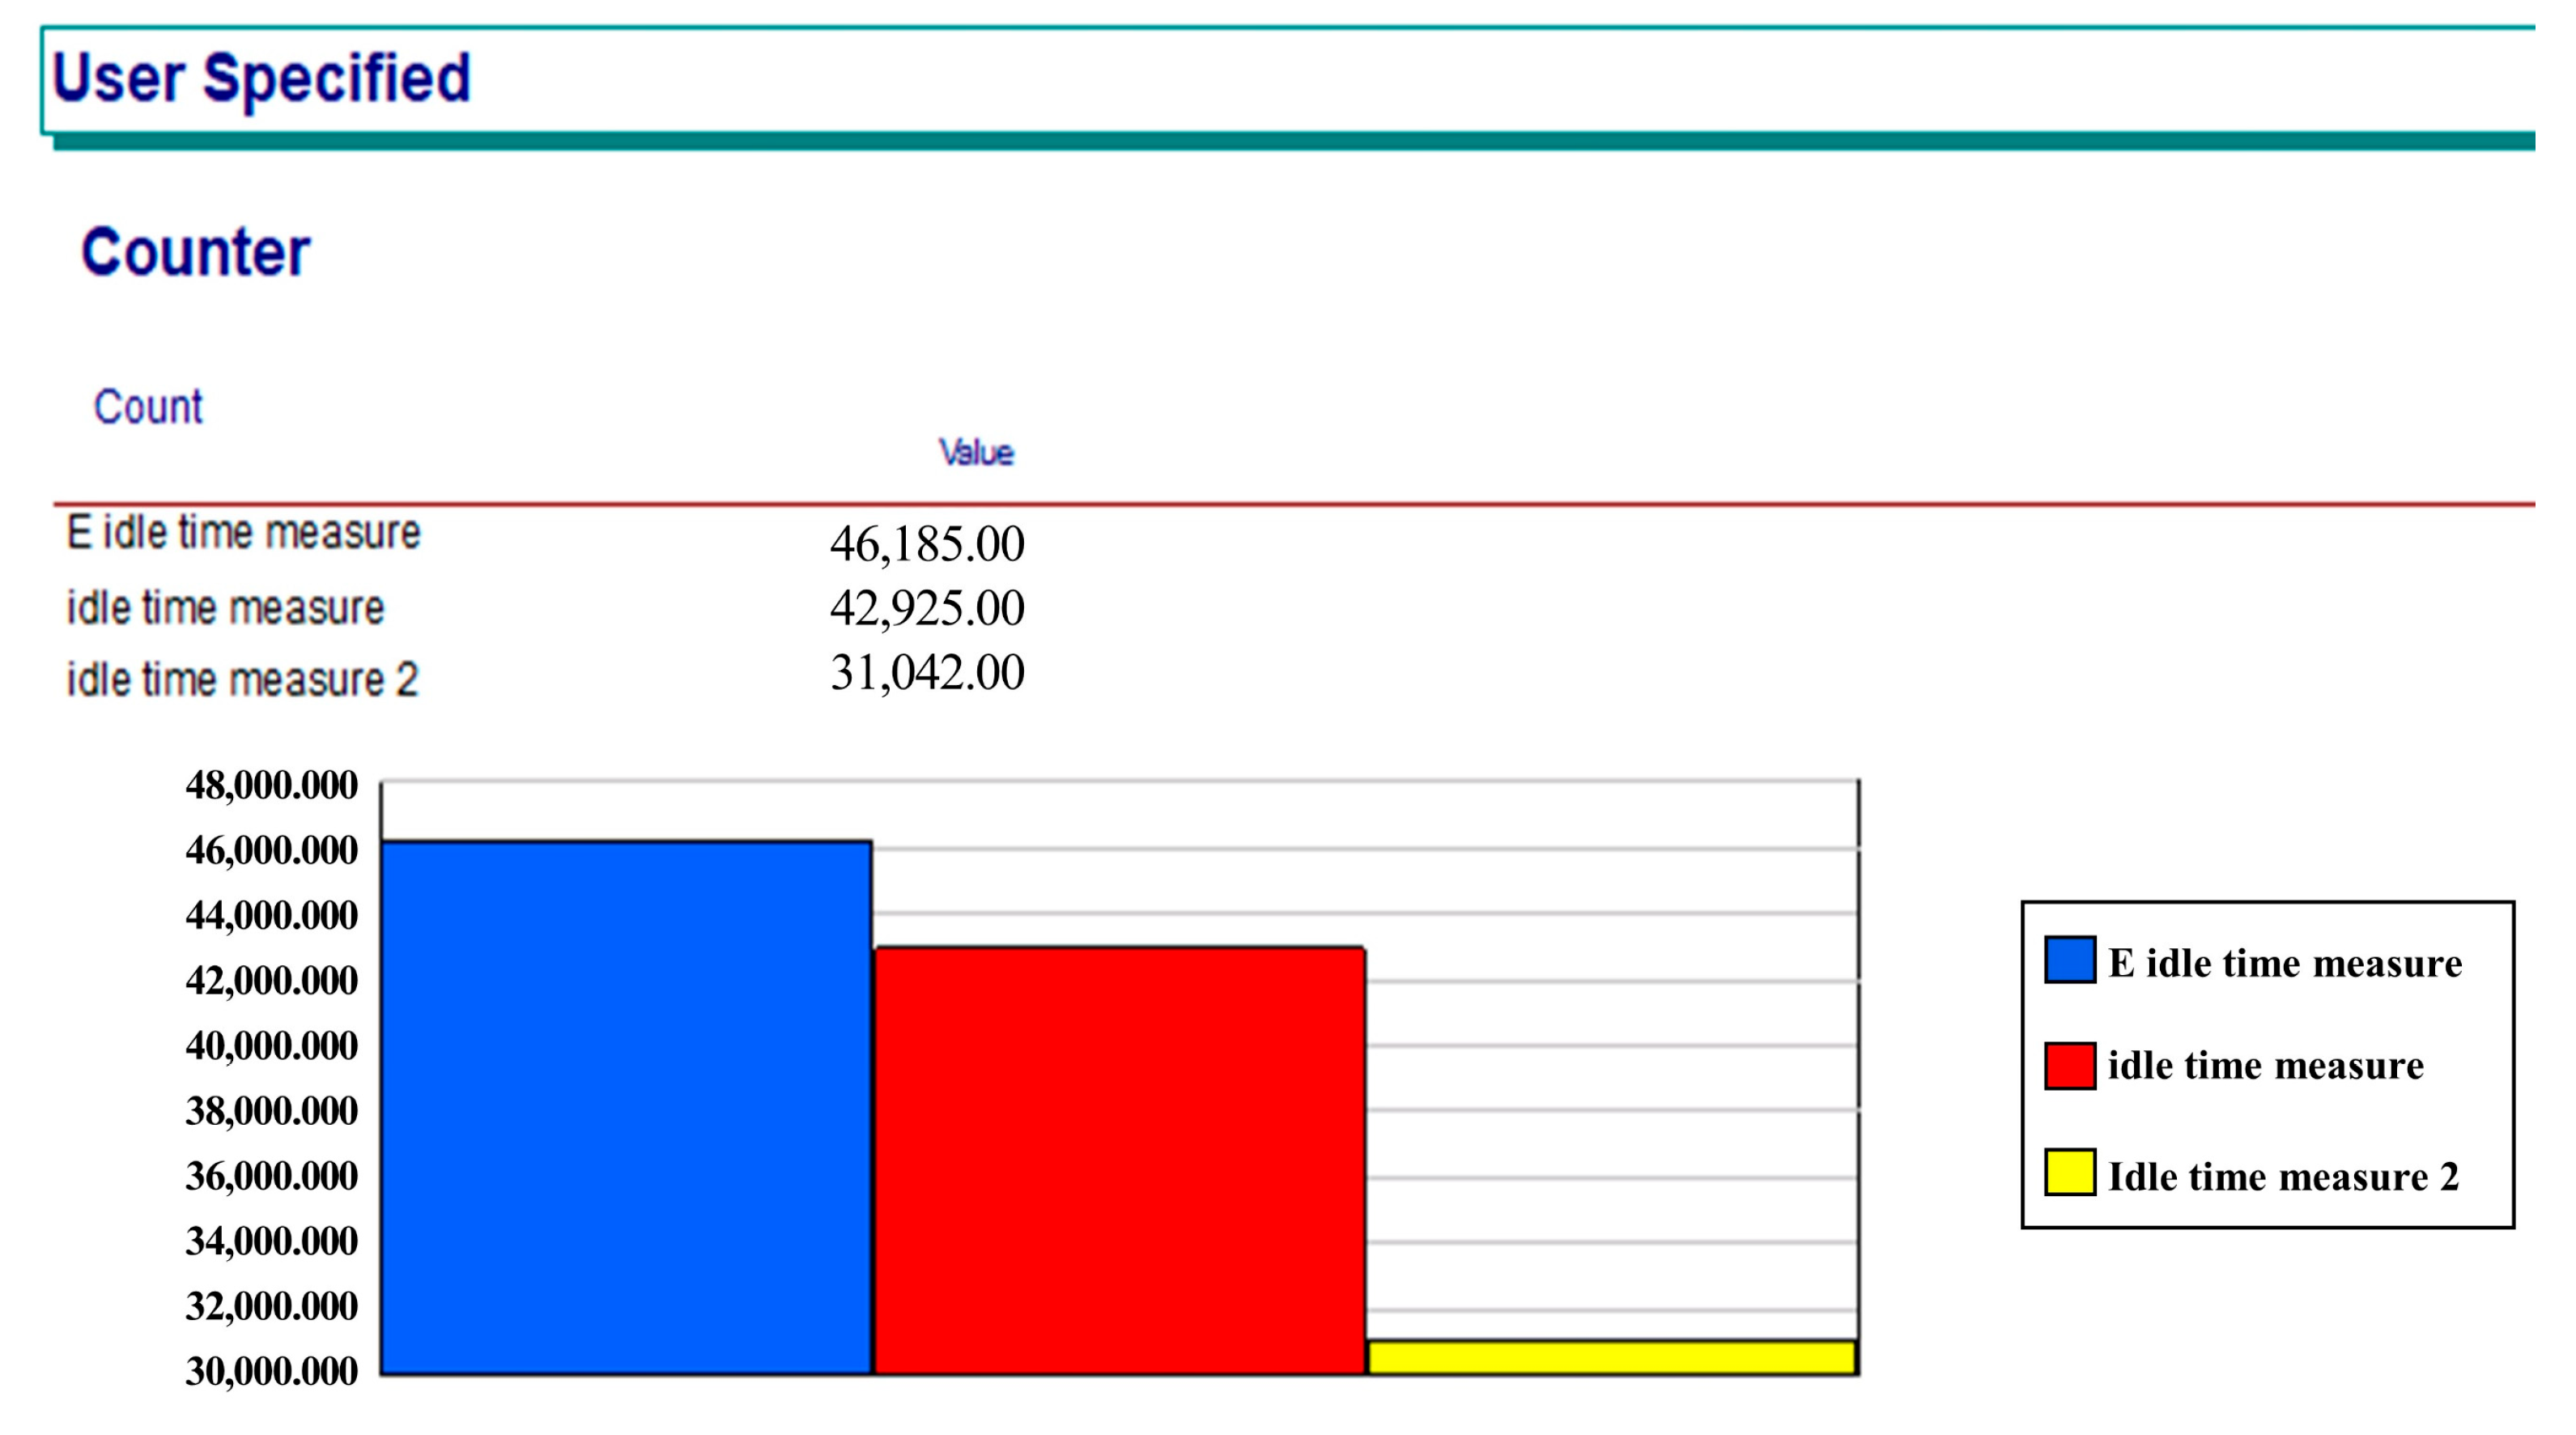
4.1. Current Loading System

The simulation results for the current loading system are shown in Table 3. As the average waiting time in the bottleneck of this simulation is measured in seconds, the simulation time setting has been set to seconds. The batch delivery procedure, in which drivers were picked up by the shuttle van, resulted in the longest wait time. The 5 s rule enforced on all cars caused the second-longest waiting period. The 5 s rule is a principle applied to all vehicles moving from a yard to a ship within a RORO terminal [36]. The purpose of this rule is to prevent collisions caused by simultaneous departures by having each vehicle depart 5 s after the one in front of it. The total load time was 83,515.60 s. Approximately 3 days would be required to finish the entire loading operation. The result slightly differs from that of the previous study because Park et al. [13] evaluated the loading system primarily inside the vessel without considering the vehicle’s departure rule in the yard. Alternatively, Park et al. [14] investigated the vehicles’ traffic in the yard with a simple loading mechanism inside the vessel. In this study, two earlier simulation models are combined to evaluate the entire loading system.

4.2. CAV-Loading System

Figure 4 shows the result of the CAV-loading system. The total loading time was 46,185.00 s, which implies that the actual work time charge was less than 1 day as the CAV-loading system can be operated for 24 h. Compared to the current loading system, the loading time was reduced by 45% as the CAV-loading system eliminated the drivers’ parking process and the workers’ return procedures to the yard. Compared to the AGV-loading system, the CAV-loading system reduced loading time as CAVs can reach a higher speed than AGVs can. Additionally, the CAV-loading system is not controlled by transportation of vehicles, such as AGVs.
The benefit of the impact of the CAV-loading system is noted to be more significant in terms of cost-effectiveness. The following subsection compares the economic benefits of the CAV-loading system with those of current loading systems.

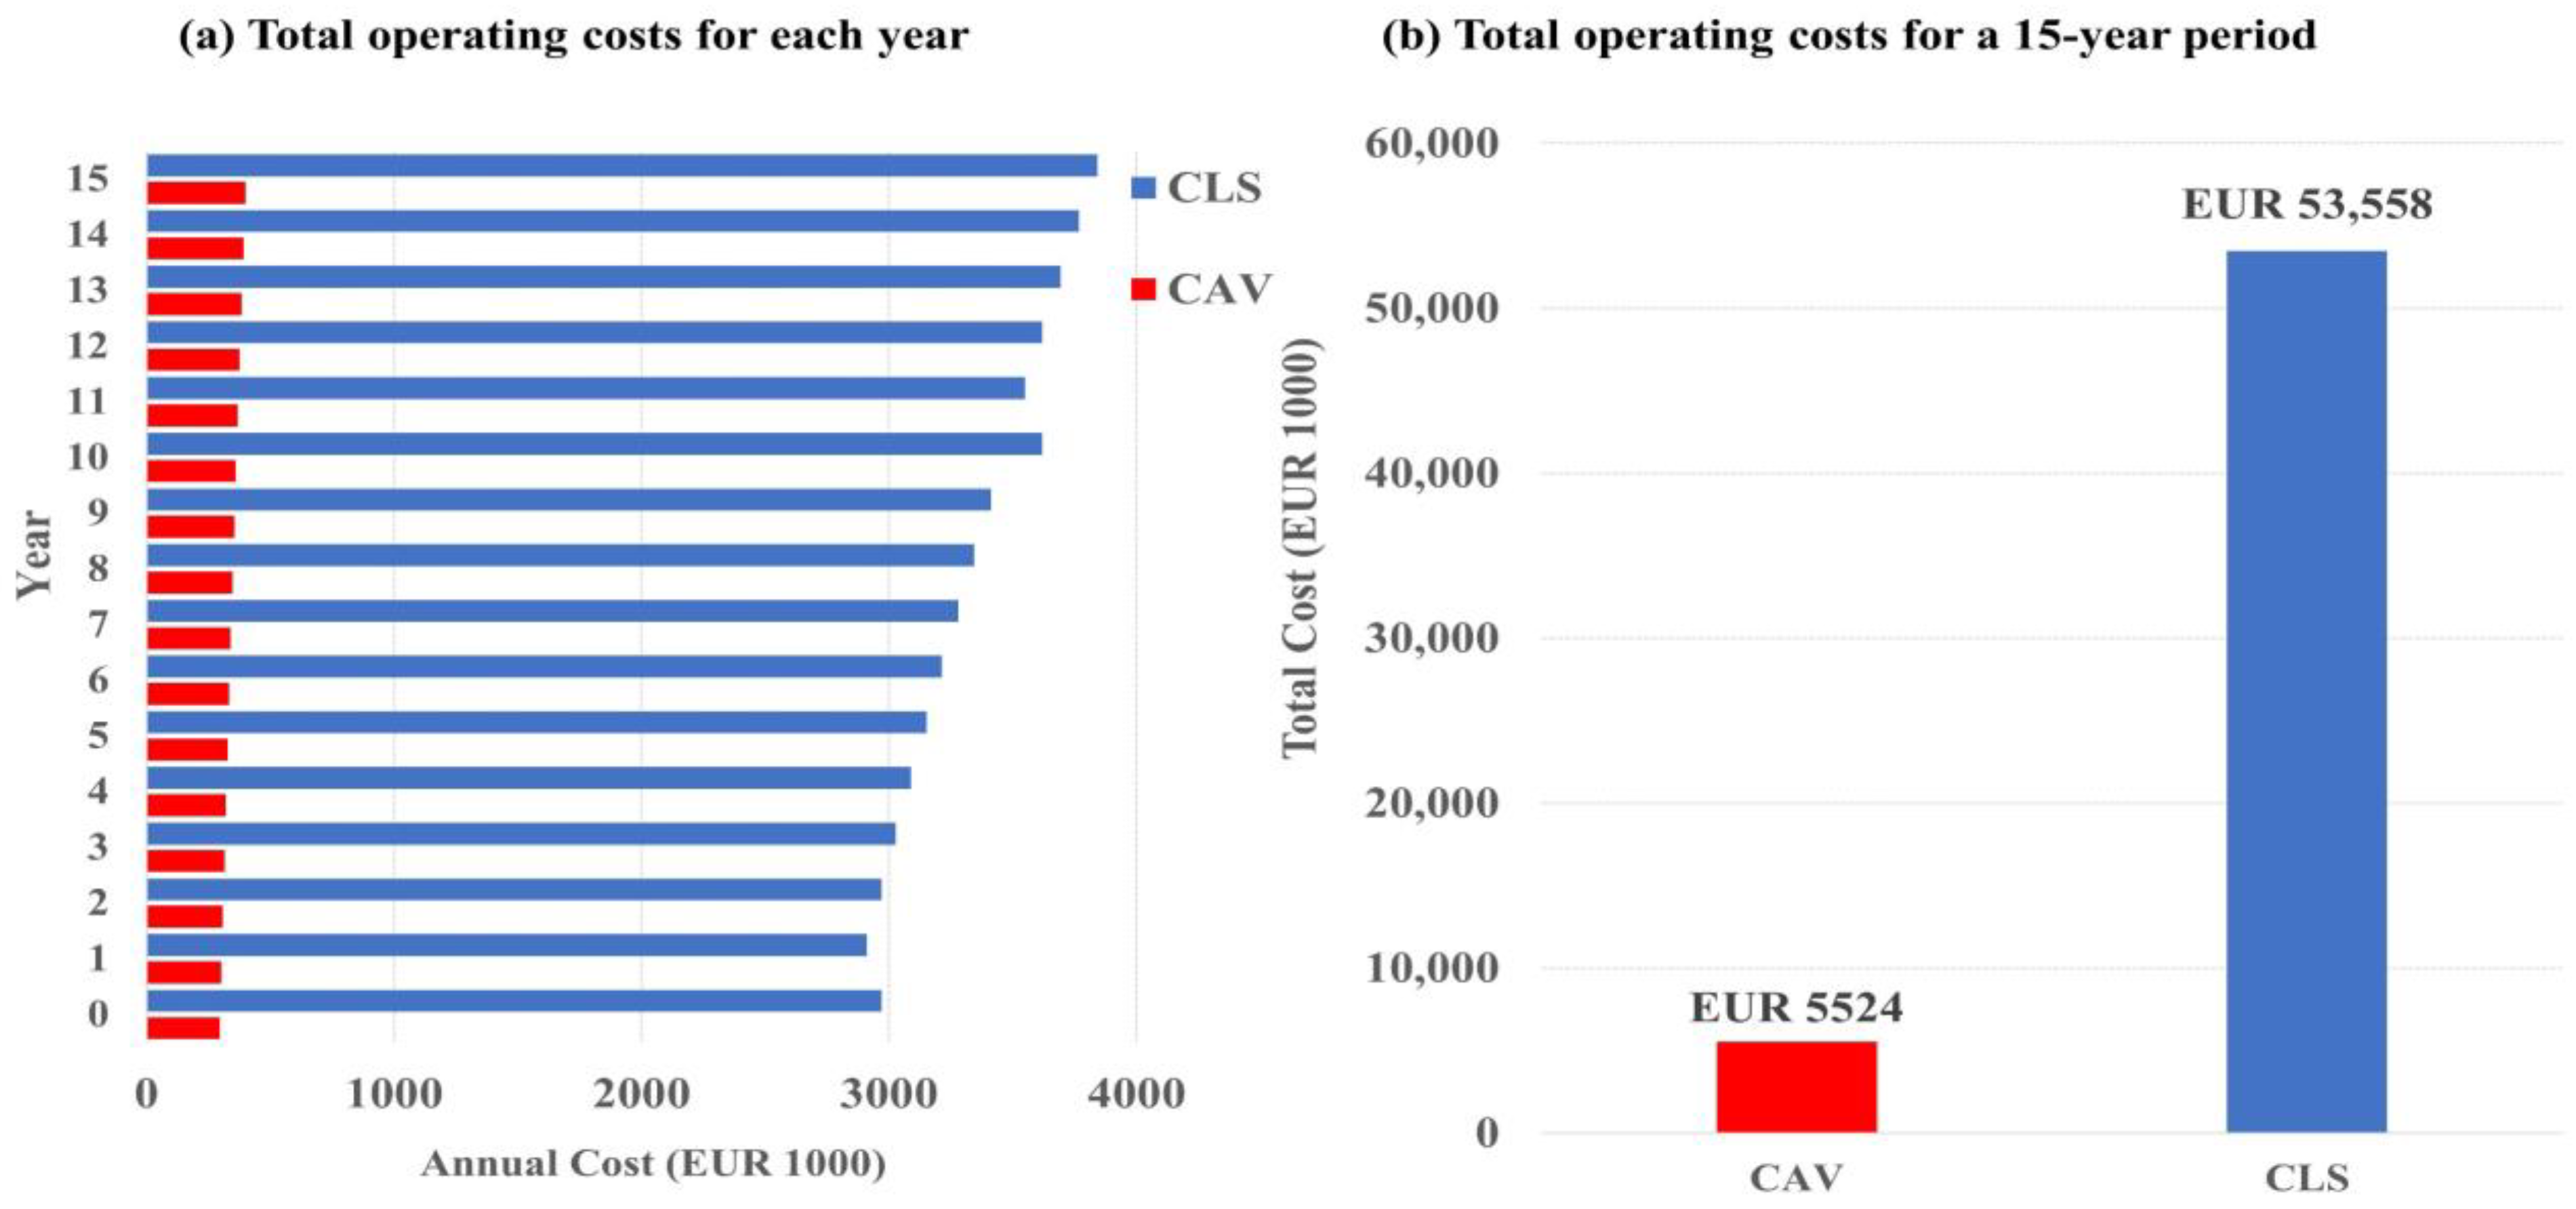
4.3. Cost Model Analysis

In this study, we developed the cost model based on the previous studies [14,21]. Kavakeb et al. [21] developed the cost model to compare the total cost of using two types of vehicles, IAVs and trucks, in a port over a 15-year period. The analysis considers the capital and operational costs of the vehicles and uses a discount rate of 5% and a 15-year period to calculate the present value of each system. The cost model takes into account various factors such as the vehicles’ capital, energy cost, wage cost, service cost, and spare vehicles. The operational cost includes the cost of energy consumption, wage cost, and service cost. To estimate the economic benefit of the CAV-loading system, the cost model was employed. The cost model calculates the operating costs for Pyeongtaek Port for 15 years with the CAV-loading system, assuming a vehicle life expectancy of 10 years and a replacement cycle of 5 years.
The CAV-loading system does not require vehicles for cargo and transportation because the vehicle carrying the shipment cargo also functions as a means of transportation. Therefore, the capital cost of the vehicles is not required for the CAV-loading system. In contrast, in the case of the current loading system, the shuttle van and workers made up most of the capital costs. Therefore, the economic benefits of the CAV-loading system are shown in this section.
The distance traveled by cargo vehicles during the loading process in the CAV-loading system and the current loading system is the same, but the current loading system also involves the travel of the shuttle van to transport the drivers. Therefore, only the total energy cost of the shuttle vans was calculated as follows:
D l v a n : diesel liter consumed per 100 km for van.
p d : price per diesel liter.
t v a n : travel distance for van per shipping.
E v a n : total energy a cost of van per shipment.
E v a n = t v a n × D l v a n 100 × p d
The following intermediate parameter is the cost of workers’ wages. To calculate the total cash flow for the operational cost of a year, the total salary for workers per year must be calculated. Equations (2) and (3) calculate the annual salary for the workers.
h : total working hours per shipping 7352 R/T.
p s v d : hourly pay for Stevedore.
p C A V : hourly pay for CAV operators.
W s v d : total wage for stevedores per shipment.
W C A V : total CAV operator wage per shipment.
W s v d = p s v d × h
E v a n = t v a n × D l v a n 100 × p d
By calculating the above intermediate parameter, the yearly operational costs of the current loading process and the CAV-loading process can be calculated, as shown in Equations (4) and (5). To calculate the annual salary for workers and the yearly energy cost for vehicles, we further considered n s the number of shipments per year and n o p the number of CAV operators.
n s : number of shipments per year.
n s v d : number of stevedores.
n g a n g : number of gangs.
n o p : number of CAV operators.
s v a n : total service cost per van for a year.
O 0 c l s = n s × E v a n + W s v d × n s v d × n g a n g + ( s v a n × n v a n )
O 0 C A V = W C A V × n o p × n s
The cash flows for the operational costs of the next 15 years are calculated from year 0 and the inflation rate, I. This is shown in Equation (6).
O t = O 0 × I t ,   1 t 15
The vehicle capital costs in year 0 were calculated as follows:
C 0 c l s = p v a n × n v a n
Equation (8) calculates the cash flows for vehicle capital in year 0.
C t c l s = C 0 × I t ,   i f   t = 10 0 ,   o t h e r w i s e
Equations (9) and (10) calculate total cash flow of year t, which is the summation of the operational cash flow and vehicle capital.
R t c l s = C O 2 t c l s + C t c l s
R t C A V = C O 2 t C A V
We extended the evaluation of the cost of the CAV-loading system from an environmental perspective, and CO2 costs were then considered. In the extended cost model, CO2 emissions from the vehicles are calculated and converted into a monetary valuation. CO2 emissions from the current loading process are primarily produced during the operation of cars and the van. Similarly, the major cause of CO2 emissions for the CAV-loading system is the operation of vehicles. The total C O 2 emissions from the two types of loading processes are calculated below.
C O 2 c a r : CO2 emissions from the car per kilometer.
C O 2 v a n : CO2 emissions from the van per kilometer.
C O 2 C A V : CO2 emissions from the CAV per kilometer.
e m i s s c l p : total CO2 emissions produced during the current loading process.
e m i s s C A V : total CO2 emissions produced during the CAV loading process.
A t c a r : travel distance for the car per shipment.
e m i s s c l s = ( C O 2 c a r × t c a r ) + ( C O 2 v a n × t v a n )
e m i s s C A V = C O 2 C A V × t C A V
Equations (13) and (14) calculate the intermediate parameters of the total CO2 costs per year for two loading systems.
C O 2 c s t 0 c l s = E M c l s × n s 1 m t × C O 2 p r
C O 2 c s t 0 C A V = E M C A V × n s 1 m t × C O 2 p r
The CO2 price per metric ton is denoted by C O 2 p r . Then, Equations (15) and (16) calculate the total CO2 costs for the next 15 years:
C O 2 c s t t c l s = C O 2 c s t 0 c l s × ( 1 + r ) t ,   1 t 15
C O 2 c s t t C A V = C O 2 c s t 0 C A V × ( 1 + r ) t ,   1 t 15
The values of the initial and intermediate parameters utilized in the cost model are shown in Table 4 and Table 5. Equations (1)–(3), (11) and (12) calculate the intermediate parameters. Equations (4)–(10) calculate the cash flows for 15 years, as shown in Table 6.
The following intermediate parameter is the cost of workers’ wages. To calculate the total cash flow for the operational cost of a year, the total salary for workers per year must be calculated.
Figure 5 compares the cash flows in each year for the current and CAV-loading systems. From year 0, the CAV-loading system remained relatively cheaper than the current loading system as a significant capital investment was not required. As the year progresses, the gap between the operating costs of the two loading systems increases. Despite the need for some operators with the CAV-loading system, they replace a significant proportion of the manual labor required by the current loading system. While the CAV-loading system remains the same as it does not have to purchase any vehicles, the cost of the current loading system will increase again in year 10 as the life cycle of the existing capital ends. The total cash flows for the current and CAV-loading systems for the 15 years were EUR 53,558,339 and EUR 5,524,684, respectively, which means the CAV-loading system could operate at a tenfold lower cost than that of the current loading system.
The environmental effects of using the CAV-loading system are shown in Figure 6. The total CO2 emissions from the current and CAV-loading systems were 1276 and 1015 m3/t, respectively, throughout the 15 years. When these emissions were translated into monetary value, they were equal to EUR 78,109 and EUR 69,224, respectively. The results show that the CAV-loading system can operate at a lower cost and with fewer emissions as it operates fewer vehicles than the current loading system.

5. Conclusions

Several studies discussed the advantages and potential benefits of port automation. The key advantages and potential benefits associated with port automation are increased efficiency, increased capacity, and environmental benefits [18]. The studies provided a comprehensive overview of them but presented only limited specific technology recommendations for practical implementation and their primary focus was on container terminals [16,18,19]. Thus, only a few studies have been conducted on the productivity of vehicle terminals because the productivity of RORO terminals is primarily influenced by human factors, resulting in comparatively less attention being given to their automation compared to that of other types of terminals. Some previous studies have explored the use of AGVs in RORO terminals and found that they reduced loading time but had limited operational efficiency due to their lower maximum speed [13,14]. Meanwhile, the development of autonomous vehicles is accelerating and being widely adopted in airports, trunk lines, logistics, ports, mines, and other industries. The emergence of autonomous vehicles at the automobile terminal is inevitable. Some studies have discussed the feasibility of integrating autonomous vehicles in RORO ports, but there has been limited discussion on strategies and the use of modeling and analysis approaches to facilitate their implementation [7,27]. Based on the distinction on these aspects, in this study, we proposed automating the operation of RORO terminals using CAVs to improve performance. To address the aim of the study, we investigated the effect of a CAV-loading system in terms of its impact on the productivity, cost efficiency and environment. To test the terminal’s performance with the CAV-loading system, we developed several simulation models. The simulation results for the CAV-loading system showed that the loading time of the RORO terminal was reduced by 45% compared to the current loading system. This result shows that the CAV-loading system is more productive and efficient than the AGV-loading system. According to Park et al. [14], the AGV-loading system using 29 AGVs matched the productivity of the current loading system. However, the study found that increasing the number of AGVs can increase productivity but also leads to decreased active rates of AGVs and increased waiting times within the external ramp. Moreover, the maximum productivity that the AGV-loading system could achieve was lower than that of the CAV-loading system. This is because the maximum driving speed of CAVs is much faster than that of AGVs. Additionally, the CAV-loading system does not require transportation modes such as AGVs to transport vehicles, as CAVs act as a means of transportation on their own. Thus, the CAV-loading system is more efficient than the AGV-loading system is.
Then, a cost model was developed to examine the economic benefits of the CAV-loading system. The CAV-loading system reduced total operational costs by 90% over 15 years. The underlying factor contributing to this outcome was the costs of wages. Although CAV-loading systems need some operators to manage the system, they replace a significant part of the human resources required by the current loading system which accounts for the major portion of the total operating cost of the current loading system. This figure also shows that the CAV-loading system was more efficient than the AGV-loading system was, reducing the loading time and operating costs [14]. This can be attributed to the fact that implementing a CAV-loading system involved lower upfront costs compared to those required with an AGV-loading system. CAVs can utilize commercially available vehicles with minimal modifications, reducing the need for specialized or custom-built vehicles. In contrast, AGVs require purpose-built vehicles with specialized automation and navigation capabilities, which can be more expensive [14,19,21].
Furthermore, in terms of environmental effects, the results show a 12% reduction in total CO2 emissions over 15 years due to the presence of fewer vehicles than in the current loading system. The current loading system resulted in more vehicle travel and emissions due to the operations of shuttle vans to transport drivers back to the yard. However, the CAV-loading system eliminates the need for drivers to return or coordinate with shuttle vans. Instead, autonomous vehicles can operate independently and form a platoon to move towards the ship. Indeed, implementing a CAV-loading system in terminals can be an effective measure to align with the IMO’s sustainable port requirements. It can contribute to reducing emissions and optimizing operations, aligning with sustainable port practices. By automating and optimizing the movement of vehicles within the port area, CAVs can help minimize idle times, reduce congestion, and optimize routes, leading to more efficient operations and reduced fuel consumption.
Overall, the CAV-loading system has several advantages over both the current loading system and the AGV-loading system. The ability of CAVs to collaborate, simplify the loading process, and integrate with terminal systems makes them a more advanced and impactful solution for automating RORO terminals. Furthermore, the CAV-loading system can be implemented with the lowest upfront cost. However, it is important to note that both CAVs and AGVs have their respective strengths and may be suitable for different terminal scenarios, depending on various factors. Careful consideration of these factors is essential in choosing the most appropriate and effective solution for automating and optimizing the efficiency of RORO terminals.
This study provides valuable insights from multiple perspectives. From the perspective of transport research, this study contributes to addressing the productivity challenges in RORO terminals. While the productivity of RORO terminals is primarily influenced by human factors, the development and implementation of a CAV-loading system presents an opportunity for automation in this sector. Furthermore, the findings of this study can contribute to research efforts aimed at developing strategies and policies to enhance the efficiency and effectiveness of RORO terminal operations. For example, one potential area of focus could be establishing the appropriate speed for autonomous vehicles within the terminal. By examining the relationship between autonomous vehicles’ speed and productivity, policymakers can determine the optimal speed that maximizes operational efficiency without compromising safety. From a policy perspective, the introduction of CAV-loading systems raises many questions related to safety standards, liability, and cybersecurity. Therefore, future studies must examine the policy frameworks and regulatory measures to ensure the implementation of CAV-loading systems in terminals. For policymakers, they need to develop and update regulations to address the unique aspects of CAV operations. This includes defining safety standards, establishing certification processes, and ensuring compliance with existing transportation regulations. Developing a comprehensive regulatory framework can help facilitate the safe and efficient integration of CAVs into terminal operations. Also, policymakers play a crucial role in planning and developing the necessary infrastructure to support CAV operations in vehicle terminals. This includes infrastructure for communication, charging or refueling, vehicle storage, and maintenance. In addition, Implementing CAVs in vehicle terminals requires technological considerations, such as communication systems, sensor technologies, and data management. Research can delve into the technical challenges and opportunities associated with integrating CAVs into existing terminal infrastructure and developing the necessary infrastructure. Policies should address infrastructure requirements, investment strategies, and coordination between different stakeholders. Lastly, the introduction of CAV-loading systems in vehicle terminals may have an impact on the workforce. Policymakers should consider strategies to support workers in transitioning to new roles or acquiring the skills needed to work alongside CAV loading systems. This may include training programs, job placement assistance, or reskilling initiatives to ensure a smooth and equitable transition.
However, this study has several limitations that warrant further investigation. First, the benefits of introducing a CAV-loading system involve more than a simple increase in productivity. As the vehicle loading time decreases, reducing vessel turnaround time can provide a greater benefit than ensuring savings in operational costs. [15]. Moreover, reducing the pollutants emitted by vessels in a port is an additional way to support port operations. In addition, the economic benefits associated with technological development, such as those in the shipping, finished vehicles, and port industries can be massive.
Alongside the limitations, there are several potential challenges that need to be addressed when implementing the CAV-loading system in the RORO terminal such as infrastructure requirements and regulatory considerations. For instance, CAVs rely on data exchange and connectivity, making data privacy and cybersecurity significant concerns. Developing regulations and protocols to safeguard data privacy and protect against cybersecurity threats is essential for secure CAV operations.
Autonomous vehicles use V2X (vehicle-to-everything) communication technology to create a platooning driving formation by sharing information about the acceleration, deceleration, and stopping of preceding or following vehicles. Therefore, the implementation of a CAV-loading system requires adequate infrastructural support. This includes the installation of communication systems to enable vehicle-to-vehicle and vehicle-to-infrastructure communication. Additionally, charging or refueling infrastructure may be needed to support electric or hydrogen-powered CAVs. Upgrading existing terminal infrastructure to accommodate the unique requirements of CAVs, such as dedicated lanes or parking areas, may also be necessary. Furthermore, studying and simulating a more sophisticated driving algorithm on a dedicated lane for CAVs during platoon formation is deemed necessary.

Author Contributions

Conceptualization, S.K. and S.P.; methodology, S.P.; validation, S.P. and S.Y.; formal analysis, S.P.; data curation, S.Y.; Writing—original draft preparation, S.P.; writing—review and editing, S.K. and S.Y.; visualization, S.P. and S.Y.; supervision, S.K.; project administration, S.K.; funding acquisition, S.K. All authors have read and agreed to the published version of the manuscript.

Funding

This work was supported by the 4th Educational Training Program for the Shipping, Port and Logistics from the Ministry of Oceans and Fisheries.

Institutional Review Board Statement

Not applicable.

Informed Consent Statement

Not applicable.

Data Availability Statement

The data presented in this study are available on request from the corresponding author.

Acknowledgments

The authors would like to thank the anonymous reviewers and handling editors for their constructive comments that greatly improved this article from its original form.

Conflicts of Interest

The authors declare no conflict of interest.

References

  1. Núñez-Merino, M.; Maqueira-Marín, J.M.; Moyano-Fuentes, J.; Castaño-Moraga, C.A. Industry 4.0 and supply chain: A Systematic Science Mapping analysis. Technol. Forecast. Soc. Chang. 2022, 181, 121788. [Google Scholar] [CrossRef]
  2. Jun, W.K.; An, M.H.; Choi, J.Y. Impact of the connected & autonomous vehicle industry on the Korean national economy using input-output analysis. Technol. Forecast. Soc. Chang. 2022, 178, 121572. [Google Scholar]
  3. Bansal, P.; Kockelman, K.M. Are we ready to embrace connected and self-driving vehicles? A case study of Texans. Transportation 2018, 45, 641–675. [Google Scholar] [CrossRef]
  4. Guan, J.; Zhang, S.; D’Ambrosio, L.A.; Zhang, K.; Coughlin, J.F. Potential Impacts of Autonomous Vehicles on Urban Sprawl: A Comparison of Chinese and US Car-Oriented Adults. Sustainability 2021, 13, 7632. [Google Scholar] [CrossRef]
  5. Marletto, G. Who will drive the transition to self-driving? A socio-technical analysis of the future impact of automated vehicles. Technol. Forecast. Soc. Chang. 2019, 139, 221–234. [Google Scholar] [CrossRef]
  6. Çetin Er, C.; Ozcan, O. Urban and architectural spatial changes based on technology-adapted users: A literature review. Technol. Forecast. Soc. Chang. 2022, 182, 121783. [Google Scholar] [CrossRef]
  7. Kim, Y.S.; Woo, S.H.; Yoo, S.Y. Re-engineering for Export Logistics System of Autonomous Vehicle Distribution. J. Shipp. Logist. 2021, 37, 869–884. [Google Scholar]
  8. Pérez, J.E.; Romero, J.E.G.; Ramírez, C.M. Performance of the Car Carrier Shipping Sector in the Iberian Peninsula under the COVID-19 Scenario. J. Mar. Sci. Eng. 2021, 9, 1295. [Google Scholar] [CrossRef]
  9. Seo, J.H.; Gong, J.M.; Nam, T.H.; Yeo, G.T. Analyzing Efficiency of Korean Automobile Ports. J. Navig. Port. Res. 2017, 41, 127–136. [Google Scholar]
  10. Chen, X.; Li, F.; Jia, B.; Wu, J.; Gao, Z.; Liu, R. Optimizing storage location assignment in an automotive Ro-Ro terminal. Transp. Res. B Methodol. 2021, 143, 249–281. [Google Scholar] [CrossRef]
  11. Sun, X.; Wang, S.; Wang, Z.; Liu, C.; Yin, Y. A semi-automated approach to stowage planning for Ro-Ro ships. Ocean. Eng. 2022, 247, 110648. [Google Scholar] [CrossRef]
  12. Zhao, J.; Liang, B.; Chen, Q. The key technology toward the self-driving car. Int. J. Intell. Unmanned Syst. 2018, 6, 2–20. [Google Scholar] [CrossRef]
  13. Park, S.H.; Hwang, J.H.; Yang, H.J.; Kim, S.H. Simulation Modelling for Automated Guided Vehicle Introduction to the Loading Process of Ro-Ro Ships. J. Mar. Sci. Eng. 2021, 9, 441. [Google Scholar] [CrossRef]
  14. Park, S.H.; Hwang, J.H.; Yoon, S.H.; Kim, S.H. Automatic Guided Vehicles Introduction Impacts to Roll-On/Roll-Off Terminals: Simulation and Cost Model Analysis. J. Adv. Transp. 2022, 2022, 6062840. [Google Scholar] [CrossRef]
  15. Moon, D.S.H.; Woo, J.K. The impact of port operations on efficient ship operation from both economic and environmental perspectives. Marit. Policy Manag. 2014, 41, 444–461. [Google Scholar] [CrossRef]
  16. Min, H. Developing a smart port architecture and essential elements in the era of Industry 4.0. Marit. Econ. Logist. 2022, 24, 189–207. [Google Scholar] [CrossRef]
  17. Malmborg, C.J. Conceptualizing tools for autonomous vehicle storage and retrieval systems. Int. J. Prod. Res. 2002, 40, 1807–1822. [Google Scholar] [CrossRef]
  18. Gharehgozli, A.; Zaerpour, N.; Koster, R.D. Container terminal layout design: Transition and future. Marit. Econ. Logist. 2019, 22, 610–639. [Google Scholar] [CrossRef]
  19. Wang, P.; Mileski, J.P.; Zeng, Q. Alignments between strategic content and process structure: The case of container terminal service process automation. Marit. Econ. Logist. 2019, 21, 543–558. [Google Scholar] [CrossRef]
  20. Zhu, Y.; Geng, Y.; Huang, R.; Zhang, X.; Wang, L.; Liu, W. Driving Towards the Future: Exploring Human-Centered Design and Experiment of Glazing Projection Display Systems for Autonomous Vehicles. Int. J. Hum. Comput. 2023, 1–16. [Google Scholar] [CrossRef]
  21. Kavakeb, S.; Nguyen, T.T.; McGinley, K.; Yang, Z.; Jenkinson, L.; Murray, R. Green vehicle technology to enhance the performance of a European port: A simulation model with a cost-benefit approach. Transp. Res. Part. C Emerg. Technol. 2015, 60, 169–188. [Google Scholar] [CrossRef] [Green Version]
  22. Bahnes, N.; Relvas, S.; Haffaf, H. Cooperation between Intelligent Autonomous Vehicles to enhance container terminal operations. J. Innov. Digit. Ecosys 2016, 3, 22–29. [Google Scholar] [CrossRef] [Green Version]
  23. Bae, H.Y.; Choe, R.; Park, T.; Ryu, K.R. Comparison of operations of AGVs and ALVs in an automated container terminal. J. Intell. Manuf. 2011, 22, 413–426. [Google Scholar] [CrossRef]
  24. Kim, H.S.; Sun, I.S.; Anh, S.B. The Study on problems and solution of Automobile Loading and Unloading Process in Pyeongtaek Port. Asian J. Shipp. Logist. 2014, 30, 321–347. [Google Scholar]
  25. Kim, H.Y. A Comparative Analysis of the Efficiency of Automobile Export Ports in Korea and Japan. J. Korea Port. Econ. Assoc. 2017, 33, 73–82. [Google Scholar] [CrossRef]
  26. Choi, K.Y. A Research on the Factors for Selecting Pyeongtaek Port for Importation of Cars. J. Korea Port. Econ. Assoc. 2011, 27, 231–245. [Google Scholar]
  27. Ahn, S.S.; Lee, J.B.; Kim, J.J.; Sohn, Y.H.; Koo, H.M. A Study on the Design of the Import/Export Ports Cyber-Physical System for Intelligent Vehicle. J. Korea Acad. Ind. Coop. Soc. 2021, 22, 25–35. [Google Scholar]
  28. Keceli, Y.; Aksoy, S.; Aydogdu, V. A simulation model for decision support in Ro-Ro terminal operations. Int. J. Logist. Syst. Manag. 2013, 15, 338–358. [Google Scholar] [CrossRef]
  29. Iannone, R.; Miranda, S.; Prisco, L.; Riemma, S.; Sarno, D. Proposal for a flexible discrete event simulation model for assessing the daily operation decisions in a Ro–Ro terminal. Simul. Model. Pract. Theory 2016, 61, 28–46. [Google Scholar] [CrossRef]
  30. Özkan, E.D.; Nas, S.; Güler, N. Capacity Analysis of Ro-Ro Terminals by Using Simulation Modeling Method. Asian J. Shipp. Logist. 2016, 32, 139–147. [Google Scholar] [CrossRef] [Green Version]
  31. Muravev, D.; Aksoy, S.; Rakhmangulov, A.; Aydogdu, Y.V. Comparing model development in discrete event simulation on Ro-Ro terminal example. Int. J. Logist. Syst. Manag. 2016, 24, 283–297. [Google Scholar]
  32. Preston, G.C.; Horne, P.; Scaparra, M.P.; O’Hanley, J.R. Masterplanning at the Port of Dover: The Use of Discrete-Event Simulation in Managing Road Traffic. Sustainability 2020, 12, 1067. [Google Scholar] [CrossRef] [Green Version]
  33. Abourraja, M.N.; Kringos, N.; Meijer, S. Exploiting simulation model potential in investigating handling capacity of Ro-Ro terminals: The case study of Norvik seaport. Simul. Model. Pract. Theory 2022, 117, 102513. [Google Scholar] [CrossRef]
  34. Abourraja, M.N.; Rouky, N.; Kornevs, M.; Meijer, S.; Kringos, N. A simulation-based decision support framework devoted to Ro–Ro terminals: Design, implementation and evaluation. Comput. Ind. Eng. 2023, 180, 109248. [Google Scholar] [CrossRef]
  35. Belcore, O.M.; Di Gangi, M.; Polimeni, A. Connected Vehicles and Digital Infrastructures: A Framework for Assessing the Port Efficiency. Sustainability 2023, 15, 8168. [Google Scholar] [CrossRef]
  36. Todorrov, D.M. Ro-Ro Handbook: A Practical Guide to Roll-On Roll-Off Cargo Ships, 1st ed.; Cornell Maritime Press: Fort Lauderdale, FL, USA, 2016; pp. 1–240. [Google Scholar]
Figure 1. Parking space for vehicles in the yard of Pyeongtaek port and deck 6 layout of Glovis Splendor (source: author).
Jmse 11 01507 g001
Figure 2. Simulation model of the current loading system in Arena, complete version (source: the authors).
Jmse 11 01507 g002
Figure 3. Simulation model of the CAV-loading system in Arena, complete version (source: the authors).
Jmse 11 01507 g003
Figure 4. Simulation results for the CAV-loading system.
Jmse 11 01507 g004
Figure 5. Total operating costs for the current and CAV-loading systems (a) each year and (b) for 15 years. (Source: The Author).
Jmse 11 01507 g005
Figure 6. (a) Total CO2 emissions from the current and CAV-loading systems for 15 years; (b) annual CO2 emission costs for current and CAV-loading systems (source: author).
Jmse 11 01507 g006
Table 1. Previous research on RORO terminal simulation.
PaperSimulation FeatureTerminalSoftwareModel Scope
Keceli et al. [28]DESROROARENARORO terminal decision support system
Iannone et al. [29]DESROROARENARORO terminal performance evaluation: loading and storage under different operational alternatives
Ozkan et al. [30]DESRORONot statedRORO terminal capacity analysis: A simulation model for terminal operators and port planners
Muravev [31]DESROROARENA, AnyLogicRORO terminal simulation models: scalability, flexibility, and result accuracy comparison
Preston et al. [32]DESROROVissimMinimizing local impact and environment
Park et al. [13,14]DESROROARENAImpact evaluation of AGVs on RORO terminal operations
Abourraja et al. [33,34]DESRORONot statedRORO terminal performance analysis: resource allocation and layout planning emphasis
Belcore et al. [35]DESRORONot statedLandside operations efficiency under traffic variability
Table 2. Vehicle speed and safe following distance in the simulation model.
Yard (km/h)External Ramp (km/h)Safe Distance (m)
Drivers21.25–25.010–15
CAVs2515
Table 3. Simulation results for the current loading system.
 Average (s)Minimum
Average (s)
Maximum
Average (s)
Minimum
Value (s)
Maximum
Value (s)
5 s rule in area 1. Queue11.468111.181111.60460.0060.5316
5 s rule in area 2. Queue10.13389.901410.39860.0059.7461
5 s rule in area 3. Queue10.938310.702811.21570.0046.0921
5 s rule in area 4. Queue16.054515.169418.26070.00100.12
Drivers batching to shuttle van. Queue35.158434.472835.75740.00115.48
External ramp to Deck 5. Queue16.098915.430216.53550.0095.6040
Deck 5 to External ramp. Queue9.81358.910910.4750 0.0079.9543
Total loading time83,515.6083,094.0083,936.00  
Note: the longest average waiting time was attributed to the batch delivery of drivers by the shuttle van followed by the 5 s rule (source: the authors).
Table 4. Parameters of the cost model and their values.
Parameter DescriptionSymbolUnitValue
Liters of diesel consumed per 100 km by the van D l v a n 1 L/100 km12
Price per liter of diesel p d EUR/L1.24
Travel distance for a van per loading process t v a n km590
Total working hours per loading process h h26
Hourly pay for a stevedore p s v d EUR/h19
Hourly pay for a CAV operator p C A V EUR/h19
Number of loading processes per year n s -120
Number of stevedores n s v d Person16
Number of gangs n g a n g Group3
Number of CAV operators n o p Person6
Total service cost per van for a year s v a n EUR/year1000
Price per shuttle van p v a n EUR/vehicle150,000
Table 5. Intermediate parameters calculated using Equations (1)–(3), (11) and (12).
Parameter DescriptionSymbolUnitValue
Total energy cost of a van per loading process E v a n EUR 95
Total wages for stevedores per loading process W s v d EUR 494
Total wages for CAV operators per loading process W C A V EUR 494
Total CO2 emissions produced from the current loading system per loading process e m i s s c l s g596,490
Total CO2 emissions from the CAV-loading system per loading process e m i s s C A V g528,640
Table 6. Cash flows for the CAV- and current loading systems. These cash flows were calculated using Equations (4)–(10) in euros (EUR).
TCurrent Loading SystemCAV-Loading System
O t c l s C t c l s R t c l s O t C A V C t C A V R t C A V
02,859,840114,0002,973,840296,4000296,400
12,917,03702,917,037302,3280302,328
22,975,37802,975,378308,3750308,375
33,034,88503,034,885314,5420314,542
43,095,58303,095,583320,8330320,833
53,157,49403,157,494327,2500327,250
63,220,64403,220,644333,7950333,795
73,285,05703,285,057340,4700340,470
83,350,75803,350,758347,2800347,280
93,417,77403,417,774354,2250354,225
103,486,129138,9653,625,094361,3100361,310
113,555,85203,555,852368,5360368,536
123,626,96903,626,969375,9070375,907
133,699,50803,699,508383,4250383,425
143,773,49803,773,498391,0940391,094
153,848,96803,848,968398,9150398,915
Disclaimer/Publisher’s Note: The statements, opinions and data contained in all publications are solely those of the individual author(s) and contributor(s) and not of MDPI and/or the editor(s). MDPI and/or the editor(s) disclaim responsibility for any injury to people or property resulting from any ideas, methods, instructions or products referred to in the content.

