Article

Observation and Modeling of the Equilibrium Slope Response of a High-Energy Meso-Macrotidal Sandy Beach

1
UMR 5805 EPOC, Univ. Bordeaux, CNRS, Bordeaux INP, Allée Geoffrey Saint-Hilaire, CS 50023, 33615 Pessac, France
2
Service Hydrographique et Océanographique de la Marine (SHOM), 13 rue Chatelier, CS 92803, CEDEX 2, 29228 Brest, France
*
Author to whom correspondence should be addressed.
J. Mar. Sci. Eng. 2023, 11(3), 584; https://doi.org/10.3390/jmse11030584
Submission received: 17 February 2023 / Revised: 2 March 2023 / Accepted: 6 March 2023 / Published: 9 March 2023

Abstract

:
Beach slope is a critical parameter to, e.g., beach safety, wave reflection at the coast and longshore transport rate. However, it is usually considered as a time-invariant and profile-average parameter. Here, we apply a state-of-the-art equilibrium model to hindcast beach slope variability from the time scales of days to years at the high-energy meso-macrotidal sandy beach of Truc Vert, southwest France. We use 9 years of bimonthly beach surveys to compute beach slope time series at different elevations. Results show that beach slope exhibits an equilibrium response with contrasting behaviors along two distinct areas of the beach profile. From 0 to 2 m above mean sea level, which is located under the berm crest, a slope response predominantly at the storm time scale is observed. The beach slope steepens under low energy waves, with the equilibrium model explaining up to 40% of the observed beach slope variability. In contrast, from 2.5 to 4 m above mean sea level, which is above the berm crest, the beach slope steepens under high-energy waves. Within this region of the beach profile, the response time scale increases upwards from seasonal (~2.5 m) to seasonal (~4 m), with the model explaining up to 65% of the observed beach slope variability. Such behaviors are found to be enforced by the berm dynamics developing from the end of the winter to early autumn, providing new perspectives to model and predict beach slope on sandy beaches.

1. Introduction

Sandy beaches occupy approximately one-third of the global ice-free coastline [1] and provide precious natural, structural and socio-economical resources to coastal communities [2,3]. Sandy beaches are, however, threatened by climate-change-driven sea-level rise [4,5], combined with other factors such as the natural shortage of sediment supply and human activities interfering with natural processes [1]. Monitoring, understanding, modeling and predicting sandy beach evolution is therefore of great importance.
Amongst other beach morphology parameters, beach slope is critical from many perspectives. For instance, beach slope largely impacts wave breaking type and intensity, from spilling to surging, through plunging [6,7,8]. Beach slope is thus important for, e.g., beach safety and lifeguarding as plunging and dumping waves at the shoreline (shore-break waves) at steep beaches can cause severe spine injuries to those caught in the impact zone [9,10,11]. Beach slope controls the reflection at the coast of gravity and infragravity waves [12], and is also a critical parameter in many empirical and semi-empirical formulas used to estimate, e.g., wave runup [13] and longshore drift [14]. In such formulae, beach slope is typically assumed as a single time-invariant parameter. However, beach slope is not homogenous along the beach profile and constantly evolves in response to the storm, seasonal and interannual variations in incident wave conditions. Such beach slope time and space variability is still poorly understood.
The work of Wright and Short [15], based on earlier seminal studies (e.g., [16,17,18]), classified different beach types into a comprehensive single-bar beach state model. This classification goes from a reflective (steep) beach state to a dissipative (gently sloping) beach state, all the way through a range of intermediate, barred, beach states. Although this classification has been mostly used as a “static” classification for modal wave conditions [19], a fundamental aspect was the development of a framework addressing dynamic beach state behavior [18]. In brief, the transitions between the different beach types were found to be driven by a disequilibrium between the surf-zone hydrodynamics and the beach [20], thus indicating a dynamic equilibrium behavior of beach states and, presumably, beach slope.
Equilibrium-based models have been developed over the last few decades to explain the time evolution of different beach parameters. Such a computationally cheap modeling approach has been primarily used to simulate and explain shoreline change from the time scales of storms to years and decades [21,22,23,24] (see review of [25]). Although such models perform substantially better using time-varying free parameters [26,27], good results were obtained both for shoreline hindcasting [22,28,29] and forecasting [30] using time-invariant parameters. Such models have also been applied to different shoreline proxies at meso- to macro-tidal beaches showing a large variability in model skill and free parameter values along the beach profile [22,24]. It is noteworthy that equilibrium models also showed a good ability to reproduce the time variability of cross-shore sandbar behavior [31], embayed beach rotation [32], or grain size [33,34]. However, to our knowledge equilibrium models have never been tested on beach slopes.
In this paper, we investigate the beach slope equilibrium response at the high-energy meso-macrotidal beach of Truc Vert, southwest France. Using 9 years of bimonthly topographic surveys, we apply a state-of-the-art equilibrium model to explore model skill for beach slopes computed across different sections of the beach profile, from mid-tide up to the surbaerial beach. We show that two distinct sections of the profile show a clear out-of-phase equilibrium response, thus opening new perspectives to model and predict beach slope on sandy beaches.

2. Study Site and Data

2.1. Truc Vert Beach

Truc Vert is an open sandy beach located on the Gironde coast, southwest France (Figure 1a). It is a remote beach located kilometers away from the first carpark, which has never been nourished or affected by hard structures and tourism. Such settings motivated the deployment of a number of intensive field experiments [35] as well as the development of a monitoring program which started in 2003 [36].
Truc Vert beach is mostly intermediate double-barred and backed by a well-developed aeolian dune (~20–25 m high and ~250 m large) separating the beach from a large area of state-owned forest (Figure 1b). The tidal range is meso-macrotidal, with a ~3.7 m annual mean spring tidal range and a maximum astronomical tide range reaching up to 5 m [37]. Incident waves are generated by extra-tropical storms tracking eastwards across the North Atlantic Ocean. The wave climate is energetic and strongly seasonally modulated with a monthly averaged significant wave height Hs ranging from 1.1 m in July with a dominant W–NW direction to 2.4 m in January with a dominant W direction [38]. Incident winter wave energy shows large interannual variability enforced by regional, large-scale, climate modes of atmospheric variability [37]. Truc Vert can be exposed to severe windstorms, with 10 m hourly wind speed exceeding 30 m/s, causing large coastal dune morphological changes [39]. The sediment consists of well-mixed fine to medium sand with a mean grain size of approximately 0.35–0.40 mm [40]. Over the last few decades, the shoreline position at Truc Vert has been relatively stable [37].

2.2. Beach Slope Data

This study is based on the Truc Vert beach GNSS topographic monitoring program that was implemented in 2003 [36]. The beach survey’s alongshore coverage prior to 2012 was shorter than 1000 m, thus not offering optimal coverage given the strongly alongshore non-uniform beach morphology enforced by ~400 m spaced rip channel systems. Therefore, here, we used the data collected between 2012 and 2021 (1500–2000 m alongshore coverage), with a notable 2-month gap in 2020 due to the COVID-19 pandemic. Beach surveys typically extend from approximately a −1.5 m (low tide mark) to 6 m (dune foot) elevation above mean sea level (AMSL). Each topographic survey is interpolated on a regular grid in local cross-shore/longshore coordinates. The reader is referred to [36] for details on the topographic surveys and interpolation techniques.
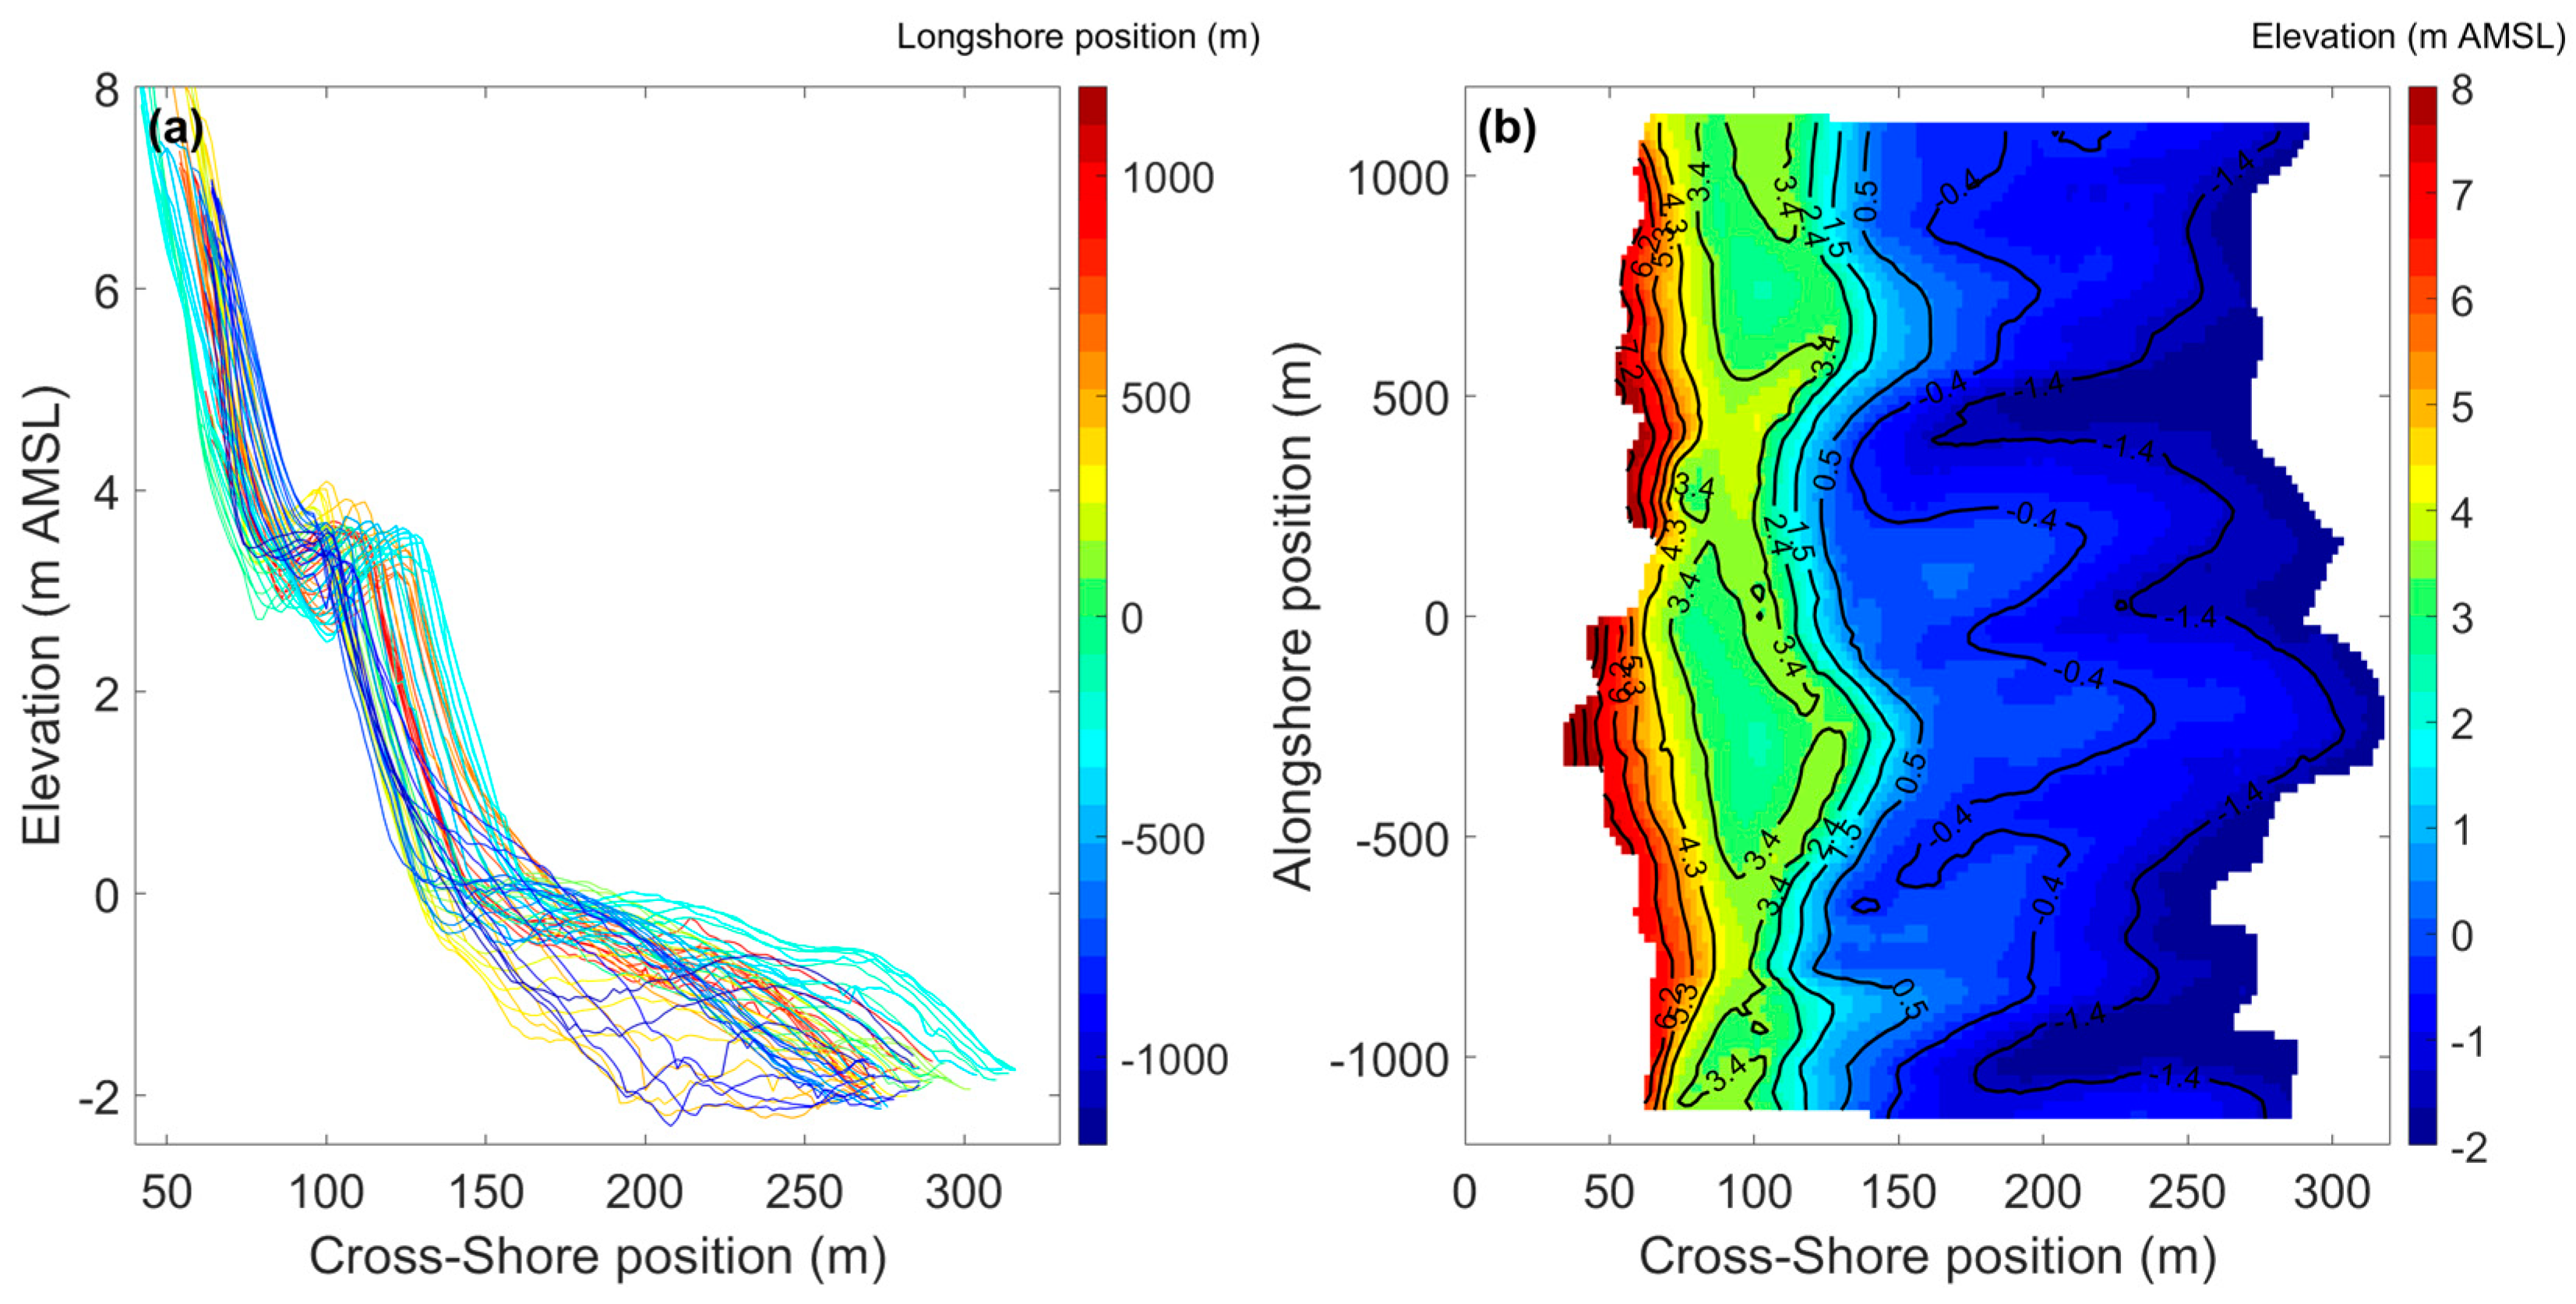
The monitoring program from October 2010 to June 2021 resulted in 181 digital elevation models (DEM) computed in local cross-shore/longshore coordinates. Figure 2 shows an example of a topographic survey (Figure 2b) and its corresponding superimposed 20 m spaced interpolated cross-shore profiles (Figure 2a), highlighting a large alongshore variability. Beach slopes were computed on 1 m elevation sections every 0.1 m (i.e., [−1.0;0.0], [−0.9;0.1], …, [5.0;6.0]) of each 20 m alongshore spaced interpolated beach profile. This segmentation was based on preliminary tests showing it best emphasizes the vertical variability of beach slope response. For each date and each 1 m elevation section, beach slopes computed at each 20 m spaced cross-shore transect were then averaged alongshore in order to investigate the equilibrium response of beach slope for different parts of the beach profile.

2.3. Wave Data

This study used approximately 13.5 years of continuous wave outputs gathered from a calibrated wave hindcast from January 2008 to June 2021 [28,29]. We used the time series of significant wave height (Hs), peak period (Tp) and mean direction (Dm) at an approximately 54 m depth offshore of Truc Vert beach [28,29]. These data were then used to force the equilibrium model with a 3-hour time step.

3. Equilibrium Profile Model

3.1. Equilibrium Model

The local beach slope time series was hindcast using the equilibrium model approach of [41], which so far has been mostly used to simulate shoreline change on cross-shore-transport-dominated beaches. The time change of local beach slope, S, is given as a function of the time-varying, wave power P and energy disequilibrium Δ Ω :
d S d t = C ± P 0.5 Δ Ω   ,
where C ± is the change rate coefficient for erosion velocity ( C ) and accretion velocity ( C + ), which represent efficiency rates determining the rate of beach slope change in response to the wave force. Δ Ω = Ω Ω e q is the energy disequilibrium, with Ω being the Dean number given by:
Ω = H s w s T p   ,
where w s is the sediment fall velocity calculated using Soulsby’s (1997) formula [42]. The equilibrium energy, Ω e q , is computed through:
Ω e q t = j = 0 2 Φ / Δ t Ω j 10 j Δ t / Φ j = 0 2 Φ / Δ t 10 j Δ t / Φ   ,
with Δ t being the sampling interval and Φ being the memory decay of the system, in days. This implies that Ω e q incorporates all past beach state information for the past 2Φ days and constantly evolves in time and maintains a weighted “memory” of antecedent incident wave conditions.
The wave power in Equation (1) is given by:
P = E C g   ,
where E is the wave energy given by:
E = 1 16 ρ g H s 2   ,
with ρ being the water density, g the gravitational acceleration and C g the wave group velocity computed using the wave linear theory:
C g = ω k 1 2 + k h 2 sin h 2 k h   ,
where ω is the angular frequency of waves, k is their wavenumber and h the water depth.

3.2. Model Parameter Optimization

The model has four free parameters, S0 the initial slope, Φ, C and C+, that were found by minimizing the root mean square error between the computed and measured beach slopes. The error minimum was found using a simulated annealing non-linear optimization algorithm [43]. Such a probabilistic approach can overcome local RMSE minima in this 4-parameter space and find a global optimum. Simulating annealing optimization already gave good results with beach equilibrium models [22,24]. Table 1 shows the search intervals used to initialize the optimization algorithm, for each free parameter. The model was initialized with broad intervals (including positive and negative erosion and accretion rates) in order to be able to find the optimal values corresponding to all the sections of the beach profile, which readily show a large range of behaviors. The simulated annealing was performed over 3,000,000 iterations.

4. Results

4.1. Beach Profile Change in Time and Space

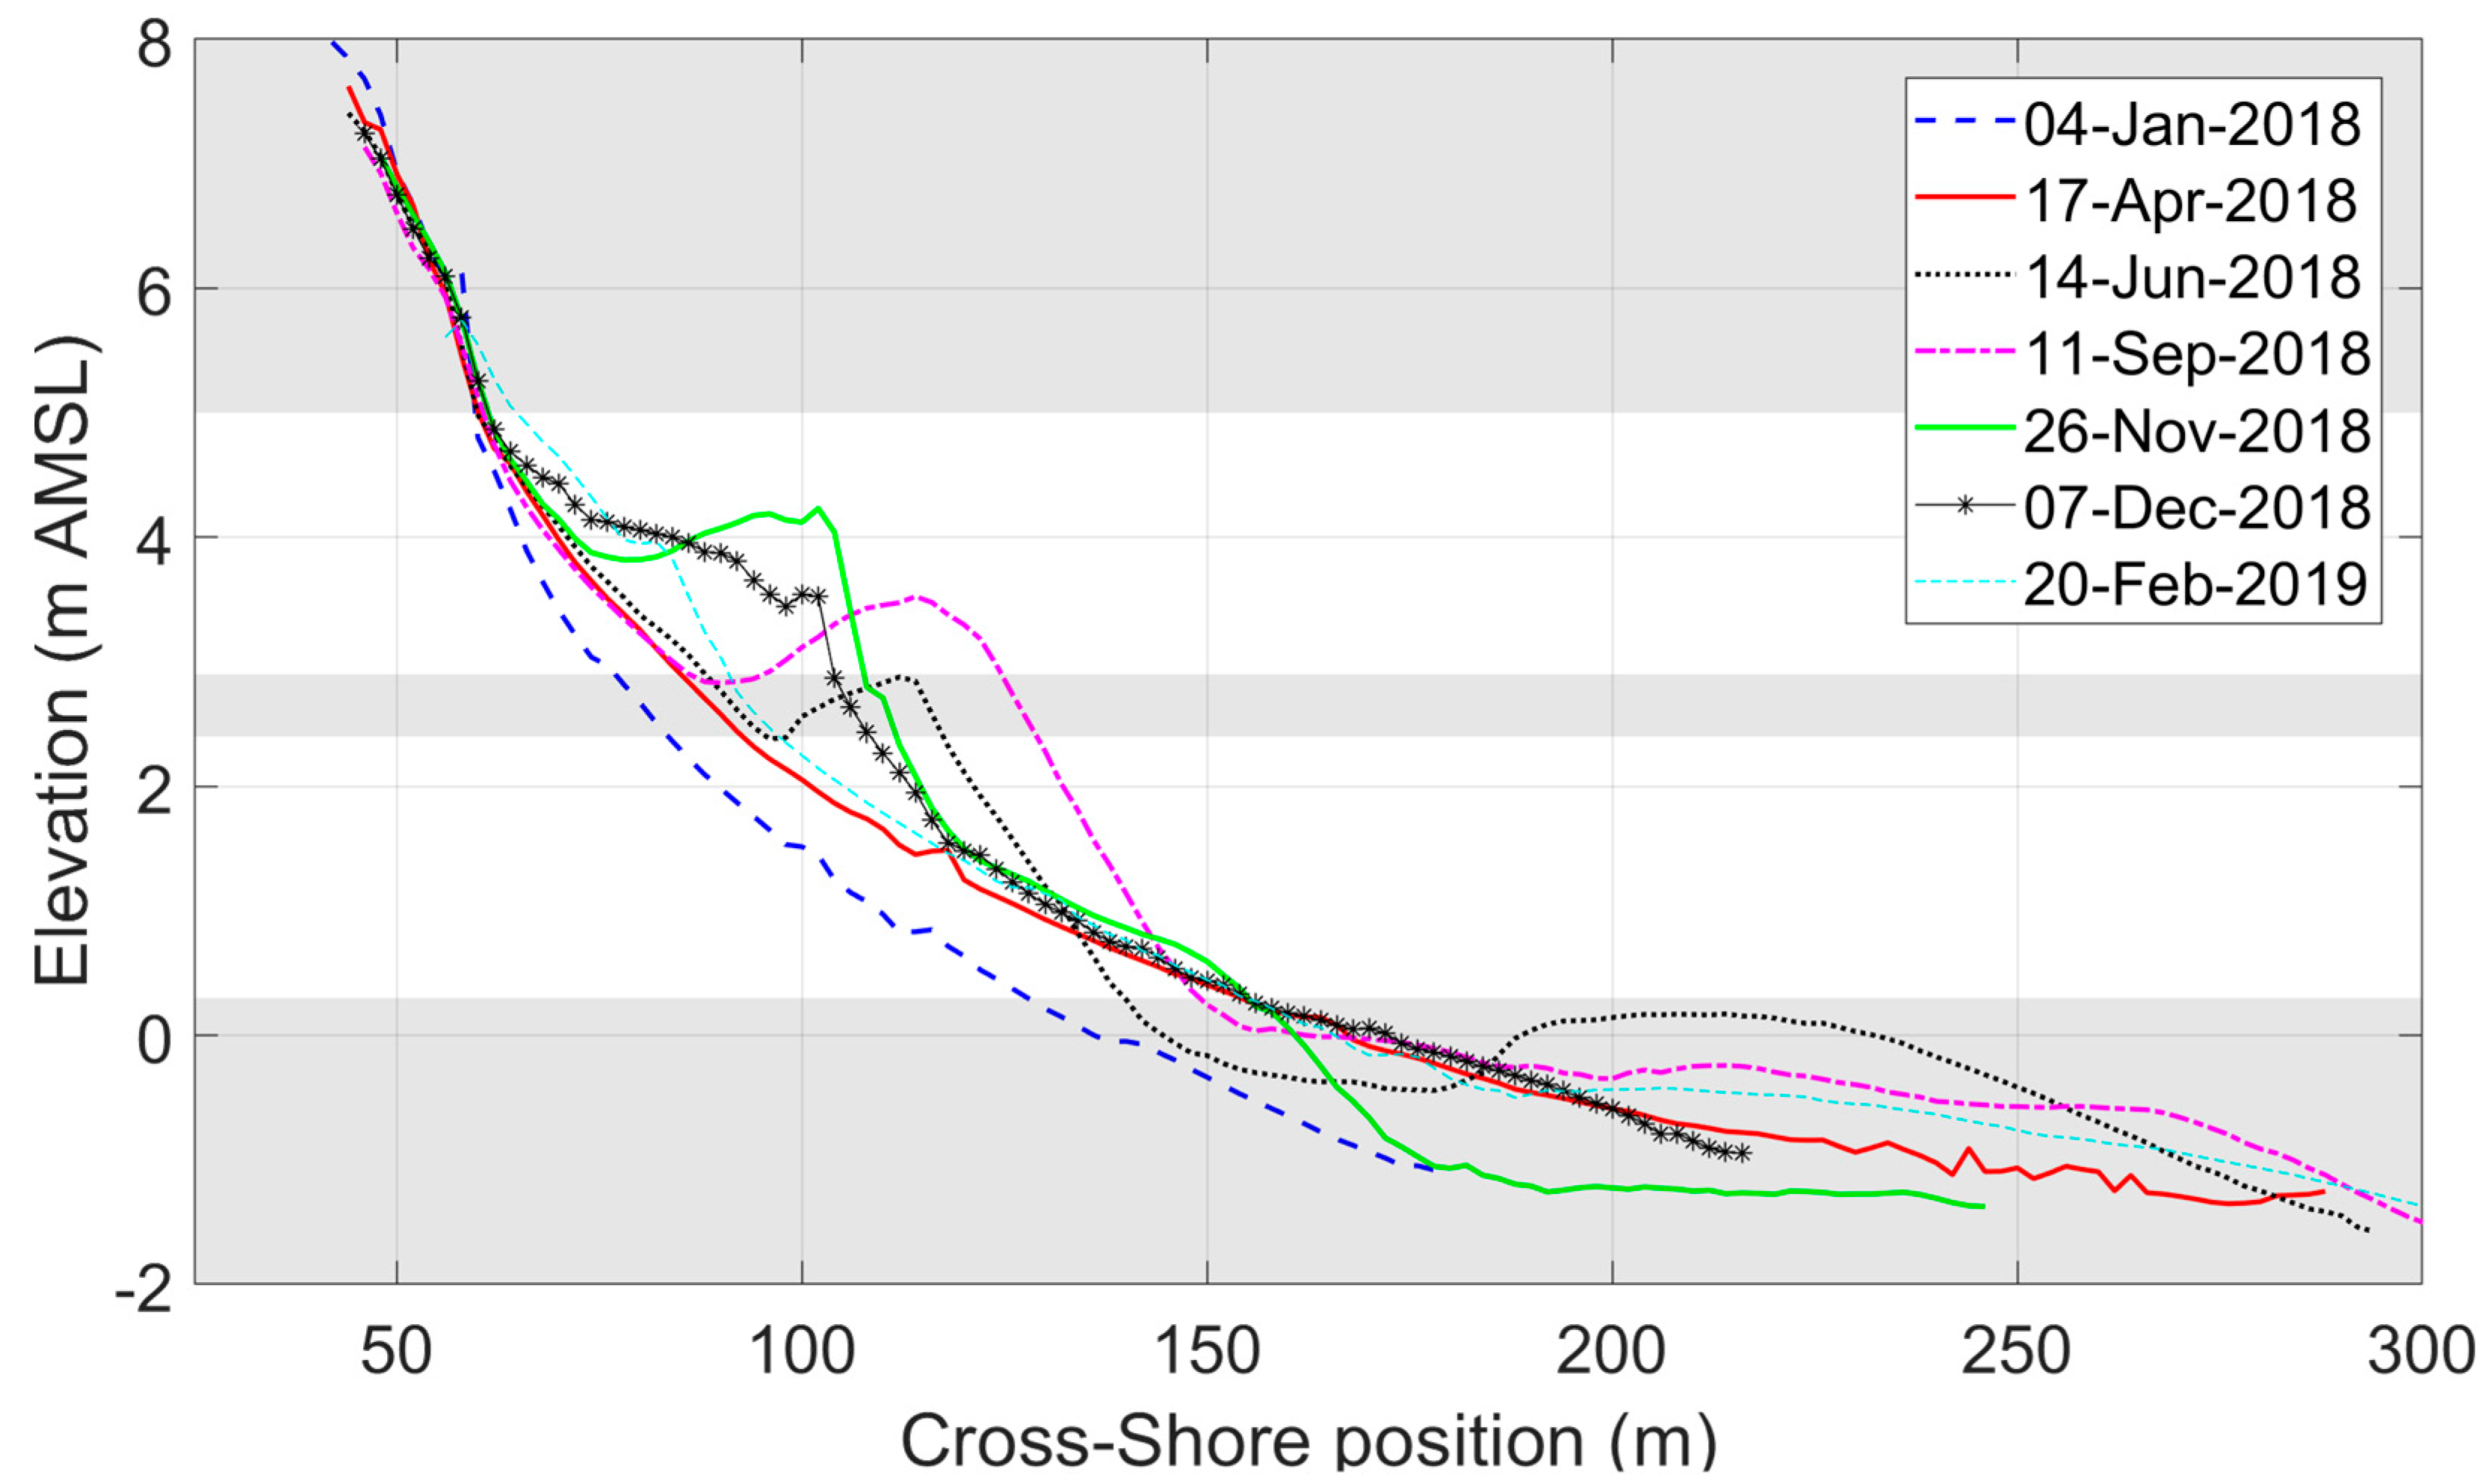
Figure 3 illustrates the seasonal beach profile shape change at a given transect over a given year. Starting from an eroded, featureless, concave shape profile in the middle of the winter (January 2018), results show the progressive building of berm throughout spring, summer and early autumn before the berm is smoothed out during the subsequent winter. The berm formed at a cross-shore distance around 100 m, and rose by over two meters before culminating at 4+ m AMSL in early autumn, making this section of the profile the most dynamic. The higher part of the profile (>5 m AMSL) is steep and barely evolves. In contrast, the lower part of the profile is systematically gently sloping owing to the overall concave shape of the beach profile. There is also the occasional presence of the inner bar (June 2018, Figure 3).
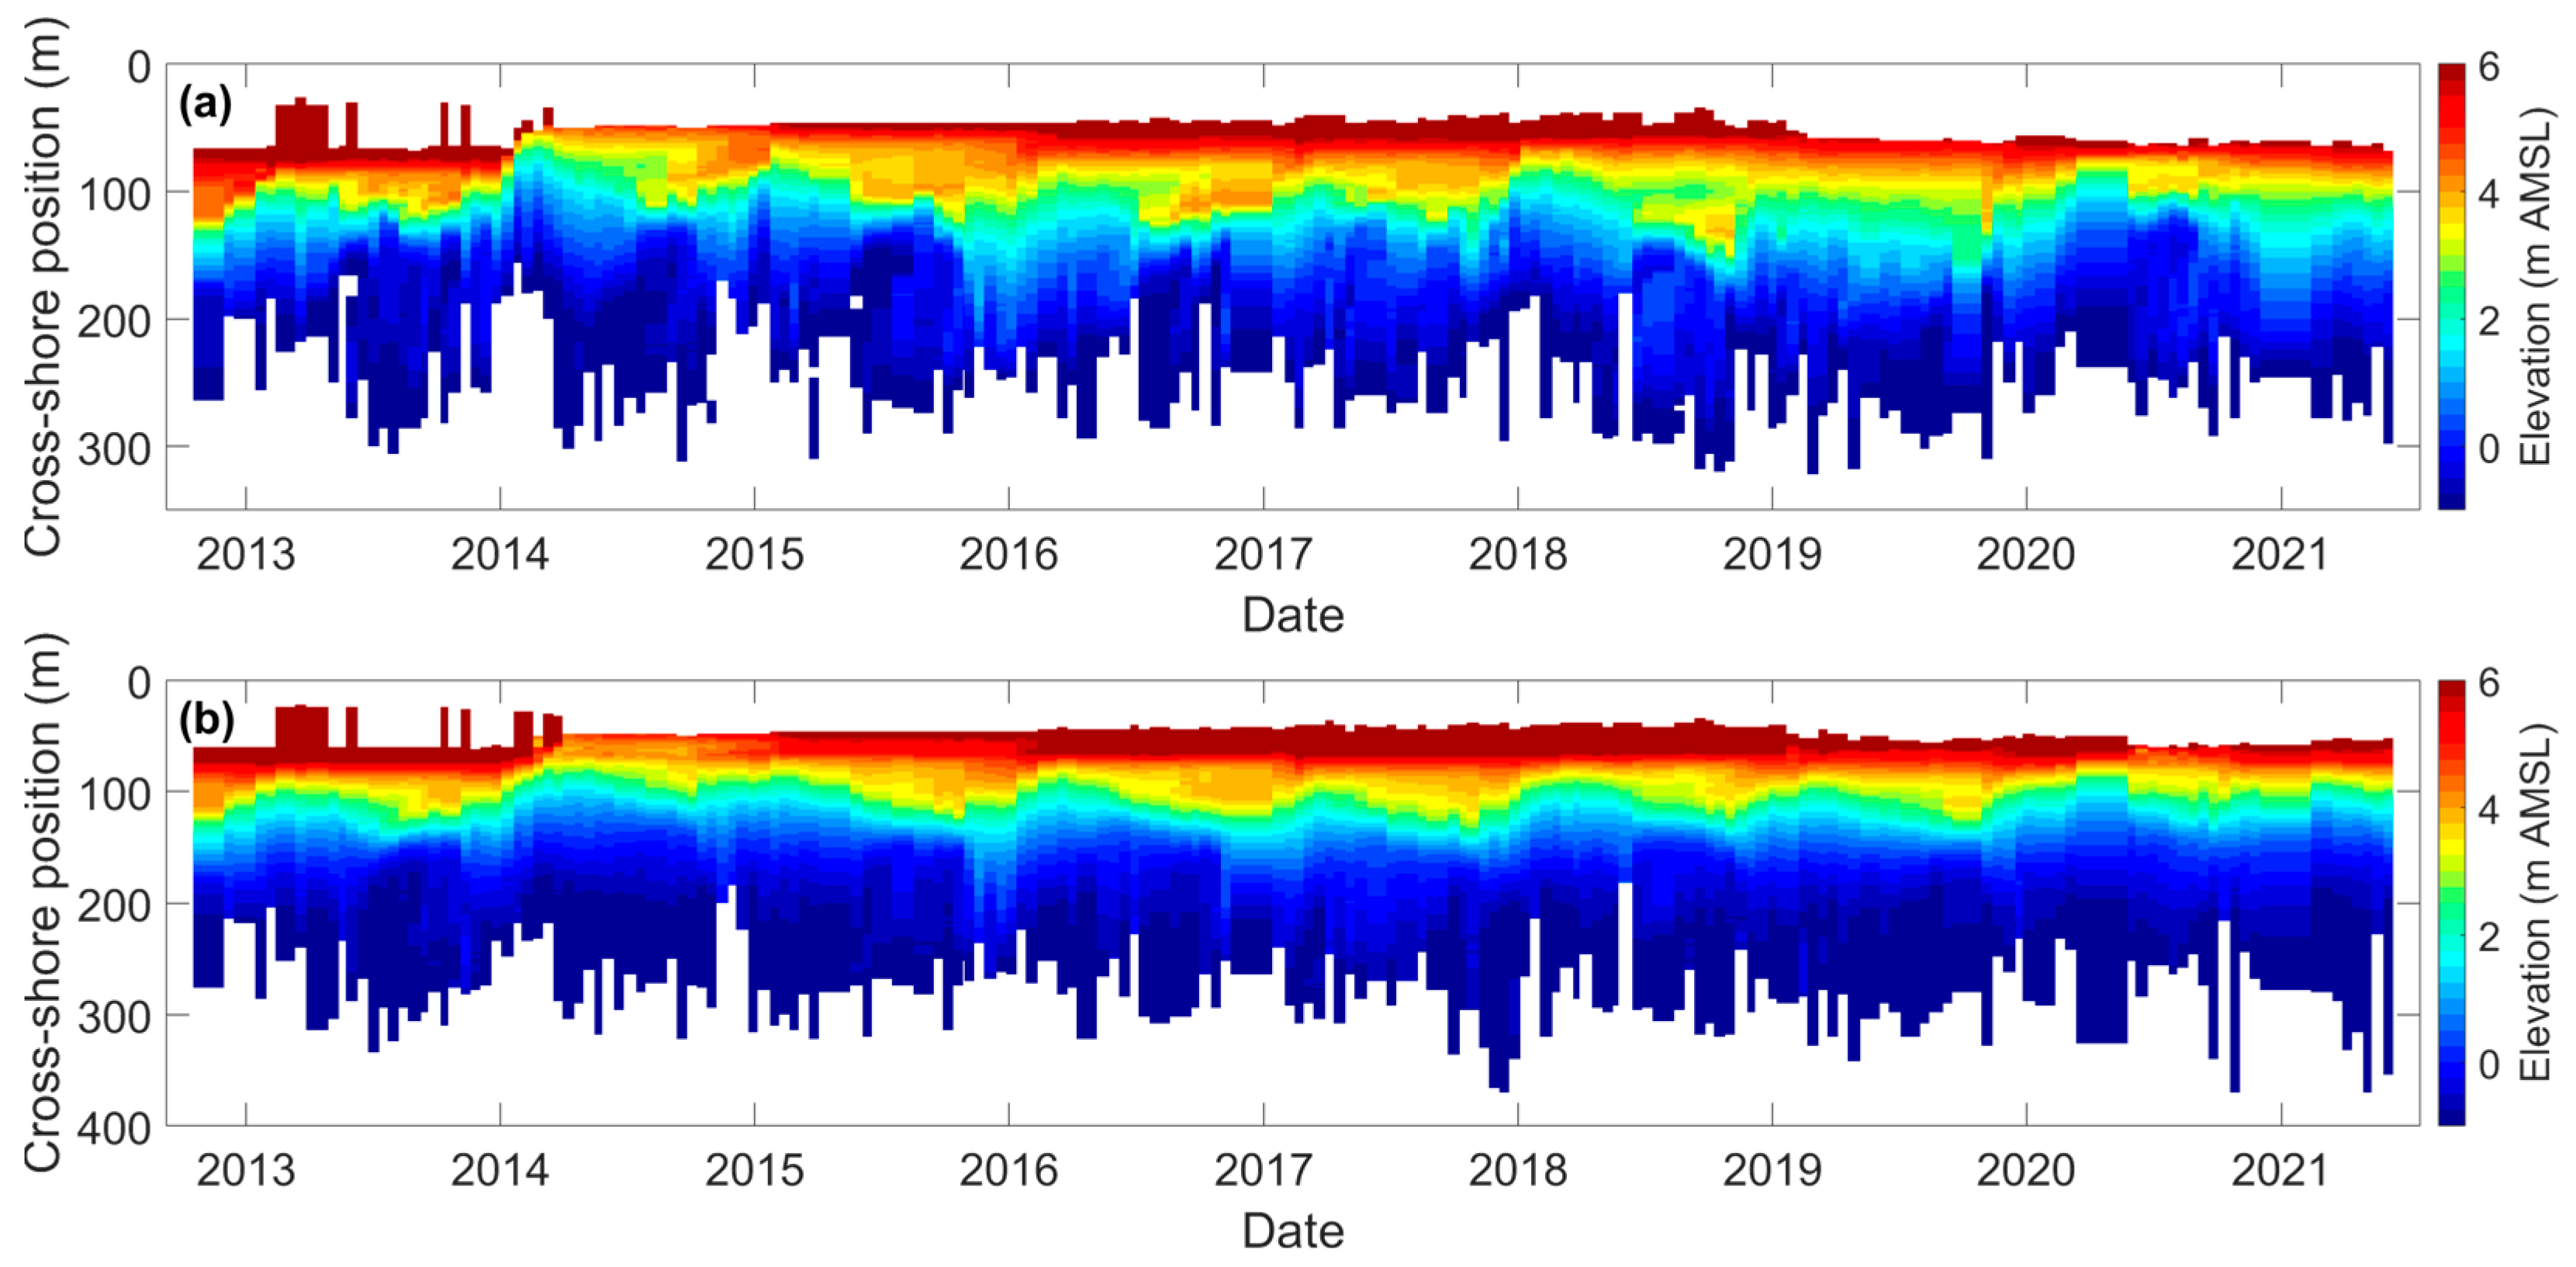
Figure 4 provides more insight into the beach profile variability from the time scales of weeks, to interannual, through seasonal. A clear seasonal signal can be depicted, particularly in the berm area described in Figure 3. Figure 4 also reveals a strong interannual variability, which is marked by the winter of 2013/14 which caused outstanding erosion. This is particularly striking for the upper part of the beach profile as the dune toe was severely scarped during this winter and has been mostly, slowly, recovering since then. Non-surprisingly, the time series of the alongshore-averaged profiles (Figure 4b) shows a smoother variability than that of the single profile (Figure 4a). These morphological changes are essentially driven by temporal changes in incident wave conditions, which are used to drive the equilibrium model below.

4.2. Equilibrium Beach Slope Response

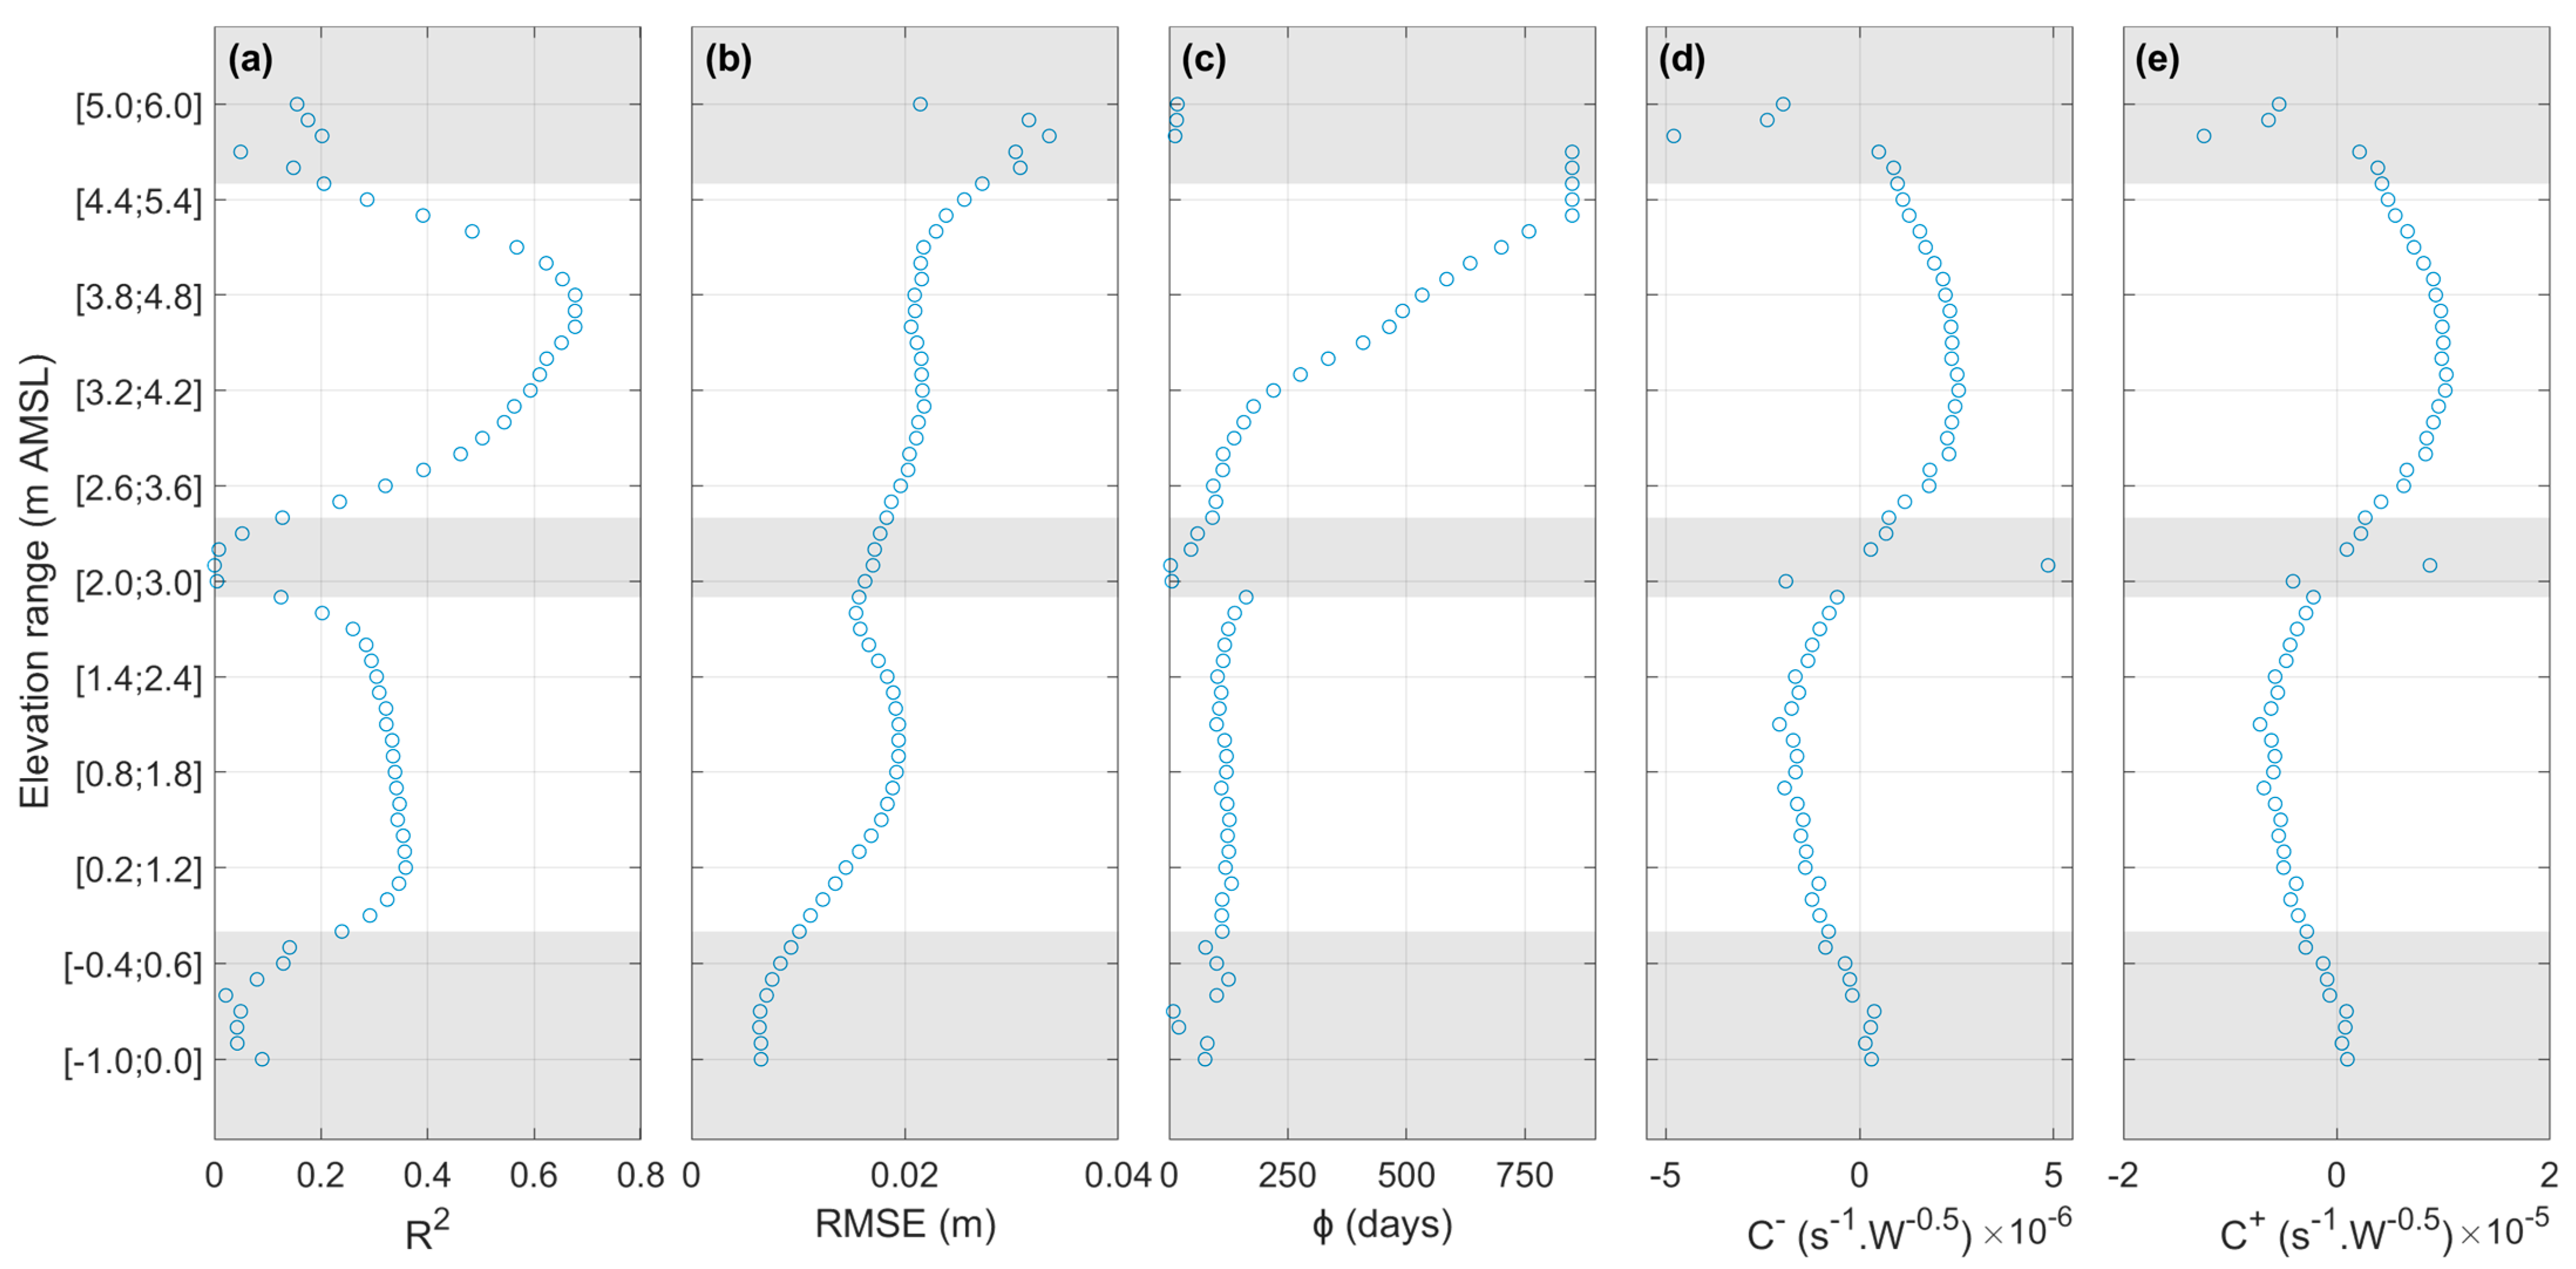
Figure 5 shows the equilibrium model skill to simulate beach slope response (Figure 5a,b) and the corresponding model free parameters (Figure 5c–e) as the function of the beach elevation where the slope is computed. There is large variability in the ability of the model to hindcast beach slope response depending on elevation. However, two distinct areas where R2 is > 0.2 can be depicted (white areas in Figure 5), i.e., where the model explained more than 20% of the observed beach slope variability. For the area in the lower part of the profile, R2 mostly ranges between 0.3 and 0.4, with Φ < 150 days and negative erosion and accretion rate coefficients. This means that the beach slope in this region of the profile shows fair equilibrium response characteristics, with slope changes at the scale of individual storms and with the slope steepening (flattening) during low- (high-)energy waves. This contrasts with the other area, located in the higher part of the profile (Figure 5). Overall, the equilibrium model shows better skill than in the lower area, with R2 even locally exceeding 0.65. Beach slope also shows a slightly larger response rate, with positive values, meaning that the slope steepens (flattens) during high- (low-)energy waves, i.e., out-of-phase with the lower part. Interestingly enough, within this higher area, beach memory Φ rapidly increases upwards, eventually reaching the upper value of Φ = 850 days. This means that beach slope variability tends to predominate at seasonal scale when going upwards, rather than at the storm scale.
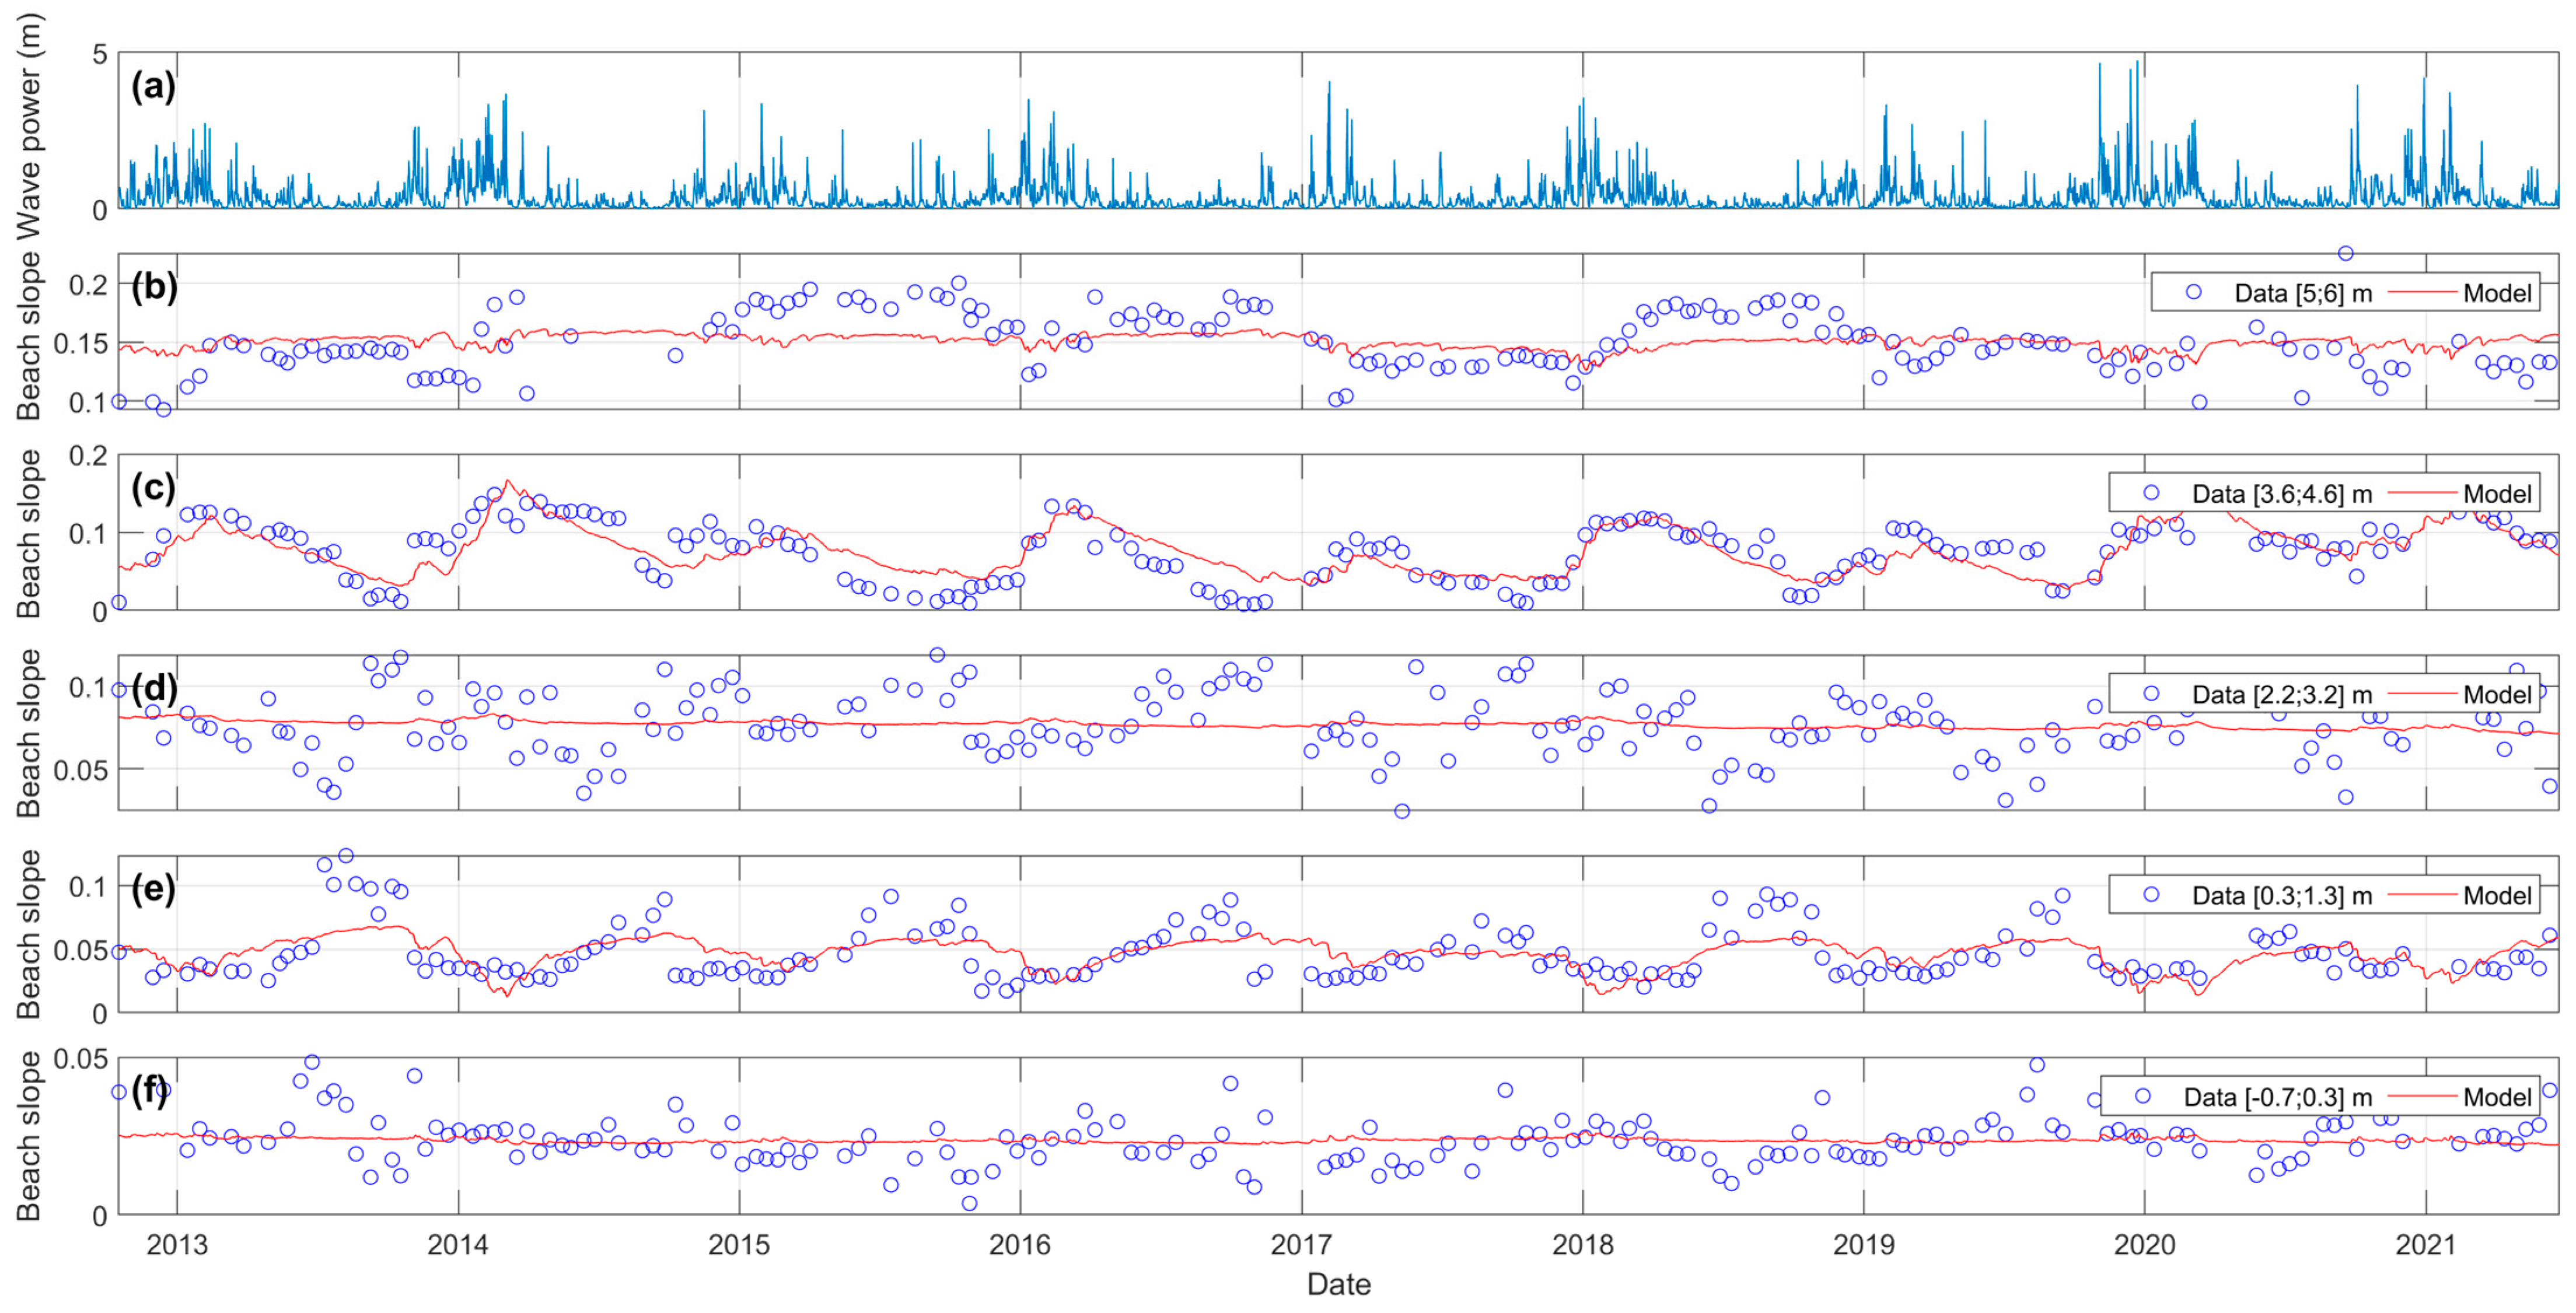
This is further illustrated in Figure 6 which shows the time series of observed and modeled beach slopes at five different vertical locations along the profile. In line with the greyish areas in Figure 5 where R2 < 0.2, the model fails to simulate beach slope variability at these locations (Figure 6b–d). In contrast, the model shows fair skill at the lower part of the profile (Figure 6e), and behaves even better in the higher part of the profile (Figure 6c). In line with accretion/erosion rate coefficients of the opposite sign in Figure 5, the areas clearly show out-of-phase beach slope signals, with beach slope in the higher part being approximately twice as large as in the lower part.

5. Discussion

Consistent with other sandy beach morphological indicators, such as shoreline, cross-shore sandbar position or grain size [31,32,33], beach slope also shows a clear equilibrium response to changes in incident wave conditions. On the meso-macrotidal beach of Truc Vert, southwest France, such a response strongly depends on the beach elevation around which slope is computed, consistent with earlier work using different shoreline proxies [22,44]. The best equilibrium response is found in the higher part of the profile, around 4 m AMSL, that is, well above the highest astronomical tide level (~2.5 m AMSL). This may be seen as a surprising result, which will be discussed later, as this region of the beach profile is only rarely activated by surf zone processes and could be assumed to be decoupled from wave force. At this elevation, the equilibrium model explains over 65% of the observed beach slope variability. This is similar to the shoreline variance explained by the equilibrium model for the optimal shoreline proxy at Truc Vert of around 1.5 m AMSL. Our results therefore demonstrate that equilibrium models can be successful at simulating beach slope variability from the time scales of days to years, with similar skill as for shoreline hindcasting.
In contrast with the shoreline equilibrium response at Truc Vert beach, with a single area of consistent equilibrium shoreline response ranging approximately from 0 to 4 m AMSL, beach slope response shows two distinct opposing areas ranging approximately from 0 to 2.5 m AMSL and 3 to 4.5 m AMSL (Figure 5). The lower part of the profile responds at the storm scale, with the slope decreasing with larger waves. This is in line with existing beach state models [45,46] with more dissipative, gently sloping, beach profiles under storm conditions. In contrast, the higher part of the profile steepens with larger waves and increasingly responds by moving upwards at the seasonal time scale (increased memory Φ). Such opposing behavior can be explained by the berm dynamics. The area below 2 m AMSL is systematically under the crest of the berm and reflects the beach slope response to incident wave conditions during the daily high stage of the tide. The area ranging from 3 to 4.5 m AMSL, located higher along the profile, is systematically steeper during winter (Figure 3). This is because during winter storm wave events, surf zone and swash zone processes smooth out the berm, resulting in a featureless concave winter profile (Figure 3). However, during berm development from spring to early autumn, thus with a seasonal signature, this sector is located in the lee of the berm crest built up through swash processes, resulting in a progressively decreasing beach slope as seasonal mean wave conditions become less energetic. This explains why the best equilibrium response is found in the higher part of the profile, well above the highest astronomical tide level of around 4 m AMSL. Between these two areas forming a transition between two contrasting behaviors, beach profile does not show an equilibrium response. Similar observations can be made at the higher (>4.5 m AMSL) and lower (<0 m) parts of the profile, where a poor correlation is systemically found, for different reasons. Above 4.5 m AMSL, the beach slope is steep (>0.1) and evolves without any apparent link with incident wave conditions (Figure 6b). In contrast, below 0 m AMSL, the beach slope is low (<0.05) and also shows variations which are not always readily related to changes in incident wave energy. This is consistent with shoreline response at this elevation [22], because this part of the profile is strongly influenced by the inner-bar dynamics. Given that the cross-shore inner-bar dynamics at Truc Vert beach are influenced largely by tide-range variations [47], this is not captured by the equilibrium model. Such findings suggest that an alternative approach could be to develop an equilibrium berm response model rather than a multiple, elevation-dependent, equilibrium beach slope model, such as that developed here.
In our contribution, we only applied an equilibrium model based on that developed for the shoreline by [41]. However, different equilibrium response frameworks exist [21,22,29,48,49]. The model of [21] was also tested here, showing similar skill. However, the interpretation of the model free parameters is more complex [50], and outputs were thus not shown herein. We used time-invariant free parameters, but we hypothesize that investigating time-varying parameters, such as in [27], may further improve model skill. Another avenue for model improvement is to account for tide range, as berm development was found to depend on spring-neap tide cycles at the microtidal beach of Narrabeen, Australia, using high-frequency Lidar data [51]. We assumed a sediment grain size constant in both time and space. However, large variations (0.2–0.7 mm) in grain size over tens of meters linked with morphological variability have been observed at Truc Vert [40]. In addition, grain size has been found elsewhere to largely vary in time in response to changes in wave conditions [34]. Including changes in grain size could improve beach slope model skill, but there is currently no framework for this. Finally, given the wealth of long-term beach monitoring programs [52,53,54,55], applying such a model to different sites to search for a parametrized version of the free parameters, similar to what [23] did for shoreline, would help to better understand the influence of the general settings (e.g., sediment size, wave climate, tide regime) on beach slope response.

6. Conclusions

Beach slope is usually considered as a time-invariant and profile-average parameter. By applying a simple equilibrium model to a 9-year time series of bimonthly beach surveys of a high-energy meso-macrotidal beach, we found that beach slope can locally exhibit a strong equilibrium response. A state-of-the-art equilibrium model and a global optimization simulating annealing algorithm were combined to reveal two distinct areas with contrasting behaviors. First, at 0–2 m AMSL, below the berm crest, equilibrium slope response was found at the storm timescales, with slope steepening under low energy waves. At 2.5–4 m AMSL, above the berm crest, an opposite behavior was observed, with the equilibrium response time scale moving increasingly, seasonally, upwards. This study provides new perspectives to better understand, model and predict beach slope and sandy beaches. It also motivates the further development of beach monitoring programs.

Author Contributions

Conceptualization, B.C.; methodology, C.L., B.C., V.M. and S.B.; software, V.M. and C.L.; validation, B.C., V.M. and C.L.; formal analysis, C.L. and V.M.; investigation, S.B.; resources, B.C. and V.M.; writing—original draft preparation, C.L.; writing—review and editing, B.C., V.M., C.L. and T.G.; visualization, C.L. and V.M.; supervision, B.C., V.M. and T.G. All authors have read and agreed to the published version of the manuscript.

Funding

C.L. PhD funded by project MEPELS (contract number 19CP06, Shom/DGA). Truc Vert beach monitoring program financially supported by Observatoire Aquitain des Sciences de l’Univers (OASU), Observatoire de la Côte de Nouvelle-Aquitaine (OCNA) and Service National d’Observation (SNO) Dynalit.

Institutional Review Board Statement

Not applicable.

Informed Consent Statement

Not applicable.

Data Availability Statement

The Truc Vert beach monitoring data and wave forcing time series used herein are publicly available at [29,36], respectively.

Acknowledgments

We thank all colleagues and students who helped surveying the beach of Truc Vert. We also thank Mark Davidson and an anonymous reviewer for their constructive comments which helped improving the manuscript.

Conflicts of Interest

The authors declare no conflict of interest.

References

  1. Luijendijk, A.; Hagenaars, G.; Ranasinghe, R.; Baart, F.; Donchyts, G.; Aarninkhof, S. The State of the World’s Beaches. Sci. Rep. 2018, 8, 6641. [Google Scholar] [CrossRef] [PubMed]
  2. Nunes, P.A.L.D.; Ghermandi, A. The Economics of Marine Ecosystems: Reconciling Use and Conservation of Coastal and Marine Systems and the Underlying Natural Capital. Environ. Resour. Econ. 2013, 56, 459–465. [Google Scholar] [CrossRef] [Green Version]
  3. Poumadère, M.; Bertoldo, R.; Idier, D.; Mallet, C.; Oliveros, C.; Robin, M. Coastal Vulnerabilities under the Deliberation of Stakeholders: The Case of Two French Sandy Beaches. Ocean Coast. Manag. 2015, 105, 166–176. [Google Scholar] [CrossRef] [Green Version]
  4. Vousdoukas, M.I.; Ranasinghe, R.; Mentaschi, L.; Plomaritis, T.A.; Athanasiou, P.; Luijendijk, A.; Feyen, L. Sandy Coastlines under Threat of Erosion. Nat. Clim. Chang. 2020, 10, 260–263. [Google Scholar] [CrossRef]
  5. Cooper, J.A.G.; Masselink, G.; Coco, G.; Short, A.D.; Castelle, B.; Rogers, K.; Anthony, E.; Green, A.N.; Kelley, J.T.; Pilkey, O.H.; et al. Sandy Beaches Can Survive Sea-Level Rise. Nat. Clim. Chang. 2020, 10, 993–995. [Google Scholar] [CrossRef]
  6. Galvin, C.J., Jr. Breaker Type Classification on Three Laboratory Beaches. J. Geophys. Res. 1896-1977 1968, 73, 3651–3659. [Google Scholar] [CrossRef]
  7. Iribarren Cavanilles, R.; Casto Nogales, M. Protection Des Ports. In Proceedings of the XVIIth International Naval Congress, Lisbon, Portugal, 1 January 1949. [Google Scholar]
  8. Battjes, J.A. Surf Similarity. Coast. Eng. Proc. 2015, 26, 466–480. [Google Scholar] [CrossRef]
  9. Castelle, B.; Scott, T.; Brander, R.; McCarroll, J.; Robinet, A.; Tellier, E.; de Korte, E.; Simonnet, B.; Salmi, L.-R. Environmental Controls on Surf Zone Injuries on High-Energy Beaches. Nat. Hazards Earth Syst. Sci. 2019, 19, 2183–2205. [Google Scholar] [CrossRef] [Green Version]
  10. Robles, L.A. Cervical Spine Injuries in Ocean Bathers: Wave-Related Accidents. Neurosurgery 2006, 58, 920–923, discussion 920–923. [Google Scholar] [CrossRef]
  11. Puleo, J.A.; Hutschenreuter, K.; Cowan, P.; Carey, W.; Arford-Granholm, M.; McKenna, K.K. Delaware Surf Zone Injuries and Associated Environmental Conditions. Nat. Hazards 2016, 81, 845–867. [Google Scholar] [CrossRef]
  12. Battjes, J.A.; Bakkenes, H.J.; Janssen, T.T.; van Dongeren, A.R. Shoaling of Subharmonic Gravity Waves. J. Geophys. Res. Oceans 2004, 109, C02009. [Google Scholar] [CrossRef] [Green Version]
  13. Stockdon, H.F.; Holman, R.A.; Howd, P.A.; Sallenger, A.H. Empirical Parameterization of Setup, Swash, and Runup. Coast. Eng. 2006, 53, 573–588. [Google Scholar] [CrossRef]
  14. Kamphuis, J.W. Alongshore Sediment Transport Rate. J. Waterw. Port Coast. Ocean Eng. 1991, 117, 624–640. [Google Scholar] [CrossRef]
  15. Wright, L.D.; Short, A.D. Morphodynamic Variability of Surf Zones and Beaches: A Synthesis. Mar. Geol. 1984, 56, 93–118. [Google Scholar] [CrossRef]
  16. Short, A. Three Dimensional Beach-Stage Model. J. Geol. 1979, 87, 553–571. [Google Scholar] [CrossRef]
  17. Wright, L.D.; Chappell, J.; Thom, B.G.; Bradshaw, M.P.; Cowell, P. Morphodynamics of Reflective and Dissipative Beach and Inshore Systems: Southeastern Australia. Mar. Geol. 1979, 32, 105–140. [Google Scholar] [CrossRef]
  18. Castelle, B.; Masselink, G. Morphodynamics of Wave-Dominated Beaches. Camb. Prisms Coast. Futur. 2023, 1, e1. [Google Scholar] [CrossRef]
  19. Dionne, J.-C.; Komar, P.D. (1976): Beach Processes and Sedimentation, Englewood Cliffs (New Jersey), Prentice-Hall, xii et 429 p., 218 fig., 18.5 × 24 cm, $33.30. Géogr. Phys. Quat. 1978, 32, 178–179. [Google Scholar] [CrossRef] [Green Version]
  20. Prodger, S.; Russell, P.; Davidson, M.; Miles, J. Beach Morphological Predictions: The Impact of a Temporally Varying Sediment Fall Velocity. J. Coast. Res. 2016, 75, 447–451. [Google Scholar] [CrossRef]
  21. Yates, M.L.; Guza, R.T.; O’Reilly, W.C. Equilibrium Shoreline Response: Observations and Modeling. J. Geophys. Res. 2009, 114, C09014. [Google Scholar] [CrossRef] [Green Version]
  22. Castelle, B.; Marieu, V.; Bujan, S.; Ferreira, S.; Parisot, J.-P.; Capo, S.; Sénéchal, N.; Chouzenoux, T. Equilibrium Shoreline Modelling of a High-Energy Meso-Macrotidal Multiple-Barred Beach. Mar. Geol. 2014, 347, 85–94. [Google Scholar] [CrossRef]
  23. Splinter, K.D.; Turner, I.L.; Davidson, M.A.; Barnard, P.; Castelle, B.; Oltman-Shay, J. A Generalized Equilibrium Model for Predicting Daily to Interannual Shoreline Response. J. Geophys. Res. Earth Surf. 2014, 119, 1936–1958. [Google Scholar] [CrossRef] [Green Version]
  24. Lemos, C.; Floc’h, F.; Yates, M.; Le Dantec, N.; Marieu, V.; Hamon, K.; Cuq, V.; Suanez, S.; Delacourt, C. Equilibrium Modeling of the Beach Profile on a Macrotidal Embayed Low Tide Terrace Beach. Ocean Dyn. 2018, 68, 1207–1220. [Google Scholar] [CrossRef]
  25. Hunt, E.; Davidson, M.; Steele, E.C.C.; Amies, J.D.; Scott, T.; Russell, P. Shoreline Modelling on Timescales of Days to Decades. Camb. Prisms Coast. Futur. 2023, 1, e17. [Google Scholar] [CrossRef]
  26. Splinter, K.D.; Turner, I.L.; Reinhardt, M.; Ruessink, G. Rapid Adjustment of Shoreline Behavior to Changing Seasonality of Storms: Observations and Modelling at an Open-Coast Beach. Earth Surf. Process. Landf. 2017, 42, 1186–1194. [Google Scholar] [CrossRef]
  27. Ibaceta, R.; Splinter, K.D.; Harley, M.D.; Turner, I.L. Improving Multi-Decadal Coastal Shoreline Change Predictions by Including Model Parameter Non-Stationarity. Front. Mar. Sci. 2022, 9, 1012041. [Google Scholar] [CrossRef]
  28. D’Anna, M.; Idier, D.; Castelle, B.; Vitousek, S.; Le Cozannet, G. Reinterpreting the Bruun Rule in the Context of Equilibrium Shoreline Models. J. Mar. Sci. Eng. 2021, 9, 974. [Google Scholar] [CrossRef]
  29. D’Anna, M.; Idier, D.; Castelle, B.; Rohmer, J.; Cagigal, L.; Mendez, F.J. Effects of Stochastic Wave Forcing on Probabilistic Equilibrium Shoreline Response across the 21st Century Including Sea-Level Rise. Coast. Eng. 2022, 175, 104149. [Google Scholar] [CrossRef]
  30. Montaño, J.; Coco, G.; Antolínez, J.A.A.; Beuzen, T.; Bryan, K.R.; Cagigal, L.; Castelle, B.; Davidson, M.A.; Goldstein, E.B.; Ibaceta, R.; et al. Blind Testing of Shoreline Evolution Models. Sci. Rep. 2020, 10, 2137. [Google Scholar] [CrossRef] [Green Version]
  31. Plant, N.G.; Holman, R.A.; Freilich, M.H.; Birkemeier, W.A. A Simple Model for Interannual Sandbar Behavior. J. Geophys. Res. Oceans 1999, 104, 15755–15776. [Google Scholar] [CrossRef]
  32. Turki, I.; Medina, R.; Coco, G.; Gonzalez, M. An Equilibrium Model to Predict Shoreline Rotation of Pocket Beaches. Mar. Geol. 2013, 346, 220–232. [Google Scholar] [CrossRef]
  33. Larson, M. Equilibrium Profile of a Beach with Varying Grain Size; ASCE: Reston, VA, USA, 1991; pp. 905–919. [Google Scholar]
  34. Prodger, S.; Russell, P.; Davidson, M.; Miles, J.; Scott, T. Understanding and Predicting the Temporal Variability of Sediment Grain Size Characteristics on High-Energy Beaches. Mar. Geol. 2016, 376, 109–117. [Google Scholar] [CrossRef] [Green Version]
  35. Senechal, N.; Abadie, S.; Gallagher, E.; MacMahan, J.; Masselink, G.; Michallet, H.; Reniers, A.; Ruessink, G.; Russell, P.; Sous, D.; et al. The ECORS-Truc Vert’08 Nearshore Field Experiment: Presentation of a Three-Dimensional Morphologic System in a Macro-Tidal Environment during Consecutive Extreme Storm Conditions. Ocean Dyn. 2011, 61, 2073–2098. [Google Scholar] [CrossRef]
  36. Castelle, B.; Bujan, S.; Marieu, V.; Ferreira, S. 16 Years of Topographic Surveys of Rip-Channelled High-Energy Meso-Macrotidal Sandy Beach. Sci. Data 2020, 7, 410. [Google Scholar] [CrossRef] [PubMed]
  37. Castelle, B.; Guillot, B.; Marieu, V.; Chaumillon, E.; Hanquiez, V.; Bujan, S.; Poppeschi, C. Spatial and Temporal Patterns of Shoreline Change of a 280-Km High-Energy Disrupted Sandy Coast from 1950 to 2014: SW France. Estuar. Coast. Shelf Sci. 2018, 200, 212–223. [Google Scholar] [CrossRef]
  38. Castelle, B.; Bujan, S.; Ferreira, S.; Dodet, G. Foredune Morphological Changes and Beach Recovery from the Extreme 2013/2014 Winter at a High-Energy Sandy Coast. Mar. Geol. 2017, 385, 41–55. [Google Scholar] [CrossRef]
  39. Laporte-Fauret, Q.; Castelle, B.; Michalet, R.; Marieu, V.; Bujan, S.; Rosebery, D. Morphological and Ecological Responses of a Managed Coastal Sand Dune to Experimental Notches. Sci. Total Environ. 2021, 782, 146813. [Google Scholar] [CrossRef]
  40. Gallagher, E.L.; MacMahan, J.; Reniers, A.J.H.M.; Brown, J.; Thornton, E.B. Grain Size Variability on a Rip-Channeled Beach. Mar. Geol. 2011, 287, 43–53. [Google Scholar] [CrossRef]
  41. Davidson, M.A.; Splinter, K.D.; Turner, I.L. A Simple Equilibrium Model for Predicting Shoreline Change. Coast. Eng. 2013, 73, 191–202. [Google Scholar] [CrossRef]
  42. Soulsby, R. Dynamics of Marine Sands: A Manual for Practical Applications; Thomas Telford: London, UK, 1997; ISBN 978-0-7277-2584-4. [Google Scholar]
  43. Bertsimas, D.; Tsitsiklis, J. Simulated Annealing. Stat. Sci. 1993, 8, 10–15. [Google Scholar] [CrossRef]
  44. Lemos, C.; Floc’H, F.; Yates, M.L.; Dantec, N.L.; Marieu, V.; Hamon, K.; Cuq, V.; Suanez, S.S.; Delacourt, C. Equilibrium Modeling of the Beach Profile on a Macrotidal Embayed Beach. Coast. Dyn. 2017, 2017, 760–771. [Google Scholar]
  45. Jackson, D.W.T.; Cooper, J.A.G.; del Rio, L. Geological Control of Beach Morphodynamic State. Mar. Geol. 2005, 216, 297–314. [Google Scholar] [CrossRef]
  46. Grasso, F.; Michallet, H.; Barthélemy, E.; Certain, R. Physical Modeling of Intermediate Cross-Shore Beach Morphology: Transients and Equilibrium States. J. Geophys. Res. Oceans 2009, 114, C09001. [Google Scholar] [CrossRef] [Green Version]
  47. Almar, R.; Castelle, B.; Ruessink, G.; Senechal, N.; Bonneton, P.; Marieu, V. High-Frequency Video Observation of a Double Sandbar System under High-Energy Wave Forcing. J. Coast. Res. 2009, 1706–1710. [Google Scholar]
  48. Jaramillo, C.; Jara, M.S.; González, M.; Medina, R. A Shoreline Evolution Model Considering the Temporal Variability of the Beach Profile Sediment Volume (Sediment Gain/Loss). Coast. Eng. 2020, 156, 103612. [Google Scholar] [CrossRef]
  49. Dean, R.G. Equilibrium Beach Profiles: Characteristics and Applications. J. Coast. Res. 1991, 7, 53–84. [Google Scholar]
  50. Vitousek, S.; Cagigal, L.; Montaño, J.; Rueda, A.; Mendez, F.; Coco, G.; Barnard, P.L. The Application of Ensemble Wave Forcing to Quantify Uncertainty of Shoreline Change Predictions. J. Geophys. Res. Earth Surf. 2021, 126, e2019JF005506. [Google Scholar] [CrossRef]
  51. Splinter, K.D.; Harley, M.D.; Turner, I.L. Remote Sensing Is Changing Our View of the Coast: Insights from 40 Years of Monitoring at Narrabeen-Collaroy, Australia. Remote Sens. 2018, 10, 1744. [Google Scholar] [CrossRef] [Green Version]
  52. Ludka, B.; Guza, R.; O’reilly, W.; Merrifield, M.; Flick, R.; Bak, S.; Hesser, T.; Bucciarelli, R.; Olfe, C.; Woodward, B.; et al. Sixteen Years of Bathymetry and Waves at San Diego Beaches. Sci. Data 2019, 6, 161. [Google Scholar] [CrossRef] [Green Version]
  53. Turner, I.; Harley, M.; Short, A.; Simmons, J.; Bracs, M.; Phillips, M.; Splinter, K. A Multi-Decade Dataset of Monthly Beach Profile Surveys and Inshore Wave Forcing at Narrabeen, Australia. Sci. Data 2016, 3, 160024. [Google Scholar] [CrossRef] [Green Version]
  54. Bertin, S.; Floc’h, F.; Le Dantec, N.; Jaud, M.; Cancouët, R.; Franzetti, M.; Cuq, V.; Prunier, C.; Ammann, J.; Augereau, E.; et al. A Long-Term Dataset of Topography and Nearshore Bathymetry at the Macrotidal Pocket Beach of Porsmilin, France. Sci. Data 2022, 9, 79. [Google Scholar] [CrossRef] [PubMed]
  55. Dodet, G.; Castelle, B.; Masselink, G.; Scott, T.; Davidson, M.; Floc’h, F.; Jackson, D.; Suanez, S. Beach Recovery from Extreme Storm Activity during the 2013–14 Winter along the Atlantic Coast of Europe. Earth Surf. Process. Landf. 2019, 44, 393–401. [Google Scholar] [CrossRef] [Green Version]
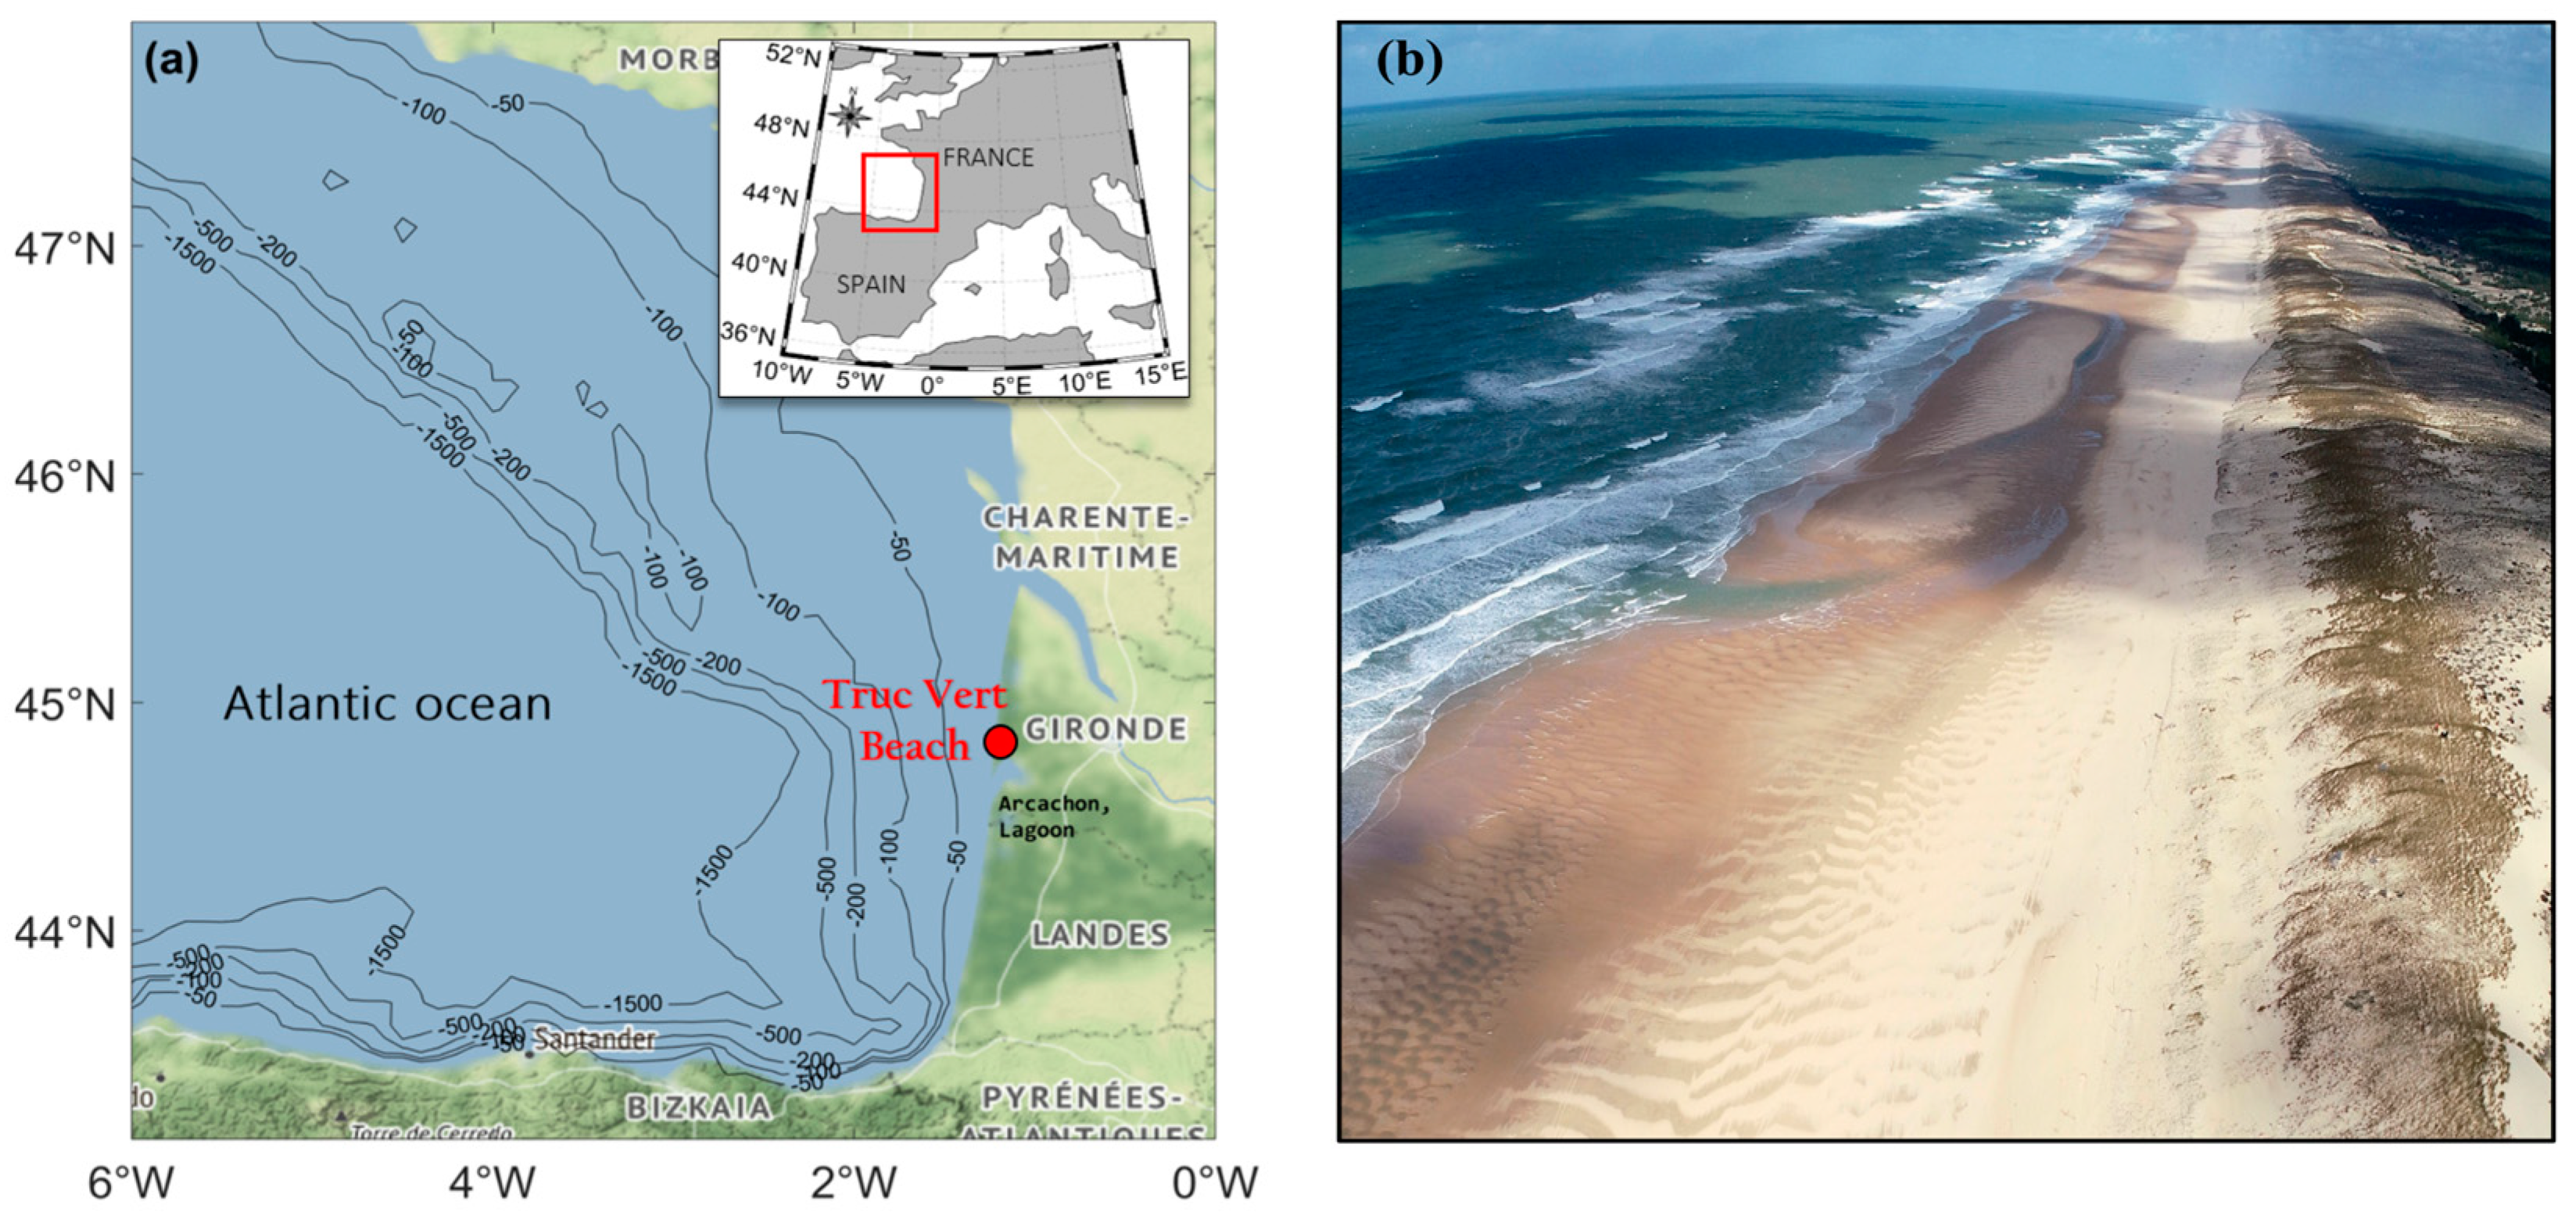
Figure 1. (a) Location map of Truc Vert beach in southwest France. (b) UAV photograph of Truc Vert (Ph. V. Marieu).
Jmse 11 00584 g001
Figure 2. Truc Vert beach DEM on 11 September 2018: (a) superimposed 20 m spaced beach profiles and (b) planview DEM.
Jmse 11 00584 g002
Figure 3. Superimposed beach profiles at a given transect covering over an entire year illustrating typical seasonal morphological changes at Truc Vert beach.
Jmse 11 00584 g003
Figure 4. Cross-shore profile evolution (elevation colored) from 17 October 2012 to 10 June 2021. (a) Single profile located in the center of the domain and (b) alongshore-averaged profile.
Jmse 11 00584 g004
Figure 5. (a) R2 and (b) RMSE between the observed and modeled beach slope and corresponding (c) Φ memory, (d) C erosion rate coefficient and (e) C+ accretion rate coefficient free parameters, found as a function of the elevation where the beach slope is computed. The shaded areas are where R2 < 0.2 which we considered as elevations where beach slope does not show an equilibrium response.
Jmse 11 00584 g005
Figure 6. Time series of (a) wave power and (bf) observed (circles) and modeled (solid line) beach slope between (b) 5–6 m; (c) 3.6–4.6 m; (d) 2.2–3.2 m (e) 0.3–1.3 m and (f) −0.7–0.3 m.
Jmse 11 00584 g006
Table 1. Initialization of the 4 free model parameters.
S0ΦCC+
(m)(days)(s−1·W−0.5)(s−1·W−0.5)
[−0.5;0.5][1;850][−0.000008;0.0000081][−0.000025;0.000024]
Disclaimer/Publisher’s Note: The statements, opinions and data contained in all publications are solely those of the individual author(s) and contributor(s) and not of MDPI and/or the editor(s). MDPI and/or the editor(s) disclaim responsibility for any injury to people or property resulting from any ideas, methods, instructions or products referred to in the content.