Abstract
Automated surveillance systems based on machine learning and computer vision constantly evolve to improve shipping and assist port authorities. The data obtained can be used for port and port property surveillance, traffic density analysis, maritime safety, pollution assessment, etc. However, due to the lack of datasets for video surveillance and ship classification in real maritime zones, there is a need for a reference dataset to compare the obtained results. This paper presents a new dataset for estimating detection and classification performance which provides versatile ship annotations and classifications for passenger ports with a large number of small- to medium-sized ships that were not monitored by the automatic identification system (AIS) and/or the vessel traffic system (VTS). The dataset is considered general for the Mediterranean region since many ports have a similar maritime traffic configuration as the Port of Split, Croatia. The dataset consists of 19,337 high-resolution images with 27,849 manually labeled ship instances classified into 12 categories. The vast majority of the images contain the port and starboard sides of the ships. In addition, the images were acquired in a real maritime zone at different times of the year, day, weather conditions, and sea state conditions.
1. Introduction
Many Mediterranean ports have a versatile port structure. In addition to passenger terminals for local or international ferry lines, they may also have a nautical marina, berths for large cruise ships, berths for local ships or fishing boats, etc. This leads to a diverse configuration of maritime traffic, ranging from smaller boats of all types, for example, sailboats or speedboats, to passenger ferries and large cruise ships. Maritime traffic is typically monitored by an AIS and/or VTS systems. The data obtained from these systems can be used for various scientific research, such as maritime traffic density analysis [1] or developing collision prediction models to improve maritime safety [2]. Datasets with this type of data already exist [3], but not every ship is required to have AIS transponders on board or to report to the relevant VTS service when entering or leaving the VTS zone [4]. This means that conventional traffic monitoring systems do not monitor many types of small and medium sized non-commercial ships. The motivation of this paper is to overcome the above-mentioned limitations of maritime traffic monitoring systems by using video surveillance, machine learning, and computer vision. In particular, by implementing deep convolutional neural networks (DCNNs) in video surveillance, we can obtain detailed information about the maritime traffic in a particular maritime zone.
1.1. Related Work
There are many different datasets for use in computer vision, which are discussed in this section. However, the lack of datasets for video surveillance and ship classification in real Mediterranean maritime zones poses a problem for the training, validation, and performance estimation of a DCNN model. The application of DCNN models in video surveillance can range from ship counting, maritime security, object detection and tracking, horizon detection, environmental damage monitoring, tourism, etc.
Bloisi et al. [5] introduced the MarDCT dataset with the goal of “provide visual data that can be used to help in developing intelligent surveillance system for the maritime environment. The datasets are divided according to the type of Ground Truth in: Detection, Classification and Tracking.” but some videos contain the Ground Truth (GT), while others do not, and there is also no Bounding Box (BB) GT in the dataset. An interesting and useful dataset is presented by Mahadevan and Vasconcelos [6]. However, it should be noted that this dataset covers only a limited number of small boats. Another feature of the dataset is that it has been prepared for use in Matlab (3D array variable).
A dynamic scene, such as maritime zone surveillance, with visible changes in illumination, is very challenging [7,8]. In [9,10], efforts are made to provide a reasonable, realistic problem dataset. However, Hashmani and Umair [9] focused on horizon line detection, while in the work of Wang et al. [10], only a few video sequences could be used for maritime applications. The dataset in [11] consists of five classes of ships: cargo, military, carrier, cruise, and tankers. Lin et al. presented the dataset COCO [12] which contains many images, including ships, but is not specific to ships or maritime applications.
Furthermore, the Singapore Maritime Dataset (SMD) was created by Prasad et al. [13] using Canon 70D cameras in Singapore waters. The dataset is divided into two parts: on-shore videos and on-board videos. Additionally, the videos were recorded using a camera on land on a fixed platform and a camera on board a moving ship, respectively. Moreover, the videos were taken at different locations and routes and therefore did not capture the same scene. The third part is near infrared (NIR) videos.
A large dataset of ships, called SeaShips, was introduced by Shao et al. [14] with the goal of advancing research and applications of ship object detection algorithms. The images are extracted from video segments captured by a video surveillance system and include six common types of ships (ore carrier, bulk cargo carrier, general cargo ship, container ship, fishing boat, and passenger ship).
In the study of Patino, Cane, and Ferryman [15], a multimodal maritime dataset is presented that consists of a set of scenarios simulating attacks on a ship by small, fast-moving boats. It can be used to train and test threat detection and classification systems and was recorded using AIS, GPS, radar, and visible and thermal cameras. Kaur et al. [16] introduced a large Sea Situational Awareness (SeaSAw) dataset, intended to enhance ship perception technology. The dataset is acquired using various cameras on moving ships with general ship classifications.
The Maritime Synthetic (MarSyn) dataset was presented by Ribeiro, Damas, and Bernardino [17] and consists of 25 photorealistic video sequences, each containing 1000 images. The goal is to simulate different maritime scenarios and conditions, such as sunny, cloudy, and sunset environments, near-shore imagery, and reflections on the water. The vessels vary in type (cargo ships, military ships, fishing boats, speedboats, rescue rafts, and others), length (from 3 m to 125 m), shape, and color. The simulated camera is attached to a UAV and moved accordingly to capture images from a height between 150 and 1000 m. The video sequences and images in this dataset are photo-realistically simulated and not taken in a real maritime zone.
Atalar and Bartan [18] developed three different classification algorithms for the classification of different types of ships as part of the project. The dataset used consists of 10 different ship classes: aircraft carriers, bulkers, cruise ships, fire-fighting vessels, fishing vessels, inland dry cargo vessels, restaurant ships, motor yachts, drilling rigs, and submarines. The SVM algorithm was used to train a convolutional neural network with 1000 images. Wang et al. [19] collected open-source images from the Internet and compiled a dataset with 12 categories of ships.
Table 1 shows the total number of images, ship categories, and ship instances within the datasets investigated in this paper. From this, we can conclude that SeaSAw has the largest number of images and ship instances, while MarDCT has the largest number of ship categories.

Table 1.
Number of images, ship categories, and instances within the datasets.
Zhang et al. [20] investigated the application of the improved You Only Look Once (YOLO) DCNN for ship detection, and datasets considered particularly important were presented. Park et al. [21] evaluated the application of different DCNN models from the YOLO family on the SMD dataset. The application of the same models on embedded edge devices for maritime object detection is investigated by Heller et al. [22].
1.2. Problem Statement
In this paper, it is hypothesized that Mediterranean ports have a specific configuration of maritime traffic that is highly dependent on the port structure and can range from smaller boats of all types, such as sailboats and speedboats, to passenger ferries and large cruise ships. Therefore, while researching maritime datasets with the goal of training, validating, and evaluating the performance of DCNN models such as [23], it became clear that most datasets are unsuitable for use in this maritime zone. This is because some datasets are not created for this purpose [9,10], some have not been updated over the years or contain low-resolution images and videos and lack ground truth [5], the ship images were taken from above (satellite or unmanned aerial vehicle) [5,17], they lack a suitable ship classification [12,16], or the annotated ships do not fit the Mediterranean maritime traffic profile [6,11,12,13,14,15,17,18,19].
Therefore, this paper aims to fill this gap, i.e., a new dataset is presented to complement other available datasets for ship detection, classification, or algorithm performance estimation for passenger ports. The methodology presented in this paper is based on the work in [12,13,14] and adapted for our application. Figure 1 shows the flowchart of the detailed dataset creation process used in this paper. The dataset creation process started with acquiring video sequences of real maritime traffic (explained in Section 2.3 and Section 2.4), followed by manual image extraction and selection (explained in Section 2.4). Afterward, the ships are annotated on the images and classified using a ship classification procedure described in Section 2.5 and Section 2.6. To the best of our best knowledge, no publicly available dataset covers this geographic location and maritime traffic profile.
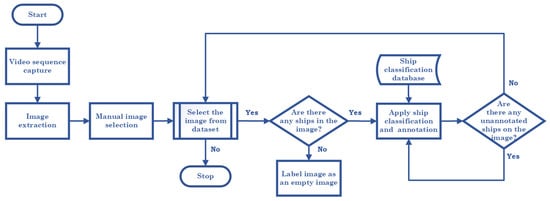
Figure 1.
Dataset creation flowchart.
The main scientific contribution, i.e., the differences between other datasets and the proposed dataset, are the following:
- The proposed dataset focuses on real maritime traffic in a particular Mediterranean port with significant passenger ship traffic, nautical marina ship traffic, and recreational ship traffic, with a large number of ships not monitored by conventional monitoring systems (AIS or VTS);
- Higher background diversity in the images is achieved by recording the images at different times of the year and day and under different weather and sea state conditions;
- The ship images mostly contain the port and starboard sides of the ships.
This paper is organized as follows: The second Section shows the geographical location and characteristics of the Port of Split, as well as camera positioning and specification, and then explains image extraction and selection, ship classification, and the image annotation process. The third Section discusses the statistical properties of the dataset, and finally, the fourth Section presents concluding remarks and future work.
2. Methodology
2.1. Geographical Location
The city of Split is the economic and cultural center of the Croatian region of Dalmatia and the second largest city in the country. Due to its geographic location, proximity to the airport, and recent tourism growth, Split has also become an important transportation hub between the mainland and the islands. As shown in Figure 2, according to the Split Port Authority [24], in 2009, 3,955,846 passengers and 657,871 vehicles were transported, while in 2019, 5,607,789 passengers and 829,594 vehicles were transported (disruption caused by the COVID-19 pandemic is ignored). In the above-mentioned ten-year period, the number of passengers increased by 42%, while the number of transported vehicles increased by 26%. This makes it the largest passenger port in Croatia and the third largest passenger port in the Mediterranean regarding the number of passengers and vehicles transported. These facts underline the importance of detailed maritime traffic monitoring for this port.
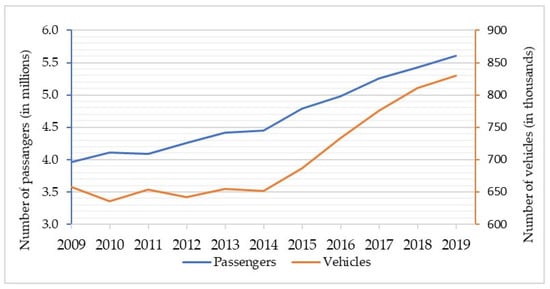
Figure 2.
Number of passengers and vehicles transported in the port of Split from 2009 to 2019.
2.2. Characteristics of Port of Split
Due to the nature of the port of Split, maritime traffic consists mainly of passenger ships of various sizes. Additionally, it has to be pointed out that there are no cargo ship arrivals. The generalized configuration of the port is shown in Figure 3. The inner berths 1 are reserved for high-speed crafts operating on various routes between the mainland and the islands. The same berths are also used for small passenger ships (e.g., excursion boats) for tourist trips. Inner berths 2 and 3 are reserved for domestic and international coastal ferries, while outer berths are for large passenger ships (e.g., cruise ships) or larger ferries. Locals mainly use the city port basin with small private and fishing boats, and in the summer season, also by speedboats of all sizes for tourist transfers. In the western part of the port, there is a nautical marina, which houses sailing clubs with a number of small sailboats for training, as well as moorings for private and chartered sailboats and yachts. Next to the marina, toward the city port basin, there is an area reserved for larger yachts, sailboats, catamarans, and excursion boats.
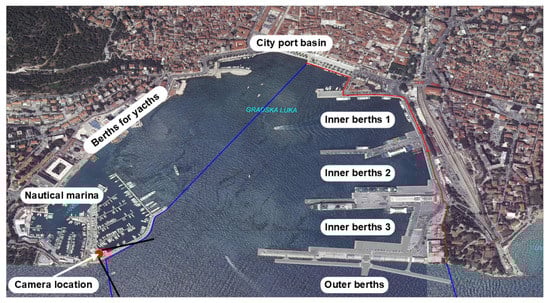
Figure 3.
Adapted from [24]; generalized configuration of the Port of Split.
This port configuration ensures the diversity of maritime traffic since the port can accommodate different types of ships, as mentioned above. Most of these ships are not monitored by conventional maritime traffic monitoring systems. In order to monitor all maritime traffic entering and leaving the Port of Split, a long-range (LR) surveillance camera was procured as part of the project and mounted on the building overlooking the entrance to the port in January 2020. The location of the camera is shown as a red circle in Figure 3, while black lines depict the camera’s field of view. The camera coordinates are as follows: Latitude 43°30′04″ N, Longitude 16°25′48″ E, mounted 9 m above sea level.
2.3. Camera Specification
Similar studies on maritime datasets have successfully used a single [9,13], or a set of visual range cameras [5,12], and the presented dataset focuses primarily on visible-range detection methods. For LR video surveillance, the Dahua DH-TPC -PT8620A-T is used. It is a hybrid network pan and tilt camera for outdoor applications with IP67 protection. The camera is mounted and fixed to monitor ships entering and leaving the Port of Split. Since it is a network camera, the main stream is routed to a laboratory computer in H.264 compression, high-definition (HD) quality resolution, and 25 frames per second (FPS). The basic technical data [25] of the visible camera and the visible lens are listed in Table 2.
Table 2.
Dahua DH-TPC-PT8620A-T technical specification.
2.4. Image Extraction and Selection
The Dahua LR camera recorded video sequences of maritime traffic from February 2020 to December 2022. In addition, the video sequences were recorded at different times of the year and day and under different weather and sea state conditions. Then, images with an HD resolution, i.e., 1920 × 1080, were extracted from the video sequences and manually selected for the dataset. The images are saved in .jpg format and have a spatial point density of 96 dpi, a bit depth of 24, and a standard red green blue (sRGB) color representation. It should be noted that the focus was on images of ships leaving or entering the port of Split and that the dataset mainly shows the port and starboard sides of the ships.
2.5. Ship Classification
Based on the goals and purpose of the dataset, as well as the nature of the Split port, we identified 12 specific ship categories with the help of experts from the Department of Nautical Engineering. In addition, when defining the ship categories, we had to take into account that the assignment of labels by DCNNs is based on prior knowledge. Therefore, it is preferable to classify ships that “look alike” in the same category when possible. The ship category identification number (ID), category names, and descriptions of each category are listed in Table 3.
Table 3.
This table contains 12 specific categories of ship classifications with descriptions (see the Appendix A).
For example, Table 3 shows that ships with Cat. ID. 6, designated as Speed Craft, have the following characteristics: length is greater than 3 m, can be made of rubber, plastic, aluminum, etc.
2.6. Image Annotation
The images are manually annotated on the desktop computer using Yolo_mark labeler, a Windows and Linux software for annotating Bounding Box (BB) around objects in images for YOLO training and/or validation [26]. The format used for the image annotations is the YOLO-Darknet format [27], but there are many available tools for converting from one format to another. The annotations are normalized in the range [0, 1] with respect to the image’s height and width, making it easier to work with the annotations after scaling or stretching the images. As shown in Figure 4, the upper left corner of an image is always a starting point (0,0), the lower left corner is (0,1), the upper right corner is (1,0), and the lower right corner is (1,1).
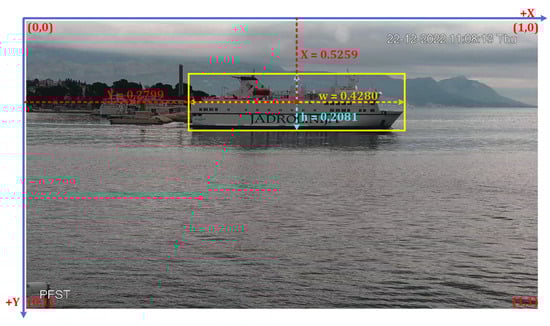
Figure 4.
Annotated image from the proposed dataset.
Additionally, in Figure 4, an example image from the proposed dataset is shown, in which the ship categorized as “Large Ferry” (Cat. ID 10 from Table 3) is annotated with the yellow BB, where X and Y are the normalized coordinates of the center of BB, and w and h are the normalized width and height of BB, respectively. After the image is annotated, a .txt file is created that contains all mentioned BB parameters. Then, a new line is created in the same .txt file for each annotated ship within an image. An example of the .txt file for the annotated ship from the image in Figure 4 is shown in Table 4. Within the proposed dataset, each image contains a .txt file with the same name as the image and is located in the same directory. Images without annotated ships contain an empty .txt file.
Table 4.
Example of a .txt file with single annotation.
3. Results Dataset Description
In this paper, we present the Split Port Ship Classification Dataset (SPSCD) for detecting ships in passenger ports. The proposed dataset consists of a total of 27,849 ship instances manually annotated with BB and classified as described above. The distribution histogram in Figure 5 shows the number of ship instances per class. In the proposed SPSCD dataset, the speed craft and sailing boat classes have a higher number of instances, while fishing trawlers have a lower number of instances. This is due to the nature of the maritime traffic profile in the Port of Split: fishing trawlers are not common in passenger ports, while speed crafts and sailing boats are very common, especially during the summer. Intra-class variability also affects the number of instances per class, as for example, speed crafts can come in different models and colors, different types of propulsion (the outboard engine may be clearly visible on board), etc., while classes such as high-speed craft or large ferry have lower intra-class variability.
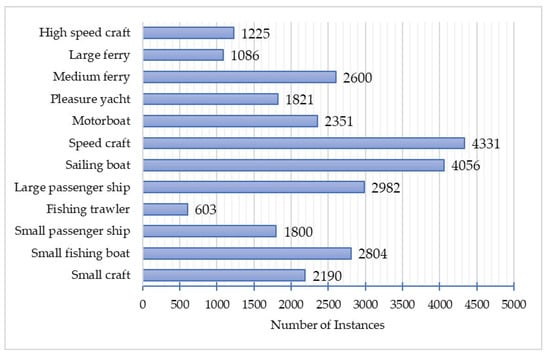
Figure 5.
Distribution histogram of class annotations.
One of the parameters in image datasets is the information about how many objects are on the images at the same time. The distribution of ships per image of the SPSDC dataset is shown in Figure 6, where 10,679 images contain one ship, while the rest contain between two and seven ships. Of the total 19,337 images, 2257 images contain no ships, or 11.7%. This is a good balance between images with ships and empty images, which is important for the performance estimation of algorithms or DCNN models.
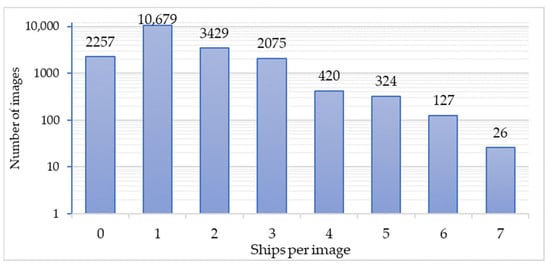
Figure 6.
Histogram of the distribution of the number of ships per image.
Figure 7a shows the distribution of positions of all annotations, where x and y are normalized coordinates of the center of BB. As described in Section 2.6, the annotation format sets the starting point (0,0) of the image in the upper left corner, which means that on the plot, the starting point of the images is in the lower left corner. Each scatters plot represents the annotation position, while the blue color range (from light blue to dark blue) represents the concentration of the annotation position.
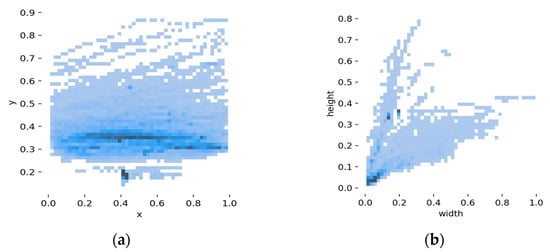
Figure 7.
(a) Distribution of position of all annotations; (b) Heatmap of the annotation size.
The correlation plots in Figure 8 show the relationship between the position of the ship’s annotation, its width, and its height. Additionally, the width and height of the annotation and the x and y coordinates of the BB center are normalized as described in Section 2.6. Each scatters plot shows the number of ship annotations with specific parameters with respect to the x and y axes of that plot. The blue color range represents the concentration range. In this plot, the positions of the annotations are examined even more closely, from which it can be concluded that most of the ships are positioned in the upper half of the image. This is due to the fact that the depth of the port entrance is such that most of the ships navigate in the area that is further away from the camera and that the camera is placed at a certain height.
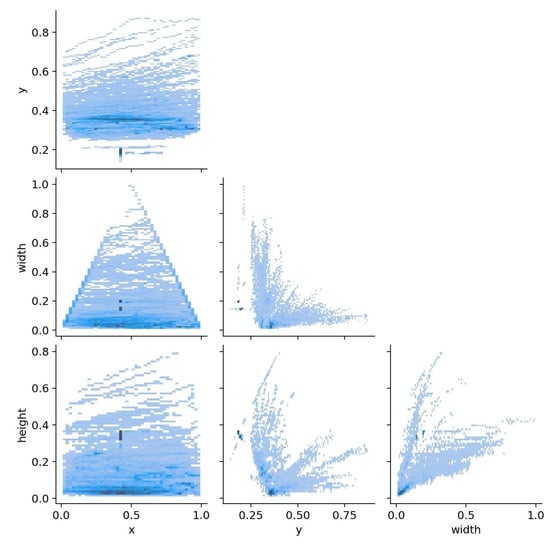
Figure 8.
2D correlogram of annotation positions versus sizes.
Additionally, there is a spot with a higher concentration of annotations of similar BB size (Figure 8, x-y plot; x-width and x-height plots). This is due to the fact that there is a berth for large passenger ships directly in front of the camera (outer berths in Figure 3). These ships had to be annotated because if the proposed dataset is used to train the DCNN model, we want a model that recognizes these ships. Otherwise, the DCNN model would consider them as background, and there would be problems in detection.
4. Discussion
It is important to emphasize the following benefits of using the proposed dataset: there are twelve ship category classifications with descriptions and a large number of ships not monitored by conventional monitoring systems (AIS or VTS). Additionally, recording the images at different times of the year and day, under different weather and sea conditions, ensures higher background diversity in the images. Finally, the images mostly contain the port and starboard sides of the ships.
Similarly, there are many image and video datasets used for various maritime applications, such as horizon line detection [9,13], piracy threat detection [15], ship perception [16], etc. Some datasets contain images that are simulated [17] or collected from the Internet [19], i.e., not taken in a real maritime zone. Additionally, Table 1 also shows that datasets [18,19] contain a relatively low number of images, which can be a problem when training a DCNN model. It has to be emphasized that, in this paper, the lack of maritime video surveillance and ship classification dataset for the real maritime zone is observed and addressed. Although there are already datasets suitable for this particular maritime zone [5], the dataset has not been updated since 2013. It has to be pointed out that some videos lack the GT and the annotation GT, which is vital for DCNN applications. In addition, the images were taken from a bird’s perspective.
Furthermore, this is also true for the dataset in [17], which poses a problem in detecting ships from the port and starboard side due to the camera’s position. On the contrary, it is observed that datasets in [12,15,16] lack appropriate ship classifications due to the nature of the datasets. The COCO dataset [12] is a general object detection dataset that can be used for maritime applications but only contains a single general ship category. Furthermore, the multimodal IPATCH dataset [15] is focused on threat detection and event recognition, while the goal of the SeaSAw dataset [16] is to improve ship perception technologies. For instance, it contains by far the largest set of images and annotations (Table 1) and includes eight general ship categories and four non-ship categories (wind turbine, marker, mooring buoy, and miscellaneous). While some ship categories could be used, four of them consist of non-ships, while others are too general for detailed maritime traffic monitoring. This is also true for the dataset in [11], which contains five ship categories (cargo, military, carrier, cruise, and tankers).
Moreover, the SeaShips dataset [14] is created in the real maritime zone of Hengqin Island (China) and contains six different ship categories (ore carrier, bulk cargo carrier, general cargo ship, container ship, fishing boat, and passenger ship). The SMD dataset [13] was also created in a real maritime zone and contains eight different ship categories and two non-ship categories, but it has to be pointed out that the problem is that most of the ship instances are assigned to a single category. The vast majority of the abovementioned ship categories from [11,13,14,16] are not present in the ports similar to the Split port, as they are mainly passenger ports. It has to be pointed out that some categories could be used, but for example the category “fishing boat” from [14] is visually very different from fishing boats in the Mediterranean.
To conclude, we established that the configuration of maritime traffic should also be taken into account. This is because Mediterranean ports have a specific traffic configuration that is highly dependent on the port structure, meaning that traffic can range from smaller boats of all types, such as sailboats and speedboats, to passenger ferries and large cruise ships. In addition, the vast majority of ships are not monitored by conventional traffic monitoring systems. By applying these unique features into the proposed SPSCD dataset, the presented dataset can complement other available datasets for applications in this specific maritime zone.
5. Conclusions
As a complement to other available datasets, the SPSCD dataset is presented for ship detection, classification, or algorithm performance estimation for passenger ports. It also provides versatile ship annotations and classifications for Mediterranean passenger ports. The diversity of the dataset results from the selection of images taken under different weather conditions (e.g., rainy, cloudy, sunny), different illumination effects from the sun and sea surface reflections (different times of the year and day), and different sea state conditions. Therefore, each ship class contains images taken under the above-mentioned conditions, resulting in a wide variety of images in the dataset. In addition, the vast majority of the images contain the port and starboard sides of the ships.
Some limitations of the proposed SPSCD dataset, such as an imbalance between ship classes and a concentration of ship annotations in certain locations, should be noted. These imbalances could be addressed by applying data augmentation techniques. Additionally, this dataset does not include military ships and ships typical of cargo ports, but can otherwise be used for any passenger port with a large number of small- to medium-sized ships that are not monitored by the AIS and/or VTS service. The presented methodology can be applied to any maritime zone with a similar maritime traffic profile.
Finally, in the future work the dataset will be used to train DCNN models for ship detection and tracking for detailed monitoring of maritime zones. The dataset can be extended to include even more images with manually annotated ships. This can address the class imbalance limitations noted above and diversify the locations of ship annotations in the images. Additional ship classes can also be included if necessary.
Author Contributions
Conceptualization, M.P. and I.V.; methodology, M.P. and Z.L.; validation, J.Š., Z.L. and M.P.; investigation, M.P.; resources, M.P. and Z.L.; writing—original draft preparation, M.P.; writing—review and editing, I.V., J.Š. and Z.L.; visualization, M.P. and I.V.; supervision, I.V. and J.Š. All authors have read and agreed to the published version of the manuscript.
Funding
This research received no external funding, but the equipment used is obtained by the project “Functional integration of the University of Split, PMF/PFST/KTF through the development of scientific and research infrastructure in the three faculty (3F) building” grant number: KK.01.1.1.02.0018.
Informed Consent Statement
Not applicable.
Data Availability Statement
The Split Port Ship Classification Dataset (SPSCD) can be downloaded from: https://labs.pfst.hr/maritime-dataset/ (accessed on 1 February 2023) and used for scientific purposes only.
Conflicts of Interest
The authors declare no conflict of interest.
Appendix A
This appendix is a supplement to Table 3, which shows the example ships from each class included in the proposed dataset. The ship images are extracted from the dataset and enlarged for better viewing as shown in Figure A1: Examples of ships from the dataset.

Figure A1.
(a,b) are small craft boats; (c–e) are small fishing boats; (f) are fishing trawlers; (g,h) are large passenger ships; (i,j) are sailing boats; (k–m) are speed crafts; (n,o) are motorboats; (p,q) are pleasure yachts; (r) is a medium ferry; (s) is a large ferry; (t) is a high-speed craft; and finally, (u,v) are small passenger ships.
References
- Ramin, A.; Mustaffa, M.; Ahmad, S. Prediction of Marine Traffic Density Using Different Time Series Model from AIS Data of Port Klang and Straits of Malacca. Trans. Marit. Sci. 2020, 9, 217–223. [Google Scholar] [CrossRef]
- Vukša, S.; Vidan, P.; Bukljaš, M.; Pavić, S. Research on Ship Collision Probability Model Based on Monte Carlo Simulation and Bi-LSTM. J. Mar. Sci. Eng. 2022, 10, 1124. [Google Scholar] [CrossRef]
- Ray, C.; Dréo, R.; Camossi, E.; Jousselme, A.L.; Iphar, C. Heterogeneous Integrated Dataset for Maritime Intelligence, Surveillance, and Reconnaissance. Data Brief 2019, 25, 104141. [Google Scholar] [CrossRef] [PubMed]
- Skočibušić, M.B.; Galić, S.; Vidan, P. Overview of the Vessel Traffic System in the Republic of Croatia. In Management Perspective for Transport Telematics, Proceedings of the 18th International Conference on Transport System Telematics, TST 2018, Krakow, Poland, 20–23 March 2018; Mikulski, J., Ed.; Springer: Cham, Switzerland, 2018; Volume 897, pp. 380–394. [Google Scholar]
- Bloisi, D.D.; Iocchi, L.; Pennisi, A.; Tombolini, L. ARGOS-Venice Boat Classification. In Proceedings of the AVSS 2015—12th IEEE International Conference on Advanced Video and Signal Based Surveillance, Karlsruhe, Germany, 25–28 August 2015. [Google Scholar] [CrossRef]
- Mahadevan, V.; Vasconcelos, N. Spatiotemporal Saliency in Dynamic Scenes. IEEE Trans. Pattern Anal. Mach. Intell. 2010, 32, 171–177. [Google Scholar] [CrossRef] [PubMed]
- Vujović, I.; Petković, M.; Kuzmanić, I.; Šoda, J. Visualization Approach to Presentation of New Referral Dataset for Maritime Zone Video Surveillance in Various Weather Conditions. In Engineering Design Applications IV: Structures, Materials and Processes; Öchsner, A., Altenbach, H., Eds.; Springer: Cham, Switzerland, 2021. [Google Scholar]
- Cullen, D.; Konrad, J.; Little, T.D.C. Detection and Summarization of Salient Events in Coastal Environments. In Proceedings of the 2012 IEEE Ninth International Conference on Advanced Video and Signal-Based Surveillance, Beijing, China, 18–21 September 2012; pp. 7–12. [Google Scholar] [CrossRef]
- Hashmani, M.A.; Umair, M. A Novel Visual-Range Sea Image Dataset for Sea Horizon Line Detection in Changing Maritime Scenes. J. Mar. Sci. Eng. 2022, 10, 193. [Google Scholar] [CrossRef]
- Wang, Y.; Jodoin, P.M.; Porikli, F.; Konrad, J.; Benezeth, Y.; Ishwar, P. CDnet 2014: An Expanded Change Detection Benchmark Dataset. In Proceedings of the IEEE Computer Society Conference on Computer Vision and Pattern Recognition Workshops, Columbus, OH, USA, 23–28 June 2014; pp. 393–400. [Google Scholar] [CrossRef]
- Classification of Ship Images. Available online: https://www.kaggle.com/code/teeyee314/classification-of-ship-images/notebook (accessed on 23 January 2023).
- Lin, T.Y.; Maire, M.; Belongie, S.; Hays, J.; Perona, P.; Ramanan, D.; Dollár, P.; Zitnick, C.L. Microsoft COCO: Common Objects in Context. In Computer Vision—ECCV 2014, Proceedings of the ECCV: European Conference on Computer Vision, Zurich, Switzerland, 6–12 September, 2014; Fleet, D., Pajdla, T., Schiele, B., Tuytelaars, T., Eds.; Springer: Cham, Switzerland, 2014; pp. 740–755. [Google Scholar] [CrossRef]
- Prasad, D.K.; Rajan, D.; Rachmawati, L.; Rajabally, E.; Quek, C. Video Processing from Electro-Optical Sensors for Object Detection and Tracking in a Maritime Environment: A Survey. IEEE Trans. Intell. Transp. Syst. 2017, 18, 1993–2016. [Google Scholar] [CrossRef]
- Shao, Z.; Wu, W.; Wang, Z.; Du, W.; Li, C. SeaShips: A Large-Scale Precisely Annotated Dataset for Ship Detection. IEEE Trans. Multimed. 2018, 20, 2593–2604. [Google Scholar] [CrossRef]
- Patino, L.; Cane, T.; Ferryman, J. A Comprehensive Maritime Benchmark Dataset for Detection, Tracking and Threat Recognition. In Proceedings of the AVSS 2021—17th IEEE International Conference on Advanced Video and Signal-Based Surveillance, Washington, DC, USA, 16–19 November 2021. [Google Scholar]
- Kaur, P.; Aziz, A.; Jain, D.; Patel, H.; Hirokawa, J.; Townsend, L.; Reimers, C.; Hua, F. Sea Situational Awareness (SeaSAw) Dataset. In Proceedings of the 2022 IEEE/CVF Conference on Computer Vision and Pattern Recognition Workshops (CVPRW), New Orleans, LA, USA, 21–24 June 2022; pp. 2578–2586. [Google Scholar]
- Ribeiro, M.; Damas, B.; Bernardino, A. Real-Time Ship Segmentation in Maritime Surveillance Videos Using Automatically Annotated Synthetic Datasets. Sensors 2022, 22, 8090. [Google Scholar] [CrossRef] [PubMed]
- Atalar, O.; Bartan, B. Ship Classification Using an Image Dataset, s2cid: 211099356. Available online: http://cs229.stanford.edu/proj2017/final-reports/5244159.pdf (accessed on 25 January 2023).
- Wang, F.; Liang, H.; Zhang, Y.; Xu, Q.; Zong, R. Recognition and Classification of Ship Images Based on SMS-PCNN Model. Front Neurorobot. 2022, 16, 889308. [Google Scholar] [CrossRef] [PubMed]
- Zhang, R.; Li, S.; Ji, G.; Zhao, X.; Li, J.; Pan, M. Survey on Deep Learning-Based Marine Object Detection. J. Adv. Transp. 2021, 2021, 5808206. [Google Scholar] [CrossRef]
- Park, H.; Ham, S.H.; Kim, T.; An, D. Object Recognition and Tracking in Moving Videos for Maritime Autonomous Surface Ships. J. Mar. Sci. Eng. 2022, 10, 841. [Google Scholar] [CrossRef]
- Heller, D.; Rizk, M.; Douguet, R.; Baghdadi, A.; Diguet, J.-P. Marine Objects Detection Using Deep Learning on Embedded Edge Devices. In Proceedings of the IEEE International Workshop on Rapid System Prototyping (RSP), part of Embedded Systems Week (ESWEEK), Shanghai (virtual), China, 13–14 October 2022. [Google Scholar]
- Redmon, J.; Divvala, S.; Girshick, R.; Farhadi, A. You Only Look Once: Unified, Real-Time Object Detection. In Proceedings of the IEEE Conference on Computer Vision and Pattern Recognition (CVPR), Las Vegas, NV, USA, 27–30 June 2016. [Google Scholar]
- Statistics—Lučka Uprava Split. Available online: https://portsplit.hr/en/port-of-split/statistics/ (accessed on 7 February 2023).
- Dahua TPC-PT8620A-TB. Available online: https://www.dahuasecurity.com/products/productDetail/26237 (accessed on 11 February 2023).
- GitHub—AlexeyAB/Yolo_mark: GUI for Marking Bounded Boxes of Objects in Images for Training Neural Network Yolo v3 and v2. Available online: https://github.com/AlexeyAB/Yolo_mark (accessed on 23 January 2023).
- Redmon, J. Darknet: Open Source Neural Networks in C. Available online: https://pjreddie.com/darknet/ (accessed on 23 January 2023).
Disclaimer/Publisher’s Note: The statements, opinions and data contained in all publications are solely those of the individual author(s) and contributor(s) and not of MDPI and/or the editor(s). MDPI and/or the editor(s) disclaim responsibility for any injury to people or property resulting from any ideas, methods, instructions or products referred to in the content. |
© 2023 by the authors. Licensee MDPI, Basel, Switzerland. This article is an open access article distributed under the terms and conditions of the Creative Commons Attribution (CC BY) license (https://creativecommons.org/licenses/by/4.0/).