Article

Analysis of Exhaust Pollutants from Four-Stroke Marine Diesel Engines Based on Bench Tests

Marine Engineering College, Dalian Maritime University, Dalian 116026, China
*
Author to whom correspondence should be addressed.
J. Mar. Sci. Eng. 2023, 11(2), 413; https://doi.org/10.3390/jmse11020413
Submission received: 4 January 2023 / Revised: 10 February 2023 / Accepted: 11 February 2023 / Published: 14 February 2023
(This article belongs to the Special Issue Advances in Sensor Technology in Smart Ships and Offshore Facilities)

Abstract

:
Implementation of new emissions regulations calls for a reassessment of the emissions levels of newly built ships sailing in Chinese regions. In this paper, marine diesel engines are subjected to emissions bench tests using high-precision testing equipment. A total of 135 marine diesel engines meeting the Limits and Measurement Methods for Exhaust Pollutants from Marine Engines (CHINA I/II) were first systematically analyzed. The emission factors of marine main engines (ME) and auxiliary engines (AE) were obtained under different displacements. The results show that the fuel-based emission factors for NOX + HC and CO meeting CHINA I/II are 25.80~44.87/16.47~46.35 and 2.47~13.22/1.64~5.62 kg/t-fuel, respectively. The energy-based emission factors for NOX + HC, CO, CO2, and PM satisfying CHINA I/II are 5.70~9.24/3.70~9.07, 0.49~2.30/0.36~0.99, 620~683/612~718, and 0.05~0.36/0.05~0.27 g/kWh, respectively. Additionally, the specific emission of NOx rises with the increase in single-cylinder displacement, so the CO emission limit of pure diesel fuel is recommended to be lower than 5 g/kWh. The results in this paper provide valuable basic data for research on and estimation of ship emissions in waterway transportation and for understanding the emission characteristics of marine diesel engines.

1. Introduction

Maritime trade results in environmental pollution to coastal cities while increasing economic benefits. Due to their routes being away from the seashore, most marine vessels spend a long time in shipping, emitting lots of toxic emissions [1,2,3,4,5]. This contributes to the regional and global toxic inventories of gaseous and particulate pollutants, negatively affecting local air quality [6,7]. Therefore, it is important to accurately quantify ships’ exhaust emissions to enable the competent authorities to formulate reasonable regulatory policies. At present, ship exhaust emissions can be evaluated with the bottom-up approach based on automatic identification systems or the top-down approach based on ship fuel consumption [8,9,10,11]. The above two predominantly applied methods depend on the energy-based and fuel-based emission factors. The energy-based emission factor represents the emission of a pollutant per unit power of diesel engine in a unit time (g/kWh), and the fuel-based emission factor refers to that of a pollutant per unit fuel quantity (g/kg-fuel).
A literature review on emission factors in marine diesel engine reveals that there are three main investigation methods: the bench test, ship-plume-based measurement, and shipboard measurement [12]. The bench test is performed in a standard environment with a high-precision instrument, producing an accurate result. In addition, it is supported by a large amount of test data and can better measure the emissions characteristics of diesel engines under different loads [6,12,13]. Xing et al. [11] statistically analyzed the test-bed emission reports of 76 and 113 marine diesel engines that met the IMO NOx Tier I and Tier II emission standards, respectively, based on which they gave the fuel-based and energy-based emission factors for NOx, CO, HC, and CO2 for main engines (MEs) and auxiliary engines (AEs). Ma et al. [14] conducted bench tests on 197 marine diesel engines, classified the statistics according to their power distribution, and, finally, gave fuel-based and energy-based emission factors for NOx, CO, HC, and CO2 for different diesel engines. Ship-plume-based measurement can analyze the characteristics of ship exhaust plumes but presents low accuracy and high uncertainty [12]. Shipboard measurement, as a currently widely accepted method, can reflect a ship’s emissions under different sailing conditions. However, the number of samples is limited, and portable testing equipment is widely used, resulting in low accuracy. Fu et al. [15] and Yin et al. [16] took 7 and 12 cargo ships in the Grand Canal as samples, respectively, to analyze and initially determine the emission factors of Chinese inland river transport ships under different operating conditions at ME powers lower than 300 kW. For ocean-going vessels, emissions of gaseous and particulate pollutants are measured with portable equipment under different navigation modes, and emission characteristics are analyzed under various sailing conditions [17,18,19,20]. Cooper [21] tested the emissions of 22 diesel engines of six ships at port, gave the specific emissions of NOX, CO, HC, CO2, SO2, and PM at different load ranges, and pointed out that the emission factors under different models and load conditions changed greatly. Agrawal et al. [22] researched the emission measurements of gases, PM, metals, ions, and elemental and organic carbons from an ocean-going container vessel and provided ME-weighted emission factors for PM and NOx in sulfur-heavy fuel oil mode. Hulskotte et al. [23] statistically analyzed the activities of 89 ocean-going ships berthed at the Rotterdam port, determined the fitting relationship between the total tonnage of all kinds of ships and fuel consumption, and revealed that the emission factors of different diesel engines are associated with the fuel type. Therefore, the environmental pollution caused by ship transportation has aroused widespread concern, and ship emission factors have been researched from numerous different perspectives.
To further prevent and control the environmental pollution caused by ship exhaust emissions, the Ministry of Ecology and Environment of the People’s Republic of China issued the Limits and Measurement Methods for Exhaust Pollutants from Marine Engines (CHINA I/II) [24], which was implemented on 1 July 2018. There are very few research studies on the emission characteristics of marine diesel engines that meet CHINA I/II. The true emission level of domestic diesel engines can be accurately reflected by establishing the emission inventory of Chinese coastal transportation ships based on the above emission factors directly. Accordingly, it is absolutely urgent and important to confirm the emission factors of ships suitable for coastal areas in China under the new emission regulations.
Therefore, this paper analyzes the emissions of 135 marine diesel engines manufactured in China by bench tests and summarizes and classifies the emission factors of NOX + HC, CO, CO2, and PM, aiming to reveal and measure ship emission characteristics in coastal and inland rivers in China. The instruments for bench testing of the diesel engine are high-precision, so the test results can reflect the emissions more accurately. The results in this paper can provide more scientific and accurate basic data for marine emission estimation and related policies in coastal areas. In addition, this paper is conductive to understanding the emission characteristics of current marine diesel engines.

2. Materials and Methods

2.1. Test Engines

In this paper, 135 four-stroke marine diesel engines produced by different manufacturers after 2018 were subjected to bench tests. According to their different uses, diesel engines are usually classified into ME for propulsion and AE for power generation. Engines with single-cylinder displacement below 30 L were conducted emission tests according to CHINA I/II. The engine power was 56–2720 kW, the cylinder diameter was 89–280 mm, and the speed was 750–3000 r/min. In this paper, the bench tests mainly included three test cycles. The E3 cycle was used for the ME, operating according to the propulsion characteristics, where the engine power is proportional to the third power of the speed. The E2 cycle was adopted for the ME operating at a constant speed, including the diesel engines for electric propulsion and driving a controllable-pitch propeller. The D2 test cycle is appropriate for an AE operating at a constant speed. The weighting factors of each power point vary in different working cycles under CHINA I/II, as listed in Table 1.

2.2. Emission Regulations

The International Maritime Organization (IMO) marine diesel engine NOX technical code [25] only stipulates NOx emission. The newly implemented CHINA I/II specifies limits not only for NOX + HC emissions, but also for CO and PM, as shown in Table 2 and Table 3. CHINA I and CHINA II are more stringent compared with the IMO NOX technical code. Therefore, manufacturers have to upgrade their diesel engine manufacturing technologies, complete the emission test again, and obtain a diesel emission permit. In addition, they are required to complete the durability test and obtain the degradation coefficient, so that the emission of the diesel engine after 10,000 h of operation will still satisfy the emission standards (CHINA I/II). Meanwhile, CH4 emission is stipulated for dual-fuel and gas engines. Compared with CHINA I, CHINA II is toughened by more than 20% for HC + NOX and by 40% for PM in general.

2.3. Test Measurement System and Bench Test

The HORIBA MEXA 1600DSEGR engine emission analyzer made in Japan was employed to measure the contents of the gaseous substances, including NOX, CO2, CO, THC, and O2 in the engine exhaust. Specific information is shown in Table 4. The test equipment was approved by the China Classification Society (CCS) and meets the specification requirements. The linearization test and NOX conversion efficiency tests are carried out every three months, and the conversion efficiency should be more than 90% to ensure the accuracy of the test results. Leakage should be checked before the test, and the zero and span are calibrated with standard gas before and after every test to ensure the accuracy of the measuring instrument.
Unlike previous regulations, the current rules for particulate emissions from ships sailing in China are clear and depend on the single-cylinder displacement. Therefore, it is necessary for the diesel engine to complete the bench test for PM emission. In this paper, PM is measured by a partial flow dilution system using the single-filter-paper sampling method. Currently, weighing the filter paper is the widely accepted method to measure PM with the highest accuracy [18]. PM is measured with the AVL SPC472 partial flow dilution tunnel sampling system made in Austria, and the diameter of the sampling filter paper is 70 mm. According to CHINA I/II, all test equipment for the bench test should be calibrated every three months, the test must be carried out as a standard experiment, and the test environment must meet the emission standards. In this way, measuring errors can be reduced greatly. Before each bench test, atmospheric temperature, humidity, and pressure are measured to ensure that the environmental parameter (fa) meets 0.93 ≤ fa ≤ 1.07, with the calculation method detailed in the Supplementary Materials. The tests are performed in laboratories with appropriate temperature and humidity, clean air, and no dust. The PM test equipment is placed in front of the gaseous pollutant test equipment. The diesel engine operates stably at each load point for 10 min, and relevant experimental data are recorded and averaged for calculation. The oil tank is usually placed at a high position, is fed by gravity into the flowmeter, and, finally, crosses a high-pressure oil pump installed by the diesel engine to inject fuel into the cylinder for combustion. The layout of the test equipment on the bench is illustrated in Figure 1.

2.4. Calculation Method

In this paper, the carbon balance method is employed to calculate the diesel exhaust flow, as detailed in the Supplementary Materials. According to CHINA I/II, the weighted average method was selected to evaluate the emission level. During the bench test, the engine power, the fuel mass flow rate, and the concentration of each component in the exhaust gas are measured at each load point. Meanwhile, the mass flow rate of each component in the exhaust gas is calculated based on the fuel element content. According to the above conditions, the fuel-based and energy-based emission factors can be calculated with Equations (1) and (2), respectively. The PM energy-based emission factors can be calculated with Equation (3):
EF f = i = 1 n Q mags , i · W F , i Q mf , i
EF gas e = i = 1 n Q mags , i · W F , i i = 1 n P i · W F , i · 10 3
EF PM e = PM mass i = 1 n P i · W F , i
Marign = Avg . Limit Limit · 100 %
where EFf is the fuel-based emission factor (kg/t-fuel); Qmags is the emission mass flow rate of the individual gas (kg/h); Qmf is the fuel flow rate (t/h); WF is the weighting factor (as shown in Table 1); i is the test power point (Table 1); EFegas is the energy-based emission factor of the gaseous substance (g/kWh); P is the power at each test load point (kW); EFePM is the PM energy-based emission factor (g/kWh); PMmass is the PM exhaust mass flow rate (g/h); Margin is the percentage between the measured value and the limit value (%); Avg. is the average value (Tables S4 and S5); and Limit is the limit value (Table 2 and Table 3).

2.5. Fuel Information

The fuel selected for the bench tests is vehicle diesel, and its performance is better than that of marine diesel oil (MDO). As the carbon balance calculation method is adopted, the contents of carbon (C), hydrogen (H), oxygen (O), and nitrogen (N) elements should be confirmed. At the end of each test, the fuel is sampled, and its element composition is analyzed in a professional testing institution. The analysis results for fuel elements and characteristics are shown in Table S1.

3. Results and Discussion

According to CHINA I/II, the diesel engines were classified according to their single-cylinder displacement during the data statistical analysis, as shown in Table 5.

3.1. Fuel-Based Average Emission Factors

When the top-down approach is adopted to evaluate the exhaust emissions of a ship, it is important to accurately calculate the total amount of fuel consumed and to determine the fuel-based emission factors. The mass flow of each exhaust gas component is calculated according to the method given in CHINA I and CHINA II. The fuel-based emission factors of NOX, CO, CO2, and HC can be calculated according to Equation (1). Figure 2 and Figure 3 show the fuel-based emission factors of diesel engines that meet CHINA I and CHINA II. Since the single-cylinder displacement of the diesel engine is classified according to CHINA I/II, the data in the figures and tables are statistically analyzed according to the single-cylinder displacement of the diesel engine. The results in the figures are averaged based on the statistics of the number of samples, and the maximum and minimum calculated values are given to represent the discrete range of the data. No discrete range is given, indicating that there is only one diesel engine. The number of diesel engines in each displacement interval is shown in Supplementary Material Table S2.
As illustrated in Figure 2 and Figure 3, the NOX fuel-based emission factors of ME and AE gradually increase with an increase in the single-cylinder displacement. The CO and HC fuel-based emission factors exhibit no obvious change rule. The CO2 fuel-based emission factor mainly depends on carbon content [20] instead of engine operating cycle, single-cylinder displacement, or engine power. A research report from the IMO [9] gives the reference value for the CO2 fuel-based emission factor as 3206 kg/t-fuel, which is calculated according to the content and the molecular weight of carbon in the fuel. Due to their different carbon content and the influence of combustion efficiency, the measured result differs from the theoretically calculated value. Fossil fuels emit more CO2 due to their higher carbon contents. If the initial IMO strategy is to reduce the carbon intensity of international shipping by 70% and total annual greenhouse gas emissions by at least 50% by 2050 compared to the values in 2008, new technologies need to be developed, including alternative energy sources or carbon recovery [26,27].

3.2. Energy-Based Average Emission Factors

The mass flow rate for each exhaust gas component can be calculated according to the emission standards. With the corresponding test load point power, the energy-based emission factors for NOX + HC, CO, CO2, and PM can be calculated with Equations (2) and (3), as shown in Figure 4 and Figure 5 and Tables S4 and S5. The calculation method for the margin is expressed in Equation (4), and Tables S4 and S5 list the margins for NOX + HC, CO, and PM.
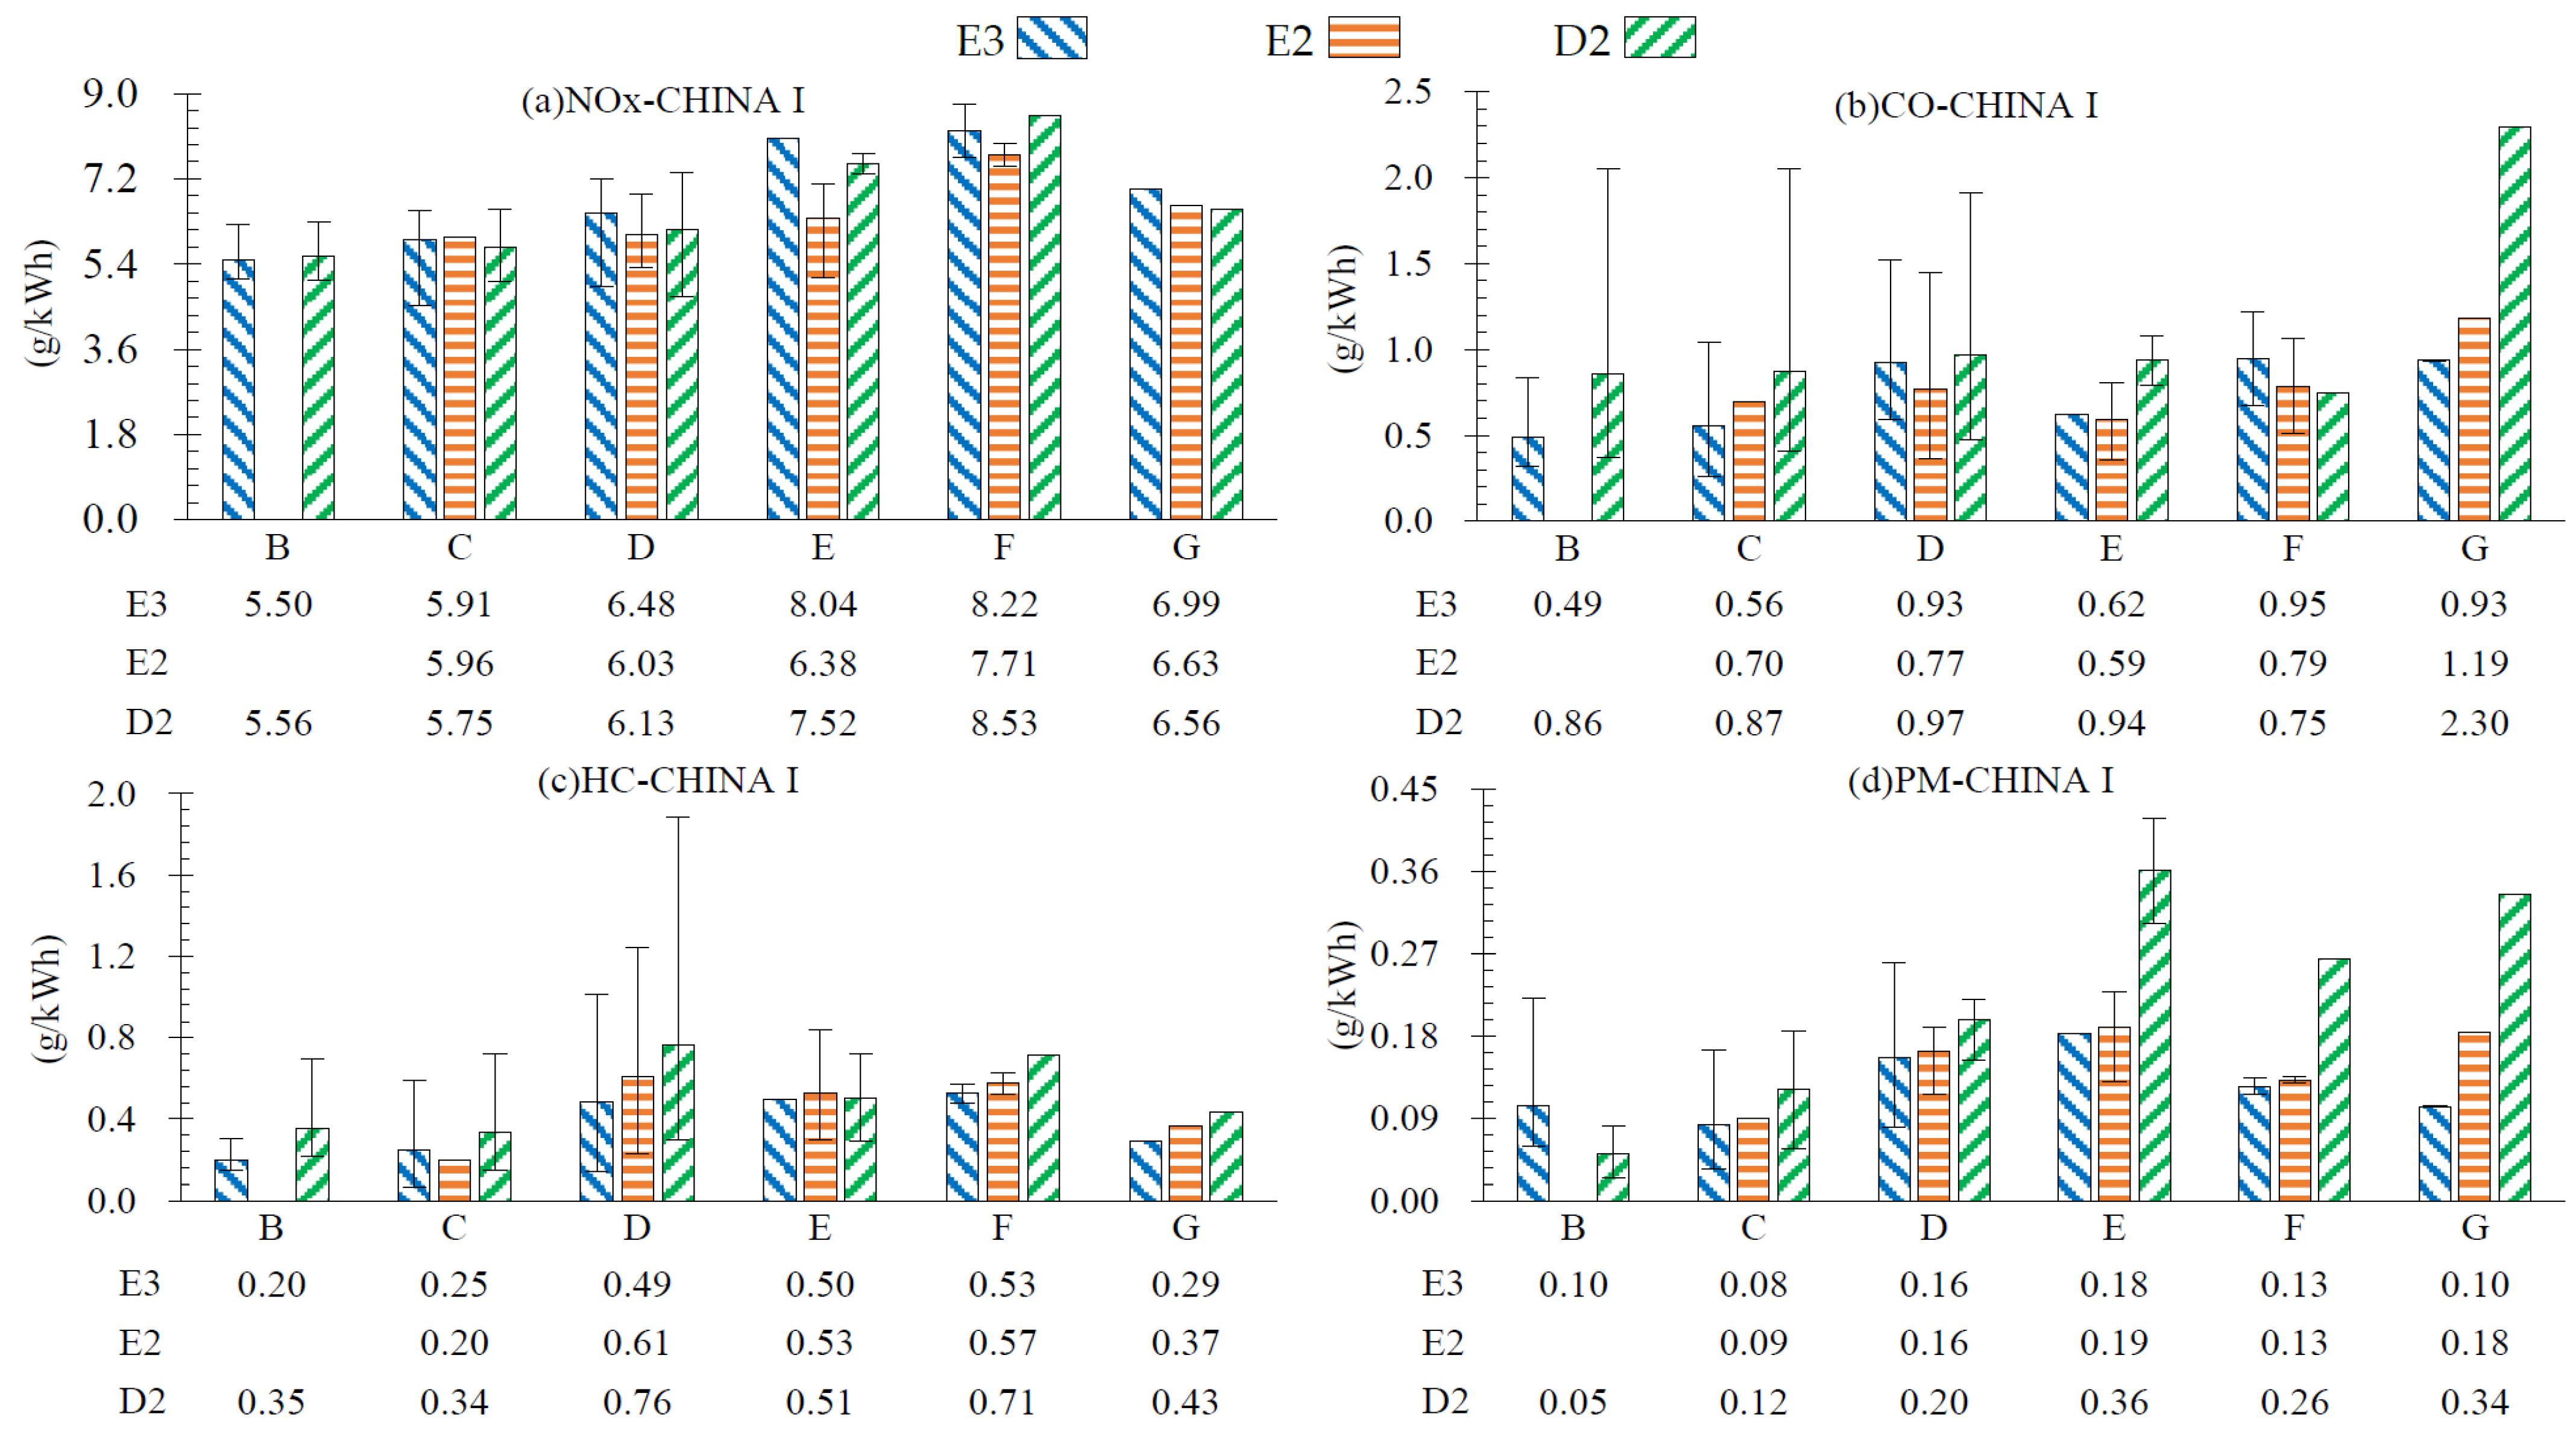
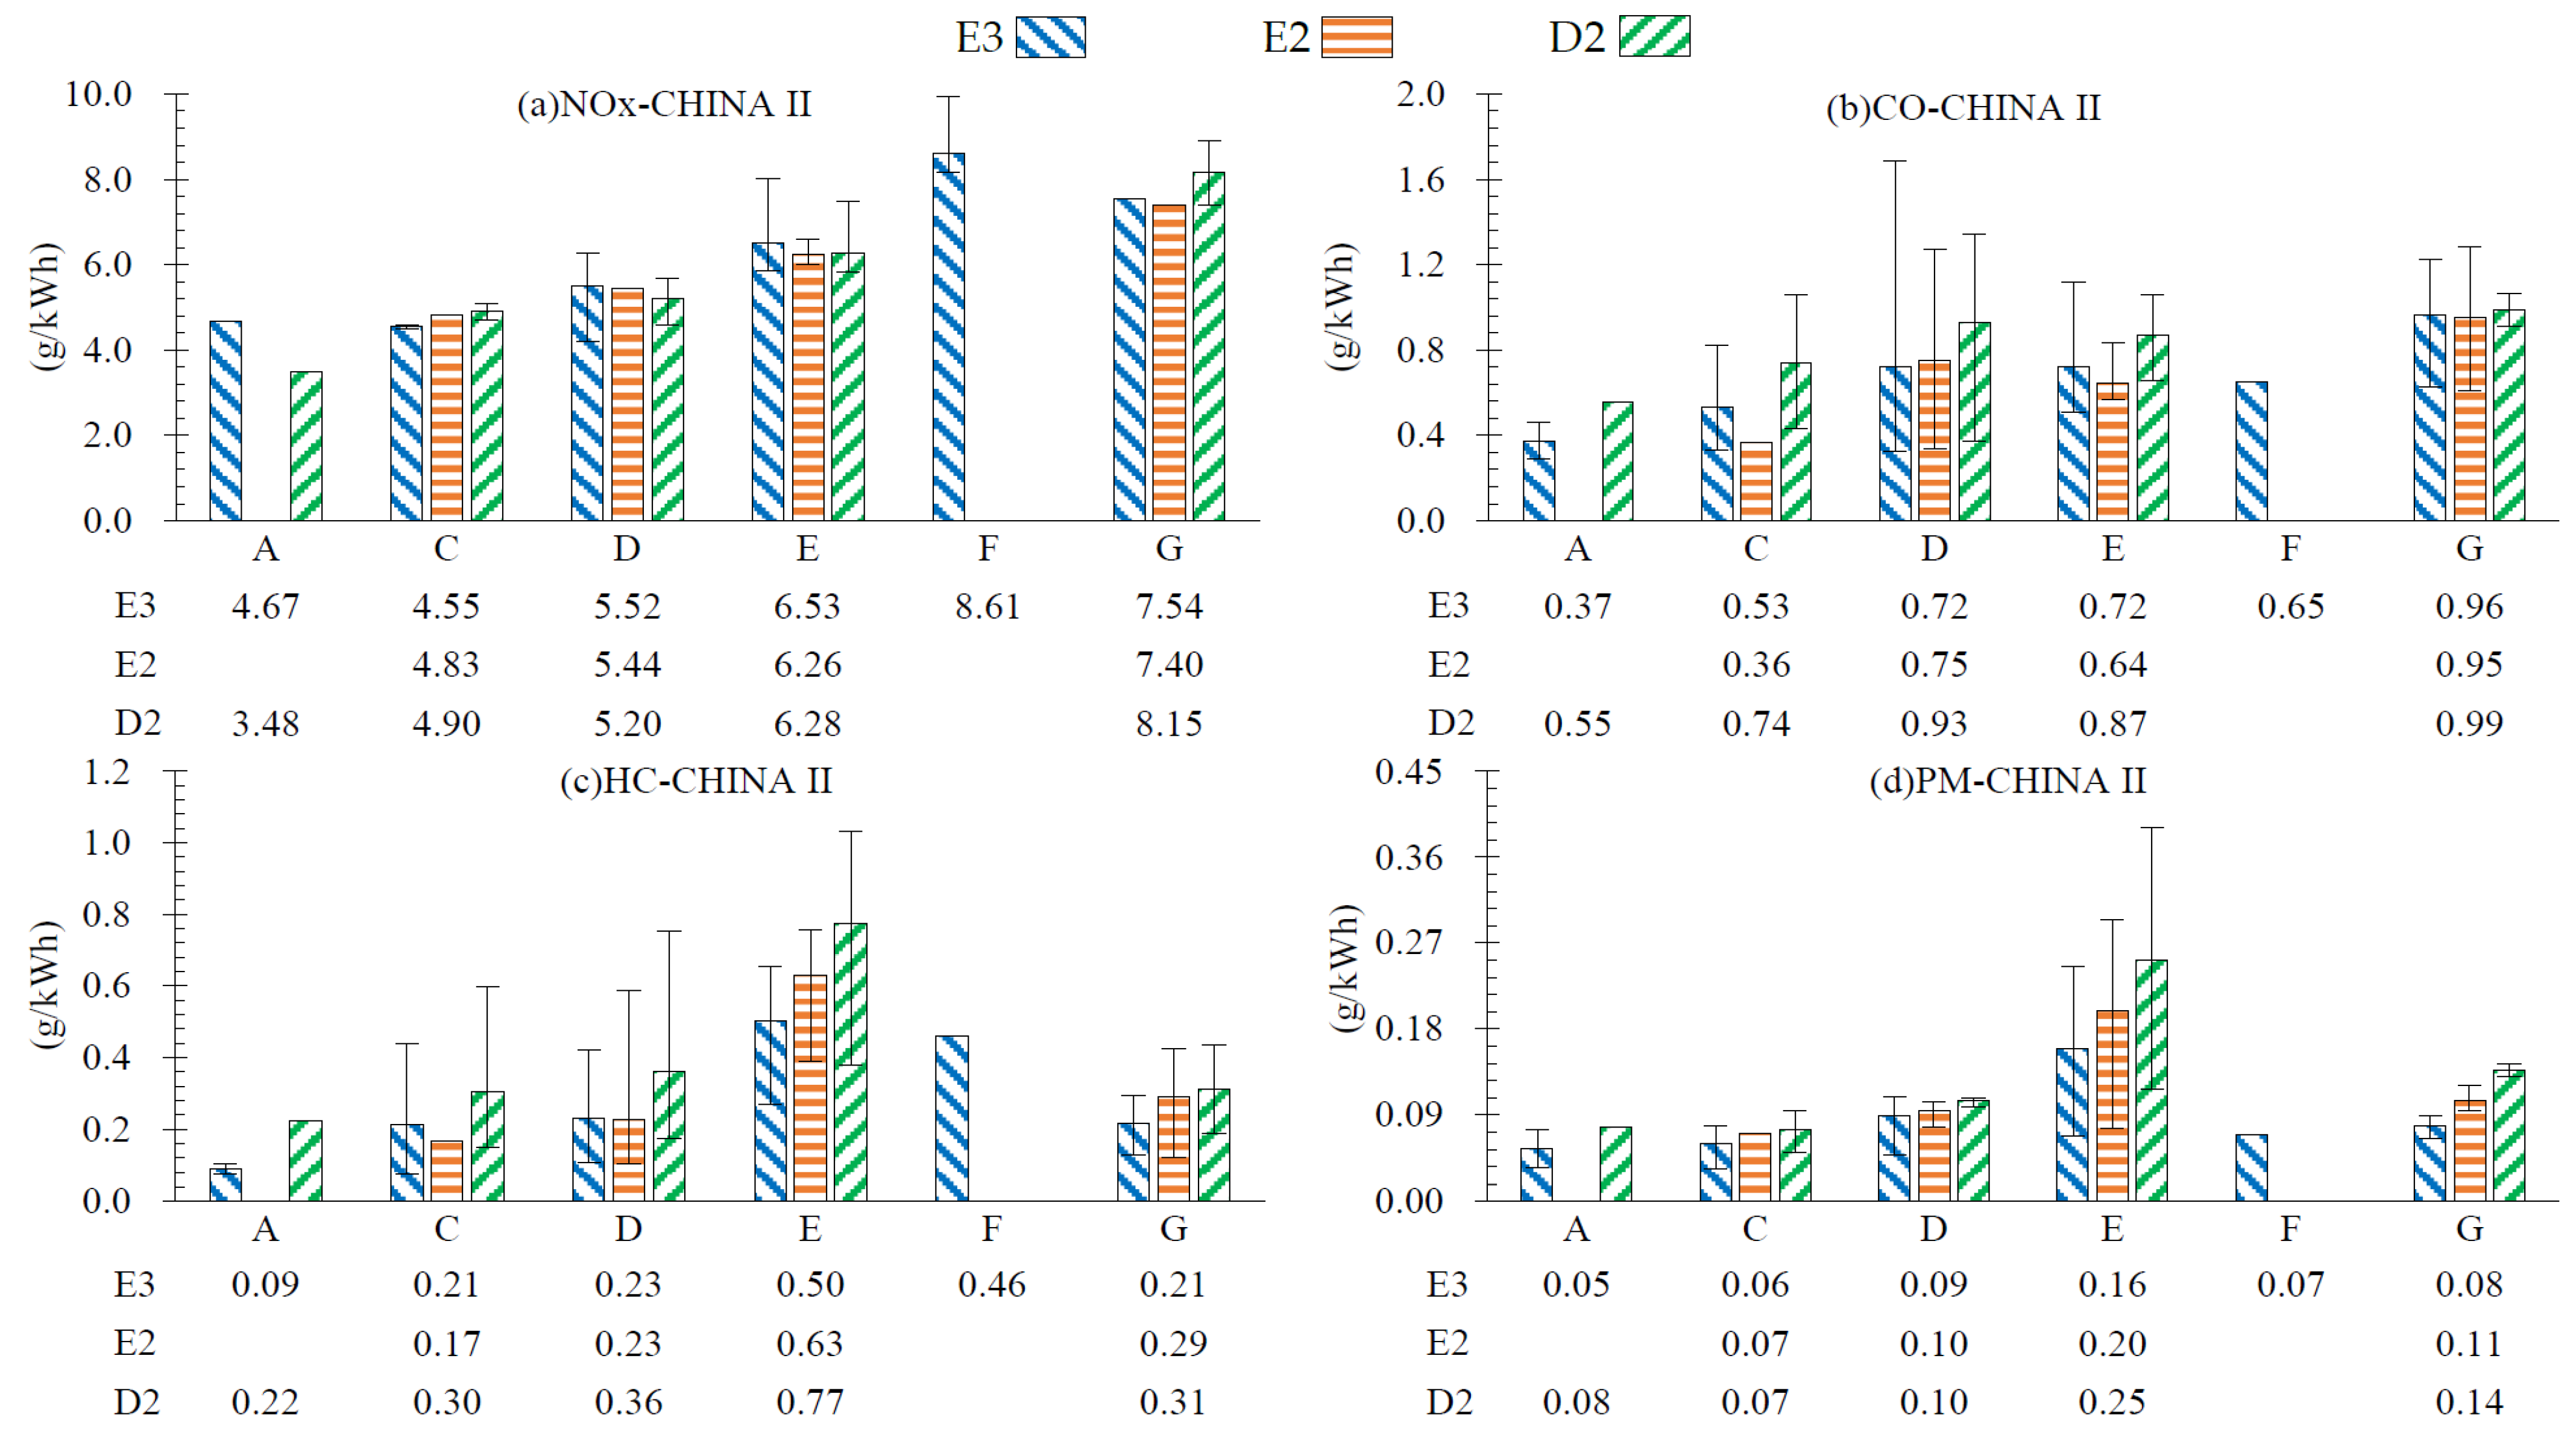
Figure 4 and Figure 5 demonstrate that, with an increase in single-cylinder displacement, the NOX energy-based emission factor rises gradually, except for at displacement G. Tables S4 and S5 suggest that the average margin of the NOX + HC energy-based emission factor is lower than 20%, while a smaller portion of the mean margins are higher than 20%, which is subject to the number of samples. The average margin of the PM energy-based emission factor is above 25%, which is larger due to the trade-off relationship between NOX and PM. A diesel engine with small single-cylinder displacement exhibits a higher rated speed, suggesting a shorter combustion duration and a lower NOX energy-based emission factor. For CO, the maximum measured value meeting CHINA I is 2.3 g/kWh, leaving a margin of 54% compared with the limit value of 5.0 g/kWh. The maximum measured CO value meeting CHINA II is 1.12 g/kWh, with a margin of 78%. The above results indicate that, if diesel is used only, the CO emission limit can be reduced further. The CO2 energy-based emission factor will be greater for a higher fuel consumption of the diesel engine [9].

3.3. Energy-Based Emission Factors under Different Load Conditions

A ship sailing in a port area will generate varying amounts of emissions under different operating modes due to the influence of uncontrollable factors. There are three common navigation modes for a ship—berthing, maneuvering, and cruising [12,18,28,29]—under which the diesel engine and ship speed vary. Therefore, the emissions of the diesel engine differ due to the sailing modes. Bench tests provide a better understanding of the emission characteristics of the engine under different loads, enabling the acquisition of real emission factors. Based on bench tests, the differences between engine emissions under laboratory conditions and those in the real world can be understood better. In this paper, the energy-based emission factors at each test load point are calculated and averaged. Figure 6, Figure 7 and Figure 8 illustrate the relationships between the energy-based emission factors of each type and engine load.
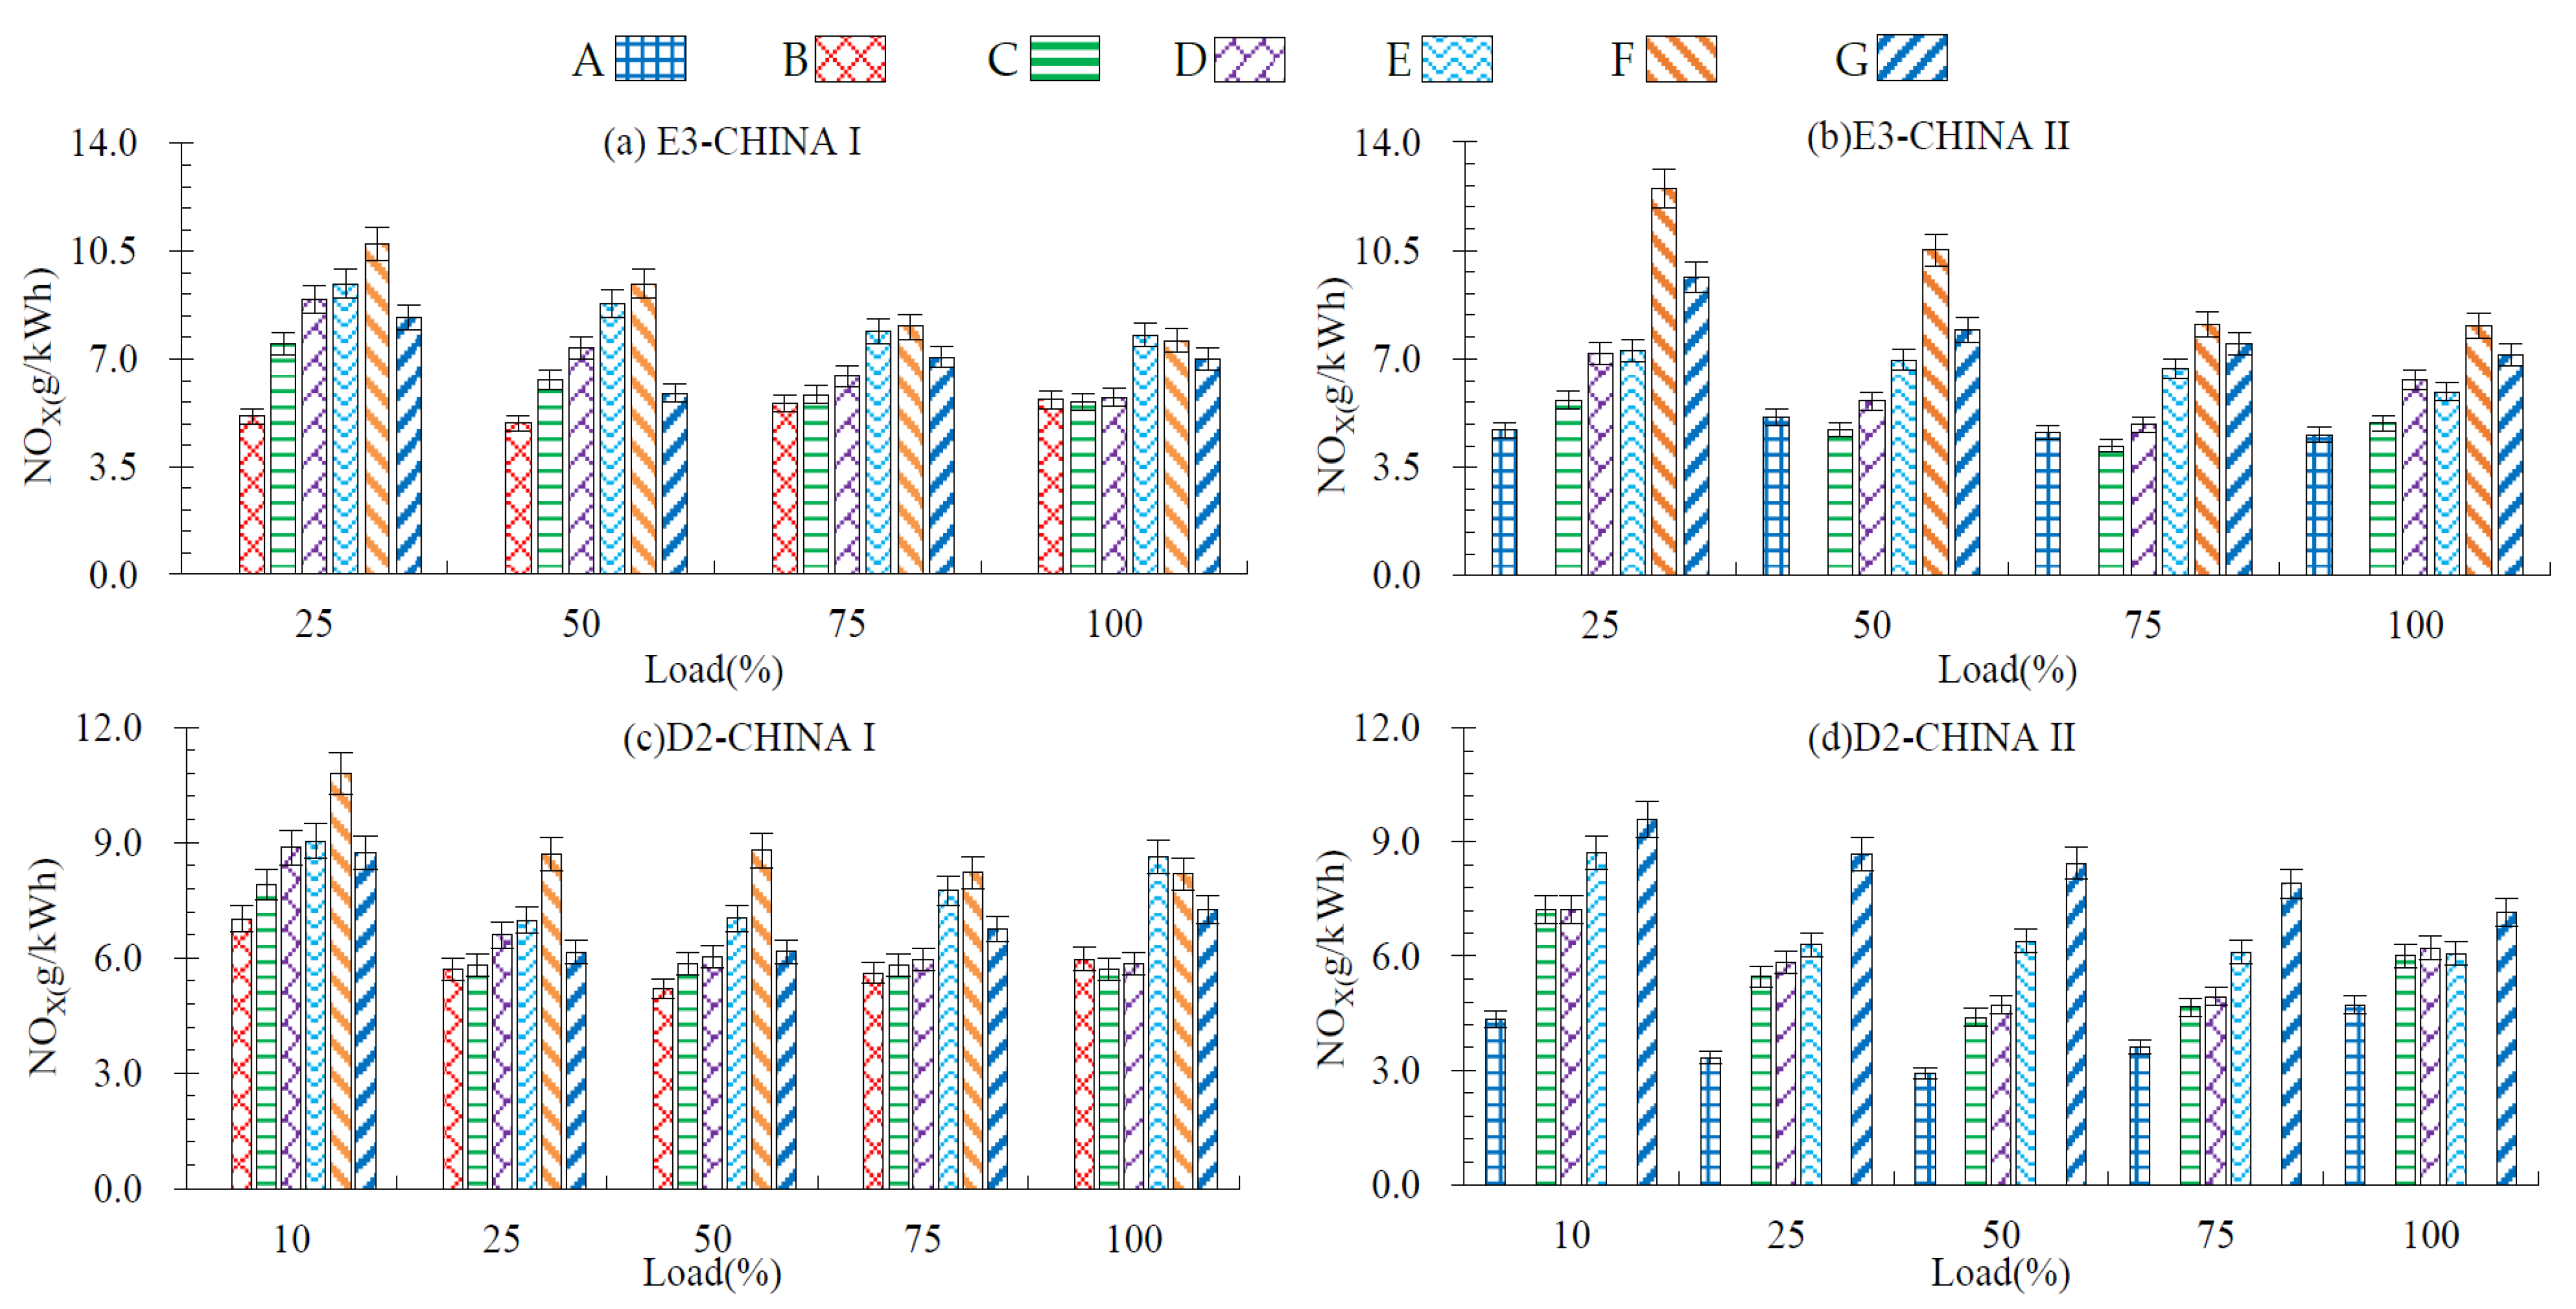
With a decrease in the ME load, the specific emission of NOX shows an increasing trend in general, as demonstrated in Figure 6a,b. The speed of an ME operating under the E3 cycle is only 63% of the rated speed when the engine operates at 25% load, as shown in Table 1. Engine load and speed decrease simultaneously, and the stable intake air flow and sufficient oxygen content promote the complete combustion of fuel. In addition to this, the long mixing time of oil and gas in the cylinder is conducive to NOX generation [18,30]. Due to the weak work capacity of the engine at the 25% load point, the specific emissions of NOx from Class C to Class G are larger than those at other load points. At a high load, the engine speed increases, the retention time of nitrogen and oxygen in the cylinder becomes shorter, and the work capacity of the diesel engine is enhanced, reducing the specific emission of NOx. The engines in Class A and Class B are electrically controlled at high speed, and some single point optimization measures would be considered to meet the emission standard. As revealed in Figure 6c,d, the engine operates as a generator with a constant speed and the engine power is proportional to the torque. At a 10% load, the oil supply per cycle is decreased, and the temperature in the cylinder is reduced, but the NOx specific emission becomes larger, which results from the weak work ability of the engine in a low load working condition. Under a high-load condition, the concentration of NOx increases, and the engine exhibits a strong work ability, reducing the NOx specific emission. The results discussed here are consistent with several previous studies [14,16,31] showing that the higher the engine load, the lower the NOX specific emission.
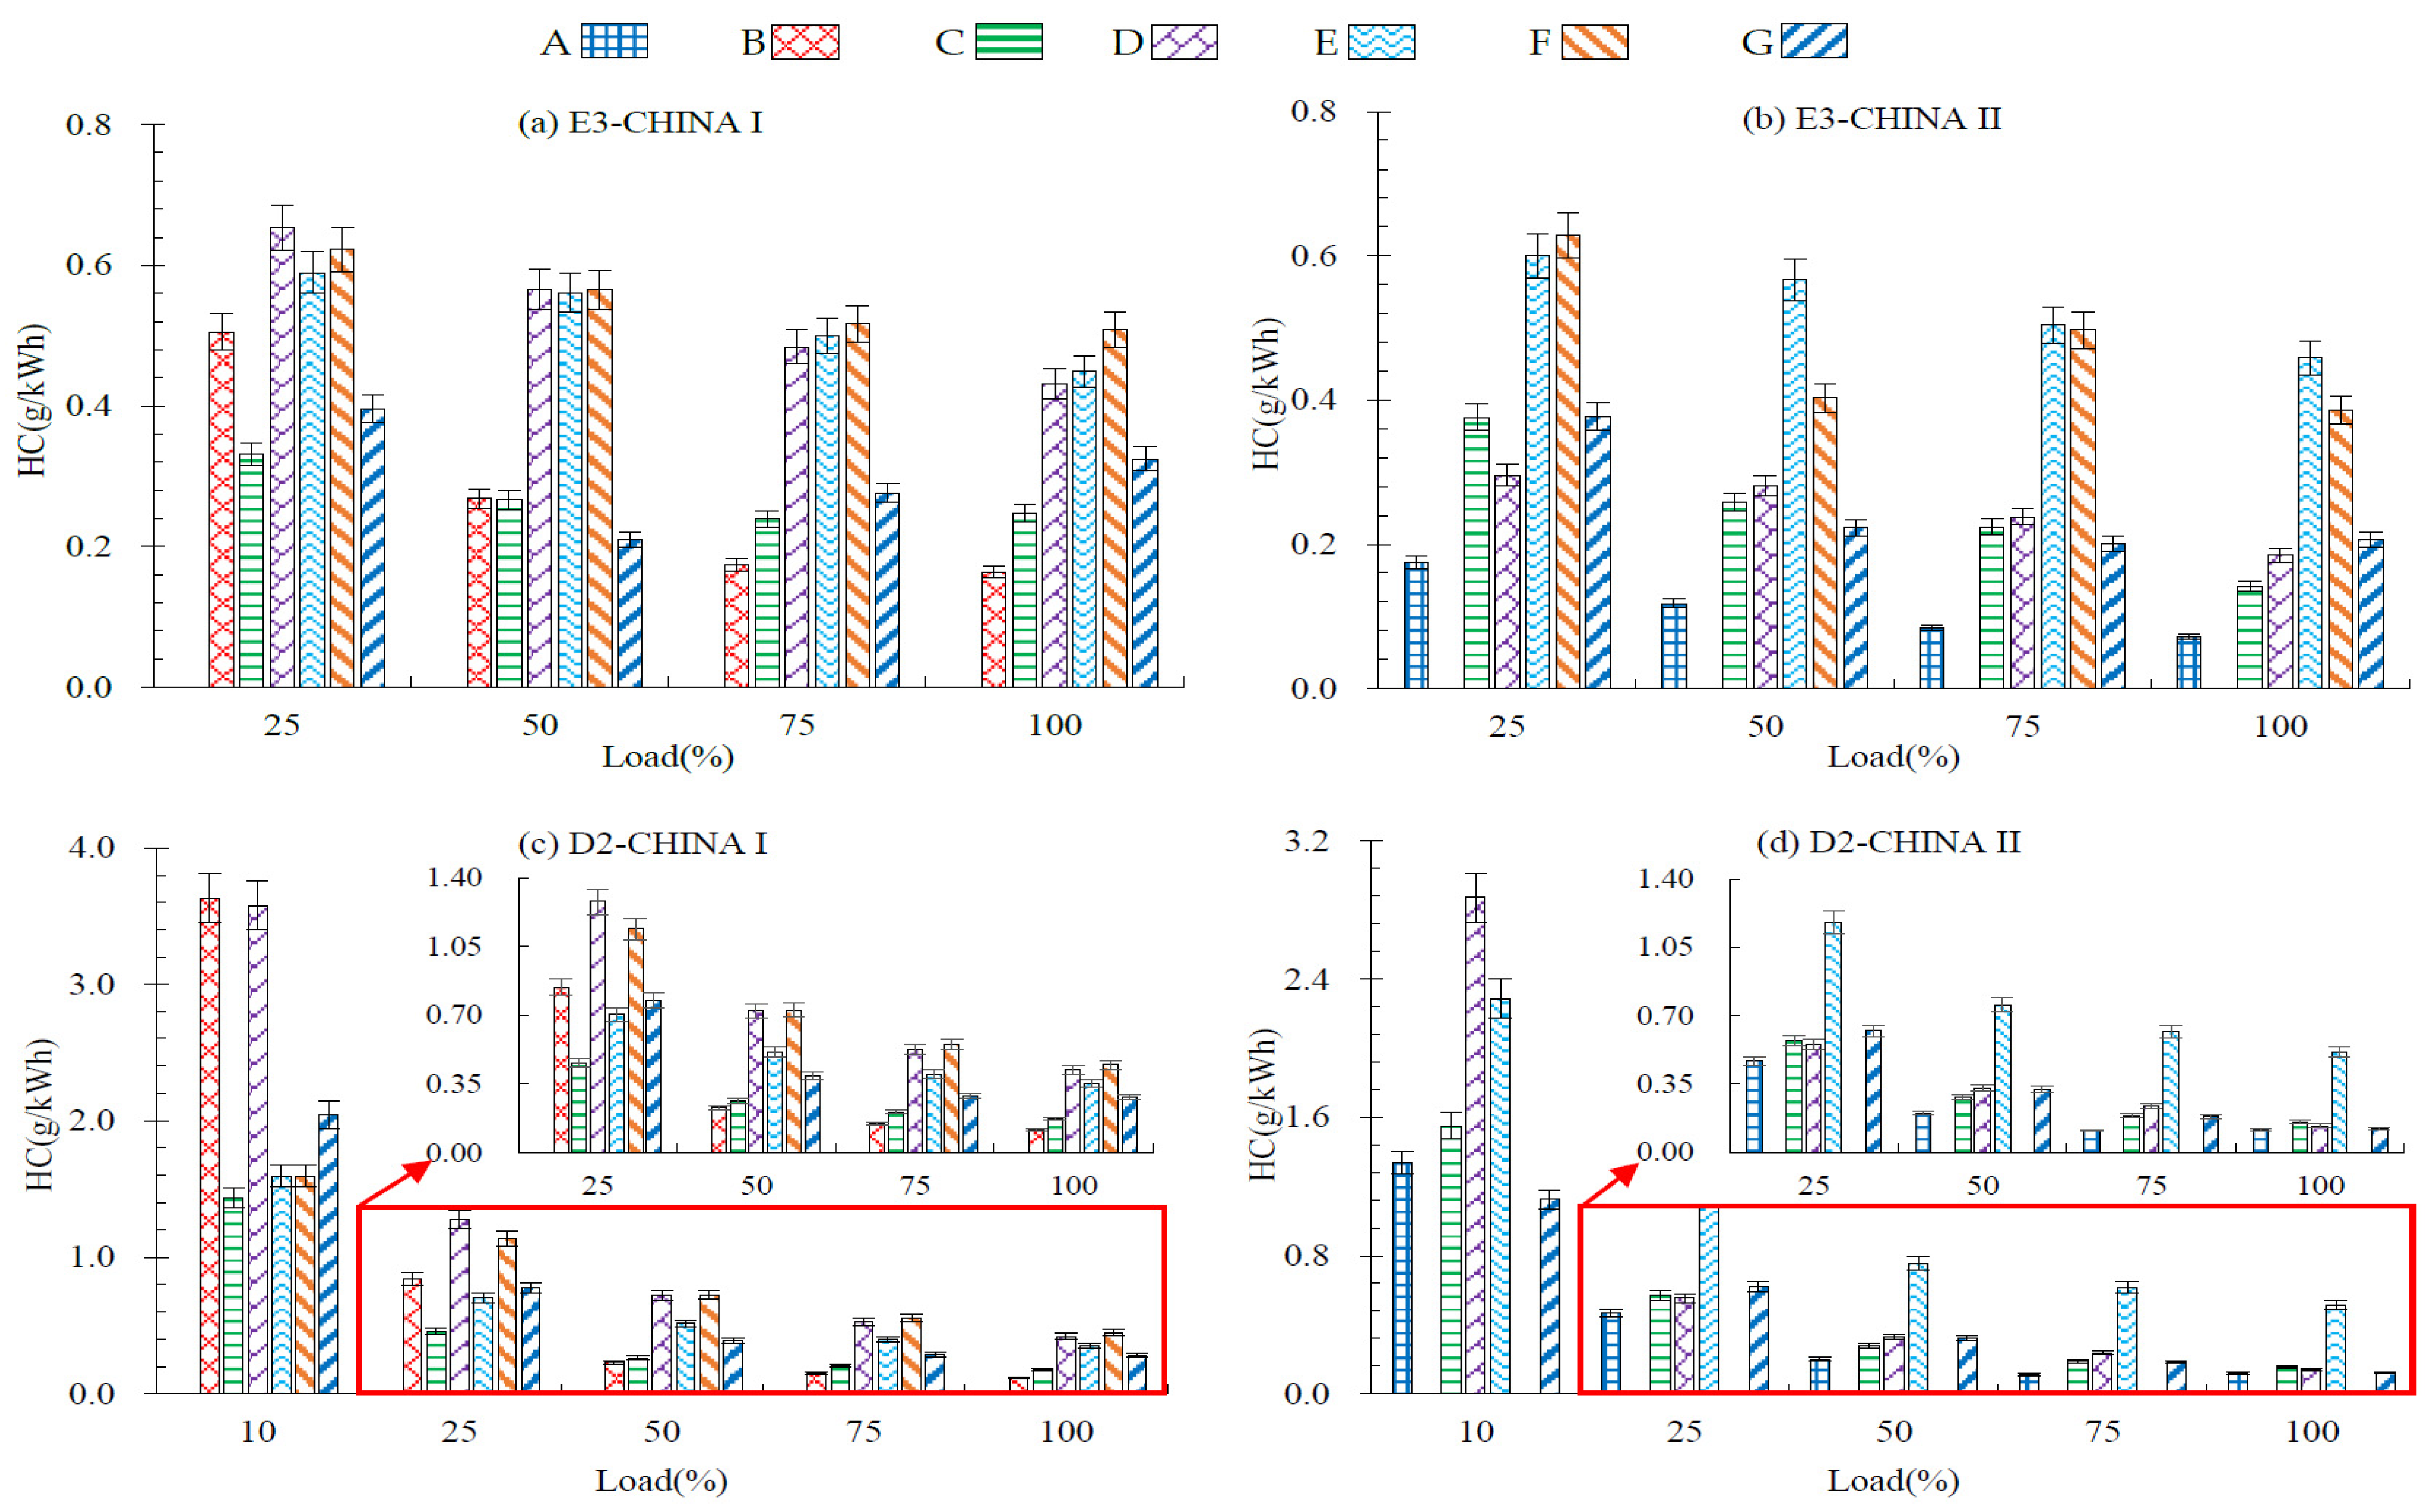
The HC specific emission of the ME varies steadily, is below 0.7 g/kWh in general, and shows an increasing trend at a 50% load, as displayed in Figure 7a,b. For the AE, the HC-specific emission is relatively stable and at a low level when the engine load is above 50%, but increases significantly when the engine load is lower than 25% (Figure 7c,d). When the diesel engine operates at a low load, the oil supply per cycle is reduced and the temperature inside the combustion chamber decreases, and the local mixture of oil and gas is uneven [18]. The diesel engine presents a weak work capacity at a low load, elevating the HC specific emission.
As disclosed in Figure 8a,b, CO specific emission is relatively elevated when the ME load is under 50% and is highest at a 25% load for most MEs. When the diesel engine operates at a low load, the temperature inside the combustion chamber lowers, the reactivity of oil and gas is low, and the concentration of oil and gas near the boundaries of the combustion chamber is low, resulting in a higher CO specific emission. Figure 8c,d present the CO specific emission of the AEs. It is relatively stable when the load is above 50% and significantly increases when the load is lower, which is consistent with findings in previous research [31]. In general, the specific change characteristics of CO emission are similar to those of HC for both ME and AE, which are mainly affected by the combustion conditions. This is consistent with the results of previous research [18]. As mentioned above, the diesel engine exhibits a weak work capacity at a low load, which can elevate CO specific emission. Under the D2 cycle, the weight factors of 25% and 10% load points account for 40%. In response to CHINA II, the 25% and 10% load points should be considered and optimized. As can be observed in Figure 8, the CO specific emission is lower than 2.4 g/kWh overall at a 25% engine load, and it is reduced further when the load is above 50%. The weighted specific emission would be smaller, which proves that the limit value given in the specification should be further reduced.
The PM generated by ships is mainly attributed to the combustion of fuel oil [32]. Generally speaking, PM is mainly produced in oil-rich areas, where there is a lack of oxygen and the temperature is also too low for a reaction. The fuel type affects the sulfate composition and elemental composition greatly, thus exerting an important role in PM production [20,21]. There will be more PM if heavy oils with high sulfur content (sulfate and metal oxide ash constituents) are used. The PM specific emission of the diesel engine under the D2 cycle is higher than that under the E3 cycle, so it is more difficult for the D2 cycle to meet the emission standards, as illustrated in Figure 4 and Figure 5. When the AE is tested at the 10% load point, the oil and gas are not mixed uniformly, and temperature in the combustion chamber is low, resulting in inadequate combustion and higher PM emission.
During the bench test, data acquisition, and statistical analysis, there are some uncertain factors, such as measurement error and data underrepresentation. Firstly, the number of diesel engines tested in some displacement ranges is insufficient, resulting in some data with low representativeness. Secondly, the engines for the bench test are newly assembled, and the emission level will change after several years of use. Additionally, the emissions levels of some pollutants from the engines will be elevated according to the deterioration experiments of some diesel engine manufacturers. Therefore, the deterioration coefficient of the diesel engine is recommended to be included in evaluation of the exhaust emissions of a ship. For safe navigation, the ship is in maneuvering mode and the ME is in a low-load mode during the port area voyage [12,17]. In addition, ME is the main source of marine exhaust pollution [33]. The results obtained here indicate that diesel engines mostly operate at low loads and exhibit elevated specific emissions when sailing near port areas, emitting large amounts of pollutants. Therefore, port cities should control the emission from ships sailing in port areas to lower the resultant threat to people’s health.

4. Conclusions

In this paper, standard test equipment was selected for bench tests to analyze the emissions of 135 marine diesel engines of different uses. In addition, induction and analysis were carried out according to CHINA I/II for the first time. Due to the limited number of testing engines, the conclusions can be a reference only.
The fuel-based emission factors under the E3, E2, and D2 cycles were given. The NOX + HC fuel-based emission factors meeting CHINA I/II are 25.80~44.87/21.58~46.35, 29.30~40.47/23.39~38.36, and 27.34~42.07/16.47~41.55 kg/t-fuel, respectively. The CO fuel-based emission factors meeting CHINA I/II are 2.47~5.76/1.64~5.46, 3.16~7.78/1.85~5.21, and 4.05~13.22/3.21~5.62 kg/t-fuel, respectively. The CO2 fuel-based emission factor is 3043–3121 kg/t-fuel in this paper, which mainly depends on the fuel’s carbon content instead of the engine operating cycle or the single-cylinder displacement.
The energy-based emission factors under the E3, E2 and D2 cycles which meet CHINA I/II were presented. The NOX + HC energy-based emission factors are 5.70~8.75/4.76~9.07, 6.16~8.28/5.00~7.69, and 5.91~9.24/3.70~8.46 g/kWh, respectively. The CO energy-based emission factors are 0.49~0.95/0.37~0.96, 0.59~1.19/0.36~0.95, and 0.75~2.30/0.55~0.99 g/kWh, respectively. The CO2 energy-based emission factors are 620~683/612~699, 629~657/624~690, and 658~679/619~718 g/kWh, respectively. The PM energy-based emission factors are 0.08~0.18/0.05~0.16, 0.09~0.19/0.07~0.27, and 0.05~0.36/0.07~0.25 g/kWh, respectively.
With an increase in the single-cylinder displacement, the NOX + HC emission factors gradually increase. As for the CO emission limit, the emission standards should be specified separately according to the fuel type. The research results in this paper suggest that the CO emission limit of pure diesel fuel should be reduced in view of CHINA II. With more bench emission tests, the emission levels of marine diesel engines in China can be more comprehensively and accurately grasped. The research results of this paper can provide a basis for the port management department to formulate control policies for ship emissions.

Supplementary Materials

The following supporting information can be downloaded at: https://www.mdpi.com/article/10.3390/jmse11020413/s1, Table S1: Fuel elements and characteristics statistical results; Table S2: Fuel-based emission factors-CHINA I emission standard; Table S3: Fuel-based emission factors-CHINA II emission standard; Table S4: Energy-based emission factors-CHINA I emission standard; Table S5: Energy-based emission factors-CHINA II emission standard; Table S6: Carbon balance calculation method; Table S7: Marine diesel engine parameters under CHINA I emission standard (E3-cycle); Table S8: Marine diesel engine parameters under CHINA I emission standard (E2-cycle); Table S9: Marine diesel engine parameters under CHINA I emission standard (D2-cycle); Table S10: Marine diesel engine parameters under CHINA II emission standard (E3-cycle); Table S11: Marine diesel engine parameters under CHINA II emission standard (E2-cycle); Table S12: Marine diesel engine parameters under CHINA II emission standard (D2-cycle).

Author Contributions

Methodology, S.D. and P.S.; software, T.D., K.W. and H.X.; validation, H.X.; formal analysis, Z.M. and P.S.; investigation, Z.M.; resources, H.Q.; data curation, S.D. and H.Q.; writing—original draft preparation, Z.M.; writing—review and editing, Z.M., T.D. and Y.Z.; supervision, P.S.; project administration, P.S.; funding acquisition, K.W. and P.S. All authors have read and agreed to the published version of the manuscript.

Funding

This research was funded by the National Natural Science Foundation of China (Grant Nos. 52271305).

Institutional Review Board Statement

Not applicable.

Informed Consent Statement

Not applicable.

Data Availability Statement

Data is available on request from the corresponding authors.

Conflicts of Interest

The authors declare no conflict of interest.

Abbreviations and Definitions

TermExplanationTermExplanation
MEMain EnginegGram
AEAuxiliary EnginekgKilogram
NOXNitrogen OxidestTonne
HCHydrocarbonNDIRNon dispersive Infrared detection
COCarbon MonoxideCLDChemi-uminescent detection
CO2Carbon DioxideMPDMagnetic pneumatic detection
O2OxygenHFIDHeated flame ionization detection
PMParticulate MatterPTPoint
SO2Sulfur DioxideFSFull Scale
CH4MethaneCCarbon
kWhKilo Watt-hourHHydrogen
SVSingle-cylinder displacementOOxygenium
LVolume unit, literNNitrogen
PPowerSSulphur

References

  1. Yusuf, A.A.; Yusuf, D.A.; Jie, Z.; Bello, T.Y.; Tambaya, M.; Abdullahi, B.; Muhammed-Dabo, I.A.; Yahuza, I.; Dandakouta, H. Influence of waste oil-biodiesel on toxic pollutants from marine engine coupled with emission reduction measures at various loads. Atmos. Pollut. Res 2022, 13, 101258. [Google Scholar] [CrossRef]
  2. Yusuf, A.A.; Inambao, F.L.; Ampah, J.D. Evaluation of biodiesel on speciated PM2.5, organic compound, ultrafine particle and gaseous emissions from a low-speed EPA Tier II marine diesel engine coupled with DPF, DEP and SCR filter at various loads. Energy 2022, 239, 121837. [Google Scholar] [CrossRef]
  3. Alanen, J.; Isotalo, M.; Kuittinen, N.; Simonen, P.; Martikainen, S.; Kuuluvainen, H.; Honkanen, M.; Lehtoranta, K.; Nyyss¨onen, S.; Vesala, H.; et al. Physical characteristics of particle emissions from a medium speed ship engine fueled with natural gas and low-sulfur liquid fuels. Environ. Sci. Technol. 2020, 54, 5376–5384. [Google Scholar] [CrossRef] [PubMed]
  4. Lang, J.; Zhou, Y.; Chen, D.; Xing, X.; Wei, L.; Wang, X.; Zhao, N.; Zhang, Y.; Guo, X.; Han, L.; et al. Investigating the contribution of shipping emissions to atmospheric PM2.5 using a combined source apportionment approach. Environ. Pollut. 2017, 229, 557–566. [Google Scholar] [CrossRef] [PubMed]
  5. Toscano, D.; Murena, F. Atmospheric ship emissions in ports: A review. Correlation with data of ship traffic. Atmos. Environ. X 2019, 4, 100050. [Google Scholar] [CrossRef]
  6. Jiang, H.; Wu, G.; Li, T.; He, P.; Chen, R. Characteristics of particulate matter emissions from a low-speed marine diesel engine at various loads. Environ. Sci. Technol. 2019, 53, 11552–11559. [Google Scholar] [CrossRef]
  7. Sommer, D.E.; Yeremi, M.; Son, J.; Corbin, J.C.; Gagn´e, S.; Lobo, P.; Miller, J.W.; Kirchen, P. Characterization and reduction of in-use CH4 emissions from a dual fuel marine engine using wavelength modulation spectroscopy. Environ. Sci. Technol. 2019, 53, 2892–2899. [Google Scholar] [CrossRef]
  8. Miola, A.; Ciuffo, B. Estimating air emissions from ships: Meta-analysis of modelling approaches and available data sources. Atmos. Environ. 2011, 45, 2242–2251. [Google Scholar] [CrossRef]
  9. IMO. Third IMO GHG Study 2014 Executive Summary and Final Report; IMO: London, UK, 2014; pp. 1–295. [Google Scholar]
  10. Nunes, R.A.O.; Alvim-Ferraz, M.D.C.; Martins, F.; Sousa, S. The activity-based methodology to assess ship emissions-A review. Environ. Pollut. 2017, 231, 87–103. [Google Scholar] [CrossRef]
  11. Xing, H.; Duan, S.; Huang, L.; Han, Z.; Liu, Q. Testbed-Based Exhaust Emission Factors for Marine Diesel Engines in China. Huan Jing Ke Xue Huanjing Kexue 2016, 37, 3750–3757. [Google Scholar]
  12. Chu-Van, T.; Ristovski, Z.; Pourkhesalian, A.; Rainey, T.; Garaniya, V.; Abbassi Jahangiri, S.; Enshaei, H.; Kam, U.; Kimball, R.; Yang, L.; et al. On-board measurements of particle and gaseous emissions from a large cargo vessel at different operating conditions. Environ. Pollut. 2018, 237, 832–841. [Google Scholar] [CrossRef] [PubMed] [Green Version]
  13. Reda, A.A.; Schnelle-Kreis, J.; Orasche, J.; Abbaszade, G.; Lintelmann, J.; Arteaga-Salas, J.M.; Stengel, B.; Rabe, R.; Harndorf, H.; Sippula, O.; et al. Gas phase carbonyl compounds in ship emissions: Differences between diesel fuel and heavy fuel oil operation. Atmos. Environ. 2015, 112, 370–380. [Google Scholar] [CrossRef]
  14. Ma, Z.; Yang, Y.; Sun, P.; Xing, H.; Duan, S.; Qu, H.; Zou, Y. Analysis of Marine Diesel Engine Emission Characteristics of Different Power Ranges in China. Atmosphere 2021, 12, 1108. [Google Scholar] [CrossRef]
  15. Fu, M.; Ding, Y.; Ge, Y.; Yu, L.; Yin, H.; Ye, W.; Liang, B. Real-world emissions of inland ships on the Grand Canal, China. Atmos. Environ. 2013, 81, 222–229. [Google Scholar] [CrossRef]
  16. Yin, H.; Ding, Y.; Ge, Y.; Ye, W.; Wang, J.; Bai, T.; Qian, L. Emissions characteristics of diesel engines for inland waterway vessels in China. Res. Environ. Sci. 2014, 27, 470–476. [Google Scholar]
  17. Huang, C.; Hu, Q.Y.; Wang, H.Y.; Qiao, L.P.; Jing, S.A.; Wang, H.L.; Zhou, M.; Zhu, S.H.; Ma, Y.G.; Lou, S.R.; et al. Emission factors of particulate and gaseous compounds from a large cargo vessel operated under real-world conditions. Environ. Pollut. 2018, 242, 667–674. [Google Scholar] [CrossRef]
  18. Wang, C.; Hao, L.; Ma, D.; Ding, Y.; Lv, L.; Zhang, M.; Wang, H.; Tan, J.; Wang, X.; Ge, Y. Analysis of ship emission characteristics under real-world conditions in China. Ocean Eng. 2019, 194, 106615. [Google Scholar] [CrossRef]
  19. Peng, W.; Yang, J.; Corbin, J.; Trivanovic, U.; Lobo, P.; Kirchen, P.; Rogak, S.; Gagn, S.; Miller, J.; Cocker, D. Comprehensive analysis of the air quality impacts of switching a marine vessel from diesel fuel to natural gas. Environ. Pollut. 2020, 266, 115404. [Google Scholar] [CrossRef]
  20. Zhang, F.; Chen, Y.; Tian, C.; Lou, D.; Li, J.; Zhang, G.; Matthias, V. Emission factors for gaseous and particulate pollutants from offshore diesel engine vessels in China. Atmos. Chem. Phys. 2016, 16, 6319–6334. [Google Scholar] [CrossRef]
  21. Cooper, D.A. Exhaust emissions from ships at berth. Atmos. Environ. 2003, 37, 3817–3830. [Google Scholar] [CrossRef]
  22. Agrawal, H.; Malloy, G.J.; Welch, W.A.; Miller, J.W.; Cocker, D.R. In-use gaseous and particulate matter emissions from a modern ocean-going container vessel. Atmos. Environ. 2008, 42, 5504–5510. [Google Scholar] [CrossRef]
  23. Hulskotte, J.H.J.; Denier van der Gon, H.A.C. Fuel consumption and associated emissions from seagoing ships at berth derived from an on-board survey. Atmos. Environ. 2010, 44, 1229–1236. [Google Scholar] [CrossRef]
  24. CCS. Limits and Measurement Methods for Exhaust Pollutants from Marine Engines (CHINA Ⅰ/Ⅱ); China Classification Society (CCS): Beijing, China, 2018; pp. 1–110. [Google Scholar]
  25. CCS. Technical Code on Control of Emission of Nitrogen Oxides from Marine Diesel Engines; China Classification Society (CCS): Beijing, China, 2020; pp. 1–100. [Google Scholar]
  26. Xing, H.; Stuart, C.; Spence, S.; Chen, H. Alternative fuel options for low carbon maritime transportation: Pathways to 2050. J. Clean. Prod. 2021, 297, 126651. [Google Scholar] [CrossRef]
  27. IMO. Initial IMO Strategy on Reduction of GHG Emissions from Ships; Resolution MEPC, 304 (72) adopted on 13 April 2018; IMO: London, UK, 2018. [Google Scholar]
  28. Peng, Z.; Ge, Y.; Tan, J.; Fu, M.; Wang, X.; Chen, M.; Yin, H.; Ji, Z. Emissions from several in-use ships tested by portable emission measurement system. Ocean Eng. 2016, 116, 260–267. [Google Scholar] [CrossRef]
  29. Winnes, H.; Fridell, E. Emissions of NOX and particles from manoeuvring ships. Transport. Res. Part D 2010, 15, 204–211. [Google Scholar] [CrossRef]
  30. Zhang, F.; Chen, Y.; Chen, Q.; Feng, Y.; Shang, Y.; Yang, X.; Gao, H.; Tian, C.; Li, J.; Zhang, G.; et al. Real-world emission factors of gaseous and particulate pollutants from marine fishing boats and their total emissions in China. Environ. Sci. Technol. 2018, 52, 4910–4919. [Google Scholar] [CrossRef]
  31. McCaffery, C.; Zhu, H.; Karavalakis, G.; Durbin, T.D.; Miller, J.W.; Johnson, K.C. Sources of air pollutants from a Tier 2 ocean-going container vessel: Main engine, auxiliary engine, and auxiliary boiler. Atmos. Environ. 2021, 245, 118023. [Google Scholar] [CrossRef]
  32. Bie, S.; Yang, L.; Zhang, Y.; Huang, Q.; Li, J.; Zhao, T.; Zhang, X.; Wang, P.; Wang, W. Source appointment of PM2.5 in Qingdao Port, East of China. Sci. Total Environ. 2021, 755, 142456. [Google Scholar] [CrossRef]
  33. Tan, J.; Song, Y.; Ge, Y.; Li, J.; Li, L. Emission inventory of ocean-going vessels in Dalian coastal area. Res. Environ. Sci. 2014, 27, 1426–1431. [Google Scholar]
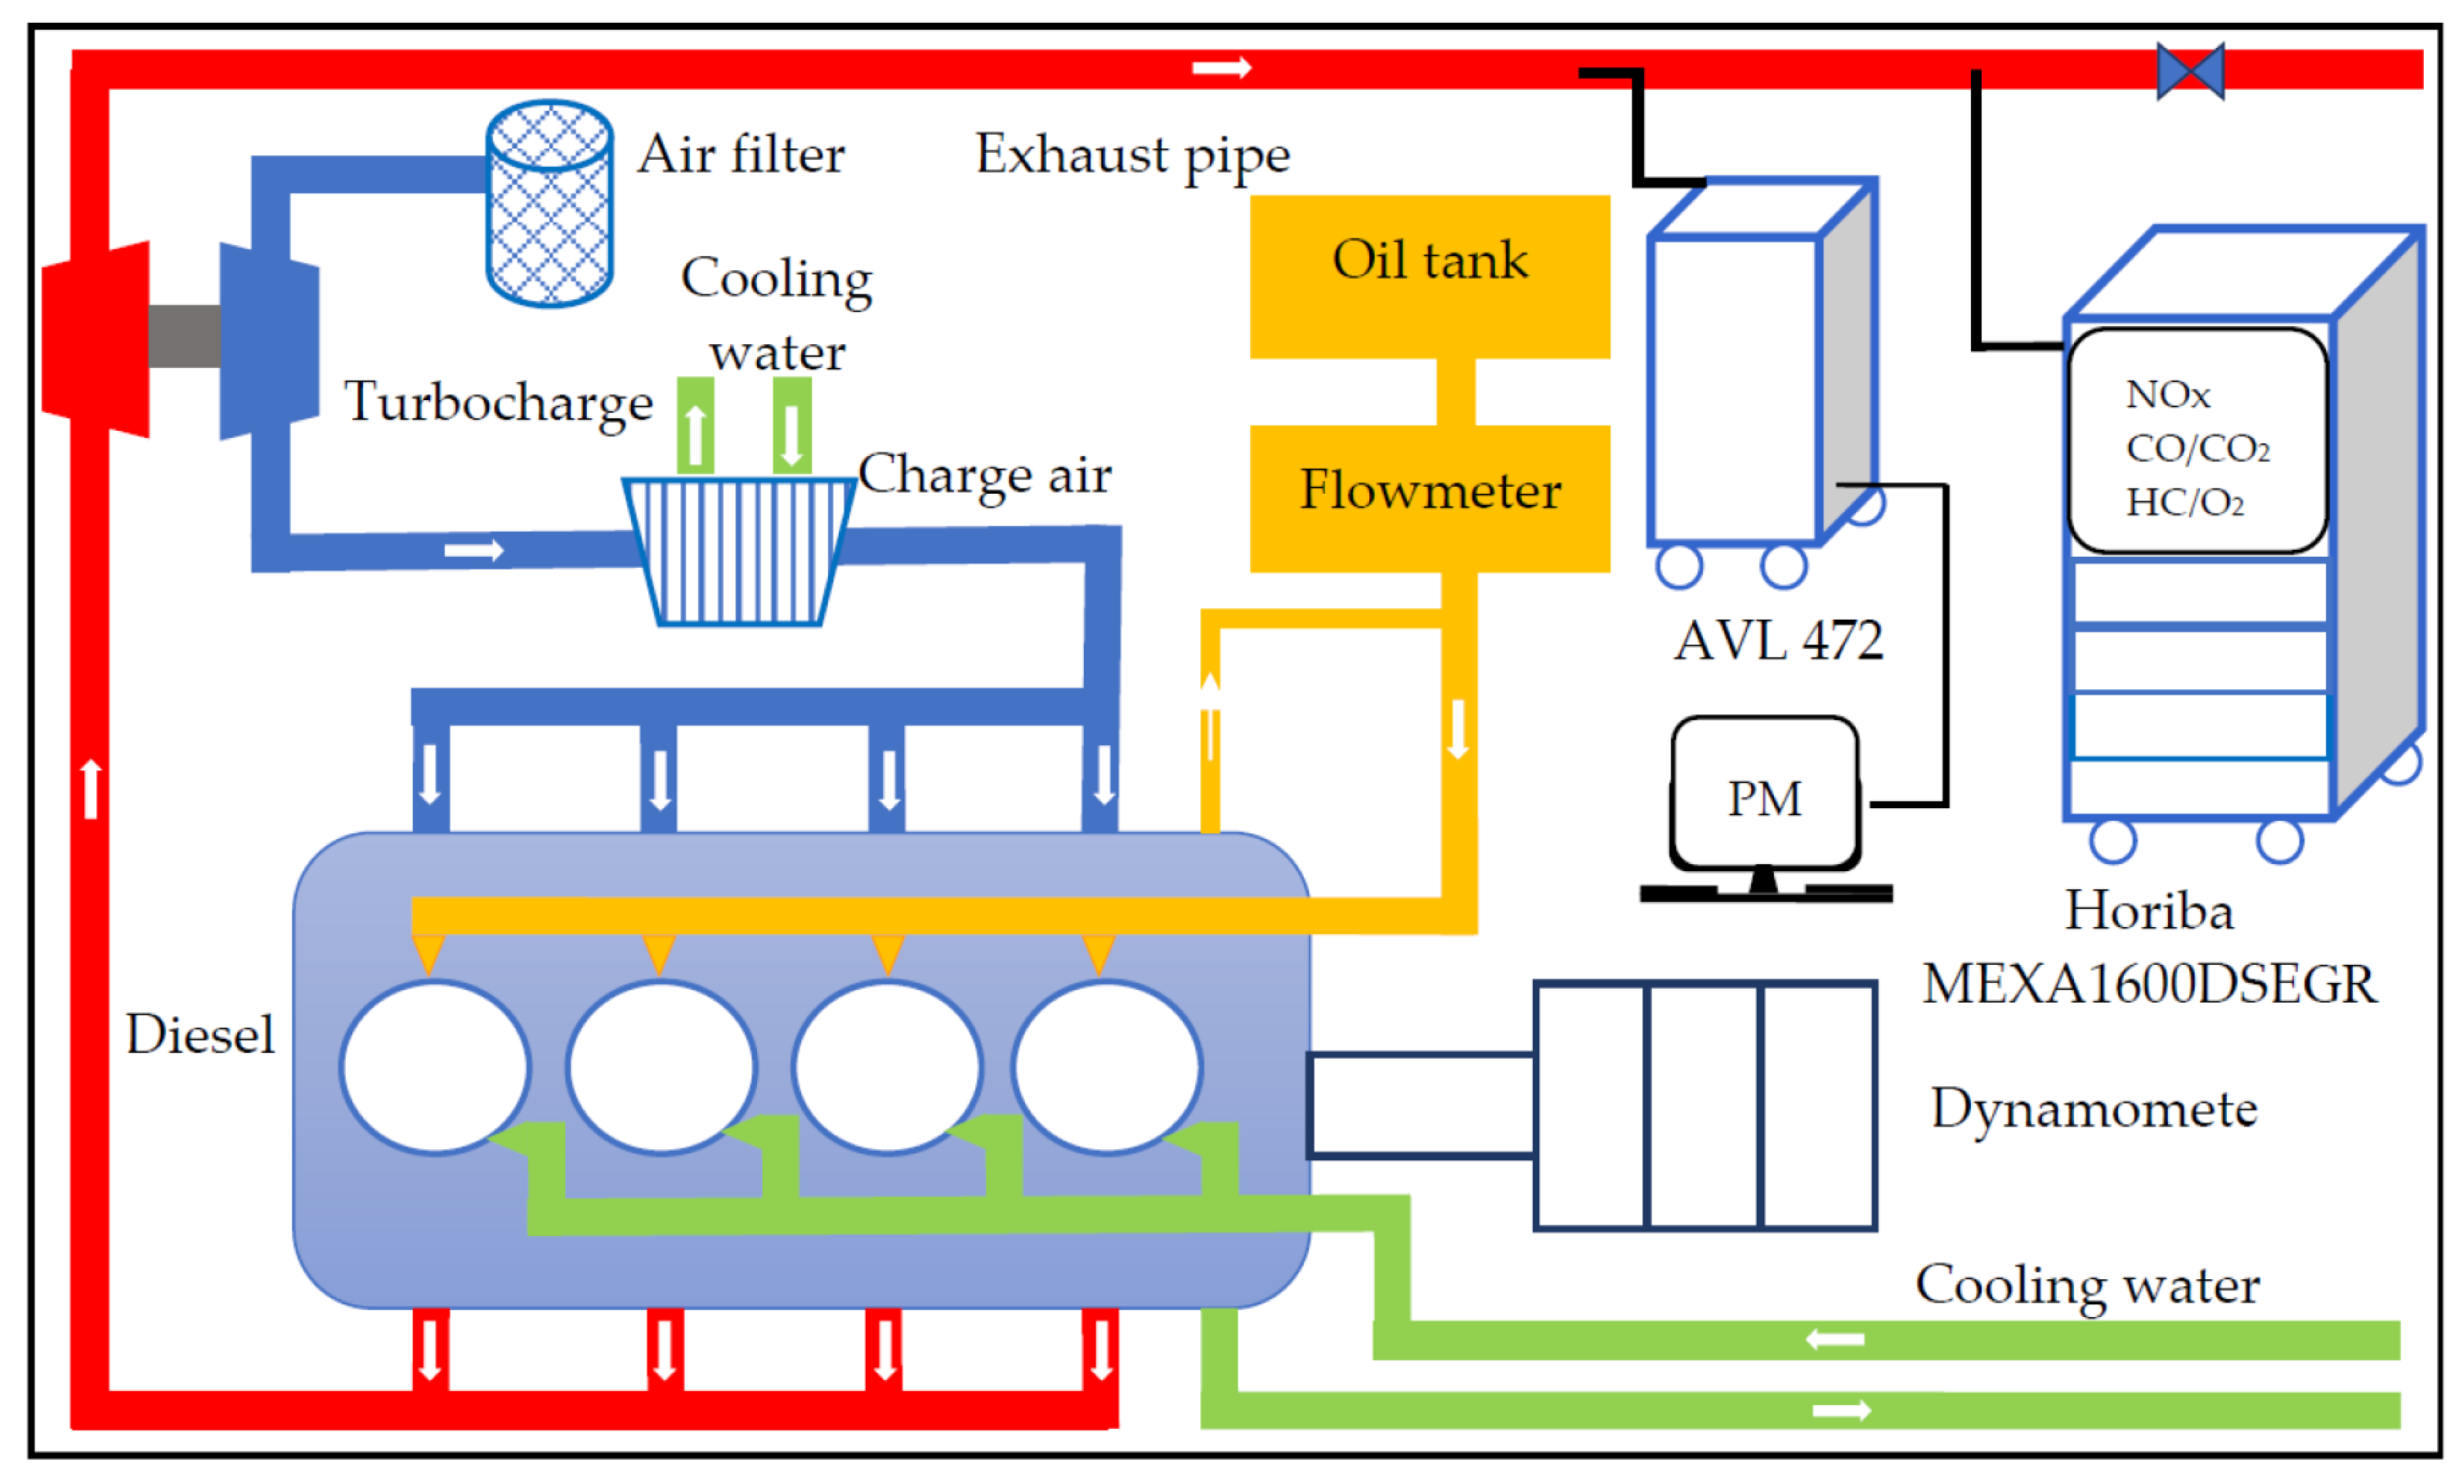
Figure 1. Layout diagram of the diesel engine bench emission test equipment.
Jmse 11 00413 g001
Figure 2. Fuel-based emission factors for different single-cylinder displacements under the CHINA I standard. (a) NOx-specific emissions in the E3, E2, and D2 cycles; (b) CO-specific emissions in the E3, E2, and D2 cycles; (c) HC-specific emissions in the E3, E2, and D2 cycles; (d) CO2-specific emissions in the E3, E2, and D2 cycles.
Jmse 11 00413 g002
Figure 3. Fuel-based emission factors for different single-cylinder displacements under the CHINA II standard. (a) NOx-specific emissions in the E3, E2, and D2 cycles; (b) CO-specific emissions in the E3, E2, and D2 cycles; (c) HC-specific emissions in the E3, E2, and D2 cycles; (d) CO2-specific emissions in the E3, E2, and D2 cycles.
Jmse 11 00413 g003
Figure 4. Energy-based emission factors for different single-cylinder displacements under the CHINA I standard. (a) NOx-specific emissions in the E3, E2, and D2 cycles; (b) CO-specific emissions in the E3, E2, and D2 cycles; (c) HC-specific emissions in the E3, E2, and D2 cycles; (d) PM-specific emissions in the E3, E2, and D2 cycles.
Jmse 11 00413 g004
Figure 5. Energy-based emission factors for different single-cylinder displacements under the CHINA II standard. (a) NOx-specific emissions in the E3, E2, and D2 cycles; (b) CO-specific emissions in the E3, E2, and D2 cycles; (c) HC-specific emissions in the E3, E2, and D2 cycles; (d) PM-specific emissions in the E3, E2, and D2 cycles.
Jmse 11 00413 g005
Figure 6. Relationship of NOX energy-based emission factors against load. (a) Specific emissions in the E3 cycle at four load points under the CHINA I standard; (b) Specific emissions in the E3 cycle at four load points under the CHINA II standard; (c) Specific emissions in the D2 cycle at five load points under the CHINA I standard; (d) Specific emissions in the D2 cycle at five load points under the CHINA II standard.
Jmse 11 00413 g006
Figure 7. Relationship of HC energy-based emission factors against load. (a) Specific emissions in the E3 cycle at four load points under the CHINA I standard; (b) Specific emissions in the E3 cycle at four load points under the CHINA II standard; (c) Specific emissions in the D2 cycle at five load points under the CHINA I standard; (d) Specific emissions in the D2 cycle at five load points under the CHINA II standard.
Jmse 11 00413 g007
Figure 8. Relationship of CO energy-based emission factors against load. (a) Specific emissions in the E3 cycle at four load points under the CHINA I standard; (b) Specific emissions in the E3 cycle at four load points under the CHINA II standard; (c) Specific emissions in the D2 cycle at five load points under the CHINA I standard; (d) Specific emissions in the D2 cycle at five load points under the CHINA II standard.
Jmse 11 00413 g008
Table 1. Test cycle and weighting factors.
Test CycleParameterTest Power Point
E3Power100%75%50%25%-
Speed100%91%80%63%-
Weighting factor0.200.500.150.15-
E2Power100%75%50%25%-
Speed100%100%100%100%-
Weighting factor0.200.500.150.15-
D2Power100%75%50%25%10%
Speed100%100%100%100%100%
Weighting factor0.050.250.300.300.10
Table 2. CHINA I emission limit (g/kWh).
Single-Cylinder
Displacement SV(L 1)
Rated Power
(kW)
COHC + NOXCH4 2PM
SV < 0.9P ≥ 375.07.51.50.40
0.9 ≤ SV < 1.25.07.21.50.30
1.2 ≤ SV < 55.07.21.50.20
5 ≤ SV < 155.07.81.50.27
15 ≤ SV < 20P < 33005.08.71.60.50
P ≥ 33005.09.81.80.50
20 ≤ SV < 255.09.81.80.50
25 ≤ SV < 305.011.02.00.50
1 Volume unit, liter (L), 2 For dual-fuel and gas engines.
Table 3. CHINA II emission limit (g/kWh).
Single-Cylinder
Displacement SV(L 1)
Rated Power
(kW)
COHC + NOXCH4 2PM
SV < 0.9P ≥ 375.05.81.00.30
0.9 ≤ SV < 1.25.05.81.00.14
1.2 ≤ SV < 55.05.81.00.12
5 ≤ SV < 15P < 20005.06.21.20.14
2000 ≤ P < 37005.07.81.50.14
P ≥ 37005.07.81.50.27
15 ≤ SV < 20P < 20005.07.01.50.34
2000 ≤ P < 33005.08.71.60.50
P ≥ 33005.09.81.80.50
20 ≤ SV < 25P < 20005.09.81.80.27
P ≥ 20005.09.81.80.50
25 ≤ SV < 30P < 20005.011.02.00.27
P ≥ 20005.011.02.00.50
1 Volume unit, liter (L), 2 For dual-fuel and gas engines.
Table 4. Gaseous-substance-measuring equipment specific information.
IngredientPrincipleAccuracyMeasuring Range
CONDIRWithin 2%PT or 0.3%FS0~3000 ppm
CO2NDIRWithin 2%PT or 0.3%FS0~16 vol.%
NOXCLDWithin 2%PT or 0.3%FS0~5000 ppm
O2MPDWithin 2%PT or 0.3%FS0~25 vol.%
THCHFIDWithin 2%PT or 0.3%FS0~5000 ppm
Table 5. Single-cylinder displacement classification.
ClassSingle-Cylinder Displacement SV (L)ClassSingle-Cylinder Displacement SV (L)
ASV < 0.9E15 ≤ SV < 20
B0.9 ≤ SV < 1.2F20 ≤ SV < 25
C1.2 ≤ SV < 5G25 ≤ SV < 30
D5 ≤ SV < 15
Disclaimer/Publisher’s Note: The statements, opinions and data contained in all publications are solely those of the individual author(s) and contributor(s) and not of MDPI and/or the editor(s). MDPI and/or the editor(s) disclaim responsibility for any injury to people or property resulting from any ideas, methods, instructions or products referred to in the content.