Article

Numerical Study and Geometrical Investigation of an Onshore Overtopping Device Wave Energy Converter with a Seabed Coupled Structure

by
Andréia S. de Barros
1,
Cristiano Fragassa
2,*,
Maycon da S. Paiva
3,
Luiz A. O. Rocha
1,
Bianca N. Machado
4,
Liércio A. Isoldi
1,
Mateus das N. Gomes
5 and
Elizaldo D. dos Santos
1
1
School of Engineering, Federal University of Rio Grande (FURG), Italia Av., Km 8, Rio Grande 96203-900, RS, Brazil
2
Department of Industrial Engineering, University of Bologna, Viale Risorgimento 2, 40136 Bologna, Italy
3
Department of Pure and Applied Mathematics, Federal University of Rio Grande do Sul, Bento Gonçalves Av., 9500, Porto Alegre 91509-900, RS, Brazil
4
Interdisciplinary Department, Federal University of Rio Grande do Sul (UFRGS), RS 030, 11.700-Km 92 Emboaba, Tramandaí 95590-000, RS, Brazil
5
Federal Institute of Paraná (IFPR), Antônio Carlos Rodrigues Av., 453, Paranaguá 83215-750, PR, Brazil
*
Author to whom correspondence should be addressed.
J. Mar. Sci. Eng. 2023, 11(2), 412; https://doi.org/10.3390/jmse11020412
Submission received: 21 January 2023 / Revised: 6 February 2023 / Accepted: 8 February 2023 / Published: 13 February 2023

Abstract

:
Studies regarding renewable energy sources have gained attention over recent years. One example is wave energy converters, which harvest energy from sea waves using different operational principles such as oscillating water columns, oscillating bodies, and overtopping devices. In the present paper, a numerical study is carried out, and a geometrical investigation of a full-scale overtopping device with a coupled structure mounted on the seabed is performed using the Constructal Design method. The main purpose is to investigate the influence of the design over the available power of the device. The areas of the overtopping ramp (Ar) and the trapezoidal seabed structure (At) are the problem constraints. Two degrees of freedom are studied, the ratio between the height and length of the ramp (H3/L3) and the ratio between the upper and lower basis of the trapezoidal obstacle (L1/L2). The device submersion is kept constant (H1 = 3.5 m). The equations of continuity, momentum, and the transport of volume fraction are solved with the Finite Volume Method, while the water–air mixture is treated with the multiphase model Volume of Fluid. Results showed that the ratio H3/L3 presented a higher sensibility than the ratio L1/L2 over the accumulated water in the reservoir. Despite that, the association of a structure coupled to the ramp of an overtopping device improved the performance of the converter by 30% compared to a conventional condition without the structure.

1. Introduction

The use of renewable energy sources has become necessary due to the increase in energy demand and environmental problems caused by the consumption of fossil fuels [1]. Thereby, Hernández-Fontes [2] highlights ocean energy resources as an alternative way to supply energy with several magnitudes. However, various difficulties have been faced in exploring the potential energy on a large scale, challenging the consolidation of wave energy converters in the commercial form [3].
Despite the adverse sea conditions regarding the installation and maintenance of wave energy converters (WECs), many experimental studies have indicated that devices with different physical operating principles can harvest energy from sea waves [4,5,6,7,8,9,10,11]. According to Pecher and Kofoed [12], different WECs can be classified according to the following main operational principles: oscillating water column (OWC), with fixed or floating structure; oscillating, floating, or submerged bodies; and overtopping, with a fixed or floating structure. However, there are WECs where the physical operating principles do not fit into the mentioned classification, e.g., the Submerged Horizontal Plate [13,14,15].
The present object of study is an onshore overtopping WEC. This device is accessible by land, which guarantees greater practicality in installation and maintenance. The operating principle of the device consists of guiding sea waves through a ramp to a reservoir located above mean sea level, transforming kinetic energy into potential energy. The water accumulated in the reservoir returns to the sea flowing through a low-head turbine, generating electricity [12,16].
Over the last few years, overtopping devices and breakwaters have been investigated by means of experimental and numerical works [4,5,6,7,9,17,18,19,20]. Recent developments have been achieved related to the comprehension of the influence of multiple ramps and stages of reservoirs in overtopping devices [5], investigation of hybrid converters associating the overtopping device in a harbor breakwater with an oscillating water column device [6], and integration of overtopping devices with breakwater structures [17,18]. In the latter subject, Han et al. [17] numerically evaluated the performance of multi-level overtopping breakwater for energy conversion (MOBREC). The device was composed of two reservoirs with sloping walls at different levels. More precisely, the effect of parameters such as angles of the ramps, the width of the opening of the lower reservoir, and the height of the space between the reservoirs over the dimensionless discharge of water of the device was investigated. Afterward, Lauro et al. [18] analyzed the hydraulic performance and stability of a vertical breakwater with an overtopping device attached to its top. The device was named OBREC-V and consisted of a concrete structure with a frontal ramp capable of capturing and collecting part of the incident wave energy. Simulations were carried out to compare the performance of the structure under the action of irregular waves in terms of wave reflection, overtopping, and wave acting forces. Results indicated a reduction in destabilizing forces acting in the breakwater compared to a traditional structure. Recently, the OBREC device was investigated and installed for field tests, obtaining important recommendations about the design under sea conditions [19,20]. In the work of Contestabile et al. [19], for example, the effect of a structure coupled to the reservoir of overtopping (parapet) to improve the protection of the coast and, at the same time, to augment the wave energy conversion was investigated. Some tests were performed considering the influence of the geometry of the parapet for different water levels. Later, Contestabile et al. [20] investigated the effects of sea winds and land breeze circulations for wind and wave energy conversion on the Gulf of Naples (Italy) coast, considering a dataset of 42 years. A case study was analyzed at the Marine Renewable Energy Laboratory and generated recommendations about exploring multivariable techniques such as wind and wave technologies for wave energy conversion. For the coast conditions studied, results indicated that the production would be more available and less variable when the combined wave-wind farm is installed.
One important aspect of defining the overtopping devices lies in the investigation of the influence of the design on the performance of the WECs. Recently, Constructal theory [21] has been used to obtain recommendations about the geometry of WECs [22,23,24,25,26,27]. Constructal theory is the view that the design of any finite-size flow system is ruled by a physical principle, including what is seen in nature [21,28]. The physical principle that leads to the formation of these flow systems is called the Constructal Law, which states that for a given finite-size flow system to persist in time, its design must freely evolve in such a way that it provides easier access to the imposed currents that flow through it [29,30,31]. Constructal Design [21,31] is the method used to investigate the influence of the design of a finite-size flow system over its performance. In this method, the geometry is deduced from a principle of increase in performance while the system is subjected to constraints and varied according to the defined degrees of freedom.
Concerning the application of Constructal Design on overtopping devices, Dos Santos et al. [22] performed a geometric study of an offshore device at a laboratory scale. More precisely, the influence of the height/length ratio of the ramp for different relative depths (given by the ratio between the depth of the wave channel and the length of the monochromatic wave used) on the accumulated water into the device reservoir was evaluated. Later, Goulart et al. [23] evaluated the influence of a ramp geometry on the performance of a full-scale onshore overtopping device under the incidence of regular waves. The ratio between the height and length of the ramp that maximizes the mass of water accumulated in the reservoir for distances of 5.0 m and 6.0 m between the bottom of the device and the bottom of the channel was investigated. Martins et al. [24] evaluated the effect of the slope of the ramp and the submersion of the device on the available power of a full-scale onshore overtopping device, considering three different areas for the ramp, as well as the incidence of two different monochromatic waves. Recently, Martins et al. [22] carried out a numerical study on an overtopping device with one and two ramps incorporated into a breakwater placed on the south coast of Brazil, which has a high potential for conversion of wave energy [32,33], and subjected to irregular waves modeled with the JONSWAP spectrum. The authors identified that, for future studies, the use of a realistic database could contribute even more to predicting the design of overtopping devices under more realistic conditions. Progress has been made towards this kind of prediction, as seen in the recent methodology named WaveMIMO [34,35,36]. It is also important to mention that an overtopping device can be used in coastal placements for two purposes, coastal defense and wave energy conversion. Moreover, recent works have demonstrated that increasing renewable energy availability is one of the main challenges. In this sense, the study of wind-wave energy in combination has been indicated as a future strategy for energy conversion [20]. Recently, new contributions have been proposed to use new strategies for power take-off, such as triboelectric nanogenerators for energy conversion [37]. For example, Jiao et al. [37] developed numerical and experimental investigations on magnetic capsulate triboelectric nanogenerators. The authors observed that the proposed device provided an effective form to harvest electrical energy from low-frequency and low-amplitude oscillations, which is adequate for converting wave energy. Another strategy for future devices is the improvement of design in order to increase wave energy conversion efficiency, being the contribution proposed here for overtopping devices.
Despite the numerous works found in the literature, none of these studies investigated the effect that the geometry of obstacles positioned on the seabed has on the amount of water accumulated in the reservoir of an overtopping device where the obstacle is coupled. Thereby, the present paper aims to evaluate the geometry of a trapezoidal obstacle at the bottom of a full-scale wave channel coupled with an onshore overtopping device, being the main contribution to the detailed investigation of the geometric configuration of the device performance. The geometry is investigated using the Constructal Design method, and the geometrical optimization is performed with exhaustive search, allowing the comprehension of the effect of degrees of freedom of the problem over the performance indicator (water accumulated in the reservoir). To the best of the authors’ knowledge, this kind of investigation was not previously performed in the literature.

2. Mathematical Modeling

The Volume of Fluid (VOF) multiphase model [38] was employed, which makes it possible to represent two or more immiscible fluids by solving a transport equation for volume fraction along the domain. In each control volume, the sum of the volume fraction of all phases is unity. Therefore, once there are two different phases, air and water, the concept of volume fraction (α) is used to represent the two phases within a control volume. Thus, 0 indicates that the control volume does not contain one of the phases (αwater or αair), while 1 indicates that only this phase is contained in the volume. If the volume contains a mixture of air and water, then:
α a i r = 1 α w a t e r
According to Schlichting [39], the mass conservation equation for a mixture of air and water in an isothermal, laminar, and incompressible flow is given by:
ρ t + ( ρ v ) = 0
where ρ is the fluid density (kg/m3); t is the time (s); v is the velocity vector (m/s). The momentum equation for the mixture is given by:
ρ v t + ( ρ v v ) = p + ( μ τ ¯ ¯ ) + ρ g
where p is the static pressure (Pa); μ is the dynamic viscosity (kg/(m.s)); g is the gravity acceleration vector (m/s2); and τ ¯ ¯ is the strain rate tensor (N/m2), which for a Newtonian fluid, is represented by:
τ ¯ ¯ = μ ( v + v T )
Finally, the volume fraction transport equation is given by [38]:
α w a t e r t + ( α w a t e r v ) = 0
Since the conservation mass and momentum equations are solved for the mixture, it is necessary to obtain the specific mass and viscosity values for the mixture, which can be written by:
ρ = α w a t e r ρ w a t e r + ( 1 α w a t e r ) ρ a i r
μ = α w a t e r μ w a t e r + ( 1 α w a t e r ) μ a i r

2.1. Wave Generation

Regarding the numerical wave generation, a velocity profile is imposed on the left wall of the channel, simulating the behavior of a wave generator, similar to that performed in previous works [13,18,24]. Table 1 presents the characteristics adopted for the regular waves considered in this study.
According to Chakrabarti [40], these waves correspond to the second-order Stokes theory. Therefore, the velocity potential and the free surface elevation of the water can be described, respectively, by [40,41]:
φ = g H 2 k c cosh [ k ( z + k ) ] cosh ( k h ) sin ( k x ω t ) + 3 32 c k H 2 cosh [ 2 k ( z + h ) ] sinh 4 ( k h ) sin [ 2 ( k x ω t ) ]
η = H 2 cos ( k x ω t ) + k H 2 16 cosh ( k h ) sinh 3 ( k h ) [ 2 + cosh ( 2 k h ) ] cos [ 2 ( k x ω t ) ]
φ being the velocity potential (m2/s); η the water-free surface elevation (m); x and z, respectively, the horizontal and vertical coordinate axis (m); c the wave celerity (m/s); k the wave number (m−1); and ω the angular frequency (Hz). Furthermore, the wave number and angular frequency are given, respectively, by:
c = λ T = g k tanh ( k h )
k = 2 π λ
ω = 2 π T
Thus, by deriving the velocity potential equation for each coordinate axis, it is possible to analytically determine the velocity components given, respectively, by [40,41]:
u = g H 2 c cosh [ k ( z + h ) ] cosh ( k h ) cos ( k x ω t ) + 3 16 c k 2 H 2 cosh [ 2 k ( z + h ) ] sin 4 ( k h ) cos [ 2 ( k x ω t ) ]
w = g H 2 c sinh [ k ( z + h ) ] cosh ( k h ) sin ( k x ω t ) + 3 16 c k 2 H 2 sinh [ 2 k ( z + h ) ] sinh 4 ( k h ) sin [ 2 ( k x ω t ) ]
where u is the horizontal velocity component (m/s); w is the vertical velocity component (m/s).
Aiming to verify the numerical model employed, the free surface elevation of the water on the wave channel was monitored through a gauge located at x = 50.00 m. The numerical data obtained were then compared to the analytical results given by Equation (9) using the mean absolute error, given by [42]:
M A E = i = 1 N | O i P i | N
where Oi represents the numerical value (m); Pi is the analytical value (m); and N represents the total number of data, i.e., the number of time steps.

2.2. Problem Description and Geometrical Investigation

The physical problem consists of a wave channel with a trapezoidal obstacle coupled to an overtopping device placed at the bottom of the channel, as can be observed in Figure 1. Therefore, a two-dimensional numerical model was considered, as in [13,22,23,24,25,26,27,34,35,36], because this simplification adequately represented the incidence of waves and led to a significant reduction of the processing time of the simulations, allowing the investigation of various geometric configurations. The wave channel has a length of LT = 320.00 m, a height of HT = 20.00 m, and the water depth at rest is h = 10.00 m. Furthermore, the submersion of the device is fixed, being H1 = 3.50 m, and the reservoir dimensions are Lr = 20.00 m and Hr = 6.50 m. The wave flow conditions and dimensions of the reservoir and channel are the same as those used in the work of Martins et al. [24]. Moreover, the magnitude used for H1 represents the submergence with the best performance found in Martins et al. [24] for the overtopping device without coupled structure. In this sense, it is possible to compare the effect of the seabed trapezoidal obstacle with the case without its use.
Regarding the boundary conditions considered, the generation of waves is caused by the imposition of velocity profiles, defined by the second-order Stokes theory, on the lower-left surface of the computational domain (red line). The atmospheric pressure condition is imposed on the upper-left side and on the upper surface of the channel (blue lines). Meanwhile, on the other surfaces of the channel and on the device, the velocities are prescribed as null, i.e., no-slip and impermeability boundary condition (black lines) is adopted. Furthermore, regarding the initial conditions, the flow is at rest.
To apply the Constructal Design, defining the performance indicator, constraints, and degrees of freedom is necessary. In the present study, the objective of the flow system, which consists of a wave channel with a coupled converter, is to maximize the amount of water mass that enters the reservoir of the overtopping device.
The problem has three area constraints:
-
Total area of the channel (AT = 6400 m2),
A T = H T L T
-
Area of the overtopping device ramp (Ar = 78.5 m2),
A r = H 3 L 3 2
-
Area of the obstacle placed at the bottom of the channel (At = 36.75 m2):
A t = ( L 1 + L 2 ) H 1 2
The constraints Ar and At are illustrated in gray in Figure 1. It is possible to rewrite Ar and At as fractions areas, using the area of the channel as a reference, respectively, by:
ϕ r = A r A T
ϕ t = A t A T
The values of ϕr = 0.012 and ϕt = 0.006 were fixed.
The defined degrees of freedom are the ratio between the height and length of the ramp of the device (H3/L3) and the ratio between the major and minor base of the trapezoidal obstacle (L1/L2), which are varied throughout the study. As previously mentioned, the submersion of the device (H1) is kept fixed, using the best submergence obtained in the work of Martins et al. [24]. Table 2 presents the values investigated for the H3/L3 freedom degree and the respective values of H3 and L3 adopted in each case.
It is worth noting that the lowest ratio H3/L3 = 0.33 was the optimal ratio identified in the study of Martins et al. [24] for the case with H1 = 3.5 m. On the contrary, the upper limit was established at H3/L3 = 0.37, since it was the limit condition where the ramp acts as a WEC and not a breakwater. For each magnitude of H3/L3 investigated, 10 different values of the ratio L1/L2 were analyzed. Table 3 shows the ratios L1/L2 studied and the magnitudes of L1 and L2 variables.
The lowest ratio addressed, L1/L2 = 0.00, represents a triangular obstacle, and the highest ratio, L1/L2 = 1.00, portrays a rectangular obstacle, while the intermediate ratios, 0.00 < L1/L2 < 1.00, represent trapezoidal obstacles. Figure 2 illustrates different configurations adopted for the obstacle coupled with the overtopping device in extreme and intermediate conditions of the ratio L1/L2 and the case without the obstacle: (a) triangular obstacle, (b) trapezoidal obstacle, (c) rectangular obstacle, (d) no obstacle.
For the geometrical investigation, it is also considered as restriction that (H1 + H3) > (h + H/2), thus ensuring that the wave crest does not exceed the maximum height of the device.
The performance indicator in the present study is the total mass of water accumulated in the reservoir, which is determined through:
M = 1 t f 0 t f M ˙ d t
where tf refers to the time interval of analysis (s); and M ˙ is the mass flow rate of water in overtopping occurrences (kg∙s−1).
With the constraints, degrees of freedom, and performance indicator defined, it is possible to define the strategy of geometric investigation. The present work uses the association between the Constructal Design and the exhaustive search for geometric optimization. The scheme of investigation can be seen in Figure 3. In the first step, the ratio L1/L2 is varied for a constant magnitude of the ratio H3/L3. The highest magnitude of the mass of water accumulated in the reservoir is named the once-maximized mass of water accumulated in the reservoir (Mmax) and the corresponding optimal shape is the once-optimized ratio L1/L2, (L1/L2)o. In the second step, the same process performed in the first step is repeated for the different magnitudes of the ratio H3/L3. The highest magnitude of the mass of water accumulated in the reservoir obtained is called the twice-maximized mass of water accumulated in the reservoir, M2max, and the corresponding optimal configurations are the twice-optimized ratio L1/L2, (L1/L2)oo, and the once-optimized ratio H3/L3, (H3/L3)o. In the present study, a total of 50 simulations were performed for the geometric investigation.

3. Computational Modeling

For the execution of the present study, numerical simulations of wave generation were carried out in a channel through the software ANSYS Fluent, which is a package of computational fluid dynamics (CFD) based on the Finite Volume Method (FVM) [43]. Such a method consists of dividing the interest domain into several elementary volumes to perform a balance of properties for each finite volume aiming to obtain the corresponding approximate equation and solve one algebraic equations system [43,44].
As for the spatial discretization, a stretched mesh was considered, as in Martins et al. [24]. However, a greater refinement was adopted on both the free surface region, where 30 computational cells per wave height were used, and horizontally, where 70 computational cells per wavelength were considered, as defined by the mesh independence test. The interaction between the wave flow and the ramp of the overtopping device justifies this greater refinement. Moreover, a greater refinement was employed near the walls due to the more significant gradients of the velocity field in these regions. Figure 4 illustrates the mesh adopted for the computational domain, detailing the region of the overtopping device.
Concerning the numerical procedures used to solve Equations (2)–(5), the methods and parameters used in the present work are presented in Table 4. This numerical methodology is similar to the methodology used in previous studies, as in [23,24,25,26]. The computational method has the advantage to allow the simulation of various cases with lower costs than the experimental investigation. However, rigorous investigation of the reliability of the computational method is required to obtain adequate recommendations. This process is performed in the first subsection of the results and discussion section.

4. Results and Discussion

The first results presented refer to studies carried out to determine the spatial and temporal discretization to be adopted and to verify the numerical model used to generate the waves. Then, the results related to the geometric optimization of the obstacle coupled to the overtopping wave energy converter, the main objective of the present study, are presented.

4.1. Mesh and Time Step Independence Study and Verification of the Computational Model

It is worth mentioning that the mesh used was composed of regular rectangles. This kind of finite volume has the advantage of avoiding numerical effects such as false diffusion on the solution of the primary variables of the problem, which could occur by using an irregular mesh with triangular volumes. Thus, in this study, a mesh convergence test was carried out, simulating four cases with a different number of volumes, 19,000, 38,000, 76,000, and 152,000. The results were compared with the calculation of the analytically generated wave (Equation (9)). Therefore, the elevation of the free surface was monitored using a numerical probe of the integral type located at x = 50.00 m.
Furthermore, for the mesh independence test, a time step of ∆t = 2.00 × 10⁻² s was considered. Table 5 shows the MAE average, calculated using Equation (15), and the processing time demanded for each simulation for different meshes investigated.
To determine the best mesh, the refinement and processing time of the simulation were considered along with the calculated numerical error. After verifying that the difference between a mesh of 76,000 and one of 152,000 volumes is only 0.01%, lower than the difference observed in the other cases analyzed, a mesh with 76,000 regular rectangular volumes was then adopted.
Since it is a transient problem, the temporal discretization employed was defined by carrying out a time step independence study. For this study, four simulations are performed considering a total time of wave flow over the overtopping device of 100 s and varying the time step by: ∆t = 5.00 × 10⁻³ s, ∆t = 1.00 × 10⁻² s, ∆t = 2.00 × 10⁻² s, and ∆t = 4.00 × 10⁻² s.
Table 6 presents the free surface elevation values (η) obtained at x = 50.00 m and for the instant of time t = 15.00 s for each time step studied and the variation among the tested cases. Consequently, the time step of ∆t = 2.00 × 10⁻² s was adopted for the geometric evaluation simulations since it leads to less computational effort among the best time steps. Moreover, only the time step ∆t = 2.00 × 10⁻² s has a higher discrepancy in the magnitude of η compared to the other investigated time steps.
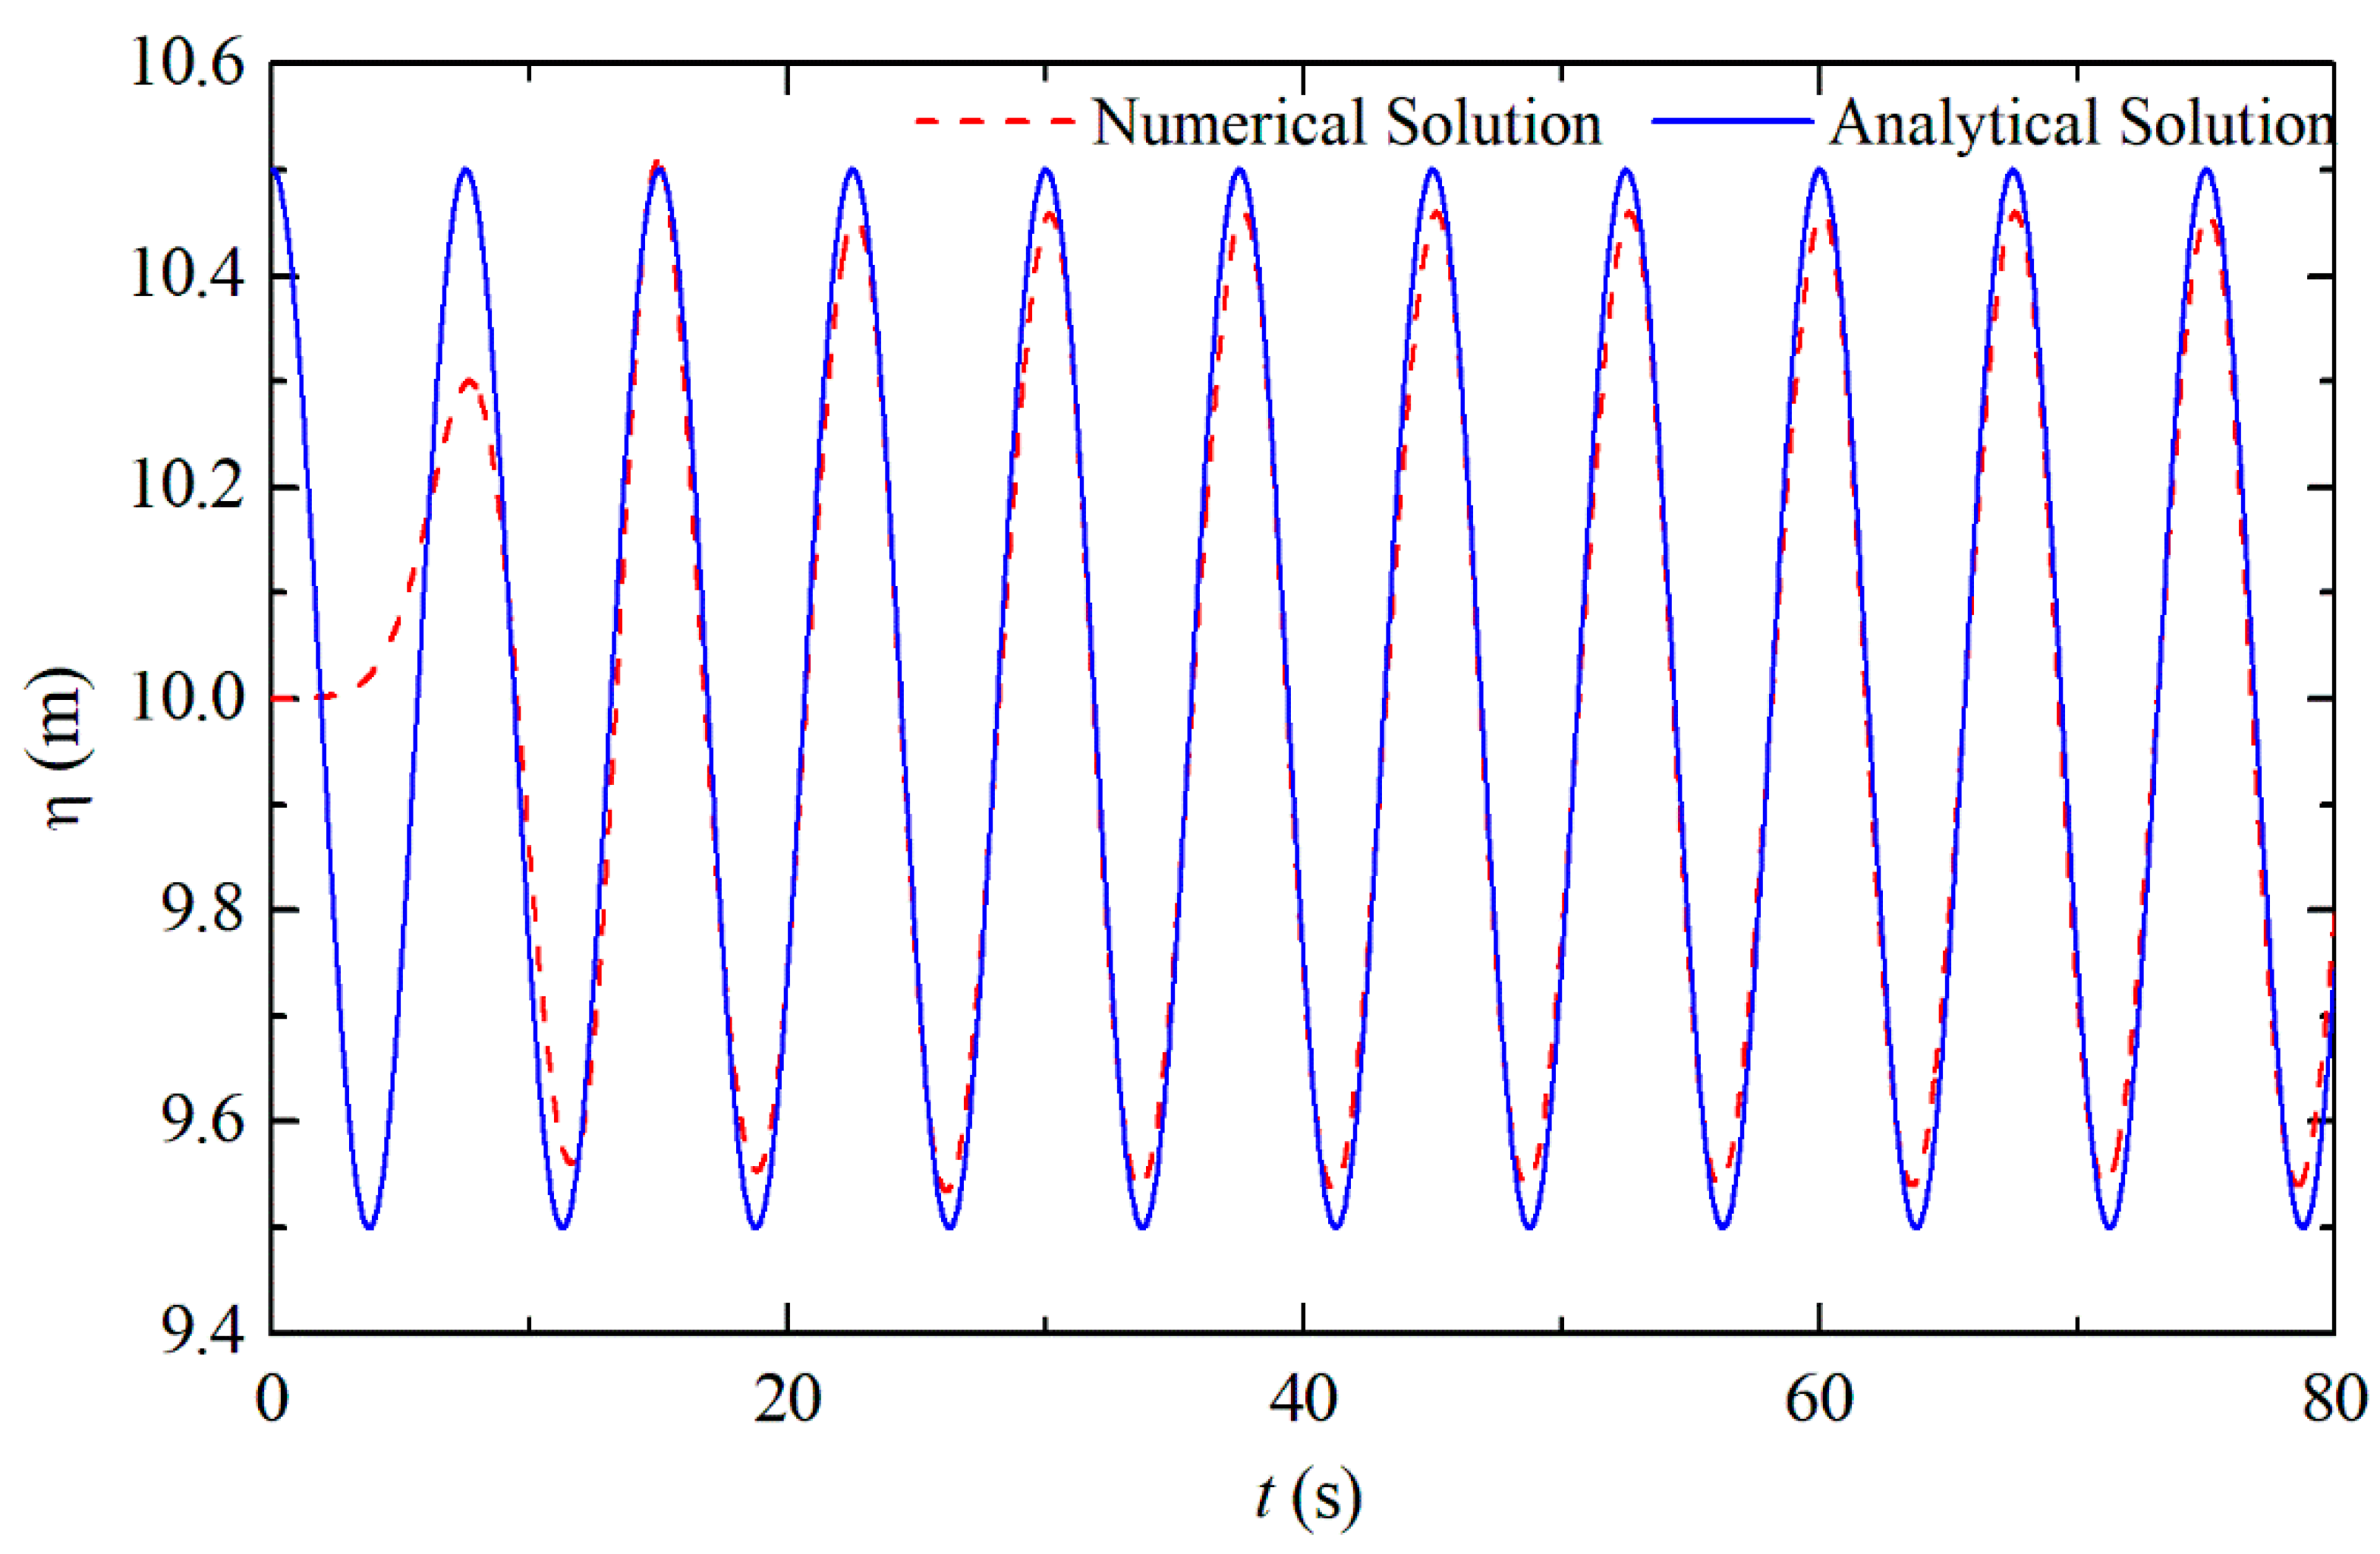
The analytical solution (Equation (9)) was compared to the numerical solution for a wave generated in a channel without the device to verify the methodology employed. This comparison is presented in Figure 5, where it is possible to verify that the numerical wave fits well in the analytical solution for t > 15.00 s where the stabilization occurred. Before this period, the numerical solution is influenced by the initial condition of inertia of the flow, which is not contemplated in the analytical solution. Thus, the wave generation verification considered the interval of 15.00 s ≤ t ≤ 80.00 s.
Evaluating the difference between the analytical and numerical results, when calculating the MAE comparing the elevation of the free surface in the wave channel, considering the depth of h = 10.00 m, a result of approximately 0.10% was obtained. However, when calculating the average MAE considering only the generated wave, i.e., disregarding the water depth on the channel, an average of 8.00% was obtained. Thus, there is a good agreement between the results.
It is also worth mentioning that a validation of the present computational method was performed in a previous research group work. A comparison between the free surface elevation as a function of time in a laboratory-scale wave channel obtained with the present computational model and those obtained experimentally in the work of Goulart [45] was performed. 
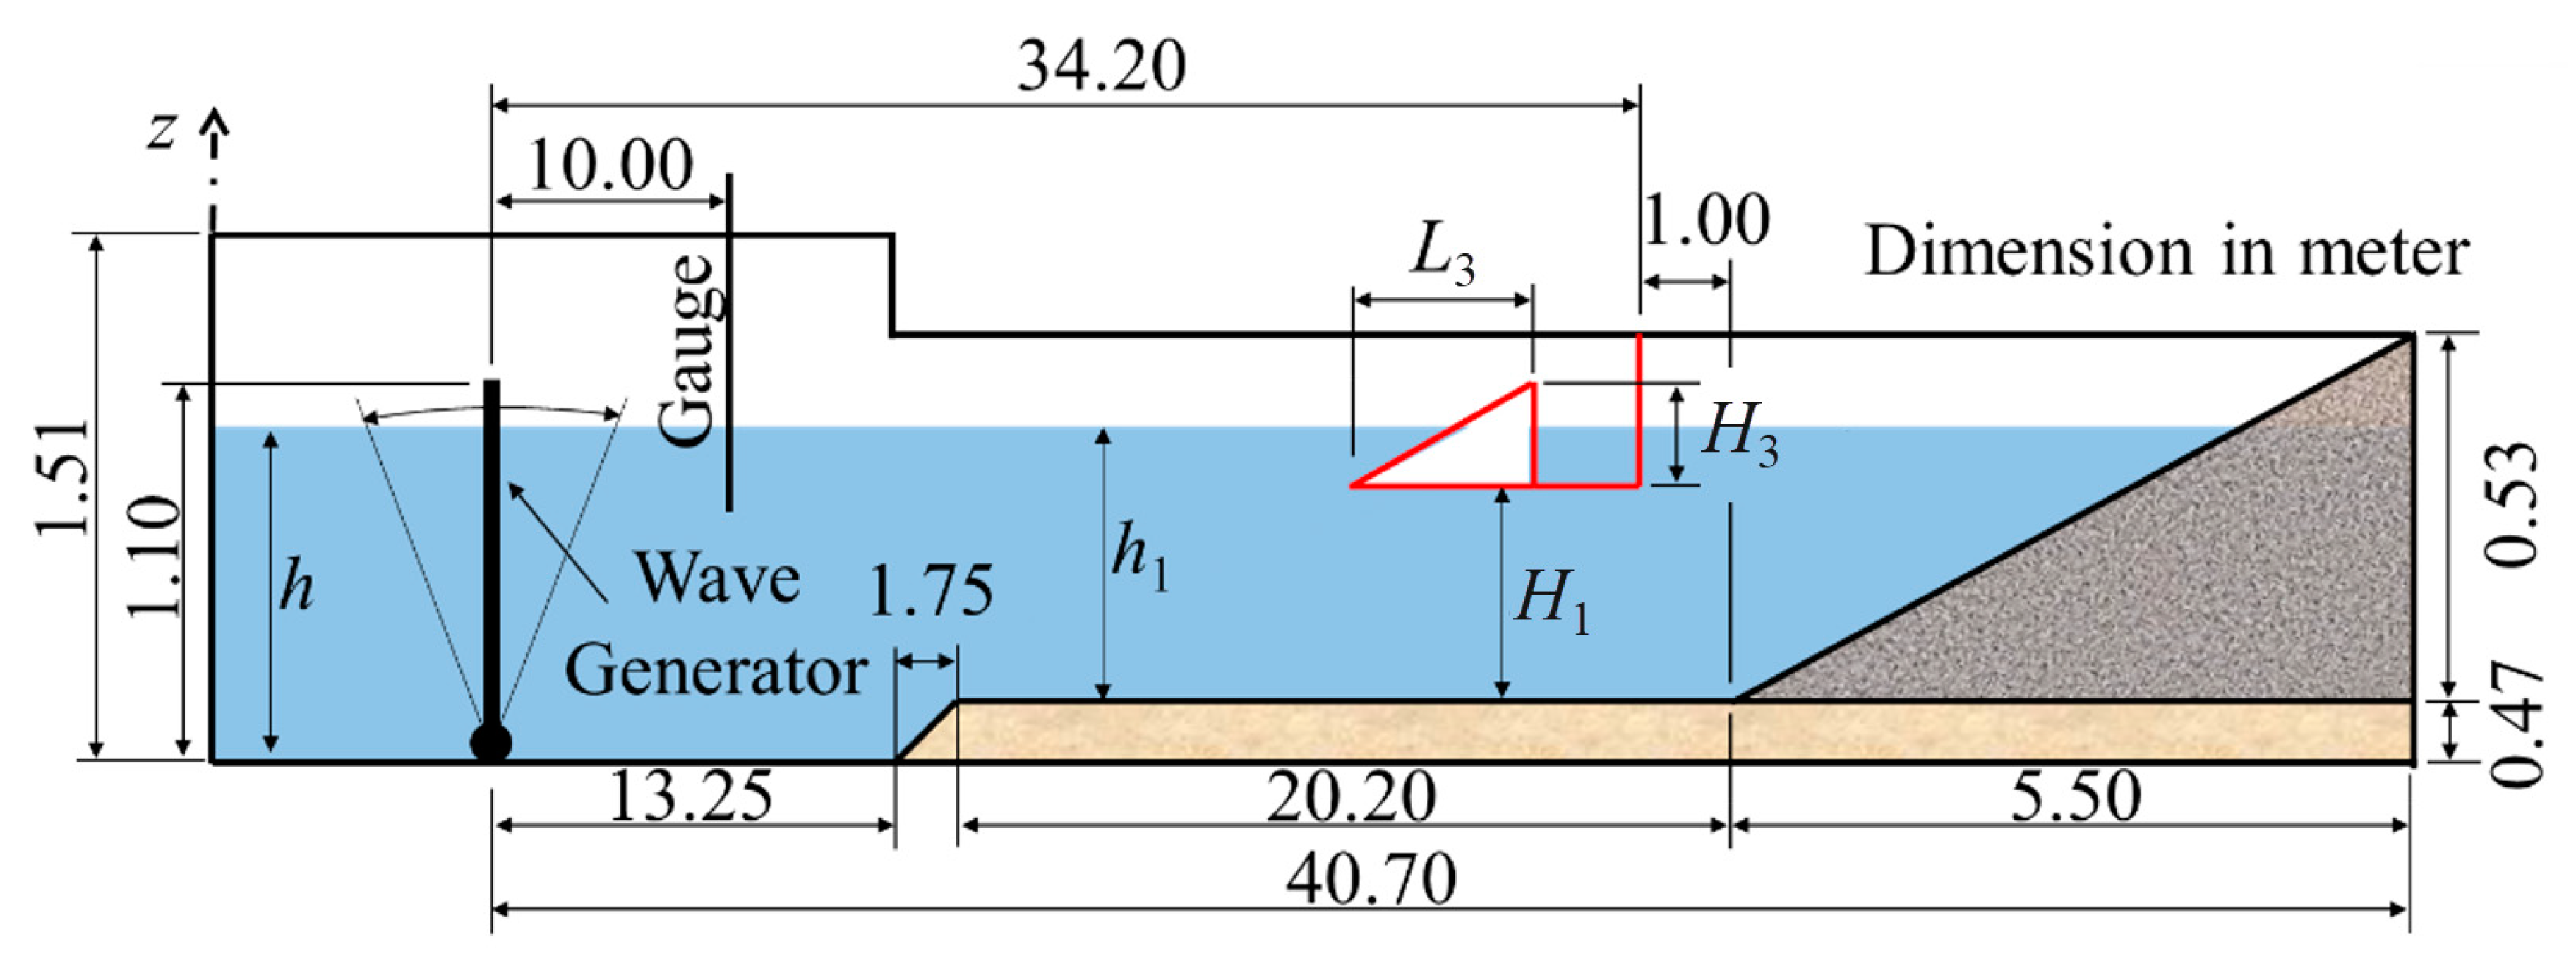
Figure 6 illustrates the wave channel at a laboratory scale used in the work of Goulart [45], which was reproduced numerically with the present computational method. The following dimensions were adopted in the problem: LT = 34.2 m, HT = 1.0 m, H1 = 0.15 m, Lr = 0.5 m, h = 0.862 m, h1 = 0.392 m, H3 = 0.279 m, and L3 = 0.716 m, leading to a ramp angle of 21.3°. Moreover, it is considered that the waves reaching the device have a period of T = 1.94 s, height of H = 0.067 m, and wavelength of λ = 3.54 m. Figure 7 shows the results of the height of water accumulated in the reservoir as a function of time obtained in the experiment of Goulart [45] (red line) and the numerical predictions obtained with the present computational method (black line). As can be observed, the experimental and numerical results were in close agreement, with a difference of 1.8%. The numerical results also predicted the beginning of the overtopping occurrence (t~22.5 s) and the slope of the curve of water accumulation in the reservoir well. Therefore, it is possible to state that the present computational method is verified and validated.

4.2. Geometric Investigation of the Overtopping Device with Coupled Obstacle

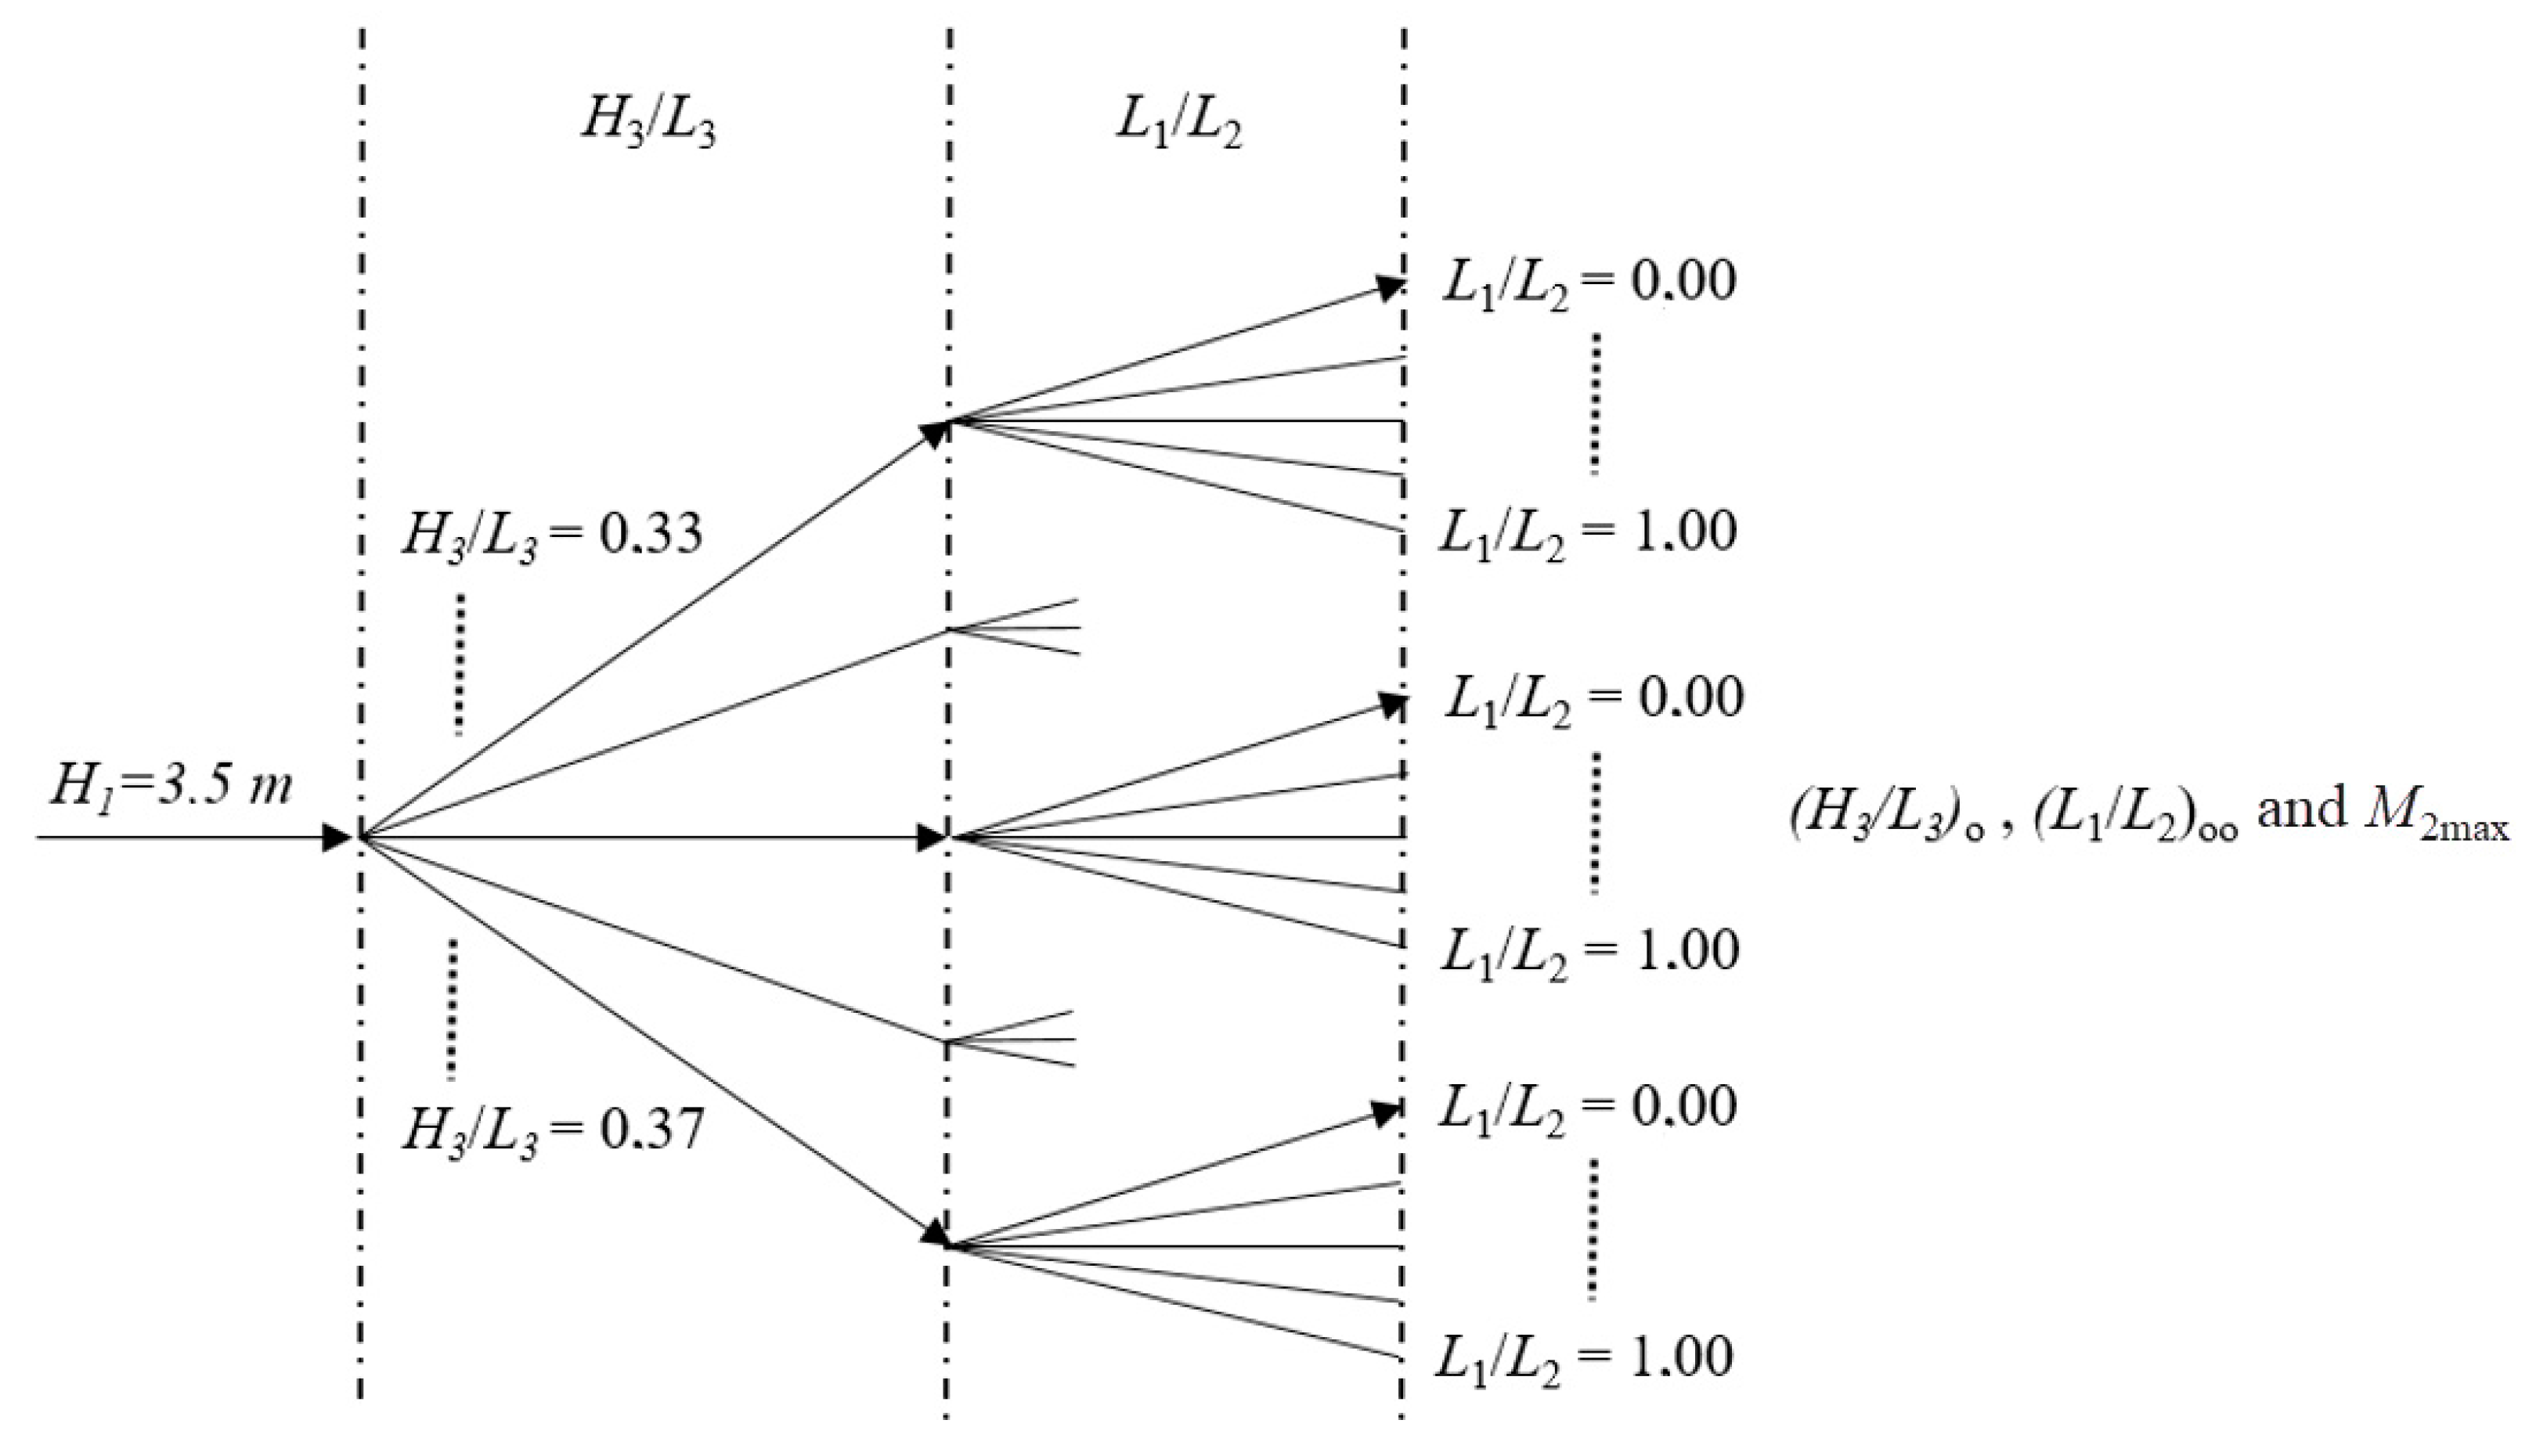
To perform the geometric evaluation, the geometry of the overtopping device with five different H3/L3 ratios, previously studied in [
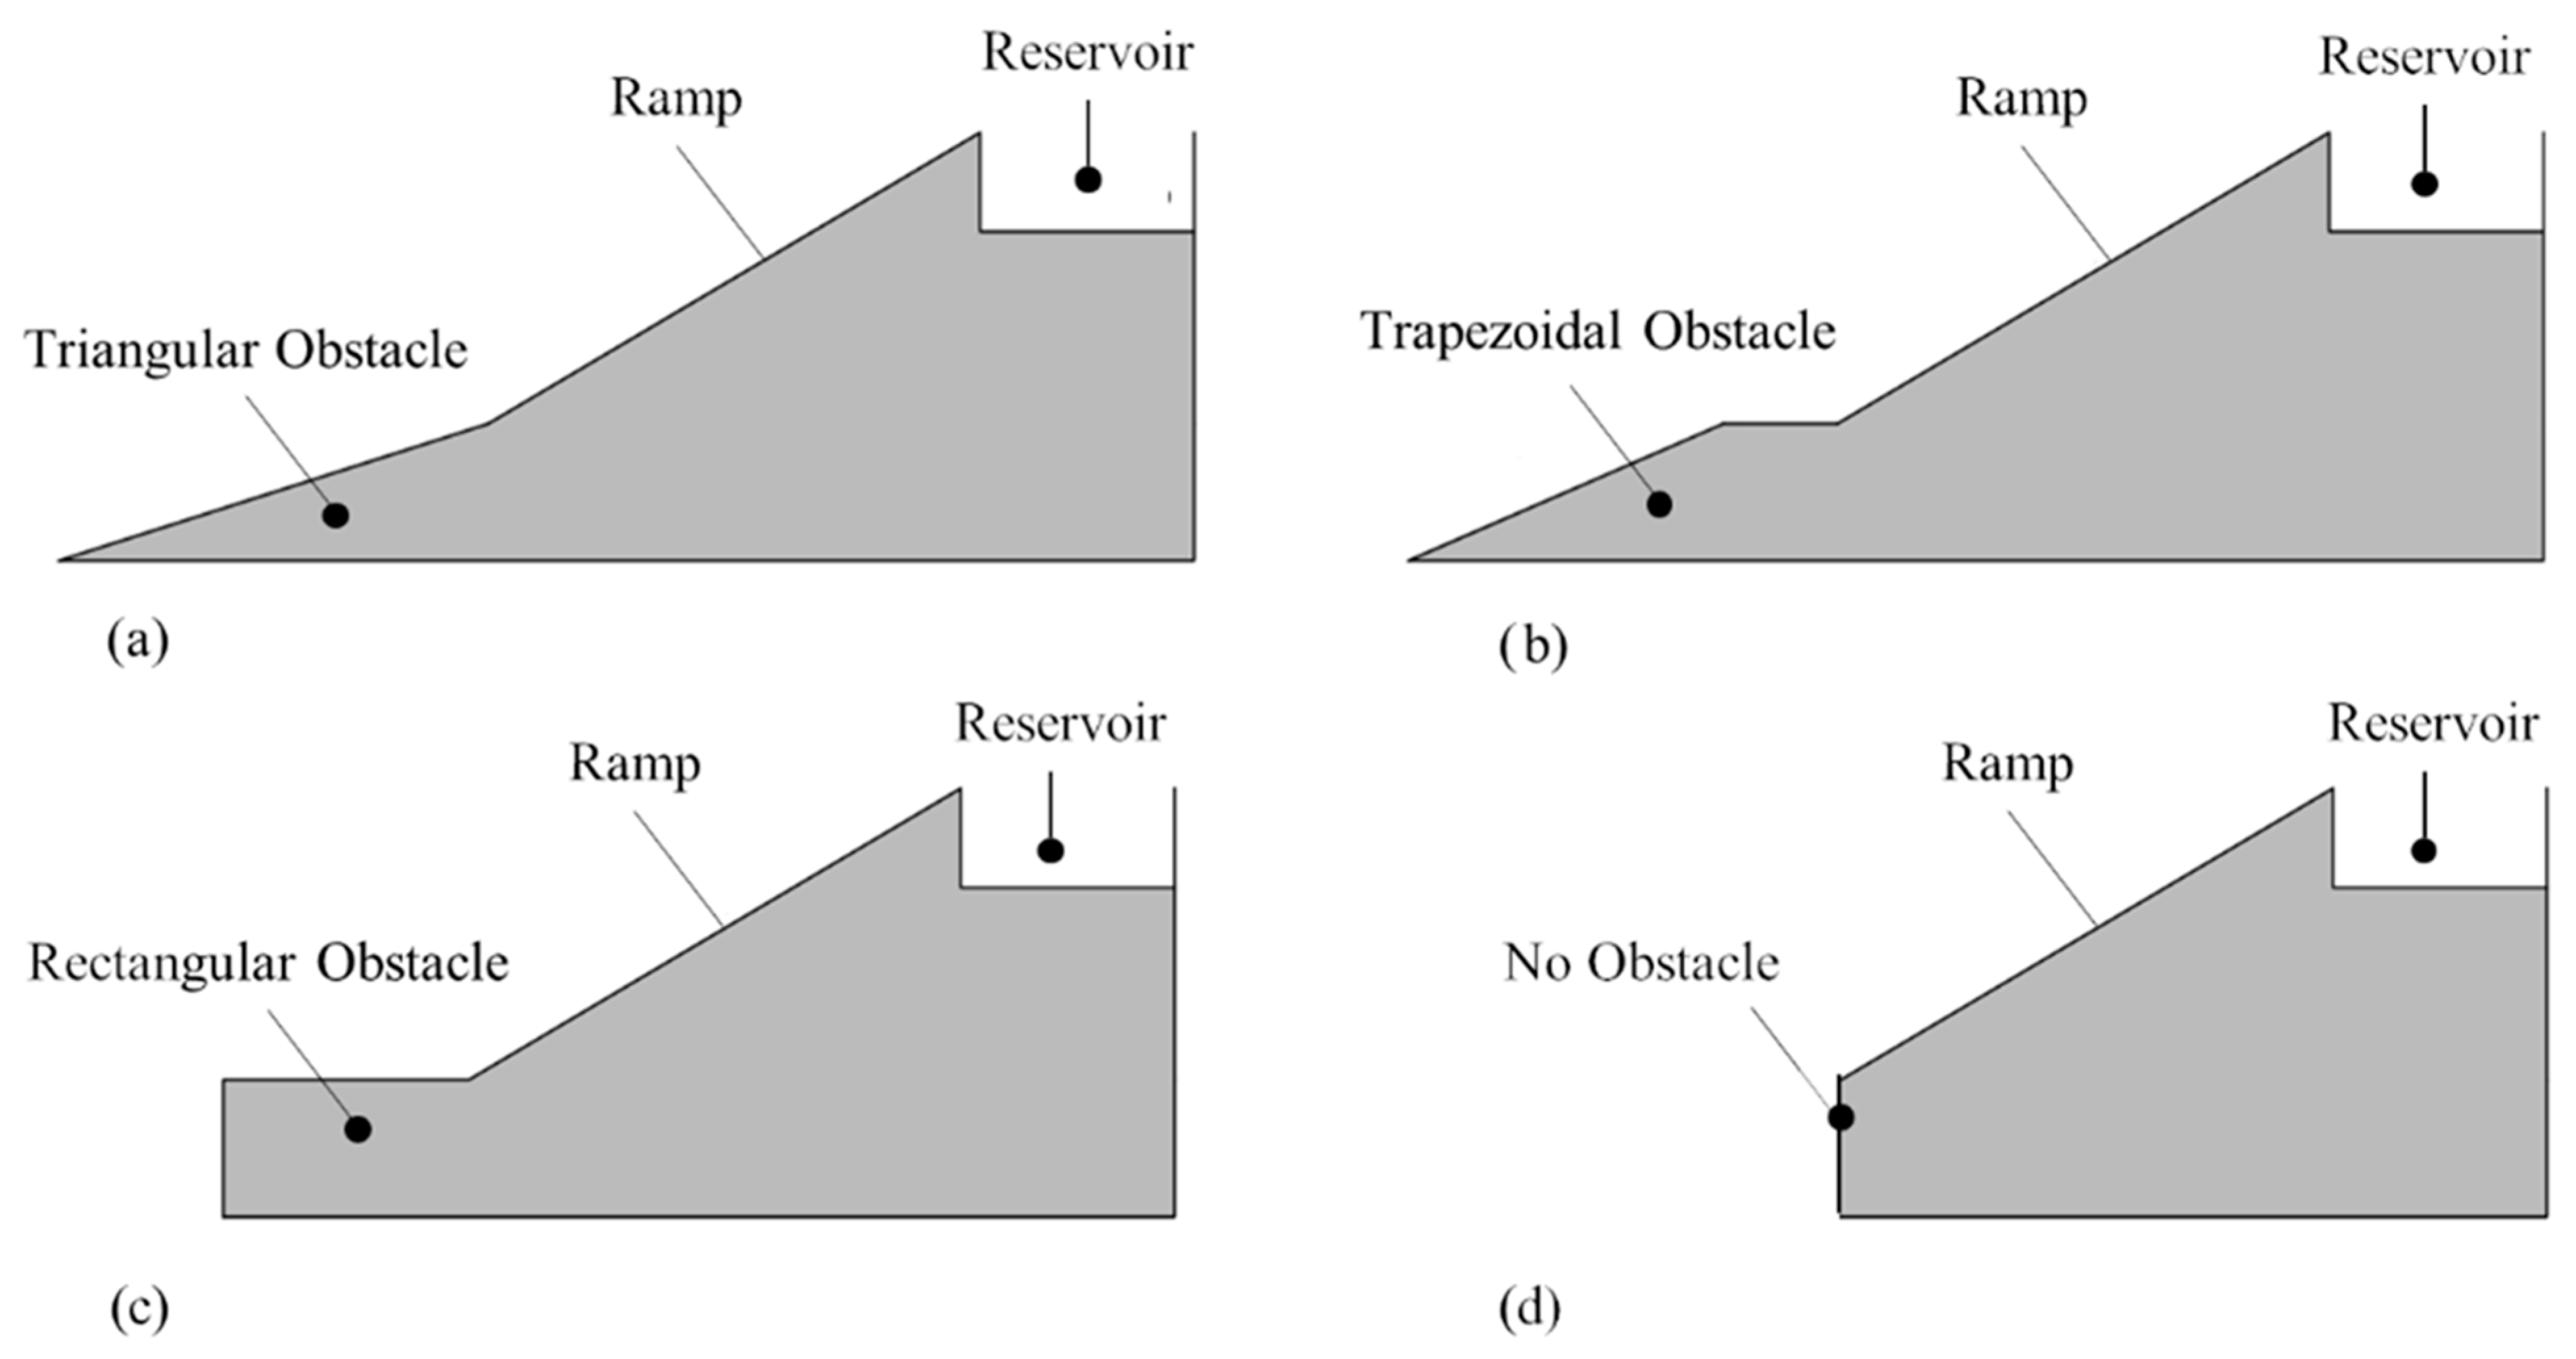
24], is considered. The obstacle attached to the device varied between the lowest magnitude of L1/L2 = 0.00, representing a triangular configuration, and the highest magnitude of L1/L2 = 1.00, representing a rectangular configuration. Intermediate ratios of L1/L2 (0.00 < L1/
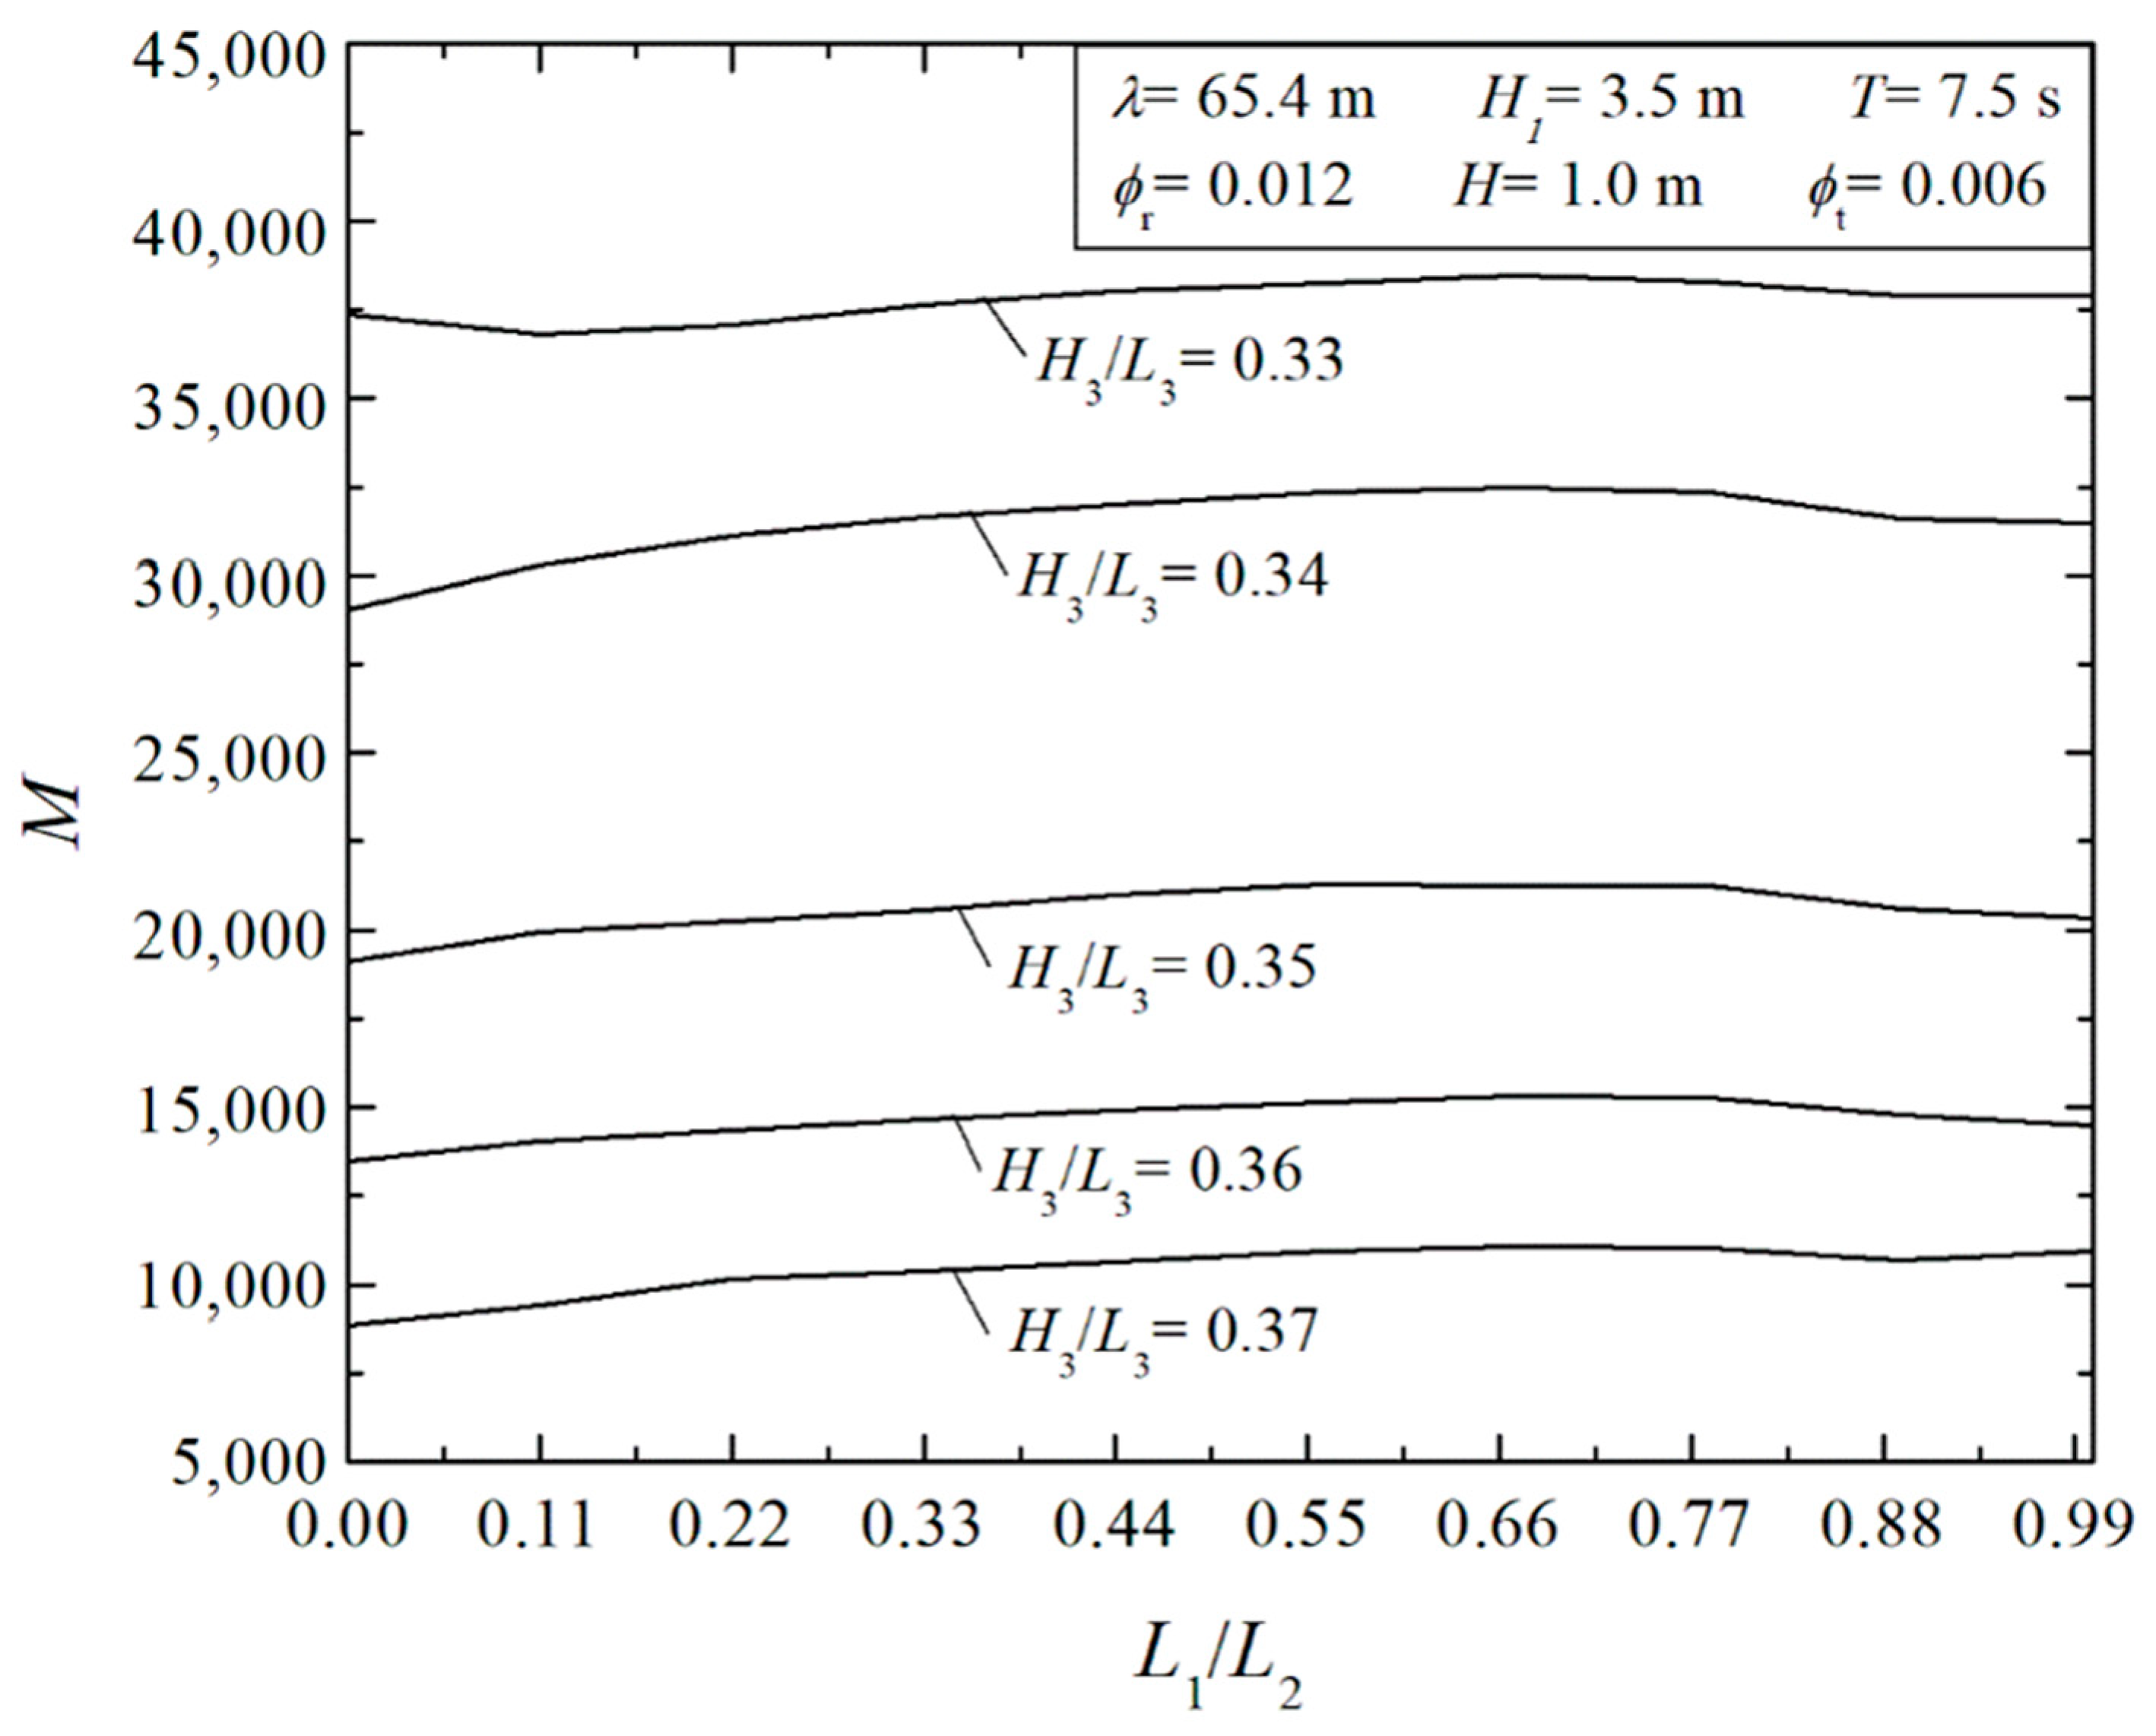
L2 < 1.00) refer to trapezoidal obstacles. The total sum of the mass of water entering the reservoir over the 100.00 s simulated was calculated to compare the performance of the different geometries.
Figure 8 shows the effect of the ratio L1/L2 over the total amount of water mass accumulated in the reservoir over the time interval considered (M) for different values of H3/L3. It is possible to observe that the ratio H3/L3 = 0.33 conducted to the maximum water accumulation in the reservoir was almost M = 40,000 kg, while ratios of H3/L3 = 0.37 led to an amount of mass in the range of M = 10,000 kg, i.e., a ratio of 4.5 times between the best and worst conditions of H3/L3. Results also indicated that the effect of L1/L2 on the device performance was significantly lower than the effect of H3/L3 over M, i.e., the sensibility of H3/L3 was much higher than L1/L2 over the overtopping performance. One example can be noticed for H3/L3 = 0.33, where the difference between the best configuration of L1/L2, (L1/L2)o = 0.67 led to a performance of only 5.00% superiority to that achieved for the worst configuration (L1/L2 = 0.11). As the magnitude of the ratio H3/L3 increases, the influence of the ratio L1/L2 over m increases, as can be attested for the ratio H3/L3 = 0.37, where the best configuration of L1/L2, (L1/L2)o = 0.67 conducted a performance nearly 20.00% superior than the triangular configuration (L1/L2 = 0.00) which conducted to the worst performance. Moreover, for all cases using H3/L3 an optimal intermediate configuration of L1/L2 is obtained. Despite presenting a secondary contribution, the ratio L1/L2 improved the overtopping device, mainly for non-optimized ratios of H3/L3.
The best configurations found in Figure 8 are summarized in Figure 9, presenting the effect of the ratio H3/L3 over the once-maximized mass of water accumulated in the reservoir, Mmax. The results reinforced the strong sensitivity of the ratio H3/L3 over the overtopping device performance. It is also noticed that, for almost all cases, the ratio L1/L2 = 0.67 led to the best performance, except for the case with H3/L3 = 0.35, where the ratio L1/L2 = 0.54 was the best. Thus, the L1/L2 ratio that provides the best performance in all cases has a trapezoidal shape. When considering a triangular obstacle, L1/L2 = 0.00, the wave flow suffers a dispersion and the overtopping is not favorable, i.e., the configuration of the ramp and obstacle acts as a beach, smoothing the intensity of the wave that reaches the final stage of the ramp. On the other hand, considering a rectangular obstacle, L1/L2 = 1.00, there is a greater reflection of the wave, also disfavoring the intensity of the flow that reaches the ramp.
The fluid dynamic behavior of the problem is shown, for some instances of time, in Figure 10 and Figure 11, where the water volumetric fraction and velocity fields are displayed. Thereby, it is possible to observe how the wave flows over the device for the case with the optimal ratio of (H3/L3)o = 0.33, considering three different obstacle ratios, (a) L1/L2 = 0.11, (b) (L1/L2)oo = 0.67, and (c) L1/L2 = 1.00. Furthermore, in Figure 10, water is represented by red, while air is represented by blue. Through the volume fraction fields in Figure 10, it is possible to observe the overtopping occurrence in the instances of time t = 74.00 s and 75.00 s for different configurations of L1/L2 investigated. In all plotted cases, between the time instances of 73.00 s ≤ t ≤ 75.00 s, it is observed that the water mass generates a high inflection in the free surface, which leads to a wave-breaking process, causing the overtopping. From t = 76.00 s on, it is noted that the wave stabilizes and the mass of water begins to move in the opposite direction, towards the base of the ramp. In Figure 11, among the color scales, red represents higher velocities while blue represents the lower ones. In all situations, it is observed that the highest magnitudes occur in the air due to the lower air density. In the time interval 74.00 s ≤ t ≤ 75.00 s, the mass of water entering the reservoir causes a boundary layer detachment, increasing the magnitude of velocity fields even more in the airflow near the water jet entering the reservoir. In the water region, the highest magnitudes can be noticed when the wave is in the imminence to overtop the ramp and after the overtopping, when the water is in the opposite direction of the wave flow. In this situation, the water going down the ramp meets the next incident wave, generating a mixture of streams and intensifying the velocity magnitude. Concerning the comparison of ratios L1/L2, only slight differences are observed in the volume fraction and velocity fields, which are reflected in the small differences found between the best and worst configurations.
Finally, a comparison among three different configurations coupled with the overtopping device was performed: 1—trapezoidal for the optimal ratio of L1/L2, 2—rectangular (L1/L2 = 1.00), 3—triangular (L1/L2 = 0.00), and one configuration without a seabed structure (for the same conditions studied in the work of Martins et al. [25]). Figure 12 illustrates the effect of the ratio H3/L3 over the amount of mass overtopped in the reservoir (M) along the time interval for the four studied configurations. It is important to mention that the mass accumulated in the reservoir is directly proportional to the potential energy of water in the device, considering the use of the same reservoir for all investigated configurations, as is the case here. Therefore, the highest magnitudes of M led to the highest energy conversion when the water in the reservoir is expanded in a low-head turbine. Results demonstrated that the best configuration is the trapezoidal, followed by the rectangular and triangular configurations, respectively, regardless of the ratio H3/L3. Moreover, results demonstrated that the differences between the different configurations with the coupled structure are not significant, mainly for (H3/L3)o = 0.33, where differences are nearly 4%. Despite the influence of the degree of freedom of L1/L2 being smaller than that of H3/L3, analyzing the results shown in Figure 12, it is possible to state that the configuration of the obstacle-ramp set captures a greater amount of water mass in the reservoir, making this configuration more efficient compared to the conventional overtopping device. For the twice optimal configuration, i.e., for (H3/L3)o = 0.33 and (L1/L2)oo = 0.67, the coupling of the trapezoidal structure improved the device performance by 30% when compared to the conventional device for the same H3/L3 ratio. For non-optimized ratios of H3/L3, the influence of the seabed structure is even more important. For instance, for H3/L3 = 0.34, the performance reached with the trapezoidal structure is around 1.7 times superior to the case without the structure.

5. Conclusions

In the present paper, a numerical analysis and optimization study was carried out to evaluate the geometry of a seabed structure coupled with the ramp of an onshore overtopping device. The geometry was varied to maximize the amount of water from the incident waves entering the reservoir of the overtopping device. The variation of two degrees of freedom was analyzed, along with the ratio between the major and minor base of the trapezoidal obstacle (L1/L2) and the ratio between the height and length of the device ramp (H3/L3). The geometric evaluation was performed using the Constructal Design method, and the optimization was performed using the exhaustive search method.
In all cases analyzed, the maximum amount of water that entered the reservoir over time occurred for the lowest ratio of (H3/L3), (H3/L3)o = 0.33, associated with intermediate geometries of L1/L2, i.e., trapezoidal configurations. With the exception of the ratio H3/L3 = 0.35, the best ratios of L1/L2 were obtained for (L1/L2)o = 0.67. On the contrary, the worst performances were achieved for the highest magnitudes of H3/L3 and lower magnitudes of L1/L2. It is important to note that the H3/L3 ratio had a bigger influence on the device performance than the L1/L2 ratio had over the device performance. Despite that, the L1/L2 ratio led to improvements of approximately 4% and 20% when comparing the best and worst geometry ratios of H3/L3.
Results, in general, showed the applicability and efficiency of the Constructal Design in the geometric evaluation after finding that the best geometry has a performance four times higher than the case in which the worst geometry was adopted for the obstacle-ramp set. Finally, the comparative numerical analysis between an overtopping device without an obstacle and a device with a coupled structure proved that the use of the obstacle provides better performance for the wave energy converter than a conventional device. For the ratio (H3/L3)o = 0.33, the use of the coupled structure improved the performance by 30% in comparison with the case without a structure studied in the work of Martins et al. [25].
For future studies, it is suggested to vary both the construction area of the ramp and the coupled structure, as well as to analyze the variation of the submersion of the device. Still, it is suggested that optimization studies of wave energy converter devices be carried out using the WaveMIMO methodology, which allows the numerical simulation of irregular waves based on realistic sea states. In this way, it is possible to optimize an overtopping device considering the wave climate of the place where it is to be installed.

Author Contributions

Conceptualization, A.S.d.B., L.A.O.R., B.N.M., L.A.I., M.d.N.G. and E.D.d.S.; methodology, A.S.d.B., M.d.S.P., B.N.M., L.A.I., M.d.N.G. and E.D.d.S.; software, A.S.d.B., B.N.M., L.A.I., M.d.N.G. and E.D.d.S.; validation, A.S.d.B., M.d.S.P., B.N.M., M.d.N.G. and E.D.d.S.; formal analysis, C.F., L.A.O.R., B.N.M., L.A.I., M.d.N.G. and E.D.d.S.; investigation, A.S.d.B., M.d.S.P., B.N.M., L.A.I. and E.D.d.S.; resources, C.F., L.A.O.R., L.A.I. and E.D.d.S.; data curation, B.N.M., L.A.I., M.d.N.G. and E.D.d.S.; writing—original draft preparation, M.d.S.P., B.N.M. and E.D.d.S.; writing—review and editing, C.F., L.A.O.R., L.A.I. and M.d.N.G.; visualization, C.F., L.A.O.R., L.A.I. and E.D.d.S.; supervision, M.d.N.G., B.N.M. and E.D.d.S.; project administration, L.A.O.R., B.N.M., L.A.I., M.d.N.G. and E.D.d.S.; funding acquisition, C.F., L.A.O.R., L.A.I., M.d.N.G. and E.D.d.S. All authors have read and agreed to the published version of the manuscript.

Funding

This research was funded by Brazilian Coordination for the Improvement of Higher Education Personnel—CAPES (Finance Code 001), Research Support Foundation of the State of Rio Grande do Sul—FAPERGS (Public Call FAPERGS 07/2021—Programa Pesquisador Gaúcho—PqG—21/2551-0002231-0), Brazilian National Council for Scientific and Technological Development—CNPq (Processes: 309648/2021-1, 307791/2019-0, 308396/2021-9, 440010/2019-5, and 440020/2019-0), and Ministry of Science, Technology, Innovation and Communications (Public Call MCTIC/CNPq N°28/2018—Universal).

Institutional Review Board Statement

Not applicable.

Informed Consent Statement

Not applicable.

Data Availability Statement

The data presented in this study are available on request from the corresponding author. The data are not publicly available due to privacy reasons.

Acknowledgments

The authors thank FAPERGS (Public Call FAPERGS 07/2021—Programa Pesquisador Gaúcho—PqG—process: 21/2551-0002231-0) and CNPq (Public Call CNPQ/EQUINOR Energia Ltd.a N° 38/2018—Processes: 440010/2019-5 and 440020/2019-0) for the financial support. The authors A.S.d.B. and M.d.S.P. thank CAPES (Finance Code 001) for their master’s scholarship. The author M.d.N.G. thanks MCTIC (Public Call MCTIC/CNPq N° 28/2018—Universal). The authors L.A.O.R., L.A.I. and E.D.d.S. are grant holders of the CNPq (processes: 307791/2019-0, 309648/2021-1, and 308396/2021-9, respectively).

Conflicts of Interest

The authors declare no conflict of interest. The funders had no role in the design of the study, in the collection, analyses, or interpretation of data, or in the writing of the manuscript, as well as in the decision to publish the results.

Nomenclature

ATchannel total area [m2]
Attrapezoidal obstacle area [m2]
Arovertopping device ramp area [m2]
cwave celerity [m/s]
g gravity acceleration vector [m/s2]
Hwave height [m]
hwater depth [m]
Hrreservoir height [m]
HTwave channel height [m]
H1device submersion [m]
h1water depth in experimental test [m]
H3ramp height [m]
icounter variable [-]
kwave number [m−1]
Lrreservoir length [m]
LTwave channel length [m]
L1minor base of the trapezoidal obstacle [m]
L2major base of the trapezoidal obstacle [m]
L3ramp length [m]
Mwater mass accumulated [kg]
M ˙ mass flow rate [kg∙s−1]
Ntotal number of data [-]
Onumerical data [m]
Panalytical data [m]
pstatic pressure [Pa]
Twave period [s]
ttime [s]
tftime interval of analysis [s]
uhorizontal velocity component [m/s]
v velocity vector [m/s]
xhorizontal coordinate axis [m]
wvertical velocity component [m/s]
zvertical coordinate axis [m]
αvolume fraction [-]
ηwater-free surface elevation [m]
λwavelength [m]
μdynamic viscosity [kg/(m.s)]
ρfluid density [kg/m3]
τ ¯ ¯ strain rate tensor [N/m2]
ϕrfraction area of the ramp [-]
ϕtfraction area of the trapezoidal obstacle [-]
φ velocity potential [m2/s]
ωangular wave frequency [Hz]

References

  1. Østergaard, P.A.; Duic, N.; Noorollahi, Y.; Kalogirou, S. Renewable energy for sustainable development. Renew. Energy 2022, 199, 1145–1152. [Google Scholar] [CrossRef]
  2. Hernández-Fontes, J.V.; Martínez, M.L.; Wojtarowski, A.; González-Mendoza, J.L.; Landgrave, R.; Silva, R. Is ocean energy an alternative in developing regions? A case study in Michoacan, Mexico. J. Clean. Prod. 2020, 266, 121984. [Google Scholar] [CrossRef]
  3. Clemente, D.; Rosa-Santos, P.; Taveira-Pinto, F. On the potential synergies and applications of wave energy converters: A review. Renew. Sustain. Energy Rev. 2021, 135, 110162. [Google Scholar] [CrossRef]
  4. Liu, Z.; Shi, H.; Cui, Y.; Kim, K. Experimental study on overtopping performance of a circular ramp wave energy converter. Renew. Energy 2017, 104, 163–176. [Google Scholar] [CrossRef]
  5. Liu, Z.; Han, Z.; Shi, H.; Yang, W. Experimental study on multi-level overtopping wave energy convertor under regular waves conditions. Int. J. Nav. Archit. Ocean. Eng. 2018, 10, 651–659. [Google Scholar] [CrossRef]
  6. Rosa-Santos, P.; Taveira-Pinto, F.; Clemente, D.; Cabral, T.; Fiorentin, F.; Belga, F.; Morais, T. Experimental Study of a Hybrid Wave Energy Converter Integrated in a Harbor Breakwater. J. Mar. Sci. Eng. 2019, 7, 33. [Google Scholar] [CrossRef]
  7. Peng, W.; Zhang, Y.; Yang, X.; Zhang, J.; He, R.; Liu, Y.; Chen, R. Hydrodynamic Performance of a Hybrid System Combining a Fixed Breakwater and a Wave Energy Converter: An Experimental Study. Energies 2020, 13, 5740. [Google Scholar] [CrossRef]
  8. Singh, U.; Abdussamie, N.; Hore, J. Hydrodynamic performance of a floating offshore OWC wave energy converter: An experimental study. Renew. Sustain. Energy Rev. 2020, 117, 109501. [Google Scholar] [CrossRef]
  9. Clemente, D.; Calheiros-Cabral, T.; Rosa-Santos, P.; Taveira-Pinto, F. Hydraulic and Structural Assessment of a Rubble-Mound Breakwater with a Hybrid Wave Energy Converter. J. Mar. Sci. Eng. 2021, 9, 922. [Google Scholar] [CrossRef]
  10. Liu, Z.; Xu, C.; Kim, K. Overall performance of a model OWC system under the free-spinning mode: An experimental study. Ocean. Eng. 2021, 227, 108890. [Google Scholar] [CrossRef]
  11. Shahroozi, Z.; Göteman, M.; Engström, J. Experimental investigation of a point-absorber wave energy converter response in different wave-type representations of extreme sea states. Ocean. Eng. 2022, 248, 110693. [Google Scholar] [CrossRef]
  12. Pecher, A.; Kofoed, J.P. Handbook of Ocean Wave Energy; Springer Open: Cham, Switzerland, 2017. [Google Scholar]
  13. Seibt, F.M.; Camargo, F.V.; Dos Santos, E.D.; Neves, G.M.; Rocha, L.A.O.; Isoldi, L.A.; Fragassa, C. Numerical evaluation on the efficiency of the submerged horizontal plate type wave energy converter. FME Trans. 2019, 47, 543–551. [Google Scholar] [CrossRef]
  14. Carmigniani, R.; Leroy, A.; Violeau, D. A simple SPH model of a free surface water wave pump: Waves above a submerged plate. Coast. Eng. J. 2019, 61, 96–108. [Google Scholar] [CrossRef]
  15. He, M.; Gao, X.; Xu, W.; Ren, B.; Wang, H. Potential application of submerged horizontal plate as a wave energy breakwater: A 2D study using the WCSPH method. Ocean. Eng. 2019, 185, 27–46. [Google Scholar] [CrossRef]
  16. Kofoed, J.P.; Frigaard, P.; Friis-Madsen, E.; Sørensen, H.C. Prototype testing of the wave energy converter wave dragon. Renew. Energy 2006, 31, 181–189. [Google Scholar] [CrossRef]
  17. Han, Z.; Liu, Z.; Shi, H. Numerical study on overtopping performance of a multi-level breakwater for wave energy conversion. Ocean. Eng. 2018, 150, 94–101. [Google Scholar] [CrossRef]
  18. Lauro, E.D.; Maza, M.; Lara, J.L.; Losada, I.J.; Vicinanza, D. Advantages of an innovative vertical breakwater with an overtopping wave energy converter. Coast. Eng. 2020, 159, 103713. [Google Scholar] [CrossRef]
  19. Contestabile, P.; Crispino, G.; Russo, S.; Gisonni, C.; Cascetta, F.; Vicinanza, D. Crown wall modifications as response to wave overtopping under a future sea level scenario: An experimental parametric study for an innovative composite seawall. Appl. Sci. 2020, 10, 2227. [Google Scholar] [CrossRef]
  20. Contestabile, P.; Russo, S.; Azzellino, A.; Cascetta, F.; Vicinanza, D. Combination of local sea winds/land breezes and nearshore wave energy resource: Case study at MaRELab (Naples, Italy). Energy Convers. Manag. 2022, 257, 115356. [Google Scholar] [CrossRef]
  21. Bejan, A. Shape and Structure, from Engineering to Nature; Cambridge University Press: Cambridge, UK, 2000. [Google Scholar]
  22. Dos Santos, E.D.; Machado, B.N.; Zanella, M.M.; Gomes, M.; Das, N.; Souza, J.A.; Isoldi, L.A.; Rocha, L.A.O. Numerical Study of the Effect of the Relative Depth on the Overtopping Wave Energy Converters According to Constructal Design. Defect Diffus. Forum 2014, 348, 232–244. [Google Scholar] [CrossRef]
  23. Goulart, M.M.; Martins, J.C.; Acunha Junior, I.C.; das Neves Gomes, M.; Souza, J.A.; Rocha, L.A.O.; Isoldi, L.A.; dos Santos, E.D. Constructal design of an onshore overtopping device in real scale for two different depths. Mar. Syst. Ocean. Technol. 2015, 10, 120–129. [Google Scholar] [CrossRef]
  24. Martins, J.C.; Goulart, M.M.; Gomes, M.N.; Souza, J.A.; Rocha, L.A.O.; Isoldi, L.A.; Santos, E.D. Geometric evaluation of the main operational principle of an overtopping wave energy converter by means of Constructal Design. Renew. Energy 2018, 118, 727–741. [Google Scholar] [CrossRef]
  25. Martins, J.C.; Fragassa, C.; Goulart, M.M.; dos Santos, E.D.; Isoldi, L.A.; das Neves Gomes, M.; Rocha, L.A.O. Constructal Design of an Overtopping Wave Energy Converter Incorporated in a Breakwater. J. Mar. Sci. Eng. 2022, 10, 471. [Google Scholar] [CrossRef]
  26. Gomes, M.; Das, N.; Lorenzini, G.; Rocha, L.A.O.; Dos Santos, E.D.; Isoldi, L.A. Constructal Design Applied to the Geometric Evaluation of an Oscillating Water Column Wave Energy Converter Considering Different Real Scale Wave Periods. J. Eng. Thermophys. 2018, 27, 173–190. [Google Scholar] [CrossRef]
  27. Gomes, M.N.; De Deus, M.J.; Dos Santos, E.D.; Isoldi, L.A.; Rocha, L.A.O. Analysis of the Geometric Constraints Employed in Constructal Design for Oscillating Water Column Devices Submitted to the Wave Spectrum Through a Numerical Approach. Defect Diffus. Forum 2019, 390, 193–210. [Google Scholar] [CrossRef]
  28. Bejan, A. The Physics of Life: The Evolution of Everything; St. Martin’s Press: New York, NY, USA, 2016. [Google Scholar]
  29. Bejan, A.; Lorente, S. Design with Constructal Theory; Wiley: New Jersey, NJ, USA, 2008. [Google Scholar]
  30. Bejan, A.; Zane, J. Design in Nature; Doubleday: New York, NY, USA, 2012. [Google Scholar]
  31. Bejan, A.; Lorente, S. Constructal Theory of generation of configuration in nature and engineering. J. Appl. Phys. 2006, 100, 5. [Google Scholar] [CrossRef]
  32. Guimarães, R.C.; Oleinik, P.H.; Kirinus, E.P.; Lopes, B.V.; Trombetta, T.B.; Marques, W.C. An overview of the Brazilian continental shelf wave energy potential. Reg. Stud. Mar. Sci. 2018, 25, 100446. [Google Scholar] [CrossRef]
  33. Oleinik, P.H.; Marques, W.C.; Kirinus, E.P. Evaluation of the seasonal pattern of wind-driven waves on the south-southeastern Brazilian shelf. Defect Diffus. Forum 2017, 370, 141–151. [Google Scholar] [CrossRef]
  34. Machado, B.N.; Oleinik, P.H.; Kirinus, E.P.; Dos Santos, E.D.; Rocha, L.A.O.; Gomes, M.; Das, N.; Conde, J.M.P.; Isoldi, L.A. WaveMIMO Methodology: Numerical Wave Generation of a Realistic Sea State. J. Appl. Comput. Mech. 2021, 1, 2129–2148. [Google Scholar] [CrossRef]
  35. Maciel, R.P.; Fragassa, C.; Machado, B.N.; Rocha, L.A.O.; Dos Santos, E.D.; Gomes, M.; Das, N.; Isoldi, L.A. Verification and Validation of a Methodology to Numerically Generate Waves Using Transient Discrete Data as Prescribed Velocity Boundary Condition. J. Mar. Sci. Eng. 2021, 9, 896. [Google Scholar] [CrossRef]
  36. Hubner, R.G.; Fragassa, C.; Paiva, M.S.; Oleinik, P.H.; Gomes, M.N.; Rocha, L.A.O.; Santos, E.D.; Machado, B.N.; Isoldi, L.A. Numerical Analysis of an Overtopping Wave Energy Converter Subjected to the Incidence of Irregular and Regular Waves from Realistic Sea States. J. Mar. Sci. Eng. 2022, 10, 1084. [Google Scholar] [CrossRef]
  37. Jiao, P.; Matin Nazar, A.; Egbe, K.-J.I.; Barri, K.; Alavi, A.H. Magnetic capsulate triboelectric nanogenerators. Sci. Rep. 2022, 12, 89. [Google Scholar] [CrossRef] [PubMed]
  38. Hirt, C.W.; Nichols, B.D. Volume of fluid (VOF) method for the dynamics of free boundaries. J. Comput. Phys. 1981, 39, 201–225. [Google Scholar] [CrossRef]
  39. Schlichting, H. Boundary Layer Theory; McGraw-Hill: New York, NY, USA, 1979. [Google Scholar]
  40. Chakrabarti, S.K. Handbook of Offshore Engineering; Elsevier: St. Louis, PH, USA, 2005. [Google Scholar]
  41. Michael, E.; McCormick, M.E. Ocean Engineering Mechanics with Applications; Cambridge University Press: New York, NY, USA, 2009. [Google Scholar]
  42. Chai, T.; Draxler, R.R. Root mean square error (RMSE) or mean absolute error (MAE)? Arguments against avoiding RMSE in the literature. Geosci. Model Dev. 2014, 7, 1247–1250. [Google Scholar] [CrossRef] [Green Version]
  43. Versteeg, H.K.; Malalasekera, W. An Introduction to Computational Fluid Dynamics—The Finite Volume Method; Pearson Education Limited: London, UK, 2007. [Google Scholar]
  44. Patankar, S.V. Numerical Heat Transfer and Fluid Flow; McGraw-Hill: New York, NY, USA, 1980. [Google Scholar]
  45. Goulart, M.M. Validation of a Numerical Model of an Overtopping Device and Numerical and Experimental Research of Geometry Applying the Constructal Design Method. Master’s Thesis, Universidade Federal do Rio Grande, Rio Grande, Brazil, 2022. (In Portuguese). [Google Scholar]
Figure 1. Schematic representation of the two-dimensional computational domain of the overtopping device coupled with the trapezoidal obstacle in the wave channel.
Jmse 11 00412 g001
Figure 2. Geometric configurations of the obstacle and case without the obstacle: (a) triangular; (b) trapezoidal; (c) rectangular; and (d) no obstacle.
Jmse 11 00412 g002
Figure 3. Illustration of the optimization process applied to the overtopping device varying two degrees of freedom.
Jmse 11 00412 g003
Figure 4. Spatial discretization of overtopping device detailing the regions of ramp and obstacle.
Jmse 11 00412 g004
Figure 5. Comparison of the numerical and analytical solution of water surface level in the wave channel.
Jmse 11 00412 g005
Figure 6. Illustration of the domain investigated experimentally in the work of Goulart [45] and validated with the present computational method.
Jmse 11 00412 g006
Figure 7. Water accumulated in the reservoir of laboratory-scale overtopping device as function of time obtained experimentally in Goulart [45] and with the present numerical method.
Jmse 11 00412 g007
Figure 8. Influence of ratio L1/L2 over the mass of water considering different H3/L3 values.
Jmse 11 00412 g008
Figure 9. Influence of ratio H3/L3 over once-maximized mass of water and corresponding optimal ratios of L1/L2.
Jmse 11 00412 g009
Figure 10. Transient fields of volume fraction for (H3/L3)o = 0.33 and the ratios: (a) L1/L2 = 0.11; (b) (L1/L2)o = 0.67; and (c) L1/L2 = 1.00.
Jmse 11 00412 g010
Figure 11. Transient fields of velocity fields for (H3/L3)o = 0.33 and the ratios: (a) L1/L2 = 0.11; (b) (L1/L2)o = 0.67; and (c) L1/L2 = 1.00.
Jmse 11 00412 g011
Figure 12. Comparison between the performance of the device without an obstacle studied in [25] with the device integrated with different geometric shapes of obstacles.
Jmse 11 00412 g012
Table 1. Characteristics of the regular waves.
CharacteristicNomenclatureMagnitude
Wave heightH (m)1.00
Wave periodT (s)7.50
Wavelength λ (m)64.50
Water depthh (m)10.00
Table 2. Values considered for the ratio H3/L3.
H3/L3H3 (m)L3 (m)
0.337.230021.7000
0.347.305221.4860
0.357.411921.1768
0.367.517020.8806
0.377.620720.5965
Table 3. Values considered for the investigated ratios of L1/L2.
L1/L2L1 (m)L2 (m)
0.000.0021.00
0.112.0818.92
0.223.7917.21
0.335.2115.79
0.446.4214.58
0.567.5413.46
0.678.4312.57
0.789.2011.80
0.899.8911.11
1.0010.5010.50
Table 4. Methods and parameters used in the present numerical simulations.
Parameters Numerical Inputs
Solver Pressure-Based
Pressure-Velocity Coupling PISO
Spatial DiscretizationGradient EvaluationGreen-Gauss-Cell-Based
PressurePRESTO
MomentumFirst Order Upwind
Volume FractionGeo-Reconstruct [38]
Temporal Differencing Scheme First Order Implicit
Under-Relaxation FactorsPressure0.3
Momentum0.7
ResidualContinuity10−6
x-velocity
z-velocity
Open Channel Initialization Method Plane
Regime Flow Laminar
Time Step (∆t) 2.00 × 10⁻² s
Total time of investigation 100 s
Table 5. Average MAE and simulation time values for each mesh.
Number of VolumesMAE (%)Processing Time (h)
19,0000.815.50
38,0000.858.00
76,0000.8712.00
152,0000.8819.50
Table 6. Free surface elevation height at x = 50.00 m and t = 15.00 s and the variation among the time steps.
t (s)η (m)Variation (%)
5.0 × 10−310.507790-
1.0 × 10−210.5077701.90 × 10−4
2.0 × 10−210.5077006.66 × 10−4
4.0 × 10−210.4964001.10 × 10−1
Disclaimer/Publisher’s Note: The statements, opinions and data contained in all publications are solely those of the individual author(s) and contributor(s) and not of MDPI and/or the editor(s). MDPI and/or the editor(s) disclaim responsibility for any injury to people or property resulting from any ideas, methods, instructions or products referred to in the content.

