Article

Preliminary Design Tools for Hydrodynamic Aspects of Submerged Impermeable Breakwaters

1
The Interdisciplinary Program for Marine Engineering, Technion-Israel Institute of Technology, Coastal and Marine Engineering Research Institute, CAMERI, Technion City, Haifa 32000, Israel
2
Faculty of Mechanical Engineering, Technion-Israel Institute of Technology, Haifa 32000, Israel
*
Author to whom correspondence should be addressed.
J. Mar. Sci. Eng. 2023, 11(2), 236; https://doi.org/10.3390/jmse11020236
Submission received: 13 November 2022 / Revised: 10 January 2023 / Accepted: 11 January 2023 / Published: 17 January 2023
(This article belongs to the Section Marine Aquaculture)

Abstract

:
The boundary element method (BEM) with Lagrangian formulation is a conceptually simple and efficient method for the simulation of nonlinear wave shoaling, with or without impermeable coastal structures, up to the wave breaking. However, in post-breaking flows, the domain is no longer simply connected, and the BEM is not efficient for the generation of a new free surface. Volumes of fluid (VOF) methods are made to track the fluid-free surfaces after breaking, but they are more numerically complex and less efficient relative to the BEM before breaking. This study presents a numerical model, named BELWF—boundary elements Lagrangian wave flume—for the mathematical simulation of two-dimensional wave flumes. The BELWF can simulate the hydrodynamics of wave shoaling over a coast profile, with submerged impermeable coastal structures of any geometry. The developed model is applied to simulate and study Geotube structures. The BELWF is validated by comparisons with OpenFOAM simulations. Both the BELWF and OpenFOAM simulations show that the most critical state, regarding the sliding stability of the Geotube, occurs, typically just before breaking, where the BELWF reasonably assesses the wave loads and the sliding stability. Hence, the BELWF is a valid and efficient method for the preliminary design of impermeable coastal structures. Finally, the BELWF is applied to simulate a practical design example of a complete shoaling process along a sloped shore with a Geotube structure at the shallow water, which develops a plunging breaker. The simulation well captures the critical event considering the sliding stability of the structure.

1. Introduction

So far, the most common way to mitigate waves, protect beaches and ports, or to control beach morphology changes by sand transport, is by constructing rubble mound breakwaters. Breakwaters cause partial reflection, diffraction, breaking and dissipation of waves, phenomena that form regions of affected waves (attenuated, concentrated, and reflected) near the breakwaters.
Developments of solutions other than emerged rubble mound coastal structures, over the recent decades, such as floating breakwaters [1,2], Bragg breakwaters [3], submerged reef balls [4,5], artificial mangrove root system [6], and living breakwaters [7], may present potential advantages in cost [1,8], hydrodynamics [9,10] and environmental features. These types of objects suggest more options to affect the waves to meet the design goals [1,10,11].
Geo-textile bags, filled with saturated sand, dredged from the seabed, termed Geotubes, present a relatively new method that aims to enrich traditional solutions in coastal engineering [12,13]. The woven geotextile container (tube) filters out water but keeps the sand grains inside. The principal construction procedure is laying the empty tubes on the seabed at the desirable location, securing the tubes with temporary anchors and lashing, and the high-pressure injecting of saturated sand, pumped from the seabed. After filling to the designed volume ratio, the stability of the laid Geotubes should be assured by gravity and friction. Geotextile tubes may serve, for instance, as groins, detached breakwaters, dune foot protection and submerged reefs.
Over the last twenty years, attempts to establish multifunctional submerged artificial surf reefs (ASRs) made of Geotubes have been made around the world, with the expectation that such solutions could incorporate coastal protection, surf amenities and beach safety [14,15,16]. Projects of ASR can be found, for example, in Narrowneck, Queensland, Australia [17,18]; Pratte’s Reef, El Segundo, California [14]; and Mount Maunganui Beach, New Zealand [19]. Unfortunately, in a comprehensive review provided by the “Raised Water Research” [20], it seems that most of the projects have failed. Common reasons for failure are related to too-small size Geotubes installed or the loss of effectiveness due to sand coverage [18,20]. These failures indicate the need for more applied research and design tools. Projects that utilize Geotubes as detached breakwaters may be found, for example, in Young-Jin beach on the east coast of Korea [21]; Yucatan in Mexico [22]; Al Aqah Beach Fujairah, UAE [8]; and Sigandu Beach, Indonesia [23]. In 2018, the first project of Geotubes structure was established in Israel, aimed at mitigating beach and cliff erosion along the Ashkelon shoreline [24].
Numerical simulations based on theoretical mathematical formulation are very useful in coastal engineering, for preliminary design, prior to physical model testing in wave flumes. A well-verified and practically accepted method for the assessment of the interaction of ocean waves with large bodies (typically, characteristic size above about 0.2 wavelength) is to solve the wave–body interaction mathematical formulation at a water level of constant depth, assuming incompressible and ideal (non-viscid) fluid and irrotational flow. When the wave steepness is low or moderate, the wave nature is termed weakly non-linear, and a perturbation process in the frequency domain is practical and valid. The nonlinear problem may be decomposed into a series of problems of increasing order in a small parameter, which is the wave steepness (the wave number times the wave amplitude). The first order is called the linear wave–body interaction problem, which is applicable for engineering in many practical cases. To represent irregular (real) sea, solutions for a series of monochromatic waves are summed to provide the results for an incident wave spectrum.
Fully nonlinear two-dimensional simulations of wave shoaling over sloped beaches, assuming potential flow and applying BEM, have been formulated over the years. Drimer and Agnon [25] developed an improved mathematical model for nonlinear shoaling over sloped beaches. A new compatibility condition, applied to the velocity of the free surface particles, enables the simulation of plunging breakers, up to the creation of a thin jet, without numerical smoothing. Grilli et al. [26] formulated as well a fully nonlinear two-dimensional BEM for the derivation of local properties (height, celerity, and asymmetry) and integral properties (radiation stress, and mean water level) of spilling breakers, formed over mild sloped beaches. Manolas and Riziotis [27] also introduced the effect of constant current in the tank. A finite differences solution for nonlinear waves was introduced by Xu [28], applying the immersed boundary method (IBM).
For design applications of submerged structures, the numerical wave flumes need to represent the structures and to evaluate the wave loads. Wave forces acting on submerged semi-circular bodies were studied by Yuan [29], using a hybrid numerical model based on the BEM and the finite difference method (FDM). In his work, Yuan compared the resulting numerical pressure over a semicircular breakwater with local pressure measurements in a physical model. Geng [30] developed a three-dimensional BEM for the evaluation of the loads acting on submerged horizontal plate, subjected to a solitary wave. Pinto and Neves [31] conducted a physical experiment for the measurement of wave loads over submerged trapezoidal breakwaters. Van Steeg and Vastenburg [32] derived an analysis of Geotubes sliding stability using theoretical methods together with physical experiments. More works on wave loads evaluation were conducted by applying volume of fluids (VOF) models, for instance, by Rahman and Womera [9] and by Jones et al. [33].
This research presents new and important practical findings regarding the applicability of the BEM for the design of submerged impermeable coastal structures, focusing on submerged Geotubes. In order to study and present our design-oriented practical findings, we develop and present an improved numerical model for a wave flume, applying the Lagrangian BEM. Although the Lagrangian BEM is a very efficient numerical method to simulate shoaling, it is considered limited for the assessment of coastal structures at shallow water, as it is not valid after breaking of the free surface, due to the assumption of a simply connected domain. VOF methods can track post breaking flows, but require considerably more numerical resources, which limit the extent of the computation domain. We show that the Lagrangian BEM is efficient and valid for the assessment of coastal structures at shallow water, much more than it may be concluded by previous publications. Section 2 presents all the methods that we apply in this study: the formulation of our Lagrangian BEM model (with a detailed mathematical and numerical formulation in Appendix A); the assessment of the geometry of a partially filled Geotube, which we apply in our model; and the open-source VOF system, OpenFOAM, which we apply for validation in the nonlinear range up to breaking. In Section 3, we present our results and discussion, starting with validation of the wave loads obtained by our model. By comparison with OpenFOAM simulations, we present that the BELWF predicts reasonable loads and sliding stability that are practical for design. We demonstrate that our model well captures the critical event considering the sliding stability of submerged impermeable structures, even if the structure breaks the waves. This is because the critical load takes place just before breaking. Then, we apply our model to simulate a practical design example of a complete shoaling process along a sloped shore with Geotube structure at the shallow water. The structure causes the development of a plunging breaker. Again, the simulation well captures the critical event considering the sliding stability of the structure. In Section 4, we present our conclusions.

2. Methods

2.1. The BEM for a Fully Nonlinear Wave Flume with Impermeable Structures

For the nonlinear two-dimensional simulation of the hydrodynamic effects by submerged impermeable coastal structures, we programmed a source code based on the mathematical model developed by Drimer and Agnon [25] and extended it to include cross sections of filled Geotubes and to obtain the pressure and forces applied to the structures. This model may include smooth impermeable structures of any geometry, laid on any profile of the seabed. We term this model BELWF—boundary elements Lagrangian wave flume.
Appendix A presents the mathematical and numerical formulation of the BELWF. An important feature of BELWF, relative to other Lagrangian formulations of BEM, is the formulation of two normal vectors at each nodal point (in the Lagrangian formulation, a nodal point represents a water particle): a normal to the linear boundary element before the point and a normal to the linear boundary element after the point. This improvement stabilizes the numerical scheme, enables the simulation of waves closer to breaking (relative to a single normal at each point, which smooths sharp corners that may exist before breaking), and is very important for the simulation of wave interaction with submerged structures in shallow water.

2.2. The Geometry of Filled Geotube Structures

Bezuijen and Vastenburg [34] present a practical method to approximate the geometry of a filled Geotube, laid on the seabed. When a geotextile tube is empty and lays flat on the locally flat seabed, its width is equal to half of its circumference. When it is completely filled (filling ratio FA = 1.0), it has a circular shape with a radius R = circumference/2π. The practical range of the filling ratio is between 0.60 and 0.85. At this range of filling, the underside of the cross-section is flat, each side approximates a quadrant of a circle, and the upper surface approximates a semi-ellipse. At the point of connection between the arc and the semi-ellipse the curvature is continuous.
Based on this method, we programmed a pre-processor, which generates the nodes and elements of a specified Geotube, for the BELWF. Figure 1 presents the shapes of partially filled Geotube, in all the practical range of filling: 0.60, 0.65, 0.70, 0.75, 0.80, and 0.85.
To represent several adjacent Geotube structures, forming a wider submerged breakwater, it is practical to add in the middle a horizontal section.

2.3. The OpenFOAM Model for Validation

For the validation of the BELWF, we apply the widely used open-source software OpenFOAM [35]. OpenFOAM applies the VOF method [36]. Figure 2 presents the grid, generated out of 207,777 cells, modeling a short wave-flume of length 45 m and height 7 m. This mesh demonstrates an important benefit of the BEM, which reduces the spatial dimension of the model by one. Whereas the VOF method for two-dimensional problems requires the mesh of the solution area into a grid of area elements, the BEM integral equation requires only the mesh of the boundary contour of the solution area into one-dimensional line elements. This is considerably simpler and computationally efficient. Modeling the same geometry in BELWF requires fewer than 1000 boundary elements. However, the VOF method is made to track the foamy free surface for breaking waves, as Figure 3 demonstrates.
In this example, the water depth is 5 m, and the space above the still waterline is initially air, which will be occupied by water during the process. Denser cells are applied around the free surface zone and near the Geotube. To generate the specified waves, we implemented a wave-maker flap that generates second order Stokes waves. Whereas the BELWF assumes an ideal fluid and a potential flow, in OpenFOAM a turbulence module considers the formation of eddies.
Figure 3 shows an example by OpenFOAM of the flume profile, for a wave of height 1 m propagating over the Geotube.

2.4. Sliding Index

A critical load effect for design is the stability of the structure to keep its position. We assess the stability limit by deriving the minimum friction coefficient, between the seabed-and the Geotube, which is required to prevent sliding. Figure 4 schematically presents the loads acting on the Geotube.
The vertical loads are the gravity (dry weight)   F g , the buoyancy   F b , and the vertical component of the wave load   F z , where the resultant vertical force is equals to the opposing normal reaction by the seabed N, see Equation (1). The horizontal loads are the horizontal component of the wave load   F y and the reacted friction   F μ , which is a multiplication of N by the friction coefficient; see Equation (2). By evaluating the forces during a complete wave period, we obtain by Equation (3) the sliding index, SI, which is the critical (minimum) friction coefficient, μ m i n , needed to prevent sliding of the Geotube:
N = F g F b F z
F μ = N ·   μ m i n = F y
S I = μ m i n = F y F g F b F z
For the presented analysis, the weight calculation of the Geotube assumes a density of wet saturated sand of 2082 kg/m^3 [37].

3. Results and Discussion

3.1. Verification of Wave Loads

The most important verification for design is that of the wave loads applied to the structure. Here, we present the results of horizontal and vertical wave loads for a Geotube structure of typical parameters for coastal protection by a submerged structure, which breaks high wave while transmitting low waves. In our example, a structure of a total width of 12 m is composed of two Geotubes. Each Geotube has a filled (100%) radius of 3.425 m and is filled to 80% (filling ratio FA = 0.8). This filling ratio results in a Geotube height of 3.8 m. The structure is placed on a horizontal seabed at water depth 5 m, so the freeboard is 1.2 m. The incident wave period T is 7 s, and the wave heights are increased from 0.3 m to 1.6 m. For the selected period and water depth, without structures, waves of height lower than 0.5 m are classified as linear airy waves, whereas the higher waves are in the applicability region of the second-order Stokes wave theory. However, the low freeboard of 1.2 m over the structure strengthens the non-linearity in all the simulated cases.
To validate the results obtained by the BELWF model, we compare the loads applied to the Geotubes structure with results that we obtained by applying the OpenFOAM fully nonlinear two-phase turbulence model.
Table 1 summarizes the numerical parameters for the validation simulations. Note that in the BELWF, the sizes of the free surface elements are changed during the simulations, as the Lagrangian formulation follows the water particles.
We set for the verification a short-wave flume to obtain a reasonable running time by OpenFOAM. To obtain the critical load effects, the loads are calculated during a complete wave period. For both models, the wave heights facing the Geotube are measured at the same reference point, located at 13.6 m before the Geotube (which is the distance between the Geotube and the wave generator in the OpenFOAM model).
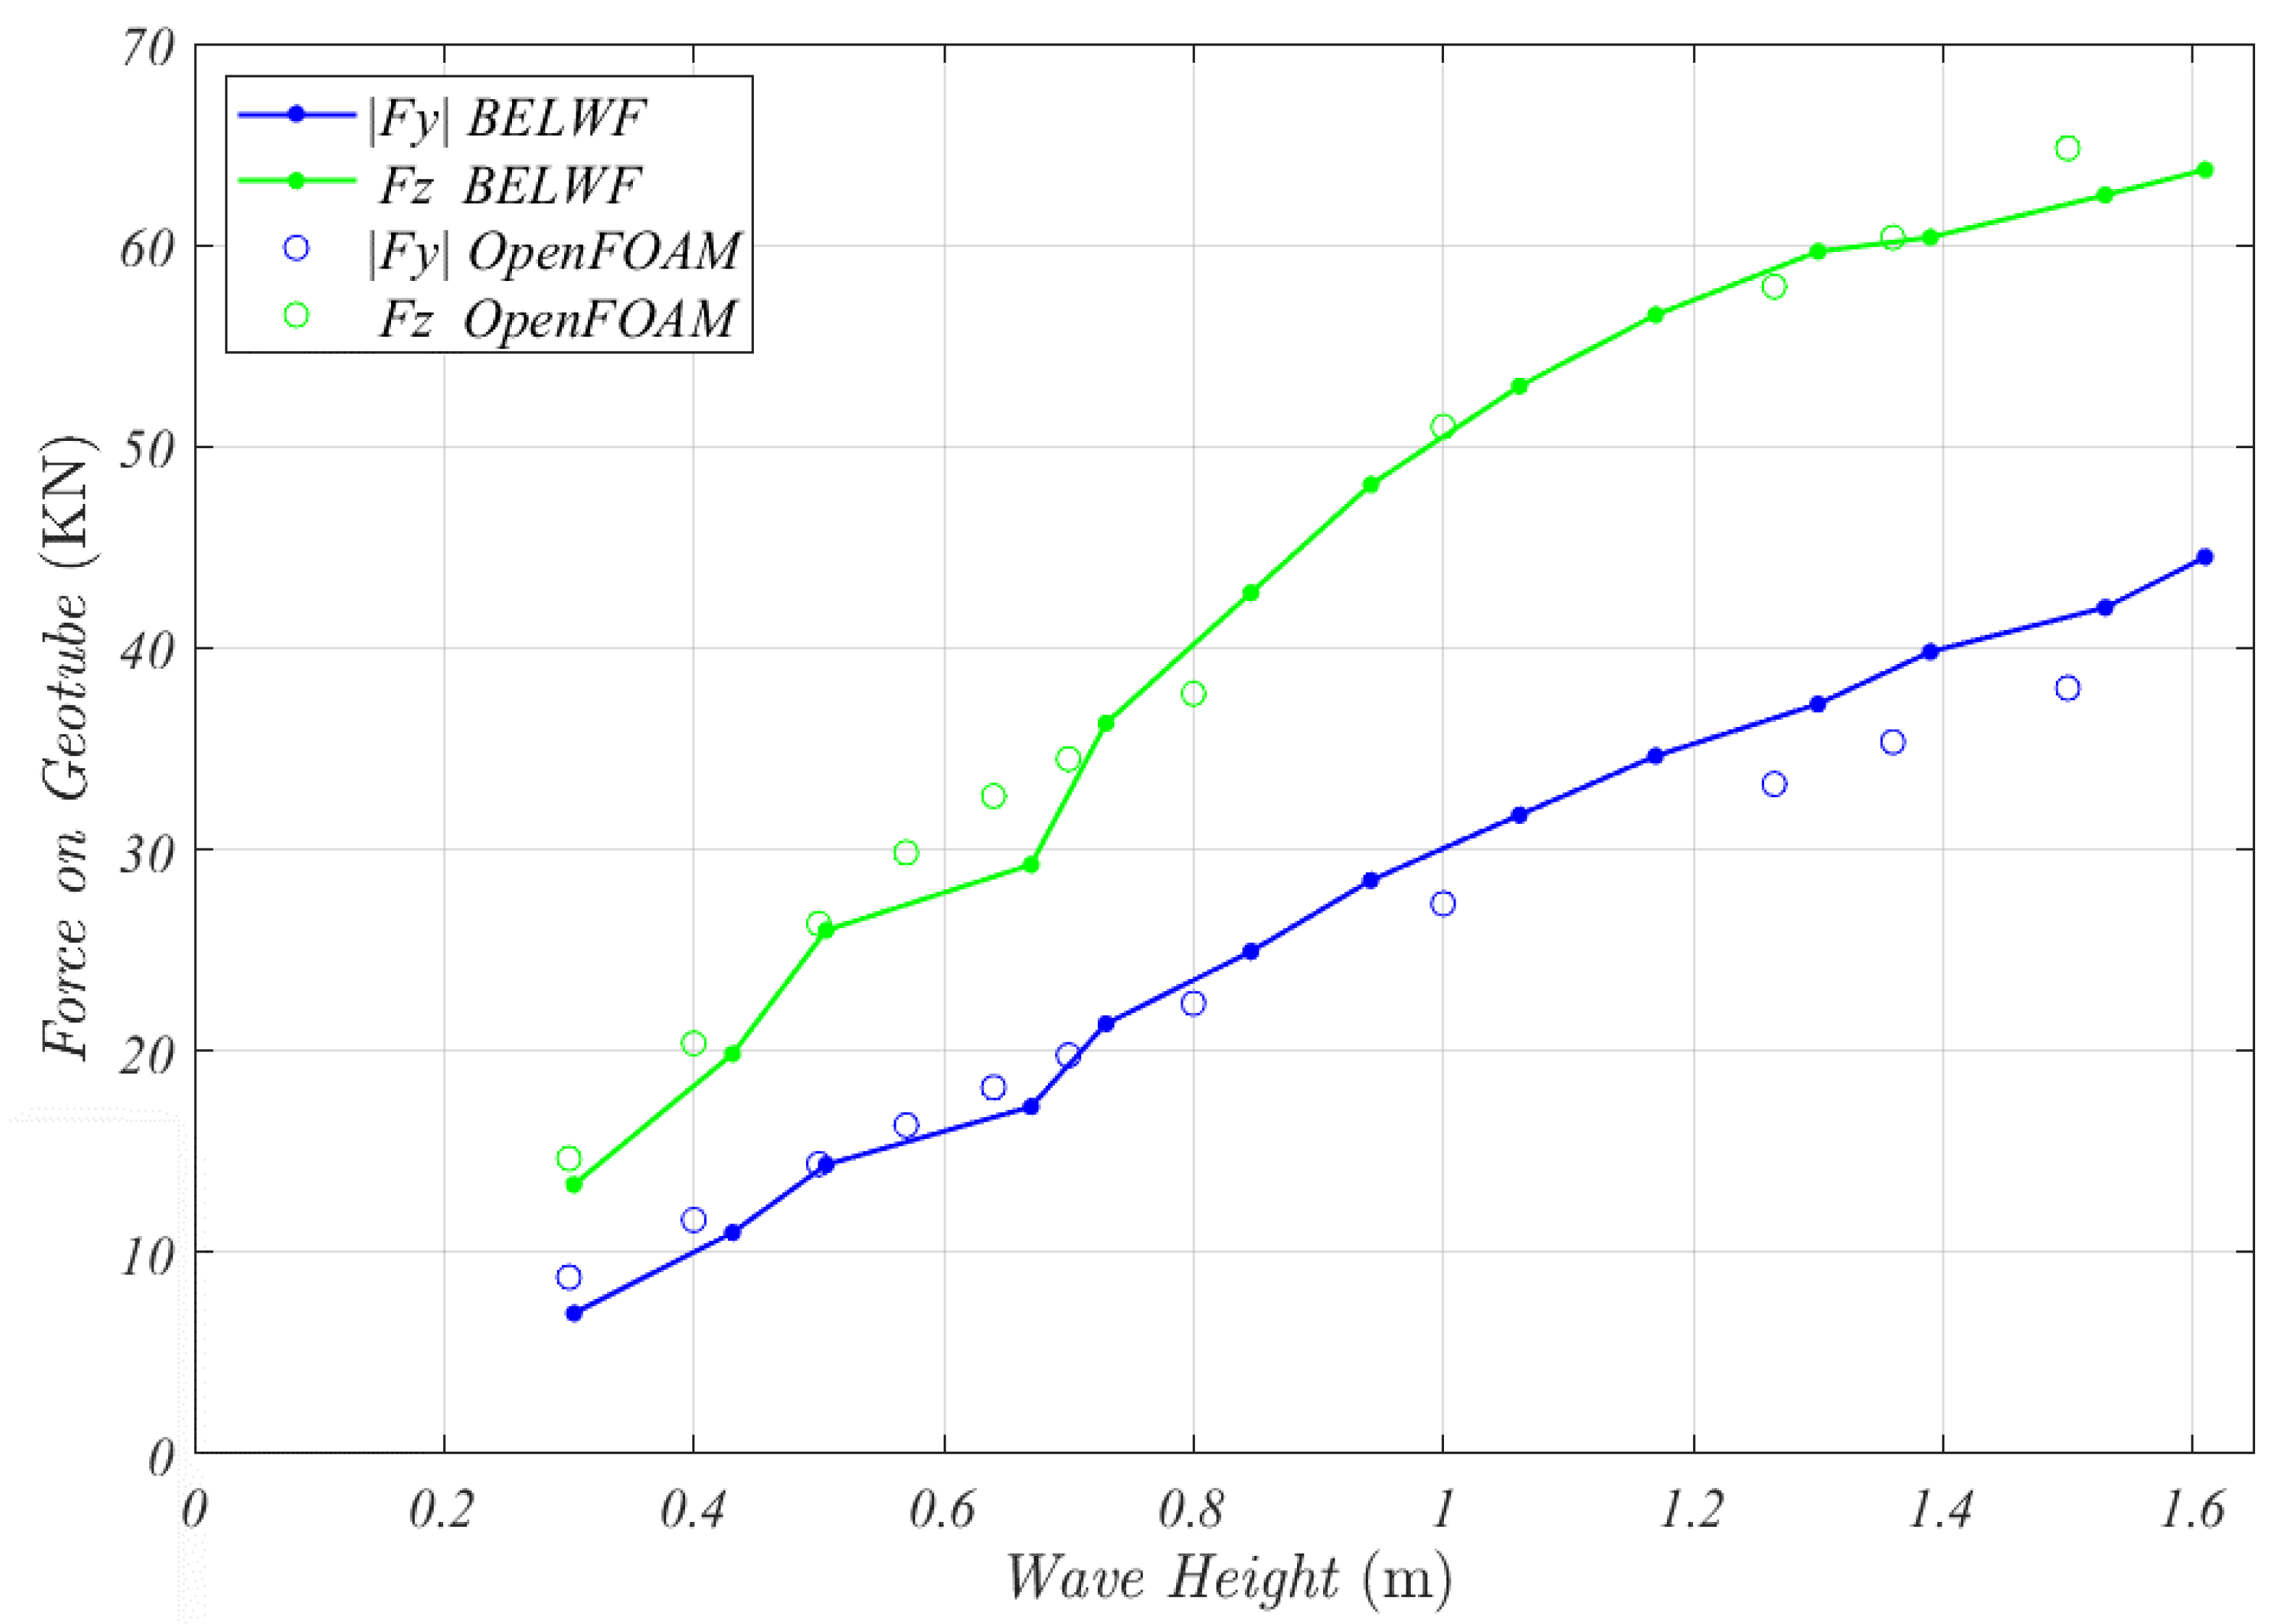
Figure 5 presents the wave loads applied to the Geotube, by OpenFOAM and by BELWF, versus the incident wave heights. For both models, we present the maximum absolute value of the horizontal load and the maximum lifting vertical load, which are most critical for the sliding stability of the structure.
The wave heights in BELWF and OpenFOAM are not exactly the same, as in BELWF we input to the model the paddle amplitude and not the wave height (In OpenFOAM we do input wave height). However, the graphical presentation of the results is proper for different wave heights.
We obtain a good agreement for the maximum uplifting vertical loads. For the high waves, the BELWF predicts about 10% higher horizontal loads.
Figure 6 compares the critical SI for all the wave heights. For the lower waves, the agreement is good, while from the wave height 0.8 m to 1.5 m, the BELWF predicts 5% to 15% higher SI, respectively.
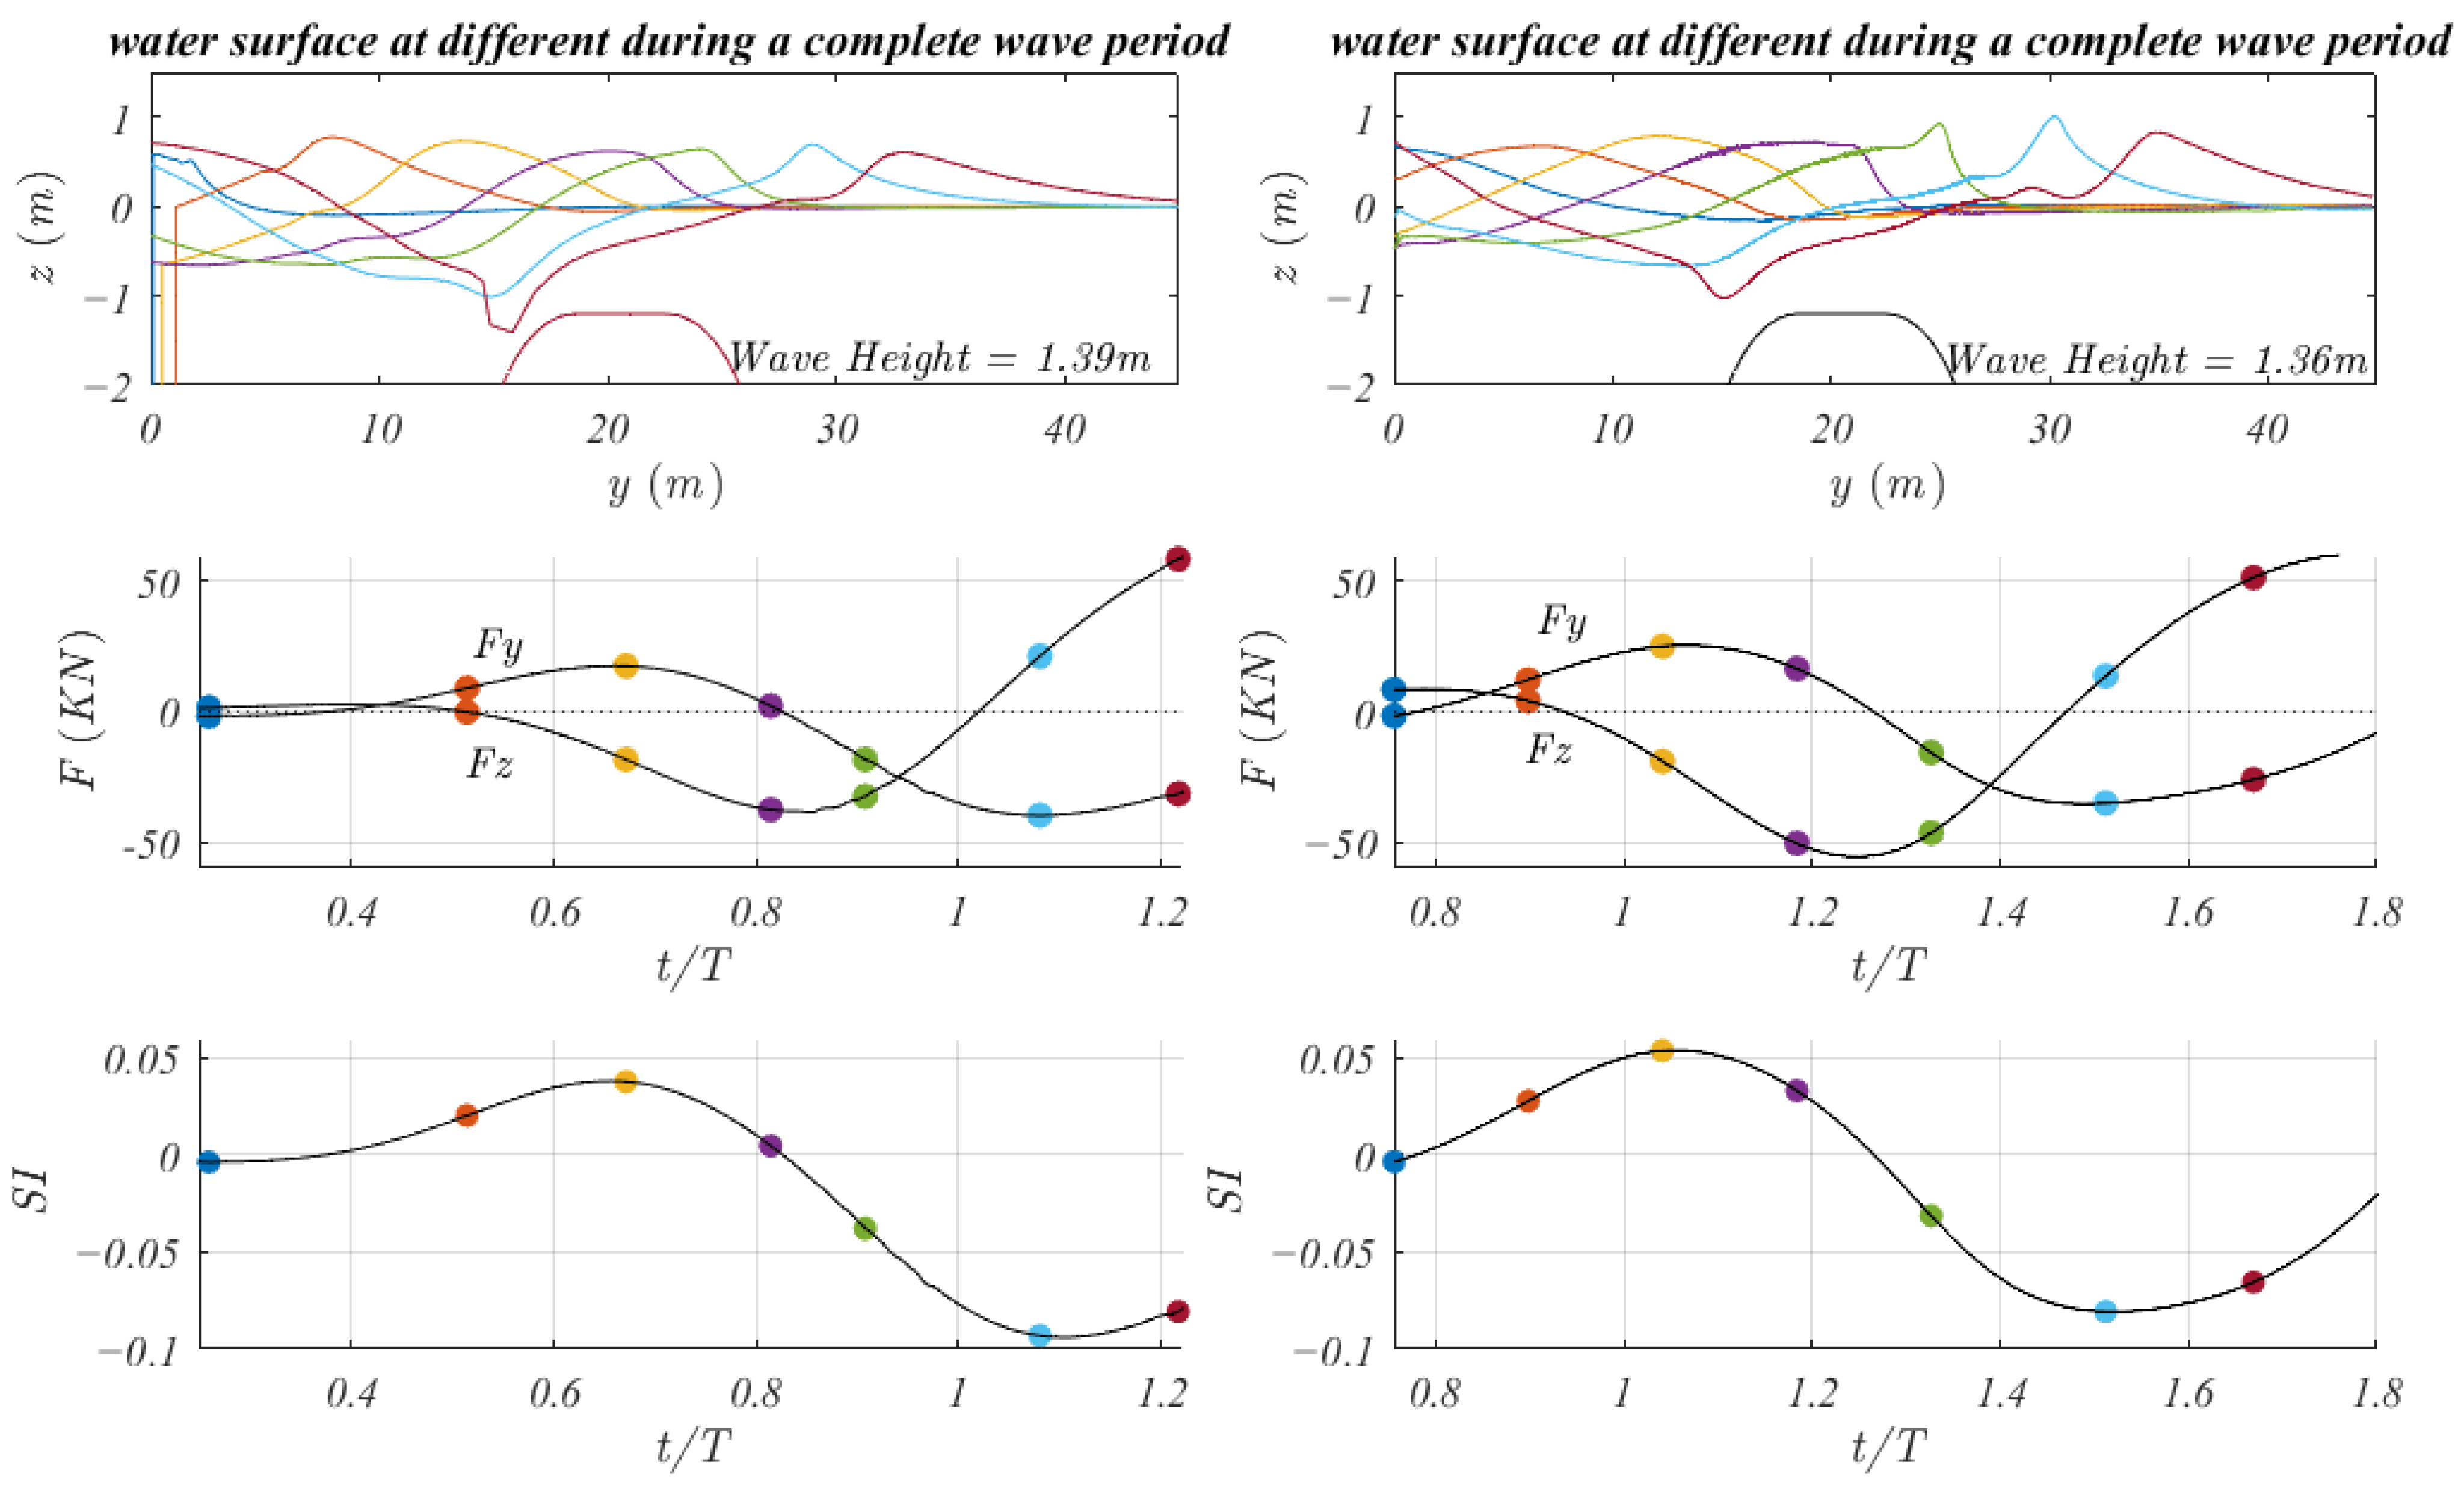
Figure 7, Figure 8 and Figure 9 present the details of evaluation of the SI for wave heights 1.3 m, 1.4 m and 1.5 m, respectively. For each wave height, we present the horizontal and vertical wave loads and the SI versus time during a complete wave period. We also present the water surface at different wave phases, which are associated with the loads by different colors. We can see that the nature of the water surface elevations is similar in both models. In all the three cases and in both models, the critical state regarding sliding is obtained when a deep wave trough takes place near the Geotube. A negative (to the up-wave direction) horizontal load occurs simultaneously with a positive (uplift) vertical load. The negative SI indicates that if the actual friction coefficient is below the absolute value of this negative SI, the structure will fail by suction toward the incoming waves. This is a common mode of failure of breakwaters. In these cases, the BELWF predicts that the minimum required friction coefficient between the structure and the seabed is about 15% higher, relative to the OpenFOAM results, which means that the BELWF may be considered safe and conservative for preliminary design.
The following section presents the application of the BELWF to simulate a practical design example of a complete shoaling process along a sloped shore with Geotube structure at shallow water, which develops a plunging breaker. In view of the number of elements and the associated running times in Table 1 for a very short wave flume, where the wave generator is close to the structure, studying such a nature as that of long shoaling processes with structures at shallow water is much more practical with our BELWF model, relative to VOF models.

3.2. A Practical Design Example

For the verification by comparison with OpenFOAM, we modeled a short flume, where the Geotube is close to the wave generator, with similar geometry and input wave for both models. With BELWF, we can easily run a long wave flume, with a beach profile that fits the site so as to better represent the natural shoaling process and to load the structure with a more natural breaker. In the following example, we present a practical design case, where we simulate the shoaling and interaction with a Geotube structure, and assess the wave loads and the SI.
In this example, the wave period is 9 s and the generated wave height is 2.2 m. The waves shoal from an intermediate water depth of 16 m, over a slope of 1:40, to shallow water of depth 4 m, where the Geotube of width 11 m and height 2.2 m (freeboard 1.8 m) is placed. At the end of slope, where the horizontal shallow seabed of depth 4 m starts, the generated wave of height 2.2 m shoals to a height of 2.86 m and loads the Geotube. The related Iribarren number is 0.17, which is in the range of the spilling breaker; however, the Geotube steepens the wave and causes a plunging breaker. The complete flume contains 1160 nodes, and the run time on C3 (see Table 1) is about 40 h. Our goal is to present an ability to simulate a practical design, and to obtain the critical loading case. Figure 10 presents the complete flume layout at an instance of a developed plunging breaker.
The Geotube lays on natural ground, and it cannot be assured that the water pressure will not act on the bottom of the structure. Hence, it is safer to assume that the dynamic pressure penetrates between the seabed and the bottom of the structure, and in the critical situation contributes to the uplifting of the Geotube. To consider this uplift load, we subtract from Equation (3) also the approximated force acting on the contact region of the Geotube with the seabed ( F c ):
F c = L c o n t a c t ·   ( P U W + P D W ) 2
S I c = μ m i n = F y F g F b F z F c
Here, P U W and P D W are the values of the dynamic pressure at the up-wave and the down-wave contact points of the Geotube and the seabed, and L c o n t a c t is the length of the contact region between the Geotube and the seabed.
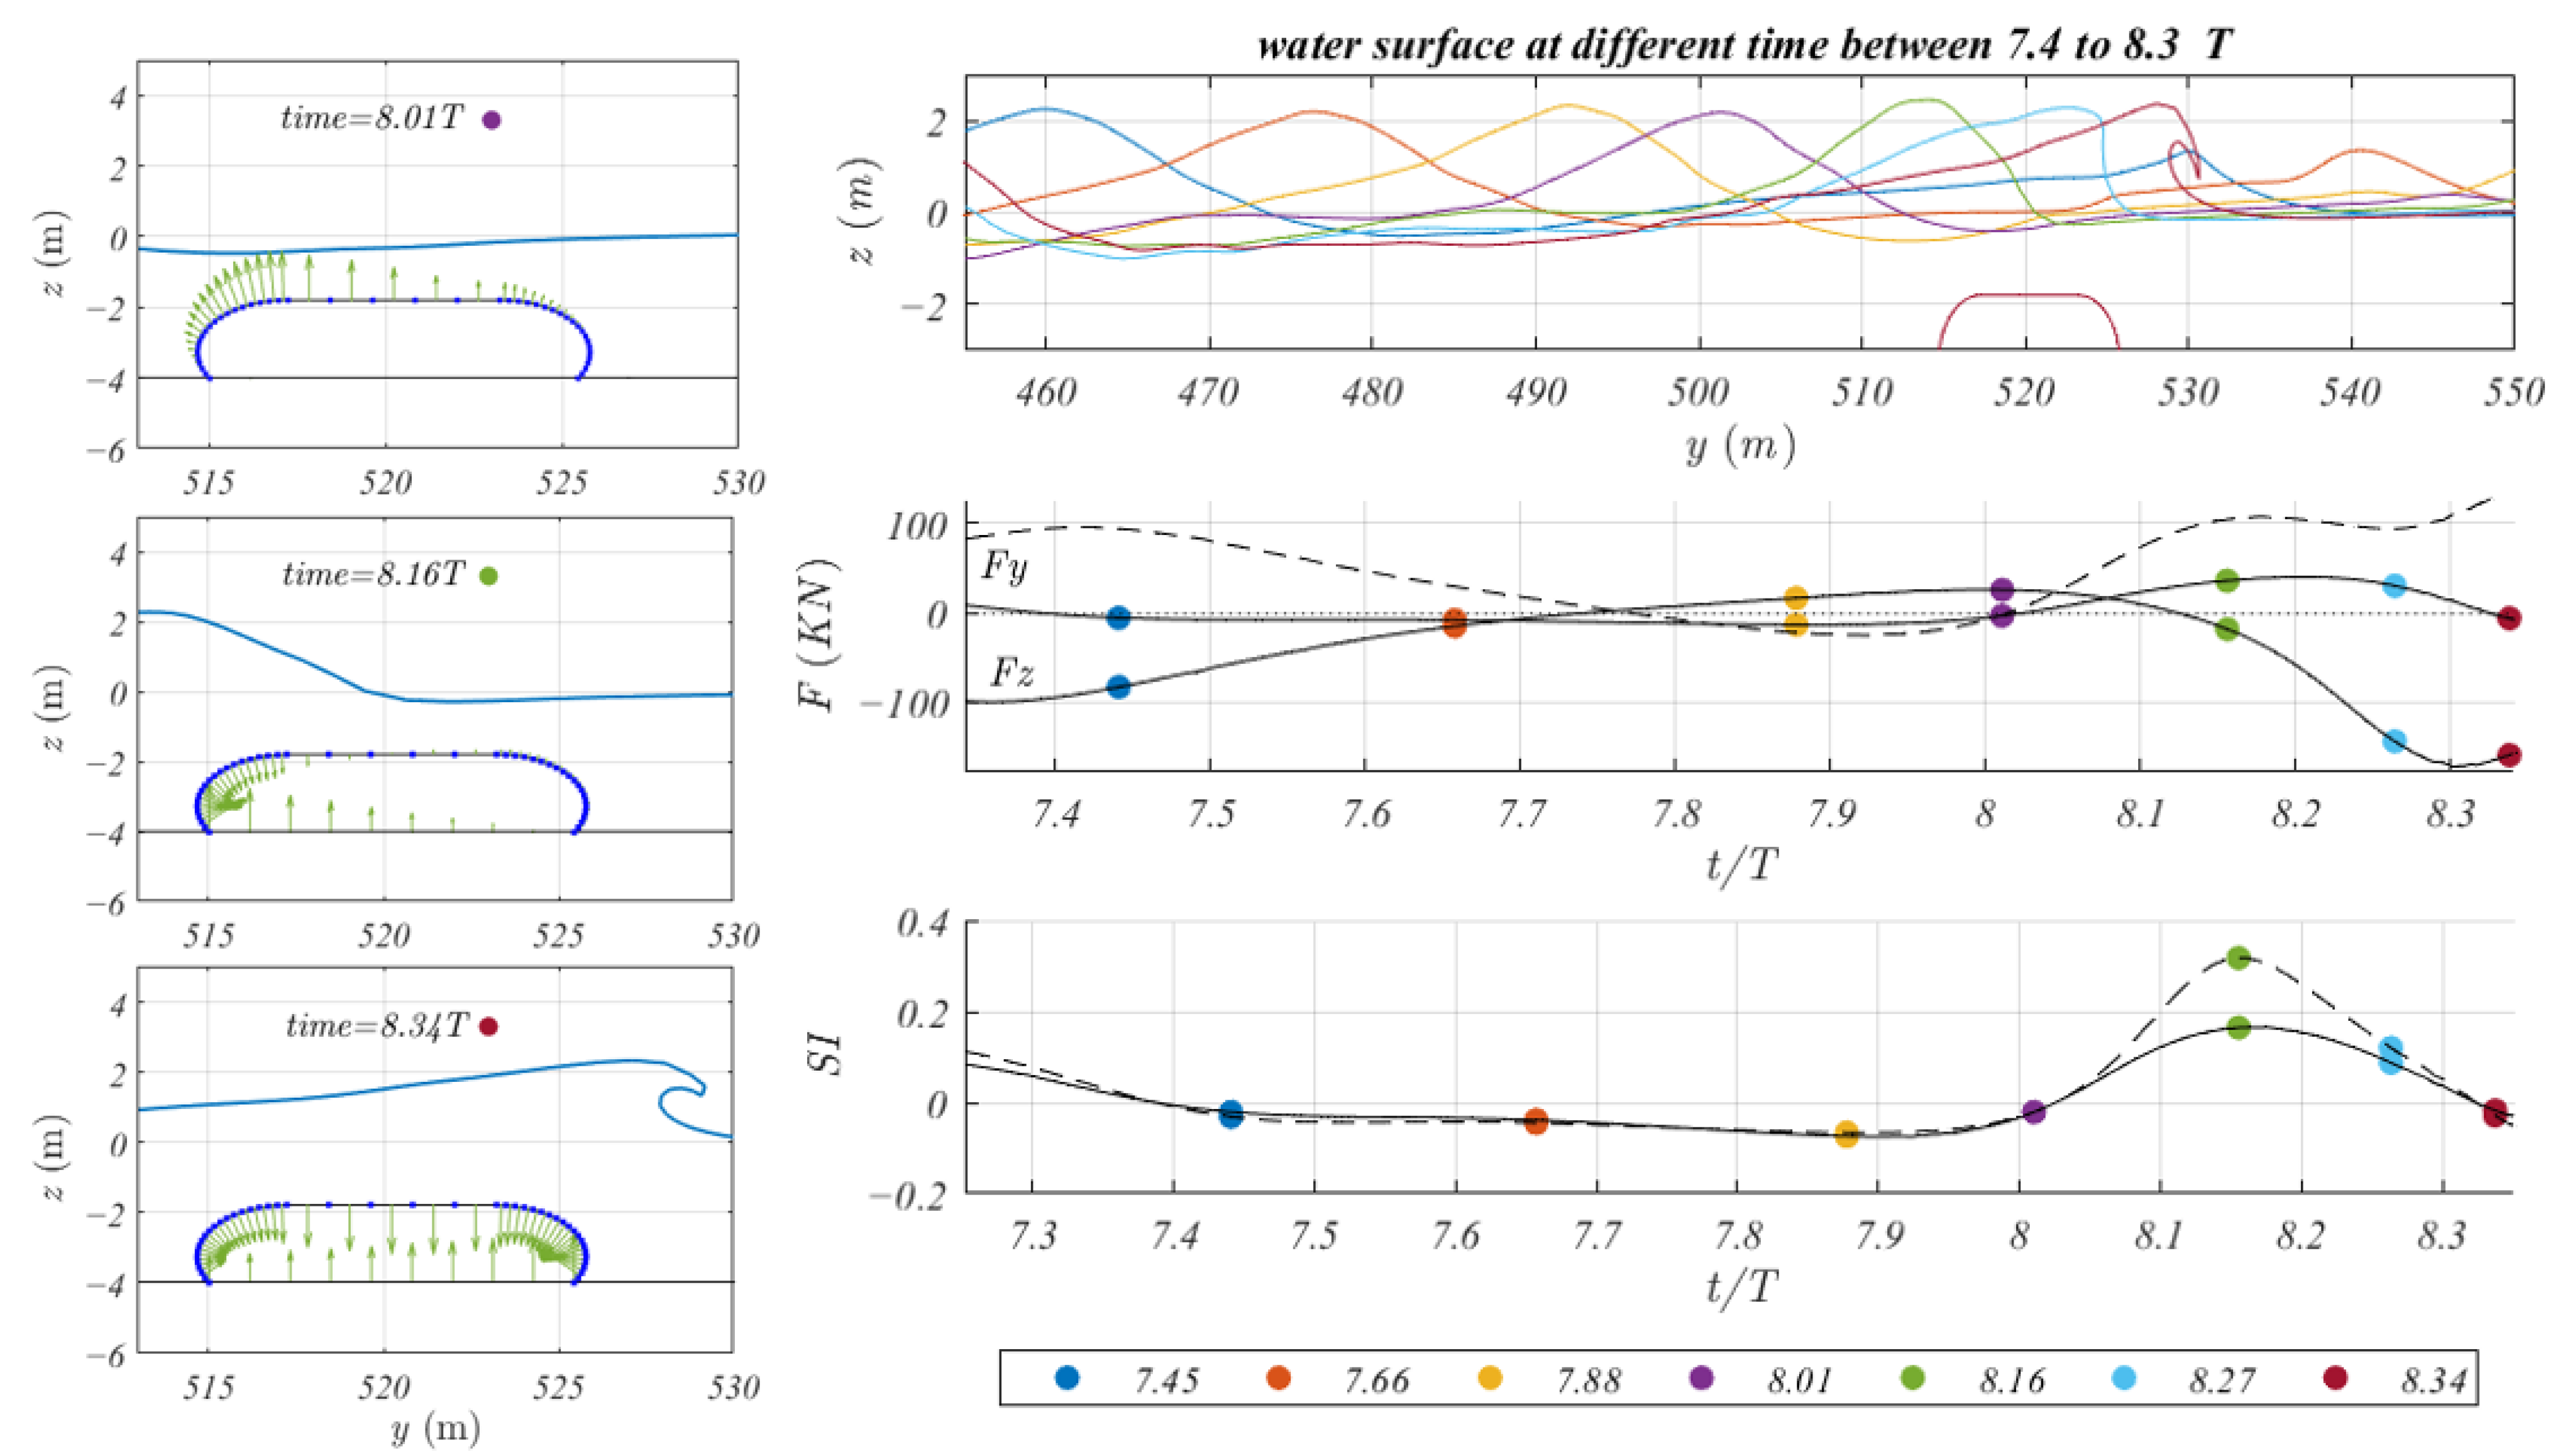
Figure 11 presents the free surface elevations, the horizontal and vertical wave loads and the SI (at the right), as well as diagrams of the hydrodynamic pressure acting on the Geotube at representative times (at the left). The dashed black lines show the modified vertical load and the associated SIc, which assumes the induction of the hydrodynamic pressure along the contact line between the Geotube and the seabed.
The results imply that the critical SI, or SIc, is obtained just before the wave breaks (the green water surface elevation, which corresponds to the green dots on the diagrams of forces and SI). This inspection makes it practical to assess the sliding stability of the structure by Lagrangian BEM and specifically our model BELWF. As there is no guarantee that the dynamic pressure does act on the Geotube’s bottom, the extreme value, between the two values of the SI, the solid line, by Equation (3), and the dashed line, SIc, by Equation (5), should be taken into account. A negative S, or SIc, means a friction coefficient, which is needed to prevent sliding, in the up-wave direction ( y ).

4. Conclusions

We formulated and presented an effective simulation model of a fully nonlinear two-dimensional wave flume for the investigation of submerged impermeable structures. Our model implements the boundary element method with Lagrangian formulation and we name it BELWF—boundary elements Lagrangian wave flume.
We showed, by comparison with the simulation system OpenFOAM, which applies the VOF method and provides post-breaking capabilities, that our model is valid for the assessment of the nature of breaking, the wave loads and the sliding stability at the preliminary design stage of impermeable coastal structures. Although the Lagrangian formulation is not valid in post-breaking flows, where the domain is no longer simply connected, we showed that, typically, the most critical state regarding the stability of a Geotubes structure occurs just before breaking, so the Lagrangian BEM is a valid and efficient method for preliminary design.
Following a set of simulations for the validation of BELWF, we presented a practical design example, simulating a complete shoaling process along a sloped shore with a submerged Geotube structure. The example shows that the BELWF enables fast and stable simulation for a long wave flume, with or without submerged impermeable costal structure, up to a developed plunging breaker, after the critical instance for the sliding stability of the structure. We suggest that it is efficient and practical to apply the BELWF to assess the effect of the design parameters over a wide range before testing the preferred cases in a physical wave flume.

Author Contributions

Conceptualization, N.D. and D.B.; methodology, N.D. and D.B.; software, N.D. and D.B.; validation, D.B. and N.D.; formal analysis, D.B. and N.D.; investigation, D.B.; resources, N.D.; data curation, D.B.; writing—original draft preparation, D.B. and N.D.; writing—review and editing, D.B. and N.D.; visualization, D.B. and N.D.; supervision, N.D.; project administration, N.D.; funding acquisition, N.D. All authors have read and agreed to the published version of the manuscript.

Funding

This research was funded by The Israel Ports Development & Assets Company Ltd. grant number 2031167.

Institutional Review Board Statement

Not applicable.

Informed Consent Statement

Not applicable.

Data Availability Statement

Data sharing not applicable.

Conflicts of Interest

The authors declare no conflict of interest.

Appendix A

Nonlinear Numerical Wave Flume Mathematical and Numerical Formulation
This appendix presents the mathematical formulation and the numerical method of solution implemented in BELWF—boundary elements Lagrangian wave flume.
For the nonlinear two-dimensional simulation of the hydrodynamic interaction of waves with submerged Geotubes, we programmed a source code, based on the model developed by Drimer [25] and extended it to represent sand-filled Geotubes.
The important improvement, relative to other BEM methods, is the formulation of two normal vectors at each nodal point (which represent a water particle in the Lagrangian formulation), a normal to the linear boundary element before the point and a normal to the element after the point. This improvement enables the simulation of waves closer to breaking, relative to previous formulations, including plunging breakers up to the creation of a thin jet, without the use of numerical smoothing. This improvement is very important for the assessment of submerged structures in shallow water.
The fully nonlinear boundary element method (BEM) applies a Rankine source Green’s function. The model can simulate phenomena, such as the steepening of waves due to shoaling, evolution of standing waves in a basin and simulation of wave propagation in a numerical wave channel. The model can solve wave propagation in the presence of structures as long as the domain remains simply connected.
Mathematical Formulation
For irrotational and incompressible 2D flow, a velocity potential function Φ y , z , t exists, as defined by
V _ = Φ  
where V _ is the vector of a particle’s velocity.
As Figure A1 presents, the solution domain   , is bounded by the free surface boundary and solid boundaries. The solid boundaries may be fixed or moving (such as a wave maker), physical (such as the seabed, or the structure) or artificial (such as the damping region that minimizes reflections).
Figure A1. Definitions sketch of the flow domain.
Jmse 11 00236 g0a1
The velocity potential function Φ satisfies the conservation of mass:
2 Φ = 0 ,       i n       Ω  
To enable the solution of a very steep water surface, we apply a Lagrangian formulation of the free surface, which follows the water particles. The free surface particles satisfy the kinematic boundary condition:
D x _ D t = Φ ,     o n   Γ f  
where x _ is the location vector (y, z) of the free surface particles, and Γ f is the contour of the free surface, as shown in Figure A1, and
D D t = t + V _ ·
is the material derivative.
The kinematic boundary condition states that the free surface is a material surface, meaning that particles do not splash out to the atmosphere or into the water domain, which is correct up to breaking.
The dynamic boundary condition at the free surface is
D Φ D t = 1 2 Φ · Φ P 0 ρ g z + a _ · x _ ,       o n   Γ f  
where P 0 is the surface pressure, assumed to be P 0 = 0 (meaning that the atmospheric pressure is the reference pressure), g is the gravity acceleration and a _ is an additional acceleration field, if it exists (for example, to simulate sloshing problems).
The dynamic boundary condition is the Lagrange form of the Bernoulli equation, which is obtained by a spatial integration of the Euler equation (conservation of momentum for an ideal fluid).
At rigid boundaries, the flow satisfies a non-penetration boundary condition:
Φ ·   n _ = V s _ ·   n _ ,       o n   Γ s  
where n _ is a unit vector (normal) perpendicular to Γ s , positive out of Ω , V s _ is the local velocity vector of the rigid boundary and Γ s is the rigid boundary.
In case that the free surface and the rigid boundaries do not completely bound the domain, Ω , artificial boundaries should be implemented, such as the following:
(a)
Spatial periodic boundary condition (at two vertical boundaries):
Φ 0 ,   z = Φ λ ,   z  
Φ   ·   n 0 , z = Φ   ·   n λ , z  
where λ is the wavelength.
(b)
Linear radiation condition:
t c ·   n _ Φ = 0  
where c is the phase velocity of the wave, ± the direction of wave propagation along the y axis. This condition guarantees no reflection of a periodic wave, which propagates with c celerity. Since nonlinear waves in general do not propagate in such a phase celerity c , there will be some partial nonphysical reflection from the wall boundary.
(c)
Artificial damping region:
To minimize reflection of waves from the wall at the end of the tunnel, we can add an artificial damping mechanism to the free surface dynamic condition, over an extension of the region of interest. This region might be referred to as an energy absorption region. This mechanism does not require prior knowledge of the wave property, and is applied by subtracting a damping term ν Φ from the right-hand side of the dynamic boundary condition:
D Φ D t = 1 2 Φ · Φ g z + a _ · x _ ν Φ ,       o n   Γ d  
where Γ d is an artificial extent of Γ f , and ν is a positive damping coefficient, slowly increasing along the damping region, such that it minimizes reflections.
Numerical formulation
We apply the numerical boundary elements method (BEM) for the evaluation of the velocity potential function Φ . By to the direct formulation, a boundary integral Equation (A11) replaces the Laplace Equation (A2) by the application of Green’s theorem to Φ and a simple Rankine source, over the contour Γ enclosing the flow domain :
α Φ ξ ,   t = Φ x _ ,   t n l n   r l n r n Φ x _ ,   t d Γ      
where α =   2 π   ξ   i n   ° Γ   ξ   o n   Γ     ° Γ is the inner angle of the contour Γ ( π if smooth) and r is the distance between x and ξ .
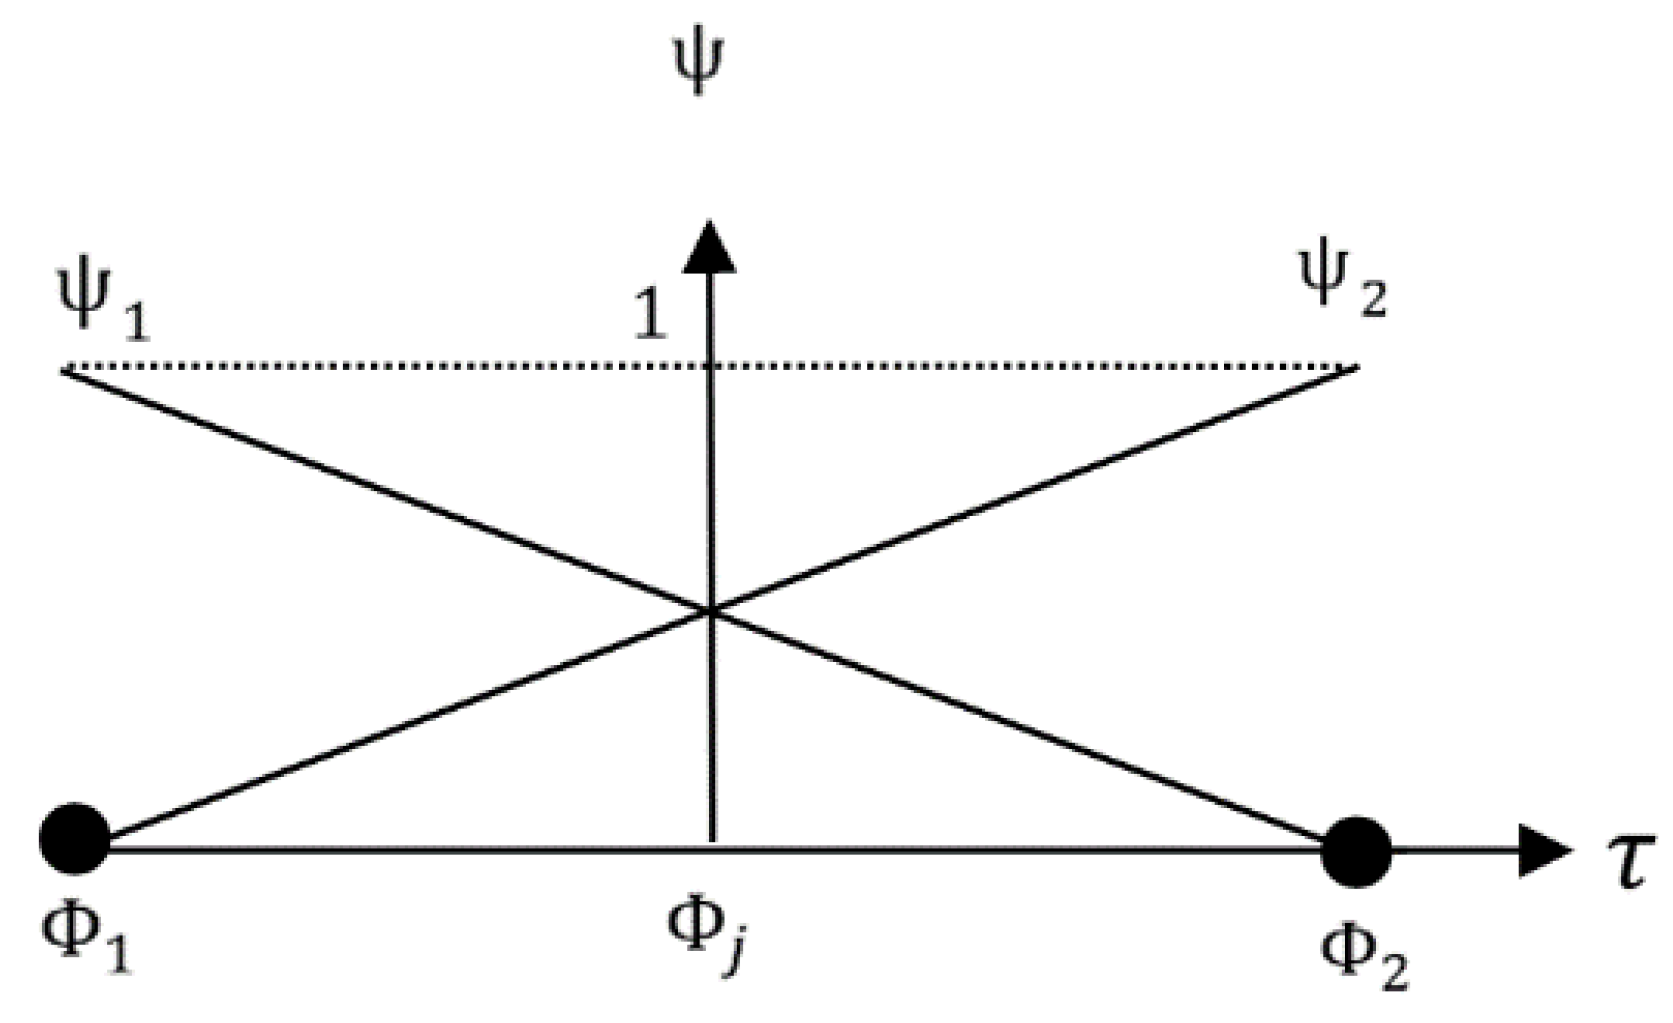
The next step is the discretization of the boundary Γ to finite elements. Along each element, we approximate the unknown functions Φ ,  Φ n by the sum of the element nodal values multiplied by interpolation functions ψ 1 , ψ 2 (see Figure A2):
Φ = Φ 1 ψ 1 + φ 2 ψ 2  
Φ n = Φ n 1 ψ 1 + Φ n 2 ψ 2  
x _ = x _ 1 ψ 1 + x _ 2 ψ 2  
where the local nodes 1 and 2 of element j are the global nodes   j ,   j + 1 , respectively, and ψ 1 ,   ψ 2 are linear interpolation functions in the element region:
ψ 1 = 1 2 1 τ   ,       ψ 2 = 1 2 1 + τ , 1 τ 1  
Figure A2. Local element interpolation functions.
Jmse 11 00236 g0a2
The arc length d Γ is expressed as a function of d τ :
d Γ = y 1 d ψ 1 d τ + y 2 d ψ 2 d τ 2 + z 1 d ψ 1 d τ + z 2 d ψ 2 d τ 2 d τ = 1 2 y 2 y 1 2 + 1 2 z 2 z 1 2 d τ  
d Γ = 1 2 Δ S d τ  
Substituting the boundary integral Equation (A11) with the approximated sum of integrals of the interpolation functions ψ 1 and ψ 2 Equation (A15) over the boundary elements, where the unknown values Φ , Φ n are left out of the integrals, results in
j = 1 N A i j ϕ j B i j Φ n j B i j + Φ n j + = 0 ,           i = 1 , 2 , N  
where
A i j = 1 2 Δ S j 1 e j 1 ψ 2 n ln r τ   + 1 2 Δ S j e j 1 ψ 1 n ln r τ δ i j α j  
B i j = 1 2 Δ S j 1 e j 1 ψ 2 ln r τ  
B i j + = 1 2 Δ S j e j ψ 1 ln r τ  
Φ n j is the normal velocity of the particle at the j th node, r is the distance between node i and the integration point along the element and e j below the integration symbol indicates integration along the j th element.
Satisfying Equation (A18) for each of the N boundary nodes results in a set of N equations with 3 N unknowns.
The integrals in the terms A i j ,   B i j ± are calculated numerically by the Gauss–Legendre integration method.
When the source point is located on one of the nodes of the element on which the integration is held ( i = j ), these terms contain singularity when r equals zero. An advantage of using linear interpolation functions is the possibility to analytically integrate the expressions at these singular elements.
In A i i , r is measured along a line element. The change of r across the perpendicular direction to the element is zero and so the change of ln r in this direction is   n ln r = 0 . So, the terms of the diagonal of the matrix A by (A19) are
A i i = α i  
For the calculation of B i i ± , assuming the line element is horizontal (it does not affect the generality), and applying the interpolation functions, we obtain
B i i = 1 2 Δ S i = 1 1 1 1 2 τ + 1 1 2 ln y i 1 1 2 1 τ + y i 1 2 1 + τ y i 2 d τ  
  B i i = 3 2 + l n   Δ S i 1 1 2 Δ S i 1  
In a similar way,
B i i + = 3 2 + l n   Δ S i 1 1 2 Δ S i  
As shown in Figure A3, the discrete linear elements have normal vectors pointing out of the domain. With the linear interpolation functions, these normals are not continuous between the elements. Hence, we define two normals at each point:
Φ n j = Φ · n _ j 1         a t       x _ = x _ j  
Φ n j + = Φ · n _ j         a t       x _ = x _ j  
n _ j = 1 Δ S j z j + 1 z j , y j y j + 1  
where j stands for the j th element for n _ j ,   Δ S j as well as for j th node for Φ n j ,   Φ j and x _ j .
Figure A3. The boundary elements model scheme.
Jmse 11 00236 g0a3
In previous formulations, the coefficients B i j and B i j + (Equation (A18)) were united to a single coefficient B i j , which multiplies the single normal velocity Φ n j , i.e., equality of term Φ n j + and Φ n j was assumed. This assumption caused numerical instability of steep waves when sharp angles between the normal of the elements evolved.
Our distinguishing formulation applies a compatibility condition. A tangential derivative of any function f following a free surface particle may be computed by a finite difference central derivative:
f s = f j + 1 f j 1 D S j  
where D S j = y i + 1 y i 1 2 + z i + 1 z i 1 2 .
The slope of the tangential velocity of the j th particle is calculated as the slope of the dashed line connects between element j + 1 to element j 1 , see dashed line in Figure A3:
y z = y j + 1 y j 1 z j + 1 z j 1  
So, the true normal velocity of j th particle is the velocity component, which is perpendicular to the tangent defined by Equation (A30). Hence, the real normal of the jth particle is
n _ j = 1 D S j z j + 1 z j 1 , y j 1 y j + 1  
Since the velocity vector of any particle is unique, the following compatibility conditions should be satisfied:
Φ n j = c o s β j Φ n j s i n β j Φ s j
Φ n j + = c o s β j + Φ n j + s i n β j + Φ s j  
where β j is the angle between the normals n _ j and n _ j as shown in Figure A3.
Φ s j = Φ j + 1 Φ j 1 D S j  
is the tangential velocity of each element.
Notice that when α j = π (meaning the boundary is smooth), the compatibility condition is reduced to
Φ n j = Φ n j + = Φ n j  
At corners, between water surface and solid boundaries, two boundary conditions are satisfied, and so the compatibility condition is not required.
Substituting the compatibility conditions for the internal free surface particles in (A11) results in
j = 1 N A i j Φ j j = Γ j = Γ a s B i j + B i j + Φ n j j   c o r n e r s B i j Φ n j + B i j + Φ n j j   Γ B i j n Φ n j + B i j s Φ n j = 0 ,   i = 1 , 2 , N  
where
  B i j n = B i j c o s β j + B i j + c o s β j +
  B i j s = B i j s i n β j + B i j s i n β j +
After applying the compatibility condition, we are left with N equations and 2 N unknowns. As Φ j or Φ n j is given at each node by the boundary condition, solving the integral equation at each time step will find Φ n j or Φ j respectively.
The velocity of the free surface particles is given by:
x _ t = Φ = Φ n n _ + Φ s s _
The time-stepping procedure
The problem is solved as an initial condition problem, whereas in each time step, a boundary values problem is solved. Figure A4 presents a flowchart of the procedure.
Figure A4. A flowchart of the solution procedure.
Jmse 11 00236 g0a4
The time stepping applies the following Runge–Kutta 4th steps formulation:
For a given initial condition problem of the form
D f D t = g t , f  
f t k = f k  
The k + 1 step, f k + 1 = f t k + Δ t is calculated by a weighted mean of g t , f , which is calculated at 4 different times in the time step Δ t .
f k + 1 = f k + Δ t 6 g k 1 + 2 g k 2 + 2 g k 3 + g k 4 + o Δ t 5  
g k 1 = g t k , f k  
g k 2 = g t k + 1 2 Δ t , f k + 1 2 Δ t g k 1  
g k 3 = g t k + 1 2 Δ t , f k + 1 2 Δ t g k 2  
g k 4 = g t k + Δ t , f k + Δ t g k 3  
In our case the functions g t , f are
D Φ D t according to the dynamic condition (Equation (A5)) for propagation of Φ .
D x _ D t according to the kinematic condition (Equation (A3)) for propagation of x _ .
At each time step the boundary condition problem is solved four times.
The condition for numerical stability is
Δ t < min Δ S j x _ t j ,     j Γ f  
Forces acting on rigid bodies—Post Processing
The total force vector (acting on the rigid boundary, having y and z components) is the integral of the pressure over the boundary of body in interest. In the discrete formulation, the integral is expressed by sum of the pressure values acting over the elements. The pressure is acting normal to each element and contributes a local force vector:
F = b o d y   r e g i o n P n _   d A = j = 1 N P j   Δ S j   n _ j
N = n u m b e r   o f   e l e m e n t s   a l o n g   t h e   b o u n d a r y   o f   t h e   s t r u c t u r e  
j = 1 : N  
T h e   i n d i c e s   o f   t h e   n o d e s   a l o n g   t h e   b o u n d a r y   o f   t h e   s t r u c t u r e   a r e :  
i = 1 : N + 1
The horizontal (along y direction) and vertical (along z direction) components are
F y = j = 1 N P j · Δ S j cos α j  
F z = j = 1 N P j · Δ S j · sin α j
where
s i n α j = Δ z j Δ S j ,           c o s α j = Δ y j d S j Δ S j = y i + 1 y i 2 + z i + 1 z i 2  
With the linear shape function, the pressure over each element is the mean pressure at the two nodes of the element:
P t , j = P t , i + P t , i + 1 2  
The dynamic pressure (the hydrostatic pressure does not contribute to the horizontal force, while the vertical hydrostatic force is the buoyancy force) acting on each node i at time step t is
P t , i = ρ ϕ i t t + 1 2 ϕ t , i · ϕ t , i
where ϕ i t t = ϕ t + 1 , i ϕ t 1 , i 2 Δ t is a central time derivative, and ϕ = ϕ n , ϕ s is the velocity vector at each node on the body boundary.
Over an impenetrable fixed body ϕ n = 0 and so ϕ t , i = ϕ s = v T i , where v T i is the tangent velocity at each node I, based on the two conjugate elements:
v T i = v T i + v T i + 2
where
v T i = ϕ t , i ϕ t , i 1 Δ S j 1  
v T i + = ϕ t , i + 1 ϕ t , i Δ S j
Figure A5 demonstrates the meshing and indexing of a submerged structure.
Figure A5. The boundary elements of a rigid body (geotextile tube) placed on seabed.
Jmse 11 00236 g0a5

References

  1. Burcharth, H.F.; Zanuttigh, B.; Andersen, T.L.; Lara, J.L.; Steendam, G.J.; Ruol, P.; Sergent, P. Coastal Risk Management in a Changing Climate. Chapter 3—Innovative Engineering Solutions and Best Practices to Mitigate Coastal Risk. In Coastal Risk Management in a Changing Climate; Butterworth-Heinemann: Oxford, UK, 2015; pp. 55–170. [Google Scholar]
  2. Zhang, C.; Magee, A.R. Effectiveness of Floating Breakwater in Special Configurations for Protecting Nearshore Infrastructures. J. Mar. Sci. Eng. 2021, 9, 785. [Google Scholar] [CrossRef]
  3. Gao, J.; Ma, X.; Dong, G.; Chen, H.; Liu, Q.; Zang, J. Investigation on the Effects of Bragg Reflection on Harbor Oscillations. Coast. Eng. 2021, 170, 103977. [Google Scholar] [CrossRef]
  4. Armono, H. Wave Transmission on Submerged Breakwaters Made of Hollow Hemispherical Shape Artificial Reefs. In Proceedings of the Canadian Coastal Conference, Kingston, ON, Canada, 15 October 2003; Volume 2003. [Google Scholar]
  5. Na’im, I.; Shahrizal, A.R.M.; Safari, M.D. A Short Review of Submerged Breakwaters. MATEC Web Conf. 2018, 203, 01005. [Google Scholar]
  6. Fatimah, E.; Wahab, A.K.A.; Ismail, H. Numerical Modeling Approach of an Artificial Mangrove Root System (ArMS) Submerged Breakwater as Wetland Habitat Protector; COPEDEC: Dubai, United Arab Emirates, 2008; p. 20. [Google Scholar]
  7. Marrone, J.; Zhou, S.; Brashear, P.; Howe, B.; Baker, S. Numerical and Physical Modeling to Inform Design of the Living Breakwaters Project, Staten Island, New York. In Proceedings of the Coastal Structures Conference 2019, Hanover, Germany, 29 September–2 October 2019. [Google Scholar]
  8. Chien, A.; Wu, S.; Tseng, F.; Tang, A. Geotextile Tubes Application on Beach Nourishment in UAE. Int. J. Environ. Sci. Dev. 2014, 5, 506–509. [Google Scholar] [CrossRef] [Green Version]
  9. Rahman, A.; Womera, S. Experimental and Numerical Investigation on Wave Interaction with Submerged Breakwater. J. Water Resour. Ocean. Sci. 2013, 2, 155. [Google Scholar] [CrossRef]
  10. Sharif Ahmadian, A. Numerical Models for Submerged Breakwaters. Chapter 1—Introduction. In Numerical Models for Submerged Breakwaters; Sharif Ahmadian, A., Ed.; Butterworth-Heinemann: Boston, MA, USA, 2016; pp. 1–15. [Google Scholar]
  11. Sharif Ahmadian, A. Numerical Models for Submerged Breakwaters. Chapter 2—Fundamental Concepts. In Numerical Models for Submerged Breakwaters; Sharif Ahmadian, A., Ed.; Butterworth-Heinemann: Boston, MA, USA, 2016; pp. 17–27. [Google Scholar]
  12. Shin, E.C.; Oh, Y.I. Coastal Erosion Prevention by Geotextile Tube Technology. Geotext. Geomembr. 2007, 25, 264–277. [Google Scholar] [CrossRef]
  13. Kiran, A.S.; Ravichandran, V.; Sivakholundu, K. Stability Analysis and Design of Offshore Submerged Breakwater Constructed Using Sand Filled Geosynthetic Tubes. Procedia Eng. 2015, 116, 310–319. [Google Scholar] [CrossRef] [Green Version]
  14. Henriquez, M. Artificial Surf Reefs. Master’s Thesis, Delft University of Technology Stevinweg, Delft, The Netherlands, 2005. [Google Scholar]
  15. Voorde, M.; Antunes do Carmo, J.; Neves, M. Designing a Preliminary Multifunctional Artificial Reef to Protect the Portuguese Coast. J. Coast. Res. 2009, 25, 69–79. [Google Scholar] [CrossRef]
  16. López, I.; Tinoco, H.; Aragonés, L.; García-Barba, J. The Multifunctional Artificial Reef and Its Role in the Defence of the Mediterranean Coast. Sci. Total Environ. 2016, 550, 910–923. [Google Scholar] [CrossRef]
  17. Black, K.; Mead, S. Design of the Gold Coast Reef for Surfing, Public Amenity and Coastal Protection: Surfing Aspects. J. Coast. Res. 2001, 115–130. [Google Scholar]
  18. Jackson, L.; Tomlinson, R.; Corbett, B.; Strauss, D. Long Term Performance of a Submerged Coastal Control Structure: A Case Study of the Narrowneck Multi-Functional Artificial Reef. Coast. Eng. Proc. 2012, 1, 54. [Google Scholar] [CrossRef] [Green Version]
  19. Black, S.M.; Kerry, A. Multipurpose, Artificial Reef at Mount Maunganui Beach, New Zealand. Coast. Manag. 1999, 27, 355–365. [Google Scholar] [CrossRef]
  20. Raised Water Research—Research, News and Advice about Making Waves. Available online: https://raisedwaterresearch.com/ (accessed on 9 June 2022).
  21. Oh, Y.I.; Shin, E.C. Using Submerged Geotextile Tubes in the Protection of the E. Korean Shore. Coast. Eng. 2006, 53, 879–895. [Google Scholar] [CrossRef]
  22. González Leija, M.; Chavez, X.; Alvarez, E.; Mendoza, E.; Silva, R. Experimental Study on Geotextile Tube Applications as Submerged Breakwaters for Beach Protection in Yucatan, Mexico. Coast. Eng. Proc. 2014, 1, 25. [Google Scholar] [CrossRef]
  23. Sulaiman, D.M.; Bachtiar, H.; Taufiq, A. Hermanto Beach Profile Changes Due to Low Crested Breakwaters at Sigandu Beach, Central Java. Procedia Eng. 2015, 116, 510–519. [Google Scholar] [CrossRef]
  24. Gouaud, F. Geotextile Structures for Beach Protection Ashkelon, Israel; Corinthe Ingenierie: Grimaud, France, 2016. [Google Scholar]
  25. Drimer, N.; Agnon, Y. An Improved Low-Order Boundary Element Method for Breaking Surface Waves. Wave Motion 2006, 43, 241–258. [Google Scholar] [CrossRef] [Green Version]
  26. Grilli, S.T.; Horrillo, J.; Guignard, S. Fully Nonlinear Potential Flow Simulations of Wave Shoaling Over Slopes: Spilling Breaker Model and Integral Wave Properties. Water Waves 2020, 2, 263–297. [Google Scholar] [CrossRef] [Green Version]
  27. Manolas, D.; Riziotis, V.; Voutsinas, S. Generation and Absorption of Periodic Waves Traveling on a Uniform Current in a Fully Nonlinear BEM-Based Numerical Wave Tank. J. Mar. Sci. Eng. 2020, 8, 727. [Google Scholar] [CrossRef]
  28. Yan, X.; Bingham, H.; Shao, Y. Finite Difference Solutions for Nonlinear Water Waves Using an Immersed Boundary Method. Int. J. Numer. Methods Fluids 2021, 93, 1143–1162. [Google Scholar]
  29. Yuan, D.; Tao, J. Wave Forces on Submerged, Alternately Submerged, and Emerged Semicircular Breakwaters. Coast. Eng. 2003, 48, 75–93. [Google Scholar] [CrossRef]
  30. Geng, T.; Liu, H.; Dias, F. Solitary-Wave Loads on a Three-Dimensional Submerged Horizontal Plate: Numerical Computations and Comparison with Experiments. Phys. Fluids 2021, 33, 037129. [Google Scholar] [CrossRef]
  31. Neves, A.; Taveira-Pinto, F. Wave Loads and Performance of Submerged Breakwaters. In Water Engineering for a Sustainable Environment; International Association of Hydraulic Research: Madrid, Spain, 2009. [Google Scholar]
  32. Van Steeg, P.; Vastenburg, E.W. Large Scale Physical Model Tests on the Stability of Geotextile Tubes; Deltares Report 1200162-000; Deltares: Utrecht, The Netherlands, 2010. [Google Scholar]
  33. Jones, L.; Klamo, J.; Kwon, Y.; Didoszak, J. Numerical and Experimental Study of Wave-Induced Load Effects on a Submerged Body Near the Surface. In Proceedings of the ASME 2018 37th International Conference on Ocean, Offshore and Arctic Engineering, Madrid, Spain, 17–22 June 2018. [Google Scholar]
  34. Bezuijen, A.; Vastenburg, E. Geosystems: Design Rules and Applications; CRC Press: Boca Raton, FL, USA, 2012; p. 144. [Google Scholar]
  35. OpenFOAM. Available online: https://www.openfoam.com/ (accessed on 11 July 2022).
  36. Chen, G.; Xiong, Q.; Morris, P.J.; Paterson, E.G.; Sergeev, A.; Wang, Y.-C. OpenFOAM for Computational Fluid Dynamics. Not. Am. Math. Soc. 2014, 61, 354. [Google Scholar] [CrossRef]
  37. Density of Sand in Kg/M3: Density of Dry Sand, Loose Sand, Packed Sand & M Sand. Available online: https://dreamcivil.com/density-of-sand/ (accessed on 13 September 2022).
  38. Courant, R. Über die Anwendung der Variationsrechnung in der Theorie der Eigenschwingungen und über neue Klassen von Funktionalgleichungen. Acta Math. 1926, 49, 1–68. [Google Scholar] [CrossRef]
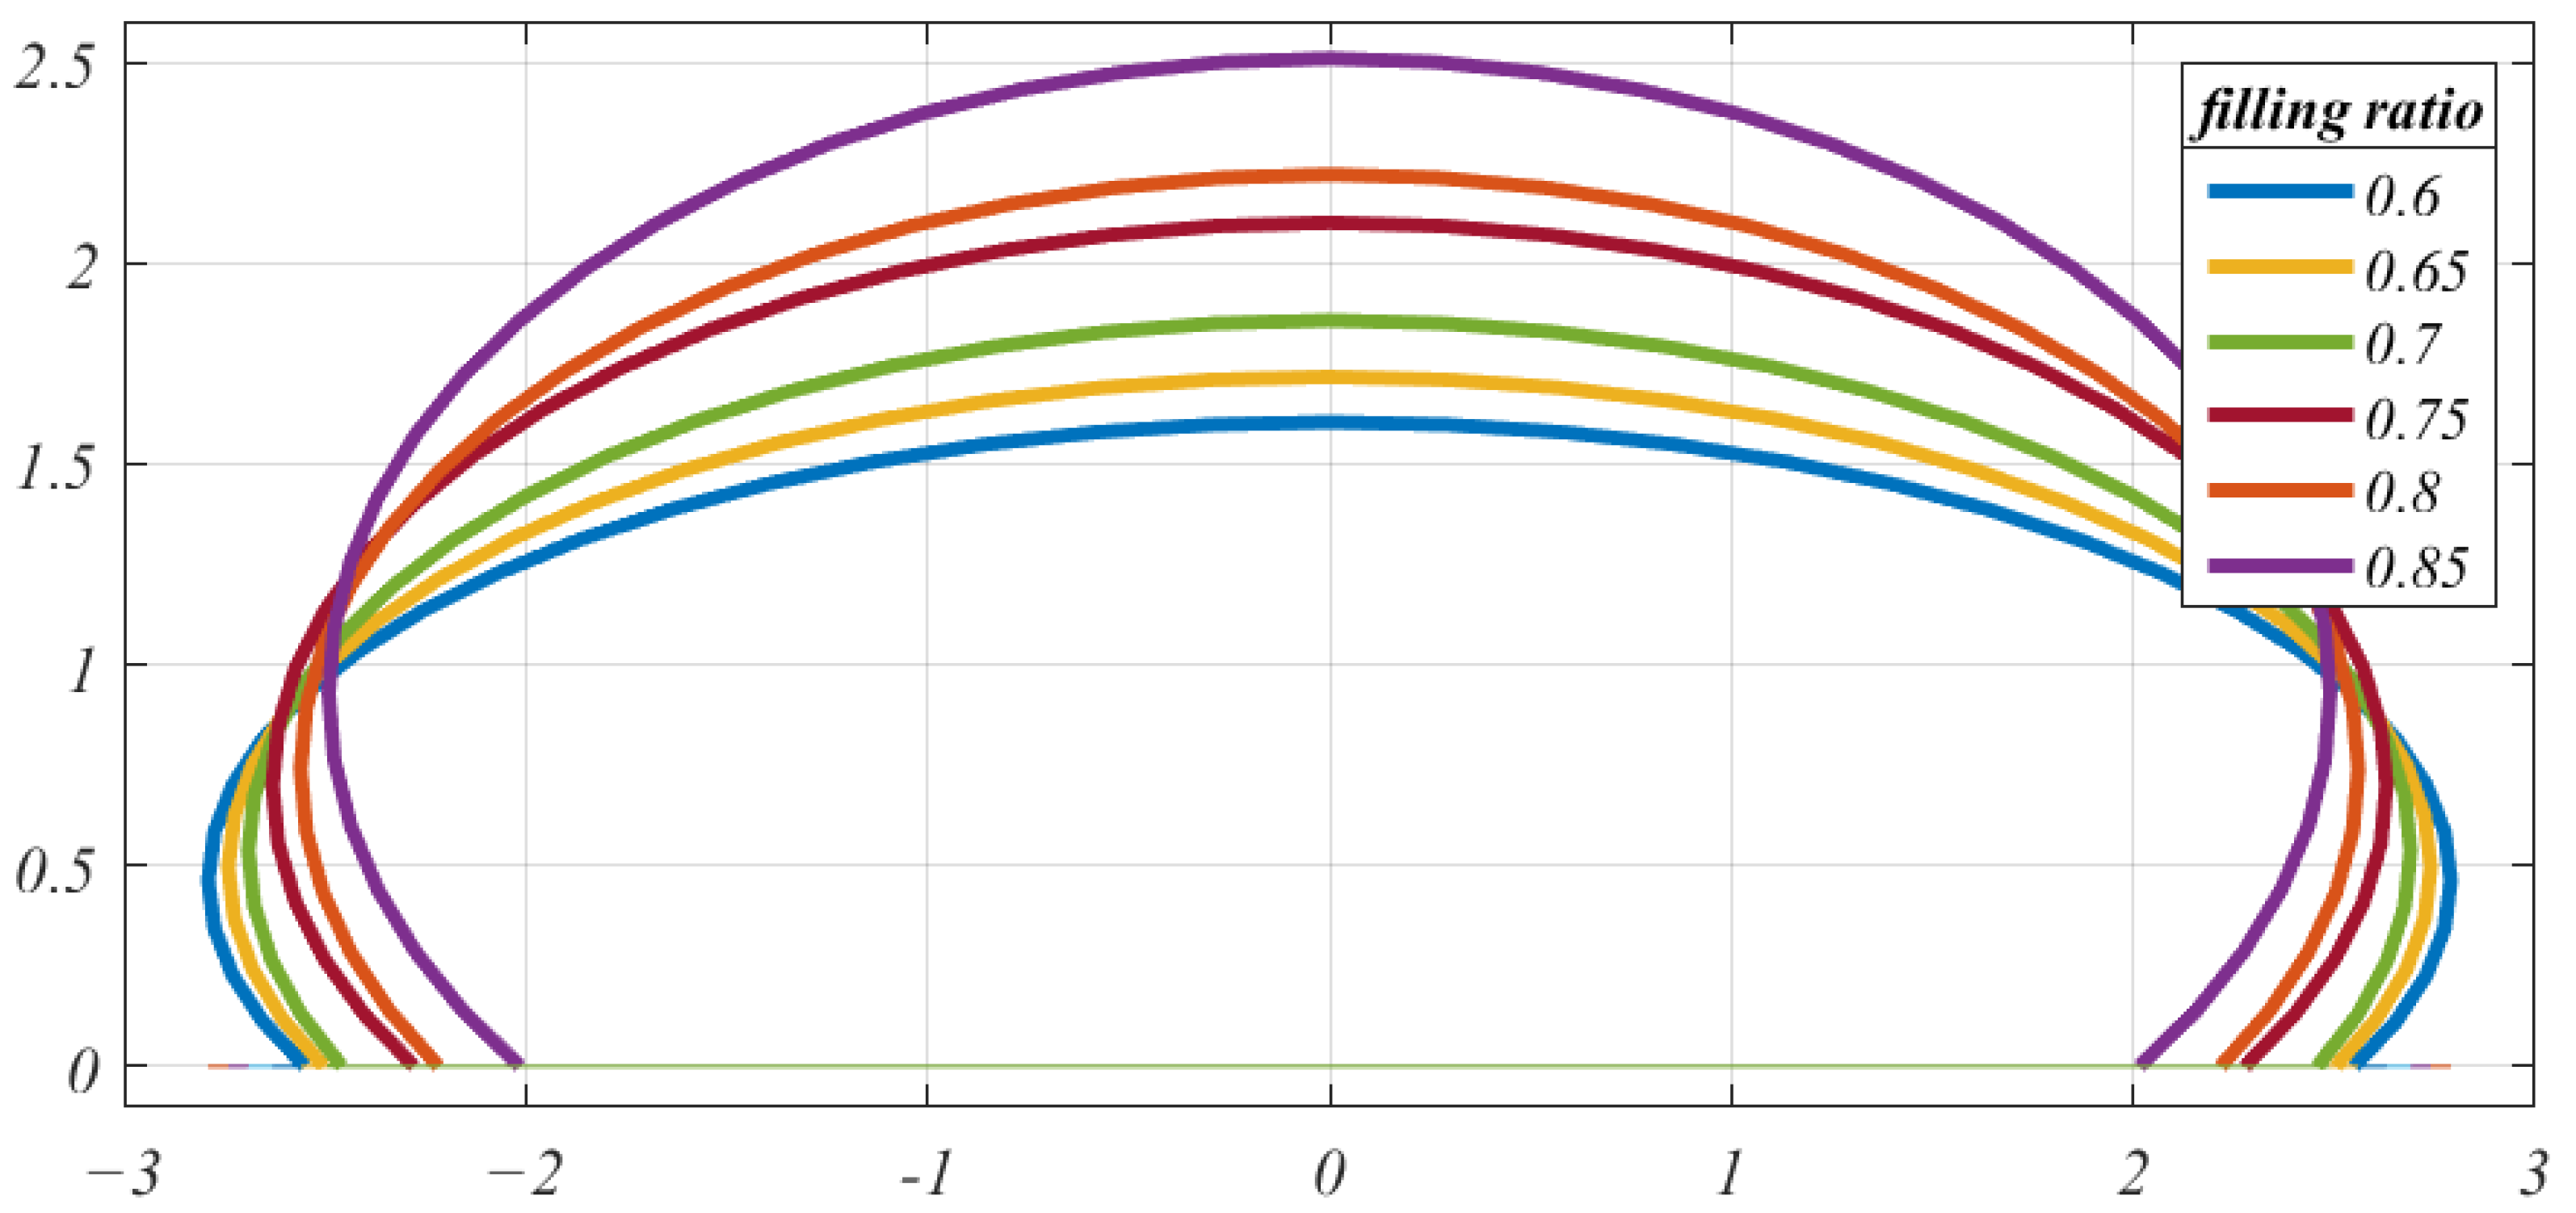
Figure 1. Shapes of partially filled Geotube, in all the practical range of filling; 0.6, 0.65, 0.7, 0.75, 0.8, 0.85. In this example, the filled radius is 2.0 m. The figure is proportional, and the grid spacing is 1.0 m horizontally and 0.5 m vertically.
Jmse 11 00236 g001
Figure 2. Cell grid of the OpenFOAM model.
Jmse 11 00236 g002
Figure 3. An example by OpenFOAM of the flume profile, showing a breaker of height 1 m over the Geotube.
Jmse 11 00236 g003
Figure 4. The loads applied to the submerged Geotube.
Jmse 11 00236 g004
Figure 5. A comparison of the wave forces applied to the Geotube, versus wave height; between BELWF and OpenFOAM.
Jmse 11 00236 g005
Figure 6. A comparison of the SI, versus wave height; between BELWF and OpenFOAM.
Jmse 11 00236 g006
Figure 7. Water surface elevations, loads and SI for wave height 1.3 m and 1.27 m, T = 7 s, as obtained by BELWF (left) and by OpenFOAM (right), respectively.
Jmse 11 00236 g007
Figure 8. Water surface elevations, loads and SI for wave height 1.36 m and 1.39 m, T = 7 s, as obtained by BELWF (left) and by OpenFOAM (right), respectively.
Jmse 11 00236 g008
Figure 9. Water surface elevations, loads and SI for wave height 1.53 m and 1.5 m, T = 7 s, as obtained by BELWF (left) and by OpenFOAM (right), respectively.
Jmse 11 00236 g009
Figure 10. The flume and water surface elevation after running BELWF 8.3 wave periods.
Jmse 11 00236 g010
Figure 11. Left: Diagrams of the dynamic pressure acting on the Geotube during the wave breaking. Right: water surface elevations, loads and SI for a practical design example. T = 9 s, wave height at the wave generator = 2.2 m.
Jmse 11 00236 g011
Table 1. Numerical parameters of all the applied models for the validation stage.
ModelMaximum
Number of
Elements
Free Surface
Elements Size
Number of Time Step in a Wave PeriodTime Step Δ t Maximum CFL *
Allowed
Run Time per Wave
Simulation
OpenFOAM207,77700.2 × 0.15 × 0.1 m^3 to 0.01 × 0.01 × 0.01 m^3140 to 26,9000.005 s to 0.00026 s0.154–42 h
On C2
BELWF8390.2 m to 0.4 m100 to 3500.07 s to 0.02 s0.542–3 h
On C3
* Courant–Fredrich–Lewy (CFL) stability criterion [38]. C1—Computer 1: Intel(R) Xeon(R) CPU E5-2690 v4 @ 2.60 GHz × (2 processors). C2—Computer 2: Intel(R) Xeon(R) CPU E5645 @ 2.40 GHz × (6 processors). C3—Computer 3: 11th Gen Intel(R) Core (TM) i7-1165G7 @ 2.80 GHz and 1.69 GHz (2 processors).
Disclaimer/Publisher’s Note: The statements, opinions and data contained in all publications are solely those of the individual author(s) and contributor(s) and not of MDPI and/or the editor(s). MDPI and/or the editor(s) disclaim responsibility for any injury to people or property resulting from any ideas, methods, instructions or products referred to in the content.