Abstract
A truss-floating aquaculture vessel is an innovative addition to the aquaculture industry, characterized by its large, porous, ship-shaped structure. It differs from traditional ships, offshore structures, and individual net cages. Due to its distinctive features, a large-scale truss-floating aquaculture vessel requires dedicated hydrodynamic and structural analysis, which is the primary focus of this paper. Our study starts with the calculation of wave loads acting on the vessel using the equivalent design wave method. Subsequently, it delves into the analysis of structural characteristics and stress distribution of the truss-floating aquaculture vessel, upon which structural optimization is performed. To determine the optimal design variables, a sensitivity analysis of the truss members is carried out using a parametric research method. Finally, the structure with multiple objectives is optimized using two distinct approaches: the adaptive simulated annealing algorithm (ASA) and the multi-island genetic algorithm (MIGA). The results reveal that prior to optimization, there is a risk of buckling and yielding damage occurring at various connections within the vessel structure. After optimization, the structural strength is significantly improved, accompanied by a reduction in the total weight of the vessel. This study offers a valuable reference for the design and structural safety assessment of this innovative truss-floating tank-type aquaculture vessel.
1. Introduction
Traditional large-scale aquaculture vessels are primarily categorized into two forms: closed aquaculture vessels and net cage aquaculture platforms. Closed aquaculture vessels are typically converted from barges, with the middle section of the compartment transformed into a breeding warehouse [1]. The advantages of this approach include ease of towing and the ability to select breeding areas conveniently. However, it comes with the drawback of requiring a more complex setup involving specialized pump facilities for internal and external seawater exchange. On the other hand, net cage aquaculture platforms are generally semisubmersible structures [2]. These platforms consist of trusses, floats, and nets, offering the benefit of a simple structure and a large aquaculture area. However, they are not suitable for towing, and they must withstand substantial wave loads and wind forces. This is primarily because their structures are typically square, round, or hexagonal in shape. To better accommodate both towing and breeding requirements, a new type of truss-floating aquaculture vessel has emerged in recent years.
A truss-floating tank aquaculture vessel differs significantly from traditional aquaculture vessels. The midship area of the vessel consists of a full truss structure without any stiffened panels. The central truss structure, which connects the bow and stern floats, bears the vessel’s bending and torsional forces. The primary buoyancy of the vessel comes from the bow and stern floats. In the hydrodynamic and structural analysis of a truss-floating aquaculture vessel, the industry often relies on ship-related codes, standards, and guidelines to evaluate wave loads and hull performance. Additionally, offshore structure codes are utilized to assess the vessel’s structural integrity. This approach is adopted because there has not yet been a dedicated code developed for truss-floating aquaculture vessels. In practice, when wave loads are calculated according to ship standards, the computed bending and torsional moments can deviate significantly due to the water permeability in the central truss-floating tank vessel. This divergence could lead to discrepancies in the vessel’s structural design.
For structural analysis, nowadays, vessels with unique structures or those exposed to complex forces require precise analysis of stress and deformation through the finite element method (FEM), ensuring the accuracy of such calculations and providing a solid foundation for safe and effective designs. For example, Xin [3] used the PCL program of MSC PATRAN software to realize the automatic loading and load adjustment steps, which significantly improved the efficiency of the direct calculation of the hull structural strength. Rui [4] used the MSC NASTRAN software to complete the analysis of the typical working conditions of a crane strength and stability calculations, providing a basis for the optimization of the hull structure. Nisi et al. [5] carried out an analysis of the total longitudinal strength of a deep-sea mining vessel using DNV WADAM and summarized the evaluation method of the real longitudinal strength applicable to marine mining vessels. Wang et al. [6] investigated the ultimate longitudinal strength of an ultralarge container ship by using an experimental and nonlinear FEM. The research delved into the progressive collapse behavior of these vessels, offering valuable insights into the structural design of various container ship types. Liu et al. [7] calculated the maximum strength and fatigue strength of single-point mooring (SPM) cage floating ring under static and vibration loads based on the FEM of elastic modeling. The results indicate that reinforcing the double tubes or selecting suitable damping mechanisms increased the ultimate strength and fatigue resistance of SPM cage floating rings.
On the other hand, hydrodynamic models must be coupled with structural analysis to calculate wave-induced motions and loads. For instance, Yanagimoto et al. [8] assessed the dry bulk cargo loads acting on the bottom plate using a coupled discrete element method (DEM) and FEM analysis with a simplified ship model. The computational results demonstrate that when the bottom plate is elastic, more force is concentrated near the edge of the bottom plate, while less force is distributed around the center. In contrast, the loads are uniformly distributed when the bottom plate is rigid. Liu et al. [9] investigated the pile–soil interactions of horizontal ice with monopile offshore wind turbines using the coupled viscous element method (VEM) and FEM with the LS-DYNA finite element code. They provide a valuable reference for evaluating the dynamic characteristics and damage of OWT structures under wind and ice conditions. Zhao et al. [10] analyzed the ultimate strength of a hull girder model with large openings, comparing failure modes, load displacements, and ultimate load results based on the nonlinear finite element method with those of the experimental model. Yang et al. [11] achieved numerical simulation and evaluation under simultaneous vertical, horizontal, and torsional vibrations by employing a three-dimensional equivalent modeling approach. Bakica et al. [12] proposed a novel numerical scheme that couples OpenFOAM and NASTRAN to enhance the transfer accuracy of hydrodynamic loads from hydrodynamic CFD meshes to structural finite element meshes.
It is worth emphasizing that within the hydrodynamic and structural analysis of ship hulls, the ultimate longitudinal strength is a critical aspect in assessing their safety. This strength is typically evaluated under conditions of hogging or sagging with monotonically increasing bending moments. For example, Manikandan and Arun [13] utilized three different methods to determine the buckling properties and strength of reinforced plates. They conducted a detailed parametric study to assess the impact of plate thickness and various factors, finding that spacer plates increased the stiffness and torsional stiffness of the members. Panda and Ramachandra [14] performed linear buckling analysis on rectangular plates without stiffening ribs by establishing boundary conditions and obtaining critical buckling loads. Their results indicate that the absence of stiffening ribs reduced buckling resistance. Liu and Wang [15] investigated the buckling behavior of reinforced thin plates with multiple stiffening ribs. They concluded that an increase in the number of stiffening ribs in a uniformly arranged thin plate led to an overall improvement in the ultimate strength of the reinforced plate. Bedair [16] conducted a stability analysis of thin plates with multiple stiffening ribs and compared the results with those obtained using the finite element method. Taysi [17] concluded that variations in the thickness of the plate and stiffening ribs, which constitute dimensional optimization parameters, had no significant effect on the critical buckling load. However, shape optimization, involving changes in the location of stiffening ribs, significantly influenced the critical buckling load.
For the optimization analysis of truss structures, several researchers have introduced innovative algorithms. Cheng et al. [18] presented a new variant of coordinated search algorithms tailored to optimize discrete truss structures under various loading conditions. Li et al. [19] proposed a heuristic particle swarm optimization algorithm designed for truss structures featuring discrete variables. Kaveh and Talatahari [20] integrated particle swarm optimization with passive aggregation, ant colony optimization, and harmony search schemes, creating an efficient algorithm known as discrete heuristic particle swarm ant colony optimization. Ho-Huu et al. [21] introduced an adaptive elite differential evolutionary algorithm specifically for optimizing truss structures with discrete design variables. Xiang et al. [22] applied a simulated annealing algorithm to optimize discrete truss systems. Miguel et al. [23] proposed an efficient single-stage firefly algorithm for the simultaneous optimization of truss structures concerning their dimensions, shapes, and topologies. Xue [24] devised a novel heuristic algorithm aimed at addressing high nonlinear characteristics in the optimization process. Khatibinia and Yazdani [25] introduced an enhanced version of the multigravitational search algorithm, known as the accelerated multigravitational search algorithm (AMGSA), which has demonstrated superior convergence and significantly reduced the number of structural analyses. Mortazavi [26] introduced an auxiliary fuzzy decision-making mechanism to enhance the capabilities of majority decision element heuristic optimization techniques in tackling structural sizing and topology optimization problems. However, existing optimization efforts have primarily concentrated on ships and trusses independently, with no prior structural optimization work carried out for the new truss-floating tank aquaculture vessel in the existing literature.
To address this gap, we performed a structural optimization of a truss-floating aquaculture vessel in our prior research [27,28]. However, our optimization analysis was confined to a parameter optimization involving continuous design variables. Typically, the sole optimization objective is the weight of the entire ship structure, encompassing the fatigue analysis of truss joints [27] and the assessment of buckling and yield strength [28]. In this paper, we apply the adaptive simulated annealing algorithm and multi-island genetic algorithm to optimize the maximum stress, maximum deformation, and overall weight of the vessel. This process includes the calculation of wave loads for two typical working conditions and the determination of wave parameters corresponding to the most demanding operational scenarios. We subsequently analyze the stress characteristics induced by wave forces to pinpoint areas and components in need of optimization. By following this comprehensive approach, we formulate a practical and feasible optimization scheme. This study aims to identify the most suitable algorithm for optimizing the truss structure of the aquaculture vessel, offering valuable insights for future aquaculture vessel design optimization.
2. Numerical Methods
This section provides an overview of the hydrodynamic model employed to calculate wave loads and the optimization methodology used for structural optimization. The hybrid hydrodynamic model combines the potential-flow theory approach with the viscous-drag term from Morison’s equation. The structural optimization process involves the exploration of two optimization schemes.
2.1. Hybrid Hydrodynamic Model
The floating tank of an aquaculture ship belongs to a large-scale body, and its wave-induced load can be calculated by applying the potential-flow theory. However, the members of the truss structure are small-scale, and they are estimated using Morison’s formula.
2.1.1. Potential-Flow Approach
The assumption of potential flow allows for defining the velocity field as the gradient of the velocity potential, denoted by , which satisfies the Laplace equation in the fluid domain.
The harmonic time dependence allows for defining a complex velocity potential :
where is the frequency of the incident wave, and t is time. The velocity potential of the incident wave is defined by
where k denotes the wave number, and is the angle between the direction of propagation of the incident wave and the positive x-axis. A is the wave amplitude, and h is the water depth. Linearization of the problem permits the decomposition of the velocity potential into the radiation and diffraction components:
where the constants denote the complex amplitudes of the body’s oscillatory motion in its six rigid-body degrees of freedom, and are their corresponding unit-amplitude radiation potentials. represents the disturbance potential.
In the first-order approximation, the dynamic pressure in the flow field can be solved by linearizing the Bernoulli equation, i.e.,
Respectively, introduce , , . Integrate the pressure on a wet surface of a transient object:
where is the wet surface area of the floating body, and are the six components of the normal unit vector . The wave force and moment acting on the body can then be estimated.
The equation of motion for the harmonic motion of rigid body systems is expressed in the global reference frame:
where is the body inertia, is the added mass, and and are the potential and viscous damping, respectively. and are the hydrostatic and external restoring coefficients, respectively. Notably, these coefficients are all matrices.
2.1.2. Morison Equation
When the dimension of the structure is small, for example, when the ratio of the diameter D to the wavelength L is less than 0.2, the structure is considered small-scale. The wave impact on small-scale structures can be neglected. Morison’s formula can be used to calculate the drag force and the inertial force of the small-scale components. Considering the effect of relative motion included to calculate contributions to the equation of motion in Equation (8), the Morison’s equation for a moving body is given as
where is the incident wave frequency, is the diagonal mass inertia matrix, is the water density, is the displaced volume of the Morison element, is the diagonal added mass coefficient matrix, is the complex amplitude of the motion, is a identity matrix, and is a complex amplitude of the incident wave field. is a linearized viscous damping matrix expressed as:
where is the projected area of the Morison element, is the drag coefficient matrix, and is the equivalent velocity. is the fluctuating hydrostatic restoring force representing the first-order restoring contributions integrated into the equation of motion. is the fluctuating gravity force representing the acceleration of gravity calculated in a coordinate system fixed with the Morison model. is the fluctuating buoyancy force calculated in a coordinate system fixed with the Morison model. The contributions from Morison elements are calculated in the particular element local coordinate systems and then transformed into the body coordinate system before assembling rigid body quantities. The wave kinematics in Equation (9) are derived from the diffracted wave calculated using the potential theory.
In the analysis of the hydrodynamic characteristics of the net, the lift resistance coefficient and drag force coefficient are calculated according to the following formula [29]:
where , and represents the impact angle of the net, signifying the angle between the net and the direction of water flow on the horizontal plane. denotes the density of the net, indicating the ratio of the projected area of the net entity to the contour area. Given the ship’s net structure, it can be determined that . To account for the structural safety of the aquaculture ship, the impact angle’s influence is omitted in the calculation of and , meaning that and are both set to their maximum value of 1. Consequently, and can be computed.
2.2. Multiobjective Optimization Model
In the multiobjective optimization process, it is essential to develop a suitable mathematical optimization model. Such a model consists of the defined objective function, design variables, and constraints. Typically, a mathematical optimization model can be expressed in the following form:
where is the vector objective function; is the subobjective function; and are the constraints; is the design variable; and and are the upper and lower bounds of the design variable of , respectively.
The aforementioned characteristics of multiobjective optimization problems typically imply that absolute optimal solutions are seldom attainable. Instead, these problems often yield satisfactory solutions. In the context of optimizing the truss-floating vessel, the current study utilizes two distinct optimization schemes.
2.2.1. Adaptive Simulated Annealing Algorithm
Simulated annealing (SA) is a stochastic search algorithm based on principles from statistical physics that is commonly employed to solve optimization problems [30]. The algorithm is inspired by the annealing process of a solid object and replicates three key phases: heating, isothermal temperature, and cooling. Adaptive simulated annealing (ASA) is a global optimization algorithm derived from the principles of simulated annealing. It offers improvements over the traditional simulated annealing algorithm by dynamically adjusting the search strategy and parameters to enhance efficiency and precision. When the temperature is high, ASA employs a search strategy with a larger step size to rapidly explore the solution space. Conversely, when the temperature is low, ASA adopts a search strategy with a smaller step size to ensure a more accurate solution can be obtained. To determine the model perturbations, the Cauchy distribution considering randomness is utilized:
where T stands for temperature, u is a uniformly distributed random number in [0,1], [, ] is the range of values of the ith variable of in the current model, and is the ith variable in the model after the perturbation, with ∈ [, ]. The acceptance probability is then obtained under the generalized Boltzmann–Gibbs distribution as follows:
with . h is a real number, and we have as . The annealing temperature updating function is then estimated as
where is the initial value of temperature, k is the proposed number of iterations, c is a given constant, and N is the number of parameters. The flowchart illustrating the steps of the ASA is presented in Figure 1.
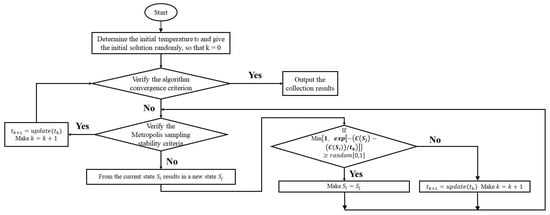
Figure 1.
Flowchart illustrating the adaptive simulation of an annealing process.
2.2.2. Multi-Island Genetic Algorithm
One of the principles in designing genetic algorithms is to maintain population diversity to expand the search space while applying selection pressure to keep the search process evolutionary. Let the current optimization problem have n design variables. The upper bounds of the design variables, denoted as , and the lower bounds, denoted as , are known, and the corresponding concepts are defined as follows.
(a) Simple hybridization: Take the solution vectors (chromosomes) and for hybridization. First, generate a random integer k in some interval [0, ]. Then, hybridization starts after the kth component of the two vectors, producing the offspring: and . Finally, perform the necessary processing on and to ensure they satisfy the bounding constraints.
(b) Arithmetic hybridization: Assuming that the solution vectors and are first arithmetically hybridized, generate a random floating-point number r in the interval [0, 1], such that and .
(c) Uniform mutation: To perform uniform mutation, select the solution vector (chromosome) . First, generate a random integer k in the interval [0, ]. This mutation process targets the kth gene of the chromosome, which corresponds to the kth component of the vector , resulting in a new chromosome vector . Next, generate two random floating-point numbers, and , in the interval [0, 1], such that
where denote the lower and upper bounds of the kth design variable, i.e., the kth component of the vector (counting from 0), and then the variant of chromosome is obtained by making .
(d) Nonuniform mutation: To perform nonuniform mutation, select the solution vector (chromosome) . Start by generating a random integer k in the interval . This mutation process targets the kth gene of the chromosome, corresponding to the kth component of the vector . Next, generate two random floating-point numbers, and , in the interval [0, 1], such that
where the function is a value in the return interval [0, y] to make the probability that the function tends to zero with an increase in the number of iterations:
where T is the maximum number of iterations, and b is a parameter that determines the coefficient of nonuniformity. The flowchart in Figure 2 illustrates the multi-island genetic algorithm according to its definition and principles.
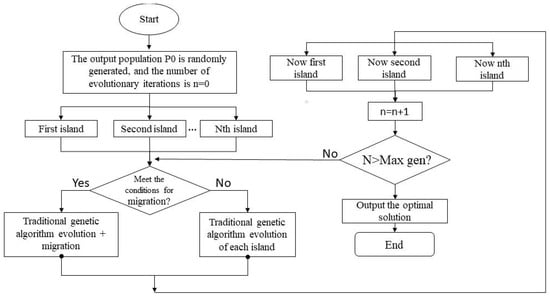
Figure 2.
Flowchar illustrating the multi-island genetic algorithm.
3. Hydrodynamic Loads and Structural Strength Analysis
This section starts with providing the principal dimensions of the analyzed aquaculture vessel. Then, the wave loads acting on the aquaculture vessel are directly calculated using the hybrid hydrodynamic method. Finally, the structural strength of the aquaculture vessel is analyzed using the finite element method.
3.1. Particulars of the Aquaculture Vessel
The primary dimensions of the truss-floating tank aquaculture vessel are provided in Table 1: length between perpendiculars , waterline breadth , depth midships , and draught midships . As depicted in Figure 3, the FE model of the entire ship structure includes the bow pontoon, stern pontoon, and amidships truss structure. Plate members (such as outer plates, the main deck, and each deck) in the model are represented using shell elements, while buttresses and trusses are simulated using beam elements. The origin of the model is situated at the intersection of the transom plumb line and the bottom baseline. The x-axis points from the stern towards the bow in the positive direction, the y-axis extends from the ship’s midpoint towards the port side in the positive direction, and the z-axis goes from the bottom of the ship to the deck in the positive direction. The structural FE model comprises a total of 49,189 elements and 31,509 nodes.

Table 1.
Key dimensions of the analyzed aquaculture vessel.

Figure 3.
Finite element structural model of the whole ship (left), along with the Morison model of the central truss and net (right).
In order to consider the influence of the net load on the strength of the structure, a crisscrossing cylindrical structure is built outside the floating body truss to make its force equal to that of the net load, so as to simulate the influence of the net load on the hull structure. Considering the fishing net structure in the Morrison model, the stressed area of the net model is equal to the actual net area. The Morison model of the central truss and net is shown in the right graph of Figure 3 as well.
Two typical working conditions for towing and operation, corresponding to different draft depths and displacements, are analyzed. For each condition, a three-dimensional panel model, Morison model, and mass model of the vessel are constructed. Variations in the draft are simulated using different wet surface models, while changes in displacement are represented with different mass bar models. Different wave heights and wave directions are considered for each working condition, as outlined in Table 2.

Table 2.
Typical working conditions and wave parameters.
3.2. Hydrodynamic Load Analysis
The panel model, Morison model, and mass model are utilized to calculate the load transfer function and the extreme bending moment, as well as the torque of the ship under two typical working conditions. The choice of wave load calculation method depends on its applicability, considering factors such as wavelength and the scale of the floats. Consequently, Morison’s equation is used to calculate the wave loads for the middle truss structure, which comprises small-scale members. In contrast, diffraction theory is utilized to compute the wave loads for the bow and stern floats. The truss-floating aquaculture vessel is mainly composed of bow and stern floats, as well as an amidships truss structure. The midsection of the vessel consists entirely of tubular members, which leads to reduced resistance to hull bending and torsion. Therefore, the primary analysis focuses on vertical bending moments and torque.
By applying loads in each section using SESAM/HydroD, the whole vessel is divided into 20 stations, with a ship length of 129 m and rib spacing of 6.5 m. FR0 is set to be the last section of the transom deck cross-section, and FR20 is the foremost part of the bow pontoon. This process yields vertical wave bending moment () and wave torque () data. Typically, the maximum vertical bending moment occurs near the amidships, while the maximum torque arises at the 1/4 and 3/4 positions of the vessel. The main control load and its corresponding section are presented in Table 3.

Table 3.
Analyzed working conditions and their main load parameters.
Considering the working conditions described above, the calculation includes the determination of vertical moment at the section under various wave angles, as illustrated in Figure 4. Furthermore, torque at the section and the section for different wave angles are computed and presented in Figure 5 and Figure 6.
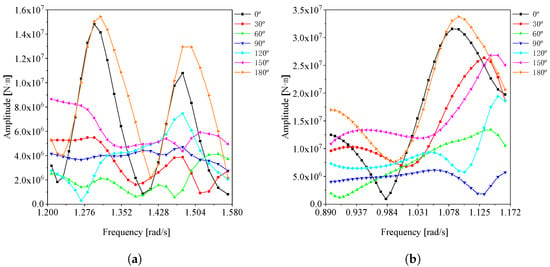
Figure 4.
Vertical moment at section: (a) Condition 1-1. (b) Condition 2-1.
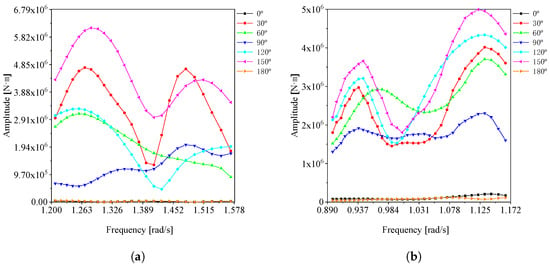
Figure 5.
Torque on section: (a) Condition 1-2. (b) Condition 2-2.
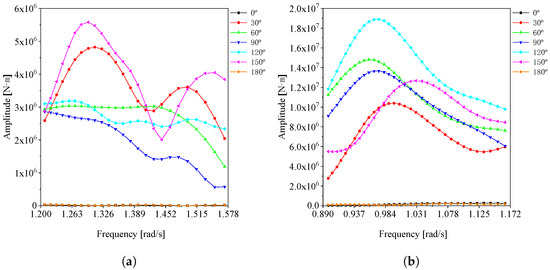
Figure 6.
Torque on section: (a) Condition 1-3. (b) Condition 2-3.
Upon analyzing the data curves presented above, it becomes evident that within the selected period–frequency range, the bending moment and torque exhibit regional extreme values, as well as unique maximum values. According to the wave frequency, wave direction, and phase that correspond to the maximum amplitude of the bending moment and torque, we can derive the wave parameters for the worst-case scenario of each working condition. The outcomes are detailed in Table 4.

Table 4.
Extreme wave conditions that result in the worst-case scenario of each working condition.
The wave loads of each section of the vessel are recalculated according to the most unfavorable wave parameters for each condition. And the vertical bending moments and wave torques at the 19 sections can be obtained for the towing and breeding conditions, as shown in Figure 7.
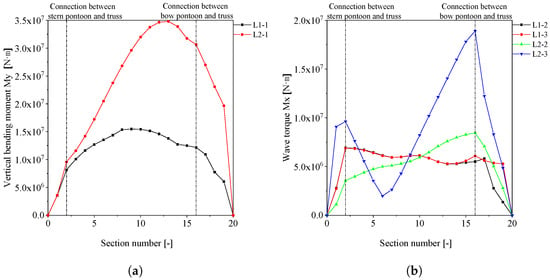
Figure 7.
Vertical bending moments and wave torques corresponding to each section: (a) Bending moment. (b) Torque.
Upon analyzing the vertical bending moment in both conditions, it becomes evident that the vertical bending moment exhibits a pattern of being smaller at both ends and larger in the middle, similar to the hull girder load curve. In the breeding condition, the maximum value of the vertical bending moment is observed at station 13 (84.5 m from the transom plumbline), with a magnitude of N·m. In the towing condition, the maximum vertical bending moment occurs at station 10 (65 m from the transom plumbline), with a value of N·m. The wave torques for conditions 1-2 and 1-3, under towing conditions, exhibit similar characteristics. The torque values are relatively high and change smoothly in the middle, whereas they are relatively low at both ends with rapid changes. Under the breeding condition, regional extremes are observed in both condition 2-3 and 2-2, specifically at station 2 and station 16. These correspond to the connections between the stern float box and the truss and the connection between the bow float box and truss, respectively. To increase the rigidity of the joint, strengthen the structural strength, and reduce the stress concentration at the joint, vertical and transverse brackets can be added inside the bow and stern pontoons. Additionally, the thickness of the pontoon plate and the diameter thickness of the truss joint should be increased.
3.3. Structural Strength Analysis
In this section, the structural strength of the vessel is assessed using equivalent design waves. The wave load corresponding to the wave parameters at the maximum vertical bending moment and wave torque is applied to the finite element model, and the structural strength is analyzed by SESTRA while considering the effects of mooring systems. The boundary conditions apply linear displacement constraints to avoid rigid hull movement without limiting the deformation of the model structure [31]. The total longitudinal strength of the whole ship is analyzed according to the maximum vertical bending moment, and the torsional strength of the whole ship is analyzed according to the maximum wave torque. The results for stress are found in Table 5. The analysis reveals that the highest axial stress appears in the maximum vertical bending moment load case, reaching 302 MPa. Conversely, the largest bending stress occurs in the maximum wave torque load case, peaking at 165 MPa. While the axial and bending stresses vary under different working conditions, it is noteworthy that the high-stress regions in both cases are situated at the connections between the left or right longitudinal trusses and the central crossbeam.

Table 5.
Structural stress analysis for different conditions.
According to [32], the beam–column buckling characteristics of the member should also be considered when checking the buckling of the member, that is, the buckling constancy of the tension–bending combination member and the compression–bending combination member. A local buckling check is carried out for beams of different positions and specifications. The check result is given in Figure 8.
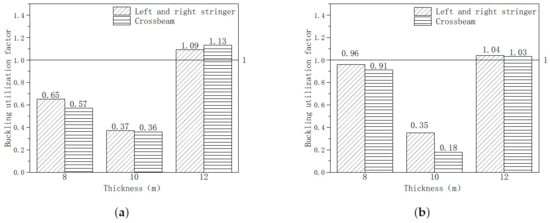
Figure 8.
Check of the buckling strength of central truss beam members: (a) Tensile stress check. (b) Compressive stress check.
It is evident that, under the most challenging operational conditions, the 8 mm and 10 mm beams of the left and right stringers, as well as the middle crossbeam, fall within the safety parameters. The 10 mm beam members exhibit a substantial safety margin in both tensile and compressive stresses. However, the tensile flexural and compressive flexural utilization factors for the 12 mm beam members exceed 1, implying the possibility of flexural buckling. Notably, flexural buckling is likely to occur at the connections between the left and right stringer trusses and the central crossbeam. The subsequent section delves into the structural optimization of the midship truss.
4. Optimization Study
Prior to undertaking the optimization study of the aquaculture vessel, this section encompasses a sensitivity analysis of the structural parameters. Subsequently, the optimization study is conducted based on the insights gained from the sensitivity analysis.
4.1. Sensitivity Analysis of Structural Parameters
The cross-sectional area of the longitudinal and transverse beam structures is considered as the design variables. The wave bending moment, obtained using the equivalent design wave method, is applied to the model. While keeping other variables constant, changes are made to the values of the design variables one by one. This allows for the analysis of their impact on the maximum stress of the bars, deformation, and the overall weight of the ship under the same wave moment. The positions of these variables are depicted in Figure 9. And the original design specifications of the design variables and their components are shown in Table 6.
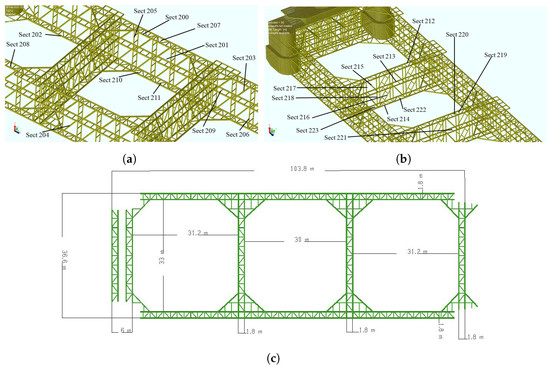
Figure 9.
Variable positions for the two truss types: (a) left and right stringer, (b) crossbeam, and (c) dimensions of the structural components.

Table 6.
Summary of the design variables of the aquaculture vessel.
The calculated values of normalized sensitivity of the above 24 design variables to the synthetic stresses in the beam are shown in Figure 10a. The horizontal coordinates are the individual design variables, and the vertical coordinates are the calculated values of the normalized maximum synthetic stress sensitivity. A positive value of sensitivity indicates a positive relationship between the design variables and the maximum beam stress, while a negative value of sensitivity indicates a negative relationship. In other words, increasing a design variable with a positive sensitivity will increase the beam stress, while increasing a design variable with a negative sensitivity will reduce the beam stress. Therefore, to enhance structural strength and reduce stress, measures should be taken to increase the value of design variables with negative sensitivity and, if possible, decrease the value of design variables with positive sensitivity. For the design variables with sensitivity values close to zero, changing these variables will have a minimal effect on the maximum stress of the beam.

Figure 10.
Sensitivity analysis of the design variables in terms of (a) max combined beam stress, (b) max deformation, and (c) mass.
The calculated normalized sensitivity values of the 24 design variables to structural deformation are presented in Figure 10b. From these results, it can be concluded that increasing the value of design variables with negative sensitivity or decreasing the value of design variables with positive sensitivity can enhance structural strength and reduce deformation. Moreover, the sensitivity of various beam members varies considerably. Therefore, it is essential to focus on the most sensitive members to optimize the structure effectively. The calculated normalized sensitivity values of the 24 design variables to total weight are shown in Figure 10c. It is evident that the calculated sensitivities of weight to the design variables are all positive, indicating that reducing the values of any design variables can lead to a decrease in the total weight. Notably, the 12 mm and 10 mm members exhibit the highest sensitivity.
4.2. Structural Optimization
While maintaining structural strength within a safe range, the cross-sectional area of nonsensitive rods can be reduced to decrease weight, and the cross-sectional area of sensitive rods can be increased to enhance structural strength. Bending stress, rod deformation, and the total mass of the central truss structure are taken as objective functions. The Isight-Optimization module is utilized to optimize the structure at the location of maximum bending stress. This section provides the optimization results for the two methods used. Subsequently, a comparison between the results obtained from these two methods is presented.
4.2.1. Results of the Adaptive Simulated Annealing Algorithm
The adaptive simulated annealing algorithm is chosen to optimize the design of the maximum stress, truss deformation, and total weight of the whole ship structure. The iterative process for optimizing design parameters, design feasibility, and the objective function is depicted in Figure 11. The black dashed line represents design points during the iterative process, red points represent optimal solution design points, and the red curve is a fitting curve for the dashed line graph.
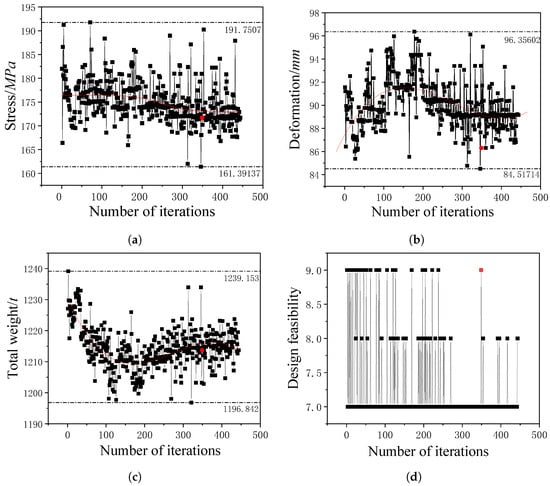
Figure 11.
Iterative process of optimization based on ASA: (a) Iterative process for bending stress. (b) Iterative process for deformation. (c) Iterative process for total weight. (d) Iterative process for design feasibility.
The number of iteration steps is finally determined to be 349 to obtain the optimal solution. The maximum bending stress and maximum deformation of the beams in the amidship truss fluctuated between to MPa and to mm, respectively. The total weight ranged from 1196.84 to 1239.15 tons. At the optimal solution, with changes in the design variables, the maximum bending stress of the truss structure was 171.70 MPa, the maximum deformation displacement was 89.16 mm, and the total weight of the ship was 1213.70 tons. Although the trends of these three parameters initially varied, they stabilized in the second half of the iteration process.
4.2.2. Results of the Multi-Island Genetic Algorithm
The performance of MIGA is influenced by various factors, including population size, migration period, and migration strategy. The optimal solution is found at the 900th iteration step. The iterative process involving optimization parameters, design feasibility, and the objective function is illustrated in Figure 12.
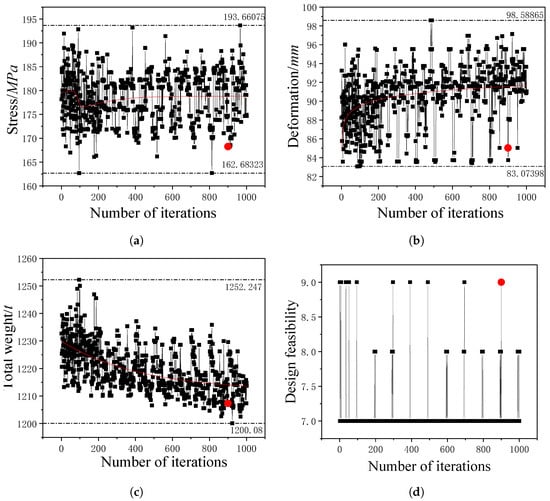
Figure 12.
Iterative process of optimization based on MIGA: (a) Iterative process for bending stress. (b) Iterative process for deformation. (c) Iterative process for total weight. (d) Iterative process for design feasibility.
Throughout the iteration process, the maximum value of the bending stress ranges from 193.66 MPa to a minimum of 162.68 MPa. The optimal solution following the optimization is found to be 168.26 MPa. Moreover, the maximum deformation of the entire ship fluctuates within the range of mm. As for the weight, it varies from a maximum of 1252.25 t to a minimum of 1200.08 t. After the optimization, the total weight of the ship is reduced to 1207.33 t. When comparing the iteration results, it becomes evident that the optimal solution values for stress, displacement, and weight are consistently lower than most of the design points.
4.2.3. Comparison of ASA and MIGA Solutions
The optimization results obtained from ASA and MIGA are compared in this section. We evaluate the truss tube diameter thicknesses in comparison with the initial design parameters, as presented in Table 7. Additionally, the results for optimal stress, deformation, and weight are listed in Table 8 for further analysis.

Table 7.
Original values and optimal solutions for the pipe diameter thicknesses.

Table 8.
Results of optimal stress, deformation, and mass.
Finally, the yield is verified using the yield failure criterion [33], and buckling is assessed based on the bending buckling characteristics of member bars [34]. The optimal results and the original results are presented in Table 9.

Table 9.
Buckling and strength of the optimized results.
The total mass after optimization using the ASA method is 1213.70 t, representing a reduction of 14.1 t, equivalent to 1.15% of the initial 1227.80 t. After optimization with the MIGA method, the mass is 1207.33 t, indicating a reduction of 20.47 t, or 1.67%. These optimizations involve thickening sensitive members while reducing the thickness of nonsensitive rods, which enhances the structural strength of the vessel, reduces its weight, and potentially lowers costs.
5. Conclusions
In this paper, we conduct an analysis of wave loads under adverse operational conditions and investigate the sensitivity of structural stresses to wave-induced effects. This analysis is performed using a direct hydrodynamic calculation method, with the goal of identifying critical areas of the hull structure and determining the most suitable breeding attitude. Subsequently, utilizing the equivalent design wave method and the design of the experimental parameter algorithm, we conduct a sensitivity analysis of areas prone to damage and assess the influence of each structural element on strength and overall weight under the most severe wave conditions. Consequently, nonsensitive structural components are disregarded, and the sensitive ones are considered design variables. The research concludes with a multiobjective optimization involving stress, deformation, and total weight. Two optimization algorithms, the ASA and the MIGA, are employed, and their results are cross-checked and compared. The key findings include the following:
- The hydrodynamic calculations accurately assess the bending moments and torques induced by waves, which are notably lower for the truss-floating tank aquaculture vessel due to its light weight and water-permeable nature compared with conventional ships.
- Under the most severe wave conditions, critical stress areas are identified at the joint between the left and right longitudinal trusses and the central beam. The maximum deformation is observed under the highest wave torque. Therefore, particular attention should be given to addressing torsional challenges when navigating oblique waves for this type of vessel.
- Different positions and sizes of beam members in the truss structure undergo a buckling strength check. The outcomes reveal that the 12 mm and 8 mm components at the connection between the left and right longitudinal trusses and the central beam have either exceeded or nearly reached the safe limits, suggesting potential buckling failure. Consequently, the ship’s structure is optimized based on these findings.
- The sensitivity analysis identifies the sensitive and nonsensitive components. Strengthening sensitive components and reducing the nonsensitive ones can enhance structural strength or reduce vessel weight.
- The optimization process reveals that MIGA appears slightly superior to the ASA algorithm, albeit at the cost of increased computational time. As a result, an efficient approach would involve an initial rough optimization using ASA to quickly assess optimal configurations, followed by the application of the more time-consuming MIGA method for fine-tuning.
Author Contributions
Conceptualization, P.X. and Y.Z. (Yuan Zhang); methodology, Y.Z. (Yuchen Zhang); software, Y.Z. (Yuchen Zhang) and J.Z.; validation, Y.Z. (Yuchen Zhang), J.Z. and Y.Z. (Yuan Zhang); formal analysis, Y.Z. (Yuchen Zhang), J.Z. and C.J.; investigation, Y.Z. (Yuchen Zhang) and J.Z.; resources, P.X.; data curation, Y.Z. (Yuchen Zhang); writing—original draft preparation, Y.Z. (Yuchen Zhang) and Y.Z. (Yuan Zhang); writing—review and editing, Z.Z., P.X. and C.J.; visualization, Y.Z. (Yuchen Zhang); supervision, C.J., Z.Z., P.X. and Y.Z. (Yuan Zhang); project administration, P.X.; funding acquisition, P.X. All authors have read and agreed to the published version of the manuscript.
Funding
This work was supported by the National Natural Science Foundation of China (NSFC: 52301342).
Institutional Review Board Statement
Not applicable.
Informed Consent Statement
Not applicable.
Data Availability Statement
Data are contained within the article.
Conflicts of Interest
Author Ji Zhang was employed by the company Zhejiang Yangfan General-Use Machinery Manufacturing Co. Ltd. The remaining authors declare that the research was conducted in the absence of any commercial or financial relationships that could be construed as a potential conflict of interest.
References
- Xiao, K.; Chen, Z. Numerical simulation of aquaculture ship motions coupled with tanks sloshing in time domain. Chin. J. Ship Res. 2020, 15, 136–144. [Google Scholar]
- Zhao, Y.; Guan, C.; Bi, C.; Liu, H.; Cui, Y. Experimental investigations on hydrodynamic responses of a semi-submersible offshore fish farm in waves. J. Mar. Sci. Eng. 2019, 7, 238. [Google Scholar] [CrossRef]
- Xin, X. Loading Method & Load Adjustment Method in Direct Calaulaton of Whole Hull Structural Strength. Master’s Thesis, Shanghai Jiao Tong University, Shanghai, China, 2017. [Google Scholar]
- Rui, Y. Structure Strength Analysis of 1200 t Crane Ship. Master’s Thesis, Jiangsu University of Science and Technology, Zhenjiang, China, 2018. [Google Scholar]
- Tao, N.; Zhang, Y.; Qiao, G.; Chi, S. Longitudinal strength design analysis of deep-sea mining vessel. Ship Eng. 2020, 42, 24–28. [Google Scholar] [CrossRef]
- Wang, C.; Wu, J.; Wang, D. Experimental and numerical investigations on the ultimate longitudinal strength of an ultra large container ship. Ocean Eng. 2019, 192, 106546. [Google Scholar] [CrossRef]
- Liu, H.Y.; Huang, X.H.; Wang, S.M.; Hu, Y.; Yuan, T.P.; Guo, G.X. Evaluation of the structural strength and failure for floating collar of a single-point mooring fish cage based on finite element method. Aquac. Eng. 2019, 85, 32–48. [Google Scholar] [CrossRef]
- Yanagimoto, F.; Sugimoto, K.; Ishibashi, K. Numerical investigation of dry bulk cargo load during ship vertical motion. Ocean Eng. 2022, 266, 112970. [Google Scholar] [CrossRef]
- Liu, Y.; Shi, W.; Wang, W.; Li, X.; Qi, S.; Wang, B.; Michailides, C. Investigation on the interaction between ice and monopile offshore wind turbine using a coupled CEM–FEM model. Ocean Eng. 2023, 281, 114783. [Google Scholar] [CrossRef]
- Zhao, N.; Chen, B.Q.; Zhou, Y.Q.; Li, Z.J.; Hu, J.J.; Soares, C.G. Experimental and numerical investigation on the ultimate strength of a ship hull girder model with deck openings. Mar. Struct. 2022, 83, 103175. [Google Scholar] [CrossRef]
- Yang, P.; Feng, Q.; Chen, H.; Wen, L. Combined backbone application on numerical simulations and a model experiment of a 20,000 TEU container ship. Ocean Eng. 2021, 223, 108662. [Google Scholar] [CrossRef]
- Bakica, A.; Malenica, Š.; Vladimir, N. Hydro-structure coupling of CFD and FEM-Quasi-static approach. Ocean Eng. 2020, 217, 108118. [Google Scholar] [CrossRef]
- Manikandan, P.; Arun, N. Behaviour of partially closed stiffened cold-formed steel compression member. Arab. J. Sci. Eng. 2016, 41, 3865–3875. [Google Scholar] [CrossRef]
- Panda, S.K.; Ramachandra, L. Buckling of rectangular plates with various boundary conditions loaded by non-uniform inplane loads. Int. J. Mech. Sci. 2010, 52, 819–828. [Google Scholar] [CrossRef]
- Liu, Y.; Wang, Q. Computational study of strengthening effects of stiffeners on regular and arbitrarily stiffened plates. Thin-Walled Struct. 2012, 59, 78–86. [Google Scholar] [CrossRef]
- Bedair, O.K. A contribution to the stability of stiffened plates under uniform compression. Comput. Struct. 1998, 66, 535–570. [Google Scholar] [CrossRef]
- Taysi, N. Determination of thickness and stiffener locations for optimization of critical buckling load of stiffened plates. Sci. Res. Essays 2010, 5, 897–910. [Google Scholar]
- Cheng, M.Y.; Prayogo, D.; Wu, Y.W.; Lukito, M.M. A Hybrid Harmony Search algorithm for discrete sizing optimization of truss structure. Autom. Constr. 2016, 69, 21–33. [Google Scholar] [CrossRef]
- Li, L.; Huang, Z.; Liu, F. A heuristic particle swarm optimization method for truss structures with discrete variables. Comput. Struct. 2009, 87, 435–443. [Google Scholar] [CrossRef]
- Kaveh, A.; Talatahari, S. A particle swarm ant colony optimization for truss structures with discrete variables. J. Constr. Steel Res. 2009, 65, 1558–1568. [Google Scholar] [CrossRef]
- Ho-Huu, V.; Nguyen-Thoi, T.; Vo-Duy, T.; Nguyen-Trang, T. An adaptive elitist differential evolution for optimization of truss structures with discrete design variables. Comput. Struct. 2016, 165, 59–75. [Google Scholar] [CrossRef]
- Xiang, B.W.; Chen, R.Q.; Zhang, T. Optimization of trusses using simulated annealing for discrete variables. In Proceedings of the 2009 International Conference on Image Analysis and Signal Processing, Linhai, China, 11–12 April 2009; pp. 410–414. [Google Scholar]
- Miguel, L.F.F.; Lopez, R.H.; Miguel, L.F.F. Multimodal size, shape, and topology optimisation of truss structures using the Firefly algorithm. Adv. Eng. Softw. 2013, 56, 23–37. [Google Scholar] [CrossRef]
- He, S.X. Truss optimization with frequency constraints using the medalist learning algorithm. In Structures; Elsevier: Amsterdam, The Netherlands, 2023; Volume 55, pp. 1–15. [Google Scholar]
- Khatibinia, M.; Yazdani, H. Accelerated multi-gravitational search algorithm for size optimization of truss structures. Swarm Evol. Comput. 2018, 38, 109–119. [Google Scholar] [CrossRef]
- Mortazavi, A. A new fuzzy strategy for size and topology optimization of truss structures. Appl. Soft Comput. 2020, 93, 106412. [Google Scholar] [CrossRef]
- Zhang, Y.; Zhang, Z. Calculation and analysis of fatigue strength of truss-floating box aquaculture vessels. Proc. J. Phys. Conf. Ser. 2023, 2455, 012014. [Google Scholar] [CrossRef]
- Zhang, Y.; Zhang, Z.; Xu, P. Wave Load and Strength Analysis of Truss-Floating Box Aquaculture Vessel. Proc. J. Phys. Conf. Ser. 2023, 2541, 012008. [Google Scholar] [CrossRef]
- Inspection Guidelines for the Offshore Aquaculture Facilities; Technical Report; China Classification Society: Beijing, China, 2019.
- Kirkpatrick, S.; Gelatt, C.D., Jr.; Vecchi, M.P. Optimization by simulated annealing. Science 1983, 220, 671–680. [Google Scholar] [CrossRef]
- Rules for Building and Classing Marine Vessels; Technical Report; American Bureau of Shipping: Spring, TX, USA, 2022.
- Requirements for Buckling and Ultimate Strength Assessment 372 for Offshore Structures; Technical Report; American Bureau of Shipping: Spring, TX, USA, 2022.
- CCS. Offshore Floating Unit Classification Specification; China Communications Press: Beijing, China, 2020. [Google Scholar]
- CCS. Guide for Assessment of Buckling Strength of Offshore Engineering Structures; China Communications Press: Beijing, China, 2015. [Google Scholar]
Disclaimer/Publisher’s Note: The statements, opinions and data contained in all publications are solely those of the individual author(s) and contributor(s) and not of MDPI and/or the editor(s). MDPI and/or the editor(s) disclaim responsibility for any injury to people or property resulting from any ideas, methods, instructions or products referred to in the content. |
© 2023 by the authors. Licensee MDPI, Basel, Switzerland. This article is an open access article distributed under the terms and conditions of the Creative Commons Attribution (CC BY) license (https://creativecommons.org/licenses/by/4.0/).