Article

Analysis of the Wave Attenuating and Dynamic Behaviour of a Floating Breakwater Integrating a Hydro-Pneumatic Energy Storage System

1
Department of Mechanical Engineering, University of Malta, MSD 2080 Msida, Malta
2
Institute for Sustainable Energy, University of Malta, MXK 1531 Marsaxlokk, Malta
3
FLASC B.V., Paardenmarkt 1, 2611 PA Delft, The Netherlands
*
Author to whom correspondence should be addressed.
J. Mar. Sci. Eng. 2023, 11(11), 2189; https://doi.org/10.3390/jmse11112189
Submission received: 17 October 2023 / Revised: 10 November 2023 / Accepted: 15 November 2023 / Published: 17 November 2023
(This article belongs to the Special Issue Offshore Structures and Hydrodynamic Modeling)

Abstract

:
Floating breakwaters have recently been generating increasing interest as a vital means to provide shelter and protect the ever-increasing number of structures deployed at sea. Notwithstanding the novel ideas being put forward, to date, floating breakwater deployment has been limited to inshore and shallow water areas. The scale of such structures has been restricted to the smaller spectrum. Furthermore, whilst some concepts to integrate floating breakwaters with other offshore systems have been proposed to benefit from cost-sharing strategies, studies related to floating breakwaters integrating energy storage are lacking in the open literature. The present research investigates the wave attenuating and dynamic performance of a large-scale floating breakwater in deep seas with a hydro-pneumatic energy storage system also integrated within the structure. This article highlights the arising need for floating breakwaters and sheds light on the present-day technological status of floating wave breakers. It then lays the ground for the proposed, novel floating breakwater concept that aims to address the current knowledge gaps in this field of study. The simulation results generated from numerical modelling via the potential flow solver ANSYS® AQWA™ have been promising, connoting that the addition of hydro-pneumatic energy storage to a floating breakwater will not lead to a degradation in the dynamic performance or wave breaking efficiency of the floating structure.

1. Introduction

Ambitious targets [1,2] are being set by policy makers worldwide in a quest to mitigate the repercussions of climate change and develop climate neutral communities with net-zero greenhouse gas (GHG) emissions. Countries are rapidly shifting towards renewable energy sources (RES) as the main alternative to burning fossil fuels for energy production. Wind and solar energy conversion technologies are at the forefront of decarbonization. Together, these renewable energy (RE) technologies have accounted for a record of 12% of the global electricity generated in 2022 [3]. The intermittency in wind and solar power, however, leads to multiple instances of either insufficient (i.e., not enough to meet demand) or excess (i.e., surplus to requirements) RE supplies, posing significant risks to the stability and security of power transmission and the energy supply system in its entirety. In recent years, energy storage systems (ESSs) have been regarded as a key solution to alleviate the resultant mismatch in renewable power production. ESSs can absorb the unpredictable power signal from the RES and dispatch it as a schedulable supply of power when required.
As the shift towards the use of RES accelerates to sustain an ever-growing fraction of global electricity, the demand for reliable, large, utility-scale energy storage applications intensifies in a parallel manner. In a domino-effect, a land–energy nexus arises as the production, storage and utilization of energy all demand a substantial allocation of land [4]. Faced with limited land resources, the oceans are now being explored for multiple purposes, including RE production [5,6] and storage [7,8]. Shallow coastal areas are already becoming spatially restricted due to multiple users. Consequently, the deep waters are being targeted for the provision of an offshore energy mix.
While RES are abundantly available offshore, significant engineering challenges arise pertaining to the deployment, operation and maintenance of RE devices at sea. A case in point is floating offshore photovoltaics [9,10] that are constrained to having a large water plane area to maximize their energy conversion efficiency at the expense of a high exposure to wave loads. Furthermore, sea faring vessels undertaking maintenance works offshore, for example, at offshore wind farms, may be constrained to return to the base under very rough weather conditions. In an effort to provide improved solutions to adequately protect the ever-increasing marine infrastructure and berthed vessels alike, engineers have been exploring the feasibility of various new breakwater concepts. The fundamental purpose of a breakwater is to attenuate waves and offer protection to coastal areas, harbours, marine craft and installations at sea. With deployments transitioning towards deep oceanic sites, floating breakwaters (FBWs) are being perceived as an attractive opportunity to enable the creation of sheltered areas in deeper seas and to facilitate multi-purpose offshore activities related to RE generation.
The present research explores a novel FBW concept that integrates a hydro-pneumatic energy storage (HPES) system. This study aims to contribute a sound understanding of a multi-use floating structure serving two different roles; (1) to mitigate the harsh wave action to provide shelter to the marine RE technologies, ships and other marine vessels and (2) to cater for medium- to long-duration energy storage (LDES) (>4 h) systems to address the intermittency issues arising from offshore wind and solar energy harvesting. The upcoming section presents a literature review focusing on the existing and emerging FBW technologies and identifies a number of knowledge gaps that need to be addressed. Section 3 defines the proposed novel solution and main configurations that seek to provide an answer to present-day uncertainties. Section 4 describes the methodology adopted, followed by the validation and numerical accuracy investigations in Section 5. Next, the discussion of the results is documented in Section 6. The salient conclusions gathered from the different investigations are finally summarized in Section 7.

2. Current Research and Technological Status

Independent entities are spearheading research to narrow the knowledge gaps and enrich the expertise related to various FBW technologies. Some researchers have sought to perform FBW design optimizations via numerical computations [11,12]. Others took the investigations a step further by introducing geometry modifications and performing physical testing on scaled models in laboratories [13,14,15]. Apart from exploring the effect of attachments or modifications on conventional, rectangular designs, hybrid ideas have also been growing in popularity. Indeed, concepts of combining FBWs with marine ecosystems [16,17] and offshore RE [18,19] are gaining traction quite rapidly. The aforementioned hybridizations do not only provide structural and performance benefits, but they also contribute towards the sustainable and economic development of the oceans through cost- and space-sharing solutions.
The well-established theories and numerical simulations validated via several experimental campaigns over the years have provided significant confidence in certain concepts to develop on a commercial level. Box and pontoon configurations are amongst the highly popular designs for commercial-scale deployment. The latter typically consist of multiple modules connected together to form the desired length of barricade close to the shore. The constituent blocks generally have relatively small dimensions compared to large-scale offshore structures. For example, the 415 m long, box-type wave attenuator deployed in Burlington Marina on Lake Ontario, Canada, [20] comprises various units that measure up to 20 m in length and are approximately 5 m wide. The structures are moored with heavy chains connected to concrete anchors at water depths of up to 9 m. Similarly, the Swedish dock in Skärhamn [21] is sheltered by an 80 m long, L-shaped FBW composed of 20 m × 8 m × 3 m pontoons. The floating barrier acts as a defence mechanism for vessels berthing in a marina having a maximum sea depth of 4 m.
The new marina project at Darsena Pagliari, in La Spezia in Italy [22], is a further example of FBW structures that have materialized and been proven to be highly effective. The creation of the new floating assemblies in 2021 incorporated 20 m long units with widths varying between 8 and 10 m. A total of 21 modules arranged in a 12 × 9 configuration now provide shelter to about 850 berths in the Ligurian harbour. Likewise, a 95 m long FBW offers protection to the Port of Figueras, in Spain [23]. Pontoon-type sections characterized by a length of 19.90 m and a width of 4 m are interconnected and anchored by cable moorings at a deployment depth of 6.75 m.
Deployments of larger units floating on the seawater surface and without any rigid supports are very limited. The FBW of Kan-on in Hiroshima Port in Japan [24] is made up of five relatively larger structures as compared to the previous examples. Every module is 30 m × 30 m × 4 m high. The system is deployed in a fixed-floating configuration, supported on dolphin structures anchored at a depth of less than 15 m. Perhaps the largest FBW to date is that at La Condamine Port in Monaco [25]. The wave attenuator in the French harbour is composed of a single concrete slab measuring 352 m × 44 m × 24.5 m in height. One end of the FBW is connected to land via a couple of chains and a massive conical revolving joint. At the other end, the sea depth is 55 m below the mean seawater level (MSL) and the structure is moored in place by eight chains. The combined station-keeping system thus only allows the motion of the wave breaker in the three rotational degrees of freedom (DoFs).
In spite of reaching commercialization, market-ready solutions have thus far been limited in both scale and application. The full-scale systems represented by numerical models [11,12] or prototypes in experimental facilities [13,14,15] remained limited in size. Actual systems [20,21,22,23] are presently composed of multiple slabs, with relatively large structures being very scarce. Similarly, most of the deployments [20,21,22,23,24,25] in the marine space have thus far been located close to shorelines, in shallow water and near marinas intended to safeguard berthed vessels. To the best of the authors’ knowledge, the technologies have not yet been proven in the deep and open seas to protect the developing offshore infrastructure. Likewise, novel conceptualizations of hybrid solutions have mostly focused on incorporating wave energy convertors (WECs) [18,19] or marine bio-matter [16,17] within the wave-breaking unit, as outlined in the previous paragraphs. The concept of integrating an FBW with an offshore ESS is, however, lacking. To date, no study has yet attempted to explore the feasibility of FBWs as power banks to address the issue of intermittency in the production and supply of RE electricity.
Information relevant to the dynamic limits of FBWs is also lacking in offshore codes and standards [26]. Most of the reviewed documents [26,27,28,29] focus either on passenger comfort and avoidance of motion sickness or present calculations specific to marine craft that deviate substantially from the functionality of FBWs. The closest correlation that could be made to an FBW is that of a floating pontoon. In [30], Freeman also acknowledges the lack of standardized acceleration limits for the aforesaid offshore structures. The author establishes the most suitable peak safe motion limits (SMLs) to maintain a human’s postural stability to be 0.1 g in both the lateral and vertical directions. In another work [31], Freeman also assesses miniature floating breakwater prototypes in a laboratory environment. In both [30,31], the author remarks that the absolute maximum accelerations for a floating pontoon/breakwater were more than six times the 0.1 g SML in response to wave conditions, assimilating the wake from the marine craft.
The present study aims to address some of the above-mentioned knowledge gaps by investigating the behaviour of a large-scale FBW in deep seas. It assesses changes in the wave breaking and dynamic response of the structure prompted by the integration of an HPES technology. The outcomes from exclusively numerical simulations shall serve to provide insight and generate new knowledge addressing the current dearth in this field.

3. Proposed Concept

In order to establish the unlocking potential of the novel hybrid system, the characteristics of a similar system without an integrated ESS have to first be recognized. Consequently, two main configurations were considered, as presented in Figure 1 and Figure 2, and as discussed in Section 3.1 and Section 3.2.

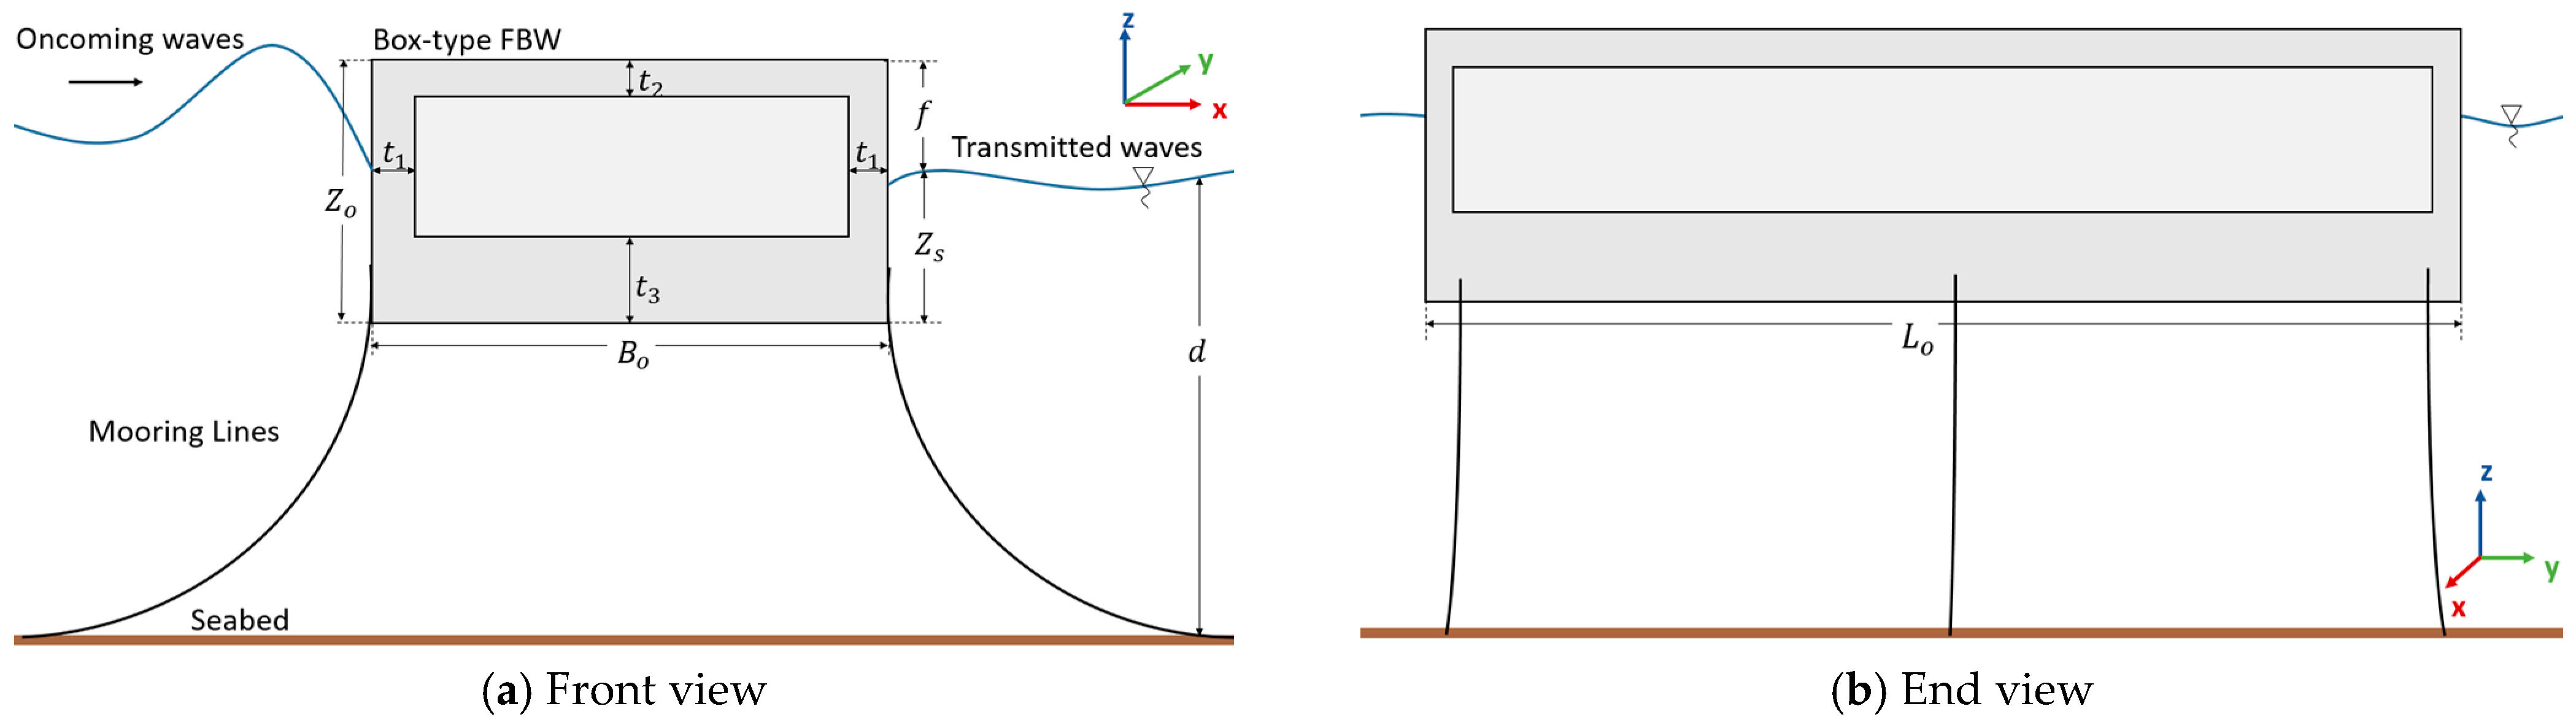
3.1. Baseline Floating Breakwater—Model A

The first model shown in Figure 1 is a stand-alone, conventional, box-type FBW unit comprising solely a steel-reinforced concrete floater module. The latter is characterized by geometric symmetry in all three planes (i.e., in the x–y, x–z and y–z planes) and attenuates wave energy via reflection. The baseline system, which will also be referred to as Model A, was set up to act as a reference for comparison purposes. Consequently, the changes in the overall response of the FBW brought about by the introduction of the HPES system in the novel model could be clearly identified.

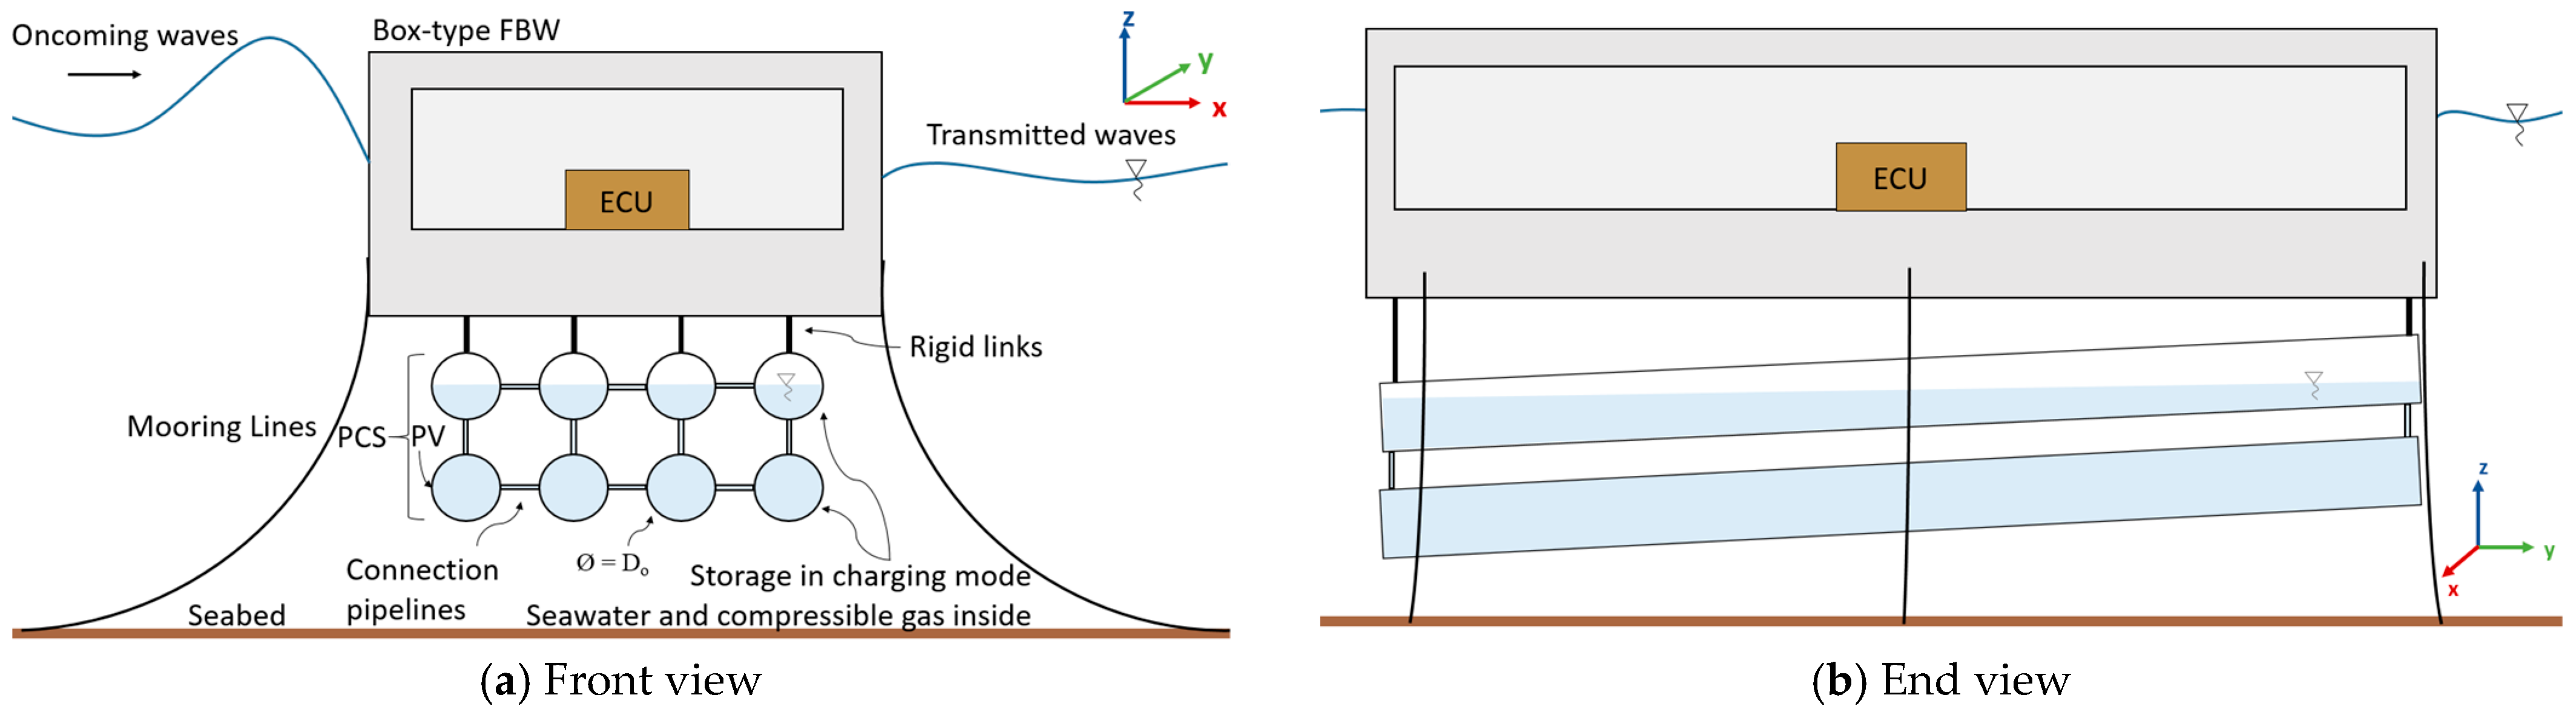
3.2. Hybrid Floating Breakwater—Model B

The novel hybrid concept is illustrated in Figure 2 and will also be referred to as Model B. The latter may be regarded as a hybrid system from a functional perspective on account of serving the dual role of creating sheltered spaces, whilst also storing energy from nearly offshore RE farms. Model B consists of two subsystems mainly, the FBW unit and the ESS. The latter, in turn, is composed of an Energy Conversion Unit (ECU) and a Pressure Containment System (PCS), as detailed in the following sections.

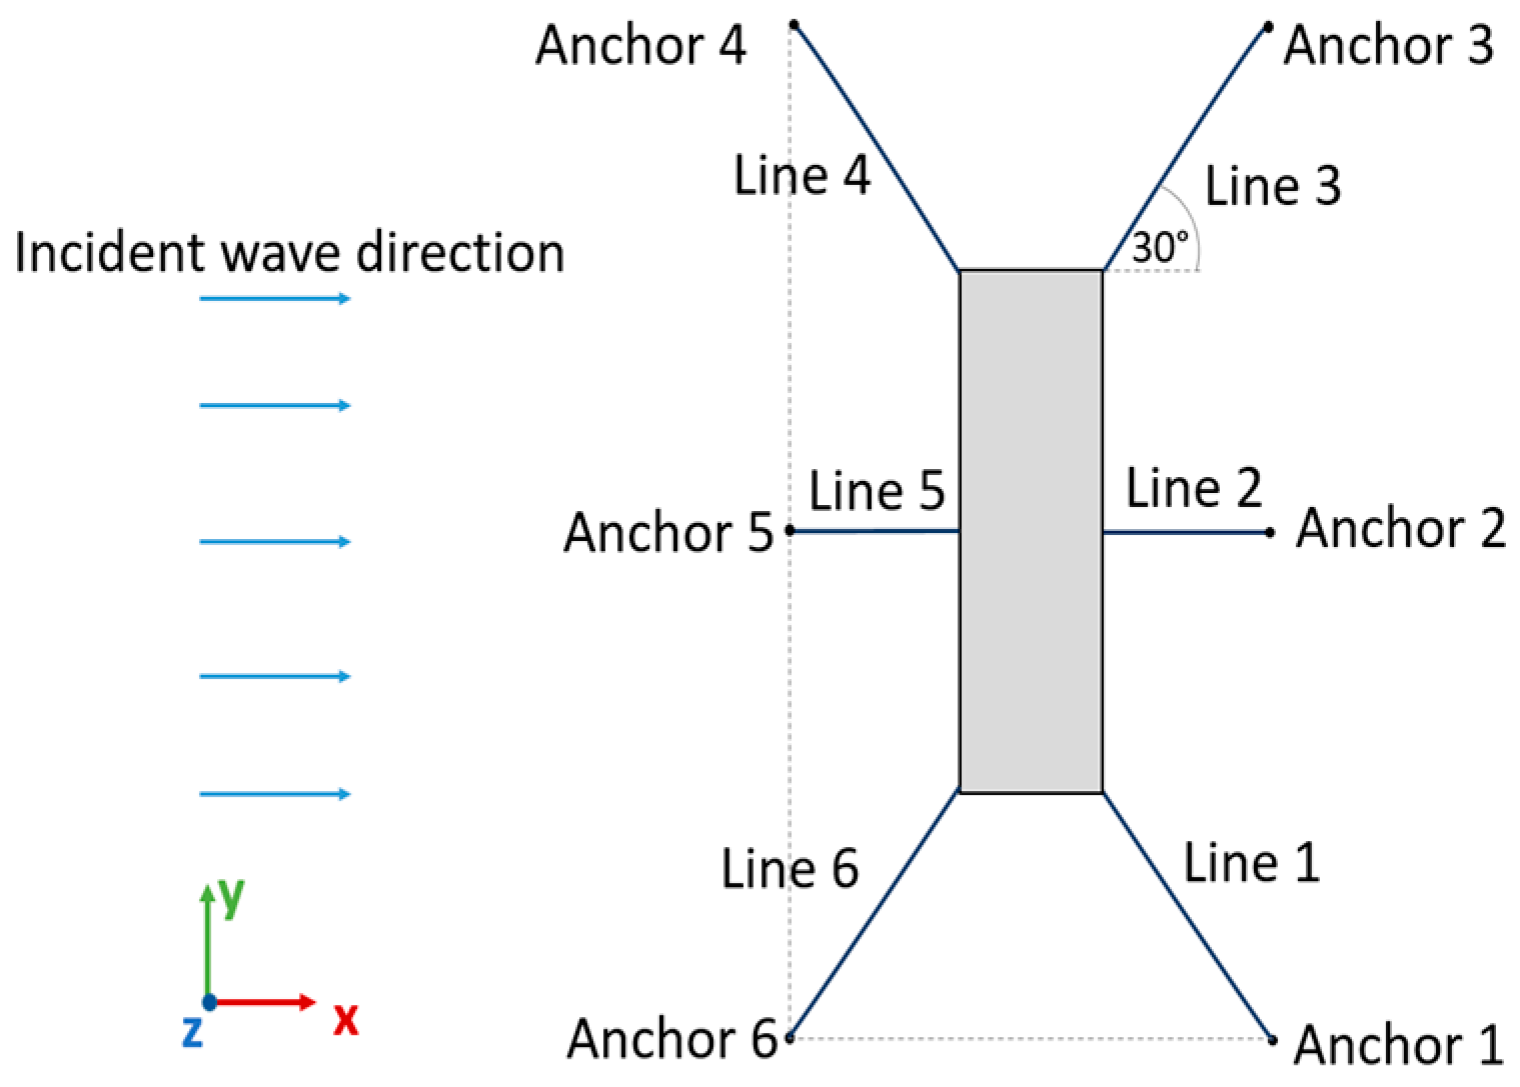
3.2.1. The Floating Breakwater Unit

The upper floater module is identical to that of Model A and acts as the main wave attenuating device, providing sheltered areas for offshore infrastructure, vessels and other activities at sea. Additionally, the inner empty core provides a space for the stowage and protection of the ECU.

3.2.2. The Energy Storage System

The HPES system being considered in the present research is specifically the developing FLASC technology [8], which is intended for offshore applications. It utilizes the surrounding seawater as a natural heat sink/source to maintain quasi-isothermal conditions and subsequently to attain exceptionally high thermal efficiencies [8]. The concept of the operation is based on a combination of pumped-hydro and compressed-air storage. Surplus energy harnessed from the floating wind turbines and solar panels situated in the area sheltered by the hybrid FBW can be stored in the HPES system co-located offshore. Initially, the system is pre-charged with a compressible gas (e.g., air or nitrogen) to a stipulated pressure to provide an initial load for the hydraulic circuit that connects to the storage. The excess energy generated by the RES operates a pump–turbine (P-T) that pumps seawater into the storage vessels. The injection of seawater thus compresses the gas inside the system, thereby storing the surplus energy. When the RE being generated fails to satisfy a pre-determined energy level at any instance, the stored compressed gas inside the HPES system is allowed to expand by releasing the seawater through the P-T which now operates in turbine mode. The turbine nozzle expels the stored fluid at high pressure, with the shaft converting the hydraulic power into electricity [8].
The ECU controls all the operations of the HPES system. It mainly comprises the P-T or a separate pump and Pelton turbine. A filtration system is also incorporated to remove large particles in the intake to prevent any damage to the system. Other components and electronics that are essential for operation and control are also included as part of the ECU. In order to ensure seawater flow to the P-T at all instances during the discharging cycle, the input flow shall be supplied from the lower row of pressure vessels (PVs). To minimize the influence of sloshing and prevent air from ending up in the hydraulic circuit and P-T, the PVs shall be slightly inclined to horizontal, as depicted in Figure 2b. Hence, the PCS outlet feeding the hydraulic machinery shall be situated at one end of the PVs occupying the relatively quiescent seawater that is constantly available. The detailed operation of the ECU is beyond the scope of the subject research. Hence, for modelling purposes, the ECU shall be treated as a black box and modelled as a point mass. The latter shall be located towards the middle of the FBW to minimize the effects of floater motions, which subsequently induce additional loads on the rotating P-T.
Whilst the ECU is enclosed within the FBW structure, the PCS is integrated within the hybrid model in the form of a pressure vessel bundle (PVB) suspended from the FBW via rigid links as illustrated in Figure 2. The PVs are assumed to be hydraulically interconnected via piping, forming as a single storage unit. The primary aim of the multitude of PVs is to store RE via a liquid piston mechanism (i.e., seawater compressing a gas), to be utilized when and as required. From a thermodynamic perspective, the array of cylindrical vessels also assimilates a heat exchanger mechanism. The concept of multiple vessels increases the contact surface area over and around which the external seawater can flow. Consequently, the heat transfer during operation is expected to be enhanced, allowing the HPES system to achieve quasi-isothermal conditions for the energy storage process. The structural contribution of the storage cylinders might provide additional functionality of the PCS that shall be explored throughout the research. The PVs may be able to assist in obstructing the wave energy and thus improve the wave attenuating performance of the FBW.

4. Methodology

Prior to assessing Models A and B numerically, simulations using the potential flow solver, ANSYS® AQWA™, Version 2022 R2, were carried out for validation and repeatability purposes of the software tool. Investigations to minimize the uncertainty of results were also performed. The procedures undertaken are detailed further in Section 5.
The investigation of FBWs then commenced by firstly establishing the geometry and design of the FBW. The box-type configuration was noted to be ideal to accommodate both the ECU (internally) and the PCS (externally). The values of the dimensions indicated in Figure 1, more specifically, the length Lo, width Bo, height Zo and wall thicknesses t1, t2 and t3 were obtained through an iterative, design optimization exercise. The latter procedure considered the influence of dimensional changes on the hydrostatic stability and wave breaking behaviour. Extensive details of the FBW design optimization can be found in [32]. The sizing of the floater was followed by the sizing of the ESS, or more precisely, of the PCS. The details of the PCS sizing are outlined in Section 6.1. The same section also outlines the hydrostatic check that was performed through the application of Archimedes law, to ensure that the structure was still able to float freely following the integration of the ESS, in both fully discharged and fully charged states.
Next, both Models A and B (refer to Figure 1 and Figure 2) were independently modelled in the aforesaid industry-standard package, ANSYS® AQWA™, which is used for a vast range of maritime engineering applications [33]. The potential flow theory is extensively detailed in the literature, and thus, the mathematical representation is not being repeated in the present article. The theory is available in the ANSYS® AQWA™ theory manual [33] and other open literature sources [34,35].
Despite the inability to model viscous effects, AQWA™ allows the modelling of drag loads on slender bodies via the addition of elements based on a linearized Morison drag term:
d F d r a g = 1 2 ρ D C d α u r m s u f u s
In Equation (1), Fdrag is the drag load, ρ is the density of the fluid (i.e., seawater), D is the characteristic dimension of the body and Cd is the drag coefficient that is typically determined from the Reynolds (Re) and Keulegan–Carpenter (KC) numbers. Moreover, α is the linearization factor, urms is the root mean square (RMS) of the transverse directional relative velocity and uf and us are the fluid and structure velocities, respectively. For simulations incorporating Model A, the inclusion of Equation (1) was not essential due to the system being classified as a large volume structure whereby the loads induced on the floater were identified to be inertia- and/or diffraction-dominated. Conversely, for Model B, the viscous loads on the cylindrical structures became relatively significant. Consequently, line elements with a Cd of 0.65 [36] were added to the PVs within the hybrid model to correct for the shortcoming of the inviscid potential flow. The quoted value of Cd was derived from computations neglecting shielding effects and in accordance with Clause 6.7 of the DNVGL-RP-C205 Standard [36].
After successfully setting up the models in the AQWA™ Suite, both aforesaid FBW structures were investigated to firstly reconfirm the hydrostatic characteristics, followed by an analysis in the Hydrodynamic Diffraction (HD) module in the frequency domain. Both fixed-floating (i.e., AQWA™ Structure Fixity setting set to Structure is fixed in place) and free-floating (i.e., AQWA™ Structure Fixity setting set to Structure is free to move) arrangements were modelled to obtain the two extremities in the range of the FBW behaviour, since the HD module does not incorporate mooring line effects. Readings of wave heights downstream of the FBWs were taken from the post-processing tool AQWA™ Graphical Supervisor (GS). The transmission coefficient K t and percentage wave breaking efficiency η of the FBWs for a range of incident wave periods were computed using Equations (2) and (3), respectively. In Equation (2), H t and H i are the transmitted wave height and incident wave height, respectively. Results obtained from the HD module are presented and discussed in Section 6.2.
K t = H t H i
η = 100 1 K t
Next, a hydrodynamic response (HR) investigation was performed to obtain an understanding of the dynamic behaviour of the baseline and hybrid FBWs under different sea conditions. For the purpose of the time response analysis, only free-floating units under the effects of mooring lines were considered. Indeed, a high-stiffness catenary mooring system was added to Models A and B to station the structures afloat at 200 m vertically above the seabed. The results obtained from the HR analysis are interpreted in Section 6.3.

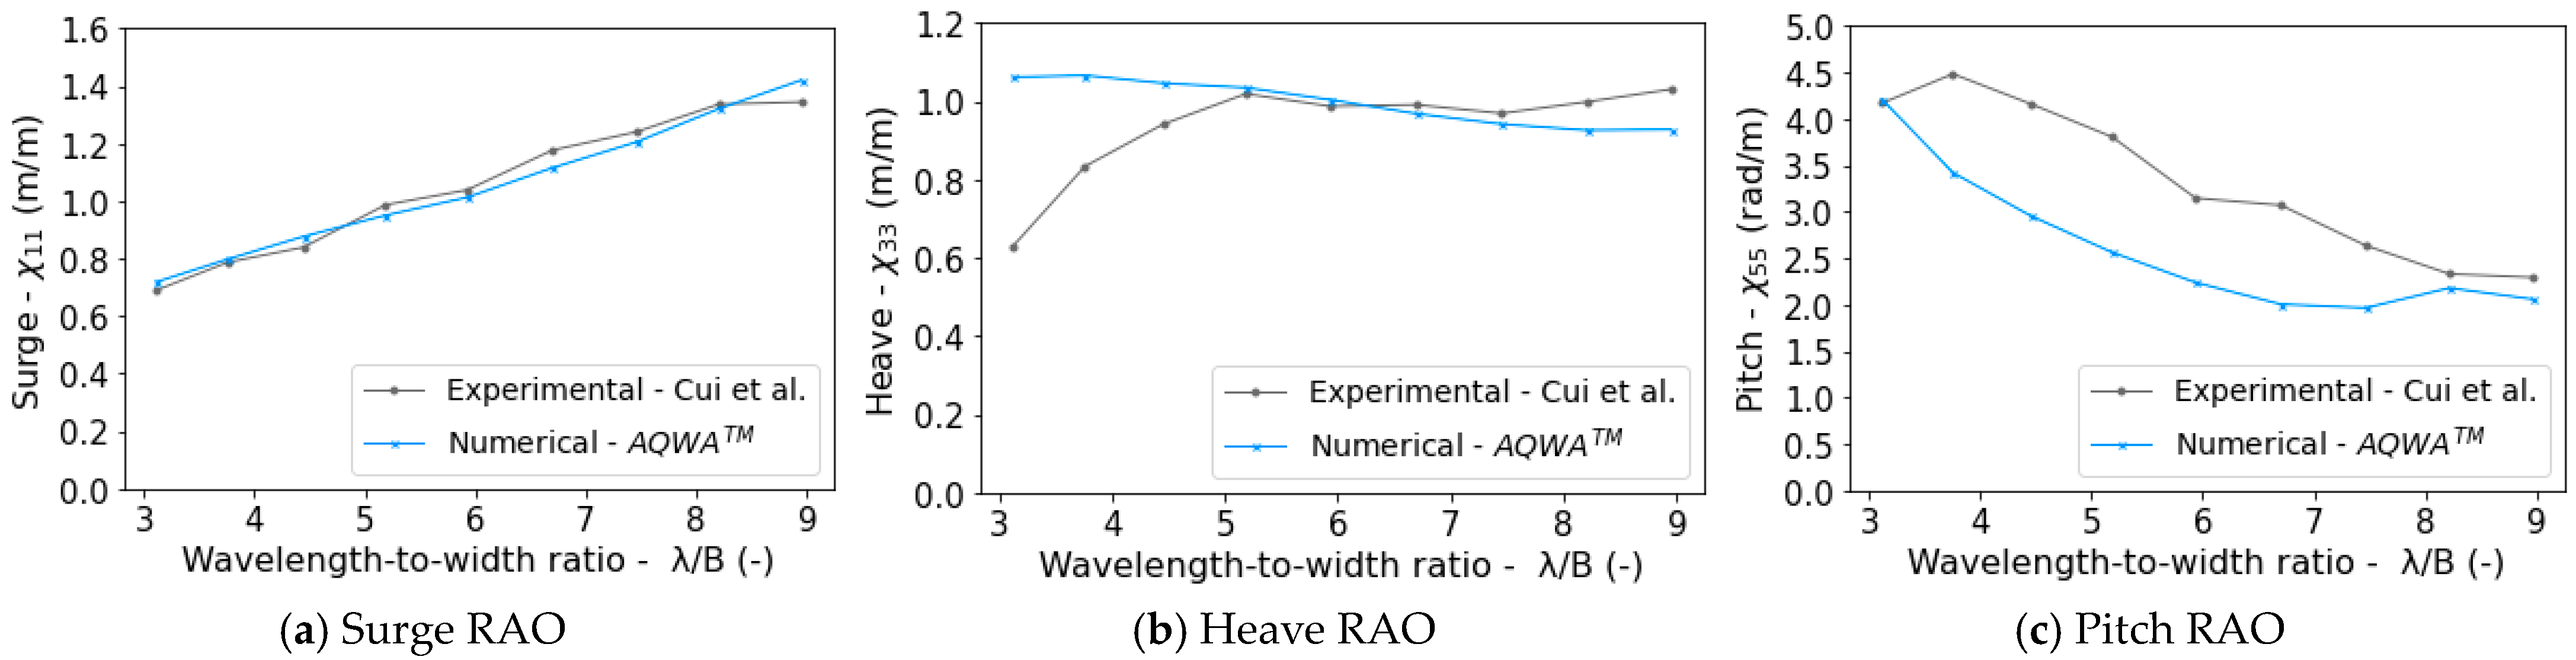
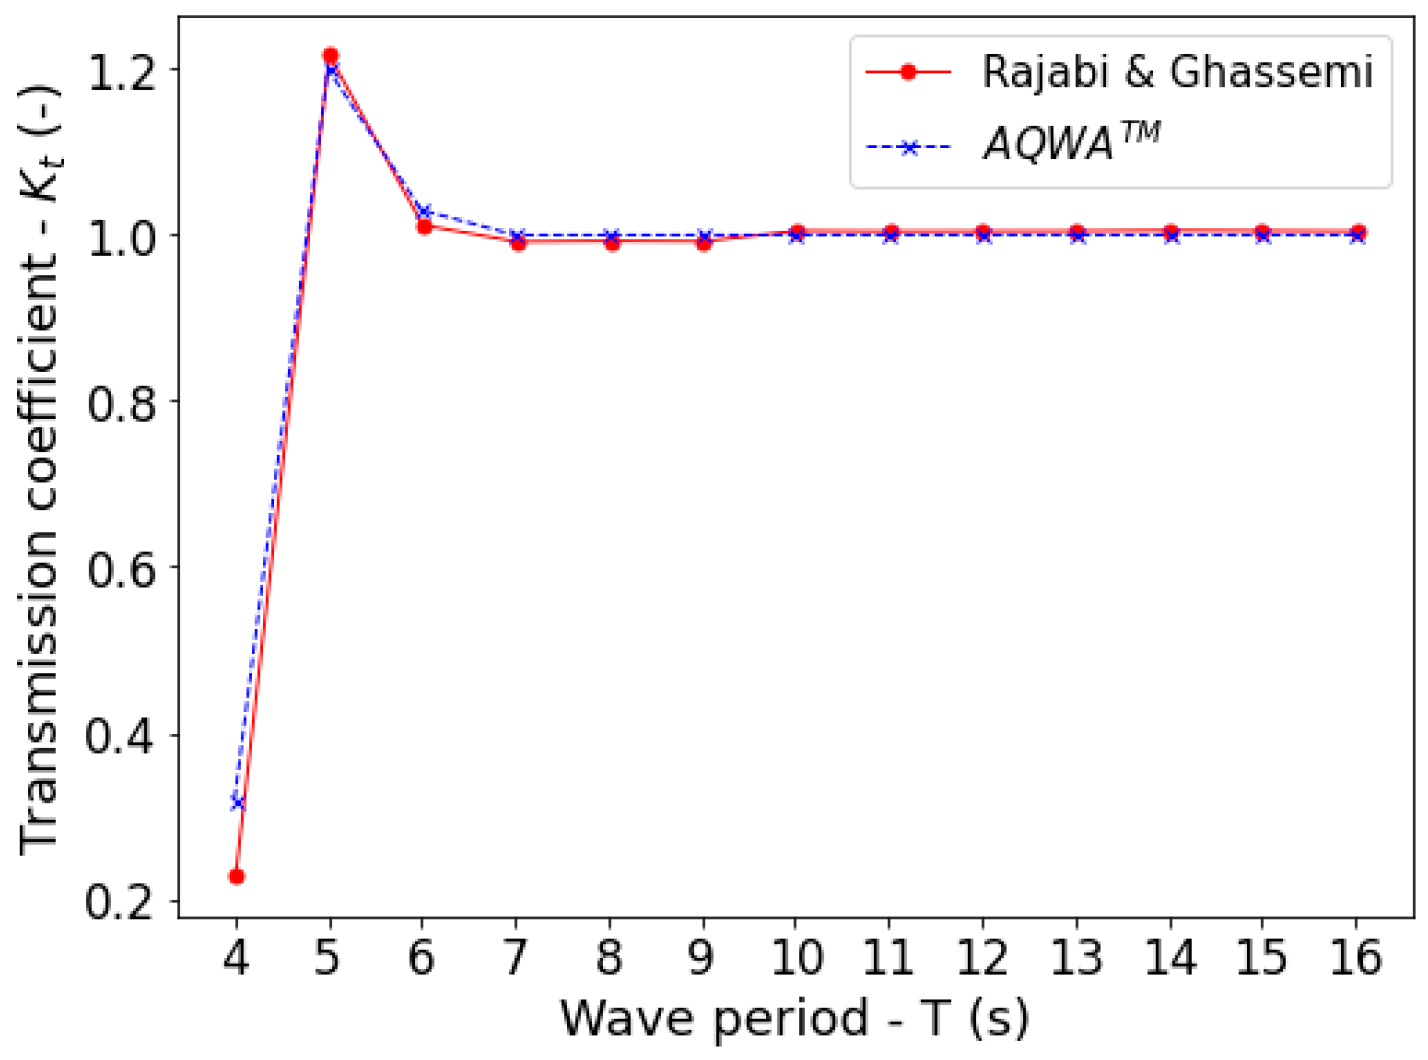
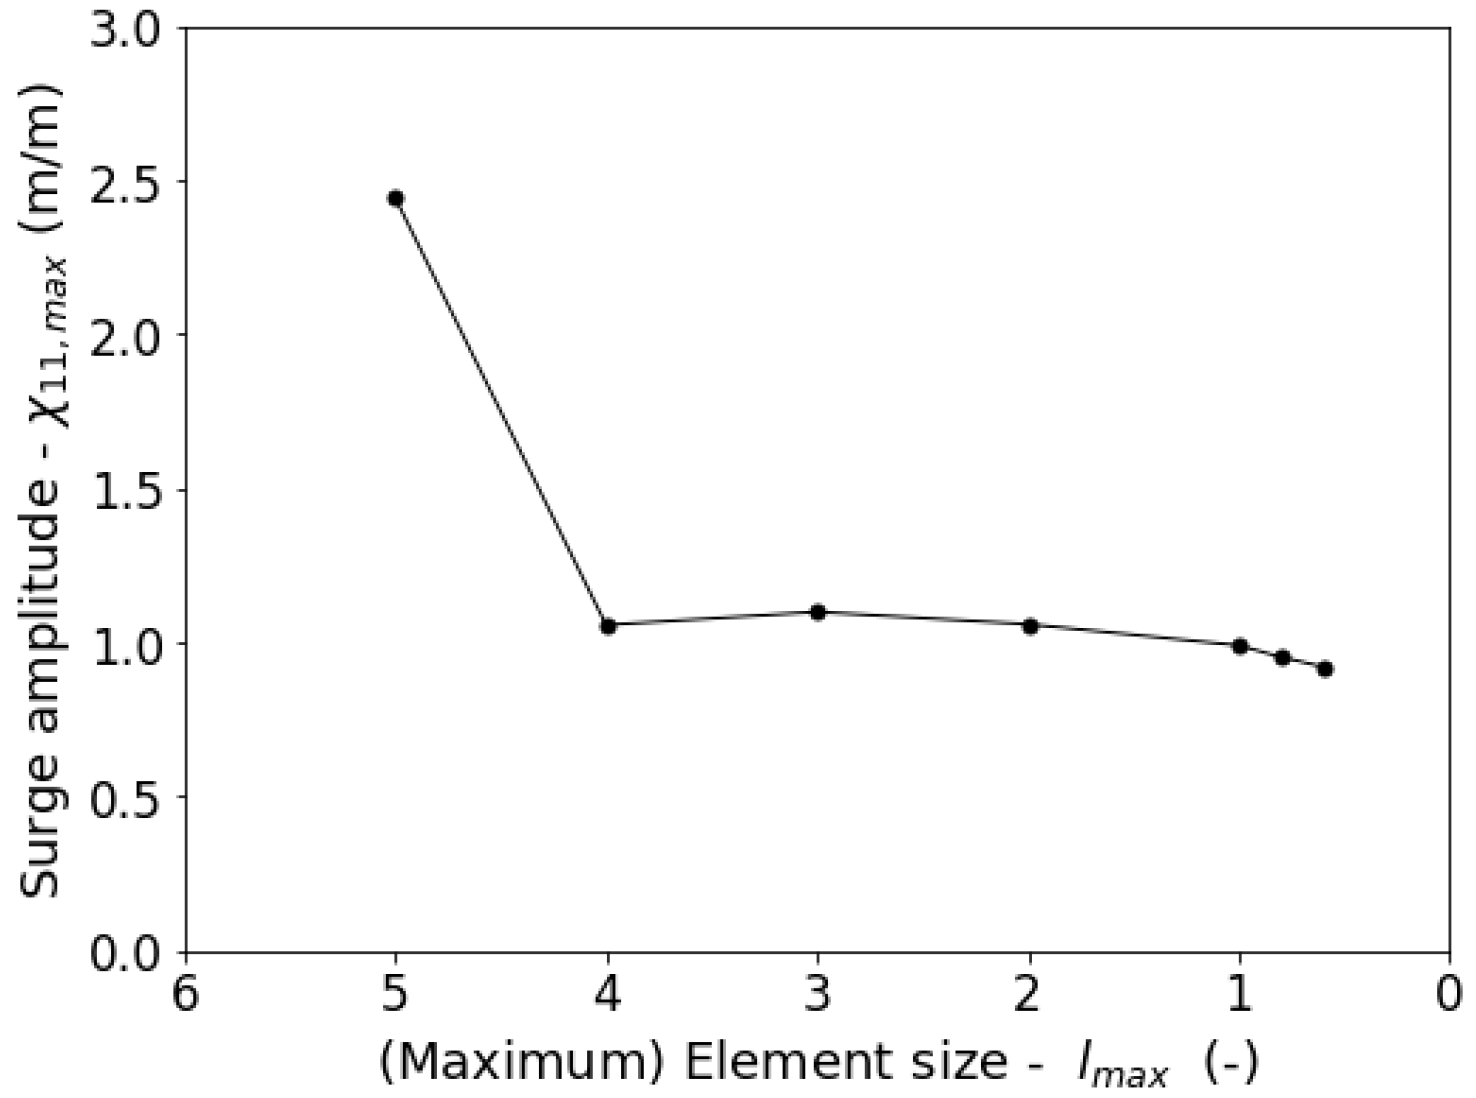
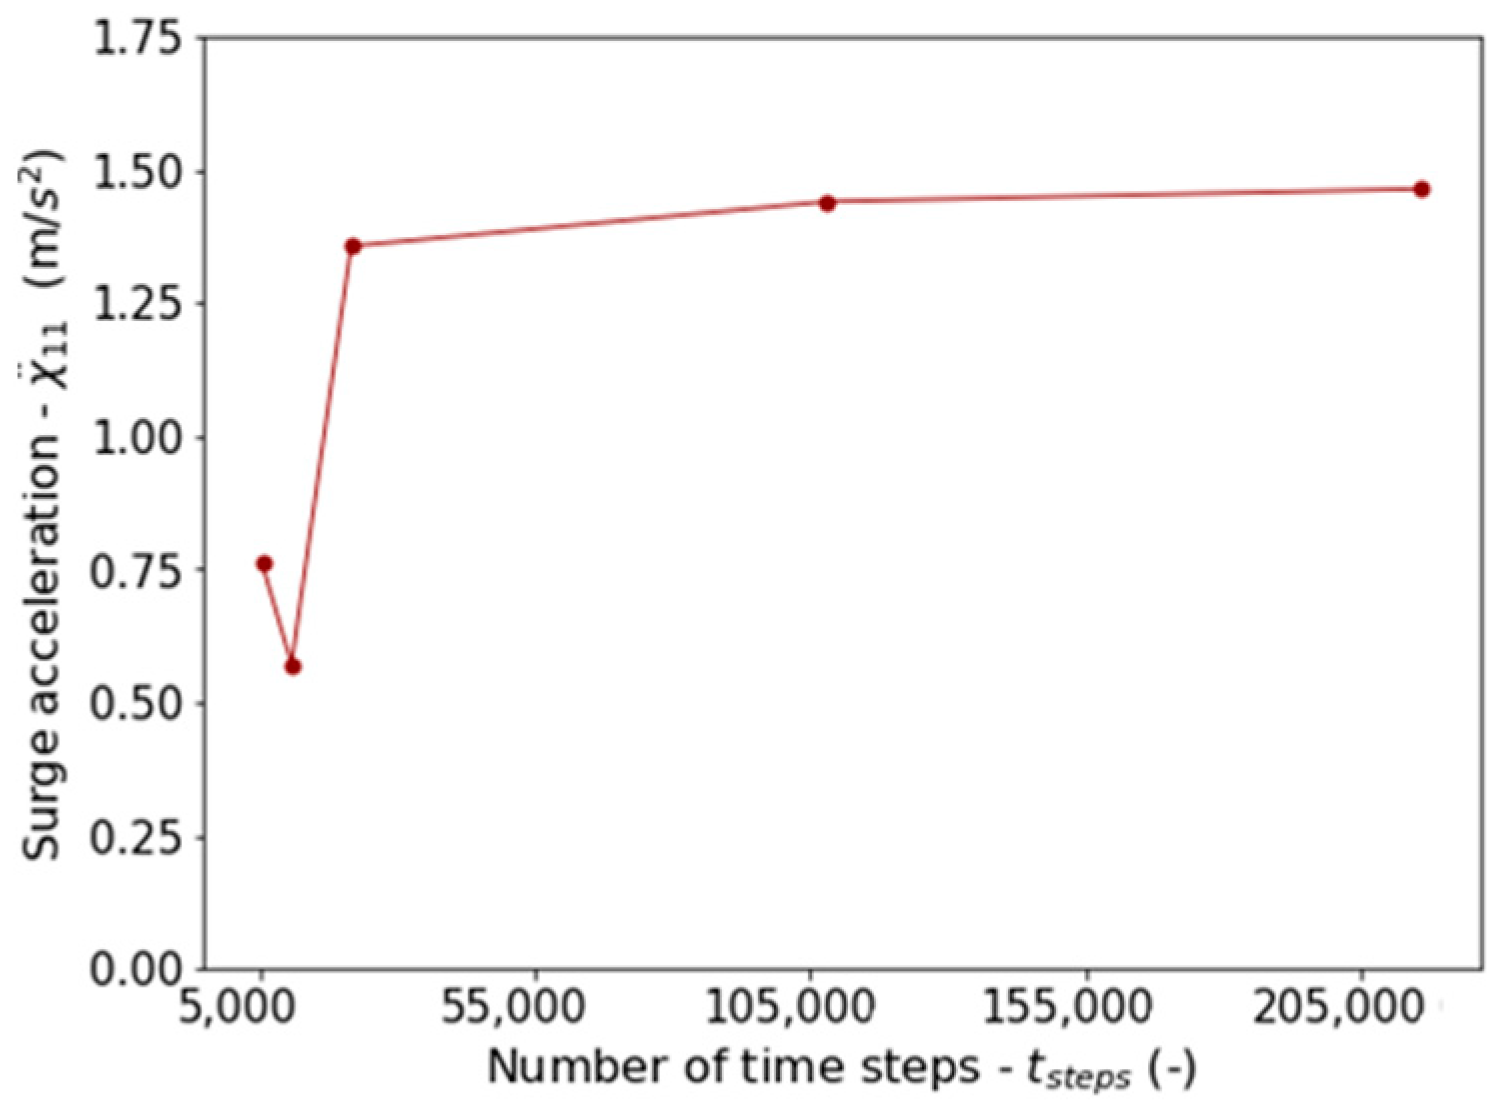
5. Validation and Numerical Accuracy

The first sets of simulations in ANSYS® AQWA™ were carried out for the validation and repeatability analyses of the software against external sources. Indeed, the box-type FBW studied in a wave flume by Cui et al. [37] was replicated in ANSYS® AQWA™ to quantify the model uncertainty. Figure 3 presents the response amplitude operators (RAOs) obtained from the source [37] with superimposed results generated by AQWA™ in the time response domain. The outcomes show good agreement between the physical testing and the potential flow solver with the average model uncertainty across the three results equating to 13.2%. The highest discrepancies are observed in heave at the range of low wavelengths and in pitch. The discrepancies could be arising from the fact that some mooring characteristics, for example, the chain diameter and steel grade, are not documented in [37] and thus had to be estimated within the present study. Furthermore, the viscous effects are more prominent on the small-scale prototypes studied in the lab. Ideally, validation of AQWA™ is performed utilizing large FBW structures. However, at the time of writing, no studies of large-scale FBWs were found publicly available. Future work should thus further validate the accuracy of the potential flow solver by implementing other numerical techniques such as Computational Fluid Dynamics (CFD), as well as perform physical analyses on medium-scaled models in real waters.
A repeatability test was also performed by re-simulating a model in ANSYS® AQWA™ which had already been analysed by other researchers using the same potential flow solver. Indeed, the double-row, box-type FBW investigated by Rajabi and Ghassemi [38] was selected as a reference model. A different version from that currently utilized (i.e., Version 2022 R2) was adopted by Rajabi and Ghassemi [38]. The version employed is not quoted in the manuscript [38]; however, based on the publication date, it is older than 2022 R2. To illustrate, the outcomes for the transmission coefficient K t are presented in Figure 4, confirming the negligible difference between the source [38] and replicated model.
Upon validating the software, Model A was set up in AQWA™ and a grid refinement study was performed to minimize the numerical uncertainty as much as possible. From a mesh-sensitivity analysis, a maximum element size lmax of 2 m or less was found to give consistent results. As an example, Figure 5 illustrates the convergence of the surge amplitude value with decreasing grid spacing. Given the simple geometry of the FBWs, refining the mesh with elements smaller than 2 m did not increase the computational time significantly. Thus, an element size of 0.8 m with a de-featuring tolerance of 0.04 m was eventually implemented and maintained throughout the investigation. Refining the mesh further to a grid size of 0.6 m was found to improve the results by a marginal value of 3%.
Similarly, a temporal domain assessment was performed to identify the suitable number of time steps (or suitable time increment) that would generate reliable outcomes. Time steps of 10, 5 and 3 s proved to be too high and generated an error whereas an increment of 0.001 s was too small and exceeded the 1,000,001 number of steps limit in AQWA™. Consequently, time response simulations in the HR domain were carried out for time increments of 2.00, 1.00, 0.50, 0.10 and 0.05 s corresponding to 5401, 10,801, 21,601, 108,001 and 216,001 time steps, respectively. Figure 6 exhibits the effect of the time increment on the surge acceleration value. The plot suggests that a time increment shorter than 0.50 s, corresponding to over 21,601 time steps, converges towards a value of 1.46 m/s2. Furthermore, the percentage difference between the outputs becomes minimal (i.e., <6%). Consequently, a time increment of 0.50 s was adopted and considered as adequate in striking a balance between reliable results and computational effort.

6. Results and Discussion

The upcoming sections demonstrate the wave attenuating characteristics and hydrodynamic response of the baseline and hybrid FBW systems outlined in Section 3. Results generated from AQWA™ for Models A and B are compared.

6.1. Hydrostatic Analysis

The hydrostatic details of FBW Models A and B (refer to Figure 1 and Figure 2) are presented in Table 1. The terms S1 and S2 for the hybrid model represent Scenario 1 and Scenario 2, respectively. The former implies a pre-charged PCS, whereas the latter represents the fully charged state of the ESS. Additionally, the details of the HPES system for Model B are summarized in Table 2 and Table 3. The ECU, which was assumed as a black box, was assigned a mass of 450 tonnes, estimated and up-scaled from the physical ECU being assembled at the University of Malta as part of Project MUSICA [39].
All thermodynamic and structural properties in Table 2 and Table 3 were derived from the software tool developed in-house, SmartPVB, Version 1.1 [40]. The latter was specifically developed for the purpose of the PVB design in offshore HPES applications and is capable of determining the optimal PVB configurations using numerical optimization algorithms. The code implements calculations as suggested by the European Standard EN 13445:2014, Parts 2, 3 and 5 [41,42,43]. Standardized dimensions, more specifically, the PV diameters and thicknesses, are based on the American Petroleum Institute (API)-5L specifications [44]. The latter pipeline code was implemented for the design of the PVs making up the PCS since, at the time of writing, pipeline sections are the cheapest form of steel structure available. Hence, the PVB and pipeline design approach provide the opportunity of leveraging the gas pipeline industry during manufacturing procedures [40].
An operating pressure ratio of 2.5 was previously identified by Cutajar et al. [40] to be an optimized operating condition which results in the minimum mass of steel requirement per unit of energy storage capacity (i.e., the minimum value of kg (of steel)/MWh). Hence, the same value was also utilized in the present research to drive down cost reductions in offshore HPES applications. The design pressure was established based on a safety factor of 1.1 on the peak working pressure, as recommended by the Pressure Equipment Directive (PED) [45].
In accordance with the parameters in Table 3, all PVs making up the PCS were assumed to be identical, having an outer diameter of 1.524 m (equivalent to the 60-inch standard pipeline dimension) [44]. A 5% [40] additional mass allowance per PV was also included in the total structural mass m s t of the PCS. The percentage value is based on the mass of steel required for one empty PV and accounts for welds, flanges, nozzles, valves and other components alike [41]. Conditioned by the findings of previous investigations by Cutajar et al. [40], a steel grade of X70 was considered for the storage vessels. The chosen material is characterized by a density of 7850 kg/m3, a yield strength of 483 MPa and an ultimate tensile strength of 565 MPa [42,43].
The quantities in Table 1 confirm that the integration of the HPES system into the FBW does not jeopardize the hydrostatic stability of the wave breaker. On the contrary, the introduction of the ECU and PCS to the floating unit enhances the intact stability criteria of the structure. Upon the integration of the ESS with the FBW, the transverse metacentric height GMt of the floating system remains positive, thus ensuring that upon a small inclination, a righting moment is induced to return the structure to its original position. Another revelation is that, in terms of the natural periods in heave, roll and pitch, the large-scale FBWs under consideration mimic the behaviour of FPSO units, as established in Clause 2.2 of the DNVGL-RP-F205 Standard [46].

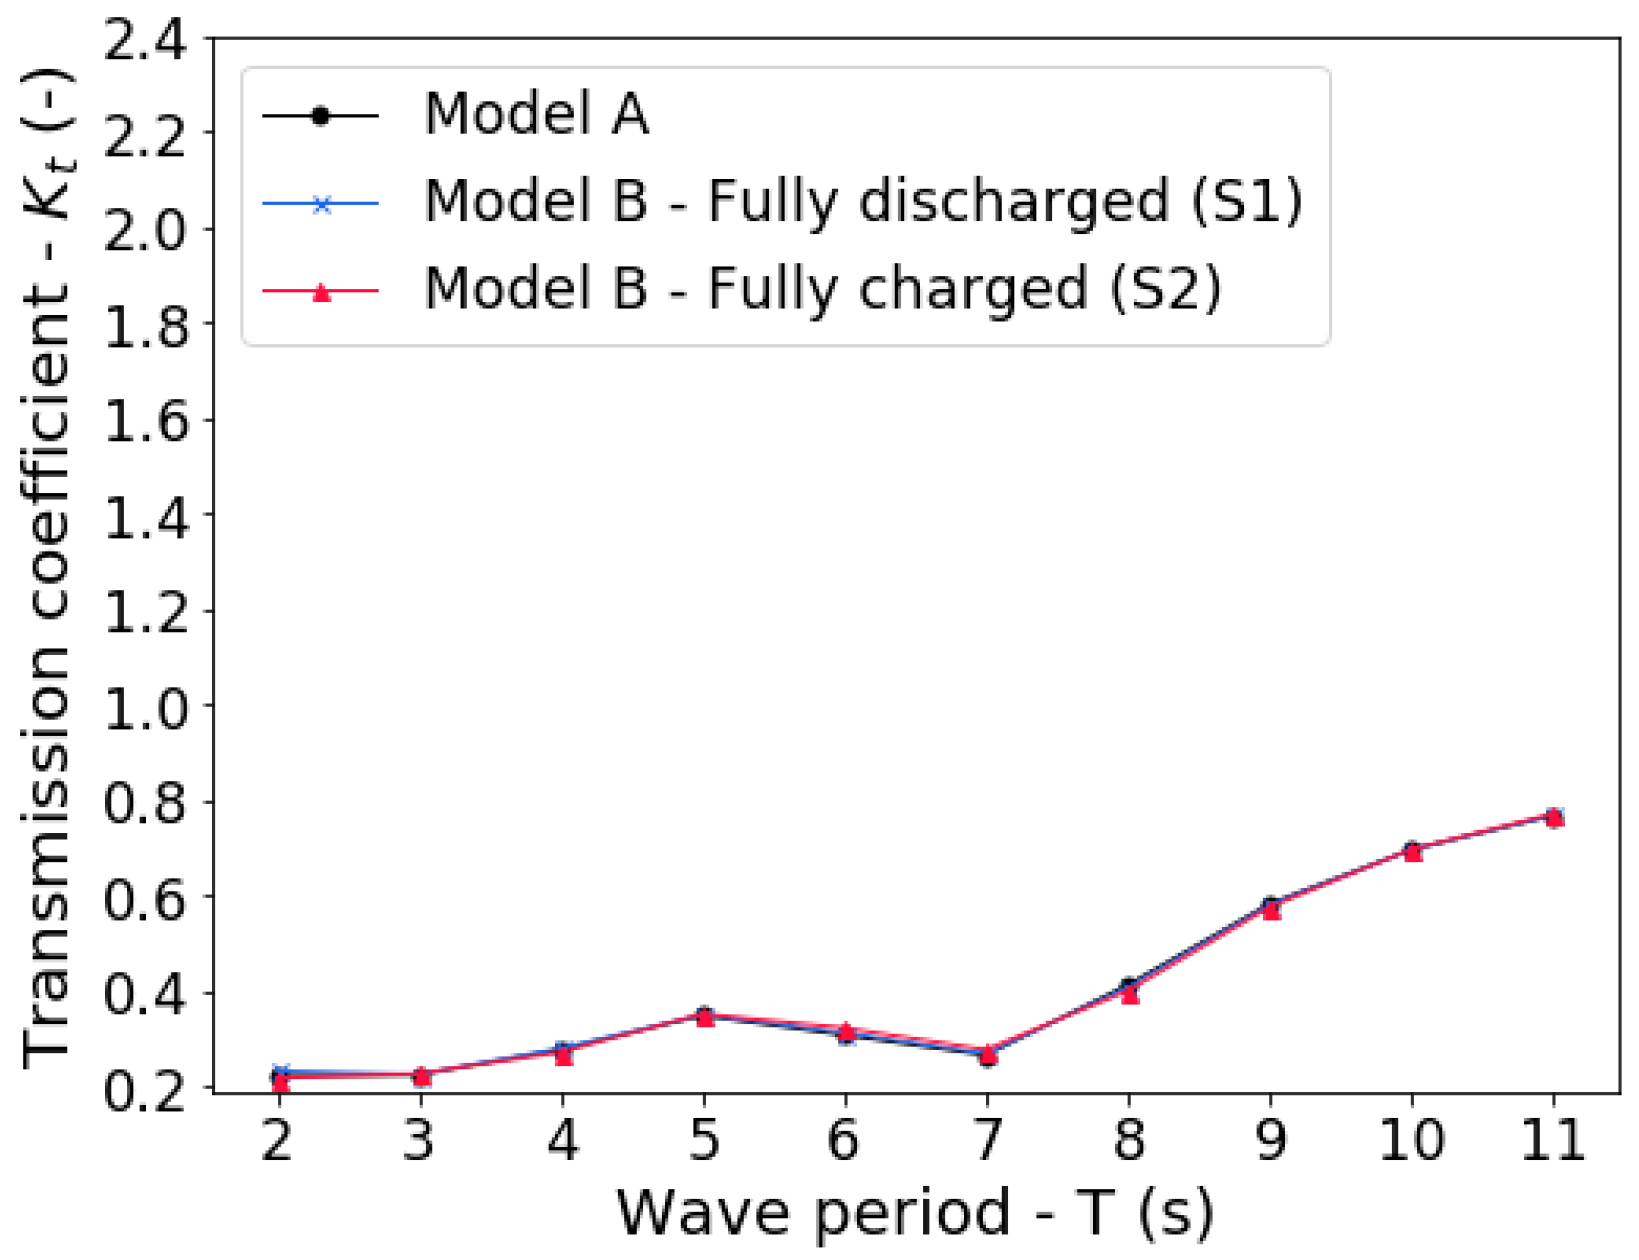
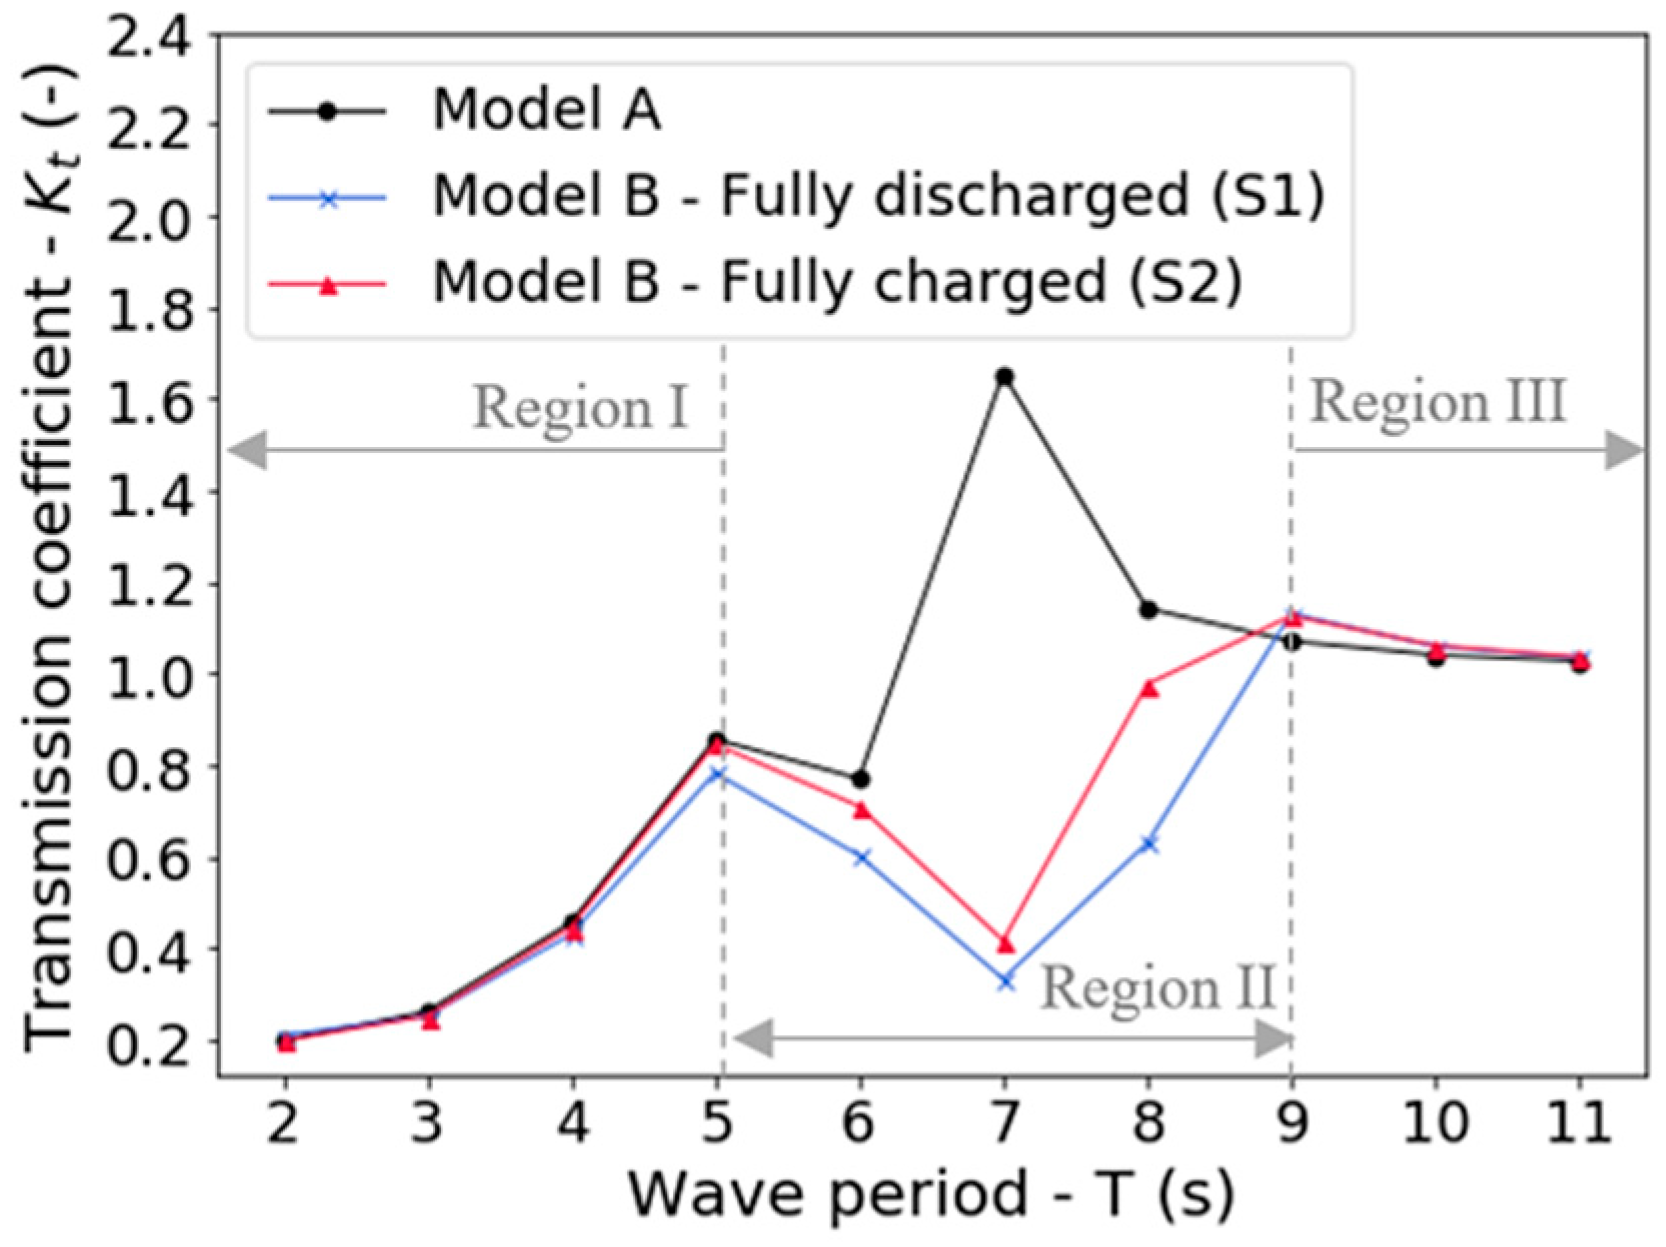
6.2. Wave Attenuation Performance Analysis

The analysis in the HD module in AQWA™ was carried out for both Models A and B in both fixed- and free-floating arrangements. The FBW models may be compared in terms of wave attenuation characteristics from the outcomes presented in Figure 7 and Figure 8. The values of K t were derived from Equation (2) as presented in Section 4. Moreover, the plots in the figures were generated for the default values of sea depth and incident wave height (i.e., d = 200 m and H i   = 2.5 m). These were chosen for central Mediterranean conditions, more specifically for the territorial waters of the Maltese Islands. All incident wave headings were taken at 0° to the x-axis (refer to Figure 1 and Figure 2 for axes notation). The 0° wave heading was chosen since AQWA™ does not allow the superposition of multidirectional waves in the HD system. Even though the simulation of a range of wave directions is possible, the numerical solution is executed individually for every wave heading.
For a detailed explanation on the behaviour of fixed- and free-FBWs and the phenomena that give rise to the displayed performance, the reader may refer to the previous work of the authors in [32]. Of importance here is the difference between the baseline and hybrid systems. Figure 7 for the fixed-floating systems shows that the hybrid FBW Model B has wave-attenuating behaviour which is identical to that of the baseline for Model A. In order to analyse any changes between the free-floating units in Figure 8, three regions can be defined.
Region I: For very short incident wave periods of 2 ≤ T < 5 s, this corresponds to the range of high incident wave frequencies 3.14 ≥ ω > 1.26 rad/s. The first region is characterized by the lowest K t values that increase in a quasi-quadratic manner with increasing wave periods. No major differences are noticed between Model A and Model B.
Region II: For mid-range incident wave periods of 5 ≤ T ≤ 8 s, this corresponds to the range of incident wave frequencies 1.26 ≥ ω ≥ 0.79 rad/s. This second region is characterized by the highest differences in K t values between Model A and Model B. While Model A is highly inefficient and even acts as a wave generator (i.e., K t ≥ 1) within region II, the integration of the ESS is observed to extend the effectiveness of the FBW to incident wave periods of up to 7 to 8 s. Between 5 and 8 s, the average transmission coefficient, K t , for free-floating Model A is 1.11, with a peak value of 1.65 at T = 7 s. For Model B, the average K t reading is reduced to 0.59 and 0.74, when the ESS is pre-charged (i.e., S1) and fully charged (i.e., S2), respectively. The FBW performance at T = 7 s decreases to 0.33 and 0.42 for S1 and S2, respectively. In summary, the average efficiency of the baseline free-FBW within region II is expected to improve by 33 to 47%, depending on the extent of the charge of the HPES system.
Region III: For very long incident wave periods of 8 < T ≤ 11 s, this corresponds to the range of low incident wave frequencies 0.79 > ω ≥ 0.57 rad/s. In the third region, the K t values for both models are observed to settle close to the value of unity. Model B experiences a rise of around 5.5% in K t at T = 9 s, as compared to Model A. Apart from being a very small discrepancy, the higher K t values for Model B occur only within region III, where the baseline model is already proving to be impractical to break the oncoming waves (i.e., K t ≥ 1). Indeed, the outcomes for region III imply that both free-FBW models are not capable of attenuating waves with periods exceeding 8 s. The limitation of box-type FBWs in attenuating waves of long periods was also reported by Elchahal et al. [11]. Considering deep water waves, wave periods higher than 8 s correspond to wavelengths beyond 100 m. Therefore, it starts becoming technically and economically challenging to construct FBWs having widths equivalent to at least half the incident wavelength, to be effective in mitigating the oncoming wave energy [47].
In relation to the results of Figure 7, it can be argued that the external cylinders do not directly assist in attenuating the waves. Otherwise, any dissipation is not being captured by the potential flow theory, and the results are conservative. However, Figure 8 for the free-FBWs predicts a significant improvement, which originates from the fact that the integration of the PCS and ECU shifts the natural frequencies (as seen in Section 6.1, Table 1) and alters the dynamic response of the FBW. The dynamic metrics are now investigated in the following section.

6.3. Hydrodynamic Time Response

In order to delve into a deeper investigation and understand the behavioural characteristics of Models A and B at specific wave climates, further simulations were carried out, this time in a temporal domain. Both FBW Models A and B were moored at a sea depth of 200 m, under six, high stiffness catenary cables having the properties listed in Table 4 [48,49]. A plan view of the mooring configuration is also provided in Figure 9, illustrating three cables on each longitudinal side of the FBW, with two cables connected to the middle and four cables extending from every corner. Thus, the described mooring design which was chosen after an extensive and separate analysis also caters for cable redundancy, which is a fundamental precaution that aids in minimizing the risks of catastrophic events in case of a single-line failure.
Table 5 presents the generic test matrix developed, inclusive of both regular and irregular wave conditions, and covering a range of sea states in accordance with the WMO Code 3700 [50]. Note that for load cases (LCs) 4 to 6, the wave height and wave period quoted in Table 5 imply a significant wave height H s and the peak period T p , respectively. All wave headings for all LCs were once again maintained at 0° to the x-axis. The unidirectional wave heading was adopted as it is highly popular in modelling the response of floating structures, even though real sea states are characterized by multidirectional wave spectra [51]. In addition, a multidirectional wave spectrum is not expected to result in a significant added response in the predominant DoFs (i.e., surge, heave and pitch) when compared to the response resulting from a unidirectional wave spectrum of equivalent energy [51]. Furthermore, in terms of wave attenuation, the unidirectional wave spectrum is perceived to be more difficult to attenuate since for a given energy content, the directionality of the wave follows the same path. Conversely, real, stochastic waves of different frequencies and phases propagate in different directions. Consequently, the unidirectional 0° heading reflects the most conservative scenario, whereby the wave attenuating performance of the structure is predicted to be a minimum.
The characteristics for the monochromatic waves were chosen based on data gathered for Malta by the Dutch Consulting Organization, BMT ARGOSS [52]. The irregular LCs were selected based on the work of De Leo et al. [53]. In [53], the authors perform trend analyses and generated future projections (up to the year 2080) of wave climates in the Mediterranean Sea. In AQWA™, the regular wave conditions were modelled via Stokes’ 2nd order wave theory [36], whilst LCs 4 to 6 were defined via the JONSWAP spectrum [36].
The results in Section 6.3.1 and Section 6.3.2 are based on a three-hour simulated history, excluding the first 900 s of data to eliminate transient effects from the subsequent analysis. Furthermore, the inclination of the PVs to the horizontal (refer to Figure 2b) and the sloshing effects inside were not modelled numerically.

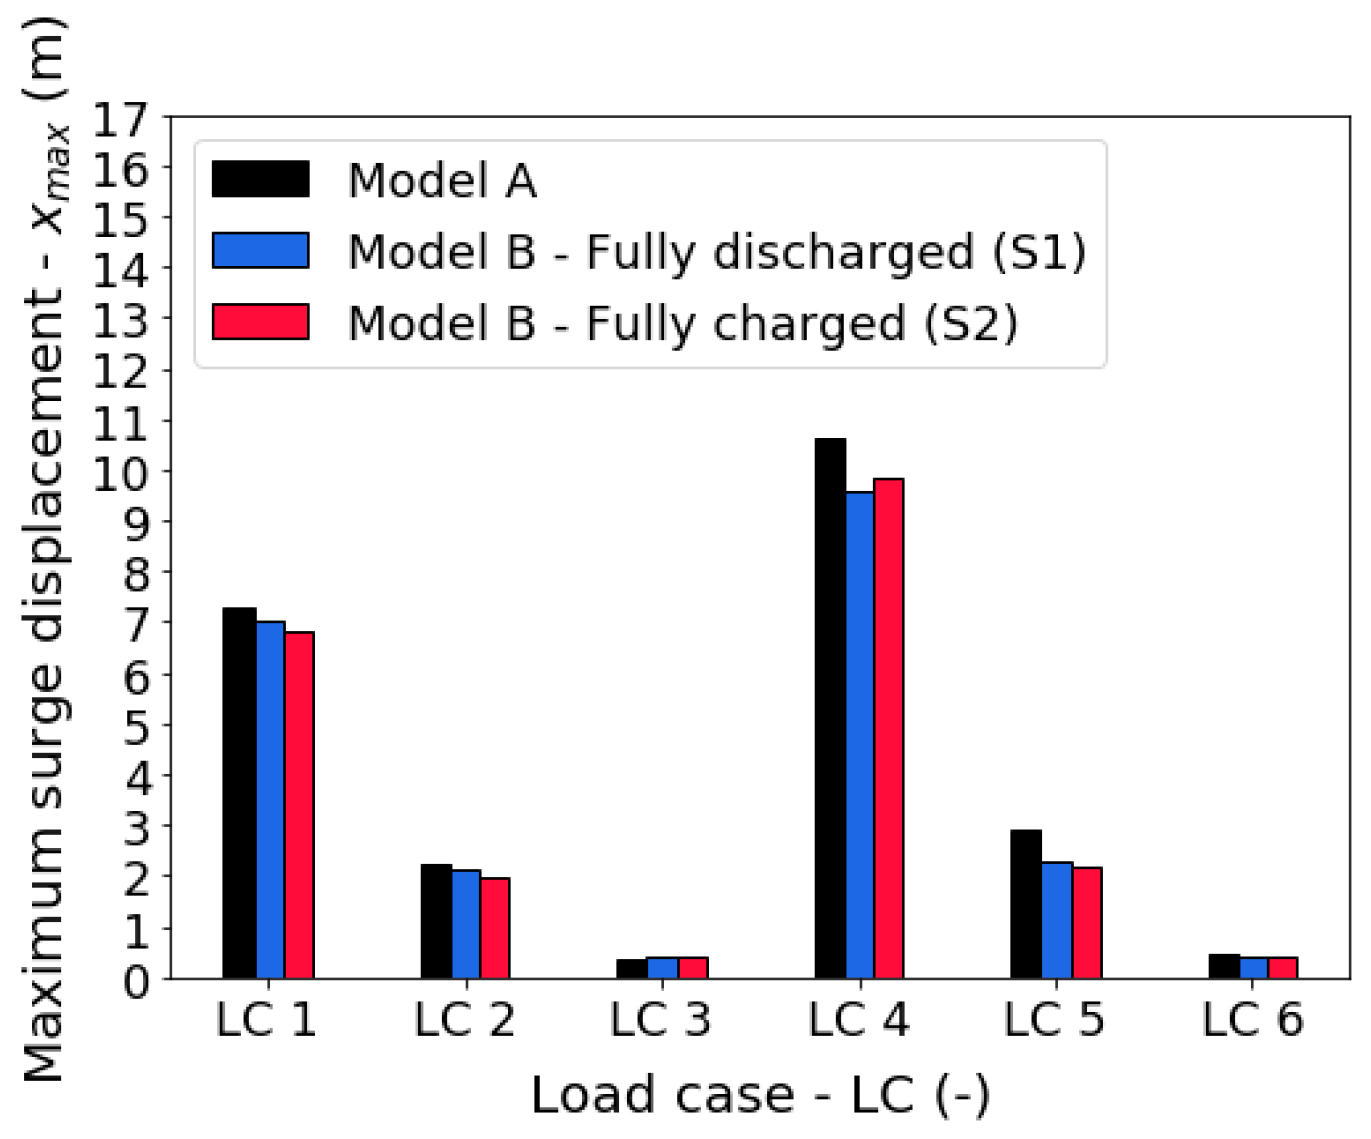
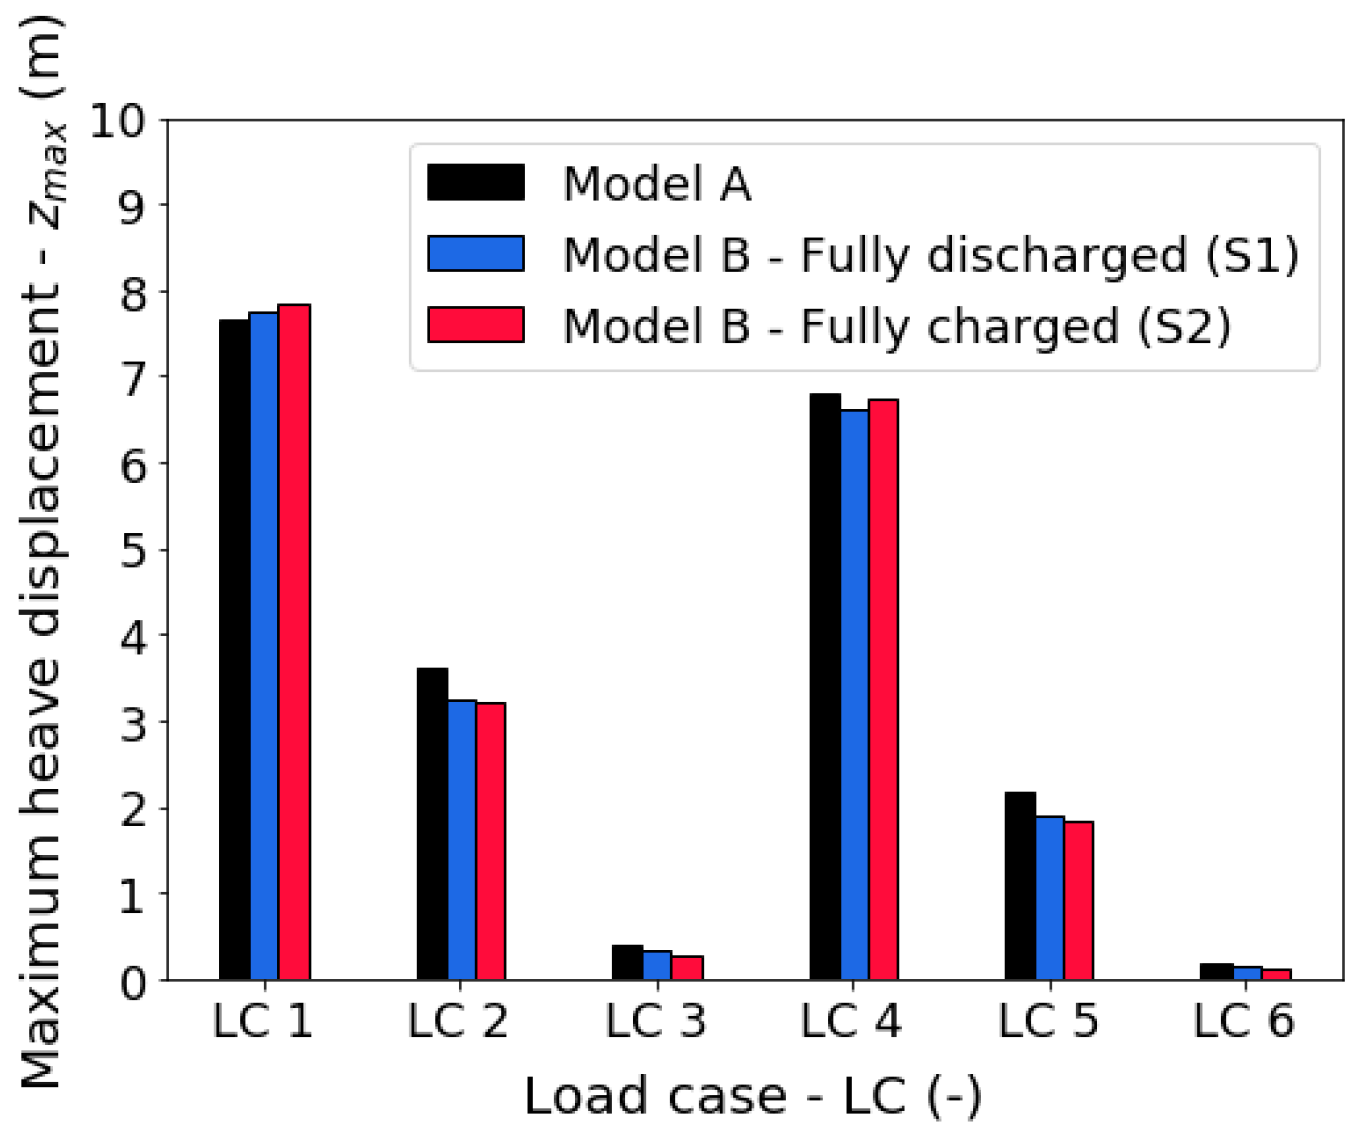
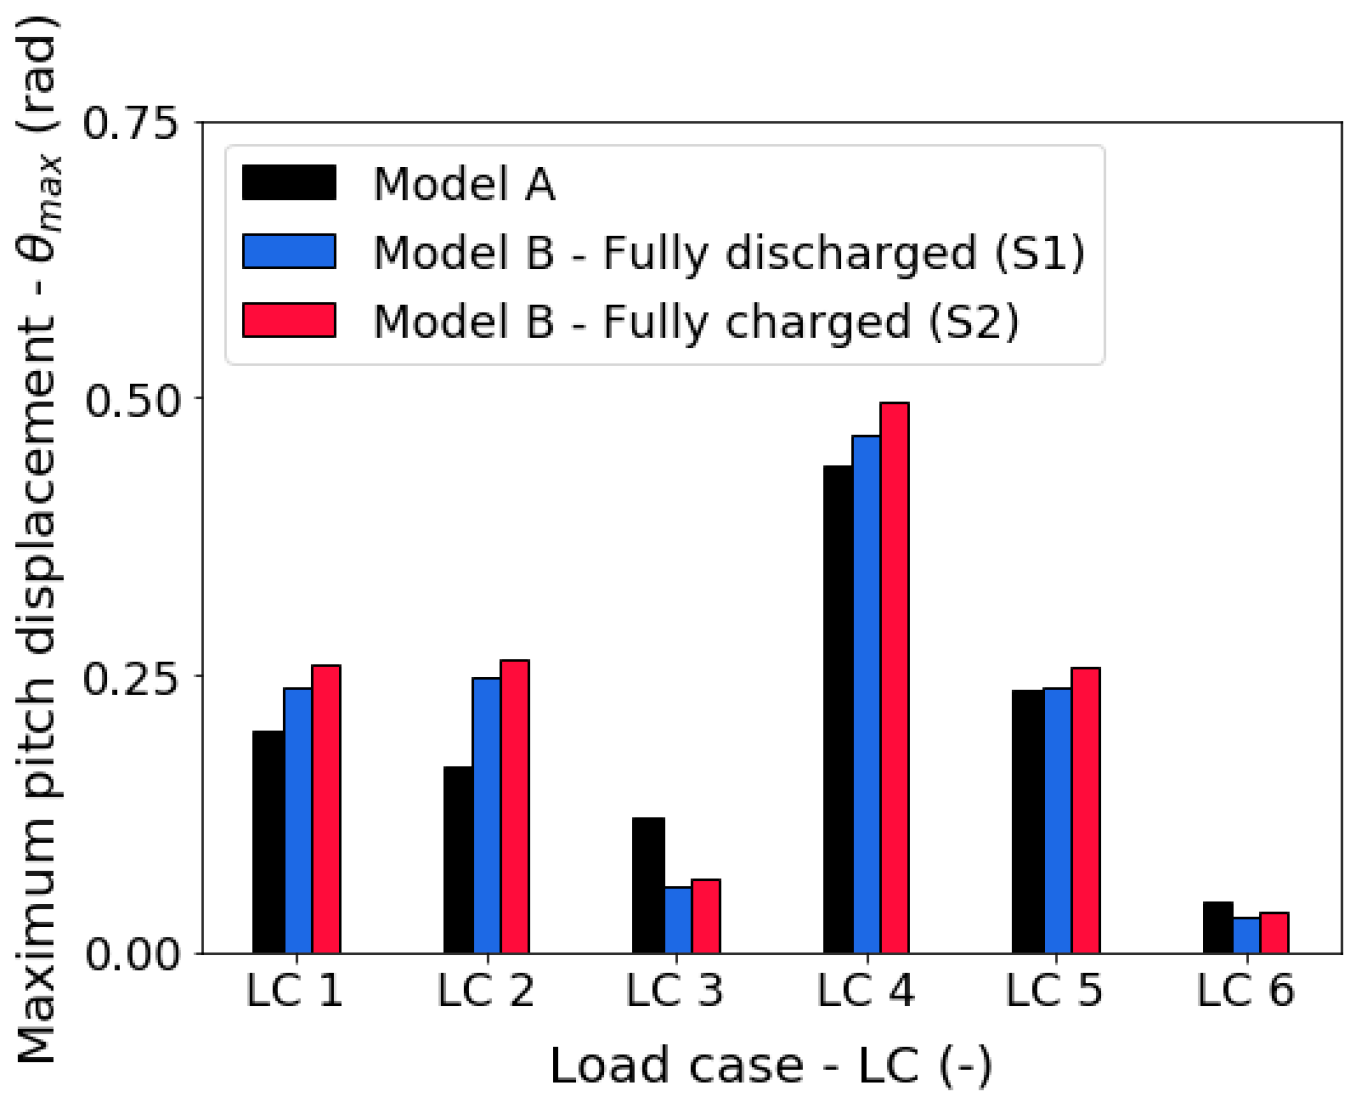
6.3.1. Displacements

The results for displacements and accelerations laid out in Section 6.3.1 and Section 6.3.2, Figure 10, Figure 11, Figure 12, Figure 13, Figure 14 and Figure 15, were generated for the reference coordinate ξ = (0 m, 0 m, −3.25 m), relative to the AQWA™ fixed reference axes (FRA). The coordinate ξ represents the average location of the CoG of the ECU for the hybrid model. For consistency, in comparison, results for Model A were also read using the same reference coordinate system. Monitoring the dynamic parameters at ξ rather than elsewhere (such as at the CoG of the whole system) is of great relevance due to the acceleration limits set on turbomachinery. The motions, mainly accelerations, of the FBW may induce unwanted loads (e.g., gyroscopic loads) and vibrations on the pump and turbine or P-T, in addition to any self-imposed vibration. It is also worth mentioning that every bar under LCs 4, 5 and 6 represents the magnitude obtained from the average of five different dimensionless seed values (i.e., 1, 10, 100, 10,000 and 100,000).
Figure 10, Figure 11 and Figure 12 present the maximum, peak-to-peak displacements occurring in the surge, heave and pitch directions, respectively. For comparison purposes, the results for Model A, Model B (S1) and Model B (S2) for LCs 1 to 6 are superimposed on the same bar plots. It is instantly apparent that the dynamic response is highly dependent on the sea state. For instance, LC 4 incites the highest surging and pitching motions, irrespective of the FBW model. The heave response is also very significant in the extreme irregular sea state (i.e., LC 4), yet translational motion along the vertical axis is more pronounced at LC 1, for all three FBW models. The difference in peak-to-peak translational and angular displacements between the fully discharged and fully charged states of Model B is minimal. Indeed, for the results in Figure 10, Figure 11 and Figure 12, the disparity in response between Model B (S1) and Model B (S2) is always less than 15%.
The bar plots in Figure 10 reveal that the presence of the ESS is likely to contribute to lower surge displacements. The outcomes in Figure 11 also indicate positive effects of the ESS on the heave peak-to-peak displacements of the FBW. Excluding LC 1, the heave motion is anticipated to decrease by 0.50 up to 27% when the HPES is combined with the FBW structure. Contrastingly, at the extreme regular wave conditions of LC 1, Model B oscillates over a wider range of vertical displacement. Nonetheless, the increased heaving attains a maximum percentage value of simply 2.54% when the PCS is fully charged at S2.
The maximum pitching motions for all LCs outlined in Table 5 are also exhibited in Figure 12. The latter uncovers how the hybrid model is only able to provide mitigated pitch rotation in calm waters (i.e., LCs 3 and 6). Contrastingly, for the moderate and extreme LCs, the dynamic pitching behaviour of Model B is seen to augment as compared to the response of Model A. The increased mass moment of inertia along the y-axis, due to the introduction of the ESS, shifts the natural frequencies and response of the floating system towards smaller wave frequencies. The overall effect is thus an increased pitching at high wave periods and reduced pitching at short wave periods. As bodies with a larger mass provide higher reluctance to a change in the dynamic state, then, it is also appropriate to say that in calm waters, the heavier hybrid model is more difficult to put in motion, and hence, there is a lower pitch response. Similarly, when Model B is in ample motion in rough sea states, it is more challenging to control and mitigate its response in comparison with the lighter Model A.

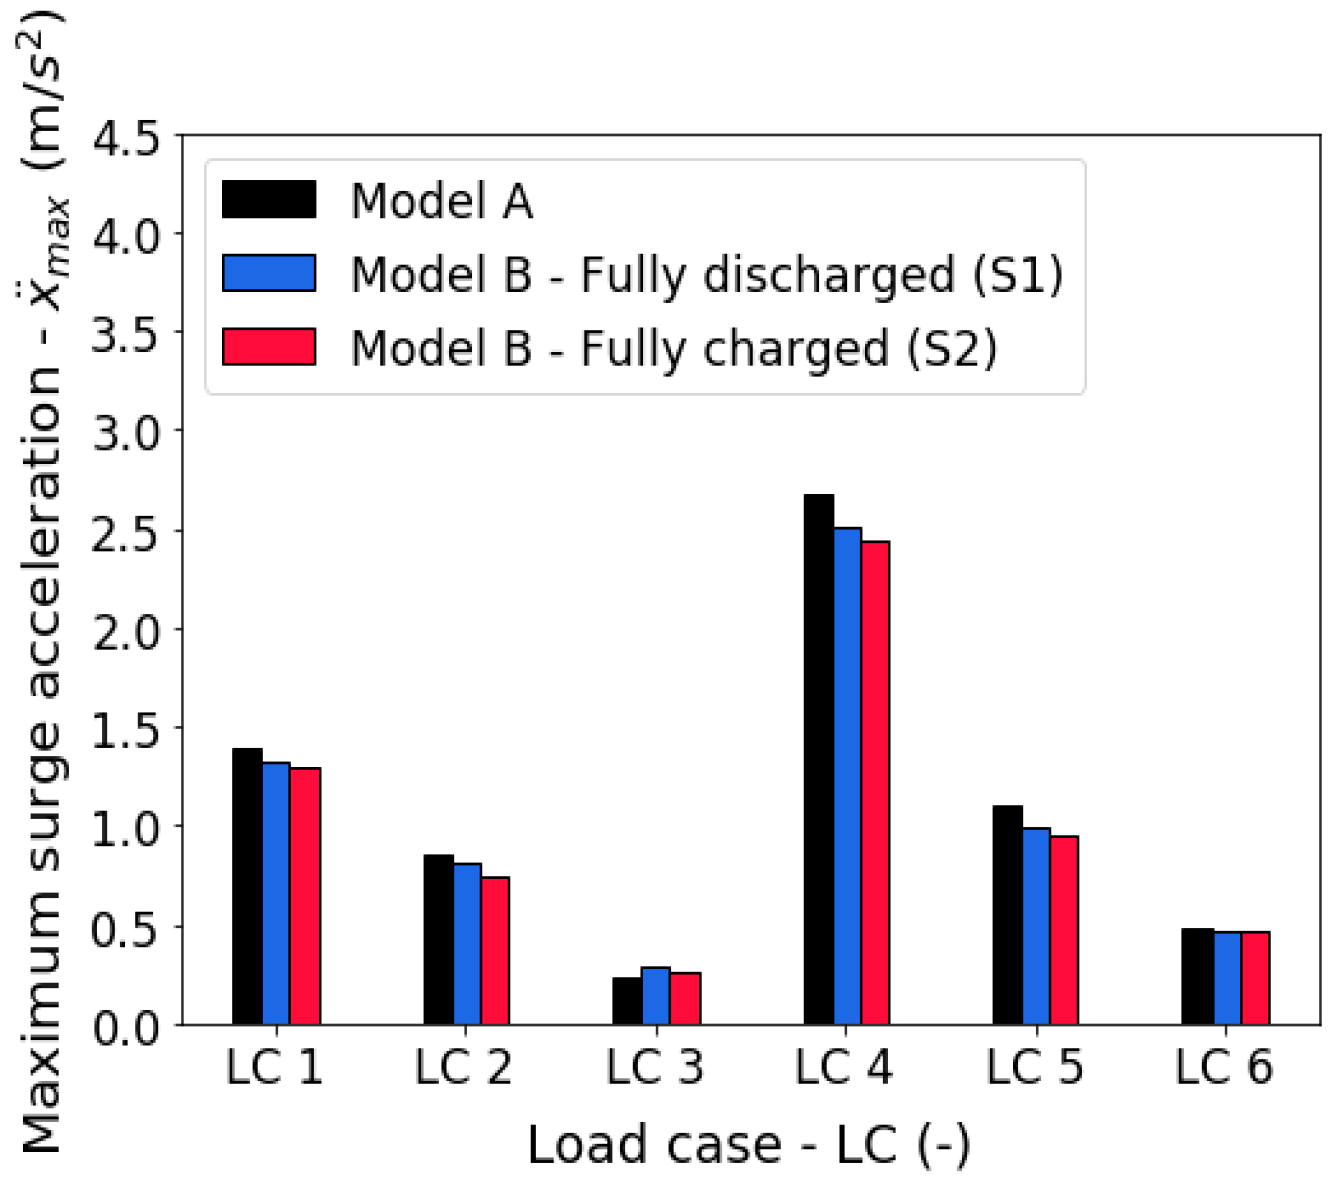
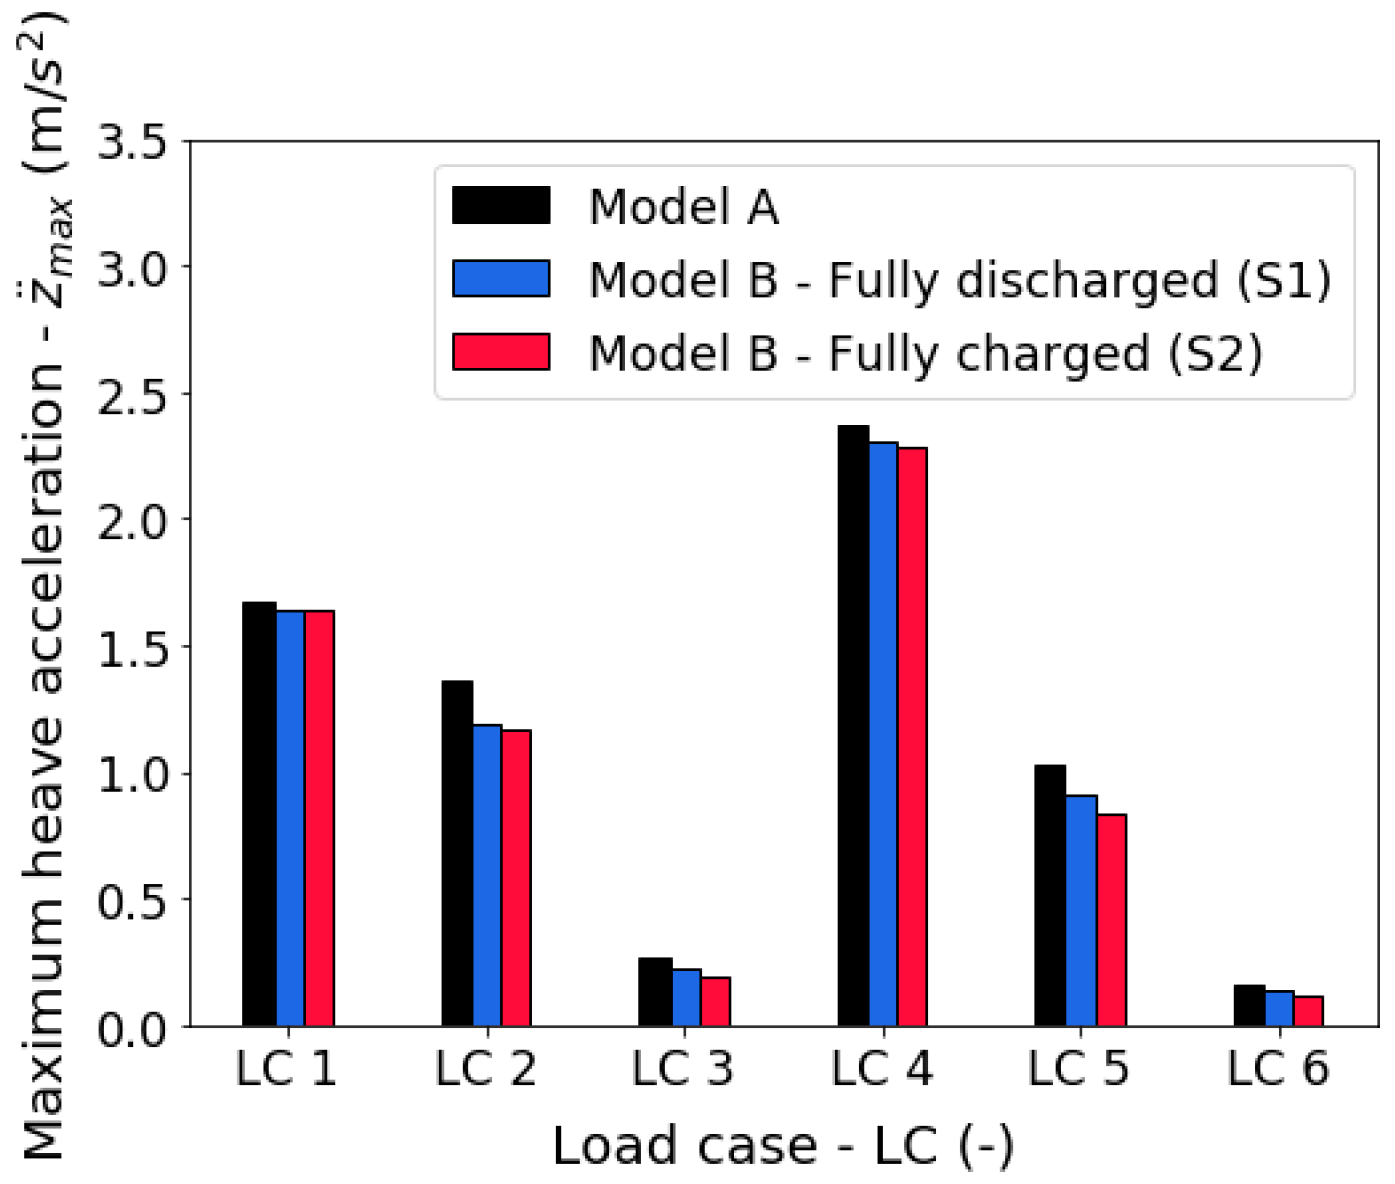
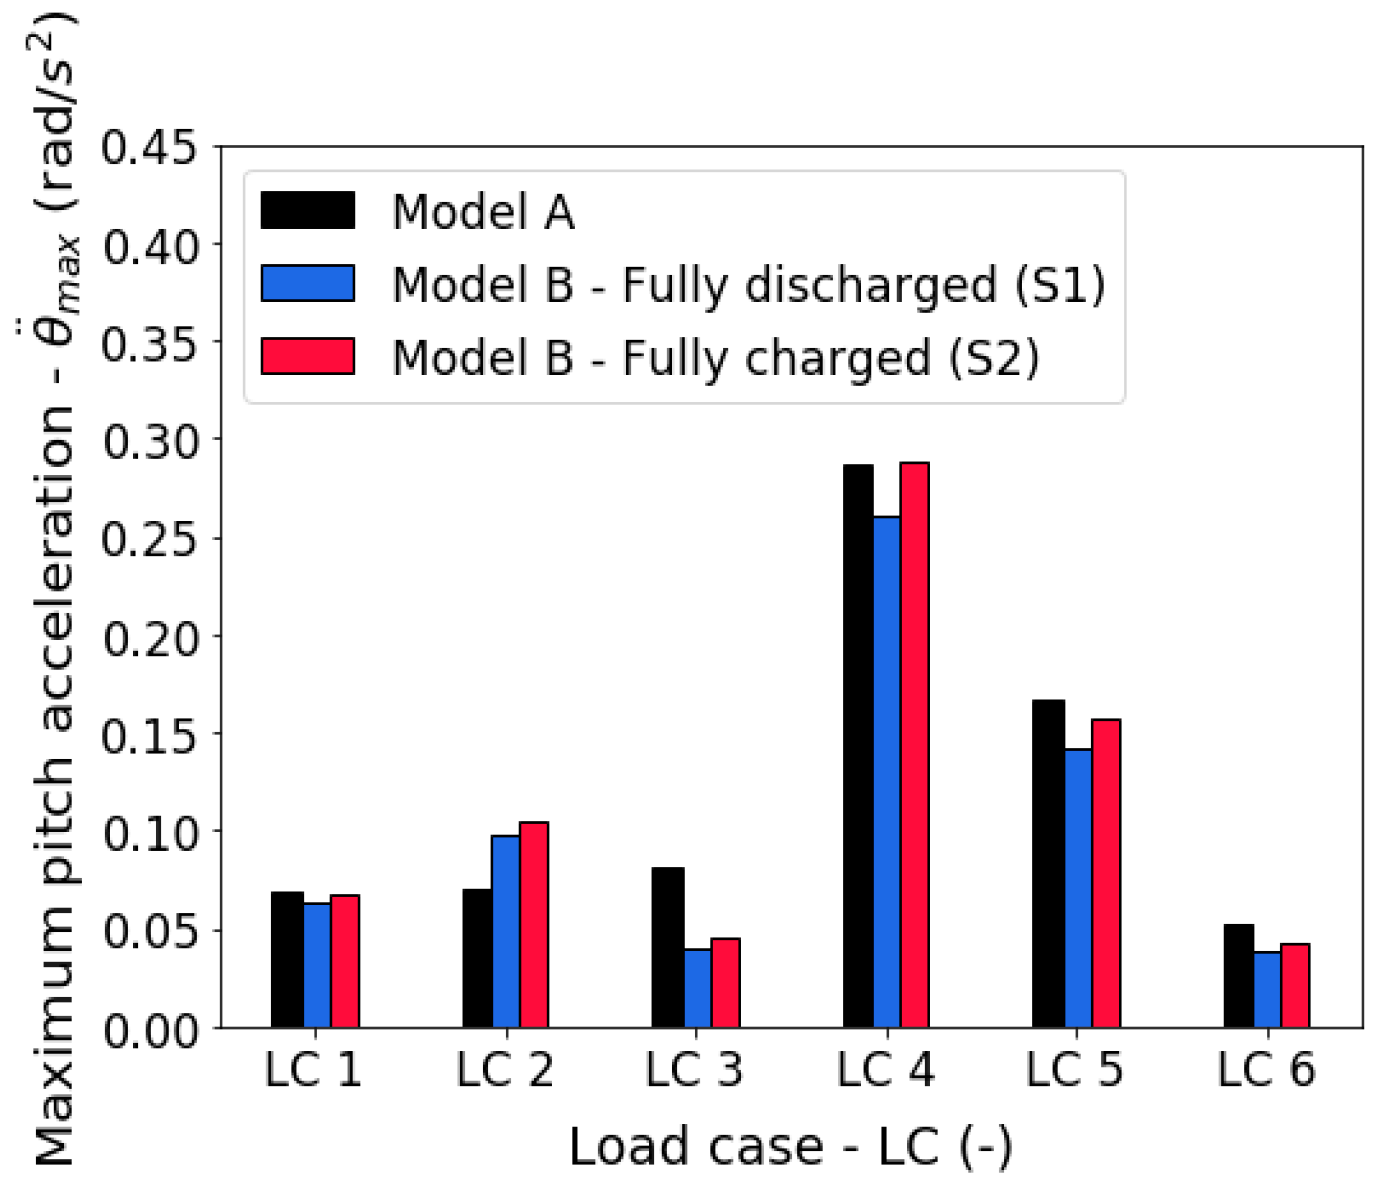
6.3.2. Accelerations

The integration of the HPES system with the FBW is also somewhat promising in terms of accelerations. The absolute values in Figure 13, Figure 14 and Figure 15 indicate the largest magnitudes recorded, irrespective of direction (i.e., +ve or −ve in accordance with the FRA). As portrayed in Figure 13, the rate of change of velocity in the translational x direction decreases for the majority of the LCs, with the only exception being LC 3. In the latter, the discrepancy is however not detrimental. The surge acceleration increases from 0.24 m/s2 for Model A to 0.28 m/s2 and 0.26 m/s2 for Model B (S1) and (S2), respectively. At LC 4, the highest surge accelerations are recognized for both the baseline and the hybrid FBWs. Model A undergoes a maximum surge acceleration of 2.67 m/s2 which reduces to 2.50 m/s2 and 2.43 m/s2 for fully discharged and fully charged Model B. Considering all LCs, up to a 15% reduction in the surge acceleration is predicted for Model B, relative to Model A. The presence of the ESS within the FBW is also expected to minimize the accelerations in heave for all test LCs. According to the plots in Figure 14, Model B experiences peak accelerations which are up to 18.8% less than the accelerations of Model A. The highest percentage decreases are noticed for the moderate wave conditions of LCs 2 and 5.
The outputs for the peak pitch accelerations are exhibited in Figure 15. The latter presents very sporadic results with no definite trends. For instance, Model B at LC 2 is characterized by a well-defined increase in acceleration relative to Model A. Conversely, at LC 3, the hybrid system accelerates significantly less than its baseline counterpart. LCs 1, 4, 5 and 6 reveal a decrease in the acceleration of Model B (S1) compared to Model A. However, when the ESS is charged maximum, Model B (S2) experiences a rise in acceleration relative to S1. The augmentation results in an acceleration that is either slightly less or equivalent to that experienced by Model A at the same LC.
In respect of Figure 13, Figure 14 and Figure 15, the conclusion is that the hybrid FBW model benefits from reduced peak accelerations in the prevailing directions of motion. Sixteen out of the eighteen results (six LCs for every predominant DoF) presented in Figure 13, Figure 14 and Figure 15 indicate a declining trend in acceleration. The highest decrease in acceleration from Model A to Model B is expected in pitch for LC 3. In the given case, the acceleration drops by 50% from 0.08 rad/s2 to 0.04 rad/s2. It is also worth remarking that in surge and in heave, the accelerations for Model B always decrease when the PCS changes state from fully discharged (S1) to fully charged (S2). On the contrary, an increase in the pitch acceleration is observed when the ESS shifts from fully discharged (S1) to fully charged (S2) conditions.
Perhaps more meaningful are the peak and RMS accelerations quoted in terms of the gravitational acceleration, g . Indeed, Table 6 and Table 7 summarize the peak and RMS values for the extreme sea states of LCs 1 and 4, respectively. The tabulated results manifest that the peak accelerations for LC 4 are more pronounced than the peak accelerations predicted for LC 1, as is also reflected in Figure 13 and Figure 14. Conversely, the highest RMS values for the lateral and vertical accelerations are realized for LC 1. The analysis of the peak and RMS accelerations link to the fact that the actual dynamic response is dominated by the incident wave characteristics and that the acceleration response follows similar trends. Thus, although higher, the peak accelerations in irregular wave conditions are short-lived.
Given the inadequacy of data available in terms of FBW accelerations, the values obtained for Model A firstly assist in quantifying the accelerations expected for conventional, large-scale FBWs in deep seas. In summary, and in accordance with the data in Table 6 and Table 7, it can be reported that massive FBW structures are being predicted to be characterized by the following:
  • Peak surge (i.e., lateral) accelerations of 0.30 g;
  • Peak heave (i.e., vertical) accelerations of 0.25 g;
  • RMS acceleration maxima of 0.1 g in both lateral and vertical directions.
The quoted values obtained from numerical simulations are limited to the test parameters considered, namely, the FBW geometry and sizing, mooring configuration and extreme wave conditions listed in Table 5 with unidirectional 0° heading.
In relation to the novel FBW concept, Table 6 and Table 7 affirm the outcomes in the bar plots shown in Figure 13 and Figure 14 in terms of the peak values, which are observed to be typically less for Model B, relative to Model A. Indeed, the tables list the average percentage differences in peak and RMS accelerations between Models A and B (S1 and S2), where the percentages are computed relative to the stand-alone FBW. The negative values denote a reduction in all cases (excluding the RMS acceleration in heave for LC 1, which is minimally increased). Furthermore, the highest reductions in both peak and RMS accelerations are realized in the surge direction. Finally, it may also be said that for the regular wave of LC 1, the peak surge and peak heave accelerations slightly overshoot the 0.1 g SML established by Freeman [30,31] for floating pontoons and breakwaters, whereas for the irregular wave of LC 4, the peak surge and peak heave accelerations are more than double the aforesaid 0.1 g SML.
The fact that the FBW accelerations predicted in this study surpass the SML established in [30,31] is however no issue of concern, since the FBW is not intended to be used as a public platform. Of interest would be the effect of FBW accelerations on the operation and lifetime of turbomachinery within the ECU. The authors have sought to translate platform motions into turbomachinery vibrations. However, at the time of writing, no means to derive such a relationship were found to be publicly available.

7. Conclusions

This study has presented significant new information on the wave-breaking and hydrodynamic performance of large-scale FBWs in deep seas. Indeed, the following have been established:
  • The natural periods in heave, roll and pitch of large-scale FBWs resemble the natural periods of FPSO units;
  • The predicted peak lateral and peak vertical accelerations of large-scale FBWs equate to 0.30 g and 0.25 g, respectively;
  • The maximum RMS accelerations in both lateral and vertical directions add up to approximately 0.10 g;
  • RMS accelerations in regular wave conditions are higher than the RMS accelerations arising from irregular sea states;
  • Peak accelerations in irregular wave scenarios are short-lived but are more pronounced than the maximum accelerations recorded under incident regular waves.
Hybridizing the conventional box-type FBW (i.e., Model A) into a solution incorporating an HPES system (i.e., Model B) has further confirmed the following:
  • The hydrostatic stability of the floating assembly is enhanced as the GMt of the hybrid system remains well above zero;
  • The wave breaking efficiency, η (or transmission coefficient, K t ), of the FBW is significantly improved by up to 47% for mid-range incident wave periods of 5 ≤ T ≤ 8 s, corresponding to the range of incident wave frequencies 1.26 ω 0.79 rad/s;
  • The presence of the ESS is likely to contribute to lower surge and heave displacements for a wide range of sea conditions;
  • Contrastingly, hybrid Model B is able to provide mitigated pitch rotation relative to Model A, in calm waters only, due to a shift in the natural frequencies of the structure;
  • From a hydrodynamic and stability perspective, both Model A and Model B are able to remain intact and withstand sea states up to very rough and high conditions.
In conclusion, it can be stated that the results are promising, implying that the addition of the HPES to the FBW will not lead to a degradation in neither the dynamic nor the wave breaking performance of the floater. On the contrary, a considerable improvement is being predicted. It should however be noted that the results obtained and conclusions drawn are subject to the test conditions, which have been restricted to unidirectional wave headings and wave spectra. Future work should consider the modelling of oblique and multimodal waves approaching the FBWs, to further enhance the knowledge about the large-scale structures under scrutiny. Furthermore, the present investigations have been limited to numerical computations based on the potential flow theory. Future work should apply more comprehensive numerical models such as CFD, which is based on the Navier–Stokes equations. Experimental testing on scaled models in adequate testing facilities or in open waters would be essential to validate the numerical modelling. The additional numerical and physical analyses are crucial to evaluate the model uncertainties and provide a higher level of confidence in the findings established to date.

Author Contributions

Conceptualization, T.S.; methodology, C.C.; software, C.C.; validation, C.C.; formal analysis, C.C.; investigation, C.C.; resources, T.S., R.N.F. and D.B.; data curation, C.C. and T.S.; writing—original draft preparation, C.C.; writing—review and editing, T.S., R.N.F. and D.B.; visualization, C.C.; supervision, T.S., R.N.F. and D.B.; project administration, T.S.; funding acquisition, T.S. All authors have read and agreed to the published version of the manuscript.

Funding

The research presented in this article forms part of project FORTRESS (A Floating OffshoRe BreakwaTer for Supporting Marine Renewable Energy around ISlandS). The project is financed by the Energy and Water Agency (Malta) under the National Strategy for Research and Innovation in Energy and Water (2021–2030). Project Reference: EWA 63/22.

Institutional Review Board Statement

Not applicable.

Informed Consent Statement

Not applicable.

Data Availability Statement

Data is contained within the article.

Conflicts of Interest

The authors declare no conflict of interest.

References

  1. Bouckaert, S.; Pales, A.F.; McGlade, C.; Remme, U.; Wanner, B. Net Zero by 2050—A Roadmap for the Global Energy Sector; Rep. IEA 2021; International Energy Agency (IEA): Paris, France, 2021; Available online: https://www.iea.org/reports/net-zero-by-2050 (accessed on 2 August 2023).
  2. European Council. Regulation (EU) 2021/1119 of the European Parliament and of the Council of 30 June 2021 Establishing the Framework for Achieving Climate Neutrality and Amending Regulation (EC) No. 401/2009 and (EU) 2018/1999 (‘European Climate Law’); European Union: Brussels, Belgium, 2021. [Google Scholar]
  3. Wiatros-Motyka, M. Global Electricity Review 2023; Rep. Ember 2023; EMBER: London, UK, 2023; Available online: https://ember-climate.org/insights/research/global-electricity-review-2023/ (accessed on 2 August 2023).
  4. El Houda Lamhamedi, B.; de Vries, W.T. An Exploration of the Land-(Renewable) Energy Nexus. Land 2022, 11, 767. [Google Scholar] [CrossRef]
  5. Gomes, J.G.; Lin, Y.; Jiang, J.; Yan, N.; Dai, S.; Yang, T. Review of Offshore Wind Projects Status: New Approach of Floating Turbines. In Proceedings of the 5th International Conference on Power and Energy Applications, Guangzhou, China, 18–20 November 2022. [Google Scholar] [CrossRef]
  6. Garanovic, A. EDP Inaugurates ‘Pioneering’ 5 MW Floating Solar Plant in Portugal. Offshore Energy. Available online: https://www.offshore-energy.biz/edp-inaugurates-pioneering-5mw-floating-solar-plant-in-portugal/ (accessed on 6 September 2023).
  7. Wang, Z.; Carriveau, R.; Ting, D.S.K.; Xiong, W.; Wang, Z. A Review of Marine Renewable Energy Storage. Int. J. Energy Res. 2019, 43, 6108–6150. [Google Scholar] [CrossRef]
  8. FLASC—Renewable Energy Storage. Available online: https://offshoreenergystorage.com/ (accessed on 11 August 2023).
  9. Vlaswinkel, B.; Ross, P.; Nelissen, M. Environmental Observations at the First Offshore Solar Farm in the North Sea. Sustainability 2023, 15, 6533. [Google Scholar] [CrossRef]
  10. Al-Yacouby, A.M.; Halim, E.R.; Liew, M.S. Hydrodynamic Analysis of Floating Offshore Solar Farms Subjected to Regular Waves. In Proceedings of the 5th International Conference on Mechanical, Manufacturing and Plant Engineering, Kuala Lumpur, Malaysia, 19–20 November 2019. [Google Scholar] [CrossRef]
  11. Elchahal, G.; Lafon, P.; Younes, R. Design Optimization of Floating Breakwater with an Interdisciplinary Fluid-Solid Structural Problem. Can. J. Civ. Eng. 2009, 36, 1732–1743. [Google Scholar] [CrossRef]
  12. Williams, A.N.; Lee, H.S.; Huang, Z. Floating Pontoon Breakwaters. Ocean Eng. 2000, 27, 221–240. [Google Scholar] [CrossRef]
  13. Huang, Z.; He, F.; Zhang, W. A Floating Box-Type Breakwater with Slotted Barriers. J. Hydraul. Res. 2014, 52, 720–727. [Google Scholar] [CrossRef]
  14. Neelamani, S.; Alragum, A. Hydrodynamic Performance of Floating Pontoon Type Breakwater with Skirt Walls and Different Porosity. In Proceedings of the ASME 41st International Conference on Ocean, Offshore and Arctic Engineering, Hamburg, Germany, 5–10 June 2022. [Google Scholar] [CrossRef]
  15. Koutandos, E.V.; Prinos, P.E. Hydrodynamic Characteristics of Semi-immersed Breakwater with an Attached Porous Plate. Ocean Eng. 2011, 38, 34–48. [Google Scholar] [CrossRef]
  16. Bryant, D.B.; Provost, L.A. Walter Marine and Atlantic Reefmaker Wave Attenuator; Rep. ERDC/CHL TR-22-3; U.S. Army Corps of Engineers: Vicksburg, MS, USA, 2022; Available online: https://erdc-library.erdc.dren.mil/jspui/bitstream/11681/43303/1/ERDC-CHL%20TR-22-3.pdf (accessed on 8 August 2023).
  17. Rocabado, I. Aquabreak (Aquaculture Living Breakwater for Coastal Protection and Sea Decarbonisation). Haedes Consultancy & Engineering. Available online: https://www.haedes.eu/aquabreak-aquaculture-living-breakwater-for-coastal-protection-and-sea-decarbonisation/ (accessed on 22 August 2023).
  18. Ukr-Techno, The Key to the Future. Ukr-Techno. Available online: http://ukrtechno.com/ (accessed on 11 September 2023).
  19. Zhao, X.L.; Ning, D.Z.; Zou, Q.P.; Qiao, D.S.; Cai, S.Q. Hybrid Floating Breakwater-WEC System: A Review. Ocean Eng. 2019, 186, 106126. [Google Scholar] [CrossRef]
  20. LaSalle Park Marina—Floating Breakwater. Kropf Industrial. Available online: https://kropfindustrial.com/case-study/lasalle-park-marina-floating-breakwater/ (accessed on 17 September 2023).
  21. SF Marina Builds Its Largest Floating Breakwater to Date. SF Marina. Available online: https://sfmarina.com/sf-marina-builds-its-largest-floating-breakwater-to-date/ (accessed on 26 September 2023).
  22. Pagliari Pier—La Spezia. Trevi. Available online: https://www.trevispa.com/en/projects/main-projects/pagliari-pier---la-spezia (accessed on 26 September 2023).
  23. Cebada-Relea, A.J.; Lopez, M.; Aenlle, M. Time-domain Numerical Modelling of the Connector Forces in a Modular Pontoon Floating Breakwater under Regular and Irregular Oblique Waves. Ocean Eng. 2022, 243, 110263. [Google Scholar] [CrossRef]
  24. Kusaka, T.; Ueda, S. Ujina Floating Ferry Pier and Kan-On Floating Breakwater, Japan. In Large Floating Structures, Ocean Engineering & Oceanography; Springer: Singapore, 2015; Volume 3, pp. 107–127. [Google Scholar] [CrossRef]
  25. Bouchet, R.; Sedillot, F.; Jaeger, J.M.; Troya, L.; Peset, L.; Martareche, F. Monaco semi-floating dyke—A 352 metre long concrete caisson. In Proceedings of the 5th Fib Symposium, Avignon, France, 26–28 May 2004. [Google Scholar]
  26. ISO 21650:2007; Actions from Waves and Currents on Coastal Structures. International Organization for Standardization: Geneva, Switzerland, 2007.
  27. Rules for High Speed, Light Craft and Naval Surface Craft; DNV-ALU STRUCTURES-HSC Part 3 Chapter 1; Det Norske Veritas: Bærum, Norway, 2011.
  28. International Code of Safety for High-Speed Craft—2008 Edition; 2000 HSC Code, 2008 Edition; The Maritime and Coastguard Agency: London, UK, 2008.
  29. ABS Guide for Passenger Comfort on Ships; American Bureau of Shipping: Houston, TX, USA, 2015.
  30. Freeman, L. Dynamic Motions of Piled Floating Pontoons and Their Impact on Postural Stability. Presented at the PIANC International De Paepe Willems Award, Australia, 2022; Available online: https://pianc.org.au/wp-content/uploads/2022/06/Freeman_PIANC_DePaepeAward-250522.pdf (accessed on 2 October 2023).
  31. Freeman, E.; Splinter, K.; Cox, R. Floating Breakwaters as Public Platforms—Impact on Postural Stability. Coast. Struct. 2018, 36, 12–30. [Google Scholar] [CrossRef]
  32. Cutajar, C.; Borg, A.; Sant, T.; Farrugia, R.N.; Buhagiar, D. Numerical Modelling of the Wave Attenuation of Floating Breakwaters in Deep Waters. In Proceedings of the 7th Offshore Energy and Storage Summit, St. Julian’s, Malta, 12–14 July 2023. [Google Scholar] [CrossRef]
  33. ANSYS Inc. Aqwa Theory Manual: Release 2022 R1; ANSYS, Inc.: Canonsburg, PA, USA, 2022. [Google Scholar]
  34. Faltinsen, O.M. Sea Loads on Ships and Offshore Structures; Cambridge University Press: Cambridge, UK, 1990. [Google Scholar]
  35. Holthuijsen, L.H. Waves in Oceanic and Coastal Waters; Cambridge University Press: Cambridge, UK, 2007. [Google Scholar]
  36. Environmental Conditions and Environmental Loads; DNVGL-RP-C205; Det Norske Veritas: Bærum, Norway, 2019.
  37. Cui, J.; Liu, H.; Deng, X.; Tao, S.; Li, Q. An Experimental Study on Hydrodynamic Performance of a Box-floating Breakwater in Different Terrains. J. Mar. Sci. Technol. 2020, 25, 991–1009. [Google Scholar] [CrossRef]
  38. Rajabi, M.; Ghassemi, H. Hydrodynamic Performance Improvement of Double-Row Floating Breakwaters by Changing the Cross-Sectional Geometry. Math. Probl. Eng. 2021, 2021, 2944466. [Google Scholar] [CrossRef]
  39. Multiple Use of Space for Island Clean Autonomy. Musica Project. Available online: https://musica-project.eu/ (accessed on 22 August 2023).
  40. Cutajar, C.; Sant, T.; Farrugia, R.N.; Buhagiar, D. A Software Tool for the Design and Operational Analysis of Pressure Vessels Used in Offshore Hydro-Pneumatic Energy Storage. J. Energy Storage 2021, 40, 102750. [Google Scholar] [CrossRef]
  41. EN 13445-2:2014; Unfired Pressure Vessels—Part 2: Materials. European Committee for Standardization: Brussels, Belgium, 2014.
  42. EN 13445-3:2014; Unfired Pressure Vessels—Part 3: Design. European Committee for Standardization: Brussels, Belgium, 2014.
  43. EN 13445-5:2014/A1:2018; Unfired Pressure Vessels—Part 5: Inspection and Testing. European Committee for Standardization: Brussels, Belgium, 2018.
  44. Specification for Line Pipe, API Specification 5L 46th ed.; American Petroleum Institute: Washington, DC, USA, 2018.
  45. European Commission. Directive, 2014/68/EU of the European Parliament and of the Council of 15 May 2014 on the Harmonisation of the Laws of the Member States Relating to the Making Available on the Market of Pressure Equipment; European Union: Brussels, Belgium, 2014. [Google Scholar]
  46. Global Performance Analysis of Deepwater Floating Structures; DNVGL-RP-F205; Det Norske Veritas: Bærum, Norway, 2017.
  47. Hales, L.Z. Floating Breakwaters: State-of-the-Art Literature Review; Rep. 81-1; U.S. Army Corps of Engineers: Norfolk, VA, USA, 1981. [Google Scholar]
  48. Position Mooring; DNVGL-OS-E301; Det Norske Veritas: Bærum, Norway, 2018.
  49. ABS Guide for Position Mooring Systems; American Bureau of Shipping: Houston, TX, USA, 2018.
  50. Manual on Codes, International Codes, 2019 ed.; World Meteorological Organization: Geneva, Switzerland, 2019; Volume I.1.
  51. Duarte, T.; Gueydon, S.; Jonkman, J.; Sarmento, A. Computation of Wave Loads under Multidirectional Sea States for Floating Offshore Wind Turbines. In Proceedings of the 33rd International Conference on Ocean, Offshore and Arctic Engineering, San Francisco, CA, USA, 8–13 June 2014. [Google Scholar] [CrossRef]
  52. Solving Complex, Real-World Problems. BMT. Available online: https://www.bmt.org/ (accessed on 24 August 2023).
  53. De Leo, F.; Besio, G.; Mentaschi, L. Trends and Variability of Ocean Waves under RCP8.5 Emission Scenario in the Mediterranean Sea. Ocean Dyn. 2021, 71, 97–117. [Google Scholar] [CrossRef]
Figure 1. Baseline FBW—Model A.
Jmse 11 02189 g001
Figure 2. Hybrid FBW with integrated HPES system—Model B.
Jmse 11 02189 g002
Figure 3. Validation plots comparing the numerical outputs from AQWA™ against the experimentation outputs from [37].
Jmse 11 02189 g003
Figure 4. Repeatability plot [38].
Jmse 11 02189 g004
Figure 5. Grid convergence plot.
Jmse 11 02189 g005
Figure 6. Time step convergence plot.
Jmse 11 02189 g006
Figure 7. Variation of K t with incident wave period for fixed-FBW Models A and B.
Jmse 11 02189 g007
Figure 8. Variation of K t with incident wave period for free-FBW Models A and B.
Jmse 11 02189 g008
Figure 9. Mooring configuration (plan view).
Jmse 11 02189 g009
Figure 10. Maximum peak-to-peak surge displacements.
Jmse 11 02189 g010
Figure 11. Maximum peak-to-peak heave displacements.
Jmse 11 02189 g011
Figure 12. Maximum peak-to-peak pitch displacements.
Jmse 11 02189 g012
Figure 13. Maximum surge accelerations.
Jmse 11 02189 g013
Figure 14. Maximum heave accelerations.
Jmse 11 02189 g014
Figure 15. Maximum pitch accelerations.
Jmse 11 02189 g015
Table 1. Hydrostatic properties for the baseline and hybrid FBWs.
ParameterBaseline Model AHybrid Model B
HPES system (-)NoYesYes
State of charge (-)-S1S2
Length   of   floater L o (m)150150150
Width   of   floater B o (m)181818
Height   of   floater H o (m)11.9011.9011.90
Wall thickness—t1 (m)0.300.300.30
Wall thickness—t2 (m)0.200.200.20
Wall thickness—t3 (m)1.901.901.90
Water-plane area A w p (m2)270027002700
Freeboard f b (m)5.725.465.04
Floater   draught Z s , f b w (m)6.196.436.86
Total   draught Z s , t o t (m)6.1912.5312.96
Total   displaced   volume V s , t o t (m3)16,70019,60020,700
Total   mass M t o t (t)17,12020,05021,220
Distance from MSL to Centre of Buoyancy (CoB)—OB (m)3.094.014.20
Distance from MSL to Centre of Gravity (CoG)—OG (m)3.333.474.27
Transverse metacentric height—GMt (m)4.613.193.59
Roll   Inertia I g x (kg m2)3.23 × 10103.33 × 10103.58 × 1010
Pitch   Inertia I g y (kg m2)6.64 × 1081.32 × 1091.67 × 109
Yaw   Inertia I g z (kg m2)3.26 × 10103.29 × 10103.51 × 1010
Natural   period   in   heave T n , 33 (s)7.277.567.69
Natural   period   in   roll T n , 44 (s)7.107.207.33
Natural   period   in   pitch T n , 55 (s)6.828.388.01
Table 2. Thermodynamic operating conditions for the PCS.
ParameterValue
Total   energy   storage   capacity E (MWh) 3.84
Total   volumetric   capacity   of   PVB V p v b (m3)1901
Mass   of   pressurized   fluid   ( i . e . ,   air ) m a i r (t)181
Operating   pressure   ratio r p (-)2.50
Pre-charged pressure p 1 (bar)80
Peak   pressure p 2 (bar)200
Design   pressure p d (bar)220
Table 3. Structural properties for the PCS obtained from SmartPVB [40].
ParameterValue
Number   of   cylinders N (-)8
Length   of   cylinders L p v (m)150
Outer   diameter D o (m)1.524
Internal   diameter D i (m)1.423
Total   wall   thickness e (m)0.050
Corrosion   allowance e c (m)0.003
Total   mass   of   steel m s t (t)2304
Additional   mass   allowance   per   PV m a (%)5
Von   Mises   safety   factor f v m (-)1.70
Table 4. Properties of the spread, high-stiffness catenary mooring system.
Parameter Value
Nominal chain diameter (m)0.171
Angle with seabed (°)0
Anchoring depth (m)200
Un-stretched cable length for corner lines (x4) (m)1420
Un-stretched cable length for middle lines (x2) (m)1231
Pre-tension per cable (kN)4800
Transverse drag coefficient (-) [48]2.40
Longitudinal drag coefficient (-) [48]1.15
Safety factor under normal conditions (-) [49]1.67
Maximum allowable load under normal conditions (kN)15,000
Table 5. Test matrix for time response analysis in the HR domain in ANSYS® AQWA™.
Load Case
(-)
Wave Type
(-)
Wave Height
H (m)
Wave Period
T (s)
WMO Code
(-) [50]
Sea State
(-) [50]
1Regular7.710.57High
2Regular3.17.55Rough
3Regular1.55.54Moderate
4Irregular4.58.56Very rough
5Irregular2.26.54Moderate
6Irregular1.14.53Slight
Table 6. Peak and RMS accelerations of the FBW models in surge (i.e., lateral) and heave (i.e., vertical) directions for LC 1.
DoFAcceleration (g)Model AModel B (S1)Model B (S2)Difference (%)
Surge (X)Peak— x ¨ m a x 0.1410.1350.132−5.451
RMS— x ¨ r m s 0.0950.0910.089−4.979
Heave (Z)Peak— z ¨ m a x 0.1700.1670.167−1.962
RMS— z ¨ r m s 0.1010.1020.103+1.567
Table 7. Peak and RMS accelerations of the FBW models in surge (i.e., lateral) and heave (i.e., vertical) directions for LC 4.
DoFAcceleration (g)Model AModel B (S1)Model B (S2)Difference (%)
Surge (X)Peak— x ¨ m a x 0.2720.2550.248−7.530
RMS— x ¨ r m s 0.0220.0210.020−7.584
Heave (Z)Peak— z ¨ m a x 0.2420.2350.233−3.501
RMS— z ¨ r m s 0.0250.0240.024−3.698
Disclaimer/Publisher’s Note: The statements, opinions and data contained in all publications are solely those of the individual author(s) and contributor(s) and not of MDPI and/or the editor(s). MDPI and/or the editor(s) disclaim responsibility for any injury to people or property resulting from any ideas, methods, instructions or products referred to in the content.

