1. Introduction
The transition toward a sustainable future has become a global imperative, and the European Union (EU) is leading the way through its ambitious Green Deal and commitment to the United Nations’ Sustainable Development Goals (SDGs) outlined in Agenda 2030. As part of these initiatives, the EU is actively promoting the adoption of new technologies for energy generation from marine sources to enhance the sustainability of ports and maritime operations. By leveraging marine energy technologies, ports can not only become more self-sufficient in terms of their energy needs but also serve as hubs for renewable energy production and distribution. The EU has recognized the importance of marine energy within its energy transition strategies. The European Green Deal emphasizes the need to invest in clean technologies and accelerate the deployment of renewable energy sources. Additionally, Agenda 2030 calls for increased access to affordable and clean energy (SDG 7) and the promotion of sustainable economic growth and decent work (SDG 8). To support these objectives, the EU has been actively funding research and development projects in the field of marine energy. For instance, the Horizon 2020 program has provided significant financial support to advance the development and commercialization of innovative technologies for harnessing marine energy. Projects such as MaRINET2 (Marine Renewables Infrastructure Network) and OPERA-Net (Optimizing Power Efficiency in Mobile Radio Networks) have facilitated collaboration among researchers, industry stakeholders, and port authorities to accelerate the deployment of marine energy solutions. Within this context, it is imperative to underscore the EU Directive 2014/94, which assumes a proactive stance in promoting the establishment of infrastructures explicitly designed to fortify the utilization of alternative fuels (DAFI—Directive on Alternative Fuels Infrastructure). Notably, the directive acknowledges the salient role of cold ironing, denoting technologies proficient in supplying energy to vessels during their berth via an electrical connection with the mainland. This multifaceted approach is indispensable in the abatement of the environmental impact wrought by maritime activities, consequently mandating the construction of requisite infrastructure in EU ports, an imperative to be realized by the year 2025.
In this context, marine energy emerges as one of the most promising alternatives to fossil fuels due to its development prospects in the coming years [
1]. The conversion of electrical power from marine resources could substantially contribute to the world’s electricity production demand without causing damage to the marine environment. Currently, there are still few companies that specialize in marine renewable energy, primarily due to high material costs and installation challenges. Even though the estimated marine energy potential is 32 PWh/y [
2], only a small quantity is currently being harvested worldwide [
3]. In recent years, the European Commission has strengthened its support for the development of ocean energy, identifying this sector as a key technological area within the Strategic Energy Technology Plan of the EU [
4]. According to IEA’s (International Energy Agency) Ocean Energy System 2014 and Ocean Energy Europe 2016, by 2050 marine energy is projected to be primarily widespread throughout Europe, creating an estimated 40,000 jobs and providing up to 100 GW on the Continent, equivalent to 10% of electricity consumption. While the majority of global marine generation capacity comes from tidal ranges [
5], wave energy can be considered an emerging energy source with the potential to address many of the challenges posed by current renewable energy concepts and devices [
6], including its predictive capacity for energy potential [
7,
8], allowing for the identification of areas with higher energy yield.
In the Mediterranean Sea, where tidal excursions are generally low (with the exception of the northern Adriatic Sea and the Gulf of Gabes) and significant tidal currents are found only in specific areas (such as the Strait of Messina), waves have been considered a potentially exploitable energy source in recent years. Although the wave energy potential in this basin is approximately 10 times lower than the oceans, detailed studies [
9,
10] have been conducted to identify areas with the highest energy potential for wave energy converters (WECs). These studies have shown that the west coast of Sardinia and the Strait of Sicily represent the most promising areas, with energy potentials ranging from 8.91 to 10.29 kW/m [
11] and from 7.5 to 6.5 kW/m [
9], respectively, with the highest values occurring during the winter period. Further studies have also revealed that the northern coast of Latium has high energy levels, some of which can exceed the energy of the offshore area [
12]. These findings have supported the development of shoreline devices (REsonant Wave Energy Converter, REWEC; [
13]) and near-shore devices (Inertial Sea Wave Energy Converter, ISWEC; [
14]) in the Mediterranean basin, which have lower installation and maintenance costs compared to offshore devices [
15]. One example of such a device is the WaveSAX device [
16], developed by RSE as part of an Electrical System Research project (granted European Patent N° 2995807 B1 published in the Bulletin 2017/44 of 1 November 2017). It is an oscillating water column (OWC) device that can be easily installed in coastal maritime structures, thereby producing a negligible environmental impact. WaveSAX’s development has been supported by numerical simulations and experimental tests in prestigious European hydraulic laboratories, aiming to define the power matrix of the device, which enables the conversion of the wave energy related to a certain sea state into direct usable electric energy [
11,
17].
The use of numerical models has significantly advanced wave energy assessments, providing detailed information on the availability of wave power at global [
7,
8] and regional [
18,
19,
20,
21] scales for accurate estimation of wave energy flux characteristics in the design of wave energy converters [
10,
22]. At the local scale, while stationary wave models (for example Simulating WAves Nearshore, SWAN) may not precisely capture how wave parameters change near wave converter devices [
23,
24,
25], they can simulate wave reflection and transmission processes near port structures using fixed coefficients [
26]. Thanks to this approximation, these models allow us to reproduce the wave conditions for a long time period [
27,
28,
29,
30] with relatively low computational effort, contributing to the proper estimation of the annual energy potential map in the coastal area.
In the proximity of vertical caisson-based port structures, the occurrence of wave reflection has the potential to amplify the amplitude of incoming waves within specific regions situated in front of the harbor breakwater. This phenomenon, arising from the interaction between incoming and reflected waves, significantly amplifies the energy potential, frequently surpassing offshore wave energy levels.
Furthermore, information on wave energy persistence is crucial for assessing typical conditions and determining the optimal operational interval for device design. This information helps identify the proportion of sea states (i.e., wave power) that fall below a critical level, as well as extreme events, providing insights into the reliability of operational limits [
31,
32].
This study assesses the electricity generation potential from wave motion near Civitavecchia Port in Latium, Italy. This region, heavily influenced by human activities, features a complex coastal morphology, including areas covered by seagrass (Posidonia oceanica). Notably, this location served as the site for sea trials of the WaveSAX conversion device. An in-depth analysis of the wave field within this area, employing high spatial resolution, provides precise information about the distribution of available wave energy throughout the port vicinity. These findings not only enable a more accurate scaling and sizing of the WaveSAX device but also identify optimal locations for deploying these units, with a particular focus on areas characterized by higher wave energy levels. By assessing the wave energy potential and characteristics in this region, we can gain valuable insights into the feasibility and effectiveness of deploying the WaveSAX system for sustainable energy generation in the harbor.
2. Materials and Methods
2.1. Study Area
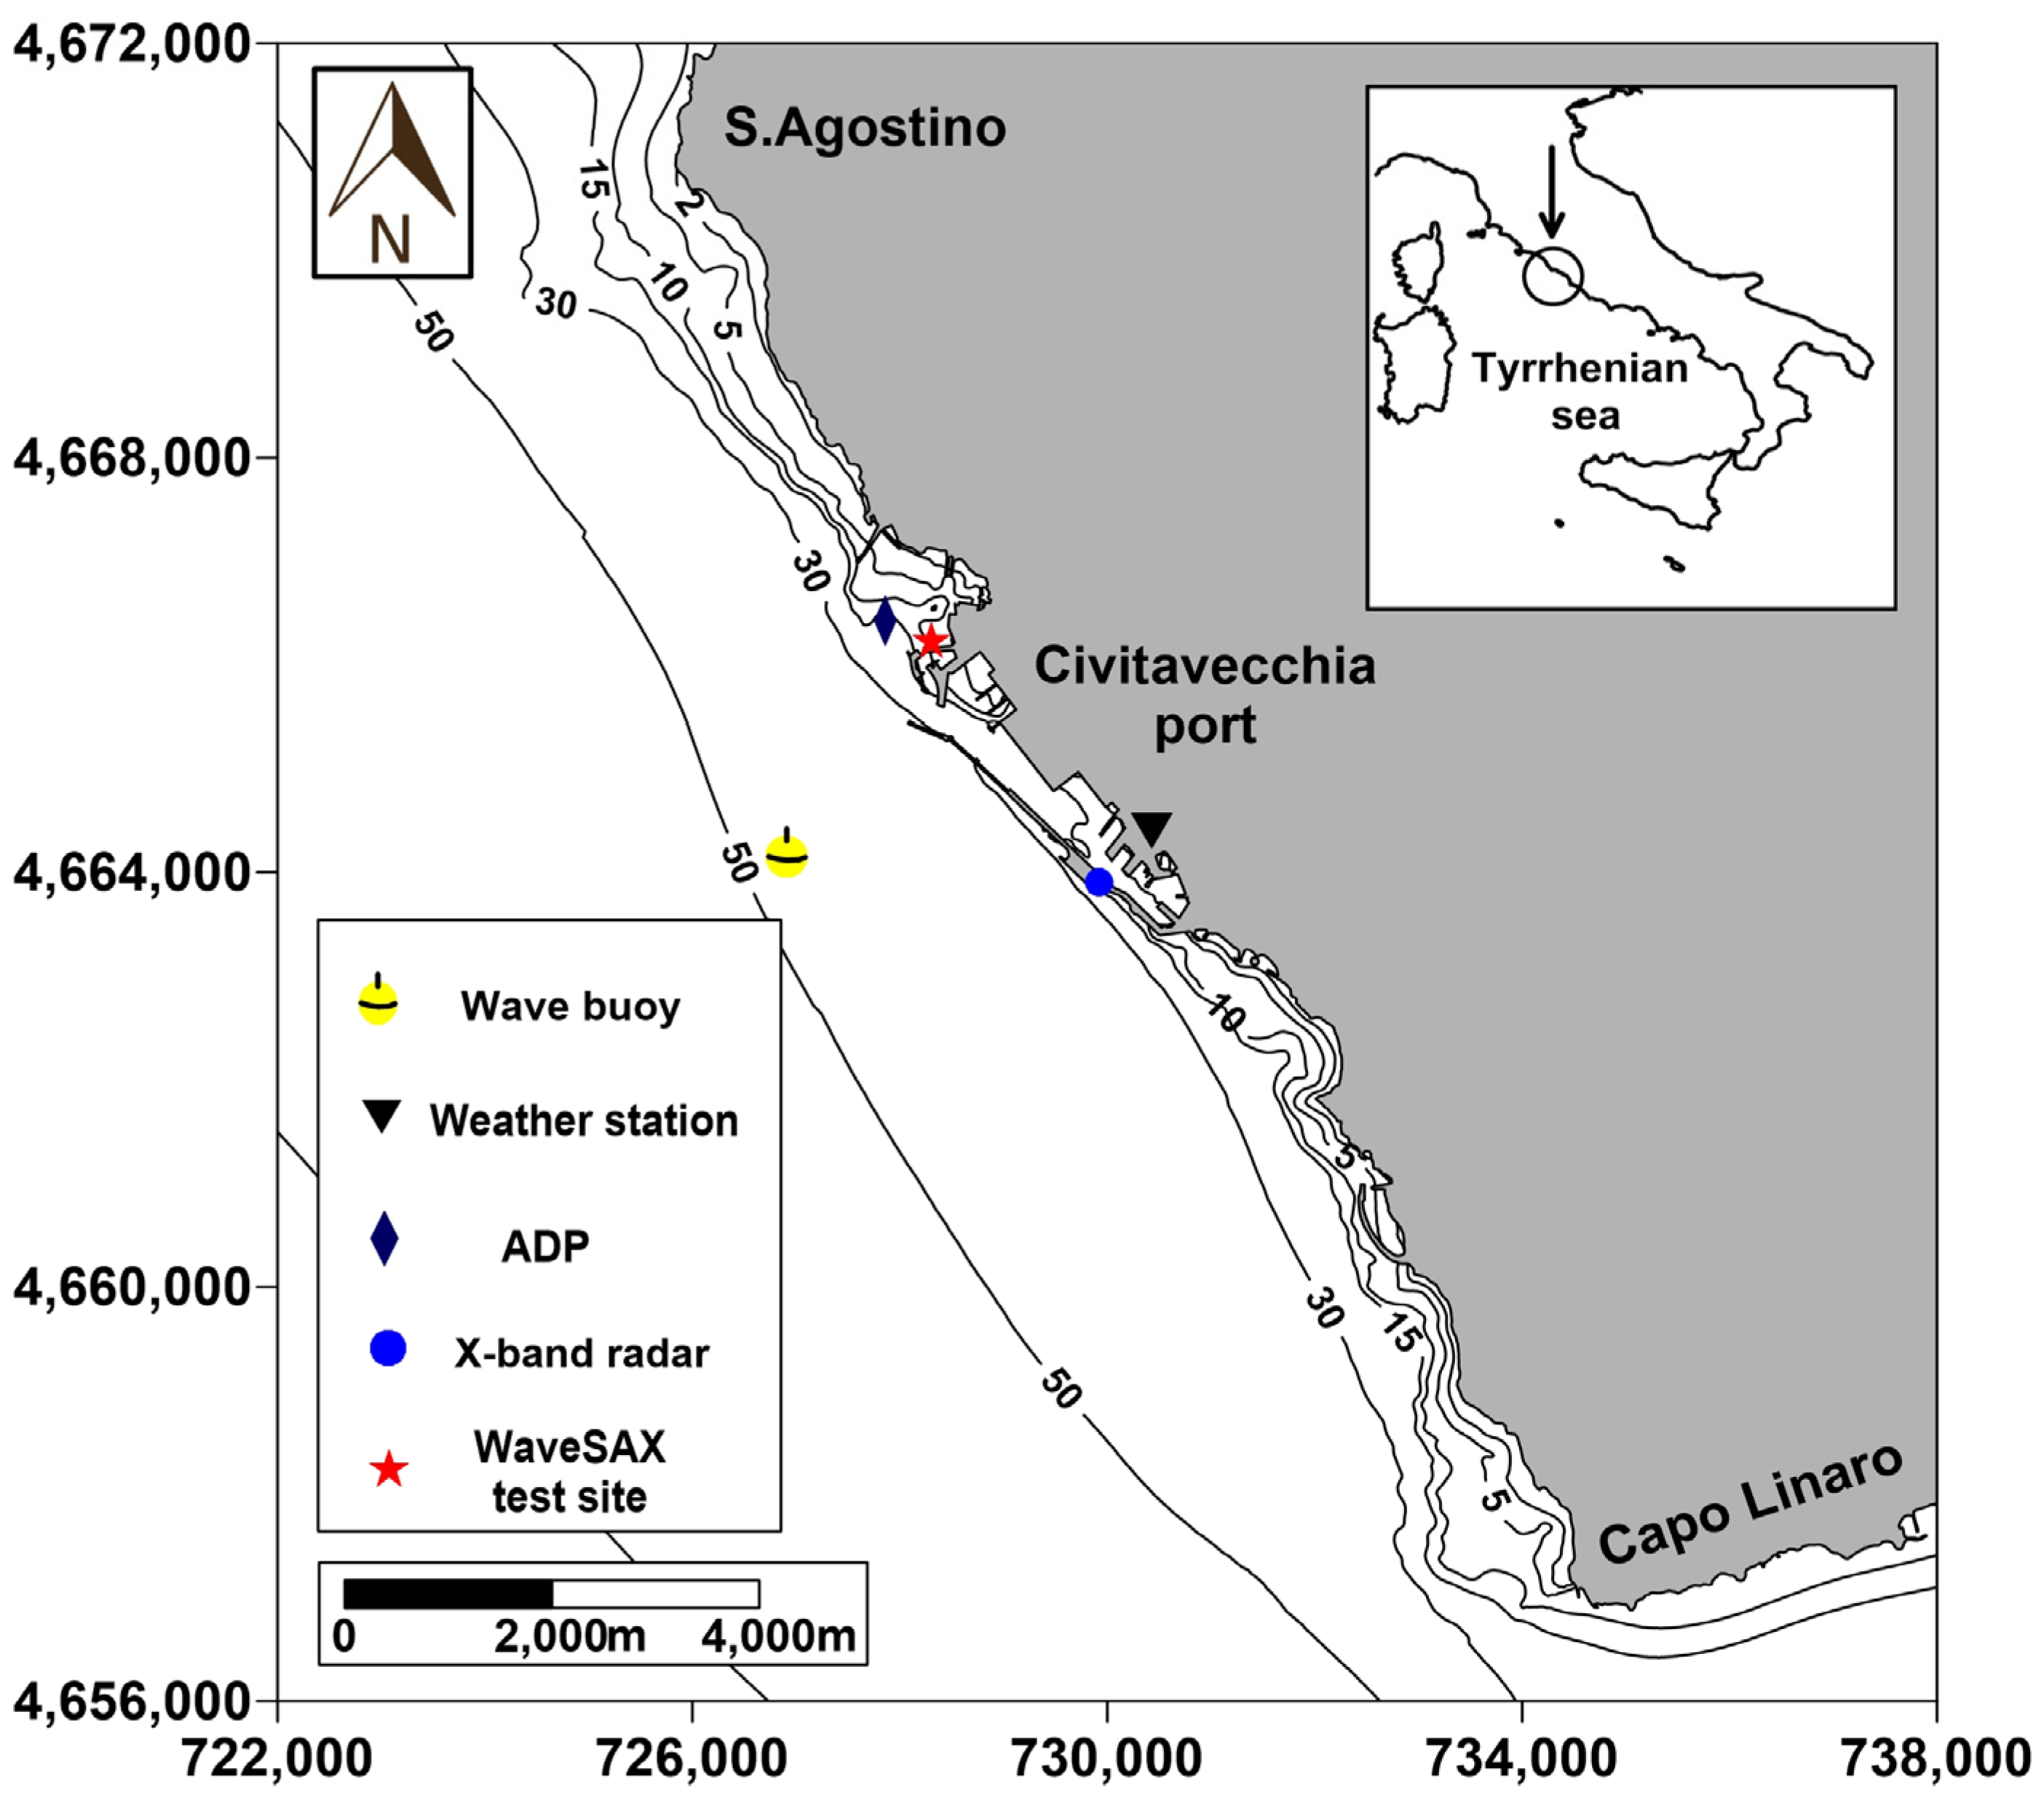
The study area encompasses the stretch from Sant’Agostino to Capo Linaro along the northeastern coast of the Tyrrhenian Sea in Italy (
Figure 1). It includes the Port of Civitavecchia, where sea tests were conducted from 11 to 18 October 2018, with the WaveSAX-1 prototype, and from 10 September to 23 November 2021, with the updated WaveSAX-2 prototype (red star in
Figure 1).
Civitavecchia Port, being one of the most prominent ports in the Mediterranean for both commercial and tourist traffic, has seen a remarkable surge in scheduled services catering to passengers and goods transport along Mediterranean routes in recent years. This rapid growth has prompted substantial expansion efforts, including the construction of new docks and berths. Consequently, there has been an imperative need for comprehensive environmental studies to assess the health of the coastal marine ecosystems and water quality in the Civitavecchia coastal zone [
33,
34].
Reflecting its pivotal role as a maritime hub, the current energy demand for the Port of Civitavecchia is substantial. In recent years, its annual energy consumption has been estimated to range between 15 and 20 GWh [
35,
36], primarily powering the buildings connected to the port’s electrical grid. The harbor has experienced consistent growth in operations and shipping activities, with an average annual increase of 5% over the past decade (prior to the COVID-19 crisis). Looking ahead, the port has plans to construct 8 electrified berths utilizing cold ironing technology [
37], which will lead to an approximate increase of 55 GWh in the port’s energy requirements per year.
The Port System Authority of the Central Northern Tyrrhenian Sea recognizes the vital importance of meeting this escalating energy demand to maintain the port’s efficiency and competitiveness. In response to the growing emphasis on reducing carbon emissions and transitioning to sustainable energy sources within the maritime industry, the Port of Civitavecchia has actively explored renewable energy alternatives to fulfill its annual energy needs. Numerous projects have been initiated in recent years, focusing on the installation and testing of various innovative prototypes of oscillating water columns (OWCs), such as REWEC [
13] and WaveSAX [
16].
The implementation of these projects has been made possible through the operation of the Civitavecchia Coastal Environment Monitoring System (C-CEMS) since 2005 [
38] within the port. C-CEMS continuously monitors weather conditions and the sea state using a weather station (black triangle,
Figure 1) for wind measurements (magnitude and direction) and a wave buoy (yellow and black circle,
Figure 1) that provides wave parameters (significant wave height, peak period, and mean direction) in the open sea. Additionally, waves and sea currents are measured using X-band radar (blue circle,
Figure 1) and an Acoustic Doppler Profiler (ADP) sensor (green diamond,
Figure 1) positioned inside a Barnacle structure on the seabed at a depth of approximately 20 m.
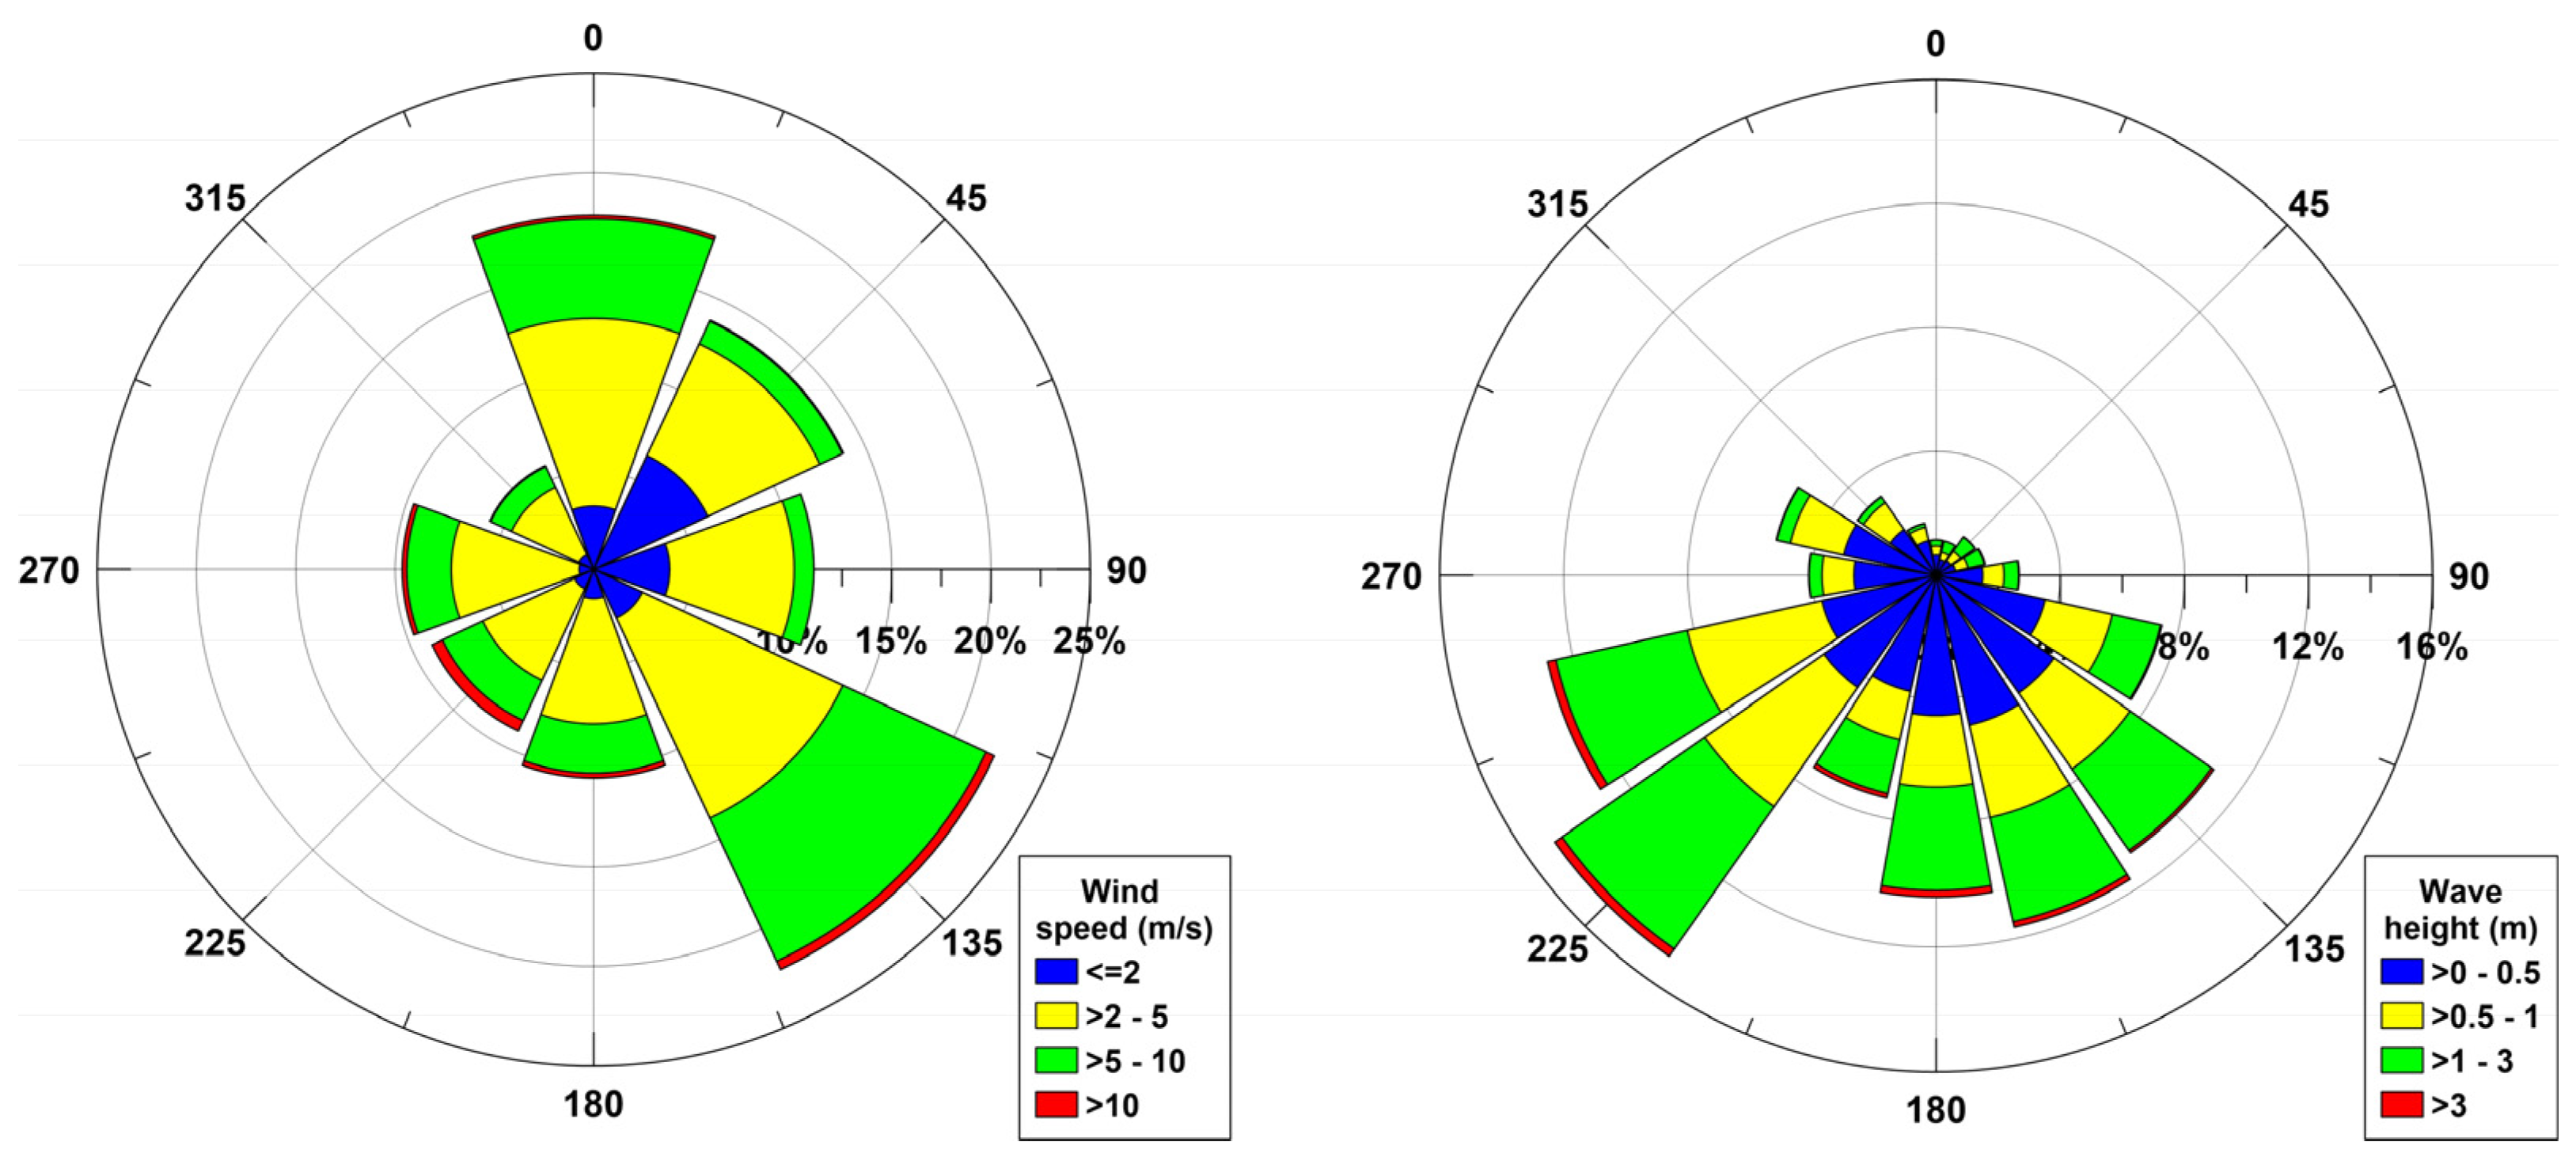
Based on wind data collected by the weather station of the C-CEMS situated within the Port of Civitavecchia (
Figure 2 on the left), it is evident that the prevailing wind events primarily originate from the eastern quadrants. However, the most intense winds, characterized by high intensities, tend to come from the southeast (Scirocco) and southwest (Libeccio) directions.
Regarding the wave climate, as recorded by the wave buoy (
Figure 2 on the right), it is notable that the most significant wave events, exceeding 3 m in height and occurring with a frequency of over 15%, originate from the southwest direction.
2.2. Description of WaveSAX
The WaveSAX device was conceived as a cost-effective solution for installation in existing coastal infrastructures, such as ports, harbors, breakwaters, and coastal protection works, located close to areas requiring power supply. Two key considerations guided its conceptual design:
Flexibility: The device can be installed in various structural configurations of existing coastal infrastructures (vertical or inclined breakwaters, coastal protection barriers, etc.), which allows it to minimize installation, maintenance, and grid connection costs;
Replicability: The modular design of the WaveSAX device enhances its scalability, enabling the cost-effective replication of a substantial number of units, ranging from tens to hundreds. This approach not only makes it economically competitive in terms of construction expenses but also permits a gradual implementation strategy aligned with the local energy demand and available financial resources.
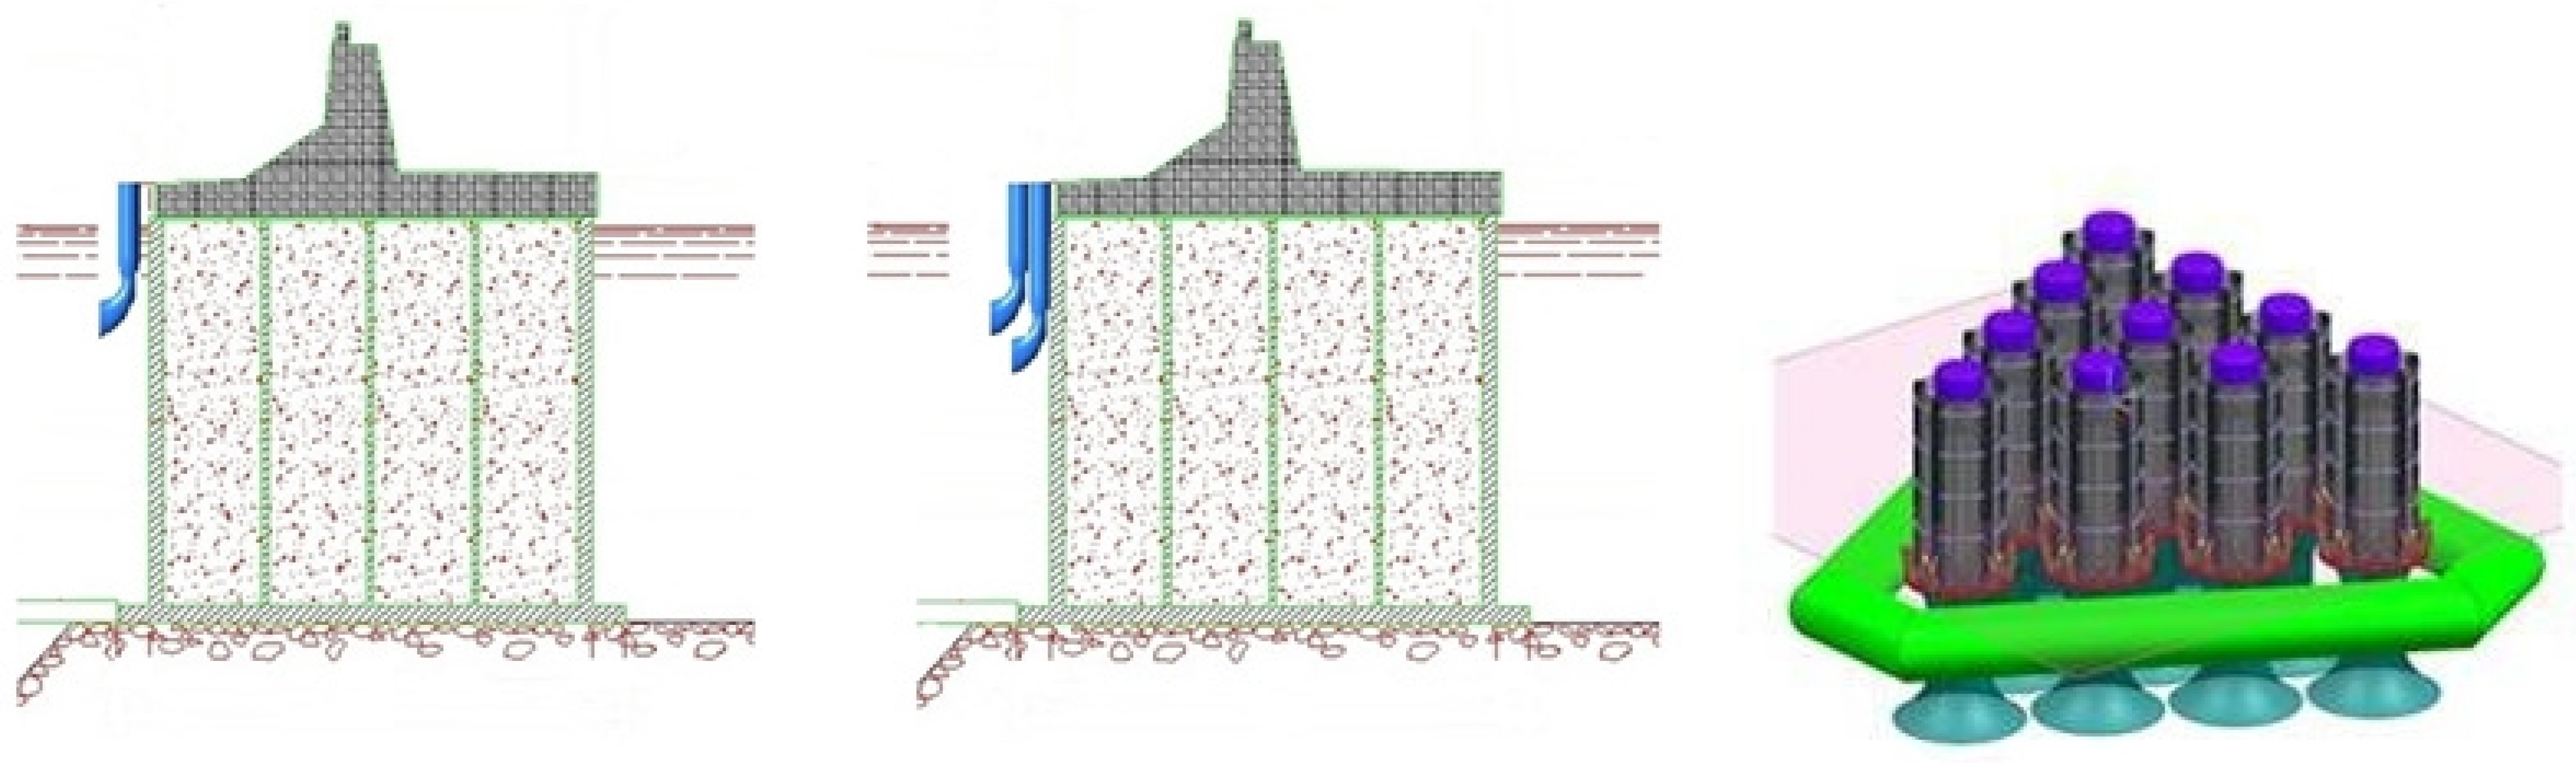
The WaveSAX system operates on the principle of an “oscillating water column” with an innovative configuration that allows vertical ascending and descending movements of water within a pipe [
39]. This movement converts hydraulic energy into electricity using a turbine and generator positioned in the liquid phase (
Figure 3).
The technical design involves directing the wave-induced motion of seawater within a vertical or sub-vertical pipe, where the water’s vertical movements activate a hydraulic turbine connected to an electricity generator. The pipe is designed to create optimal hydrodynamic conditions, including pressure and water flow speed, preferably through a narrow section, ensuring efficient operation of the turbine [
16]. The hydraulic turbine used in the system is typically bi-directional, allowing the rotor to rotate in the same direction regardless of the water flow direction within the pipe (ascending or descending). The hydrodynamic design minimizes losses due to friction and turbulence, maximizing the energy extracted from wave motion [
40].
The design parameters of the WaveSAX device encompass several key elements, including the dimensions of the oscillating water column (OWC) pipe in terms of height and diameter, the size of the turbine, and the power specifications of the electrical machine (motor generator). The scaling and design of the device are intricately tied to the characteristics of the local wave climate. The 1:5 scale prototype features a pipe measuring 1.4 m in length with a diameter of 0.30 m. The turbine rotor is equipped with a diameter of 0.20 m, and the electric generator boasts nominal specifications, including a voltage rating of 18 V, a nominal current of 5.7 A, a nominal torque of 218 mNm, and a nominal speed of 3930 rpm.
The system is intended to incorporate a movable device controlled by mechanical and/or optical probes, as well as specialized software. This device adjusts the pipe’s position in response to sea level changes, particularly the height of incoming waves. It also enables the rotation of the pipe around its vertical axis to align the water inlet with the direction of wave motion.
WaveSAX-2 was developed to be installed in an array, positioned in front of or embedded in the caissons to avoid destructive interference, made up of ten/or more units (1.5 m wide each), and located in one line with two parallel lines or triangular configurations [
39], allowing it to increase the generation efficiency per meter of the wave front (
Figure 4).
2.3. Laboratory Tests of WaveSAX
In accordance with wave energy system development guidelines (Holmes et al., 2010), the WaveSAX device underwent comprehensive testing and analysis in multiple research facilities. Computational Fluid Dynamics (CFDs) analysis was employed, with the methodology validated against laboratory tests, to enhance the device’s performance and optimize power conversion efficiency. The scaled 1:20 model was tested at the Hydraulics and Marine Research Centre in Cork, Ireland, demonstrating satisfactory functionality in various wave conditions [
41]. Valuable insights were obtained regarding the design and placement of the device, aiding in its optimization. The scaled 1:5 model was then tested at the Ecole Centrale de Nantes in France, assessing different turbine configurations and wave conditions representative of the Tyrrhenian coast [
16]. Results showed successful conversion of wave power into mechanical energy, with the 3-blade configuration performing better at lower waves and the 4-blade configuration showing improved performance at higher waves. However, challenges were observed with the Wells turbine in irregular wave conditions. Further testing at the Institute of Marine Engineering (CNR—Consiglio Nazionale delle Ricerche) in Rome, Italy, involved the evaluation of various control strategies and turbine configurations, leading to enhanced power take-off performance. The findings highlighted the effectiveness of angular velocity control. These studies contribute significant insights into the ongoing development of the WaveSAX system for coastal energy conversion, providing valuable information for optimization and future improvements [
41].
2.4. Sea Tests of WaveSAX
The sea trials of the device were conducted in the northern area of the Port of Civitavecchia (red star in
Figure 1). To avoid potential damage from intense storm events, WaveSAX was installed in a location exposed only to events from the northwest and protected from the strongest surges from the southern quadrants (
Figure 2).
In order to calculate the power matrix of the device and test the control parameters (i.e., reference velocity, ω, and stiffness constant, kc) that best fit irregular waves, the tests were carried out from 11 to 18 October 2018, with the WaveSAX-1 prototype, and from 10 September to 23 November 2021, with the WaveSAX-2 prototype. These two prototypes differ mainly in the type of Wells turbine installed and the device’s positioning relative to sea level. The test period was chosen based on the highest probability of occurrence of storms from the west and northwest directions during the autumn months, with a significant height typically not exceeding 1.2 m, which was suitable for the 1:5 scale prototype.
During the sea trials, the WaveSAX device’s operational and generation capacity were systematically evaluated by optimizing the reference speed (ω in rpm) and the stiffness constant (kc in As/rad). The device’s control system enabled real-time monitoring of various temporal variables:
Energy consumed (in Ws) by the generation and control system during periods when the motor generator operated in “motor” mode;
Energy generated (in Ws) by the generation and control system during periods when the motor generator operated in “generator” mode;
Net energy (in Ws) is represented as the cumulative sum of energy consumption and energy generation by the device;
Electrical voltage (in V) is measured across the battery terminals;
Current intensity (in A) is recorded at the battery terminals;
Control strategy parameters, including ω and kc;
Pressure (in mmH2O) is measured by specific sensors situated both inside and outside the device, including locations within the oscillation column (upstream and downstream of the working section) and external points for monitoring incoming waves;
Turbine rotation speed (in rpm);
Torque (in Nm) is exerted by the turbine on the axis.
Each test, lasting around three minutes, involved selecting cycles of three similar waves to assess the net electrical energy at the battery terminals based on the incoming wave characteristics, specifically wave height and period. The hydraulic, mechanical, and electrical parameters measured during the sea trials with the 1:5 scale prototype at Civitavecchia Port were consistently examined across all tests. Subsequently, the electrical energy values were adjusted to simulate a 1:1 device using Froude similarity conversion coefficients, where a power scale factor (kP) of 0.0036 was applied (kP = kL3.5, with kL being the geometric scale factor equal to 0.2). Assessments for the full-scale prototype were categorized into groups based on average wave height and period, and the mean producible electrical energy was computed.
Based on these measurements, power values were then calculated for different wave height and period classes. This facilitated the creation of a power matrix for the WaveSAX-1 prototype, which features a 6-blade Wells turbine (as shown in
Figure 5) [
39,
42]. However, it is important to highlight that due to the depth at which the device was installed, the turbine went above the water surface during the passage of higher waves, resulting in no generation at those times.
Based on the experience gained during the sea trials of the WaveSAX-1 prototype, two significant modifications were made to WaveSAX-2: (i) the Wells turbine with 7 blades and a slightly different shape, which achieved high performance in fluid dynamic studies, and (ii) the installation was positioned 40 cm lower than WaveSAX-1 to prevent the turbine from emerging during the passage of the most intense wave crests. The results of the sea trials provided the values to develop the power matrix for the new WaveSAX-2 device configuration at a 1:1 scale (
Figure 6) [
39,
42].
The analysis of the obtained data from WaveSAX-2 showed a better performance compared with the previous WaveSAX-1, confirming a higher electrical generation capacity with increasing wave height. For the wave period, a nearly parabolic behavior was observed, where the conversion capacity increased up to a maximum value and then slightly decreased.
The device’s durability primarily depends on two critical factors: (i) its ability to withstand extreme wave conditions and (ii) its capacity to resist marine fouling. The first challenge can be effectively addressed by situating the device within the protective structure of the caisson, thereby enhancing its resistance against the effects of wave motion. For the second concern, safeguarding the device through the application of suitable antifouling techniques extends routine maintenance intervals. Notably, sea trials evaluating antifouling methods for use with the WaveSAX device were conducted at Civitavecchia Port [
39].
An assessment of the technical and economic feasibility of WaveSAX, conducted both in Italian and Portuguese coastal sites [
42], revealed the technology’s promising prospects in the medium term. It was established that the device could significantly contribute to fulfilling the objectives outlined in the SET Plan for ocean energy. This plan advocates achieving a Levelized Cost of Energy (LCOE) equal to 0.20 €/kWh by 2025 and further reducing it to 0.10 €/kWh by 2035 [
43].
2.5. Description of the Wave Model
To calculate the wave parameters (significant wave height, peak period, mean direction) in the coastal area, the Simulating WAves Nearshore (SWAN) model [
44] was employed, as it is capable of simulating wave propagation toward the coast, accounting for refraction, diffraction, shoaling, and breaking processes.
SWAN is a third-generation wave model used in stationary mode to compute random, short-crested wind-generated waves in coastal regions and inland waters. In this model, the evolution of the wave spectrum is described by the spectral action balance equation [
45]:
The left side of this equation consists of five terms. The first term represents the local rate of change in action density over time, the second and third terms indicate the propagation of action in geographical space, the fourth term signifies the shifting of the relative frequency due to variations in depths and currents, and the fifth term represents depth-induced and current-induced refraction. Finally, the W variable on the right side of the action balance equation is the source of energy density, representing the effects of wave generation, dissipation, and non-linear wave–wave interaction.
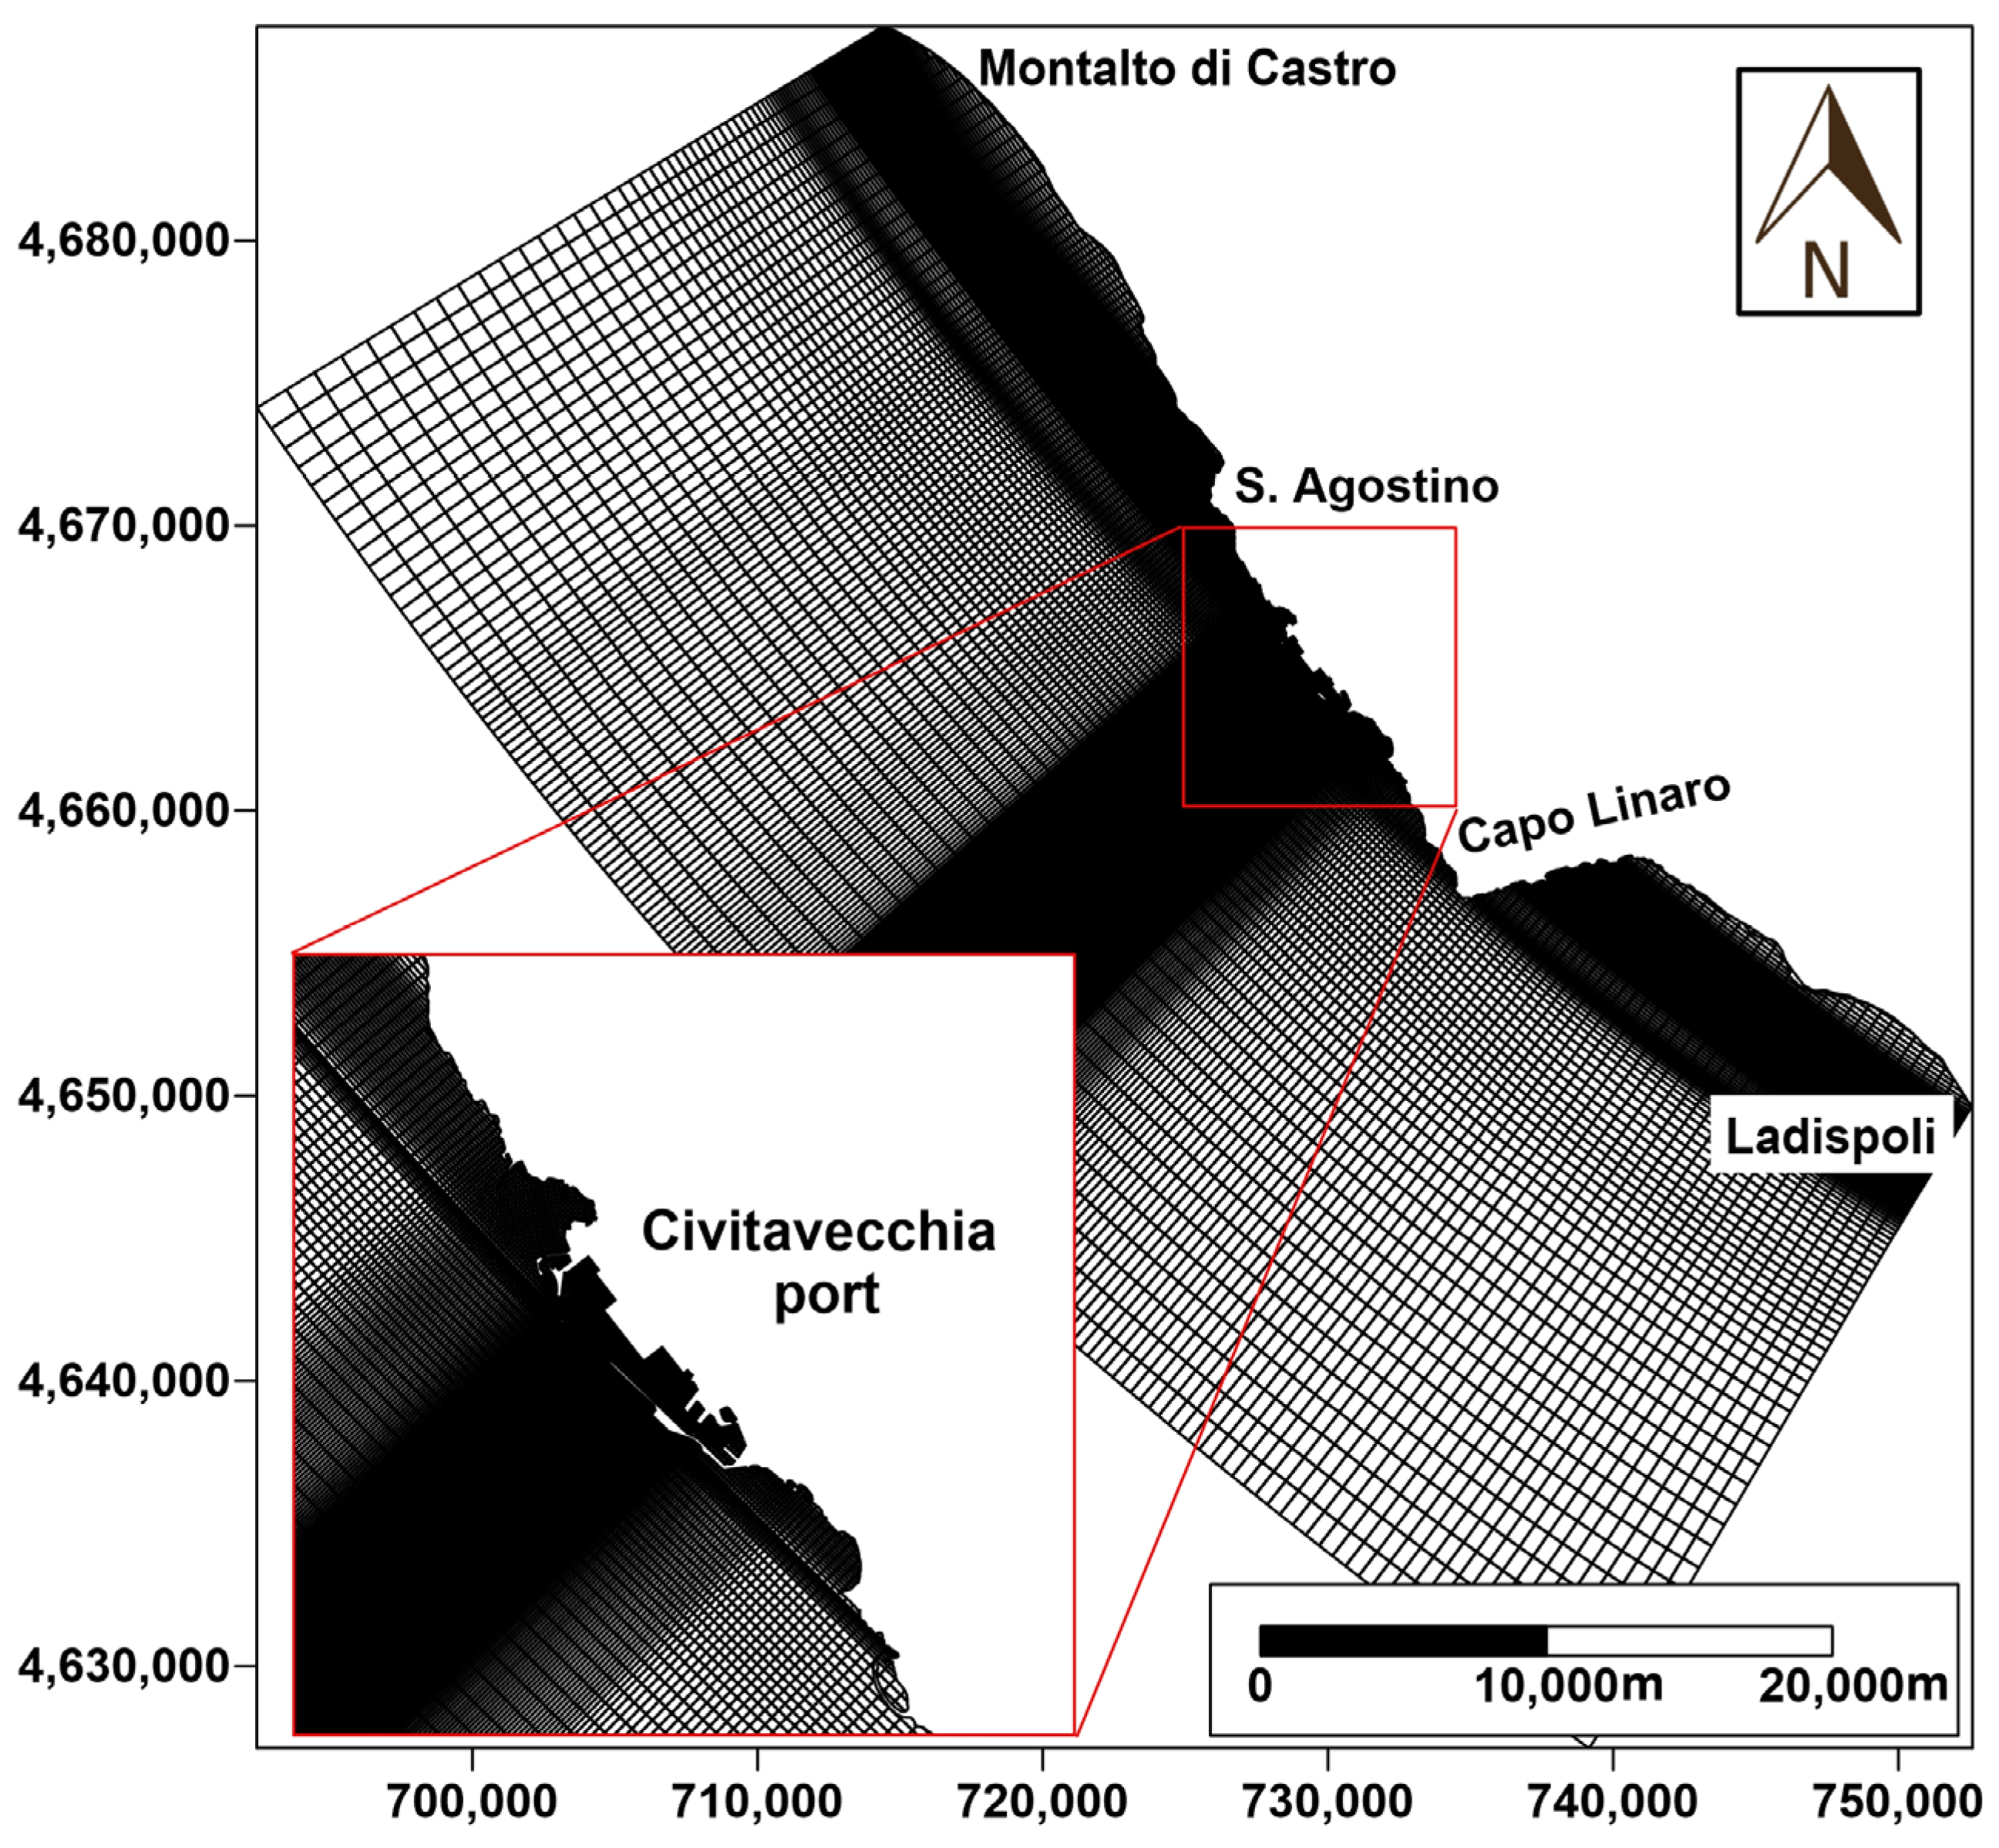
To accurately analyze the power generation of WaveSAX in the study area, the SWAN model utilizes a curvilinear finite difference grid constructed within a rectangular domain that includes an area extending from Montalto di Castro in the north to Ladispoli in the south (
Figure 7). The spatial resolution was higher in the vicinity of the Port of Civitavecchia (30 m), which was positioned at the center of the domain to mitigate potential errors generated at the model boundaries. To better replicate the behavior of wind waves approaching the coast, high-resolution bathymetric data obtained with a Multibeam instrument around Civitavecchia Port and in the WaveSAX deployment zone were interpolated within the computational grid.
The boundary conditions were assigned using a JONSWAP (JOint North Sea WAve Observation Project) wave spectrum [
46], calculated based on offshore wave parameters derived from the Mediterranean wave reanalysis product (part of the Copernicus Marine Service catalog), which encompasses a 30-year time series.
The wave energy dissipation is obtained by summing three different contributions: bottom friction, parameterized using the JONSWAP formulation with a coefficient of 0.067 m
2/s
2; whitecapping, based on a pulse-based model [
47]; and depth-induced breaking, calculated using the model developed by Battjes and Janssen [
48] with a breaking parameter of 0.73. The model also accounts for wave growth due to wind, as well as whitecapping and refraction processes.
To simulate wave behavior around the docks and breakwater of Civitavecchia, the harbor structures were modeled as linear elements within the computational area. In order to reproduce the reflection processes near the docks and the harbor breakwater, the directional wave spectra computed by the SWAN model were compared with those acquired by X-band radar [
49,
50] located in the southern part of the Civitavecchia breakwater on a terrace of the old pilot building at a height of 10 m above sea level. The use of this instrument allows for monitoring the sea state and surface currents of a marine coastal area with high temporal and spatial resolutions [
51,
52]. The data were collected on 27 July 2015 during a storm using a Marine Sperry-band radar, which radiates a maximum power of 25 kW and is equipped with a 9-foot-long (2.74 m) antenna [
53]. The model calibration was performed by modifying the transmission and reflection coefficients to match the 2D radar wave spectra (consisting of 24 logarithmically spaced frequency bins from 0.05 to 1.00 Hz and 144 directional bins with 2.5° spacing) as closely as possible.
The SWAN model was also validated using data acquired by a 1 MHz ADP-Sontek sensor positioned at a depth of −20 m, at a distance of approximately 200 m from the WaveSAXtest site (
Figure 1). The sensor is placed inside a Barnacle structure to prevent damage from trawling and is equipped with an external battery pack, allowing data acquisition from 5 September to 14 November 2018. It was configured with a vertical resolution of 1 m, a blank distance of 0.7 m, and acquired sea current profile and wave parameters every 30 min. The model calibration and validation were assessed using R-squared (R
2) and Relative Bias (RB) [
54], enabling analysis of the discrepancy between measured and predicted data.
To reproduce all the events that occurred in the study area in the last 30 years while maintaining a reasonable computational effort, offshore wave conditions were selected for a representative year between 1993 and 2023. The year 2012 was chosen because its distribution of events, classified by wave height (ΔHs = 0.5 m), period (ΔTp = 1 s), and direction (ΔDir = 15°), was most similar (with a lower root-mean-square error) to the entire historical series.
The Hs and Tp values resulting from the annual simulation were used to calculate the occurrence frequency of various events within different heights (ΔHs = 0.5 m) and period (ΔTp = 1 s) intervals at every grid element of the model.
The potential power generation map of WaveSAX-1 and WAVESAX-2 was then calculated by combining this frequency with the power matrix values obtained from sea trials conducted in 2018 and 2021. The distribution of energy captured by the two prototypes was also evaluated at an offshore point and at five points (WS, RW, EB, MB, and SB) near the Port of Civitavecchia to assess the effect of wave reflection on the port structures. These points were strategically chosen to take into account their different exposure to wave events (the northern port area and the southern zone) as well as the unique structural configurations (made by vertical caissons and tetrapods).
3. Results
3.1. Model Calibration and Validation
The SWAN model results were compared with X-band radar data to assess the model’s capability to replicate the reflection process of the port structures and with ADP data to evaluate its reliability in simulating wave diffraction and refraction in the study area.
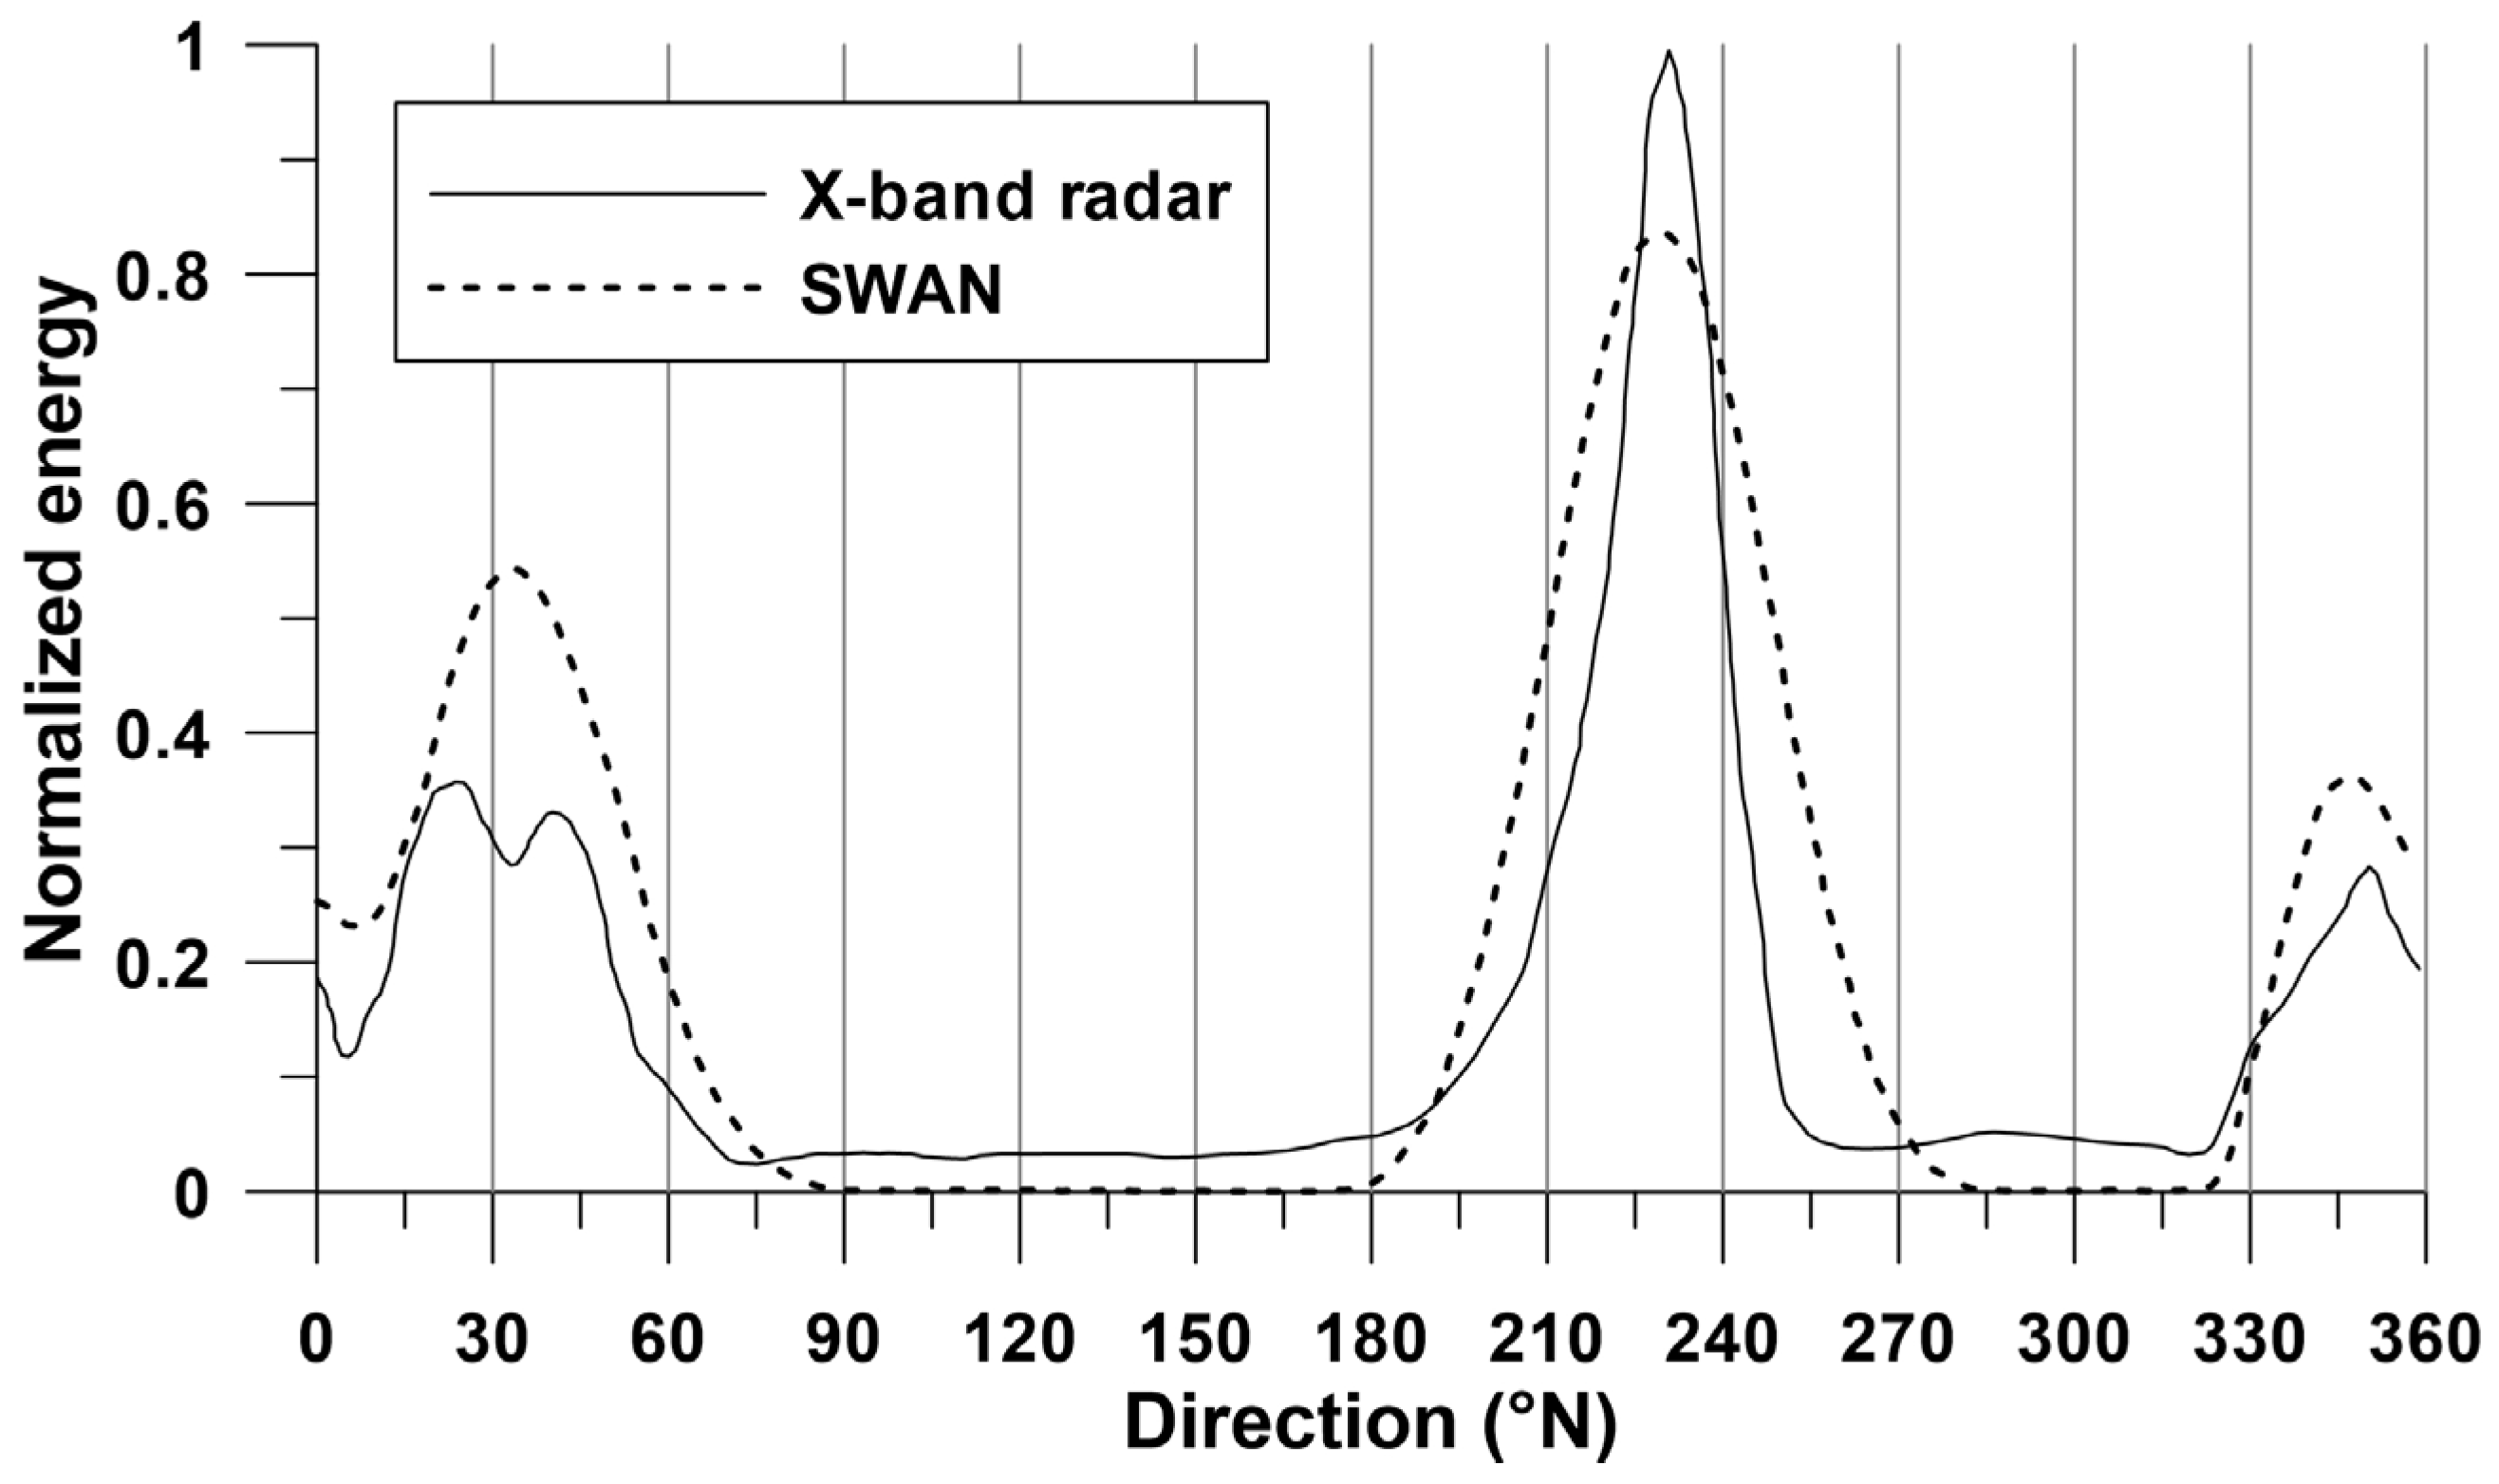
The normalized directional wave spectra acquired through the X-band radar were compared with those computed by the SWAN model during a storm event from the southwest on 27 July 2015 (
Figure 8). Notably, the radar’s coverage extended across the region in front of the harbor breakwater, characterized by the presence of vertical caissons and tetrapods. Given the distinctive coastal structures within this area, specific reflection and transmission coefficients were applied to these two sections. To accurately replicate the wave behavior in proximity to the outer zones of the Civitavecchia Port structures, specific reflection and transmission coefficients were assigned to the linear components of the model grid adjacent to these structures. Prior to the comparison, the wave spectra calculated by the model were converted into directional wave spectra to align with those obtained from the X-band radar.
A good agreement between measured and modeled data was achieved by setting reflection and transmission coefficients to 0.8 and 0.2, respectively, for the harbor structures consisting of vertical caissons, and 0.2 and 0.8 for the southern breakwater characterized by tetrapods [
53]. Overall, the model accurately replicated the average directional wave spectrum observed along the Civitavecchia Port breakwater, as measured by the X-band radar (achieving an R
2 value of 0.8215 and an RB value of 0.1441). In detail, the model slightly underestimated the wave spectra in the incident wave region (190–250° N), while providing higher values for other parts of the wave spectra, where the reflected component from the Civitavecchia harbor breakwater dominates.
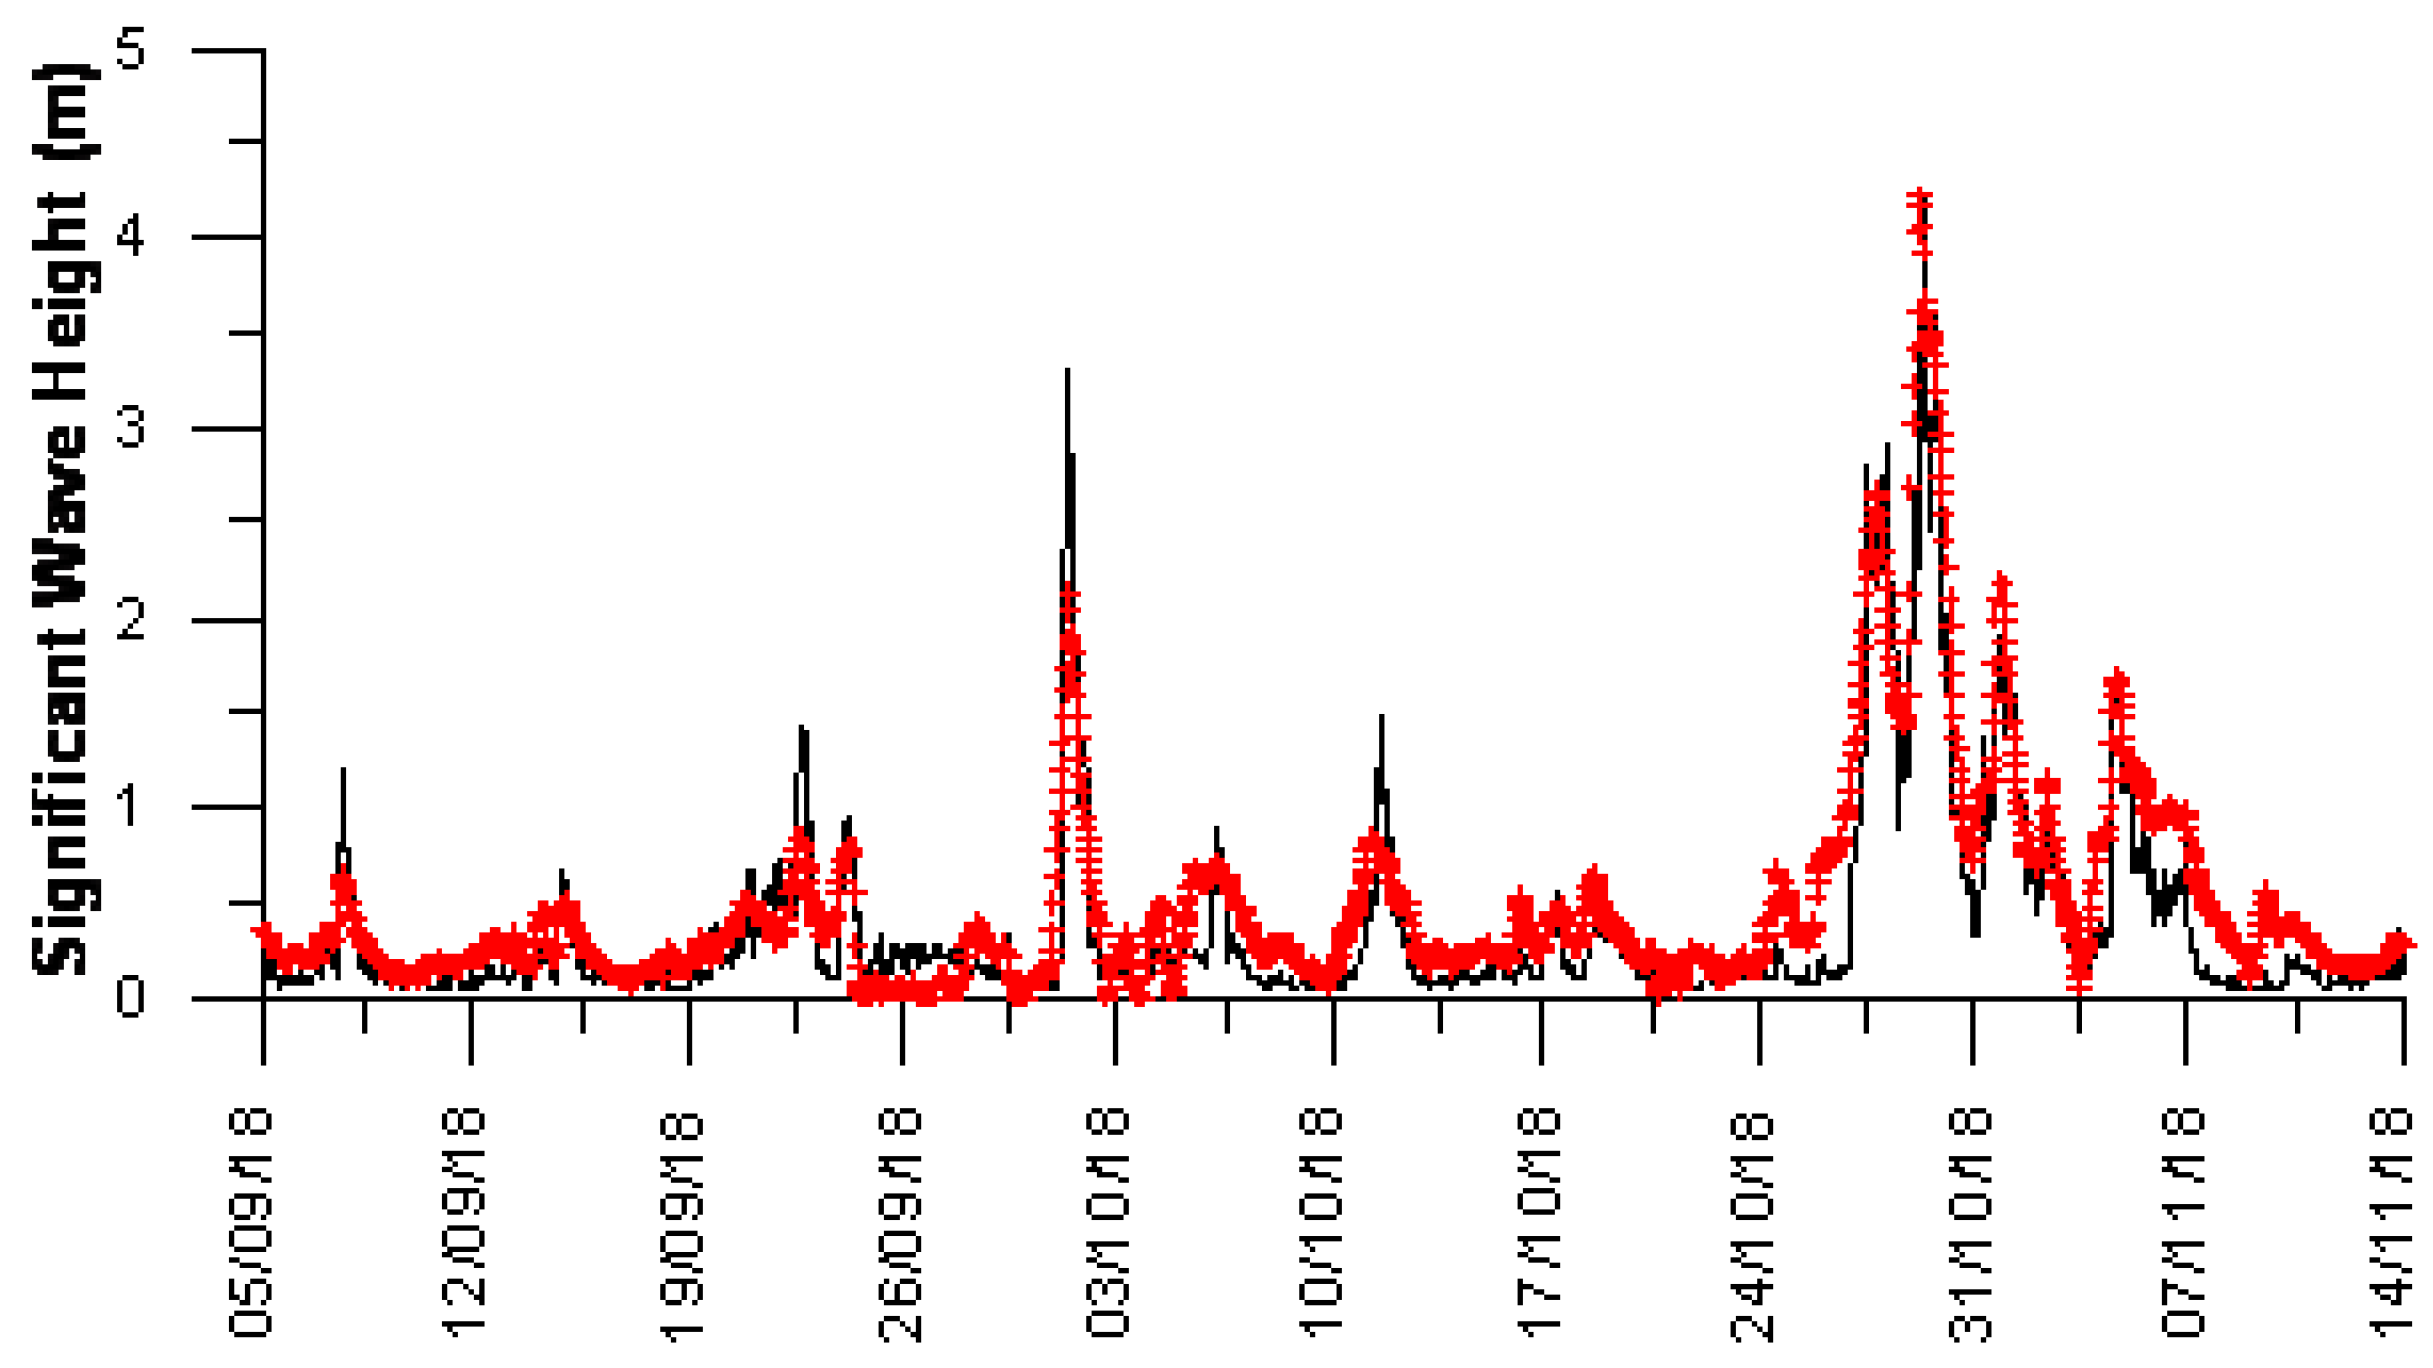
Subsequently, the significant wave height measured by the ADP was compared to the numerical simulation results for the instrument’s deployment period, spanning from 5 September to 14 November 2018. The SWAN model accurately reproduced the wave height in the northern part of Civitavecchia Port, at a distance of approximately 200 m from the WaveSAX device, with a high level of accuracy (R
2 = 0.8405) (
Figure 9). Specifically, the model overestimates high wave heights occurring in the initial part of the recording interval but faithfully replicates the intense events that characterize the later sampling period.
To more accurately assess the model’s performance in replicating nearshore wave behavior, Relative Bias (RB) was analysed in specific wave height and direction intervals (
Figure 10). The SWAN model exhibited an overestimation (dark red area) compared to the ADP data in the directional range of 150–180° N, particularly for higher wave heights. Conversely, within the directional range of 180–210° N, the model accurately simulated wave motion, resulting in slight underestimations (as represented by the blue area), with an RB value of less than 0.15. However, the model’s performance decreased for wave heights below 0.5 m, which are unsuitable for energy production using the WaveSAX device.
3.2. Model Results
The SWAN model was utilized to accurately reproduce all wave conditions along the coastal zone that occurred throughout the representative year of 2012, with an hourly resolution. The model’s outcomes facilitated the generation of potential generation maps for both the WaveSAX-1 and WaveSAX-2 prototypes. This was accomplished by intersecting the wave parameters, namely significant wave height (Hs) and peak period (Tp), at each grid cell with the respective power matrices derived from sea trials conducted in 2018 and 2021.
Figure 11 illustrates that the WaveSAX-2 prototype has the ability to generate a significantly higher amount of energy in the vicinity of Civitavecchia Port compared to WaveSAX-1. In both scenarios, the spatial distribution of potential generation reveals that the greatest values are concentrated in the central and northern sections of the port’s breakwater. Moderate energy levels are observed in the northern part of the port, precisely where the WaveSAX device was tested, while lower values are evident in the southern section of the breakwater.
To conduct a comprehensive assessment of the power generation potential of WaveSAX near the outer region of Civitavecchia Port, we calculated energy levels for various wave periods and height categories at five specific locations chosen based on varying wave exposure and harbor structural configurations (refer to
Figure 12). More specifically, we compared the energy captured by WaveSAX-1, displayed in the left-side panels in
Figure 12, with WaveSAX-2, shown in the right-side panels in
Figure 12.
Overall, the WaveSAX-1 device exhibits its highest potential generation within the range of 4–7 s and 1–3 m wave height. Conversely, for WaveSAX-2, the peak energy levels are observed in the graph’s region spanning 6–8 s and 1–2.5 m wave height. As highlighted in
Table 1, the highest energy levels are attained at points EB and MB, which are exposed to the most intense wave events from the southern quadrants. Despite the consistent wave exposure, lower energy values are noted in the southern section of the harbor breakwater due to the presence of tetrapods. The potential energy generation in this area is even lower than at the WS and RW points, which are exposed to less intense waves (mainly resulting from the diffraction process) coming from the west and northwest sectors.
The innovations introduced in WaveSAX-2 have led to a significant improvement in conversion efficiency, especially for lower wave heights, resulting in approximately 50% more energy production compared to its predecessor, WaveSAX-1. Performance improvement is around 30% in areas with higher energy levels. In summary, the new WaveSAX-2 configuration demonstrates an average performance enhancement of approximately 37%.
Based on the values recorded along the outer structure of Civitavecchia Port, the annual energy potential for different installation types of WaveSAX-2 has been calculated. The annual potential generation of the linear configuration amounts to about 4.2 GWh and would double if WaveSAX devices could be installed on two lines. The triangular configuration with modules consisting of 10 generation units anchored on the seabed could generate over 10 GWh per year.
4. Discussion
Sustainable ports play a crucial role in implementing the European Green Deal strategy and serve as essential hubs for promoting environmentally friendly practices and reducing carbon emissions in the maritime sector.
The aim of this study is to evaluate the wave potential generated by the WaveSAX device in the Civitavecchia Port area, where sea trials of two prototypes (WaveSAX-1 and WaveSAX-2) at a 1:5 scale were conducted. The integration of numerical modeling, combined with wave data from ADP and X-band radar, has facilitated the validation and calibration processes of the model, allowing for a spatially detailed and precise analysis of the available energy for the wave converter device This analysis covers a coastal zone heavily influenced by human activities and characterized by complex coastal morphology, which includes bottom areas covered by seagrass (Posidonia oceanica). To accurately calculate the potential generation of electricity from wave motion, the results of sea trials of two versions of the WaveSAX device conducted at the same site as the numerical modeling are used.
The tests allowed for analyzing the devices’ performance with irregular waves from the northwestern quadrant in order to assess the expected power production for each local wave condition (i.e., power matrix). Notably, WaveSAX-2, equipped with a new profiled 7-blade Wells turbine, demonstrates greater efficiency in energy production, particularly for low wave heights, compared to the 6-blade turbine used in the previous prototype. These findings are consistent with earlier numerical simulations utilizing fluid dynamics models [
40]. This underscores the significance of focusing on turbine control in current oscillating water column (OWC) control strategies, given the need to optimize turbine operation around its peak efficiency point [
55].
It is worth noting, however, that in the case of a 1:5 scale prototype, internal power losses (including hydraulic, mechanical, and electrical losses) significantly outweigh the electrical energy generated. This highlights the substantial potential for improving the performance of WaveSAX-2 in harnessing electricity from wave motion, especially when considering the power scale ratio, which stands at approximately 279.5 for a 1:5 device.
Similar to other OWCs [
56,
57,
58,
59], WaveSAX-2 is suitable for installation in existing anthropic structures, thus providing clean energy in high-demand areas, like ports. It is, therefore, crucial to have a detailed understanding of wave motion behavior near such structures, including the interaction between incident and reflected waves, in order to predict the available energy potential [
23,
24,
25].
Although the SWAN model was used in stationary mode in this study, it allows for the reproduction of wave reflection near port structures [
26], while also facilitating long simulations for estimating annual energy potential [
27,
28,
29,
30], with relatively low computational effort. The transmission and reflection parameters used by the model to reproduce wave behavior near port structures were determined to match the observed mean directional wave spectrum obtained from X-band radar [
50] in the marine area in front of the breakwater of Civitavecchia Port. The best fit was achieved by assigning a high reflection coefficient in the central and northern parts of the harbor structures, where vertical caissons are present, and lower reflective values in the southern zone, where tetrapods tend to disperse the incident wave energy [
53].
Furthermore, the SWAN model was validated using data from the ADP instrument located a few hundred meters away from the WaveSAX test site. The comparison between the measured and calculated data highlights the model’s high accuracy in reproducing wave height, providing a detailed representation of intense events during the sampling period, albeit slightly underestimating higher wave heights in the early part of the recording interval. This discrepancy is more pronounced when waves fall within the 150–180° N direction, which is shielded by the breakwater compared to the validation point.
Calibrating the model by adjusting the transmission and reflection parameters has enabled us to achieve a reasonably accurate replication of wave behavior near port structures, even when using models operating in a stationary mode. However, it is important to note that these models may not effectively capture rapid fluctuations occurring at subwavelength scales due to wave reflection and diffraction. Therefore, in the future, we plan to employ phase-resolving models based on either the mild-slope equation or Boussinesq-type equations, as they are better suited to address issues related to wave reflection and diffraction, especially in coastal entrances and harbors [
60].
Once validated, the model results were utilized to estimate the potential generation of the devices by cross-referencing the wave parameters calculated at each grid point with the power matrices of WaveSAX-1 and WaveSAX-2. This method allows for predicting the annual energy production of WEC devices in typical coastal sea conditions [
61]. In the Civitavecchia area, the WaveSAX-2 prototype exhibits a 37% higher efficiency compared to WaveSAX-1, as it utilizes a turbine with a greater number of blades and slightly different shapes, which can generate higher energy levels across all analyzed sea states.
In both power generation maps, high values are concentrated in the central and northern parts of the harbor breakwater, surpassing offshore energy levels. This is attributed to the presence of vertical caissons with highly reflective behavior, leading to increased wave height through the interaction of incident and reflected waves. In the southern part of the harbor breakwater, wave energy dissipates due to the presence of tetrapods, resulting in lower power generation values compared to the WaveSAX test site, despite the protection offered against southern events.
The assessment of WaveSAX’s electricity production aimed to determine the percentage of the port’s energy requirements that can be met by the wave energy source using this technology, thereby reducing CO2 emissions correspondingly.
Assuming the installation of a linear array of WaveSAX-2 in the most productive area of Civitavecchia Port (the central and northern parts of the harbor), an average annual production exceeding 4 GWh/year can be achieved. This production is capable of meeting approximately 20% of the port’s energy demand and avoiding the emission of around 2800 tCO2e/year into the atmosphere. Considering the construction of new electrified berths in the Port of Civitavecchia, which will increase port energy consumption by about five times, solutions with double arrays and near-shore triangular modules will have to be adopted. These solutions can reduce CO2 emissions into the atmosphere by 5600 and 7000 tCO2e/year, respectively.
The installation of the modules must be preceded by an assessment of the direct and indirect impacts that anchoring these devices may have on coastal marine ecosystems, such as Posidonia oceanica and coralligenous habitats, protected by the Habitat Directive (92/43/EEC).
This study demonstrates that harnessing wave energy represents a promising alternative to fossil fuels, making a substantial contribution to global electricity demand in the future without causing harm to the marine environment.
In conclusion, the support and adoption of new technologies for harnessing energy from marine sources are crucial in achieving the sustainability goals outlined in the European Green Deal and Agenda 2030. By embracing marine energy solutions, ports can become pioneers in the transition to clean and renewable energy, reducing their environmental impact and fostering economic growth in line with the principles of sustainable development.
5. Conclusions
Sustainable ports play a crucial role in implementing the European Green Deal strategy, serving as essential hubs for promoting environmentally friendly practices and reducing carbon emissions in the maritime sector. This study aimed to evaluate the wave energy potential generated by the WaveSAX device in the Civitavecchia Port area, where sea trials of two prototypes (WaveSAX-1 and WaveSAX-2) at a 1:5 scale were conducted. The integration of numerical modeling and wave data (ADP and X-band radar) facilitated a detailed analysis of the energy available for the device, given the complex coastal morphology and composition.
The outcomes have contributed to the improved scaling and sizing of the WaveSAX device and have helped identify optimal locations for installing these units. Although stationary models were utilized in this study, future research will explore phase-resolving models to better capture rapid wave fluctuations.
This study revealed the superior energy production efficiency of WaveSAX-2, particularly for low wave heights, compared to its predecessor, WaveSAX-1. The research highlighted the importance of optimizing the power take-off (PTO) control system parameters, depending on the incoming wave, during device operation, which is crucial for maximizing energy output. WaveSAX-2’s suitability for installation within existing port structures further highlights its potential as a clean energy source for high-demand port areas.
The results showed that the central and northern parts of the harbor breakwater offer higher energy potential, attributed to the presence of reflective vertical caissons. WaveSAX-2’s annual energy production was estimated to be low, but recent research suggested significantly higher output if deployed on the Portuguese coast, which has a typical Atlantic Ocean wave climate. By analyzing the potential energy production of WaveSAX-2 in Civitavecchia Port, this study highlighted its potential to meet a significant portion of the port’s energy demand and reduce CO2 emissions. Future deployments, including double arrays and near-shore triangular modules, can further enhance these benefits.
Moving forward, the ongoing research and development of WaveSAX are poised to reach a pivotal stage by advancing toward Technology Readiness Levels (TRLs) 7 and 8. This critical progression will entail conducting comprehensive full-scale tests of the device in sheltered marine environments, encompassing continuous testing for a minimum of an entire annual cycle. Additionally, the project will involve the refinement and testing of an automated control system, a more precise evaluation of the full-scale device’s power output, the exploration of methods to mitigate marine fouling, and addressing challenges related to grid connection.
The methodology employed in this research represents a case study that can be adapted in other coastal regions with variable geometrical configurations and compositions in their port structures. It offers an accurate assessment of the wave energy field and the potential for electricity generation using any available wave energy converters.
In conclusion, this research underscores the importance of marine energy solutions in achieving sustainability goals outlined in the European Green Deal and Agenda 2030. Green Ports can play a pivotal role in transitioning to clean and renewable energy sources, reducing their environmental impact, and fostering economic growth in line with the principles of sustainable development.
6. Patents
WaveSAX device has been granted European Patent N° 2995807 B1 published in the Bulletin 2017/44 on 1 November 2017. Inventor: Maximo Peviani. Proprietor: RSES.p.A., Research on Energy System.


 ,
, 


