Article

Assessment of Inflation Schemes on Parameter Estimation and Their Application in ENSO Prediction in an OSSE Framework

1
State Key Laboratory of Satellite Ocean Environment Dynamics, Second Institute of Oceanography, Ministry of Natural Resources, Hangzhou 310012, China
2
Southern Marine Science and Engineering Guangdong Laboratory (Zhuhai), Zhuhai 519000, China
J. Mar. Sci. Eng. 2023, 11(10), 2003; https://doi.org/10.3390/jmse11102003
Submission received: 18 September 2023 / Revised: 10 October 2023 / Accepted: 15 October 2023 / Published: 18 October 2023
(This article belongs to the Special Issue Advances in Physical, Biological, and Coupled Ocean Models)

Abstract

:
The ensemble Kalman filter is often used in parameter estimation, which plays an essential role in reducing model errors. However, filter divergence is often encountered in an estimation process, resulting in the convergence of parameters to the improper value and finally in parameter estimation failure. To alleviate this degeneration, various covariance inflation schemes have been proposed. In this study, I examined six currently used inflation schemes: fixed inflation, conditional covariance inflation, modified estimated parameter ensemble spread, relaxation-to-prior perturbations, relaxation-to-prior spread, and new conditional covariance inflation. The six schemes were thoroughly explored using the Zebiak–Cane model and the local ensemble transform Kalman filter in the observing system simulation experiment framework. Emphasis was placed on the comparison of these schemes when it came to estimating single and multiple parameters in terms of oceanic analyses and resultant El Niño–Southern Oscillation (ENSO) predictions. The results showed that the new conditional covariance inflation scheme had the best results in terms of the estimated parameters, resultant state analyses, and ENSO predictions. In addition, the results suggested that better parameter estimation yields better state simulations, resulting in improved predictions. Overall, this study provides viable information for selecting inflation schemes for parameter estimation, offering theoretical guidance for constructing operational assimilation systems.

1. Introduction

Climate models serve as powerful tools in climate research, which can simulate and predict climate phenomena [1]. Even with the current state-of-the-art coupled models, model predictions often diverge from the true states of the atmosphere/ocean. Researchers have demonstrated that the prediction of climate models was largely limited by the increase in initial errors [2]. Zheng et al. (2007) used data assimilation based on the ensemble transform Kalman filter (EnKF) to initialize El Niño–Southern Oscillation (ENSO) prediction, and improved the prediction skill [3]. Apart from the significant impacts of initial conditions [2,4,5], model errors also seriously deteriorate the accuracy of climate prediction [6,7,8,9]. Model errors usually originate from three aspects: dynamical core misfit, physical scheme approximation, and model parameter errors [10]. The amendment of the dynamical core is very challenging [11]. Some studies have been devoted to improving parameterization schemes [12,13,14]. For example, Mishra et al. compared several convective parameterization schemes in a regional climate model for simulating the spatiotemporal variability of precipitation extremes over India and demonstrated that different parameterization schemes had their own advantages and disadvantages [12]. Compared with the challenges of these two aspects, reducing model parameter errors is relatively easier. Thus, many studies have focused on reducing model parameter errors [15,16,17]. Although parameters in models cannot be directly observed, their uncertainty can be constrained by observational information. This process is known as parameter estimation. Many studies have shown that parameter estimation can restrain the uncertainty of parameterization schemes and reduce model errors, thus improving the simulation and prediction ability of coupled climate models [16,18,19,20,21]. In addition, parameter estimation is crucial to the study of climate predictability.
With the enhancement of atmospheric and oceanic observations as well as the development of assimilation methods, the study of parameter estimation regarding atmospheric, oceanic, or coupled models has developed rapidly [22,23,24,25]. Parameter estimation is mainly realized through two methods: the variational method [15,25,26,27] and the EnKF [17,27,28,29,30]. These two methods are also widely used in state estimation. For example, Ueno et al. reported a first application of the EnKF to an intermediate coupled atmosphere–ocean model to estimate states for initialization, and successfully predicted Sea Surface Temperature (SST) anomalies approximately 5 months in advance [31], whereas Dwivedi et al. used a four-dimensional variational method to estimate oceanic states and improved the accuracy of assimilated fields [32]. However, it is difficult to implement a four-dimensional variational method in fully coupled circulation models because of the difficulty of deriving adjoint equations. Therefore, the EnKF and its variants, such as the ensemble adjustment Kalman filter and the local ensemble Kalman filter (LETKF), are widely used from simple to fully coupled circulation models. Studies have shown that parameter estimation based on the EnKF and its variants can reduce the bias of climate simulation and improve the prediction of climate models [16,19,20,21,33].
Theoretically, any model states-related parameters can be estimated using data assimilation. However, in practice, parameter estimation is difficult because there is no physics-based description of parameters and the error covariances between prior state variables and parameters are not often guided by physical laws, so the effect of parameter estimation tends to depend on the quality of state–parameter covariance. To estimate real-life parameters using data assimilation methods, researchers often assume the parameters to be constant or slowly varying. Consequently, a finite number of ensemble members can lead to an underestimation of the background error variance in the assimilation, weakening the role of observations and converging the ensemble of parameters to a value far from the observation [34,35]. This phenomenon is known as filter divergence in the field of data assimilation. In addition, the limitation of ensemble size due to costly computational expense causes an under-sampling issue, accelerating ensemble spread decrease and leading to filter divergence [36], which makes it difficult to accurately estimate the parameter. Thus, how to deal with the filter divergence problem is challenging in parameter estimation [37].
Many efforts have been made to solve this problem, and the results have shown that inflation schemes can somewhat alleviate the filter divergence problem, thereby enhancing the parameter estimation accuracy. For example, a conditional covariance inflation (CCI) scheme was proposed by Aksoy et al. (2006a) [35]. As the name suggests, the parameter ensemble is inflated only if a condition is satisfied: its ensemble spread is smaller than a prescribed threshold. With the CCI scheme, Wu et al. successfully optimized geographically related parameters in an intermediate atmosphere–ocean–land coupled model [29]. Their results showed that the quality of state estimates was significantly improved by parameter estimation. In subsequent parameter estimation studies, this scheme was often used [17,27,29,30]. However, estimated parameters using the CCI scheme may converge to wrong values due to the rapid decline of ensemble spread. Gao et al. (2021, hereafter denote as G21) [38] developed a new scheme called the New-CCI (N-CCI) scheme based on the CCI scheme, which improved the ENSO prediction compared to other schemes in the Zebiak–Cane model.
Ruiz et al. (2013b) [39] proposed a scheme called estimated parameter ensemble spread (EPES) to estimate parameters in the SPEEDY model [40]. In this scheme, parameters are inflated within ensembles, reducing computational cost while keeping the analysis error covariance matrix structure unchanged. However, this scheme was only used for single-parameter estimation, and its performance in more realistic scenarios with multiple parameters needs to be tested further. Further, there are two inflation schemes primordially used in state estimation, including relaxation-to-prior perturbation (RTPP) [41] and relaxation-to-prior spread (RTPS) [42].
Although various inflation schemes have been proposed in previous studies, their performances in parameter estimation need to be systematically evaluated. The main objective of this study is to compare different inflation schemes in a weakly coupled data assimilation framework. In the so-called weakly coupled assimilation, the atmospheric (oceanic) assimilation analysis is only obtained by atmospheric (oceanic) observations. The atmospheric or oceanic observational information is dynamically transmitted to the other model component through coupled model integration, i.e., by flux exchange at the atmosphere–ocean interface. This differs from strongly coupled data assimilation in which atmospheric or oceanic observation simultaneously adjusts its model component and the other component. This work is a methodology study, whereas G21 focused on practical applications. G21 was based on this study and submitted after this paper, but G21 was published first.
The remainder of this article is organized as follows. Section 2 briefly introduces the Zebiak–Cane model, observations, the LETKF-based parameter estimation algorithm, and six inflation schemes. Section 3 conducts sensitivity studies with regard to the configuration. Section 4 shows the examined impacts of the inflation schemes on single and multiple-parameter estimation and ENSO prediction. Finally, further discussions and conclusions are presented in Section 5 and Section 6, respectively.

2. Materials and Methods

2.1. The Zebiak–Cane Model

The Zebiak–Cane model used in this study is an intermediate ocean–atmosphere coupled model, which contains more physical processes and higher spatial complexity than simple and theoretical model and only retains the most important part of ENSO compared to complex model that pursues a comprehensive description of the space-time structure. Therefore, it has been widely applied in ENSO simulation and prediction. The description of the model is similar to that of Gao et al. (2020) [5] as follows. Because the Gill model elucidates some basic features of the response of the tropical atmosphere to diabatic heating [43], the atmospheric dynamics follow it. The model contains steady-state and linear shallow water equations forced by heating anomalies parameterized by SST anomalies and moisture convergence. The integral range of the atmospheric model spans over the domain of 101.25° E–286.875° E and 29° S–29° N with a grid spacing of 5.625° × 2° (longitude × latitude). The oceanic dynamics, which is simulated using a reduced-gravity model, is forced by the wind stress anomalies from the atmospheric model. The integral range of the oceanic dynamics spans over the domain of 125° E–281° E and 28.75° S–28.75° N with a grid spacing of 2° × 0.5° (longitude × latitude). The oceanic thermodynamics, which describes the SST anomalies and heat flux change using a three-dimensional nonlinear equation, covers the domain of 129.375° E–275.625° E and 19° S–19° N with the same grid of the atmospheric model. The model time step is 10 days. More details about the Zebiak–Cane model can be found in Zebiak and Cane (1987) [44].
Among the parameters in the Zebiak–Cane model, I only focused on the six parameters in the SST anomaly equations:
T t = u 1 · T ¯ + T u 1 ¯ · T γ 1 × H F w ¯ + γ 2 × G F w ¯ + w × T T e H γ 2 × G F w ¯ + w × T z ¯ α T ,
T s u b = T 1 × t a n h b 1 × h ¯ + h t a n h b 1 × h ¯ ,     h > 0 T 2 × t a n h b 2 × h ¯ h t a n h b 2 × h ¯ ,     h < 0 .
where T is the SST anomaly, T s u b is the entrainment temperature, h is the perturbation of Upper Layer Depth (ULD; + h and − h perturbation show an increase and a decrease in the ULD, respectively), h ¯ is the mean of ULD, and other mathematical symbols can be found in Zhao et al. (2019) [17]. γ 1 , γ 2 , T 1 , T 2 , b 1 , and b 2 are parameters that control the variation in ocean upwelling and subsurface temperature ( T e ) and are therefore essential for simulating and predicting SST anomalies. In the observing system simulation experiment (OSSE) framework, it was assumed that incorrectly set parameter values are the only cause of model errors. A model was defined as a true model when its parameter values were set to the “default values” (Truths, third column in Table 1), whereas a model was defined as a biased model when its parameter values were set by the ensemble mean initial guesses that were perturbed from the truth (Biased Guess, fourth column in Table 1). Parameter estimation based on data assimilation was a process of adjusting the initial guess parameter values to true ones.

2.2. LETKF-Based Parameter Estimation

I selected LETKF [45] to perform state and parameter estimations, as follows. Denoting the prediction or background state vector by x b and its mean by x ¯ b , the projection of the analysis error covariance matrix onto the ensemble space can be expressed as follows:
P a = H ~ T R 1 H ~ + N e 1 I 1 ,
where H ~ = H X b and R is the observation error covariance matrix. H denotes the observation operator mapping the model state to the observation space, and the perturbation of state vector is given by X b = x b x ¯ b . N e represents ensemble size, and I is a N e order identity matrix.
With a state augmentation technique, the following calculations of the LETKF algorithm contain parameters. The Kalman gain matrix of state variables and parameters are given by
K x K Φ = X b Φ b P a H ~ T R 1 ,
where the perturbation of a parameter is expressed by Φ b = φ b φ ¯ b , φ b is parameter ensembles with a mean of φ ¯ b . Then, the analysis means and analysis perturbations can be expressed as follows:
x ¯ a η ¯ a = x ¯ b η ¯ b + K x K Φ [ y o H x ¯ b ] ,
X a Φ a = X b Φ b [ ( N e 1 ) P a ] 1 / 2 ,
where y o represents observations and η ¯ b represents ensemble mean of background parameters. The states and parameters can be calculated as follows:
x a η a = x ¯ a η ¯ a + X a Φ a .
Because the inverse matrix of H ~ T R 1 H ~ + N e 1 I in Equation (3) is calculated in the ensemble space, the amount of calculation with LETKF is much less than that with the EnKF. Some researchers successfully employed LETKF to perform parameter estimation. In particular, Kang (2009) [46] and Kang et al. (2011, 2012) [28,47] used LETKF to estimate the spatial distribution and seasonal variation in CO2 surface fluxes. Additionally, Ruiz et al. (2013a, b) [39,48] employed LETKF in a SPEEDY model to estimate parameter uncertainty and compared the differences between the simultaneous and separate estimations of states and parameters.

2.3. The Observing System

In the OSSE framework, the true values of state variables are obtained by running the true model with prescribed initial conditions and true parameters. Among the state variables, I assume that only the SST anomaly is observed at every other grid point of the Zebiak–Cane model on the 1st day of each month. Thus, the observations of SST anomaly for the OSSE are obtained by superimposing Gaussian white noise onto the true SST anomaly. The Gaussian white noise is used to simulate the observational error, with the mean of 0 °C and the variance of 0.4 (°C)2.
Other state variables, such as ULD and T e anomalies, which are obtained by running the model using the prescribed initial conditions and true parameters, can be considered true state variables. The true state variables and state simulations were compared to evaluate the impact of parameter estimation on model state simulations.

2.4. Inflation Schemes

As mentioned above, dealing with the filter divergence problem is a great challenge for parameter estimation. To resolve this issue, various inflation schemes have been proposed. In general, inflation schemes are implemented by inflating posterior perturbations of parameters [49]. The inflation can be expressed as follows:
η j = η ¯ a + μ ( η j a η ¯ a ) ,
where η j and η j a denote the j-th ensemble member of inflated and posterior parameters, respectively, and η ¯ a denotes the ensemble mean of η j a . In this study, posterior parameters are the analysis values of parameters after assimilation, i.e., η a in Equation (7), whereas those before assimilation are prior parameters. According to different inflation factors, i.e., μ in Equation (8), several inflation schemes are currently used, as listed below.
Algorithm 1 (FI scheme):
The simplest scheme is to set μ to a fixed inflation (FI) factor that is slightly greater than 1. The scheme on state and parameter estimations has been employed by several authors [4,27,39,48,50,51].
Algorithm 2 (CCI scheme):
The CCI scheme was specifically designed for parameter estimation [17,27,29,30,35,52,53,54]. In this scheme, the posterior parameter ensemble is inflated once its ensemble spread is smaller than a certain threshold. The inflation factor in Equation (8) is expressed as follows:
μ = 1 ,       σ η a a   a σ η a ,       σ η a < a       ,
where σ η a = 1 / ( N e 1 ) l = 1 N e ( η l a η ¯ a ) 2 represents the posterior standard deviation of the parameter ensemble, and a is the threshold.
Algorithm 3 (m-EPES scheme):
To determine the spread of the parameter ensemble, Ruiz et al. (2013b) proposed an approach referred to as EPES, in which the trace of P a and ensemble size are used to calculate the inflation factor [39]. Particularly, the inflation factor in Equation (8) can be written as follows:
μ = N e N e 1 t r P a ,
where tr stands for the matrix trace, and N e is the ensemble size. As pointed out by Ruiz et al. (2013b) [39], this scheme could preserve the structure of P a . It can be seen that, in the EPES scheme, the inflation factor is entirely determined by P a and N e . In this study, the scheme is extended by multiplying a factor λ that is close to 1. Particularly, the extended scheme in Equation (10) can be modified as follows:
μ = λ N e N e 1 t r P a .
The extended scheme is named as the modified EPES (m-EPES) scheme, which is equivalent to EPES when λ is set to 1. The best factor λ is tuned by a trial-and-error procedure.
Algorithm 4 (RTPP scheme):
In addition to the above three inflation schemes used in parameter estimation, there is a scheme called RTPP that was primordially used for state estimation [41,42]. In this study, I apply this scheme to parameter estimation. The posterior perturbations are relaxed back to their prior values. Thus, the inflated ensembles can be expressed as follows:
η j = η ¯ a + ( 1 α ) ( η j a η ¯ a ) + α ( η j b η ¯ b ) ,
where η j denotes the j-th inflated parameters, η j a and η j b denote the posterior and prior parameters for the j-th member, respectively, and η ¯ a and η ¯ b denote the ensemble means of η j a and η j b , respectively. α is a relaxation factor that is between 0 and a value slightly larger than 1. For 0 < α < 1 , the inflation means that part of the posterior perturbations is replaced with the prior perturbations. In the case where α is set to 1, the posterior perturbations are completely replaced by the prior perturbations. Unlike the FI scheme, this scheme has the desired property of compensating for the reduced variance due to assimilating observations to some extent.
Algorithm 5 (RTPS scheme):
Similar to Algorithm 4, there is a scheme called RTPS [42] in which the posterior ensemble standard deviation is relaxed back to its prior value via a relaxation factor. That is,
σ η a 1 α σ η a + α σ η b ,
where σ η b = 1 / ( N e 1 ) l = 1 N e ( η l b η ¯ b ) 2 represents the prior ensemble standard deviation at each analysis grid point.
Thus, the inflation factor in Equation (8) can be written as
μ = ( α σ η b σ η a σ η a + 1 ) ,
where α is a relaxation factor. Similar to the RTPP scheme, α is usually between 0 and 1. Sometimes, α > 1 is necessary to maintain ensemble spread [55]. The RTPP scheme is a combination of multiplicative inflation and additive inflation, whereas the RTPS scheme entails only multiplicative inflation.
Algorithm 6 (N-CCI scheme):
The abovementioned five schemes can be categorized into two categories: one is starting inflation at the beginning of parameter estimation, such as FI, m-EPES, RTPP, and RTPS schemes, and the other is conditional inflation, i.e., starting inflation only when some criteria are met, such as CCI. Both categories have their advantages, but caveats exist. The former inflates immediately from the beginning of parameter estimation and continues to the end, potentially resulting in exaggerated ensemble spread and causing the failure of parameter estimate, whereas the latter does not start inflation at the beginning of the parameter estimation. However, the parameter estimation is typically characterized by a rapid decline in its ensemble spread with the assimilation steps, potentially causing insufficient ensemble spread to update parameters before inflation [37].
With this motivation, a new scheme based on the ideas of these two categories was proposed, referred to as N-CCI in G21. Different from the CCI scheme, N-CCI inflates posterior parameter ensemble perturbations at the beginning of parameter estimation but stop inflating when the standard deviation is smaller than a certain threshold. N-CCI appears as a paradoxical scheme, but it was motivated by numerous sensitivity experiments. The idea behind N-CCI is that the ensemble spread of parameters is often insufficient for parameter updating because of its rapid decline at the first few assimilation steps, as observed in these sensitivity experiments. Thus, inflation is always required for an effective estimation of the parameter. However, the ensemble spread of the parameter decreases gradually once the estimated parameter approaches a steady value close to the true value. When the ensemble spread reaches a small value, the estimated parameter is closest to the true value. Therefore, the parameter estimation terminates, and the inflation stops. The N-CCI scheme is expected to be more effective in both seeking the true value and preventing the filter from the divergence caused by the rapid decline in parameter ensemble spread with assimilation steps. Opposite to the CCI scheme, the inflation factor in Equation (8) can be written as follows:
μ = b σ η a ,       σ η a a     1 ,         σ η a < a       ,
where b is a factor that controls the strength of inflation. The six schemes are summarized in Table 2. The goal of this work is to systematically compare the six inflation schemes in the OSSE framework in terms of the estimation accuracy of the parameters and resultant ENSO predictions.
To sum up, a flowchart of parameter estimation based on LETKF is presented in Figure 1.

3. The Sensitivity Study

As indicated in previous studies, the quality of the results may be affected by the configuration of the assimilation system [56]. Therefore, numerical sensitivity experiments are conducted to determine the configuration, such as factors in inflation schemes, initial guesses of parameters, and state inflations or not.

3.1. Factors in Inflation Schemes

For each inflation scheme, numerous sensitivity experiments were performed to tune such factors/thresholds as μ in the FI scheme, a in the CCI scheme, λ in the m-EPES scheme, α in the RTPP and RTPS schemes, and a and b in the N-CCI scheme, so that the best estimation of parameters is achieved. In the OSSE framework, the best estimation means to seek the estimate of a parameter as close to the true value as possible in the shortest time for each scheme.
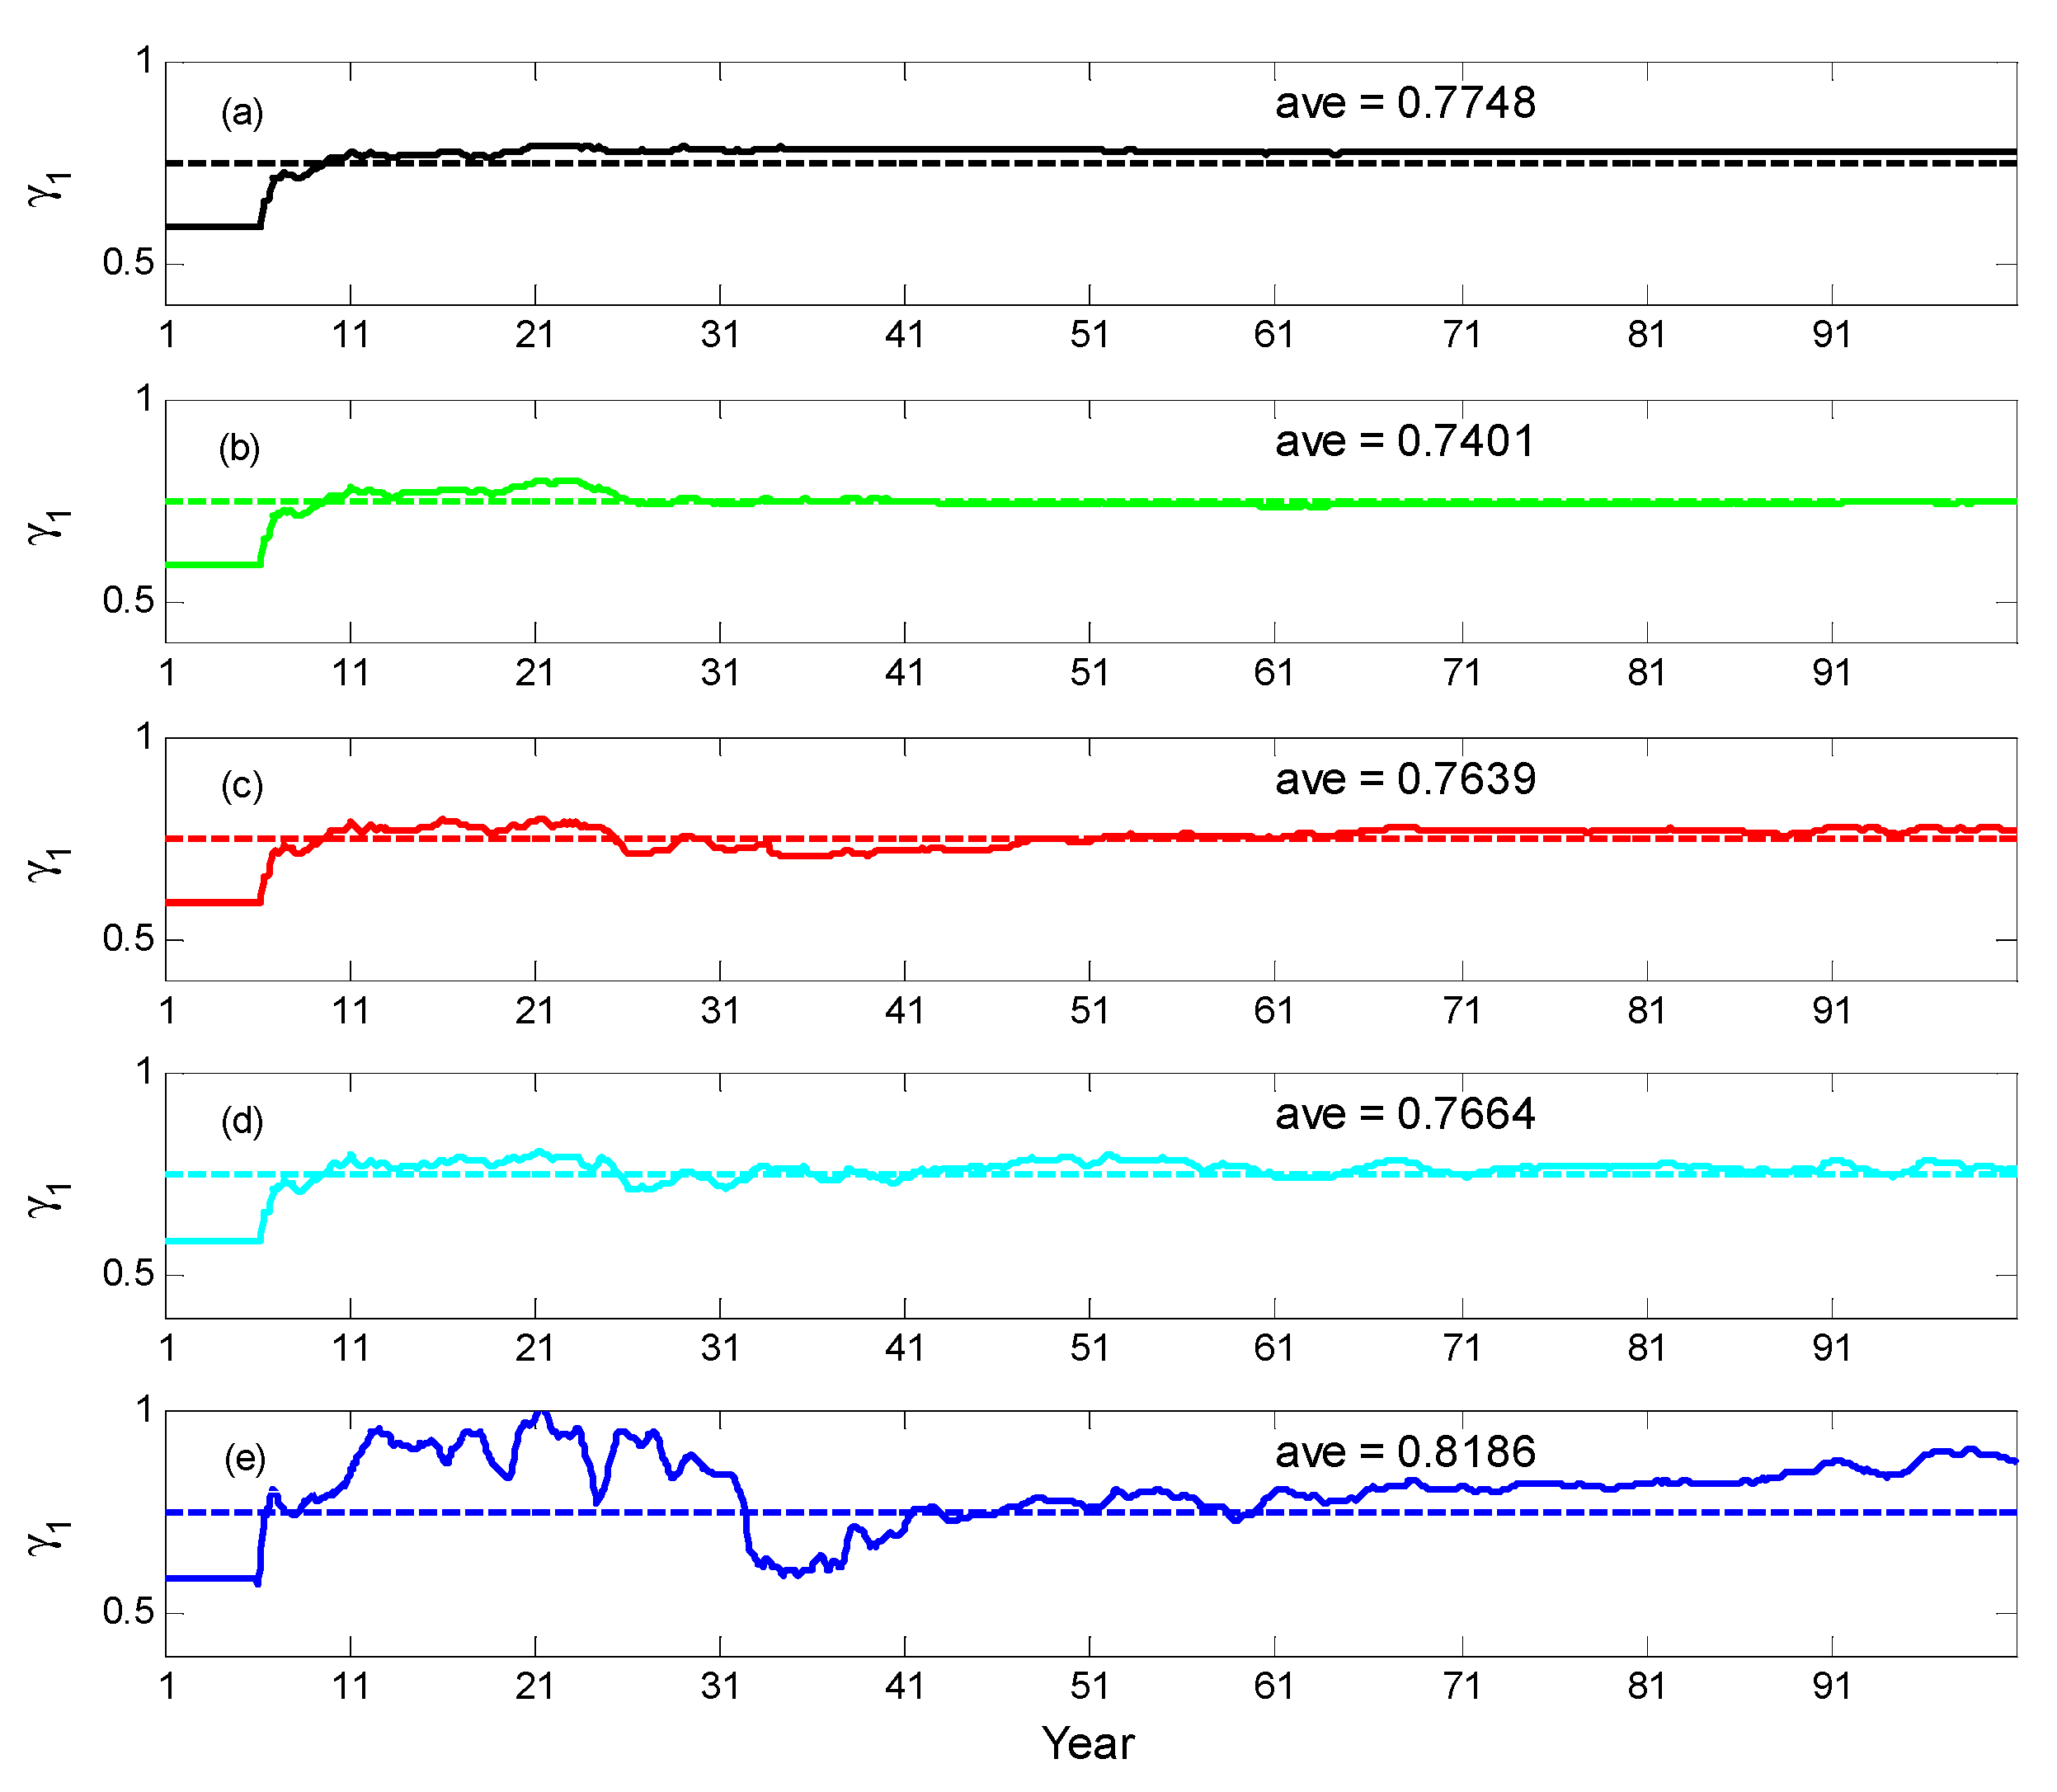
To compare the six inflation schemes, numerous sensitivity experiments were performed to tune the factors/thresholds for each scheme, whose goal was to obtain the best estimate of parameters in terms of the true values in the shortest time. Considering the FI scheme in single-parameter estimation as an example, five experiments with different inflation factors were performed. The values of inflation factor μ are listed in Table 3. To measure the convergence speed, I define the convergence time as the time taken to reach the moment when the difference between the estimated and true values fluctuates in the range of ±5% of the estimated value. The second experiment in which μ was set to 1.002 had the shortest convergence time.
Figure 2 shows the temporal evolution of the estimated γ 1 with the assimilation for the FI scheme. The estimated value of the second experiment is the closest to the true value of 0.75. If the inflation factor is too large or too small, the estimation effect of parameters will deteriorate. For example, the estimated value did not converge when μ was set to 1.20.
Similar experiments were performed with other schemes in single-parameter estimation, and the best factors/thresholds were obtained for each scheme. Note that, the third column in Table 2 shows the tested range values (signed with parentheses) and values making the best estimation for each scheme in single-parameter estimation. In particular, in other schemes, the estimation effect of the parameters will deteriorate if the inflation factor/threshold is too large or small, as in the FI scheme. Sensitivity experiments in multiple-parameter estimation were performed to obtain these factors, as in the single-parameter estimation. In particular, multiple-parameter estimation is complicated. the criterion to select the factors/thresholds for each inflation scheme will be introduced later. Thus, the comparison of these schemes was based on the best performance that each scheme could achieve. Such a comparison among different schemes was somewhat objective. In the following discussion, the comparison of these schemes is based on the best estimation that each scheme can have.

3.2. Initial Guess of Parameter

Notably, the same ensemble mean initial guesses of parameters are used in all experiments. Therefore, the question is how can the initial guesses of parameters be determined? Typically, an excessive bias of an initial guess will cause a severe initial shock to the model system, resulting in the system crashing. To examine the influence of initial guess bias on parameter estimation, I set up a series of sensitivity experiments within an allowable range of bias.
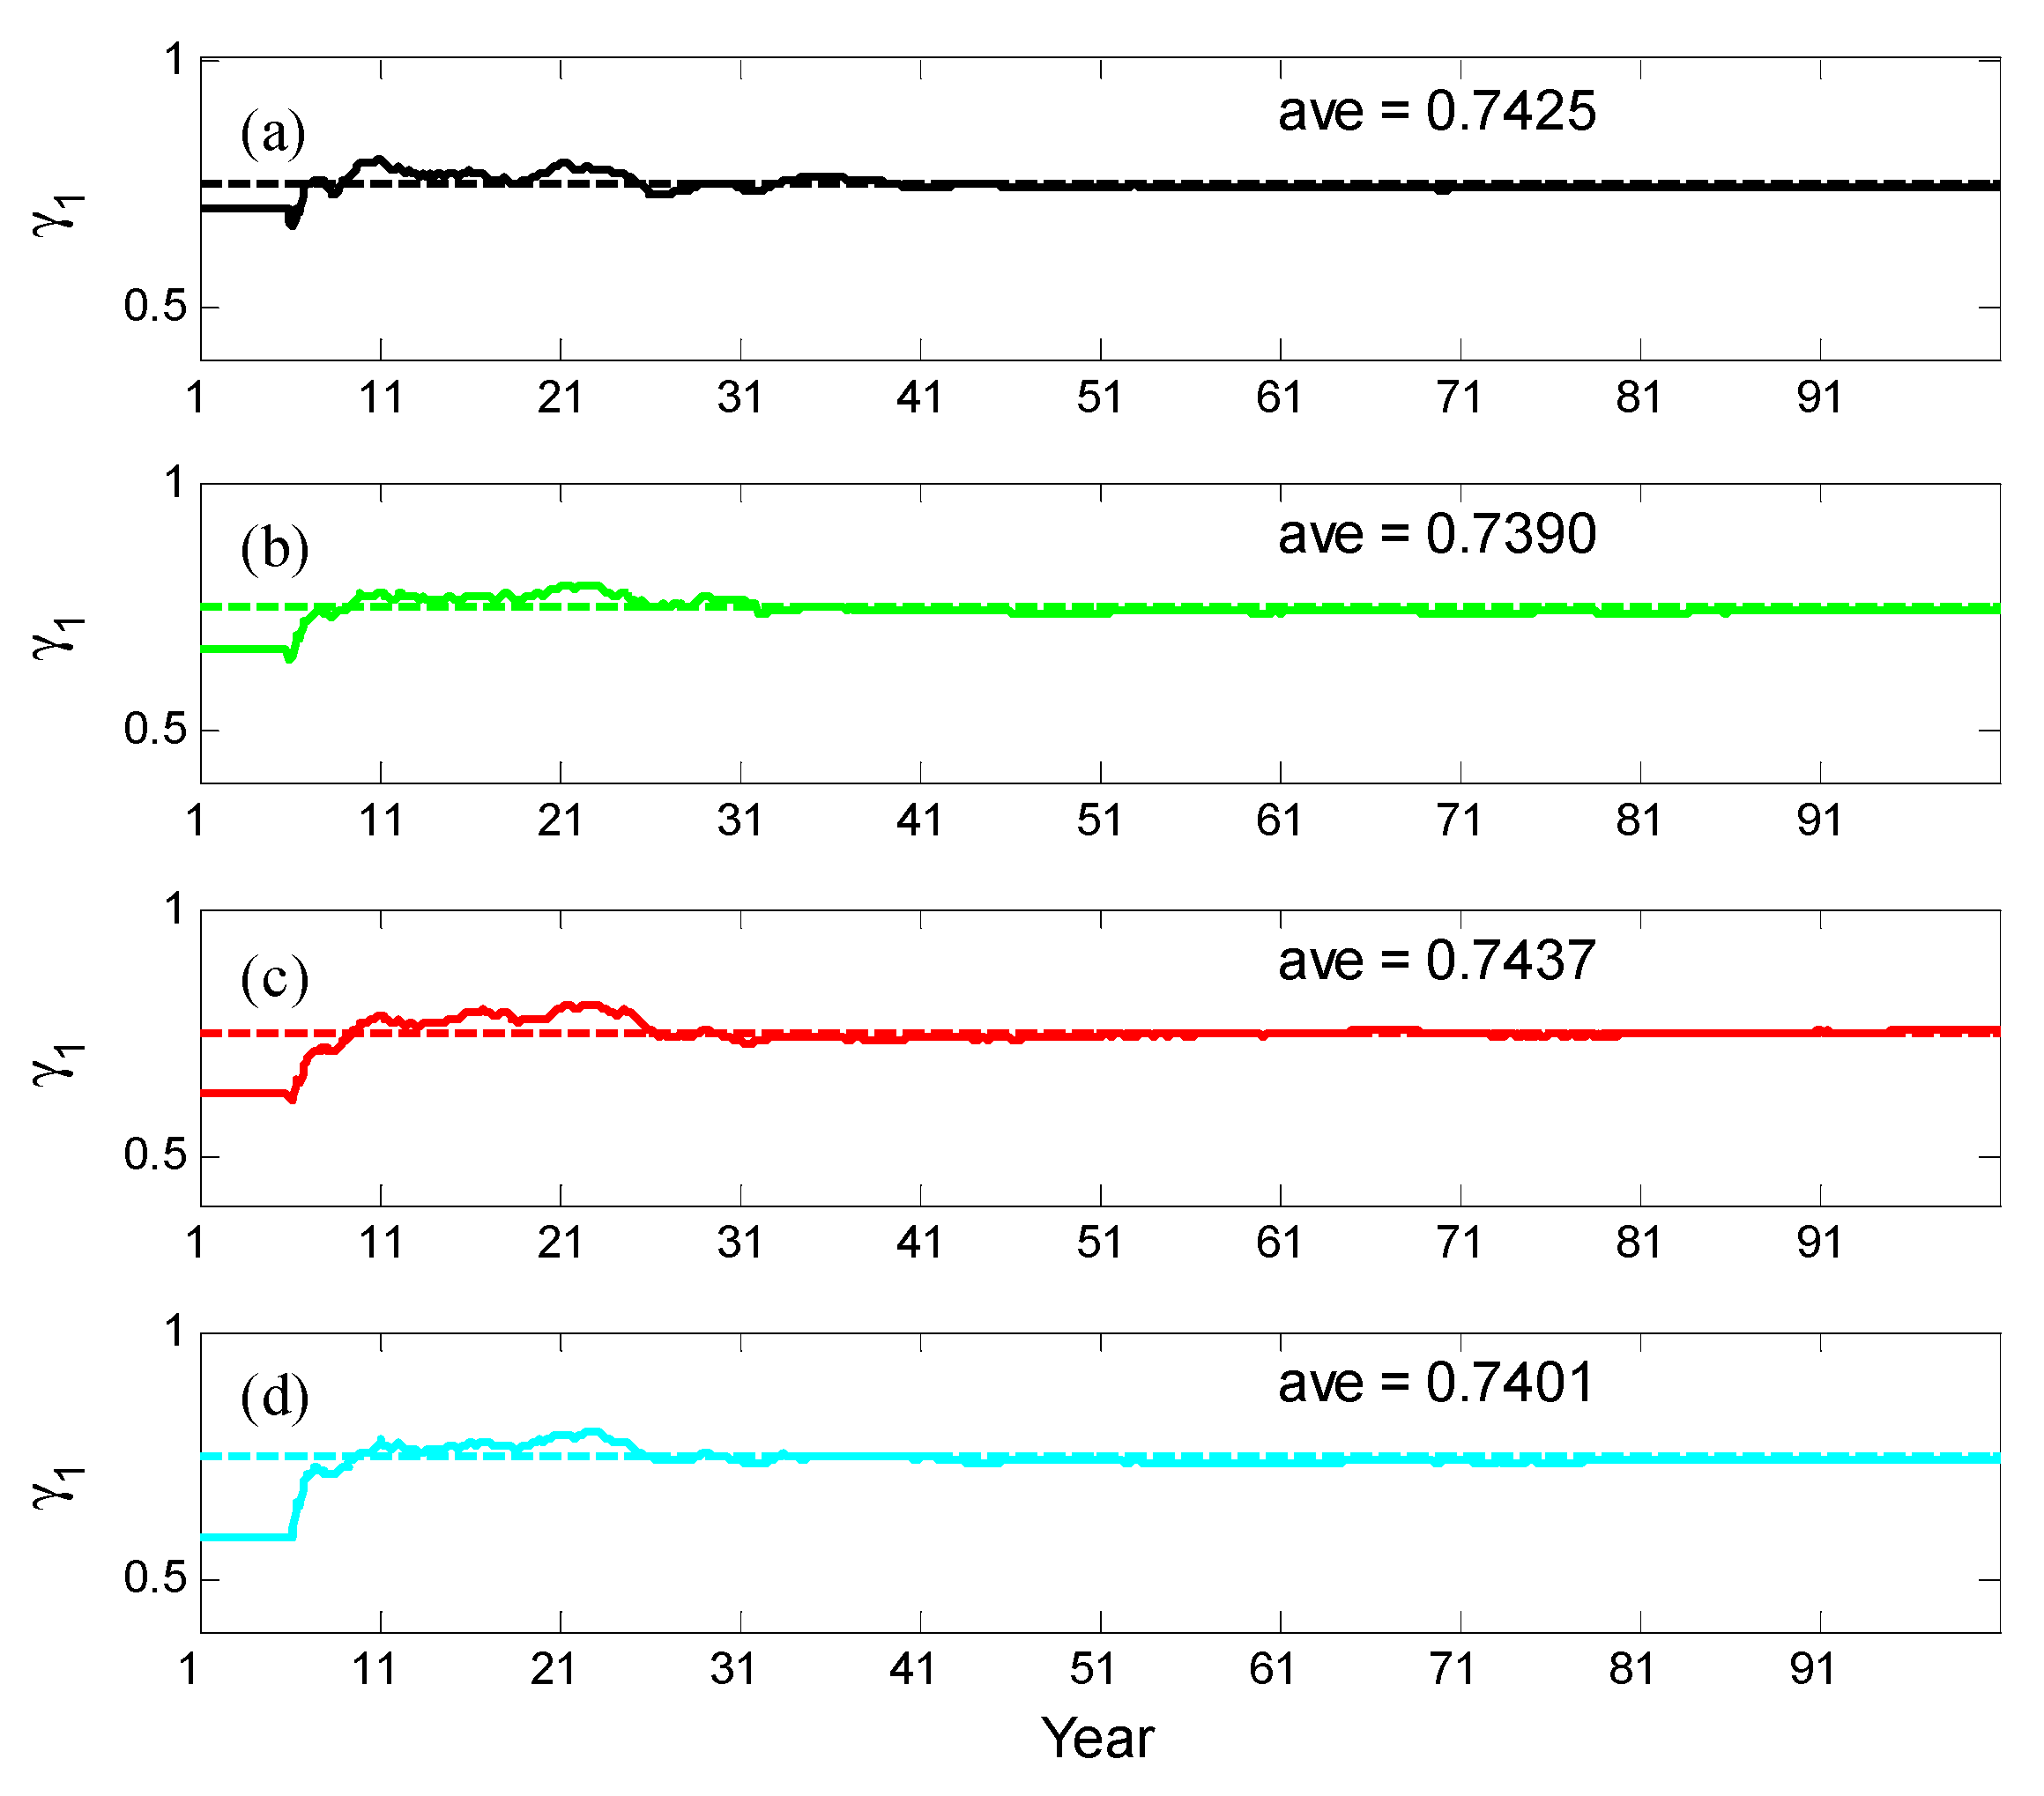
Considering the FI scheme as an example, four experiments with different initial guess biases were performed: 5%, 10%, 15%, and 20% of the truth. If the bias is larger than 25%, the model will crash. Figure 3 shows the temporal evolution of the estimated γ 1 with the assimilation for the FI scheme. The estimated values with different initial biases converge to different estimates, indicating that the relative performance is relatively sensitive to the initial guess bias. Considering that the value of the parameter in the real world is not known, the maximum allowable (20%) initial guess bias of the model parameter was adopted in this study.
Similar sensitivity experiments were also performed with the five other inflation schemes. The relative performance of inflation schemes was sensitive to the initial guess bias. That is, within the permissible limits, different initial guess biases resulted in different estimated values. After a series of sensitivity experiments, I set the ensemble mean biased guess of parameter bias 20% away from its true value (the fourth column in Table 1). Thus, the initial ensemble members are produced by perturbing the ensemble mean biased guess with random noise with a mean and variance of 0% and 25% of the biased guess, respectively.

3.3. State Inflations

The main purpose of this study is to compare the different inflation schemes on parameter estimation. Therefore, the influences of different configurations of state estimation on parameter estimation should be excluded. To this end, one possible way is to use the same state inflation scheme, such as RTPP, RTPS or any other scheme. This operation, however, changes the state variables derived from different parameter estimation experiments, which in turn affects the parameter estimation. Thus, no inflation is applied to the state estimation throughout the assimilation process.
To demonstrate that omitting inflation for state estimates is a valid design choice, I provide evidence that the ensemble spread for state variables is not collapsing well below root mean square errors. Two quantities were examined: the ensemble spreads of the prior and posterior SST anomaly and the RMSEs for the prior and posterior mean. Figure 4 shows both quantities based on the FI scheme. Even without the inflation of states, the ensemble spreads can still maintain an order of magnitude equivalent to RMSEs. Although assimilation reduces the ensemble spread of SST anomaly (i.e., posterior spread), model integration increases the ensemble spread (i.e., prior spread) again, indicating that the ensemble spread of state variables is not collapsing well below root mean square errors. The results from other schemes are similar to the results shown in Figure 4. Although model integration prevents the ensemble spread of state variables collapsing in this study, it still cannot avoid the risk of collapse without state inflation in other places.

4. Results

4.1. Single-Parameter Estimation

The different inflation schemes were first investigated using single-parameter estimation. The single-parameter estimation in this study refers to only one parameter estimated by assimilation, thus there are six single-parameter estimation experiments (see the first row in Table 4). Because γ 1 in Equation (1) is a key parameter to control upwelling, it was first selected to perform single-parameter estimation.
The ensemble size was set to 100 for all experiments. The assimilation frequency was once a month. The decorrelation of the Gaspari–Cohn function [57] is defined as the observation localization of eight times the distance between the adjacent grids (5.625° in zonal direction and 2° in meridional direction) after a series of tests. That is, when the distances between model grids and a certain observed location are beyond eight times the distance between the adjacent grids, the model grids are not affected by the analysis increment of this observation.
The total data assimilation period was 100 model years, and single-parameter estimation was activated after five years of the state estimation only (see the third row in Table 4) to ensure a “quasi-equilibrium” state [11]. The parameter estimations were performed using the augmentation technique, as mentioned in Section 2.2, which were accompanied by state estimation as shown in Equation (4) to Equation (7). For simplicity, I only refer them to as parameter estimation but actually, the state and parameter were simultaneously estimated in this study (see the first and second row in Table 4).

4.1.1. Estimated Single Parameter

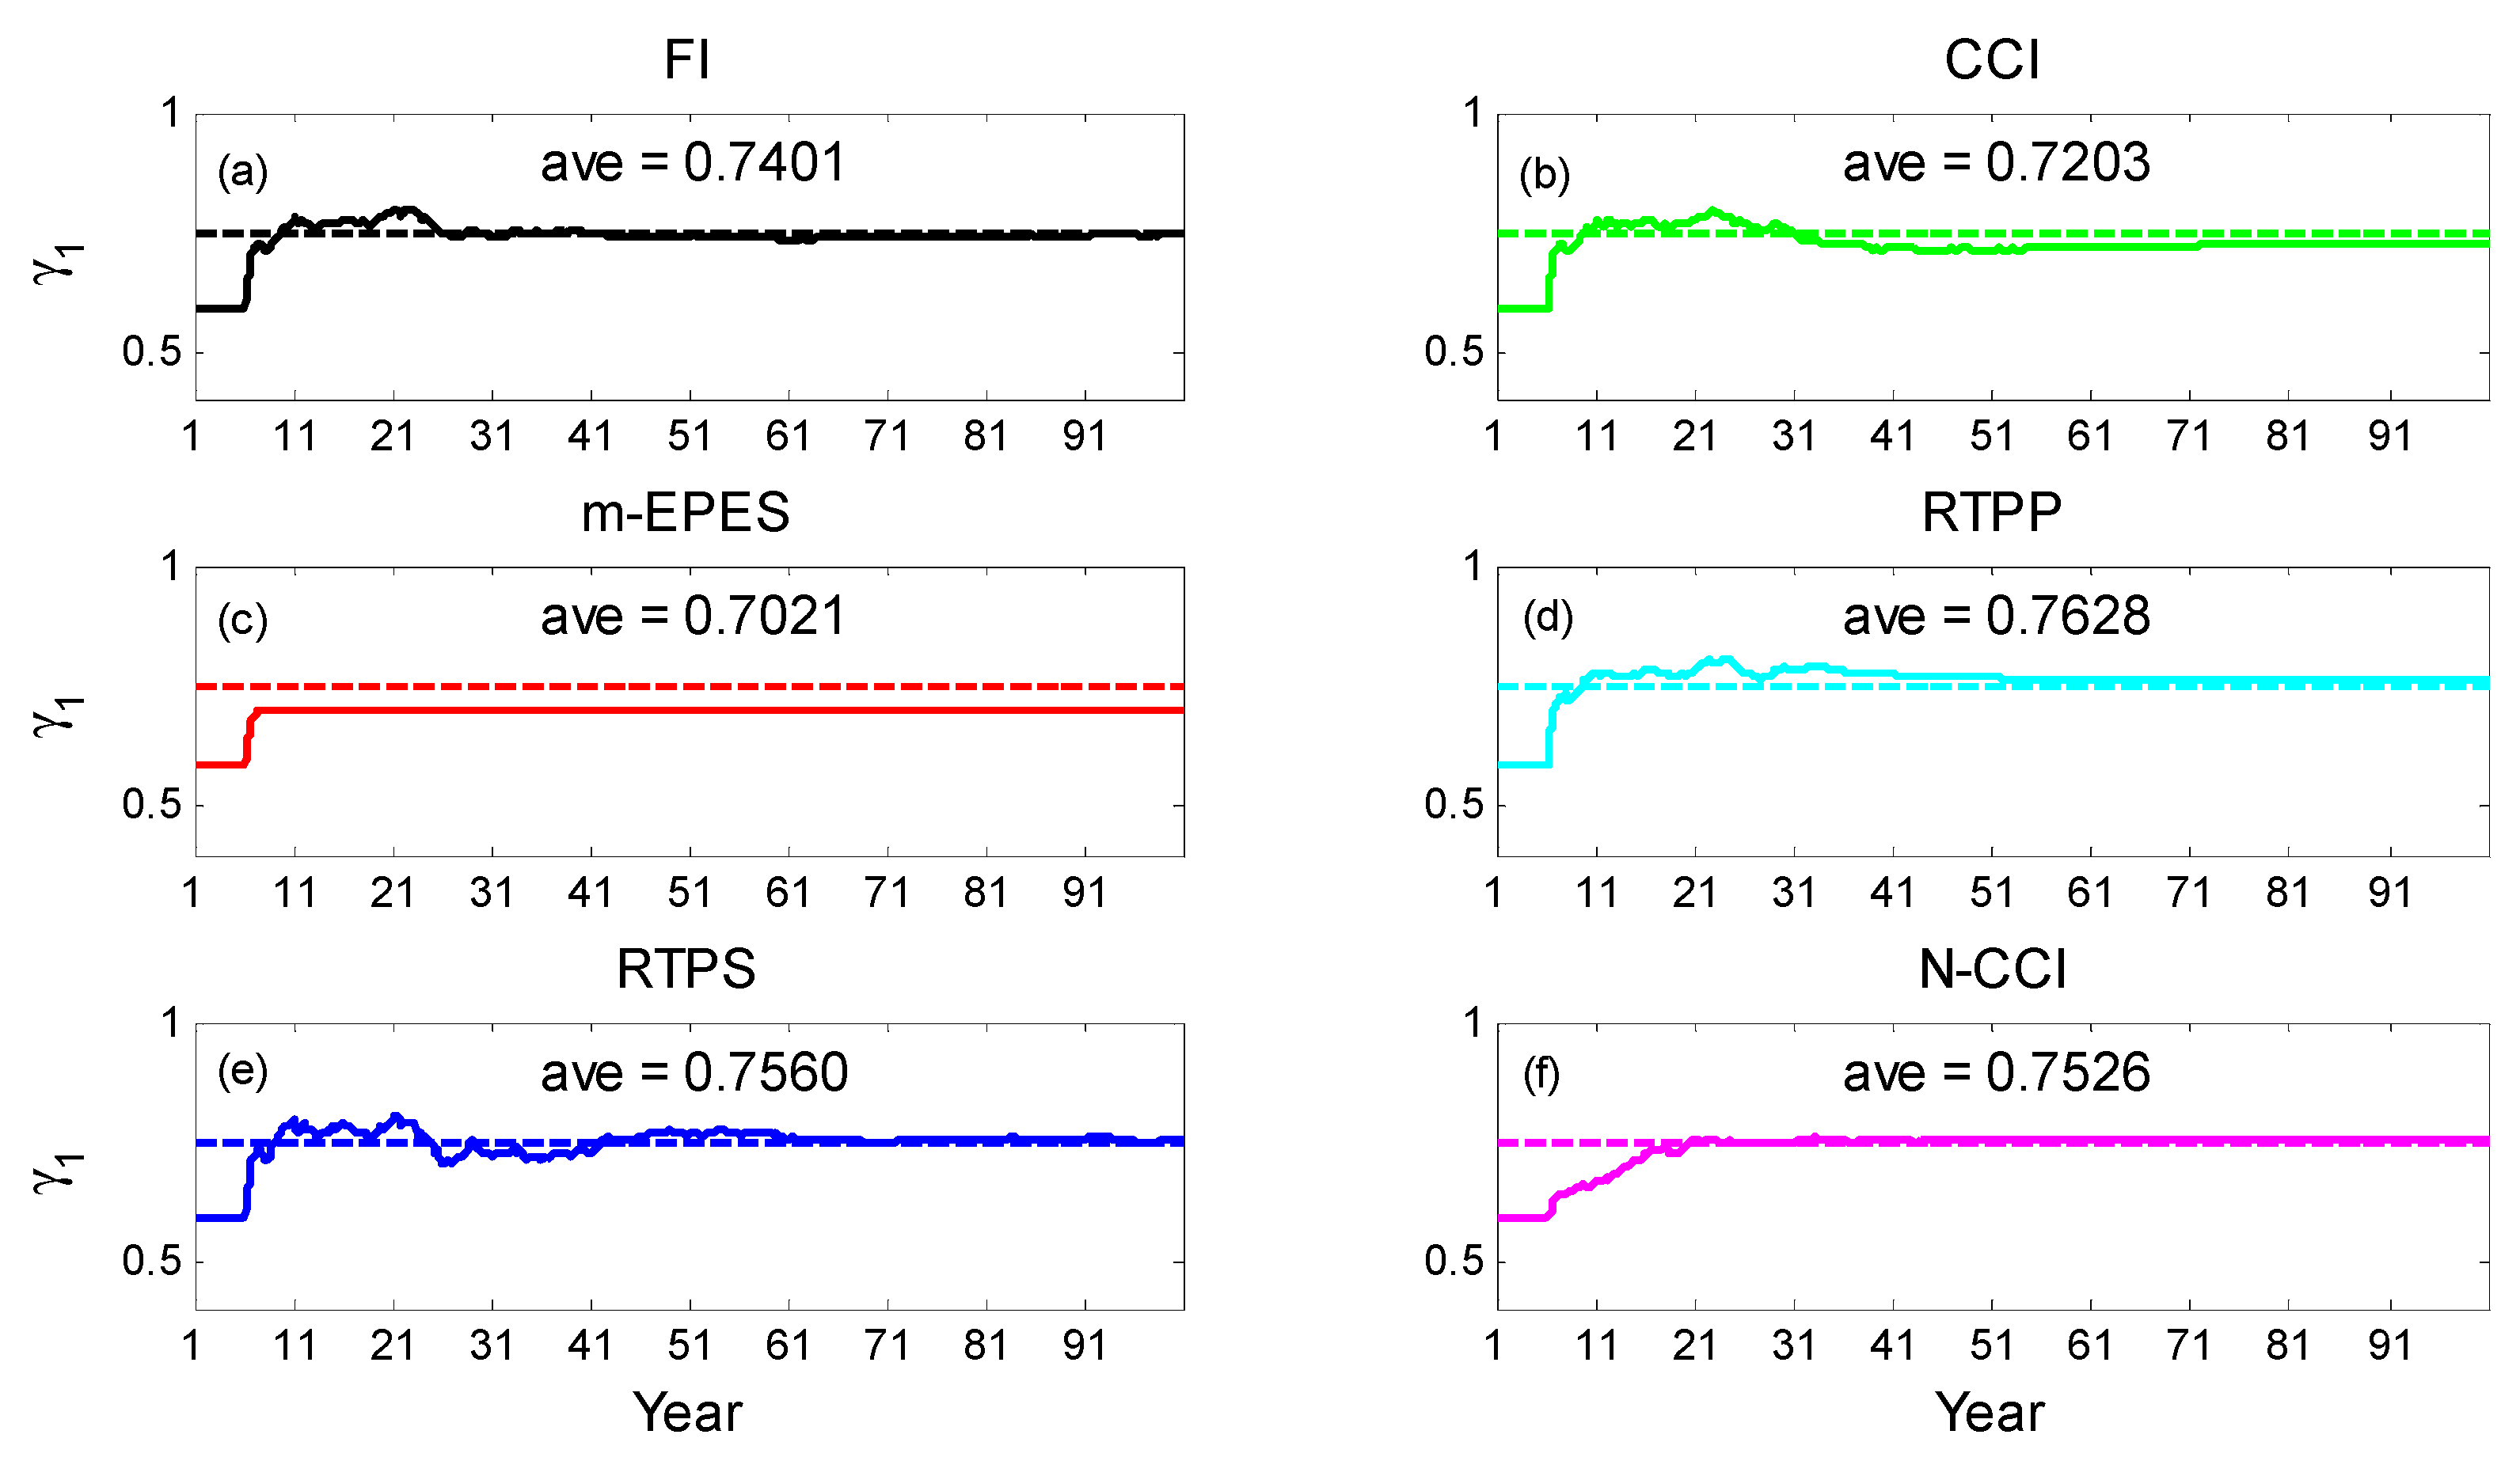
A good inflation scheme can reduce bias effectively in an estimated error covariance and produce a better estimate of the ensemble mean. Parameter estimation under the OSSE framework can make an ensemble mean converge toward a true value. Figure 5 shows the temporal evolution of the estimated γ 1 with the assimilation length. The estimated parameters with the six inflation schemes converged to a constant value close to the true value (0.75) after two or three decades, despite the large initial errors. Excluding periods of dramatic parameter adjustment, the last 50 years (51st–100th model years of data assimilation) was a relatively stable period for parameter estimates. Therefore, data over the last 50 years were used to evaluate the results in the following text. The estimated parameter for each scheme was obtained using the average value over the last 50 years, as labeled in the subplot figure. The comparison shows that the N-CCI scheme is closest to the true value, unlike the m-EPES scheme, which is farthest from the true value.
In addition, Figure 5 shows that different inflation schemes have different convergence speeds. If the absolute error variation between the estimated value and true γ 1 is maintained in a small range after a certain time, the time taken to reach this certain time is defined as the convergence time. For each scheme, the small fluctuation range is defined by the interval of ± 5% of the estimated value. Table 2 shows the convergence times of the six inflation schemes. Although the m-EPES scheme had the shortest convergence time, it converged to the wrong estimation (Figure 5c). As for the other schemes, the N-CCI scheme converged the fastest, followed by the FI and RTPP schemes, and the CCI and RTPS schemes had relatively slower convergence.
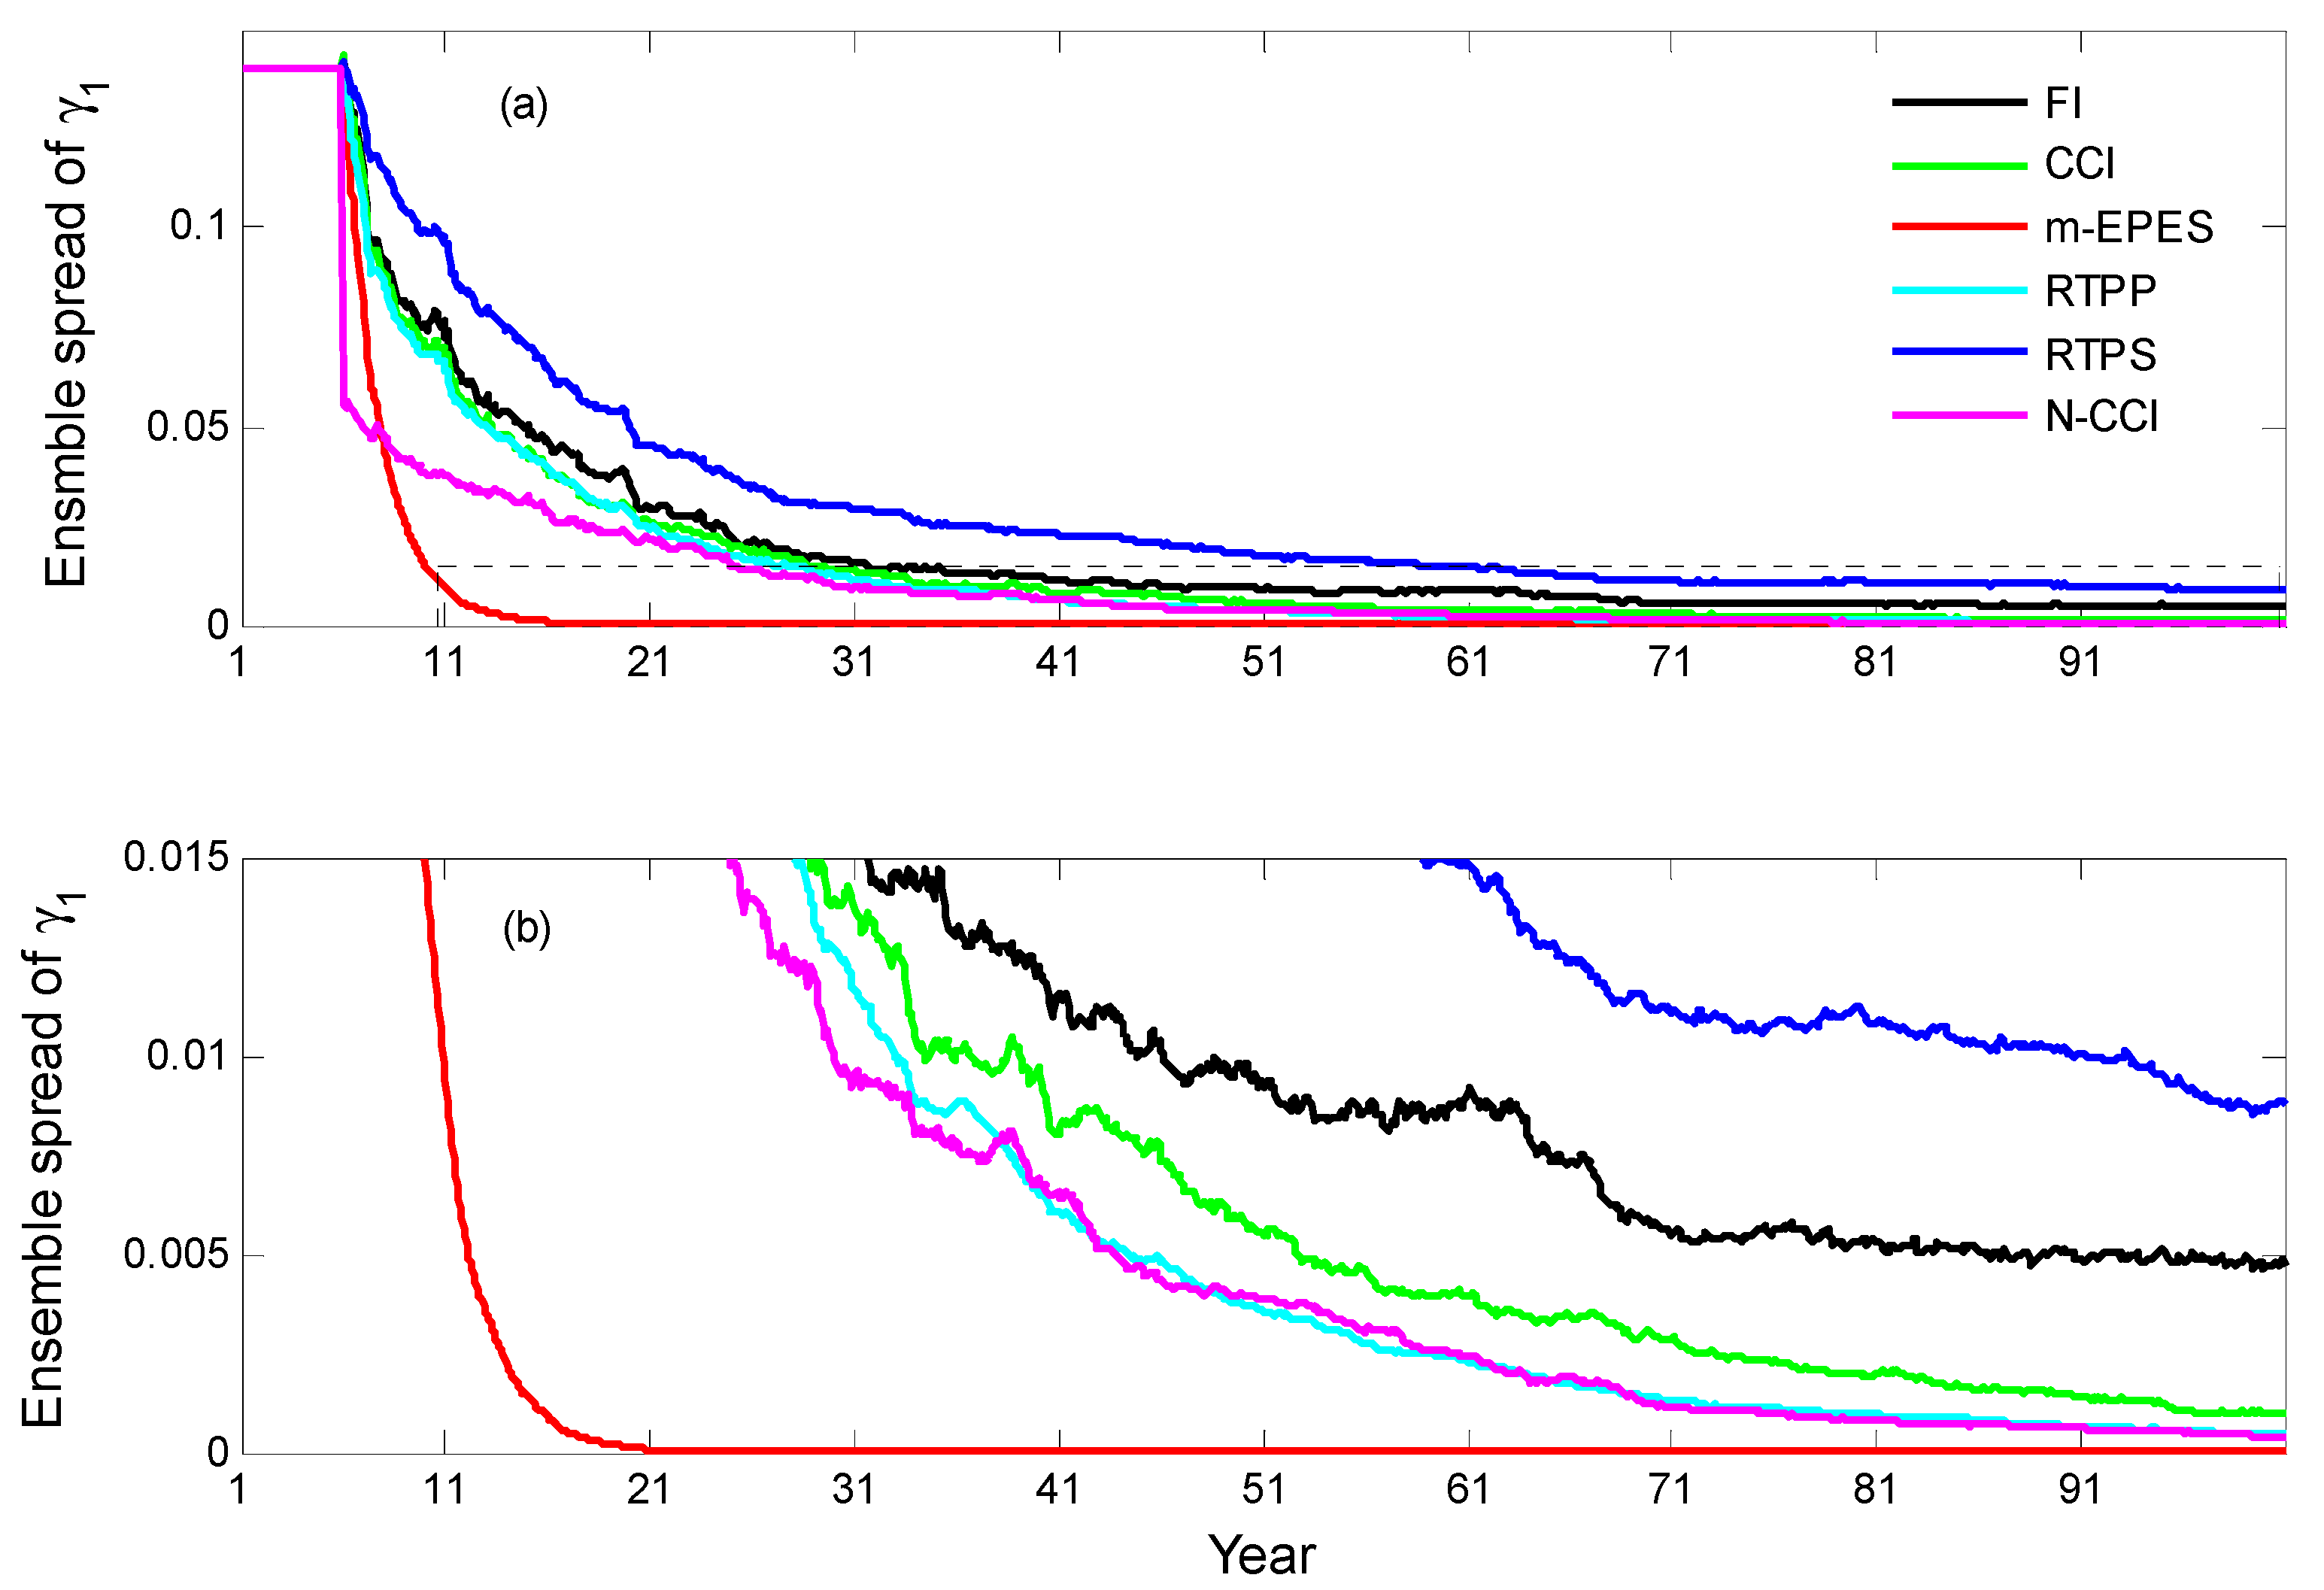
It would be interesting to explore the reason different schemes have different parameter estimation effects. The ensemble spread, which represents the uncertainty of samples, should not be too large or too small. If the spread is too large, the unrealistic parameter values would produce a negative impact on the analysis quality. However, if the spread is too small, the filter would not work due to filter divergence. Figure 6 shows the temporal evolution of the ensemble spread of the estimated γ 1 using the six schemes. To clearly display the ensemble spread of the last 50 years, Figure 6b enlarged the y-axis of 0−0.015 in Figure 6a. The spread with the m-EPES scheme rapidly declined to a value close to 0, suggesting that after several assimilation steps, the filter is no longer effective despite the participation of new observations. The estimated value of γ 1 with the m-EPES scheme seems to be a local optimum value. Additionally, other schemes can maintain certain ensemble spreads from 0.0001 to 0.01 over a long time, including the very last step of assimilation, making the estimated parameter value easier to achieve global optimum value than the m-EPES scheme.
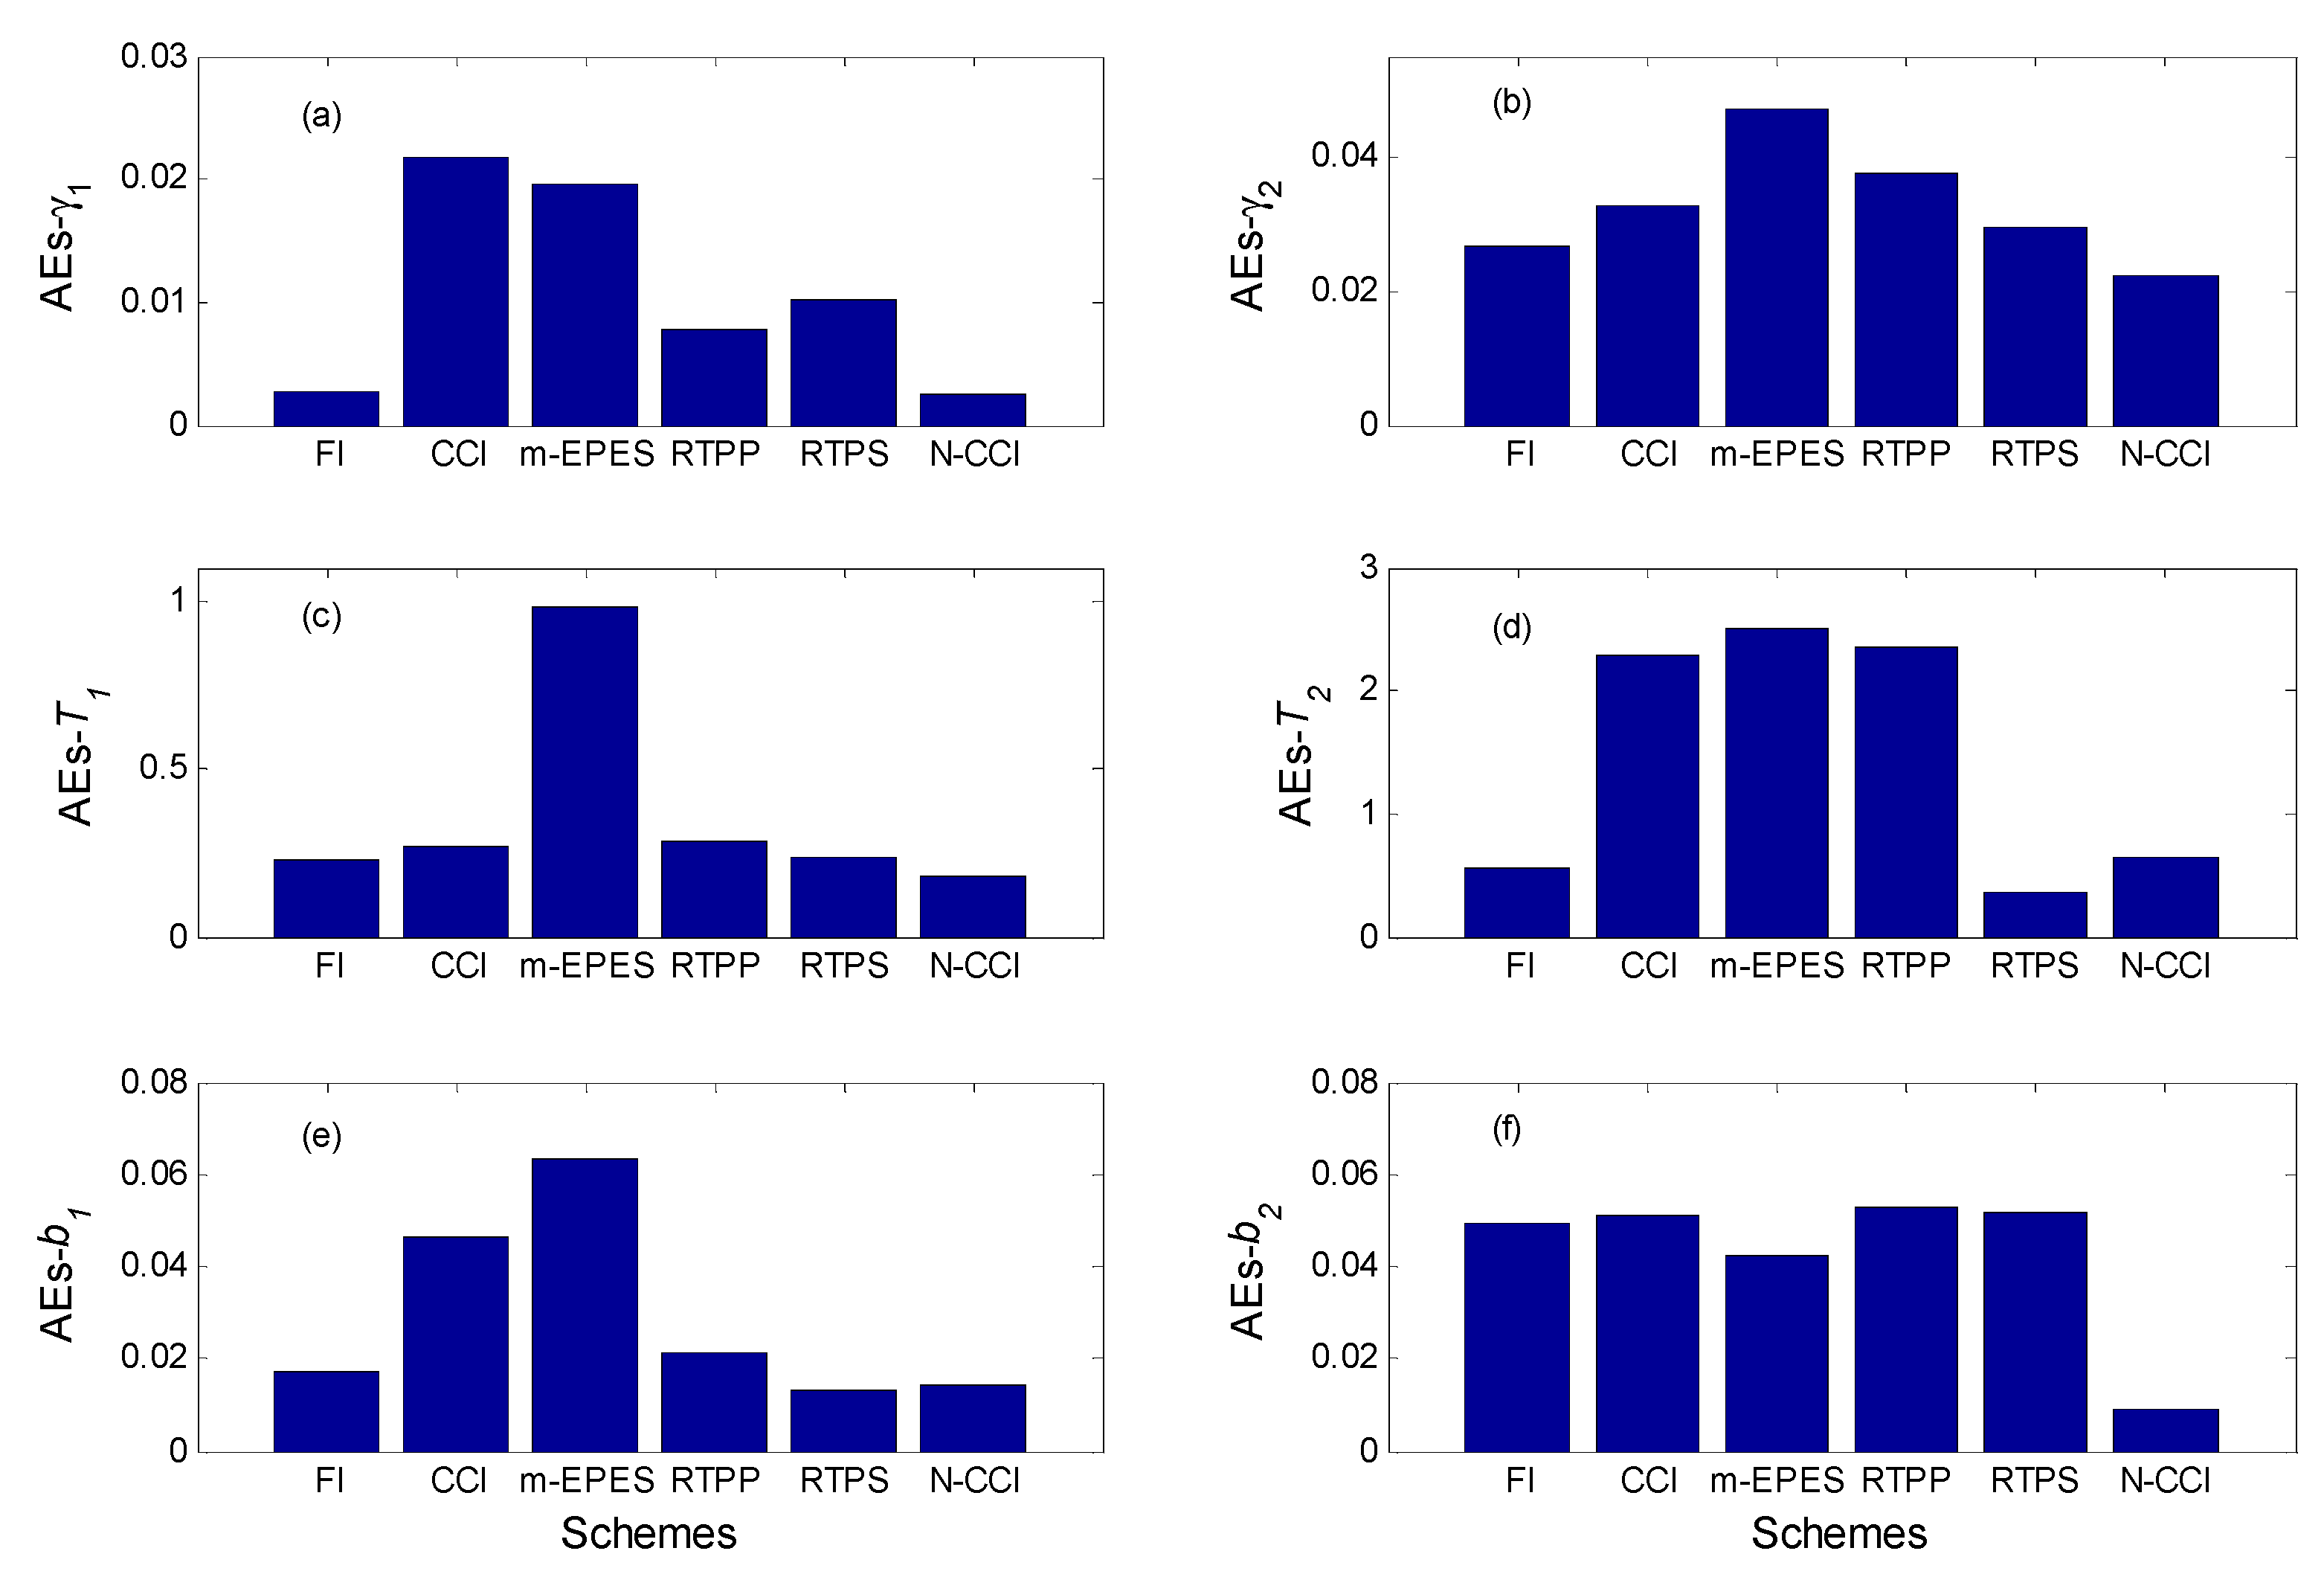
The previous analysis only examined estimations of γ 1 with the six inflation schemes. To examine the validity of the six inflation schemes in other five parameter estimations, γ 2 , T 1 , T 2 , b 1 , and b 2 were estimated separately. The absolute errors between the estimated parameters and true values all significantly declined with the assimilation steps in these experiments, implying the success of the six inflation schemes in estimating the six parameters. Figure 7 shows the absolute errors of the six estimated single parameters with the six schemes over the last 50 years. For most parameters, such as γ 1 , γ 2 , T 1 , and b 2 , the N-CCI scheme achieved the best results. As for T 2 and b 1 , the N-CCI scheme had decent estimations. For γ 1 , γ 2 , T 1 , and b 1 , the results of the FI scheme were slightly inferior to that of the N-CCI scheme, the RTPS scheme had relatively poor estimations. For most parameters, such as γ 2 , T 1 , T 2 , and b 1 , the m-EPES scheme achieved the poorest results. The results are consistent across most single-parameter estimation experiments. Thus, the performance of the inflation schemes is stable when applied to most parameter estimations.
Although the above results show that the assimilation system with different inflation schemes is successful in single-parameter estimation, there are some differences between the different schemes. In terms of both the estimated parameter and convergence speed, the N-CCI scheme achieved the best results, followed by the FI scheme.

4.1.2. Model States and ENSO Prediction

Although parameters were constant during model integration, they could influence the state variables through the model. Before performing prediction experiments, a model system should be examined for its ability to simulate state variables. To assess the impact of parameter estimation on the analysis of state variables, I performed composite analyses for El Niño and La Niña events in three scenarios. One was SST anomalies produced by the true model, another was the simulations with the N-CCI scheme from single-parameter estimation (first row in Table 4), and the third was the simulations from state estimation only (third row in Table 4). In this subsection, I only considered γ 1 and the N-CCI scheme as examples. Following the definitions in Chen et al. (2004) [2], an El Niño is defined when the Niño3.4 index is greater than 1 °C, whereas a La Niña is defined when the Niño3.4 index is less than −1 °C. Thus, there are 21 El Niño events and 23 La Niña events during the entire period.
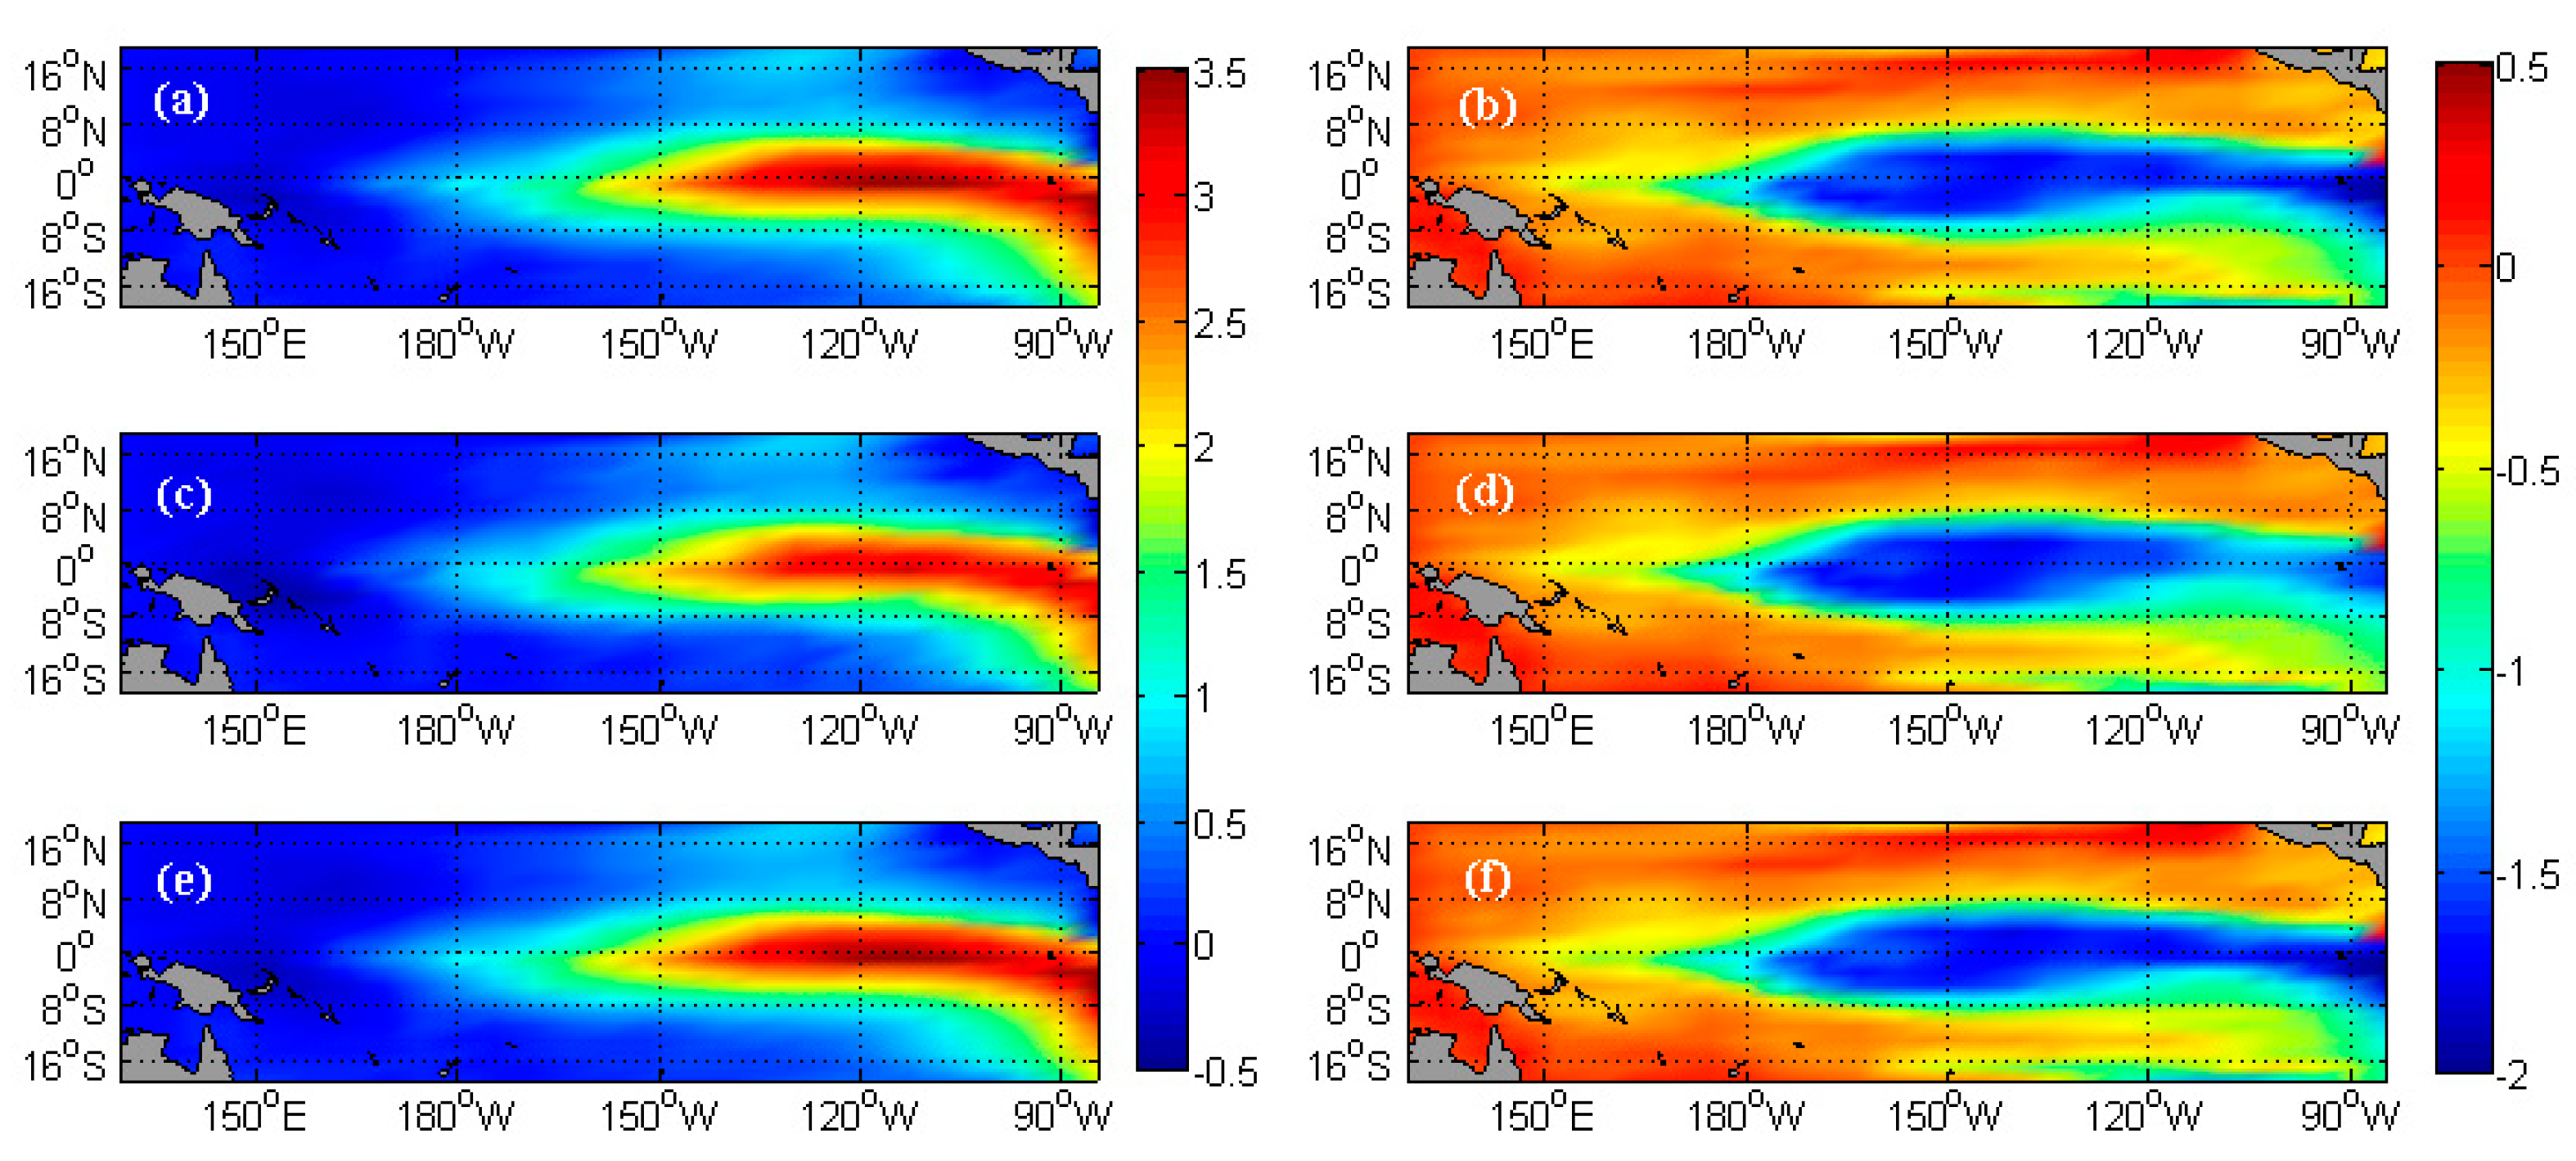
Figure 8 shows the composite results, including those comparisons with true values and state estimation only. The mean absolute error in the El Niño composite of state estimation only was 0.0499 °C, whereas that of single-parameter estimation was 0.0197 °C, with an error reduction of approximately 60%. The mean absolute error in the La Niña composite of state estimation only was 0.0404 °C, whereas that of single-parameter estimation was 0.0240 °C, with an error reduction of approximately 40%. First, the results indicate that parameter estimation makes SST anomalies in the central and eastern Pacific closer to the truths for both warm and cold events. Second, after single-parameter estimation, the decrease in mean absolute error in the La Niña composite was smaller than that in the El Niño composite, probably because the intensity of the La Niña events was usually relatively small, resulting in difficulties in improving the simulations.
Figure 9 shows the RMSEs of the averaged SST, ULD, and T e anomalies over the Niño3.4 region during the last 50 years. The RMSEs were calculated between the true states described in Section 2.3 and the simulations with each inflation scheme. Although different inflation schemes have different effects on state simulations, a consistent conclusion can be drawn in terms of the estimated parameter. Namely, the N-CCI scheme achieved the best simulations, followed by the FI scheme. The RTPP and RTPS schemes had a relatively poorer simulation, and the m-EPES and CCI schemes had the poorest simulations. Similar results were obtained using the other five single-parameter estimation experiments. In general, the best parameter estimation by the N-CCI scheme produced the best state simulations, whereas the worst parameter estimation by the m-EPES scheme produced the worst state simulations.
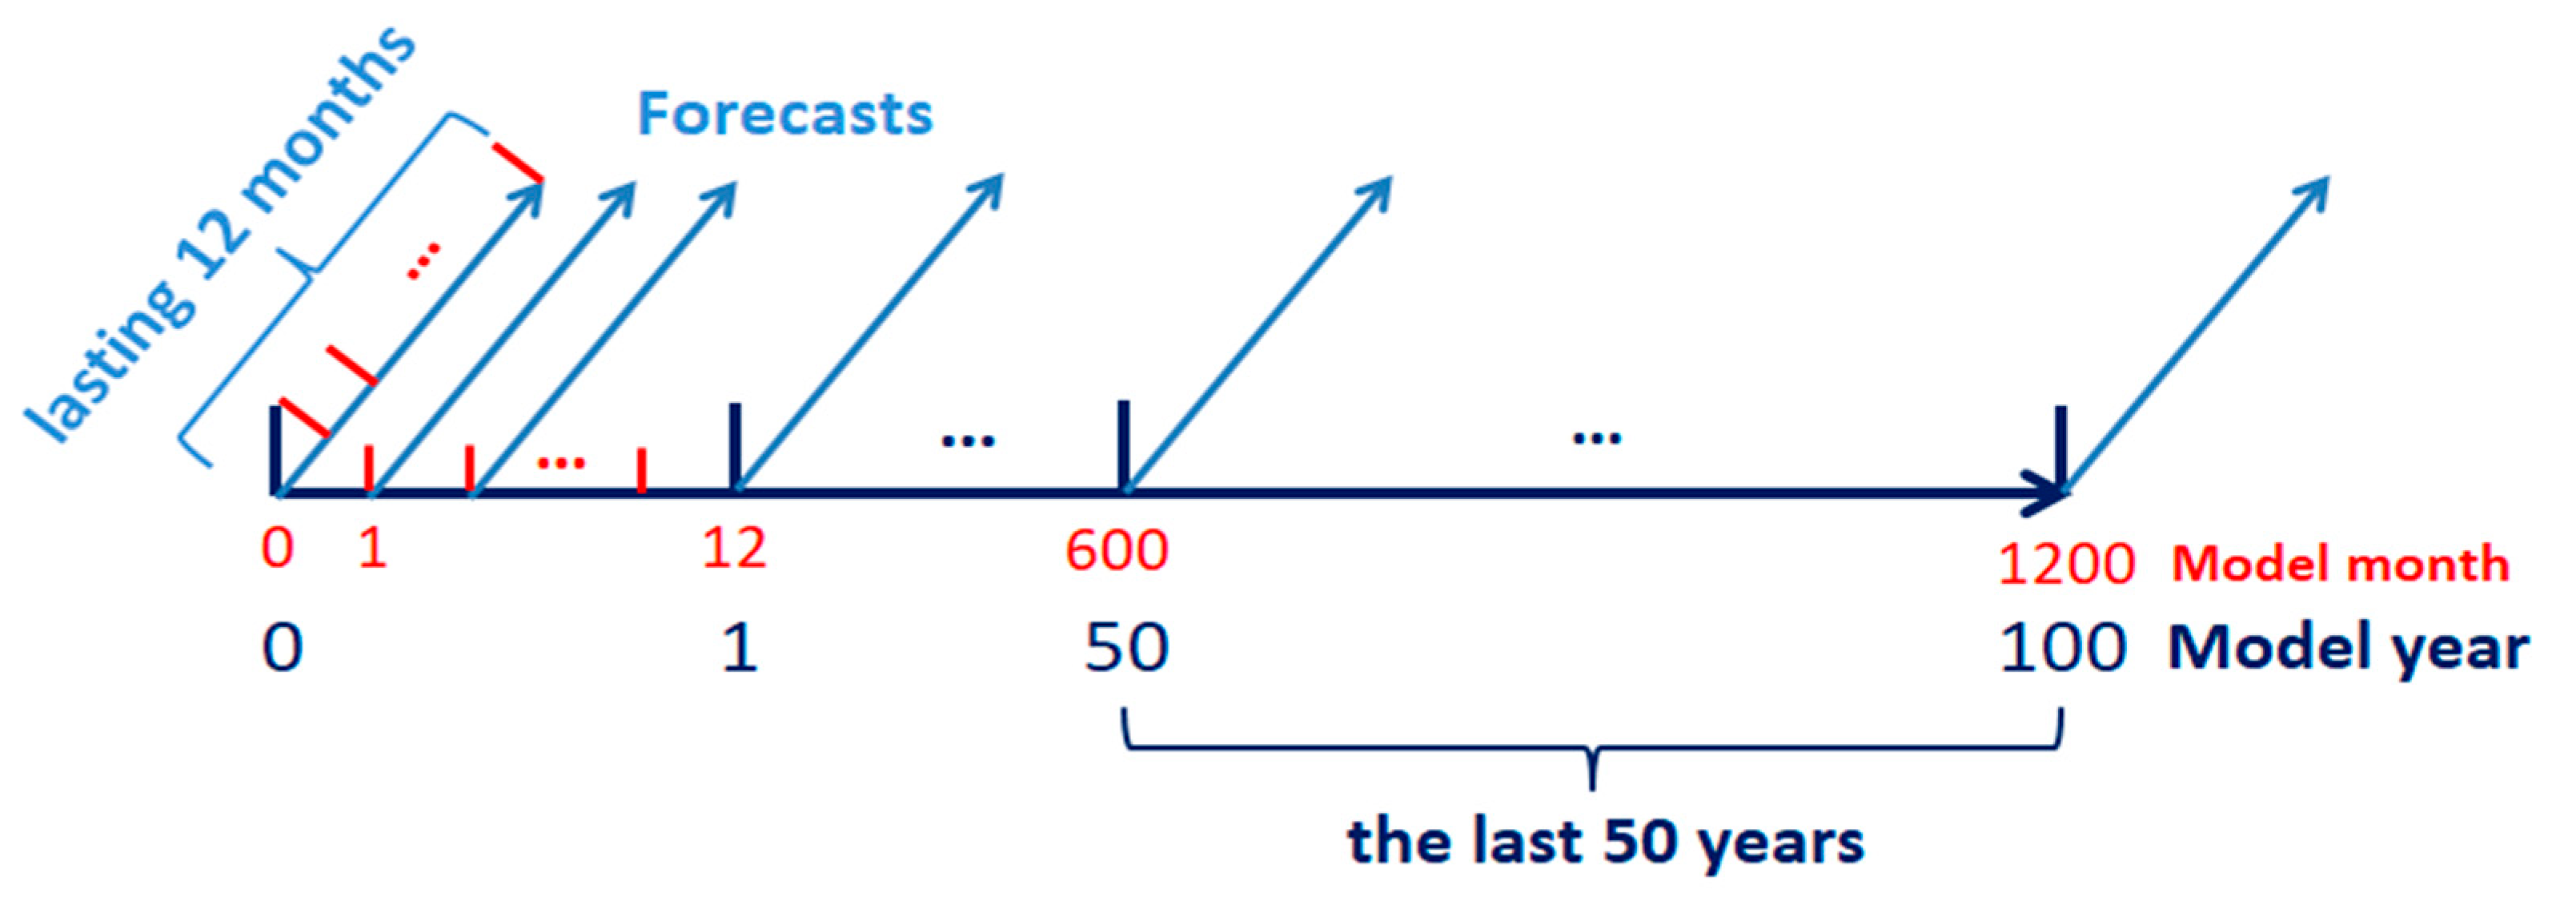
Based on the state augmentation technique, the assimilation filter estimated the parameter γ 1 and the model states, as discussed in the preceding sections of the manuscript. With the model states used as the initial conditions, and the average of estimated γ 1 over the last 50 years (see Table 5) taken as the parameter value, six prediction experiments were performed to examine the performance of the six schemes regarding the ENSO predictions. These experiments were performed covering 100 model years, with each prediction lasting for 12 months. For clarity, the diagram of prediction experiment is illustrated by Figure 10.
Since the value of γ 1 was the average value of the estimated γ 1 over the last 50 years, the results of the last 50 years were used to evaluate the predictions. Because the Zebiak–Cane model is an anomaly model, the Anomaly Correlation Coefficients (ACCs) could be calculated by Equation (16). The ACCs and RMSEs of the predicted SST anomalies against the true counterparts in the Niño3.4 region are shown in Figure 11. Note that, the formulas of the two quantities for the s -th s = 1,2 , , 12 lead month are
A C C s = m = 1 M ( X ¯ m , s f X ̿ s f ) ( X m , s o b s X ¯ s o b s ) m = 1 M ( X ¯ m , s f X ̿ s f ) 2 m = 1 M ( X m , s o b s X ¯ s o b s ) 2 ,
R M S E s = 1 M m = 1 M ( X ¯ m , s f X m , s o b s ) 2 ,
where M represents the number of prediction experiments, which is equal to 49 × 12 in this study because the evaluation was performed during the last 50 years [16]; X ¯ f denotes the ensemble mean of predicted SST anomalies over the Niño3.4 region with prediction experiments mean of X ̿ f ; X o b s denotes the observational counterpart with prediction experiments of X ¯ o b s .
The results show that the N-CCI scheme achieved the highest prediction accuracy, followed by the FI scheme. The RTPS and RTPP schemes had relatively poorer accuracies, and the m-EPES and CCI schemes had the poorest accuracies. Combined with the abovementioned results, better parameters, such as in the N-CCI and FI schemes, which produce better state simulations, will result in improved predictions. On the other hand, inferior parameters, such as in the m-EPES and CCI schemes, which produce poor state simulations, will result in worsened predictions.
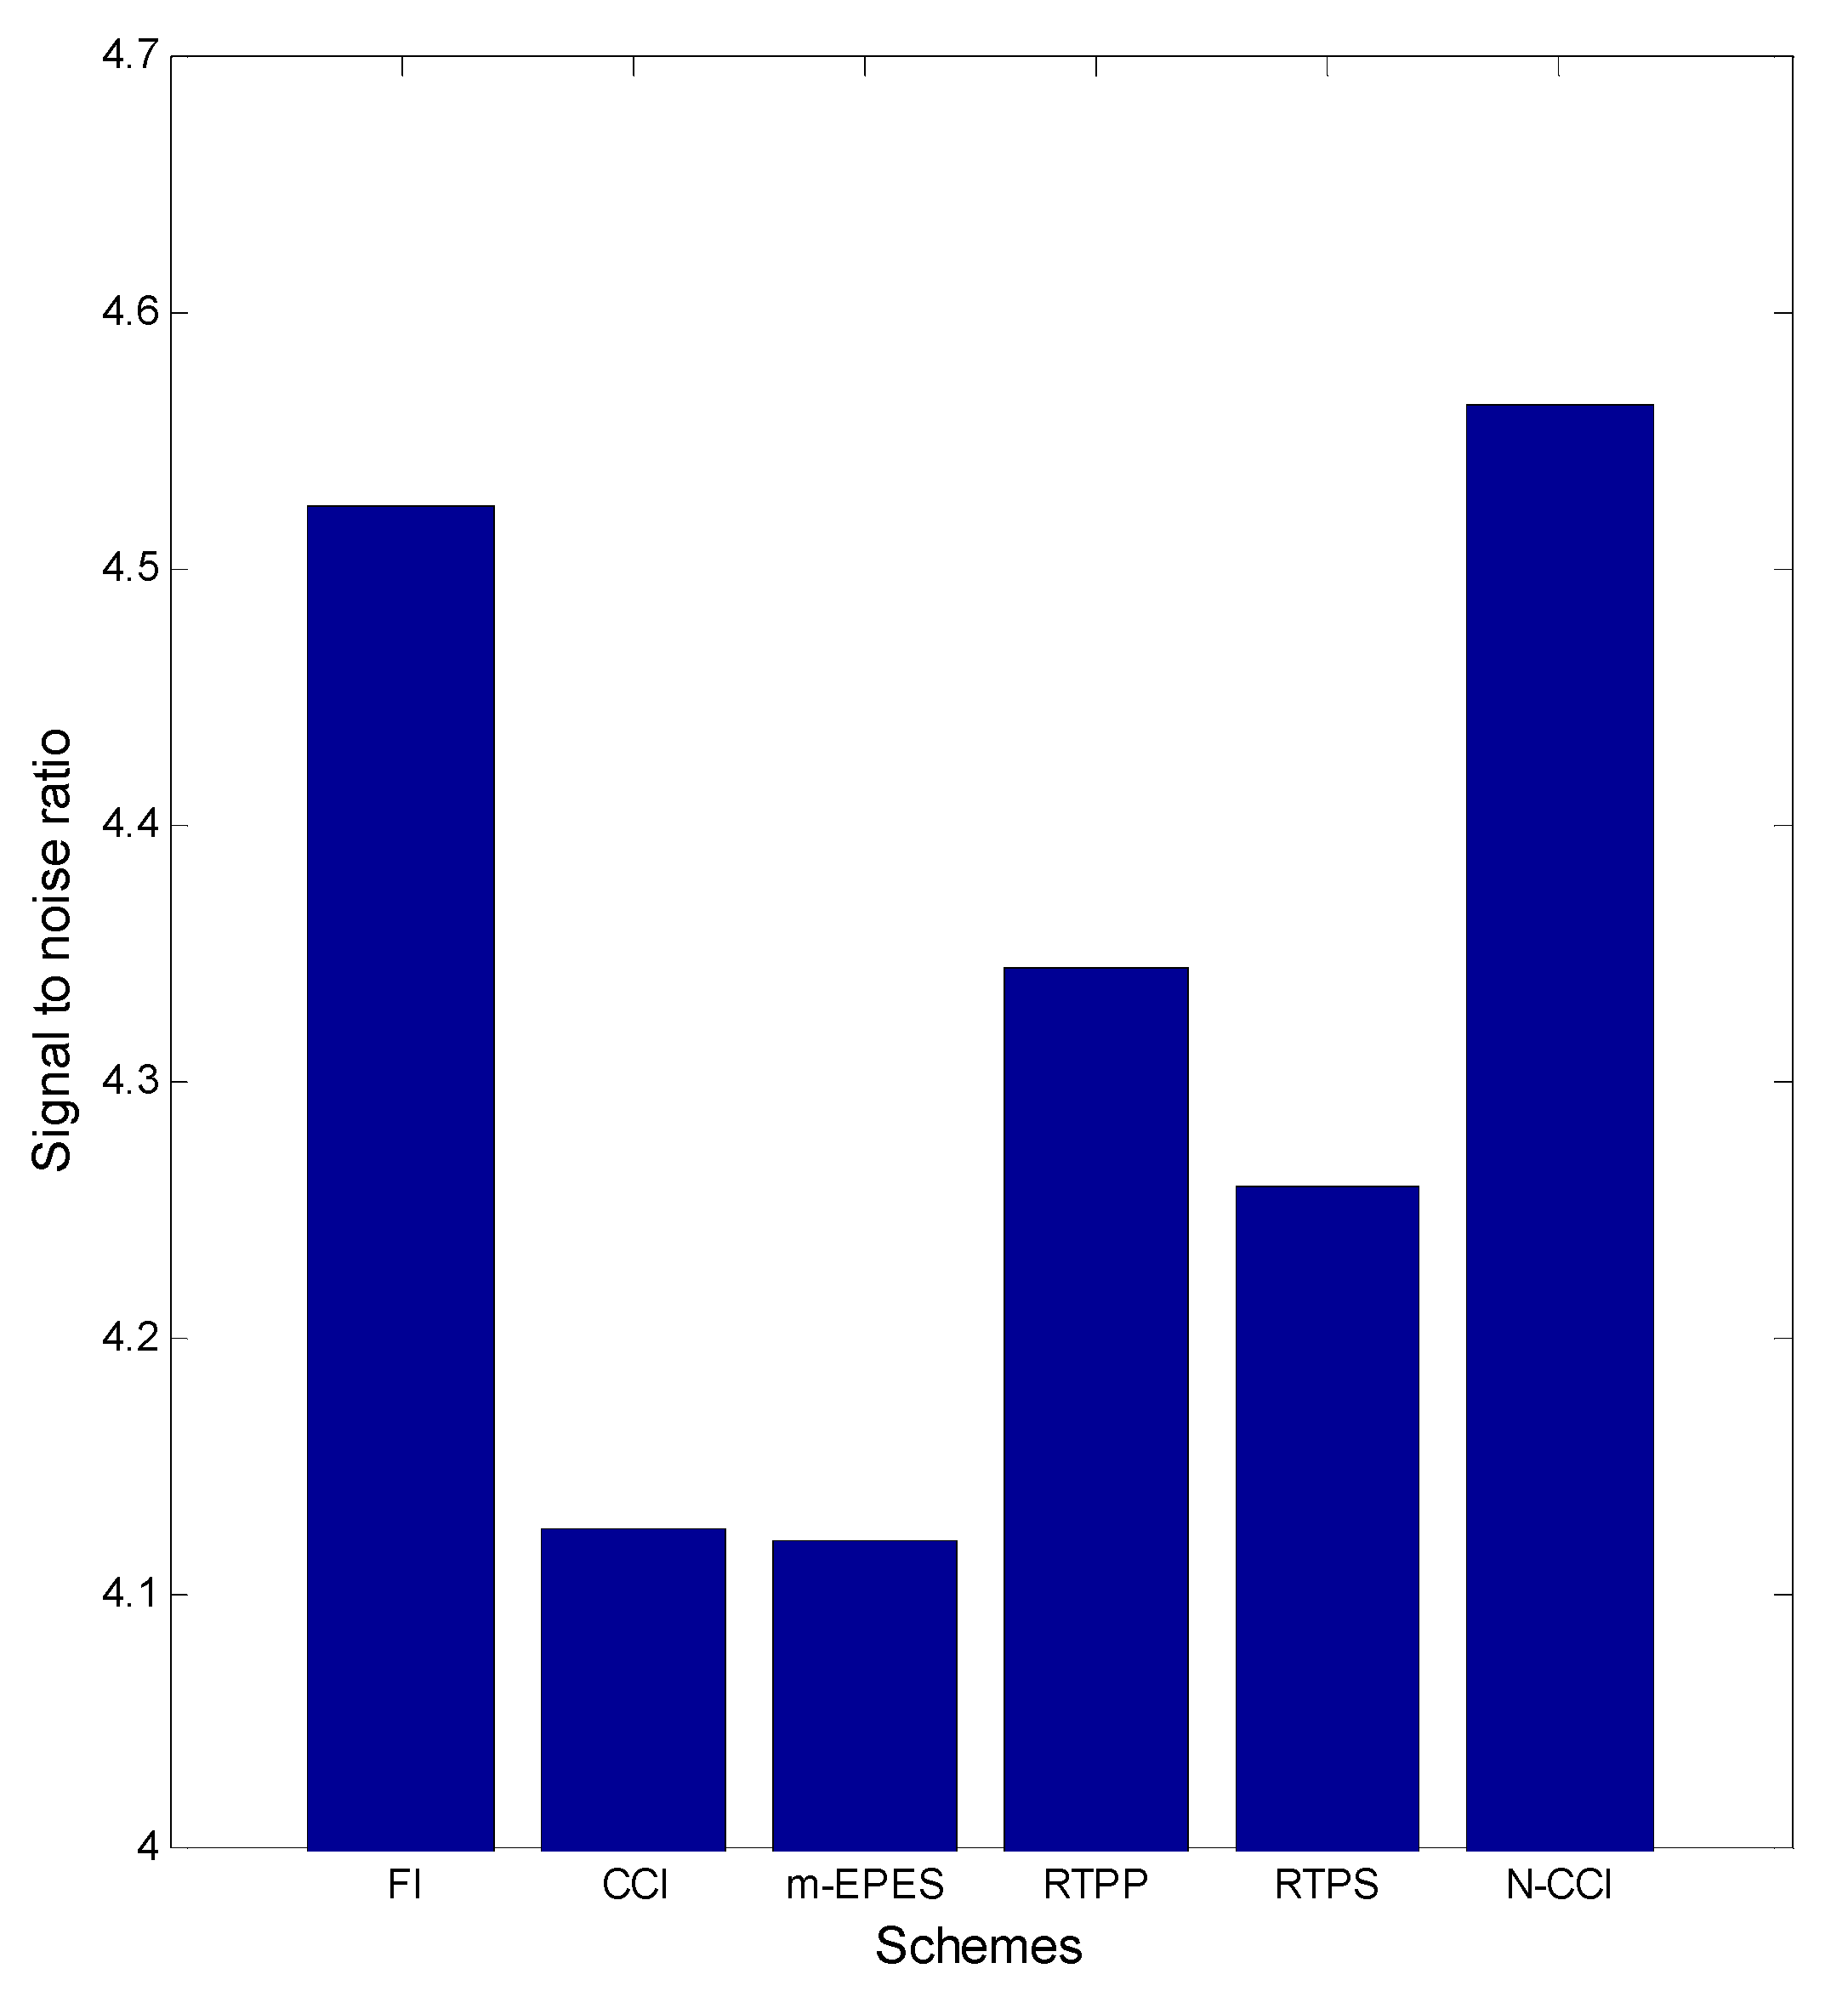
The signal-to-noise ratio analysis method was adopted to explain the differences in the predictions for the different inflation schemes further. For ensemble forecasting, the variance of the ensemble mean can be regarded as a measure of signal, while the ensemble spread reflecting the increase in disturbance can be regarded as noise. The signal-to-noise ratio should be as high as possible for a successful estimation or prediction system. Thus, the signal-to-noise ratio is a robust tool for interpreting the prediction effects of different schemes [58,59]. The signal-to-noise ratio can be expressed as
S N R = 1 M m = 1 M ( X m ¯ X ̿ ) 2 1 M · N e m = 1 M n e = 1 N e ( X m , n e X m ¯ ) 2 ,
where X m , n e denotes the n e -th member of predicted Niño3.4 index from the m -th initial condition, M represents the number of total initial conditions, and N e represents the number of ensemble members, X m ¯ = 1 N e n e = 1 N e X m , n e represents the ensemble mean of X m , n e , X ̿ = 1 M m = 1 M X m ¯ represents the mean of all initial conditions in X m ¯ . Figure 12 compares the signal-to-noise ratios of the six inflation schemes. The N-CCI scheme had the greatest signal-to-noise ratio, followed by the FI scheme. The RTPS and RTPP schemes had relatively smaller ratios, and the CCI and m-EPES schemes had the smallest ratios. The results explain why the N-CCI scheme can obtain the best parameter estimation effect.

4.2. Multiple-Parameter Estimation

As mentioned in Section 3, the N-CCI scheme showed superiority in single-parameter estimation and ENSO prediction. To examine its performance with multiple-parameter estimation, a similar study is conducted with the biased model in this section. The multiple-parameter estimation entails adjusting the six key parameters and state variables simultaneously in the assimilation step (see the second row in Table 4). The settings were the same as those in Section 3, except that the six parameters were simultaneously estimated. The fifth column in Table 2 shows the range of tested values (signed with parentheses) and the values giving the best estimation for each scheme in multiple-parameter estimation. In the CCI and N-CCI schemes, the six factors/thresholds correspond to six parameters.

4.2.1. Estimated Multiple Parameters

Joint estimation of multiple parameters is more difficult than single-parameter estimation due to the increase in the dimensional number of parameter estimation and their mutual constraints. Figure 13 shows the temporal variation in the absolute errors between the estimated parameters and true values of γ 1 , γ 2 , T 1 , T 2 , b 1 , and b 2 with the six inflation schemes. The absolute errors of all parameters had different decline degrees for the six schemes except for T 2 from the CCI scheme, in which the absolute error increase rather than decrease. For half of the parameters, such as γ 1 , T 1 , and b 2 , the absolute error based on the N-CCI scheme achieved the greatest reduction. For half of the parameters, such as γ 1 , γ 2 , and b 1 , the absolute errors based on the m-EPES scheme achieved the poorest reductions, whereas the absolute errors based on the CCI scheme achieved the poorest reductions for the other half.
To quantitatively evaluate the impact of each inflation scheme on multiple-parameter estimation, the total absolute error was defined as follows:
A E t = i = 1 6 A E p i A E p i , 0 ,
where A E p i denotes the absolute error between the i-th ( i = 1 , 2 , , 6 ) estimated parameter and its true value, and A E p i , 0 denotes the initial value of A E p i . A E t before estimation was calculated from the parameter value with a biased guess. Thus, the A E t before the estimation was six for each inflation scheme. The A E t after the estimation was calculated from the estimated parameter value. The A E t before and after estimation with the six inflation schemes are shown in Table 6. The A E t based on the N-CCI scheme achieved the largest decline, followed by the FI scheme. The RTPP and RTPS schemes had a relatively lower decay, and the CCI and m-EPES schemes had the lowest decay. The conclusion is the same as that for single-parameter estimation. Therefore, it is can be said that the N-CCI scheme is superior in both single-parameter estimation and multiple-parameter estimation.

4.2.2. Model State and ENSO Prediction

Similar to Section 3, the ability to simulate state variables of the system was examined in this section. Figure 14 shows the RMSEs of the SST, ULD, and T e anomalies during the last 50 years in the Niño3.4 region. For all three state variables, the orders of the RMSEs with the six schemes agreed with the descent orders of A E t after parameter estimation, indicating that the N-CCI scheme also showed state simulation robustness based on multiple-parameter estimation.
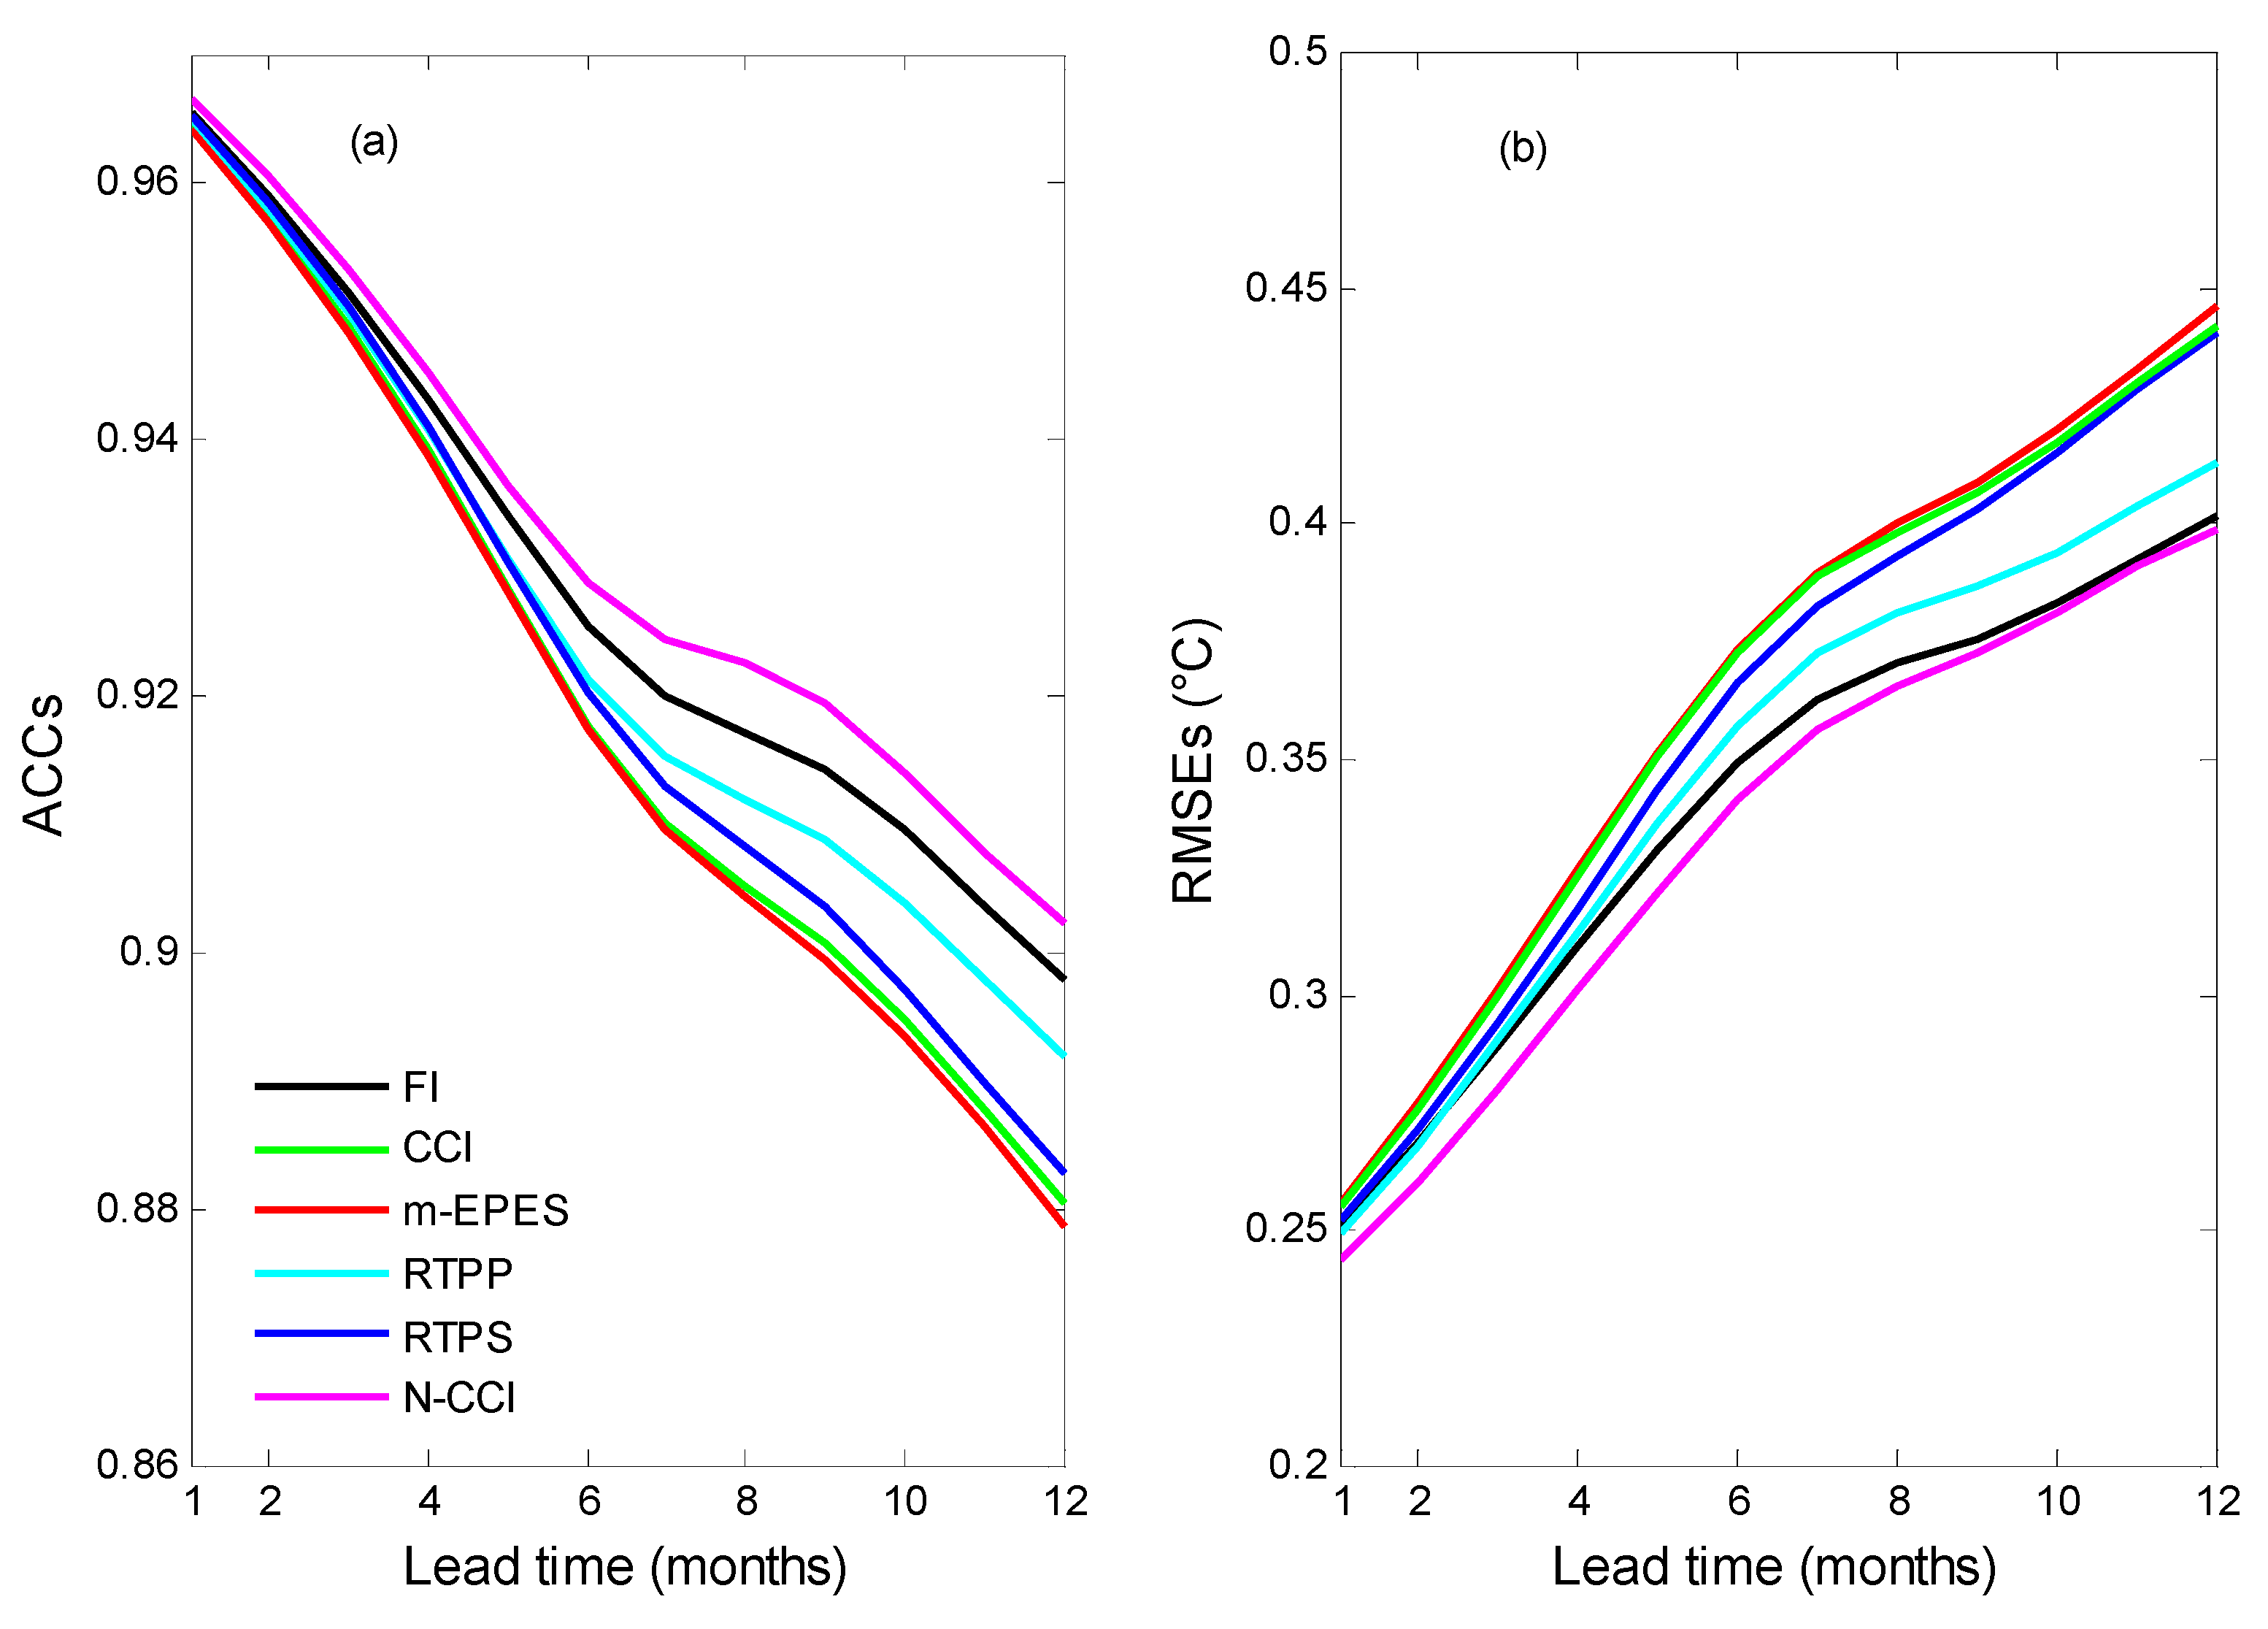
Similar to the prediction experiments in the single-parameter estimation, with the above multiple-parameter estimation averaged over the last 50 years and state simulations recognized as initial ensembles, six prediction experiments were performed to examine the performance of the six schemes regarding the ENSO predictions. The covering period and lasting time of each forecast were the same as those in the single-parameter estimation. The ACCs and RMSEs of the predicted SST anomalies against the true counterparts in the Niño3.4 region are shown in Figure 15. The N-CCI scheme achieved the highest prediction accuracy, followed by the FI scheme. The RTPS and RTPP schemes had relatively poorer accuracies, and the m-EPES and CCI schemes had the poorest accuracies. Similar to the single-parameter estimation in Section 3, better parameters, such as in the N-CCI and FI schemes which produce better state simulations, result in improved predictions; and vice versa.

5. Discussion

ENSO is a widely known short-term climatic phenomenon that can cause climate anomalies on a global scale, and further affect human life and activities in coastal zones [60]. Therefore, its forecast is of great significance for early disaster warning and coastal management. Although ENSO prediction has been greatly improved over the past few decades, there are wide uncertainties in prediction systems. Based on the sources of uncertainties, the limitations of this paper can be clarified as follows:
This study focused on parameter estimation; therefore, no inflation scheme was employed in model state estimation. In fact, there are many other inflation schemes, particularly adaptive schemes, have been successful in atmospheric and ocean sciences [7,61,62,63]. Further studies applying adaptive inflation to data assimilation are required.
This study followed the Zebiak–Cane model, a cornerstone of ENSO predictions [2], and only considered the effects of intrinsic parameters on the uncertainty of ENSO prediction. Many studies have shown that model tendency error from multiple sources, particularly from physical scheme approximations, has an important effect on ENSO prediction [64,65,66]. However, almost relative studies were based on variational and traditional linear statistical methods. Tendency error estimation based on simple ensemble Kalman filters and artificial intelligence methods is necessary for future studies.
Previous studies have shown that external forcing factors, such as westerly wind bursts in the tropical Pacific, are closely related to ENSO [67,68]. However, this study did not take into account external forcing factors, especially atmospheric forcing. Our future work will attempt to employ an appropriate westerly wind burst parameterization scheme and further optimize its uncertain parameters using data assimilation based on the EnKF.
It is universally acknowledged that more than 20 dynamical and statistical models can provide successful ENSO predictions for up to six months [69], with some models providing successful large ENSO event predictions for up to 12 months [70]. Recently, deep learning techniques have been widely applied as a powerful statistical approach in geoscience [71]. Ham et al. (2019) demonstrated that the convolutional neural network model can make skillful ENSO predictions for a lead time of 17 months [72]. This skill is systematically superior to that of almost all dynamic and linear statistical models. Therefore, deep learning is expected to be introduced in future studies.
In addition, the same initial state ensembles were used in all experiments to ensure a fair comparison. Therefore, the experimental results were only determined by the parameter estimation with different inflation schemes. Although each inflation scheme appears somewhat sensitive to its tunable parameters, the comparison was based on the best performance that each scheme can achieve. In this sense, this comparison can elucidate the relative merits of each inflation scheme.

6. Conclusions

Many studies have shown that parameter estimation plays an essential role in reducing model errors. The Kalman filter and its variants are simple and effective techniques for parameter estimation. However, the filter divergence problem, which reduces the accuracy of estimated state–parameter covariance, is often encountered in parameter estimation. To solve this problem, inflation schemes have been proposed. In this study, six currently used inflation schemes were applied to an assimilation system based on the Zebiak–Cane model using LETKF. Then, the impacts of the six schemes on parameter estimation and ENSO prediction were investigated.
Single-parameter estimation and the resultant ENSO prediction were first performed in the OSSE framework. The results showed that the assimilation systems with the six inflation schemes all successfully estimated parameters, including the systems with the relaxation-to-prior perturbation and relaxation-to-prior spread schemes primordially used in state estimation. The new conditional covariance inflation scheme achieved the best results evaluated by the estimated parameters themselves, resultant state analysis and ENSO predictions, followed by the fixed inflation scheme. The relaxation-to-prior spread and relaxation-to-prior perturbation schemes had relatively poorer performances, and the modified estimated parameter ensemble spread and conditional covariance inflation schemes had the poorest performance. The results also suggested that better parameter estimation led to better state simulations, which resulted in the ENSO prediction improvement.
I also examined the performance of the new conditional covariance inflation scheme in multiple-parameter estimation and found that the new conditional covariance inflation scheme showed superiority too. Particularly, the new conditional covariance inflation scheme achieved the greatest reduction of total absolute errors and best resultant state simulations and ENSO predictions. The fixed inflation scheme had a relatively poorer performance, followed by the relaxation-to-prior perturbation and relaxation-to-prior spread schemes, and the modified estimated parameter ensemble spread and conditional covariance inflation schemes had the poorest performance.
Although some studies have been conducted on the applications of inflation schemes, this study systematically compared various inflation schemes for parameter estimation. The results showed that there is a good consistency among parameter estimation, state simulation and ENSO prediction in general, suggesting that better parameter estimation led to better state simulations, which resulted in the ENSO prediction improvement. In general, the new conditional covariance inflation scheme reduced uncertainty of model parameters, and improved ENSO prediction. This study provides viable information for selecting inflation scheme for parameter estimations, offering theoretical guidance for constructing operational assimilation systems.

Funding

This research was jointly funded by the National Natural Science Foundation of China (42227901), the Southern Marine Science and Engineering Guangdong Laboratory (Zhuhai) (Grant no. SML2021SP314), the Scientific Research Fund of the Second Institute of Oceanography, MNR (Grant no. JG1809), and the Innovation Group Project of Southern Marine Science and Engineering Guangdong Laboratory (Zhuhai), (Grant no. 311022006).

Institutional Review Board Statement

Not applicable.

Informed Consent Statement

Not applicable.

Data Availability Statement

This study was conducted using the OSSE framework, so the assimilated data were generated by the model itself. The model code, compilation script, initial and boundary condition files, the namelist settings, and the prediction data are available at the Second Institute of Oceanography, Ministry of Natural Resources.

Acknowledgments

I acknowledge the anonymous reviewers and the editor for their constructive comments and suggestions for improving the manuscript. I want to thank “Tianhe-2 Supercomputer” for providing inclusive computing power during the completion of this paper.

Conflicts of Interest

The author declares no conflict of interest.

References

  1. Zhu, Y.; Zhang, R.-H.; Moum, J.N.; Wang, F.; Li, X.; Li, D. Physics-informed deep-learning parameterization of ocean vertical mixing improves climate simulations. Natl. Sci. Rev. 2022, 9, nwac044. [Google Scholar] [CrossRef]
  2. Chen, D.; Cane, M.A.; Kaplan, A.; Zebiak, S.E.; Huang, D. Predictability of El Niño over the past 148 years. Nature 2004, 428, 733–736. [Google Scholar] [CrossRef]
  3. Zheng, F.; Zhu, J.; Zhang, R.-H. Impact of altimetry data on ENSO ensemble initializations and predictions. Geophys. Res. Lett. 2007, 34, L13611. [Google Scholar] [CrossRef]
  4. O’kane, T.J.; Sandery, P.A.; Monselesan, D.P.; Sakov, P.; Chamberlain, M.A.; Matear, R.J.; Collier, M.A.; Squire, D.T.; Stevens, L. Coupled Data Assimilation and Ensemble Initialization with Application to Multiyear ENSO Prediction. J. Clim. 2019, 32, 997–1024. [Google Scholar] [CrossRef]
  5. Gao, Y.; Liu, T.; Song, X.; Shen, Z.; Tang, Y.; Chen, D. An extension of LDEO5 model for ENSO ensemble predictions. Clim. Dyn. 2020, 55, 2979–2991. [Google Scholar] [CrossRef]
  6. Stainforth, D.A.; Aina, T.; Christensen, C.; Collins, M.; Faull, N.; Frame, D.J.; Kettleborough, J.A.; Knight, S.; Martin, A.; Murphy, J.M.; et al. Uncertainty in predictions of the climate response to rising levels of greenhouse gases. Nature 2005, 433, 403–406. [Google Scholar] [CrossRef]
  7. Zheng, F.; Wang, H.; Zhu, J. ENSO ensemble prediction: Initial error perturbations vs. model error perturbations. Chin. Sci. Bull. 2009, 54, 2516–2523. [Google Scholar] [CrossRef]
  8. Tao, L.-J.; Gao, C.; Zhang, R.-H. Model parameter-related optimal perturbations and their contributions to El Niño prediction errors. Clim. Dyn. 2018, 52, 1425–1441. [Google Scholar] [CrossRef]
  9. Zheng, F.; Zhu, J. Balanced multivariate model errors of an intermediate coupled model for ensemble Kalman filter data assimilation. J. Geophys. Res. Ocean. 2008, 113. [Google Scholar] [CrossRef]
  10. Qi, Q.; Duan, W.; Zheng, F.; Tang, Y. On the “spring predictability barrier” for strong El Niño events as derived from an intermediate coupled model ensemble prediction system. Sci. China Earth Sci. 2017, 60, 1614–1631. [Google Scholar] [CrossRef]
  11. Zhang, S.; Liu, Z.; Rosati, A.; Delworth, T. A study of enhancive parameter correction with coupled data assimilation for climate estimation and prediction using a simple coupled model. Tellus A Dyn. Meteorol. Oceanogr. 2012, 64, 10963. [Google Scholar] [CrossRef]
  12. Mishra, A.K.; Dubey, A.K. Sensitivity of convective parameterization schemes in regional climate model: Precipitation extremes over India. Theor. Appl. Clim. 2021, 146, 293–309. [Google Scholar] [CrossRef]
  13. Baba, Y. Impact of convection scheme on ENSO prediction of SINTEX-F2. Dyn. Atmos. Oceans 2023, 103, 101385. [Google Scholar] [CrossRef]
  14. Park, S.; Bretherton, C.S. The University of Washington Shallow Convection and Moist Turbulence Schemes and Their Impact on Climate Simulations with the Community Atmosphere Model. J. Clim. 2009, 22, 3449–3469. [Google Scholar] [CrossRef]
  15. Song, J.Q.; Cao, X.Q.; Zhang, W.M.; Zhu, X.Q. Estimating parameters for coupled air-sea model with variational method. Acta Phys. Sin. 2012, 61, 110401. (In Chinese) [Google Scholar] [CrossRef]
  16. Wu, X.; Han, G.; Zhang, S.; Liu, Z. A study of the impact of parameter optimization on ENSO predictability with an intermediate coupled model. Clim. Dyn. 2015, 46, 711–727. [Google Scholar] [CrossRef]
  17. Zhao, Y.; Liu, Z.; Zheng, F.; Jin, Y. Parameter Optimization for Real-World ENSO Forecast in an Intermediate Coupled Model. Mon. Weather. Rev. 2019, 147, 1429–1445. [Google Scholar] [CrossRef]
  18. Han, G.-J.; Zhang, X.-F.; Zhang, S.; Wu, X.-R.; Liu, Z. Mitigation of coupled model biases induced by dynamical core misfitting through parameter optimization: Simulation with a simple pycnocline prediction model. Nonlinear Process. Geophys. 2014, 21, 357–366. [Google Scholar] [CrossRef]
  19. Liu, Y.; Liu, Z.; Zhang, S.; Jacob, R.; Lu, F.; Rong, X.; Wu, S. Ensemble-Based Parameter Estimation in a Coupled General Circulation Model. J. Clim. 2014, 27, 7151–7162. [Google Scholar] [CrossRef]
  20. Liu, Y.; Liu, Z.; Zhang, S.; Rong, X.; Jacob, R.; Wu, S.; Lu, F. Ensemble-Based Parameter Estimation in a Coupled GCM Using the Adaptive Spatial Average Method. J. Clim. 2014, 27, 4002–4014. [Google Scholar] [CrossRef]
  21. Li, S.; Zhang, S.; Liu, Z.; Lu, L.; Zhu, J.; Zhang, X.; Wu, X.; Zhao, M.; Vecchi, G.A.; Zhang, R.; et al. Estimating Convection Parameters in the GFDL CM2.1 Model Using Ensemble Data Assimilation. J. Adv. Model. Earth Syst. 2018, 10, 989–1010. [Google Scholar] [CrossRef]
  22. Annan, J.D. Parameter estimation using chaotic time series. Tellus A Dyn. Meteorol. Oceanogr. 2005, 57, 709. [Google Scholar] [CrossRef]
  23. Hu, X.-M.; Zhang, F.; Nielsen-Gammon, J.W. Ensemble-based simultaneous state and parameter estimation for treatment of mesoscale model error: A real-data study. Geophys. Res. Lett. 2010, 37, L08802. [Google Scholar] [CrossRef]
  24. Ito, K.; Ishikawa, Y.; Awaji, T. Specifying Air-Sea Exchange Coefficients in the High-Wind Regime of a Mature Tropical Cyclone by an Adjoint Data Assimilation Method. SOLA 2010, 6, 13–16. [Google Scholar] [CrossRef]
  25. Peng, S.; Li, Y.; Xie, L. Adjusting the Wind Stress Drag Coefficient in Storm Surge Forecasting Using an Adjoint Technique. J. Atmos. Ocean. Technol. 2013, 30, 590–608. [Google Scholar] [CrossRef]
  26. Gao, Y.; Cao, A.; Chen, H.; Lv, X. Estimation of Bottom Friction Coefficients Based on an Isopycnic-Coordinate Internal Tidal Model with Adjoint Method. Math. Probl. Eng. 2013, 2013, 1–11. [Google Scholar] [CrossRef]
  27. Han, G.; Wu, X.; Zhang, S.; Liu, Z.; Navon, I.M.; Li, W. A Study of Coupling Parameter Estimation Implemented by 4D-Var and EnKF with a Simple Coupled System. Adv. Meteorol. 2015, 2015, 1–16. [Google Scholar] [CrossRef]
  28. Kang, J.-S.; Kalnay, E.; Miyoshi, T.; Liu, J.; Fung, I. Estimation of surface carbon fluxes with an advanced data assimilation methodology. J. Geophys. Res. Atmos. 2012, 117, D24101. [Google Scholar] [CrossRef]
  29. Wu, X.; Zhang, S.; Liu, Z.; Rosati, A.; Delworth, T.L.; Liu, Y. Impact of Geographic-Dependent Parameter Optimization on Climate Estimation and Prediction: Simulation with an Intermediate Coupled Model. Mon. Weather. Rev. 2012, 140, 3956–3971. [Google Scholar] [CrossRef]
  30. Wu, X.; Zhang, S.; Liu, Z.; Rosati, A.; Delworth, T.L. A study of impact of the geographic dependence of observing system on parameter estimation with an intermediate coupled model. Clim. Dyn. 2012, 40, 1789–1798. [Google Scholar] [CrossRef]
  31. Ueno, G.; Higuchi, T.; Kagimoto, T.; Hirose, N. Prediction of ocean state by data assimilation with the ensemble Kalman filter. In SCIS & ISIS SCIS & ISIS; Japan Society for Fuzzy Theory and Intelligent Informatics: Fukuoka, Japan, 2006; pp. 1884–1889. [Google Scholar] [CrossRef]
  32. Dwivedi, S.; Srivastava, A.; Mishra, A.K. Upper Ocean Four-Dimensional Variational Data Assimilation in the Arabian Sea and Bay of Bengal. Mar. Geodesy 2017, 41, 230–257. [Google Scholar] [CrossRef]
  33. Zhang, X.; Zhang, S.; Liu, Z.; Wu, X.; Han, G. Correction of biased climate simulated by biased physics through parameter estimation in an intermediate coupled model. Clim. Dyn. 2015, 47, 1899–1912. [Google Scholar] [CrossRef]
  34. Anderson, J.L.; Anderson, S.L. A Monte Carlo implementation of the nonlinear filtering problem to produce ensemble assimilations and forecasts. Mon. Weather. Rev. 1999, 127, 2741–2758. [Google Scholar] [CrossRef]
  35. Aksoy, A.; Zhang, F.; Nielsen-Gammon, J.W. Ensemble-Based Simultaneous State and Parameter Estimation in a Two-Dimensional Sea-Breeze Model. Mon. Weather. Rev. 2006, 134, 2951–2970. [Google Scholar] [CrossRef]
  36. Hutt, A. Divergence of the Ensemble Transform Kalman Filter (LETKF) by Nonlocal Observations. Front. Appl. Math. Stat. 2020, 6, hal-02861799. [Google Scholar] [CrossRef]
  37. Zhang, S. Coupled data assimilation and parameter estimation in coupled ocean–atmosphere models: A review. Clim. Dyn. 2020, 54, 5127–5144. [Google Scholar] [CrossRef]
  38. Gao, Y.; Tang, Y.; Song, X.; Shen, Z. Parameter Estimation Based on a Local Ensemble Transform Kalman Filter Applied to El Niño–Southern Oscillation Ensemble Prediction. Remote. Sens. 2021, 13, 3923. [Google Scholar] [CrossRef]
  39. Ruiz, J.J.; Pulido, M.; Miyoshi, T. Estimating Model Parameters with Ensemble-Based Data Assimilation: Parameter Covariance Treatment. J. Meteorol. Soc. Jpn. Ser. II 2013, 91, 453–469. [Google Scholar] [CrossRef]
  40. Molteni, F. Atmospheric simulations using a GCM with simplified physical parametrizations. I: Model climatology and variability in multi-decadal experiments. Clim. Dyn. 2003, 20, 175–191. [Google Scholar] [CrossRef]
  41. Zhang, F.; Snyder, C.; Sun, J. Impacts of Initial Estimate and Observation Availability on Convective-Scale Data Assimilation with an Ensemble Kalman Filter. Mon. Weather Rev. 2004, 132, 1238–1253. [Google Scholar] [CrossRef]
  42. Whitaker, J.S.; Hamill, T.M. Evaluating Methods to Account for System Errors in Ensemble Data Assimilation. Mon. Weather. Rev. 2012, 140, 3078–3089. [Google Scholar] [CrossRef]
  43. Gill, A.E. Some simple solutions for heat-induced tropical circulation. Q. J. R. Meteorol. Soc. 1980, 106, 447–462. [Google Scholar] [CrossRef]
  44. Zebiak, S.E.; Cane, M.A. A model El Niño-Southern oscillation. Mon. Wea. Rev. 1987, 115, 2262–2278. [Google Scholar] [CrossRef]
  45. Hunt, B.R.; Kostelich, E.J.; Szunyogh, I. Efficient data assimilation for spatiotemporal chaos: A local ensemble transform Kalman filter. Phys. D Nonlinear Phenom. 2007, 230, 112–126. [Google Scholar] [CrossRef]
  46. Kang, J.S. Carbon Cycle Data Assimilation Using a Coupled Atmosphere Vegetation Model and the Local Ensemble Transform Kalman filter. Ph.D. Thesis, University of Maryland, Washington, DC, USA, 2009. [Google Scholar]
  47. Kang, J.-S.; Kalnay, E.; Liu, J.; Fung, I.; Miyoshi, T.; Ide, K. “Variable localization” in an ensemble Kalman filter: Application to the carbon cycle data assimilation. J. Geophys. Res. Atmos. 2011, 116, D09110. [Google Scholar] [CrossRef]
  48. Ruiz, J.J.; Pulido, M.; Miyoshi, T. Estimating Model Parameters with Ensemble-Based Data Assimilation: A Review. J. Meteorol. Soc. Jpn. Ser. II 2013, 91, 79–99. [Google Scholar] [CrossRef]
  49. Duc, L.; Saito, K.; Hotta, D. Analysis and design of covariance inflation methods using inflation functions. Part 1: Theoretical framework. Q. J. R. Meteorol. Soc. 2020, 146, 3638–3660. [Google Scholar] [CrossRef]
  50. Anderson, J.L. An ensemble adjustment Kalman filter for data assimilation. Mon. Wea. Rev. 2001, 129, 2884–2903. [Google Scholar] [CrossRef]
  51. Luo, X.; Hoteit, I. Ensemble Kalman Filtering with a Divided State-Space Strategy for Coupled Data Assimilation Problems. Mon. Weather. Rev. 2014, 142, 4542–4558. [Google Scholar] [CrossRef]
  52. Tong, M.; Xue, M. Simultaneous Estimation of Microphysical Parameters and Atmospheric State with Simulated Radar Data and Ensemble Square Root Kalman Filter. Part I: Sensitivity Analysis and Parameter Identifiability. Mon. Weather. Rev. 2008, 136, 1630–1648. [Google Scholar] [CrossRef]
  53. Tong, M.; Xue, M. Simultaneous Estimation of Microphysical Parameters and Atmospheric State with Simulated Radar Data and Ensemble Square Root Kalman Filter. Part II: Parameter Estimation Experiments. Mon. Weather. Rev. 2008, 136, 1649–1668. [Google Scholar] [CrossRef]
  54. Aksoy, A.; Zhang, F.; Nielsen-Gammon, J.W. Ensemble-based simultaneous state and parameter estimation with MM5. Geophys. Res. Lett. 2006, 33, L12801. [Google Scholar] [CrossRef]
  55. Schwartz, C.S.; Liu, Z. Convection-Permitting Forecasts Initialized with Continuously Cycling Limited-Area 3DVAR, Ensemble Kalman Filter, and “Hybrid” Variational–Ensemble Data Assimilation Systems. Mon. Weather. Rev. 2014, 142, 716–738. [Google Scholar] [CrossRef]
  56. Moore, A.; Zavala-Garay, J.; Arango, H.G.; Edwards, C.A.; Anderson, J.; Hoar, T. Regional and basin scale applications of ensemble adjustment Kalman filter and 4D-Var ocean data assimilation systems. Prog. Oceanogr. 2020, 189, 102450. [Google Scholar] [CrossRef]
  57. Gaspari, G.; Cohn, S.E. Construction of correlation functions in two and three dimensions. Q. J. R. Meteorol. Soc. 1999, 125, 723–757. [Google Scholar] [CrossRef]
  58. Shukla, J. Predictability in the Midst of Chaos: A Scientific Basis for Climate Forecasting. Science 1998, 282, 728–731. [Google Scholar] [CrossRef] [PubMed]
  59. Peng, P.; Kumar, A.; Wang, W. An analysis of seasonal predictability in coupled model forecasts. Clim. Dyn. 2009, 36, 637–648. [Google Scholar] [CrossRef]
  60. Almar, R.; Boucharel, J.; Graffin, M.; Abessolo, G.O.; Thoumyre, G.; Papa, F.; Ranasinghe, R.; Montano, J.; Bergsma, E.W.J.; Baba, M.W.; et al. Influence of El Niño on the variability of global shoreline position. Nat. Commun. 2023, 14, 1–13. [Google Scholar] [CrossRef]
  61. El Gharamti, M. Enhanced Adaptive Inflation Algorithm for Ensemble Filters. Mon. Weather. Rev. 2018, 146, 623–640. [Google Scholar] [CrossRef]
  62. Shen, Z.; Tang, Y.; Li, X.; Gao, Y. On the Localization in Strongly Coupled Ensemble Data Assimilation Using a Two-Scale Lorenz Model. Earth Space Sci. 2021, 8, e2020EA001465. [Google Scholar] [CrossRef]
  63. Miyoshi, T. The Gaussian Approach to Adaptive Covariance Inflation and Its Implementation with the Local Ensemble Transform Kalman Filter. Mon. Weather Rev. 2011, 139, 1519–1535. [Google Scholar] [CrossRef]
  64. Tao, L.; Duan, W.; Vannitsem, S. Improving forecasts of El Niño diversity: A nonlinear forcing singular vector approach. Clim. Dyn. 2020, 55, 739–754. [Google Scholar] [CrossRef]
  65. Tao, L.; Duan, W.; Jiang, L. Model errors of an intermediate model and their effects on realistic predictions of El Niño diversity. Int. J. Clim. 2022, 42, 7443–7464. [Google Scholar] [CrossRef]
  66. Gao, Y.; Tang, Y.; Liu, T. Reducing Model Error Effects in El Niño–Southern Oscillation Prediction Using Ensemble Coupled Data Assimilation. Remote. Sens. 2023, 15, 762. [Google Scholar] [CrossRef]
  67. Chen, D.; Lian, T.; Fu, C.; Cane, M.A.; Tang, Y.; Murtugudde, R.; Song, X.; Wu, Q.; Zhou, L. Strong influence of westerly wind bursts on El Niño diversity. Nat. Geosci. 2015, 8, 339–345. [Google Scholar] [CrossRef]
  68. Lu, F.; Liu, Z.; Liu, Y.; Zhang, S.; Jacob, R. Understanding the control of extratropical atmospheric variability on ENSO using a coupled data assimilation approach. Clim. Dyn. 2016, 48, 3139–3160. [Google Scholar] [CrossRef]
  69. Zhou, L.; Zhang, R.-H. A Hybrid Neural Network Model for ENSO Prediction in Combination with Principal Oscillation Pattern Analyses. Adv. Atmospheric Sci. 2022, 39, 889–902. [Google Scholar] [CrossRef]
  70. L’Heureux, M.L.; Levine, A.F.Z.; Newman, M.; Ganter, C.; Luo, J.; Tippett, M.K.; Stockdale, T.N. ENSO Prediction. AGU 2020, 10, 227–246. [Google Scholar] [CrossRef]
  71. Reichstein, M.; Camps-Valls, G.; Stevens, B.; Jung, M.; Denzler, J.; Carvalhais, N.; Prabhat, F. Deep learning and process understanding for data-driven Earth system science. Nature 2019, 566, 195–204. [Google Scholar] [CrossRef]
  72. Ham, Y.-G.; Kim, J.-H.; Luo, J.-J. Deep learning for multi-year ENSO forecasts. Nature 2019, 573, 568–572. [Google Scholar] [CrossRef]
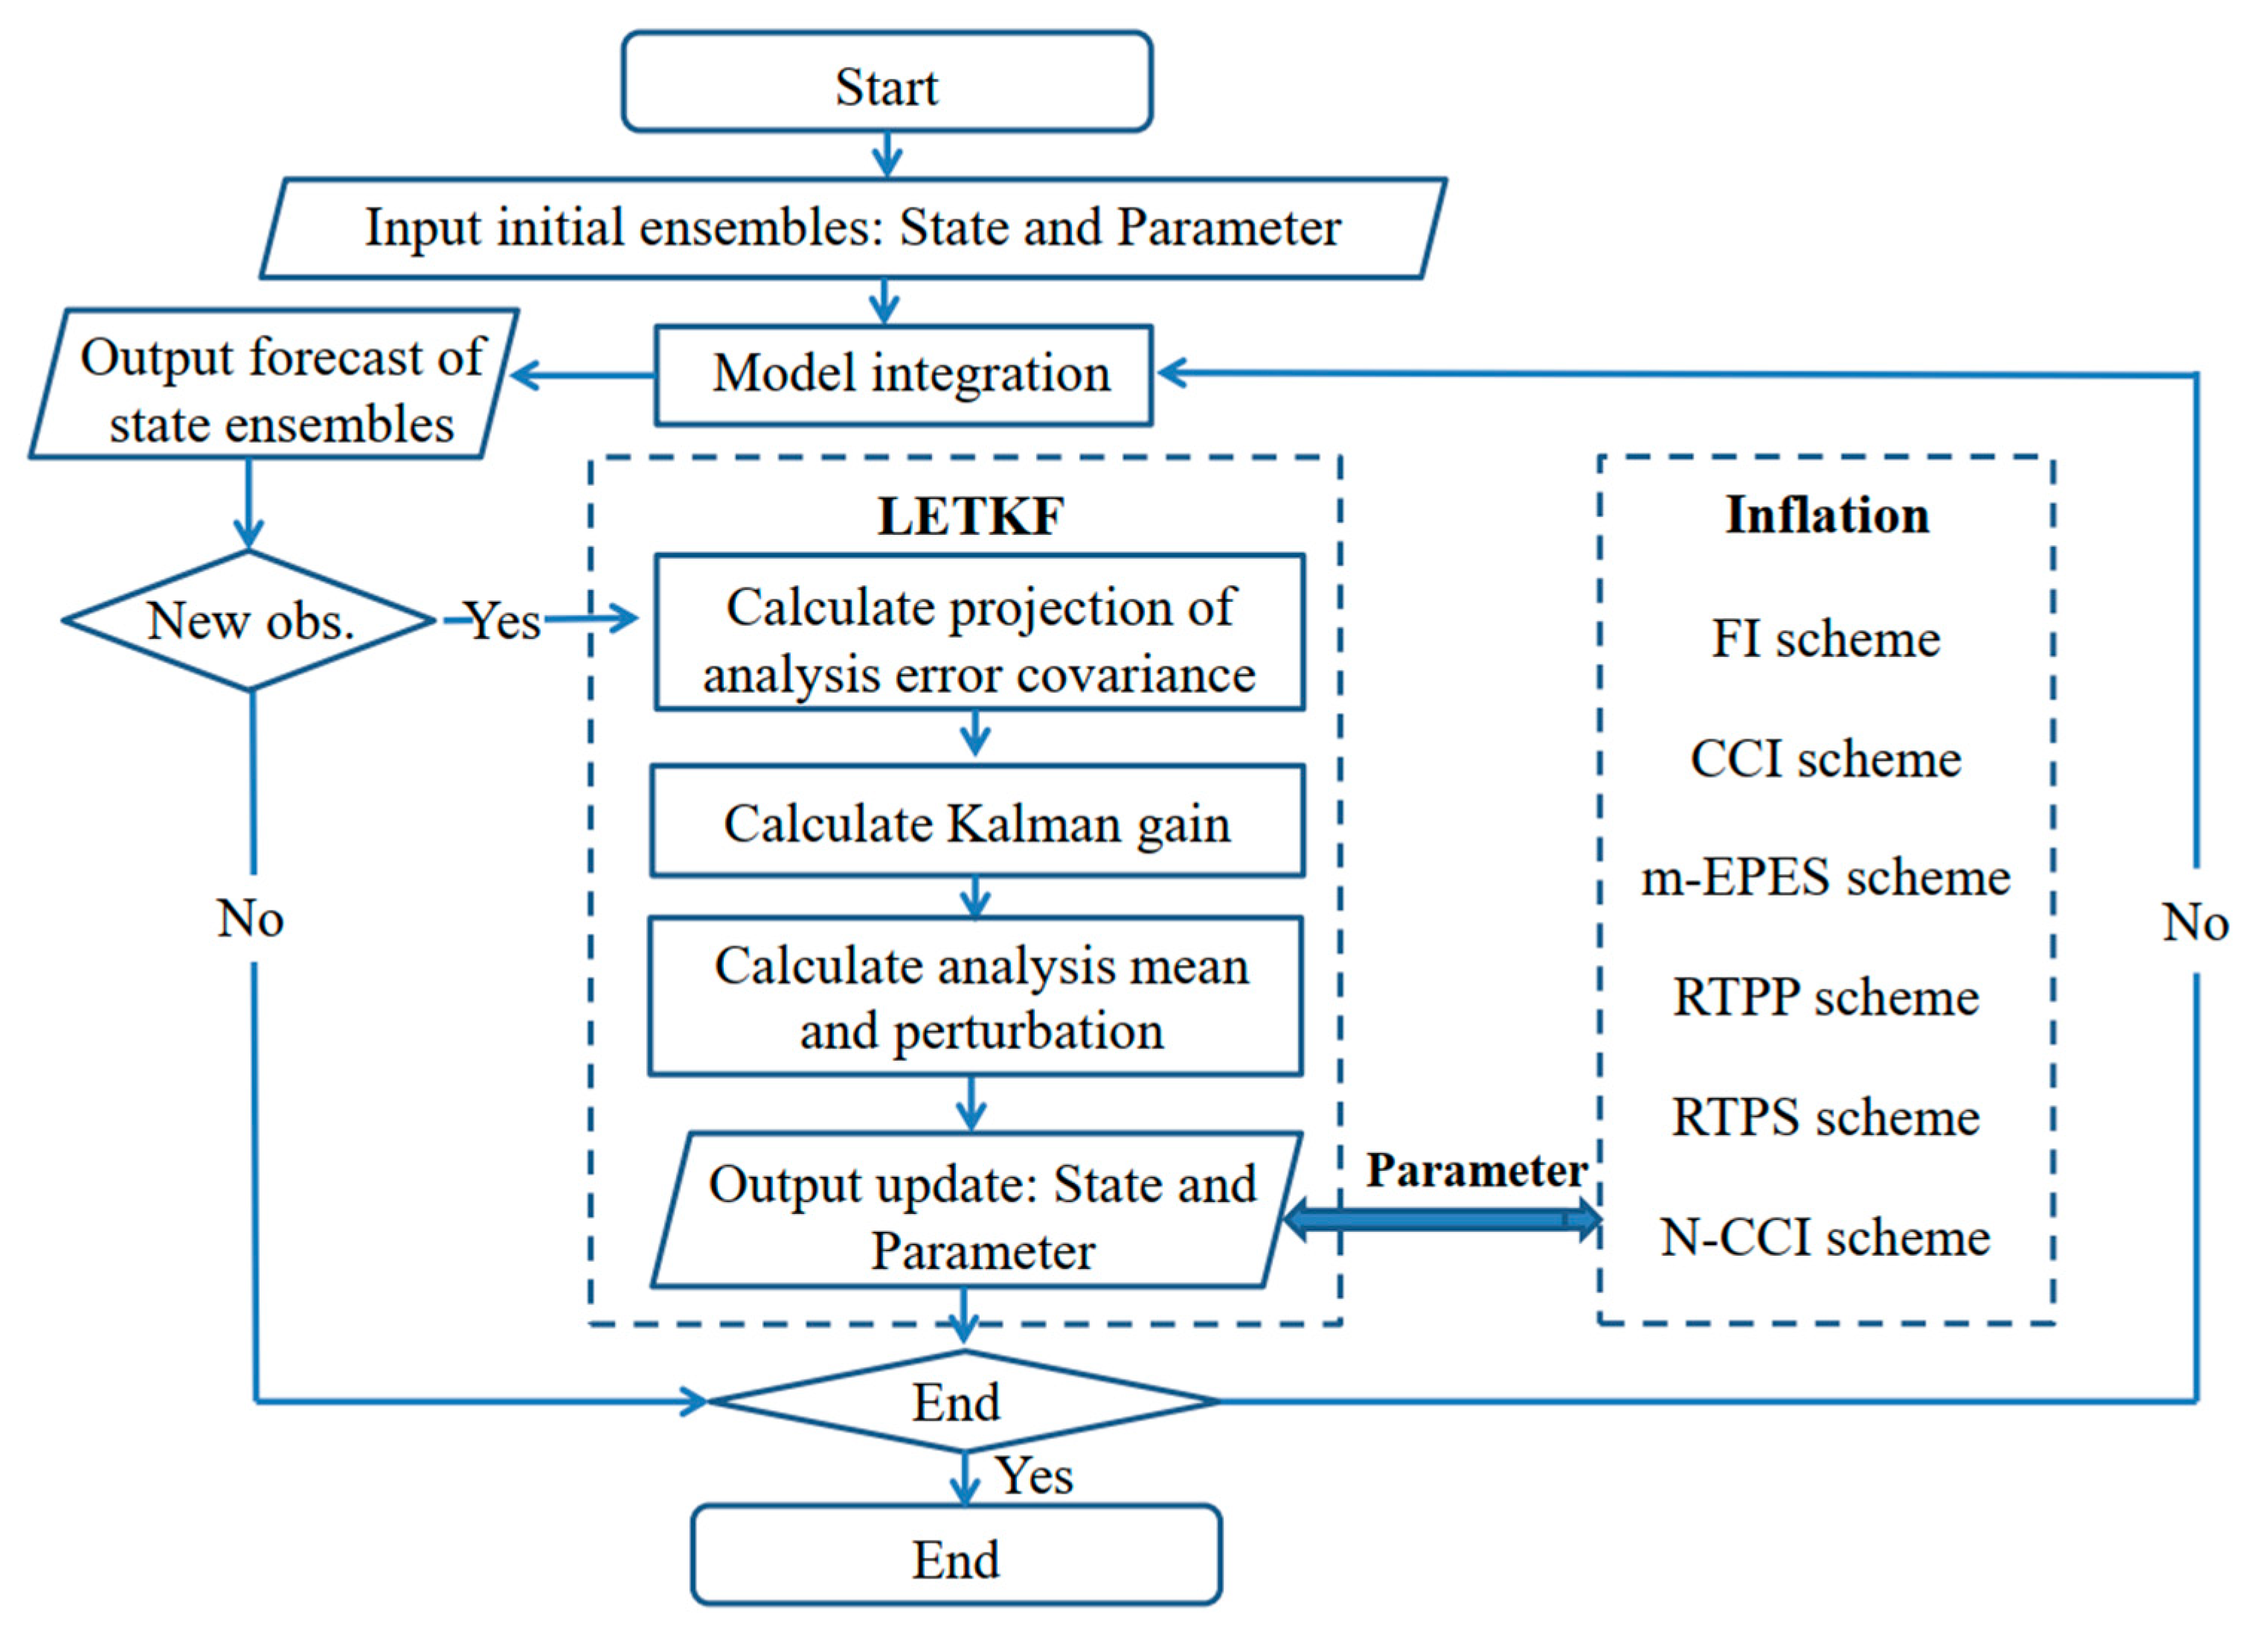
Figure 1. Flowchart of parameter estimation based on LETKF.
Jmse 11 02003 g001
Figure 2. Temporal evolution of the estimated γ 1 with the assimilation based on the FI scheme: (ae) represent experiments 1–5, respectively. The dotted lines are the truths of γ 1 in Table 1.
Jmse 11 02003 g002
Figure 3. Temporal evolution of the estimated γ 1 with the assimilation based on the FI scheme: (ad) represent initial guess bias for 5%, 10%, 15%, and 20%, respectively. The dotted lines are the truths of γ 1 in Table 1.
Jmse 11 02003 g003
Figure 4. Temporal evolution of ensemble spreads of the prior and posterior SST anomaly and RMSEs for the prior and posterior mean based on the FI scheme.
Jmse 11 02003 g004
Figure 5. Temporal evolution of the estimated γ 1 with the assimilation length. (af) represent the estimated results of FI, CCI, m-EPES, RTPP, RTPS, and N-CCI schemes, respectively. The bold solid lines indicate the ensemble means of the six inflation schemes, and the dashed lines are the truths. The dotted lines are the truths of γ 1 in Table 1.
Jmse 11 02003 g005
Figure 6. (a) Temporal evolution of the ensemble spread of γ 1 with the six schemes. (b) As in (a) but for the y-axis of 0–0.015 (remove the large spread values).
Jmse 11 02003 g006
Figure 7. The absolute errors (aEs) of the six estimated single parameters ((a) γ 1 , (b) γ 2 , (c) T 1 , (d) T 2 , (e) b 1 , and (f) b 2 ) with the six schemes over the last 50 years.
Jmse 11 02003 g007
Figure 8. (a) El Niño and (b) La Niña composite of the true values, (c) El Niño and (d) La Niña composite of state estimation only, and (e) El Niño and (f) La Niña composite of a single-parameter estimation. The colors represent the SST anomalies, and the unit is °C.
Jmse 11 02003 g008
Figure 9. RMSEs of the (a) SST anomalies, (b) ULD anomalies, and (c) T e anomalies in the Niño3.4 region for a single-parameter estimation, respectively.
Jmse 11 02003 g009
Figure 10. The diagram of prediction experiment.
Jmse 11 02003 g010
Figure 11. The (a) ACCs and (b) RMSEs of the predicted SST anomalies against the true counterparts in Niño3.4 region during the period of the last 50 years for single-parameter estimation.
Jmse 11 02003 g011
Figure 12. The signal to noise ratios for single-parameter estimation with the six schemes.
Jmse 11 02003 g012
Figure 13. Temporal variation in the AEs of the six parameters for multiple-parameter estimation. (af) represent the estimated results of γ 1 , γ 2 , T 1 , T 2 , b 1 , and b 2 , respectively.
Jmse 11 02003 g013
Figure 14. The same as Figure 9 but for multiple-parameter estimation. (ac) represent the RMSEs of the SST anomalies, ULD anomalies, and T e anomalies in the Niño3.4 region, respectively.
Jmse 11 02003 g014
Figure 15. The same as Figure 11 but for multiple-parameter estimation. (a,b) represent the ACC and RMSEs of the predicted SST anomalies against the true counterparts in Niño3.4 region, respectively.
Jmse 11 02003 g015
Table 1. List of parameters (Pars.) and their physical meanings, truths and ensemble mean biased guesses for the ensemble mean in the Zebiak–Cane model.
Pars.Physical MeaningsTruthsBiased Guess
γ 1 Strength of mean upwelling advection term0.750.6
γ 2 Strength of anomalous upwelling advection term0.750.6
T 1 Amplitude of subsurface temperature anomaly + h perturbations2822.4
T 2 Amplitude of subsurface temperature anomaly for − h perturbations−40−48
b 1 Affect the nonlinearity of subsurface temperature anomaly for + h perturbations1.251.0
b 2 Affect the nonlinearity of subsurface temperature anomaly for − h perturbations3.02.4
Table 2. Six inflation schemes, their factors/thresholds, and the convergence times in single-parameter estimation (SPE) in this study. The unit of convergence time is the month. MPE represents multiple-parameter estimation. The second row for a given algorithm (in parentheses) is the range of factors/thresholds tested. In the CCI and N-CCI schemes in MPE, the factors/thresholds correspond to six parameters, and their tested range values are quite complex and hence were omitted.
Algorithms Schemes Factors/Thresholds in SPEConvergence Times in SPEFactors/Thresholds in MPE
1FI μ = 1.002
( μ [ 1.0005~1.2])
284 μ = 1.0005
( μ [ 1.0005~1.2])
2CCI a = 0.01
( a [ 0.001~0.1])
355 a = 0.012, 0.016, 0.45,
1.95, 0.02, 0.07
(omitted)
3m-EPES λ = 0.95
( λ [ 0.8~1.2])
70 λ = 0.98
( λ [ 0.8~1.2])
4RTPP α = 0.4
( α [ 0.1~1.2])
288 α = 0.45
( α [ 0.1~1.2])
5RTPS α = 0.6
( α [ 0.1~1.2])
434 α = 0.2
( α [ 0.1~1.2])
6N-CCI a , b = [ 0.03 , 0.20 ]
( a 0.001 ~ 0.1 , b [ 0.08~0.4])
168 [ a , b ] = [ 0.021 , 0.20 ], [ 0.019 , 0.20 ], [ 0.64 , 6.75 ], [ 0.97 , 14.4 ], [ 0.01 , 0.30 ], [ 0.03 , 0.72 ]
(omitted)
Table 3. Sensitivity experiments settings and their convergence times with the FI scheme.
Experiments12345
μ 1.00051.0021.0051.101.20
Convergence time3492845731162/
Table 4. The experimental designs. SPE, MPE, and SE represent single-parameter estimation, multiple-parameter estimation, and state estimation only, respectively.
ExperimentsAssimilated DataTo Be Estimated
SPESST anomaliesSST anomalies and γ 1 , γ 2 , T 1 , T 2 , b 1 , or b 2
MPESST anomaliesSST anomalies, γ 1 , γ 2 , T 1 , T 2 , b 1 , and b 2
SESST anomaliesSST anomalies
Table 5. Values of γ 1 in the six prediction experiments.
ExperimentsFICCIm-EPESRTPPRTPSN-CCI
γ10.74010.72030.70210.76280.75600.7526
Table 6. A E t before (first row) and after (second row) the estimation and the descent (third row) for multiple-parameter estimation with the six inflation schemes.
A E t FICCIm-EPESRTPPRTPSN-CCI
Before666666
After0.84272.78132.87751.17551.55840.6913
Decay (%)85.9653.6452.0480.4174.0388.48
Disclaimer/Publisher’s Note: The statements, opinions and data contained in all publications are solely those of the individual author(s) and contributor(s) and not of MDPI and/or the editor(s). MDPI and/or the editor(s) disclaim responsibility for any injury to people or property resulting from any ideas, methods, instructions or products referred to in the content.