1. Introduction
Ships and marine engineering equipment are the main means and carriers for human beings to carry out maritime transportation activities and to develop, utilize, and protect marine resources [
1]. Influenced by the complex environment, high load, and continuous operation, ships and marine engineering equipment are characterized by the high risk of failure, high difficulty in assessment, and high maintenance and management requirements; their safety and reliability directly affect the normal operation of machinery and equipment, as well as the safety of the staff. Therefore, timely or real-time health assessment, condition warning, fault diagnosis, and maintenance, as appropriate, of marine engineering equipment is essential. As the “blood” of ships and marine engineering equipment, oil has the role of transferring energy, reducing friction between components, lowering system temperature, slowing down the oxidation of component surfaces, and reducing equipment vibration. The pollutants in the oil carry rich information about the operating status of the equipment, and this has obvious advantages in technology and prospects through the high-precision and rapid differentiation in the detection of pollutants in the oil, thus realizing the intelligent operation and maintenance of ships and marine engineering equipment and comprehensively improving their reliability [
2,
3,
4].
Oil contaminants mainly include solid particles, water, and air bubbles [
5,
6,
7]. These contaminants are metal wear particles generated by the friction of mechanical parts, and water and air bubbles generated by the poor sealing of equipment. These contaminants in the oil deteriorate the oil and cause machinery and equipment to malfunction or even stop working [
8,
9,
10]. In recent years, a variety of oil detecting and analyzing techniques have been developed, mainly divided into online and offline detecting. A variety of methods have been derived based on the online or offline detection of oil, which can be categorized into optical, acoustic, magnetic, and electrical methods according to the detection principle [
11,
12]. The principles, advantages, and disadvantages of various detection methods are shown in
Table 1.
Through
Table 1, it can be seen that each method of oil detection and analysis has its own limitations and limited scope of application, so practical applications often use a variety of technologies in a joint approach to obtain as much information as possible about the physical and chemical properties of the oil. In the above methods, inductive and capacitive methods are widely used in oil detection due to their simple structure and low cost [
20,
21,
22,
23]. Our team has developed a series of micro inductive oil sensors based on microfluidic chips, which can realize the differentiated detection of multiple contaminants in oil fluids. Such micro inductive oil sensors not only enable particle counting of oil contaminants, but are also small in size and feature high analytical accuracy, easy integration, and automation, which can help to develop portable and online monitoring devices for real-time monitoring of oil condition. SHI designed a capacitive sensor to recognize air bubbles of 110 μm in oil [
24]. Zeng invented a parallel plate capacitor with double coils and successfully recognized water and air in oil [
25]. The detection efficiency of this sensor is low and it is unable to distinguish metallic contaminants in the oil fluid. The inductive method can distinguish metallic contaminants in the oil fluid. Common inductive sensors are triple-coil type [
26,
27], double-coil type [
28,
29] and single-coil type [
30,
31]. However, if these sensors have higher detection accuracy, they are difficult to process and are unable to distinguish between water and air in the oil.
In order to improve the detection throughput and range of the sensor, we designed an oil detection sensor containing multiple detection channels, multiple detection units, and two detection modes that realizes the differentiated detection of multi-pollutants such as metal particles, water and air.
2. Materials and Methods
2.1. Production Materials of the Sensor
Figure 1 depicts the overall configuration of the sensor. The components of the sensor mainly include: three-way tubes (1 and 2), capillary glass tubes (3, 4 and 5), oil reservoir (6), PMMA (7), slide (8), detection units of inductive mode (I and II), and detection units of capacitive mode (III and IV). The specific dimensions of each component are shown in
Figure 1b. The structural parameters of the detection unit for different detection modes are shown in
Table 2.
Since the detection channel of the conventional oil detection sensor is a single channel with an inner diameter of 300 μm, the cross-sectional area of the channel is only 0.0225π mm
2. However, the paper designed a sensor that incorporates several detection channels. The cross-sectional area of the channel can be calculated as 0.2475π mm
2 by the inner diameter size of each detection channel in
Figure 1b. Under the same experimental conditions, the volume of flow increases to 11 times greater than the conventional sensor, which greatly improves the detection efficiency.
2.2. Production Methods of the Sensors
The sensor was produced as follows: first, three-way tube-1 (1) and three-way tube-2 (2) with adhesive were arranged on the slide (8) with PMMA (7) underneath each three-way tube as shown in
Figure 1a. Then, detection unit III was fixed on a short capillary (3), and the ends of 3 were connected to 1 and 2, respectively, and sealed with glue. Next, detection unit IV was fixed on a long capillary (4), and the other long capillary (4) passed through the center hole of detection unit II, and the two long capillaries were connected to the remaining two outlets of 2 and sealed. The other ends of each of the two long capillaries were padded with PMMA underneath. Then coarse capillary (5) was passed through the center hole of detection unit I and one end of coarse capillary was connected to 1 and sealed, and the other end was padded with PMMA underneath. Finally, the three oil reservoirs (6) were arranged in the position shown in
Figure 1a.
3. Results
3.1. Detection Principle
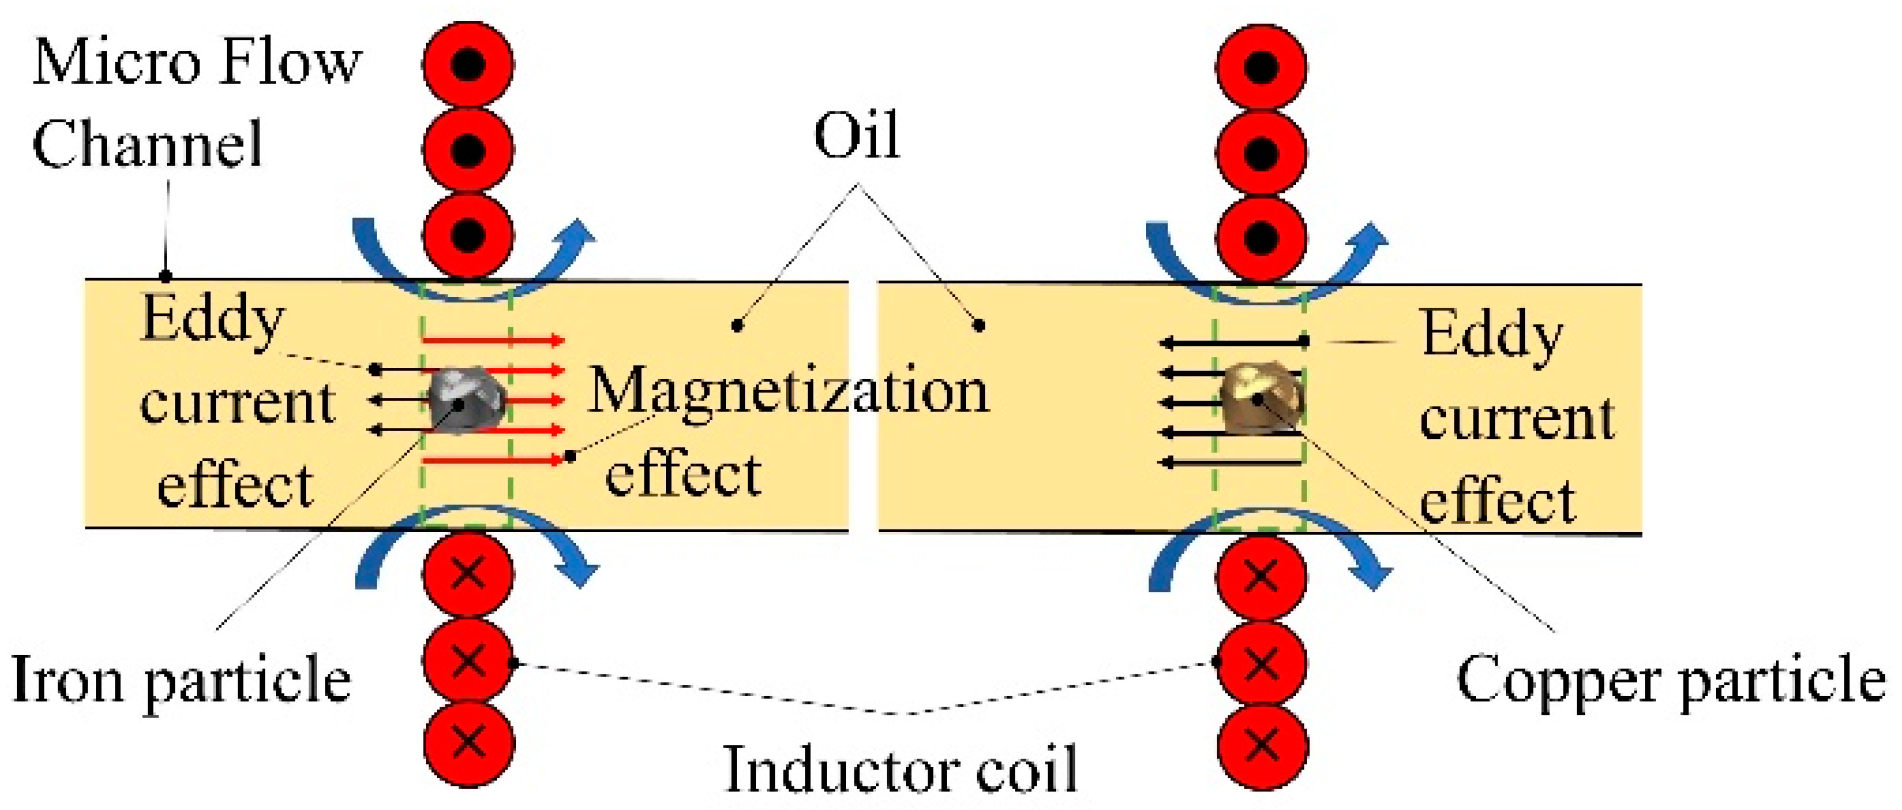
3.1.1. Principle of Inductive Mode Detection
There are two detection units, I and II, in the inductive mode of the sensor. The solenoid type takes up a lot of space but has a more evenly distributed magnetic field, while the planar type takes up less space but has a stronger local magnetic field.
Figure 2 illustrates the principle of inductive mode detection. When AC voltage is applied to the detection units, if ferromagnetic particles in the fluid pass by, the magnetic effect of magnetization causes the apparent inductance of the detection unit to increase, which is greater than the effect of eddy currents. On the other hand, if non-ferromagnetic particles pass by, the apparent inductance of the detection unit only decreases due to the effect of eddy currents.
An earlier study [
24] indicates that the metal particles passing through the coil result in a change in inductance.
where
is the peak value of impedance change caused by metal particles passing through the planar inductor coil,
is the frequency of alternating current,
is the permeability of the vacuum,
w is the thickness of the single-layer planar coil,
is the magnetization factor, and
is the function of the geometrical characteristics of the coil and the position of the particles.
3.1.2. Principle of Capacitive Mode Detection
The sensor’s water droplet and bubble detection units are based on the capacitance modes III and IV. The unit III occupies a small space but the local electric field is strong, and the unit IV occupies a large space but the local electric field is uniformly distributed.
Figure 3 illustrates the principle of capacitance mode detection. The capacitance of a capacitor is solely influenced by the dielectric constant of non-metallic particles when determining the configuration of the capacitor. Due to the significant variation in the dielectric constant of oil, water, and air, capacitive mode can distinguish and detect them.
The previous study [
30] states that the capacitance change caused by a particle passing through an ideal capacitor is
where
is the capacitance change caused by particles passing through an ideal capacitor,
is the complex capacitance of the capacitance sensor,
is the capacitance when no particles pass through the capacitive sensor,
is the equivalent complex permittivity of a mixed solution of oil and particles,
is the complex permittivity of oil,
is the area of the parallel capacitor plates,
is the distance between the two plates, and
is the complex impedance change of the capacitor caused by the particles.
In the case of the capacitor structure parameters being determined, the change in capacitance depends entirely on the change in the dielectric constant of the medium. When the dielectric constant of the oil and particle mixture is greater than that of the oil , the change of capacitance is positive, and the reverse is negative. It is possible to differentiate between the detection of water droplets and air bubbles in the oil based on the direction in which the capacitance changes.
3.2. Pre-Experiment Preparation
3.2.1. Experimental System
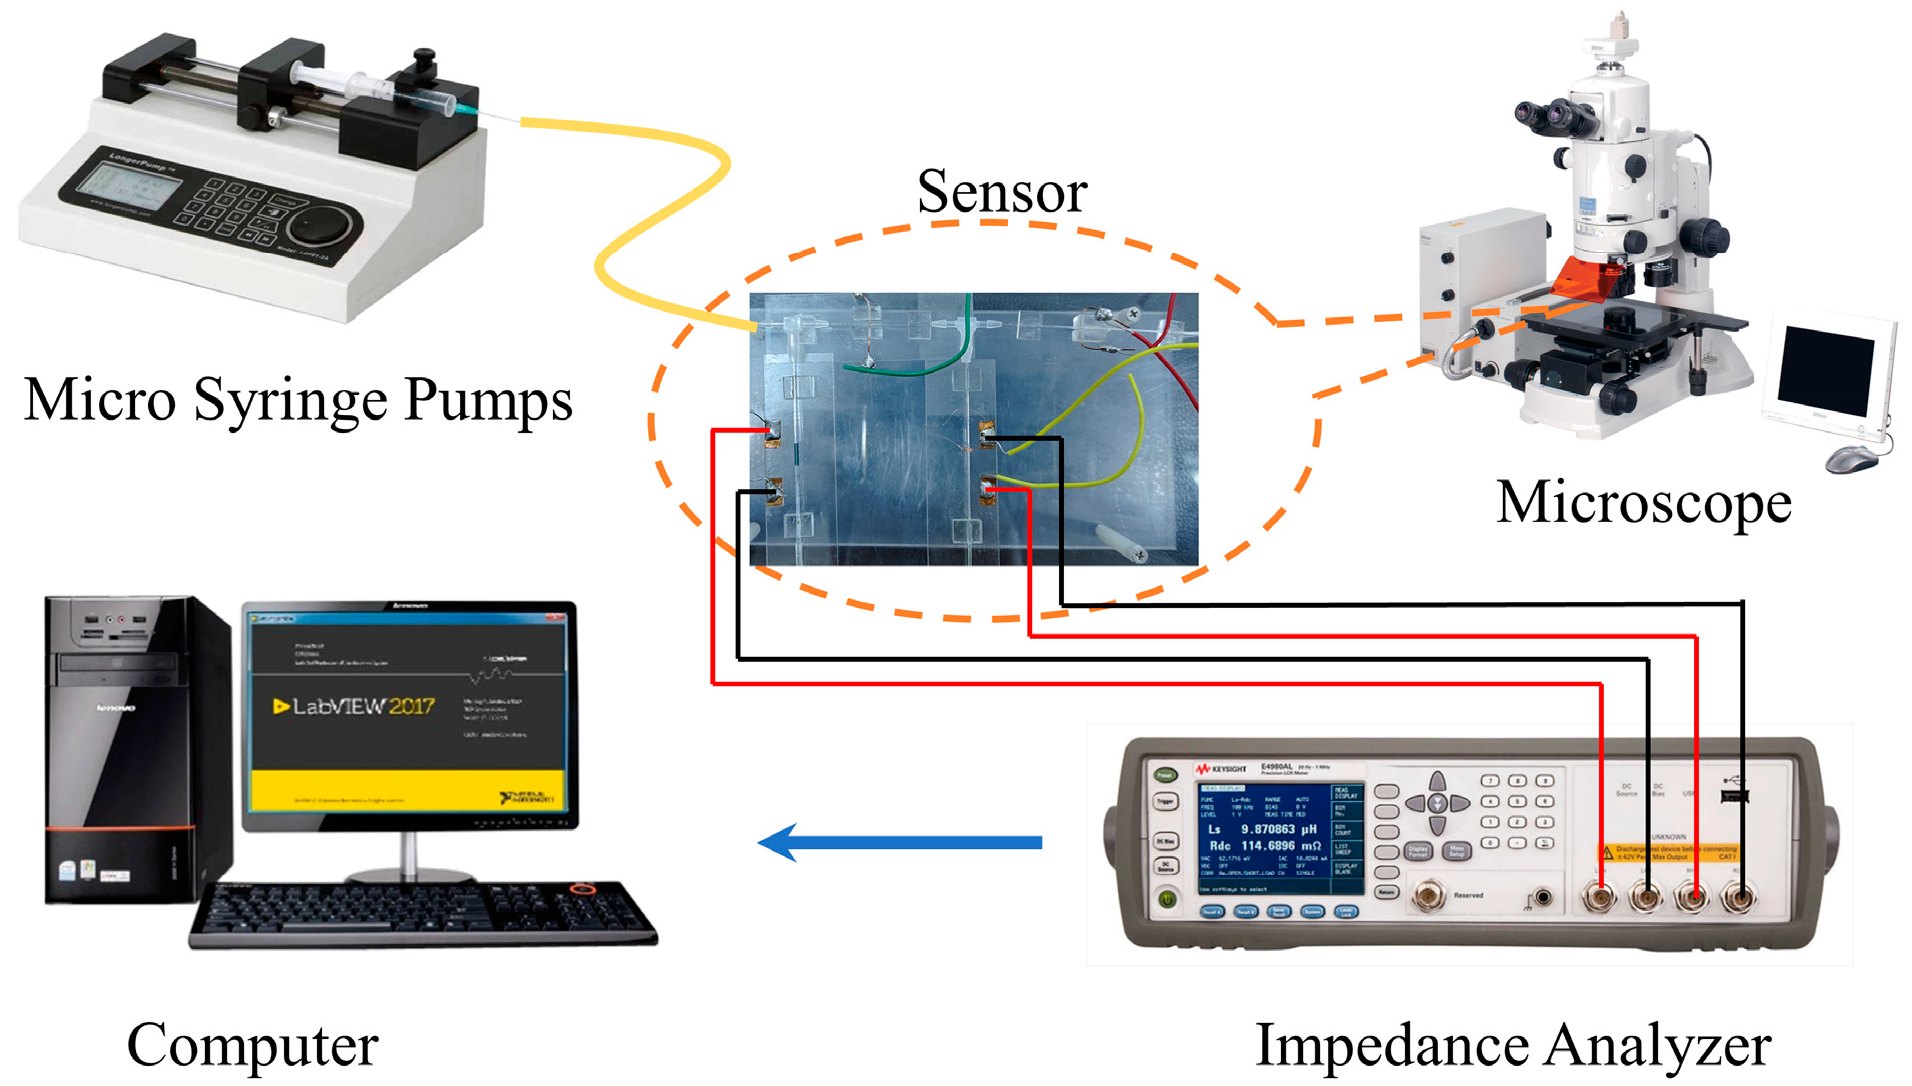
To evaluate the sensor’s overall performance, an experimental setup was built, as shown in
Figure 4. The syringe pump was employed to deliver oil to the sensor at a constant flow rate, allowing for real-time observation of the sensor’s operation and the characteristics of impurities through the microscope. The impedance analyzer was utilized to provide excitation to the sensor and collect data for transmission to the computer. Subsequently, the computer was responsible for collecting and analyzing the data. For the experiment, the syringe pump was connected to the sensor oil inlet through a rubber tube, the sensor was placed under the microscope, the four detection units of the sensor were connected to the impedance analyzer through wires, and the impedance analyzer was connected to the computer. This experimental platform can be utilized to test various types of pollutants present in the oil.
3.2.2. Experimental Sample Preparation
The steps of experimental sample preparation are shown in
Figure 5. Before adding 100 mL of oil, 15 mg of iron and copper particles (Hebei Leber Metal Material Technology Co., Ltd., Xingtai, China) of different sizes were measured with a precision balance. The samples were then thoroughly mixed by subjecting them to oscillation at 2500 rpm for 30 min using a vortex mixer. A pipette gun was used to take water and air into the oil solution, and then the vortex mixer was used to mix the sample, and the size of water droplets and air bubbles was controlled by controlling the oscillation time.
3.3. Experiment and Results
3.3.1. Inductive Mode Experiment
The main purpose of inductive mode detection is to identify metal particles in oil. Two inductive coils were linked to the impedance analyzer. Based on previous research [
24,
25], the impedance analyzer’s frequency and excitation voltage were set at 2 MHz and 2 V, respectively. To account for the impact of oil overflow speed on detection accuracy [
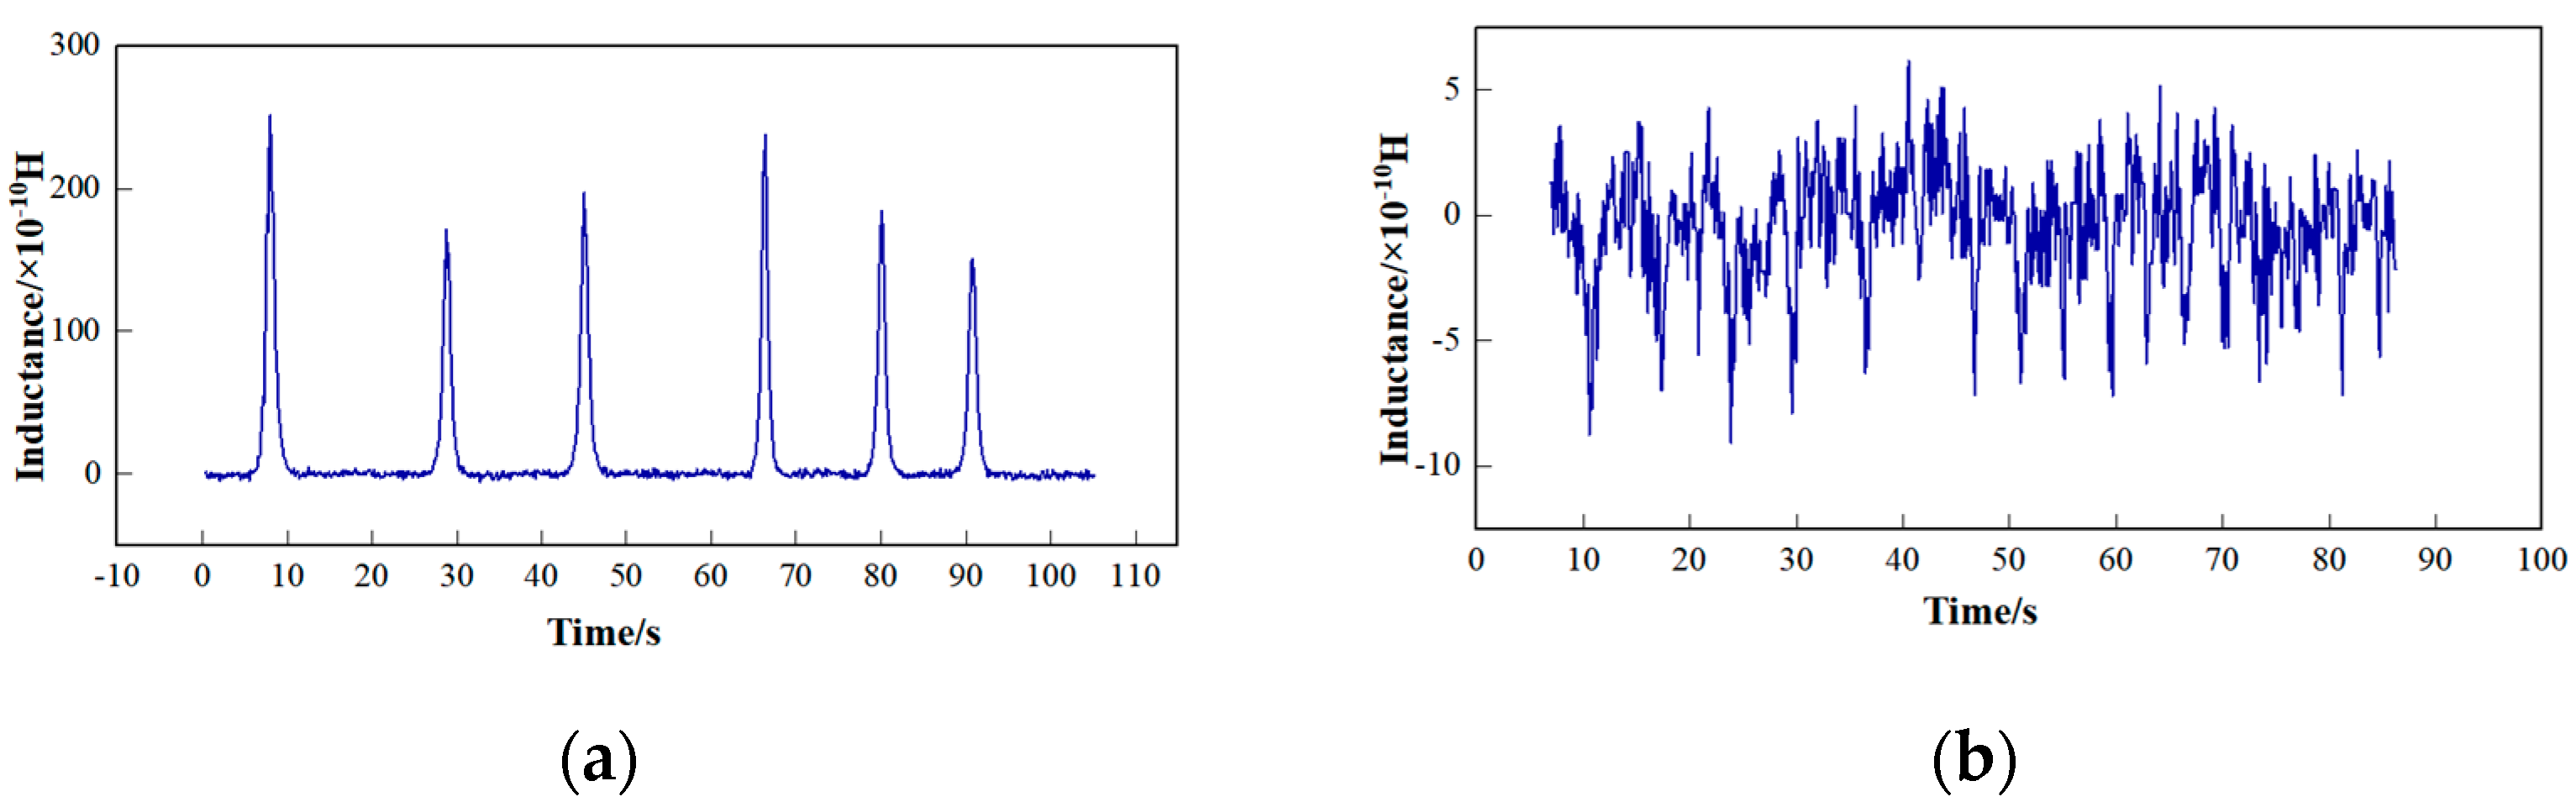
24], the flow rate of the micro syringe pump was adjusted to 480 µL/min. The experiment utilizes mixed samples along with different inductive coils. The detection results for different sizes of metal particles are shown in
Figure 6 and
Figure 7.
Table 3 illustrates the experimental statistics for various detection units operating in an inductive mode. The results reveal that detection unit Ⅱ has significantly higher fundamental noise compared to detection unit Ⅰ. Furthermore, the noise levels in both coils remain relatively constant. Additionally, when detecting particles of the same size, the signal amplitude of detection unit Ⅱ surpasses that of detection unit Ⅰ. Moreover, the signal-to-noise ratio of detection unit Ⅱ is also higher than that of detection unit Ⅰ. However, the pulse width of the signal in detection unit Ⅰ is marginally wider than that of detection unit Ⅱ.
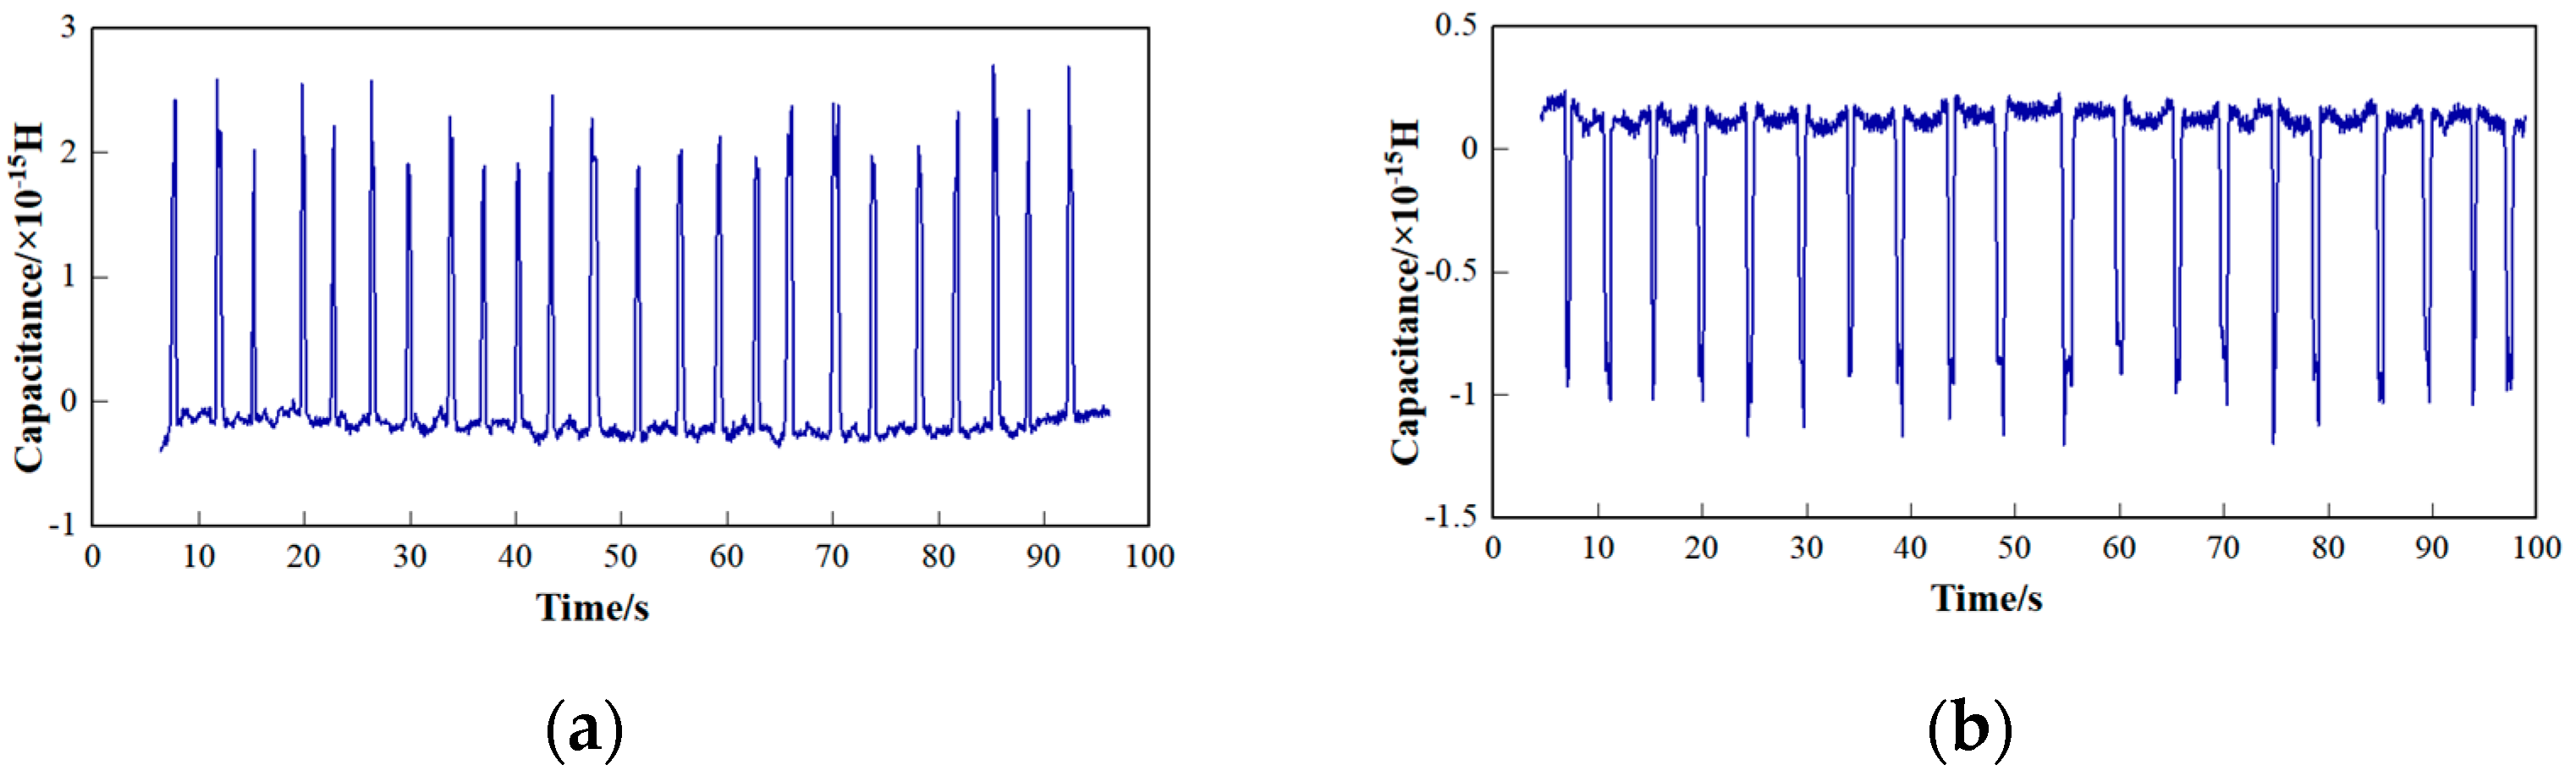
3.3.2. Capacitive Mode Experiment
In the earlier study [
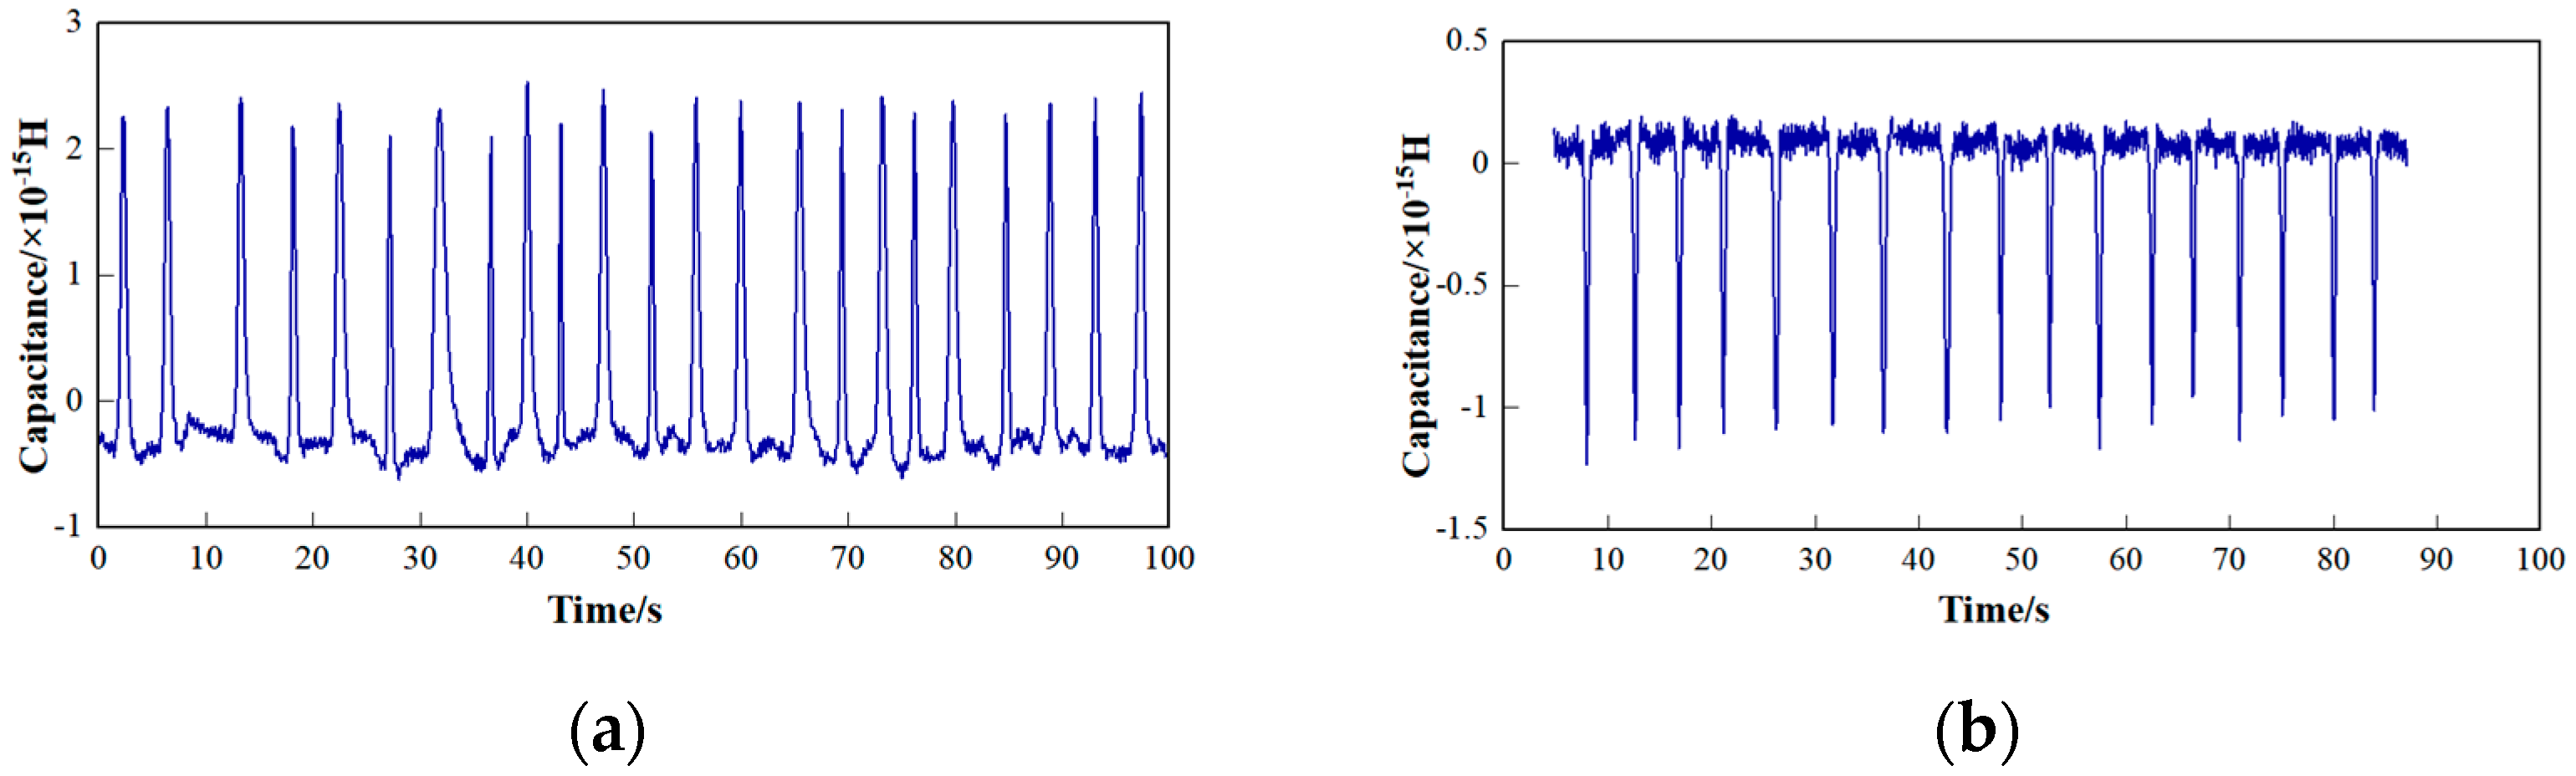
32], the capacitive sensing unit was operated at an excitation frequency of 1.8 MHz. The excitation voltage and syringe pump flow rate were also set to match the inductive mode. Experiments were carried out using samples that were prepared beforehand.
Figure 8 and
Figure 9 display the results of detecting different capacitances for various sizes of non-metal particles.
Table 4 presents the experimental data for different detection units in capacitance mode. The findings reveal that the basic noise level of detection unit III is slightly lower than that of detection unit IV, while the noise of both capacitors remains relatively consistent. Similarly, when considering particles of the same size, the signal amplitude of detection unit III is slightly greater than that of detection unit IV, resulting in a slightly higher signal-to-noise ratio for detection unit III. However, the signal width of detection unit IV is wider compared to that of detection unit III.
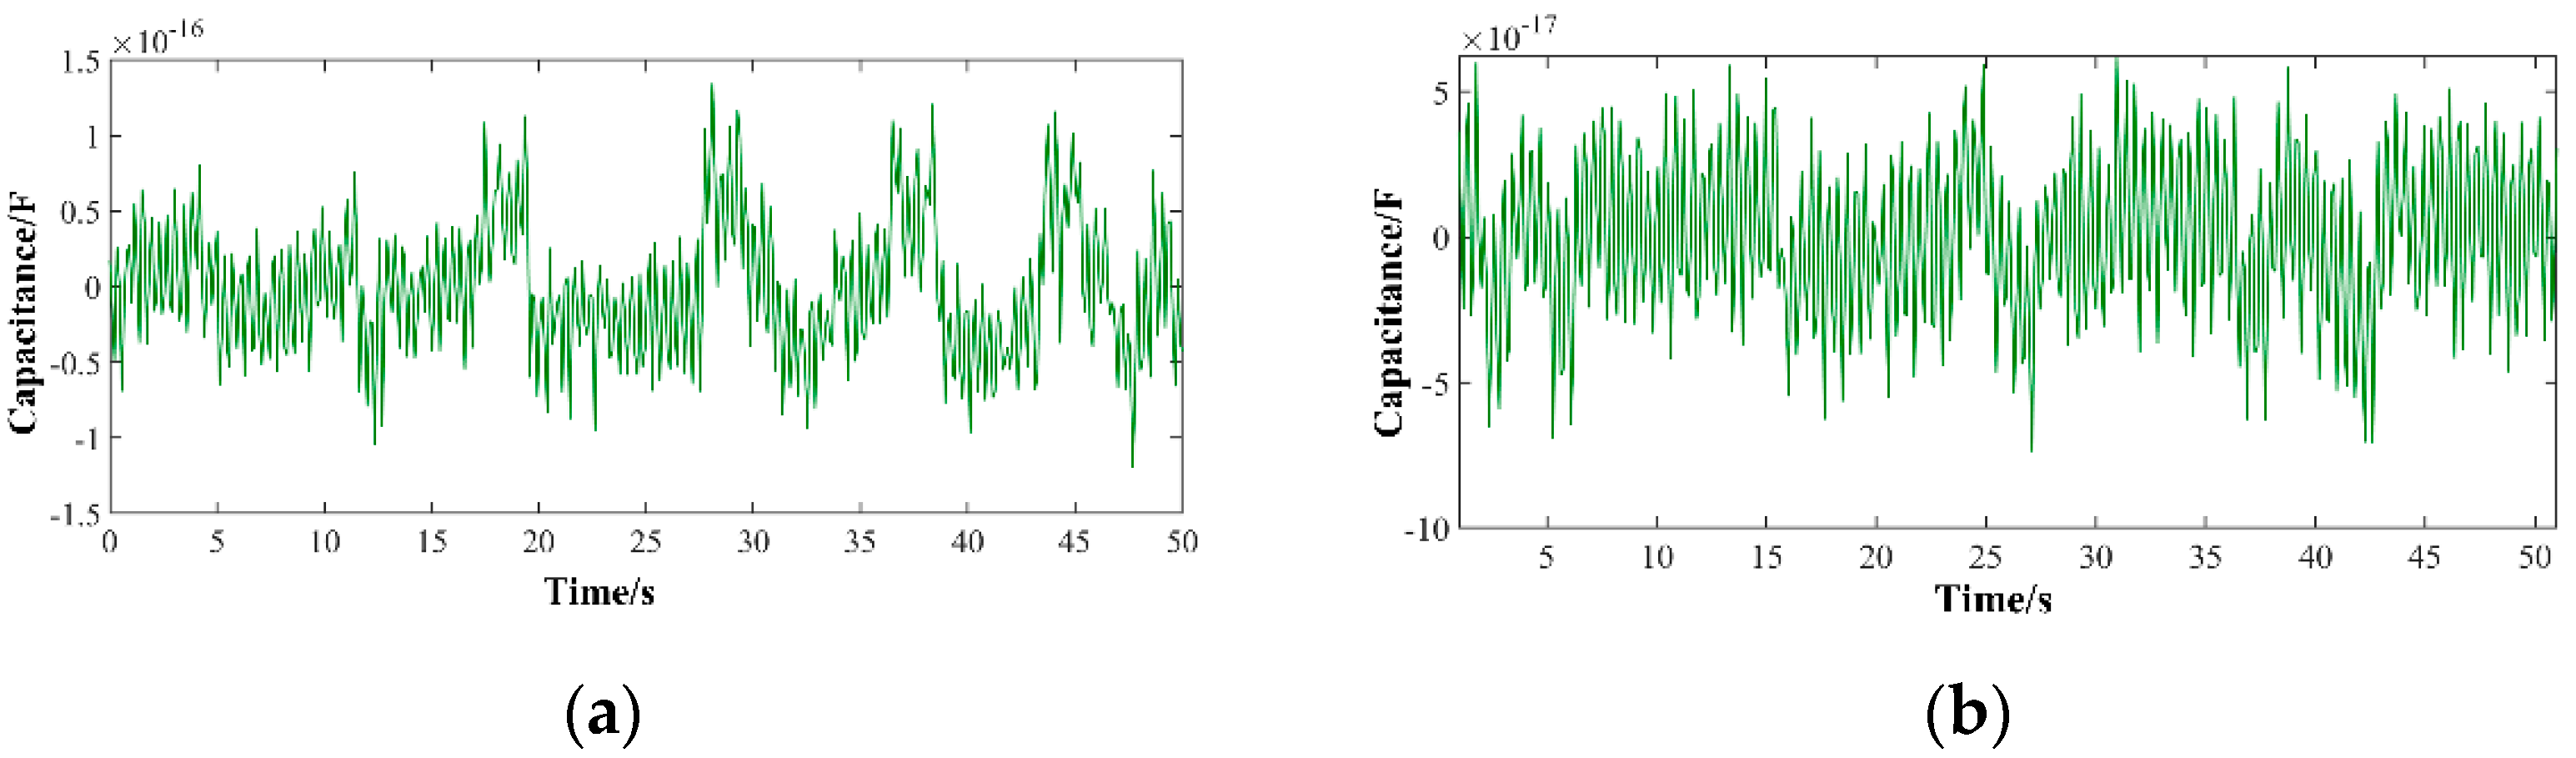
3.3.3. Lower Detection Limit Experiment
Through experimentation, it was discovered that when the particles being detected are extremely small, the signal generated is overshadowed by background noise. To address this issue, we examined how small a particle the sensor we designed can detect. Since the mixed experimental sample in the front is not conducive to the experiment of detecting the lower limit, we used an artificial addition of single metal particles or water droplets or bubbles in the pure oil, and explored the performance of the sensor by controlling the size of the added particles. The experimental method is consistent with the previous one. Our findings indicate that with detection unit II, we were able to successfully detect iron particles measuring 54 μm and copper particles measuring 90 μm. Additionally, detection unit IV allowed us to detect water droplets measuring 116 μm and air bubbles measuring 130 μm.
Figure 10 and
Figure 11 showcase the results of these experiments.
Through comparative experiments of different detection units, it can be found that the minimum size detected by iron particles is smaller than that detected by copper particles. This is mainly because the magnetization effect generated by iron particles due to the detection unit is stronger than the eddy current effect generated by copper particles due to the detection unit. And the minimum size of the water droplets detected by the detection unit is smaller than the minimum size of the bubbles detected. This is because the difference in dielectric constant between oil and water is much greater than the difference in dielectric constant between oil and bubbles.
4. Discussion
In inductive mode, detection unit II has significantly higher fundamental noise compared to detection unit I. Furthermore, the noise levels in both coils remain relatively constant. Additionally, when detecting particles of the same size, the signal amplitude of detection unit II surpasses that of detection unit I. Moreover, the signal-to-noise ratio of detection unit II is also higher than that of detection unit I. However, the pulse width of the signal in detection unit I is marginally wider than that of detection unit II. The inductive detection unit enables the differentiated detection of iron particles down to 54 μm and copper particles up to 90 μm, and of course metal particles up to 900 μm can be detected. The inductive mode offers not only good detection accuracy, but also a wide detection range.
In capacitive mode, the basic noise level of detection unit III is slightly lower than that of detection unit IV, while the noise of both capacitors remains relatively consistent. Similarly, when considering particles of the same size, the signal amplitude of detection unit III is slightly greater than that of detection unit IV, resulting in a slightly higher signal-to-noise ratio for detection unit III. However, the signal width of detection unit IV is wider compared to that of detection unit III. The capacitive detection unit enables the differential detection of water droplets down to 116 μm and air bubbles up to 130 μm.
Through comparative experiments of different detection modes, it can be found that in inductive mode, the minimum size detected by iron particles is smaller than that detected by copper particles. This is mainly because the magnetization effect generated by iron particles due to the detection unit is stronger than the eddy current effect generated by copper particles due to the detection unit. In capacitive mode, the minimum size of the water droplets detected by the detection unit is smaller than the minimum size of the bubbles detected. This is because the difference in dielectric constant between oil and water is much greater than the difference in dielectric constant between oil and bubbles.
In the future, the sensitivity of the sensor can be improved by adopting some circuits, such as a temperature compensation circuit, a signal filter circuit and a signal amplification circuit, so that the sensor can differentiate and detect oil contaminants of smaller sizes. At the same time, some machine learning or deep learning algorithms can also be used to learn and classify the oil pollutant signals collected by the sensor, so as to realize the intelligent identification and classification of multiple pollutants in the oil. Based on the sensors designed in this paper, a portable oil-monitoring device or an online oil-monitoring device can be developed to realize timely or real-time condition monitoring and fault diagnosis of ships and offshore engineering equipment.
5. Conclusions
A multi-channel, dual-mode multi-pollutant detection sensor for oil is proposed. The sensor enables simultaneous differentiated detection of metallic and non-metallic oil contaminants. The sensor’s detection volume of flow has been raised to eleven times its original value, leading to a significant improvement in detection efficiency. Through analyzing the sensor’s detection outcomes in various modes, it is now capable of simultaneously detecting iron particles, copper particles, water droplets, and air bubbles. It can detect iron particles as small as 54 μm, copper particles as small as 90 μm, water droplets as small as 116 μm, and air bubbles as small as 130 μm. Because of the magnetization effect generated by iron particles due to the detection unit is stronger than the eddy current effect generated by copper particles due to the detection unit, the minimum size detected by iron particles is smaller than that detected by copper particles. Because the difference in dielectric constant between oil and water is much greater than the difference in dielectric constant between oil and bubbles, the minimum size of the water droplets detected by the detection unit is smaller than the minimum size of the bubbles detected. In the future, timely or real-time condition monitoring and fault diagnosis of ships and offshore engineering equipment can be achieved by using optimized circuits and intelligent algorithms. A novel approach for achieving ship and marine engineering equipment health monitoring and fault diagnosis is presented in this study.
Author Contributions
Conceptualization, C.W. and H.Z.; methodology, C.W.; software, S.W.; validation, C.B. and S.Z.; resources, H.Z.; data curation, C.W.; writing—original draft preparation, C.W.; writing—review and editing, C.W.; project administration, H.Z.; and funding acquisition, W.L. and H.Z. All authors have read and agreed to the published version of the manuscript.
Funding
This research was funded by the Natural Science Foundation of China, grant number 52271303, Liaoning Revitalization Talents Program, grant number XLYC2002074, Fundamental Research Funds for the Central Universities, grant number 3132021501, and 3132023522, Innovative Projects for the Application of Advance Research on Equipment (62602010210), Science and Technology Innovation Fund of Dalian, grant number 2021JJ11CG004, and 2019J12GX023.
Institutional Review Board Statement
Not applicable.
Informed Consent Statement
Not applicable.
Data Availability Statement
Data is contained within the article.
Conflicts of Interest
The authors declare that they have no known competing financial interests or personal relationships that could have appeared to influence the work reported in this paper.
References
- Jiang, J.; Hu, Y.; Fang, Y.; Li, F. Application and prospect of intelligent fault diagnosis technology for marine power plant. Chin. J. Ship Res. 2020, 15, 56–67. [Google Scholar]
- Cao, W.; Dong, G.; Chen, W.; Wu, J.; Xie, Y.-B. Multisensory information integration for online wear condition monitoring of diesel engines. Tribol. Int. 2015, 82, 68–77. [Google Scholar]
- Sun, J.; Wang, L.; Li, J.; Li, F.; Li, J.; Lu, H. Online oil debris monitoring of rotating machinery: A detailed review of more than three decades. Mech. Syst. Signal Process. 2021, 149, 107341. [Google Scholar]
- Kumar, M.; Shankar Mukherjee, P.; Mohan Misra, N. Advancement and current status of wear debris analysis for machine condition monitoring: A review. Ind. Lubr. Tribol. 2013, 65, 3–11. [Google Scholar]
- Karanovi, V.; Jocanovi, M.; Deli, M. Influence of solid particles as a contaminants on degradation processes in hydraulic components or systems. Int. J. Ind. Eng. Manag. 2015, 6, 15–20. [Google Scholar]
- Fei, H. A Lubricating Oil Condition Monitoring System Based on Wear Particle Kinematic Analysis in Microfluid for Intelligent Aeroengine. Micromachines 2021, 12, 748. [Google Scholar]
- Sun, C.; Ding, D.; Lu, Q.; Lu, Z. Application of Oil Contamination Analysis in Oil Monitoring Techniques. Lubr. Oil 2017, 32. [Google Scholar] [CrossRef]
- Toms, A.; Toms, L. Oil analysis and condition monitoring. In Chemistry and Technology of Lubricants; Springer: Berlin/Heidelberg, Germany, 2010; pp. 459–495. [Google Scholar]
- Troyer, D. Removing water contamination. Mach. Lubr. Mag. 2001, 5, 21–24. [Google Scholar]
- Abouel, A.; Alturki, F.A.; Ahmed, S.M. Fractal analysis of cavitation eroded surface in dilute emulsions. J. Tribol. 2011, 133, 041403. [Google Scholar]
- Cao, W.; Dong, G.; Xie, Y.; Peng, Z. Prediction of wear trend of engines via on-line wear debris monitoring. Tribol. Int. 2018, 120, 510–519. [Google Scholar]
- Jia, R.; Wang, L.; Zheng, C.; Chen, T. Online Wear Particle Detection Sensors for Wear Monitoring of Mechanical Equipment—A Review. IEEE Sens. J. 2022, 22, 2930–2947. [Google Scholar]
- Hocheng, H.; Tseng, H.C.; Hsieh, M.L.; Lin, Y.H. Tool wear monitoring in single-point diamond turning using laser scattering from machined workpiece. J. Manuf. Process. 2018, 31, 405–415. [Google Scholar]
- Martín, J.C.G.; Guirado, D.; Zubko, E.; Escobar-Cerezo, J.; Moreno, F.; Muñoz, O. Computational study of the sensitivity of laser light scattering particle sizing to refractive index and irregularity. J. Quant. Spectrosc. Radiat. Transf. 2020, 241, 106745. [Google Scholar]
- Xu, C.; Zhang, P.; Wang, H.; Li, Y.; Lv, C. Ultrasonic echo waveshape features extraction based on QPSO-matching pursuit for online wear debris discrimination. Mech. Syst. Signal Process. 2015, 60–61, 301–315. [Google Scholar]
- Ren, Y.J.; Zhao, G.F.; Qian, M.; Feng, Z.H. A highly sensitive triple-coil inductive debris sensor based on an effective unbalance compensation circuit. Meas. Sci. Technol. 2018, 30, 015108. [Google Scholar]
- Zhu, X.; Zhong, C.; Zhe, J. Lubricating oil conditioning sensors for online machine health monitoring—A review. Tribol. Int. 2017, 109, 473–484. [Google Scholar]
- Jagtiani, A.V.; Carletta, J.; Zhe, J. A microfluidic multichannel resistive pulse sensor using frequency division multiplexing for high throughput counting of micro particles. J. Micromechanics Microengineering 2011, 21, 065004. [Google Scholar]
- Sun, Y.; Jia, L.; Zeng, Z. Hyper-Heuristic Capacitance Array Method for Multi-Metal Wear Debris Detection. Sensors 2019, 19, 515. [Google Scholar] [PubMed]
- Bai, Y.; Liu, Y.; Yang, L.; Fan, B.; Zhang, P.; Feng, S. A Wear Particle Sensor Using Multiple Inductive Coils under a Toroidal Magnetic Field. IEEE Access 2021, 9, 6250–6258. [Google Scholar]
- Bozchalooi, I.S.; Liang, M. In-line identification of oil debris signals: An adaptive subband filtering approach. Meas. Sci. Technol. 2009, 21, 015104. [Google Scholar]
- Luo, J.; Yu, D.; Liang, M. Enhancement of oil particle sensor capability via resonance-based signal decomposition and fractional calculus. Measurement 2015, 76, 240–254. [Google Scholar] [CrossRef]
- Leugner, L.O. Use of sediment tests and wear metal analysis to monitor hydraulic system conditions. Lubr. Eng. 1987, 43, 365–374. [Google Scholar]
- Shi, H.; Zhang, H.; Wang, W.; Zeng, L.; Sun, G.; Chen, H. An Integrated Inductive-Capacitive Microfluidic Sensor for Detection of Wear Debris in Hydraulic Oil. IEEE Sens. J. 2019, 19, 11583–11590. [Google Scholar] [CrossRef]
- Zeng, L.; Wang, W.; Rogers, F.; Zhang, H.; Zhang, X.; Yang, D. A High Sensitivity Micro Impedance Sensor Based on Magnetic Focusing for Oil Condition Monitoring. IEEE Sens. J. 2020, 20, 3813–3821. [Google Scholar] [CrossRef]
- Wang, L.; Zhong, H.; Li, L.; Chen, T.; Zhang, J. The influence of the coil spacing of the oil wear particle detection sensor on the output signal. Lubr. Eng. 2020, 45, 69–75. [Google Scholar]
- Zheng, C.; Wang, X.; Yu, L.; Wei, C.; Hou, R.; Du, J. The influence of nanocrystalline magnetic ring on the sensitivity of wear particle sensor. Trans. Beijing Inst. Technol. 2021, 41, 800–807. [Google Scholar]
- Bernieri, A.; Ferrigno, L.; Laracca, M.; Rasile, A. Eddy Current Testing Probe Based on Double-Coil Excitation and GMR Sensor. IEEE Trans. Instrum. Meas. 2019, 68, 1533–1542. [Google Scholar] [CrossRef]
- Shi, X.; Xiong, Z.; Li, Y.; Wang, X. Wear Condition Monitoring of Wind Turbine Gearbox based on the On- line Oil Abrasion Detection. J. Mech. Transm. 2014, 38, 74–77. [Google Scholar] [CrossRef]
- Shi, H.; Zhang, H.; Gu, C.; Ma, L.; Li, G. Inductance-capacitance dual-mode hydraulic oil pollutant detection sensor. Ournal Mech. Eng. 2020, 56, 20–26. [Google Scholar]
- Cao, Y.; Liu, R.; Du, J.; Yu, F.; Yang, Q.; He, Y.; Li, S. Gas Turbine Bearing Wear Monitoring Method Based on Magnetic Plug Inductance Sensor. Am. Soc. Mech. Eng. 2018, 51128, V006T05A002. [Google Scholar]
- Wang, C.; Zheng, Y.; Zhang, H.; Li, W.; Zhang, S.; Hong, J.; Sun, Y. An Oil Multipollutant Detection Sensor with High Sensitivity and High Throughput. IEEE Trans. Instrum. Meas. 2022, 71, 1–11. [Google Scholar]
| Disclaimer/Publisher’s Note: The statements, opinions and data contained in all publications are solely those of the individual author(s) and contributor(s) and not of MDPI and/or the editor(s). MDPI and/or the editor(s) disclaim responsibility for any injury to people or property resulting from any ideas, methods, instructions or products referred to in the content. |
© 2023 by the authors. Licensee MDPI, Basel, Switzerland. This article is an open access article distributed under the terms and conditions of the Creative Commons Attribution (CC BY) license (https://creativecommons.org/licenses/by/4.0/).


 ,
, 


