Article

Numerical Analysis on Effect of Structural Parameters on Flow Field and Internal Trajectory in Gas–Steam Ejection Systems

1
School of Mechanical Engineering, Nanjing University of Science and Technology, Nanjing 210094, China
2
School of Aero Engine, Zhengzhou University of Aeronautics, Zhengzhou 450046, China
3
Wuhan Second Ship Design and Research Institute, Wuhan 430205, China
*
Author to whom correspondence should be addressed.
J. Mar. Sci. Eng. 2023, 11(10), 1937; https://doi.org/10.3390/jmse11101937
Submission received: 17 August 2023 / Revised: 14 September 2023 / Accepted: 27 September 2023 / Published: 7 October 2023
(This article belongs to the Special Issue Advances in Marine Applications of Computational Fluid Dynamics)

Abstract

:
This paper aims to study the influence of the structure of spray holes and throats on the flow field and the internal trajectory of the gas–steam ejection device. The compressible Navier–Stokes equations, discrete ordinate methods and RNG k-ε turbulence model are utilized to simulate the two-phase flow of the rocket gas with multispecies and the water sprays. The comparison between numerical results and experimental data confirms the accuracy and effectiveness of this model. The simulation analysis on the cases of the ejection process with multiple spray hole diameters, number of spray holes, total spray area, and throat diameter are conducted. The shock wave structure inside the gas–steam ejection device is examined. The simulation results show that, instead of the spray hole diameter and number, the total spray area and secondary nozzle throat diameter are the key factors that affect the flow field and internal trajectory of the gas–steam ejection device. Under the existing spray structure, the maximum number of spray holes is 300 to achieve the stability of the flow field and internal ballistic trajectory of gas–steam ejection devices. By comparing the throat diameters of multiple secondary nozzles, it was found that the minimum throat diameter of the secondary nozzles should be no less than 100 mm. The results could be valuable for the design of gas–steam ejection devices.

1. Introduction

Gas–steam ejection devices are widely utilized in submarines to launch underwater devices. Gas–steam ejection has the advantages of a simple structure, high exit velocity and long range [1] compared to other methods such as gas ejection, steam ejection, and compressed air ejection. During the underwater gas–steam ejection process, the high-temperature gas jet interacts violently with the water in the cooler [2]. Due to the significant differences in temperature [3,4] and other physical properties between gas and water, intense vaporization occurs upon contact [5,6]. So, it is important to study the flow field and ballistic characteristics of gas–steam ejection devices.
Previous studies mainly focused on the vaporization in gas–steam ejection devices. For example, Li et al. [7] numerically studied the effect of the product pressure and component concentration ratio at the nozzle inlet of the gas generator on the internal trajectory and load of the gas ejection, but the shock wave characteristics of the gas–steam ejection device have not been considered. Rui et al. [8] studied the influence of droplet evaporation on gas phase distribution under different water jet pressure differences, water jet hole diameters and water gas mass ratios. Zhang and Bao [9] conducted a comparative analysis on the structural difference, water injection characteristics and their impact on the internal ballistics of the gas–steam ejection system in two different water injection modes: centralized water injection and gradual water injection, while the transient response characteristics of the shock wave of the gas–steam device were not examined. Hu et al. [10] conducted unsteady numerical simulations on the gas–liquid two-phase flow field of gas steam ejection, and studied the secondary flow phenomenon and internal ballistic change during the ejection process; however, the variation pattern of the shock wave has not been obtained. Xiao and Zhao [11] applied CFD technology to carry out multiphase flow field numerical simulation of high-temperature and high-pressure gas flow in the underwater launch gas steam power plant, and applied the atomization theory to simulate the flow field morphology, characteristic point state parameters and cooling water evaporation principle, but the oscillation characteristics of the shock wave have not been determined. Yuan [12] used similar methods to research the gas–steam ejection device, which can accurately predict the interior ballistic performance of the ejection system, but cannot determine the changes in shock wave characteristics of gas–steam ejection devices and the motion law of the missile. Zhao and Bao [13] made a detailed analysis of the cooling water vaporization process in the gas–steam ejection process according to the different states of the cooling water, providing a design basis for the gas–steam ejection system, but the shock wave characteristics of the gas–steam ejection device have not been obtained. Ni [14] studied the variable depth launch power system of the submarine missile based on the interior ballistic equation of the launcher, and proposed to achieve variable depth launch by changing the water injection amount of the cooler. Liu and Jiang [15] established a flow field calculation model for a centralized water injection ejection device, calculated the flow field during the launch process, obtained the liquid water flow pattern and vaporization effect on the gas steam ejection flow field, but the influence of the diameter of the spiracle on the flow field characteristics of the gas–steam ejection device has not been obtained. Hui et al. [16] established the calculation model of continuous water injection gas steam ejection, and analyzed the influence of the size and number of spiracles on the vaporization of gas steam ejection cooling water, but did not determine the water spray pressure difference, water volume changes, or missile movement patterns inside the launch tube. Yan et al. [17] researched the gas–steam ejection internal ballistics, the influence of the vaporization model and the component transport model on the gas–steam ejection flow field was analyzed, but the shock response analysis of the gas–steam device was not obtained. Bai and Hu [18] established a calculation model for the gas–steam launch power system, obtained the influence of the inlet angle on the flow inside the launch tube and the force acting on the nozzle, and analyzed the evaporation of different initial droplet sizes, but the shock wave characteristics of the gas vapor ejection device have not been determined. Shi et al. [19] analyzed the influence of different characteristic values of secondary flow ducts on the pressure distribution in the internal channel and spray zone of the cooler, but did not obtain the characteristics of missile motion changes.
As reviewed above, existing studies only focused on the flow field [20] of the gas–steam ejection device, while the flow, phase transition, and energy conversion laws of gas and water during the ejection process have not been well addressed [21,22,23]. Moreover, the water-to-gas-conversion [24] mechanism of the gas–steam ejection device has not been determined, the influence of different structures of the spray hole and throat on the load and internal ballistics of the ejection device was also not considered, which is also not conductive to the optimization of aerodynamic noise in gas–steam ejection devices. Analyzing the effect of structural parameters on thermodynamic and ballistic characteristics inside the launch tube of a gas–steam ejection device is of great significance for missile launch [25,26].
In this study, we develop a numerical model for the gas–steam ejection flow field [27,28,29]. The effectiveness of the numerical method is verified by simulating the water jet into the tail flame of a rocket engine. The multiphase flow field structure of gas–liquid phase transition in gas–steam ejection [30,31,32], the flow field distribution law of ejection system and the internal ballistic characteristics of missile are analyzed. Furthermore, the influence of the gas–steam ejection device structure on the multiphase flow field and internal ballistic trajectory [33,34,35] are studied, and the flow field distribution and the influence of the missile’s internal ballistic trajectory corresponding to different spiracle diameters, number and throat diameters are systematically analyzed. The influence of structural factors [36,37] on the performance of the gas–steam ejection device is obtained.

2. Computational Model

2.1. Geometric Model

A typical gas–steam ejection system is composed of the gas generator, guide cone, spiracle hole, elbow, draft tube, shunt tube, launcher, and tail cover, as shown in Figure 1. The coordinate origin is on the axis 726.36 mm away from the inlet of the first stage nozzle. The y-axis of the coordinate is upward along the axis. The coordinate x-axis is perpendicular to the y-axis and points towards the axis direction of the launcher. The z-axis is perpendicular to the x-axis and y-axis, pointing outward from the ejection device. The arrangement of spray holes is shown in Figure 2. There are a total of 6 arrangement forms of spray holes. The fuel gas is ejected from the nozzle. Through the conduction of the draft tube and the shunt tube, part of the fuel gas vaporizes with water, and the rest enters the water chamber. This increases the pressure there and a water jet is created through the spiracle. In return, this water jet contacts the main fuel gas to generate vaporization. The vaporized gas steam mixture passes through the elbow pipe and enters the launcher to drive the tail cover movement, and the missile can then be launched. The length of the first stage nozzle, Lh is 0.77 times as the diameter of the first stage nozzle inlet, Dh. The length of the water chamber, Lc, is 3.85 times the diameter of the first stage nozzle inlet, Dh. The diameter of the second stage nozzle is Ds. The geometric dimensions of the gas–steam ejection device are detailed in Table 1.

2.2. Computational Grids

A structured mesh has better numerical ability than unstructured grids using multi-blocks. Also, a structured mesh can improve the fidelity of the flow solutions and assure a better resolution of shock waves in the flow field; so, a structured mesh type is used in the calculation model. The computational mesh for this study is shown in Figure 3. Based on the gas–steam ejection calculation model, grid models are established with three grid densities of 0.7 million, 1.3 million, and 2.4 million, respectively. Figure 4 show the results of average pressure and average temperature inside the launcher under three grid densities. When the grid is sparse, the calculated pressure and temperature values have a significant deviation compared to the other two dense grid conditions. However, the pressure and temperature values calculated for the grid conditions of 1.3 million and 2.4 million are consistent, basically satisfying the calculation accuracy requirements. However, the calculation time of the 2.4 million grid model is particularly long. Therefore, considering both calculation accuracy and efficiency, the initial number of grids for all calculation models of gas–steam ejection is controlled at 1.3 million. The time steps used in the model are 4 × 10⁻⁵ s. The total gas temperature is 3000 K, and the total pressure is 7,000,000 Pa at the nozzle inlet.

3. Numerical Method

3.1. Governing Equations

The gas–liquid flow in the gas–steam ejection process studied in this paper involves the two-phase mixed mass transfer. Using the homogeneous multiphase flow theory, the two-phase mixture composed of cooling water and gas is considered as a variable density single fluid based on the volume fraction φ (0 ≤ φ ≤ 1).
The continuity equation is given as follows:
t ρ m + · ( φ 1 ρ 1 v m + φ 2 ρ 2 v m ) = 0
where φ1 is the volume fraction of cooling water, φ2 is the volume fraction of vapor, φ1 + φ2 = 1; ρm = φ1ρ1 + φ2ρ2 is the density of mixture, with ρ1 the density of cooling water and ρ2 the density of vapor, t is time, and v m is the velocity of mixture.
The momentum equation is written as follows:
t ( ρ m v m ) + · ( ρ m v m v m ) = p + · [ μ m ( v m + v m T ) ] + ρ m g + F + · [ i = 1 N φ i ρ i v d r , i v d r , i ]
Here, N is the number of phases, μm is the viscosity of mixture, F is the body force, and v d r , i is the migration velocity of cooling water. The energy equation is expressed as
t i = 1 2 ( φ i ρ i E i ) + · i = 1 2 [ φ i v i ( ρ i E i + p ) ] = S + · ( k e f f T )
where i = 1 represents cooling water, and i = 2 represents vapor; Ei = hip/ρi + vi2, and h i = i = 1 2 w i h i , wi is the mass fraction, and h i = T ref T c p , i d T , where cp,i is the specific constant-pressure heat capacity, and hi represents the sensible enthalpy of the i-th phase. We use Tref = 298.15 K, and κeff = (κ + cpμtPr) with κ as the thermal conductivity, and cp as the specific constant pressure heat capacity for the mixture. Pr is the Prandtl constant, μt is the turbulent viscosity, and S is the vaporization source term.

3.2. Vaporization Model

During the launch of a missile, the gas may undergo severe vaporization when encountering cooling water. The following equations are used to describe the mass rates of vaporization.
m l = { λ φ 1 ρ 1 | T T s a t | T s a t , T T s a t 0 , T < T s a t
The water vapor condensation formula is
m l = { 0 , T T s a t λ φ v ρ v | T T s a t | T s a t , T < T s a t
Here, T is the temperature, Tsat is the saturation temperature of water, λ is the relaxation factor of time, and we use λ = 0.1, φ l and φ v are the volume fractions of the liquid and gas phases. ρl and ρv are the densities of liquid and gas phases.

3.3. Turbulence Model

We adopt the RNG k-ε model [38] for the flows, where the equation for turbulent kinetic energy k is given as
k t + U j k x j = x j [ ( ν + ν t σ k ) k x j ] + G ε
and the transport equation for ε is
ε t + U j ε x j = x j [ ( ν + ν t σ ε ) ε x j ] + C ε 1 ε κ G C ε 2 ε 2 κ C μ η 3 1 η / η 0 1 + β η 3 ε 2 k
Here, ν t = C μ k 2 ε , η = (k/ε)(G/vt)0.5, β = 0.012, and η0 = 4.38. C μ = 0.085, C ε 1 = 1.42, C ε 2 = 1.68, σ k = 0.7194, σ ε = 0.7194.

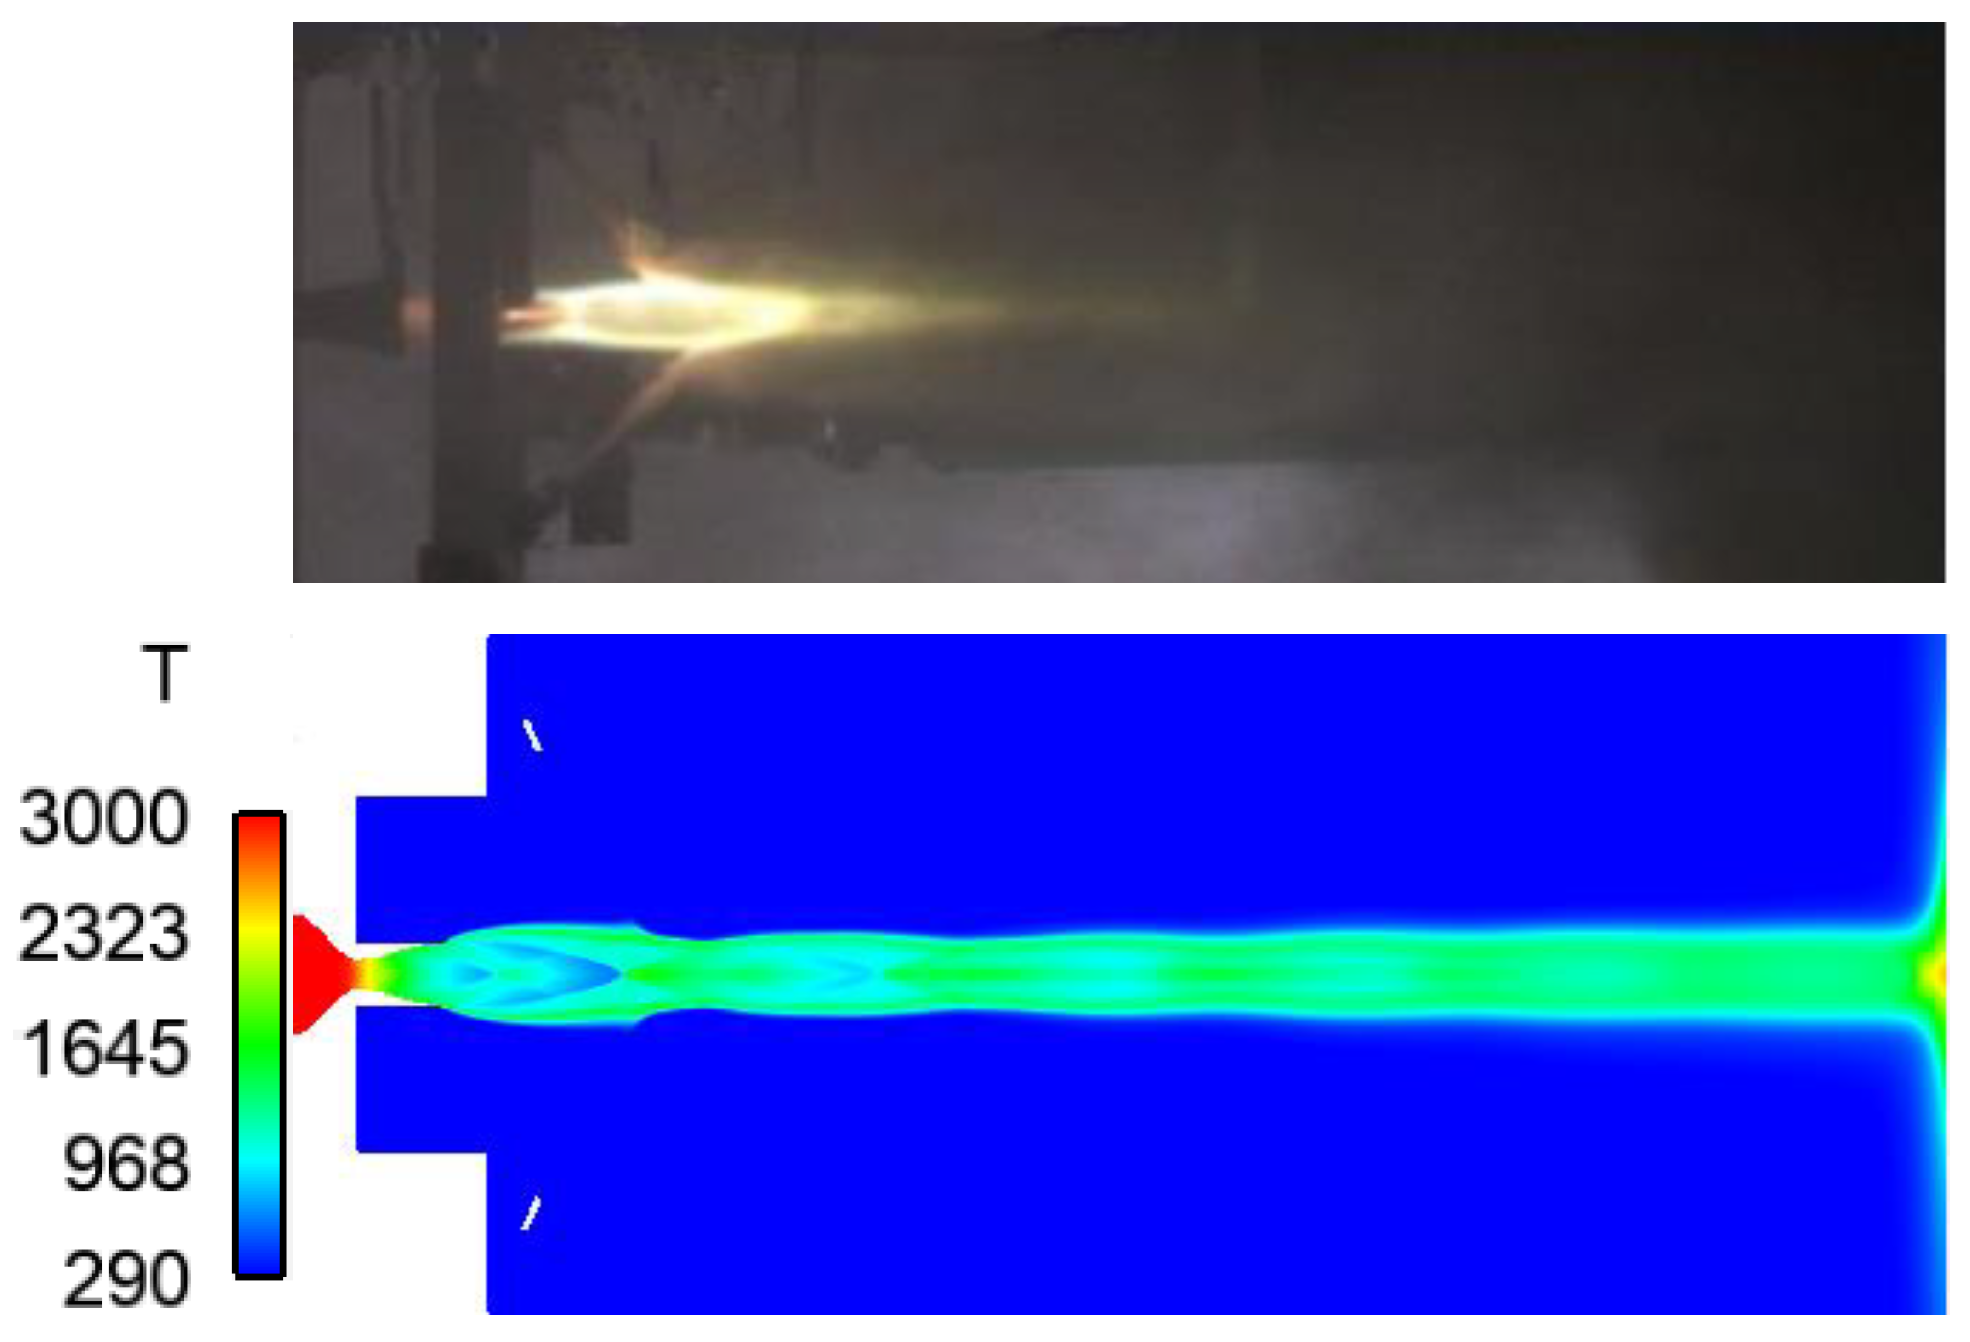
3.4. Model Validation

To verify the validity of the multiphase vaporization model [39] for the high-temperature jet and liquid water vaporization models, we simulate the water injection problem in solid rocket motors. The experimental setup is shown in Figure 5. The angle between the spray pipe and the axis of symmetry is 60°. Four temperature-monitoring points are distributed on the bottom plate, with distances from the axis of symmetry of 0.2 m, 0.3 m, 0.4 m, and 0.5 m, respectively. The nozzle wall, water pipe wall, and bottom plates are all set as solid walls. The outlet boundary of the plume is set to a pressure of 101,325 Pa, and temperature of 300 K. The experimental result with water injection and temperature contour is shown in Figure 6. The measured and simulated temperatures at the four monitoring locations are compared in Table 2.

4. Computational Results

The structure of water spray holes and throat has a great influence on the cooling effect of the water spray. The influence of spray hole diameters, number of spray holes, total spray area, and throat diameter on the multiphase interaction mechanism of gas–steam ejection and the ballistic parameters of the launcher is studied. The specific parameters of water spray conditions are shown in Table 3. The total spray area for cases 3, 6, 7, and 8 is the same. Compare cases 3, 6, 7, and 8 to analyze the effect of spray hole diameter on the flow field of the ejection device. And cases 1, 2, and 3 are compared to analyze the effect of total spray area on the flow field of the ejection device. A comparison of cases 3, 4, and 5 is conducted to analyze the effect of the secondary nozzle throat diameter on the flow field of the ejection device.

4.1. Influence of Spray Hole

The flow field distribution of the gas–steam ejection device with a spray hole diameter of 4 mm, a number of 500 spray holes, and a secondary nozzle throat diameter of 120 mm at different times for case 3 is analyzed. The pressure distributions of case 3 in the symmetric plane of the device at different times are shown in Figure 7 and Figure 8. Significant pressure fluctuations are noticed in the primary and secondary diversion pipes, as well as inside the bent pipeline. The pressure inside the first stage guide tube is mainly transmitted by a positive shock wave in the early stage due to the small inlet pressure of the primary nozzle and restrictions on the rear, resulting in a sharp increase in pressure after the shock wave. When water vaporizes and enters the bend and launcher, it is gradually affected by the increasing pressure at the inlet of the nozzle and the increasing pressure ratio. Therefore, the fluid in the first stage guide tube undergoes overexpansion, and the airflow pressure at the outlet of the nozzle shows repeated fluctuations. There are water jets at the position of the second stage guide pipe, which limits the further outward expansion of the airflow. The pressure fluctuation at this position is mainly caused by the continuous action of the water jet. At the position of the bend, the airflow and the wall interact and restrict each other, resulting in the intersection and reflection of shock waves and expansion waves. As the pressure inside the launch tube fluctuates, there will be repeated pressure fluctuations inside it. The fluctuation of pressure is mainly caused by the shock and expansion waves of supersonic airflow [40]. However, due to the use of the total pressure curve generated by turbocharged combustion at the inlet of the primary nozzle, the overall pressure value continues to increase over time, and the pressure acting on the entire launch device also gradually increases.
The temperature distributions at different times of case 3 are shown in Figure 9. From Figure 9, it can be seen that the temperature values of the jet in the core area of the guide tube are relatively high, all above 2000 K. After the gas reaches the water chamber position, it comes into contact with the water surface to cool down. Under the pressure difference, water flows out of the spray hole and vaporizes with the main flow boundary of the gas, playing a role in evaporative cooling.
The water volume fraction distributions during the process of case 3 are shown in Figure 10. As time increases, the total mass of liquid water in the water chamber gradually decreases. After liquid water is sprayed out of the spray hole and enters the straight pipe section, a portion of the liquid water on the inner side of the bend comes into contact with the gas and vaporizes into water vapor, which moves into the launch cylinder. However, a portion of the liquid water, due to incomplete contact with the gas and vaporization, directly enters the cylinder and follows the gas along the wall of the launch cylinder. Due to the limitation of the gas main jet, liquid water on the outer wall of the bend is squeezed at the boundary between the main jet and the wall, and there is no longer any water jet on the outer side after the bend.
The unsteady gas flow emitted by the first stage nozzle in the guide tube of case 3 is shown in Figure 11. The dashed lines in the figure represent expansion waves, while the solid lines represent compression waves. It can be seen that the gas flow moves between the walls of the guide tube, and the gas pressure at the outlet is smaller than the initial pressure. An oblique shock wave appears at the outlet. After passing through the outlet, the pressure increases and the velocity decreases. The oblique shock wave fronts intersect and reflects the two compression waves, resulting in a loss of total pressure after the shock wave. Since the diameter of the guide tube is larger than the outlet diameter, the compression waves do not act on the wall, but an expansion wave is formed under the influence of the free interface. Therefore, in the upper part of the guide tube, there is an interaction process between the compression waves and the expansion waves.
In the lower part of the ejection device, due to the constraint of the secondary nozzle, the airflow is compressed, causing the pressure to gradually increase. The airflow is no longer supersonic, and there is no shock wave or expansion wave observed. The pressure at the throat of the secondary nozzle is relatively high, resulting in an expansion wave. Then, the airflow moves to the wall, and a compression wave is generated under the effect of the wall.
The velocity cloud diagram near the spiracle of case 3 is shown in Figure 12, and the distribution cloud diagram of two-phase mass transformation near the spiracle for case 3 is shown in Figure 13. When the water flow rate increases to 0.04 s, the gas at the corresponding position of the spiracle is squeezed, and the jet boundary range gradually approaches the center. As the inlet pressure increases, the range of gas flow quickly expands within 0.1 s, and approaches the wall surface of the spray pipe after 0.4 s. Under the action of the water jet, the gas jet is gradually compressed first, and then expands outward.
The distribution of pressure and steam phase volume fraction in the curved pipe for case 3 is shown in Figure 14. The gas flowing out of the spray pipe has a high pressure, and when it enters a larger area in the bend, an expansion wave system is generated, resulting in a decrease in pressure. After the gas flow interacts with the upper bend walls, two compression waves are generated, causing the pressure to increase. After the compression wave intersects, the compression wave system is reflected, acting on the lower end of the bend and the inner side of the bend. Due to the short distance of the elbow, under the influence of the confined space of the launcher, the outlet of the elbow is compressed by the pressure in the canister. From the water vapor distribution diagrams in the right column, it can be seen that the distribution of gas flow wave system in the bend has the same effect as the two-phase transformation. Most of the steam is generated between the boundary of the gas jet and the wall, and the generated steam increases the local pressure and thus the gas flow is confined.
The pressure distribution under different spray hole diameters is shown in Figure 15 and Figure 16. In general, the pressure variations within the entire launch cylinder are very similar, except the weak dependences of local pressure on the spray hole size. When the diameter of the spray hole is small, the pressure value near the spray hole is smaller.
The temperature distributions under different spray hole diameters is shown in Figure 17 and Figure 18. The temperature of the gas flow in the guide pipe is relatively high, above 2000 K. After the gas reaches the water chamber, it comes into contact with the water surface and cools down. Under the gas pressure, water flows out of the spray hole and vaporizes at the boundary of the main gas jet.
-
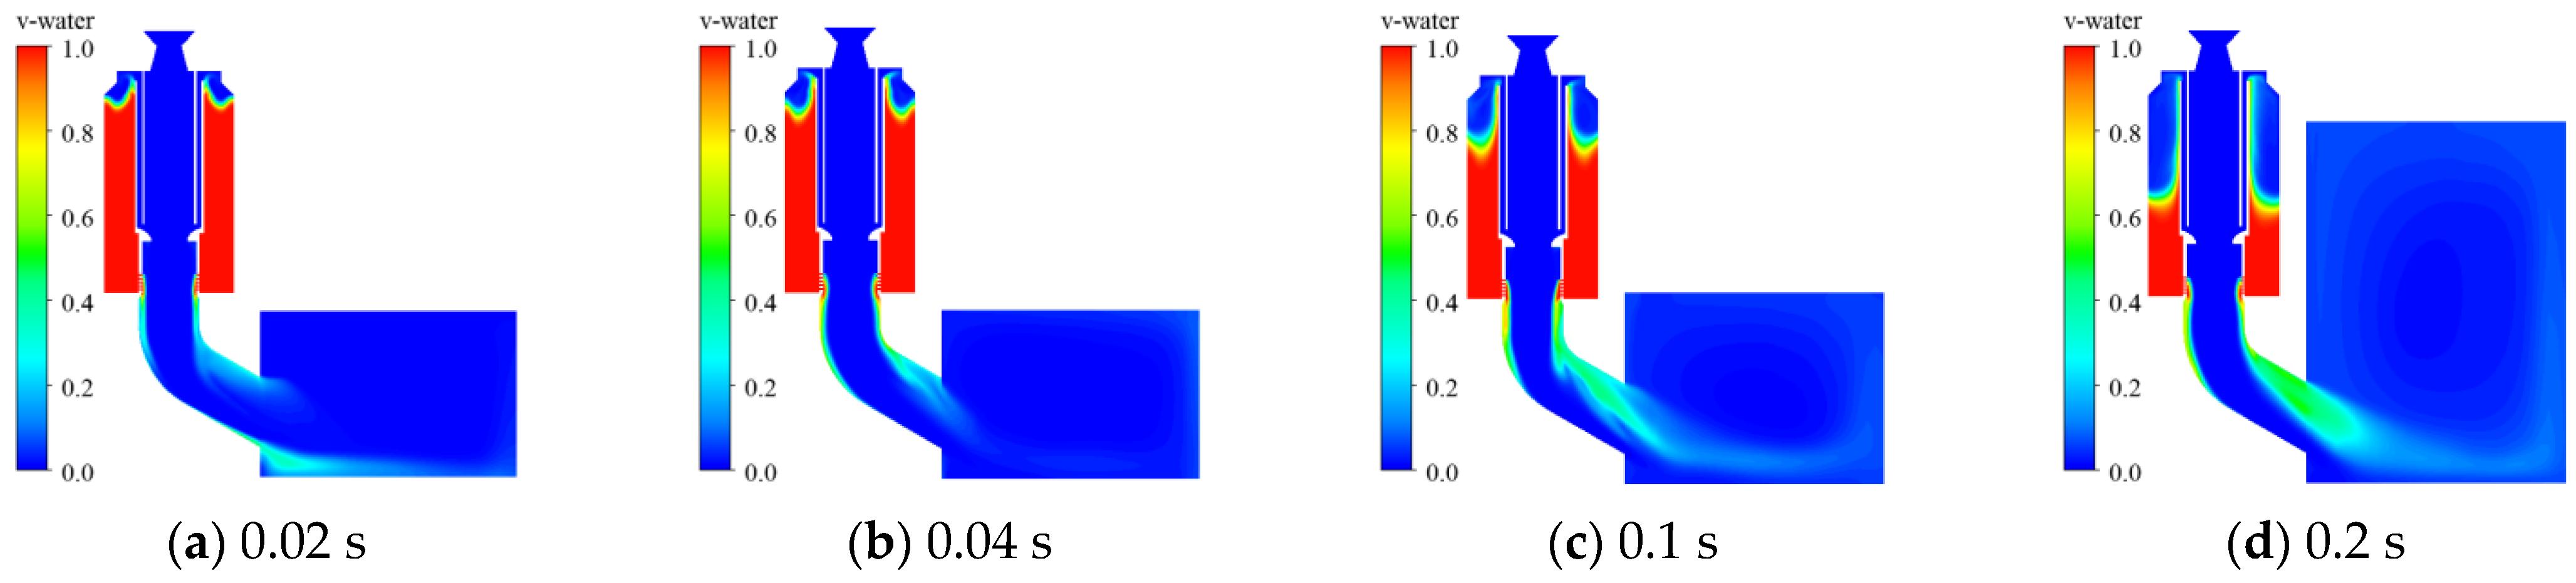
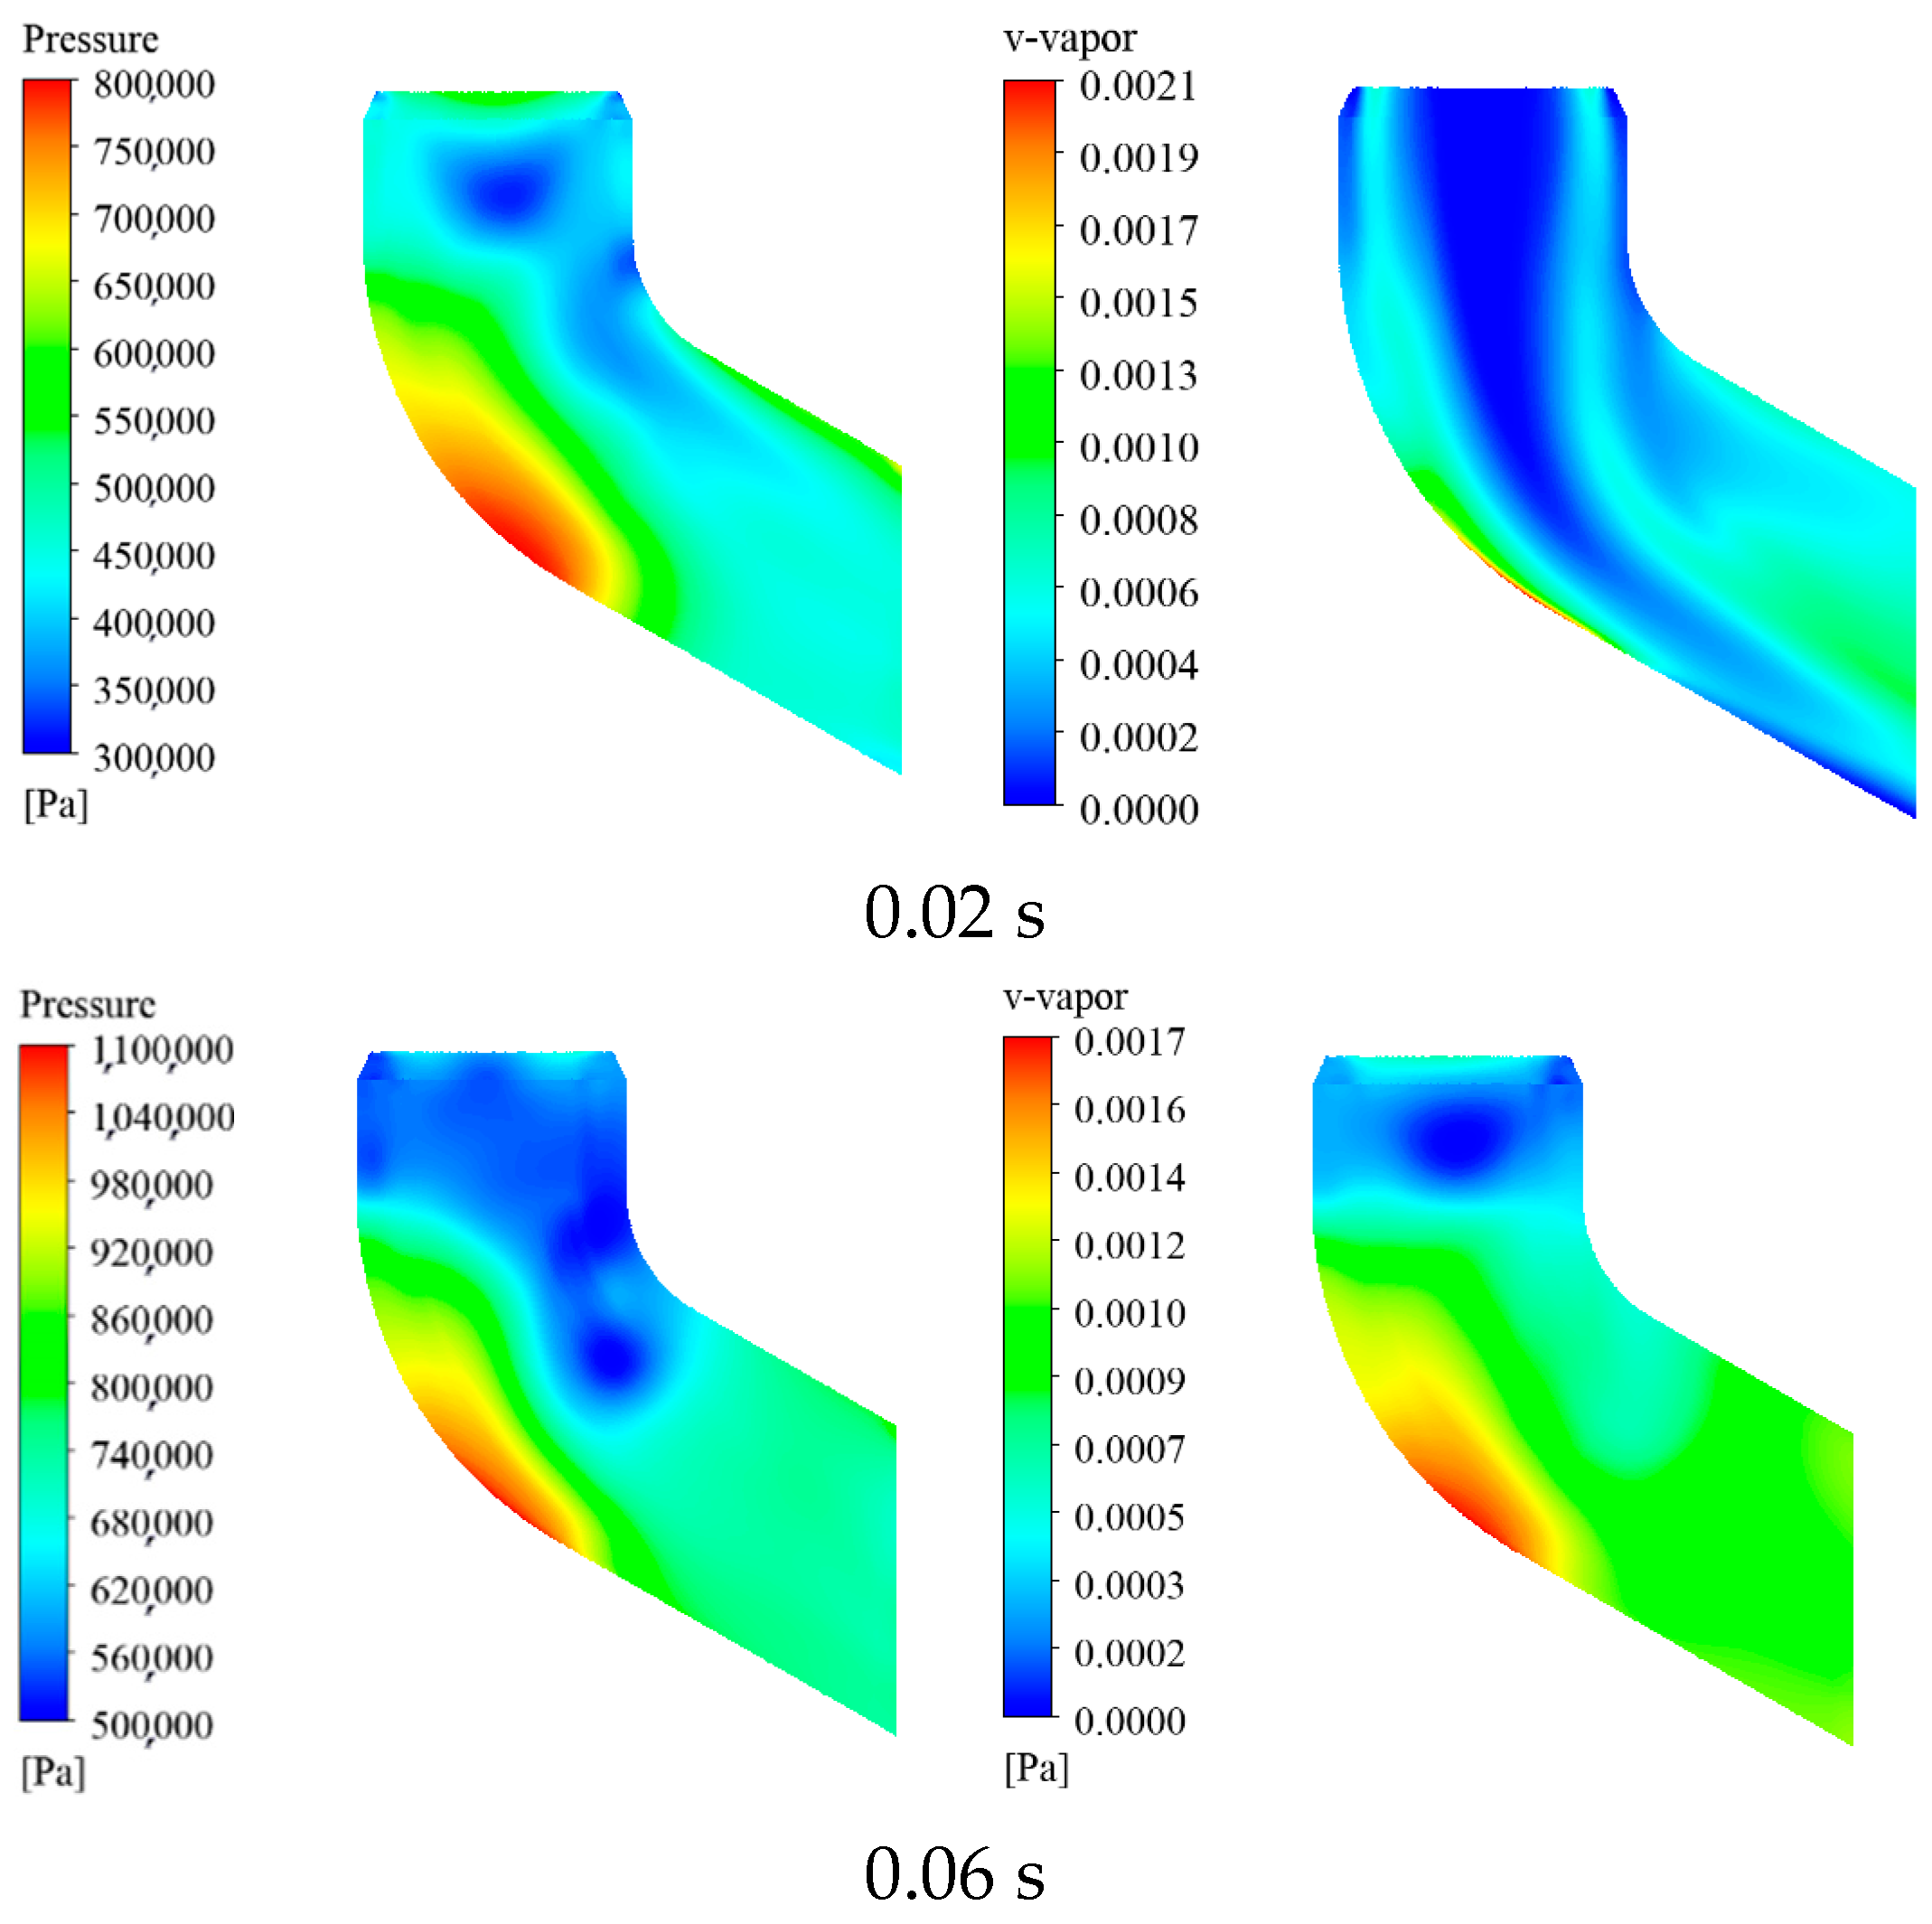
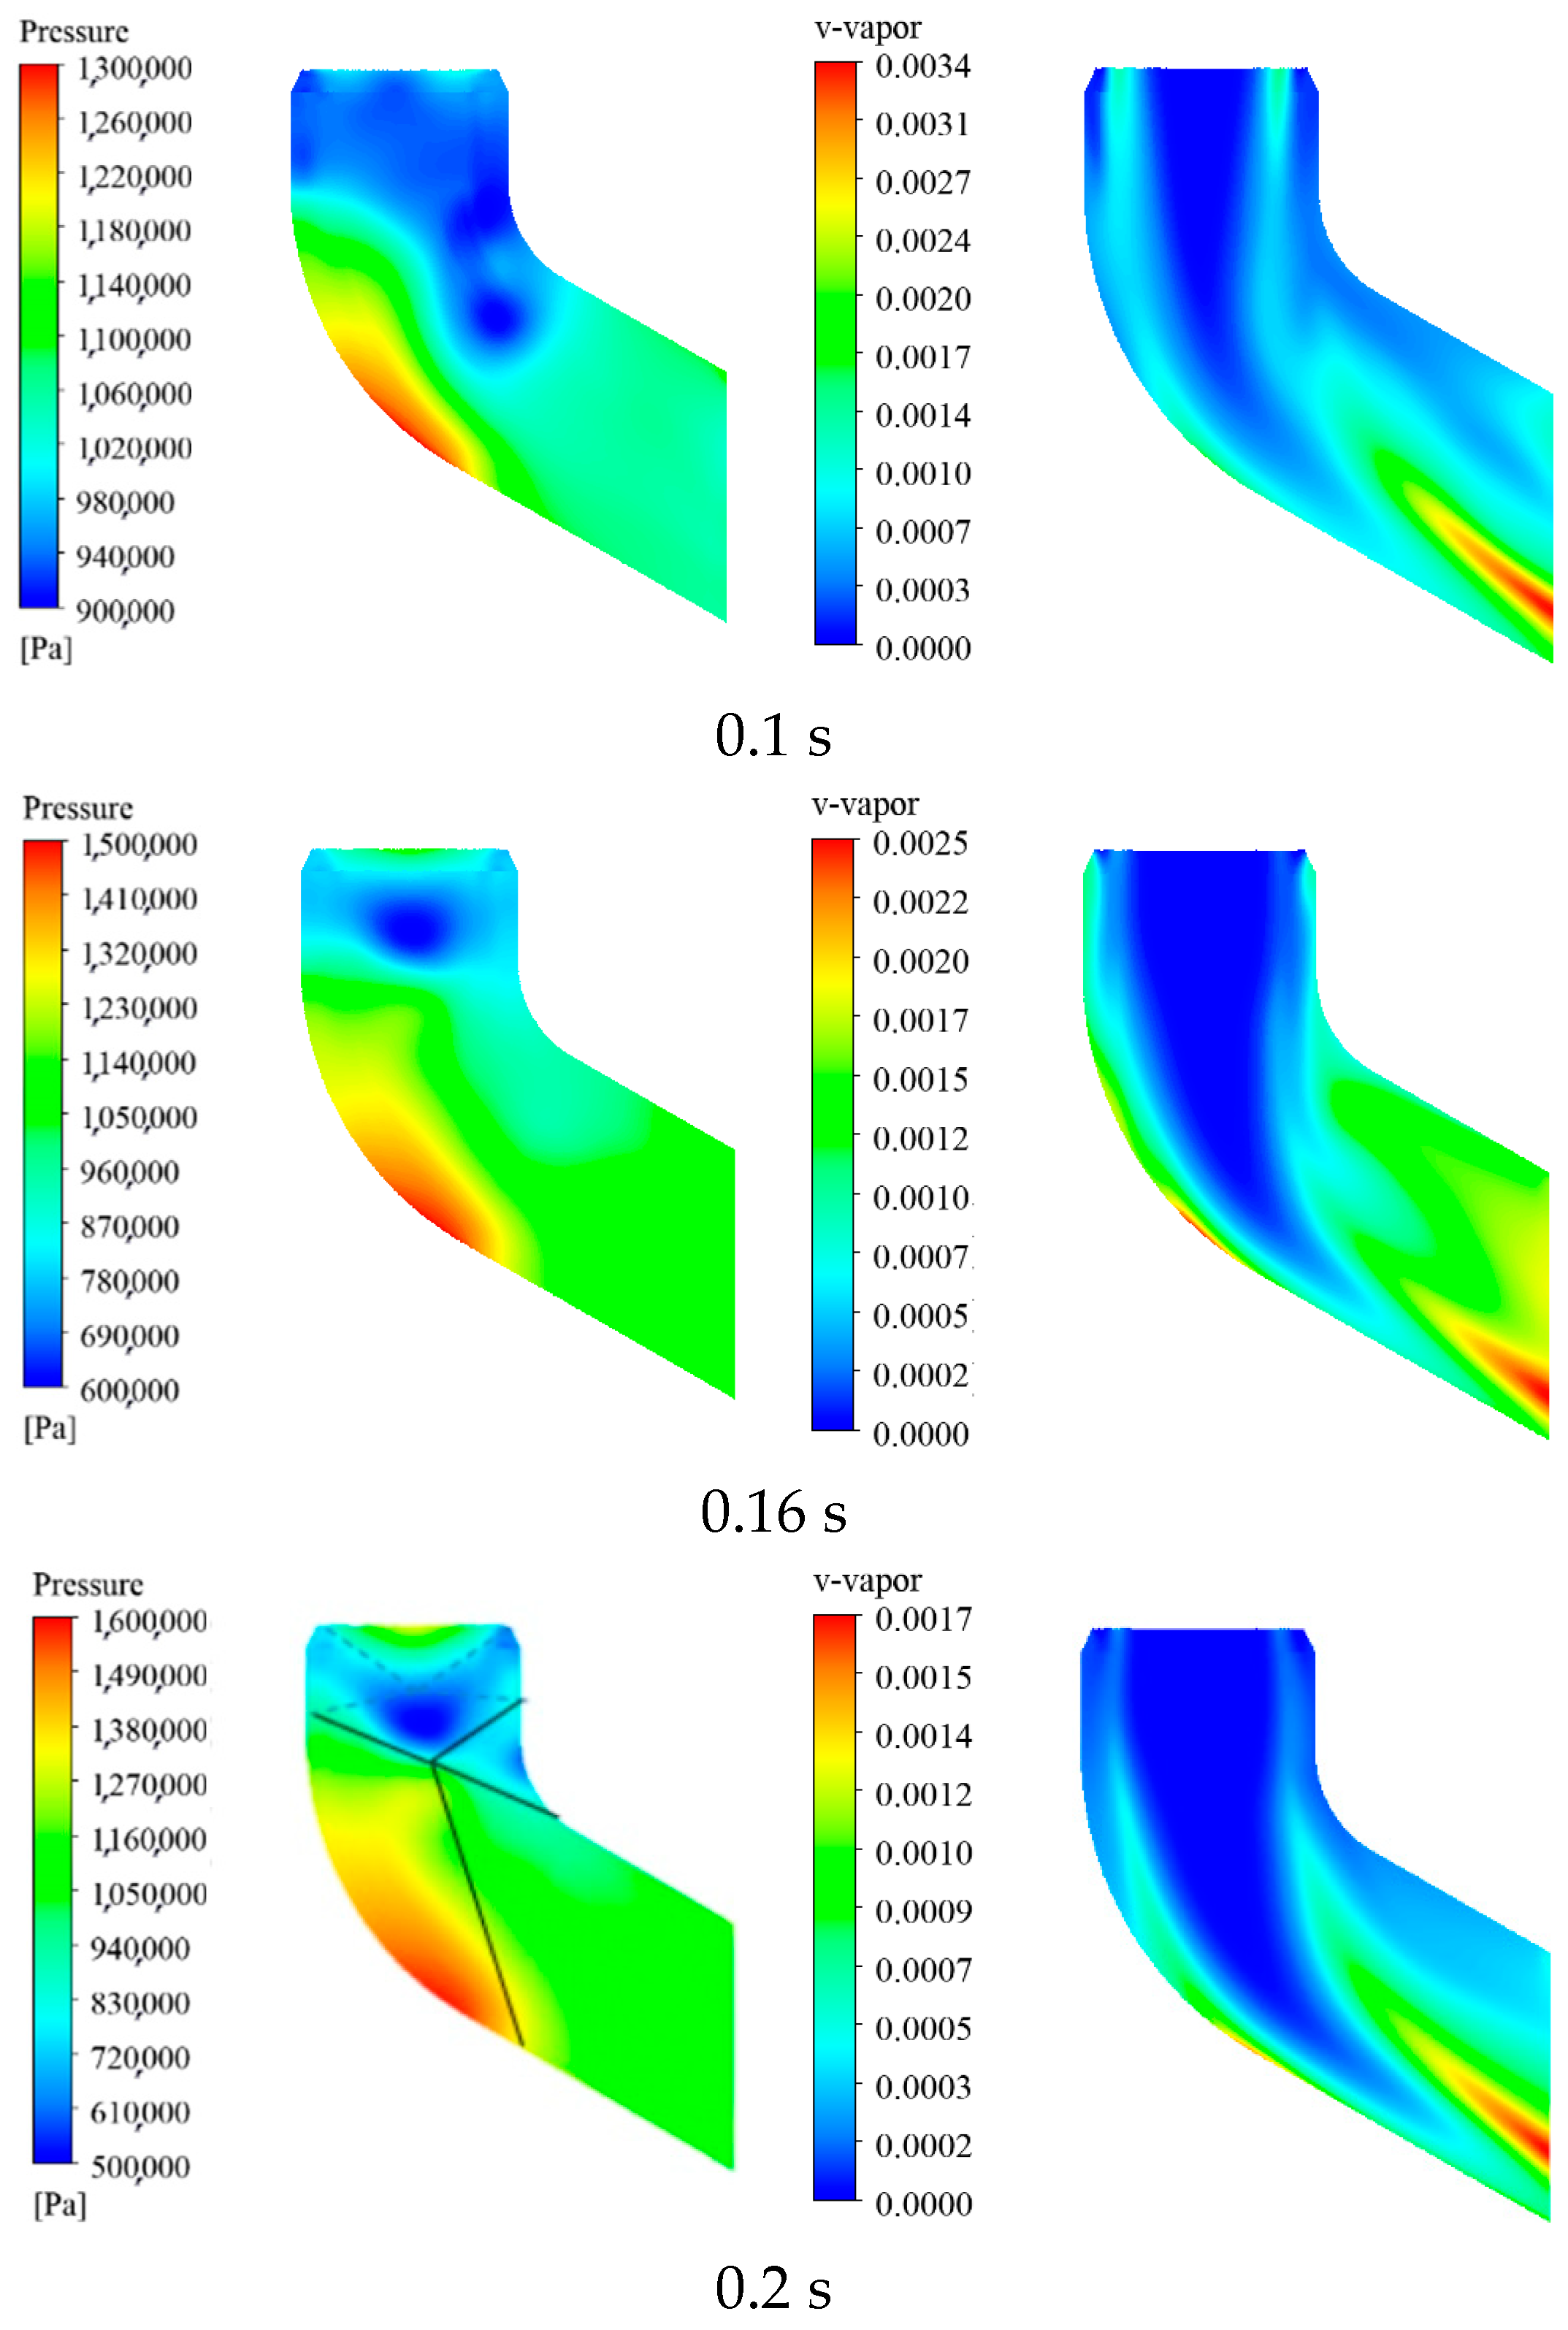
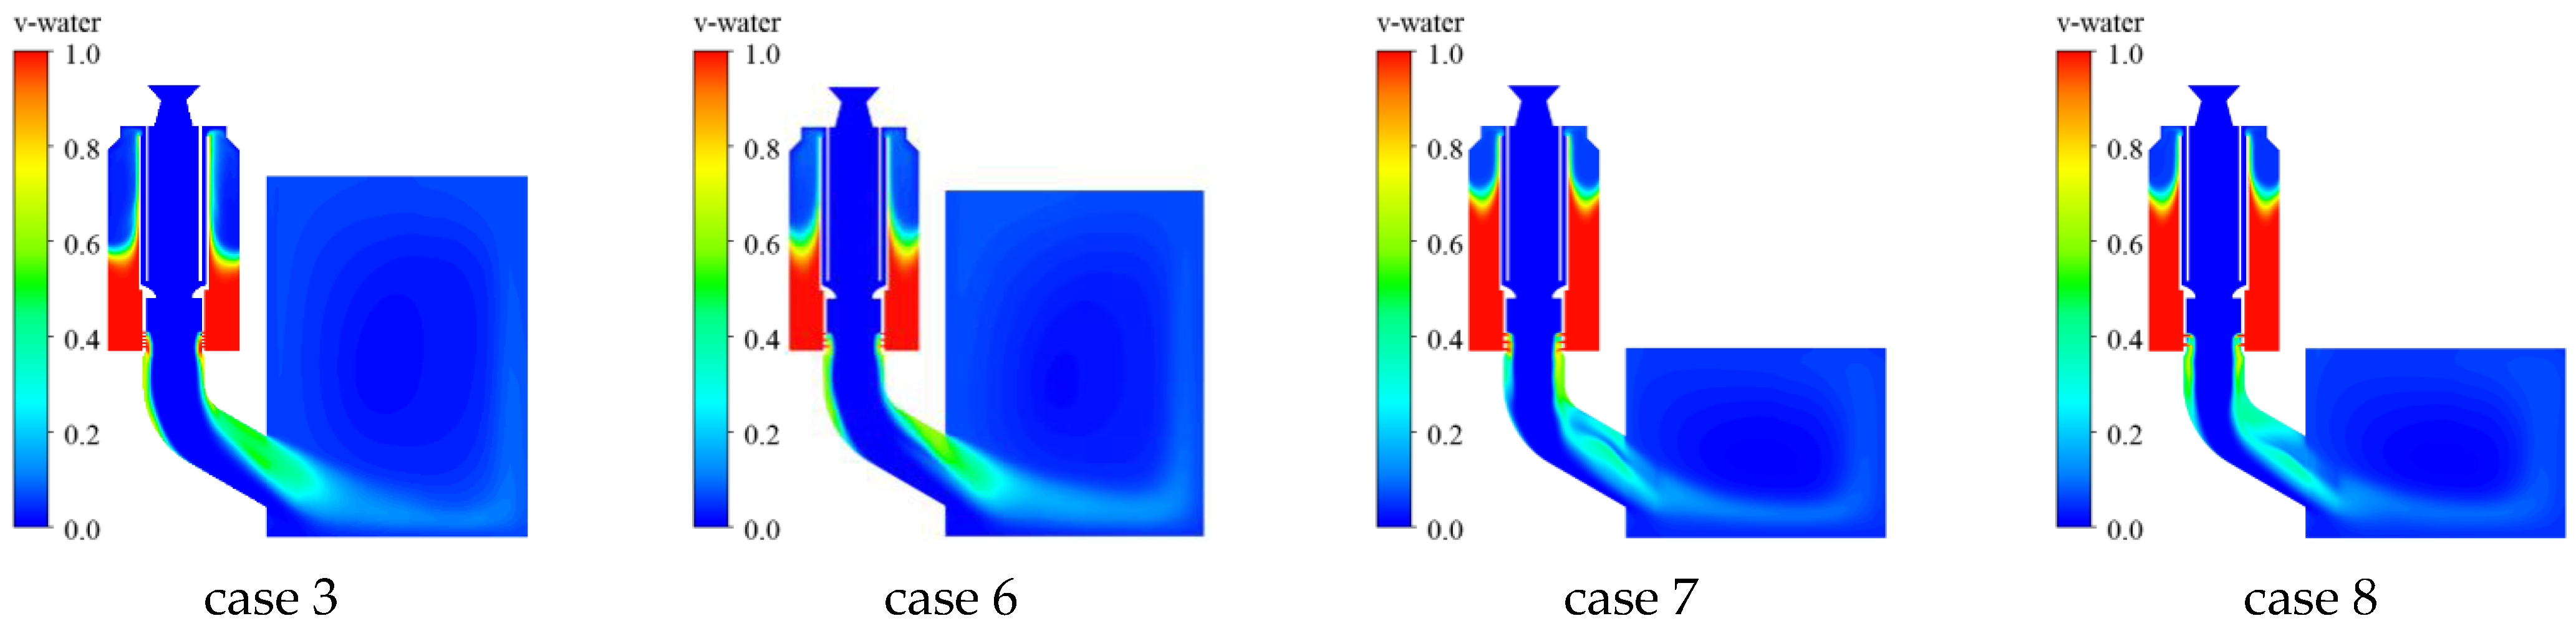
The water volume fraction distributions under different spray hole diameters are shown in Figure 19 and Figure 20. For smaller spray holes, the water flow rate acts better on the wall surface of the elbow [41]. The larger the diameter of the water spray hole, the greater the water flow in the water spray hole, and the stronger the inhibition effect on the gas impact under the action of gravity; so, it is not easy to flow along the inner wall surface of the elbow.
-
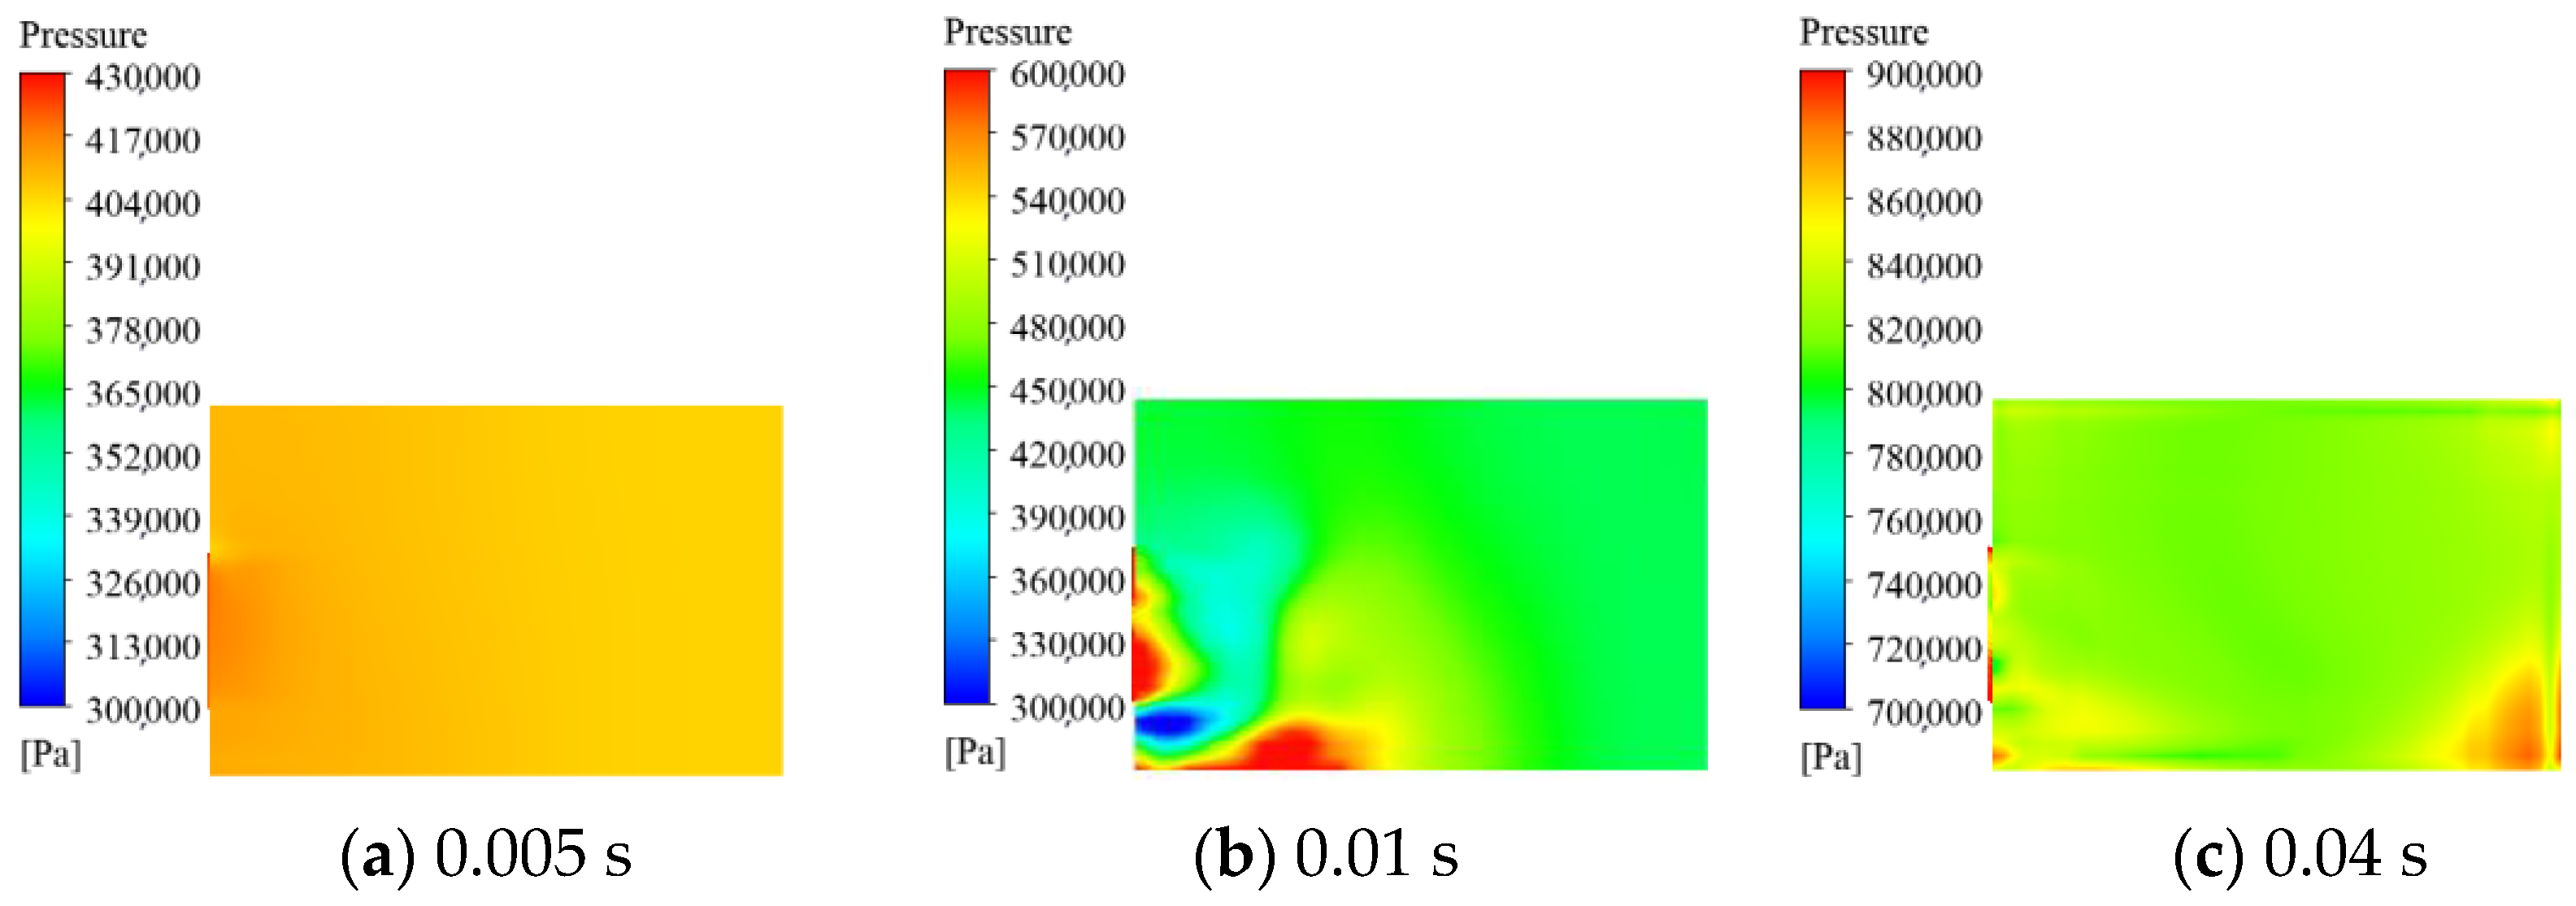
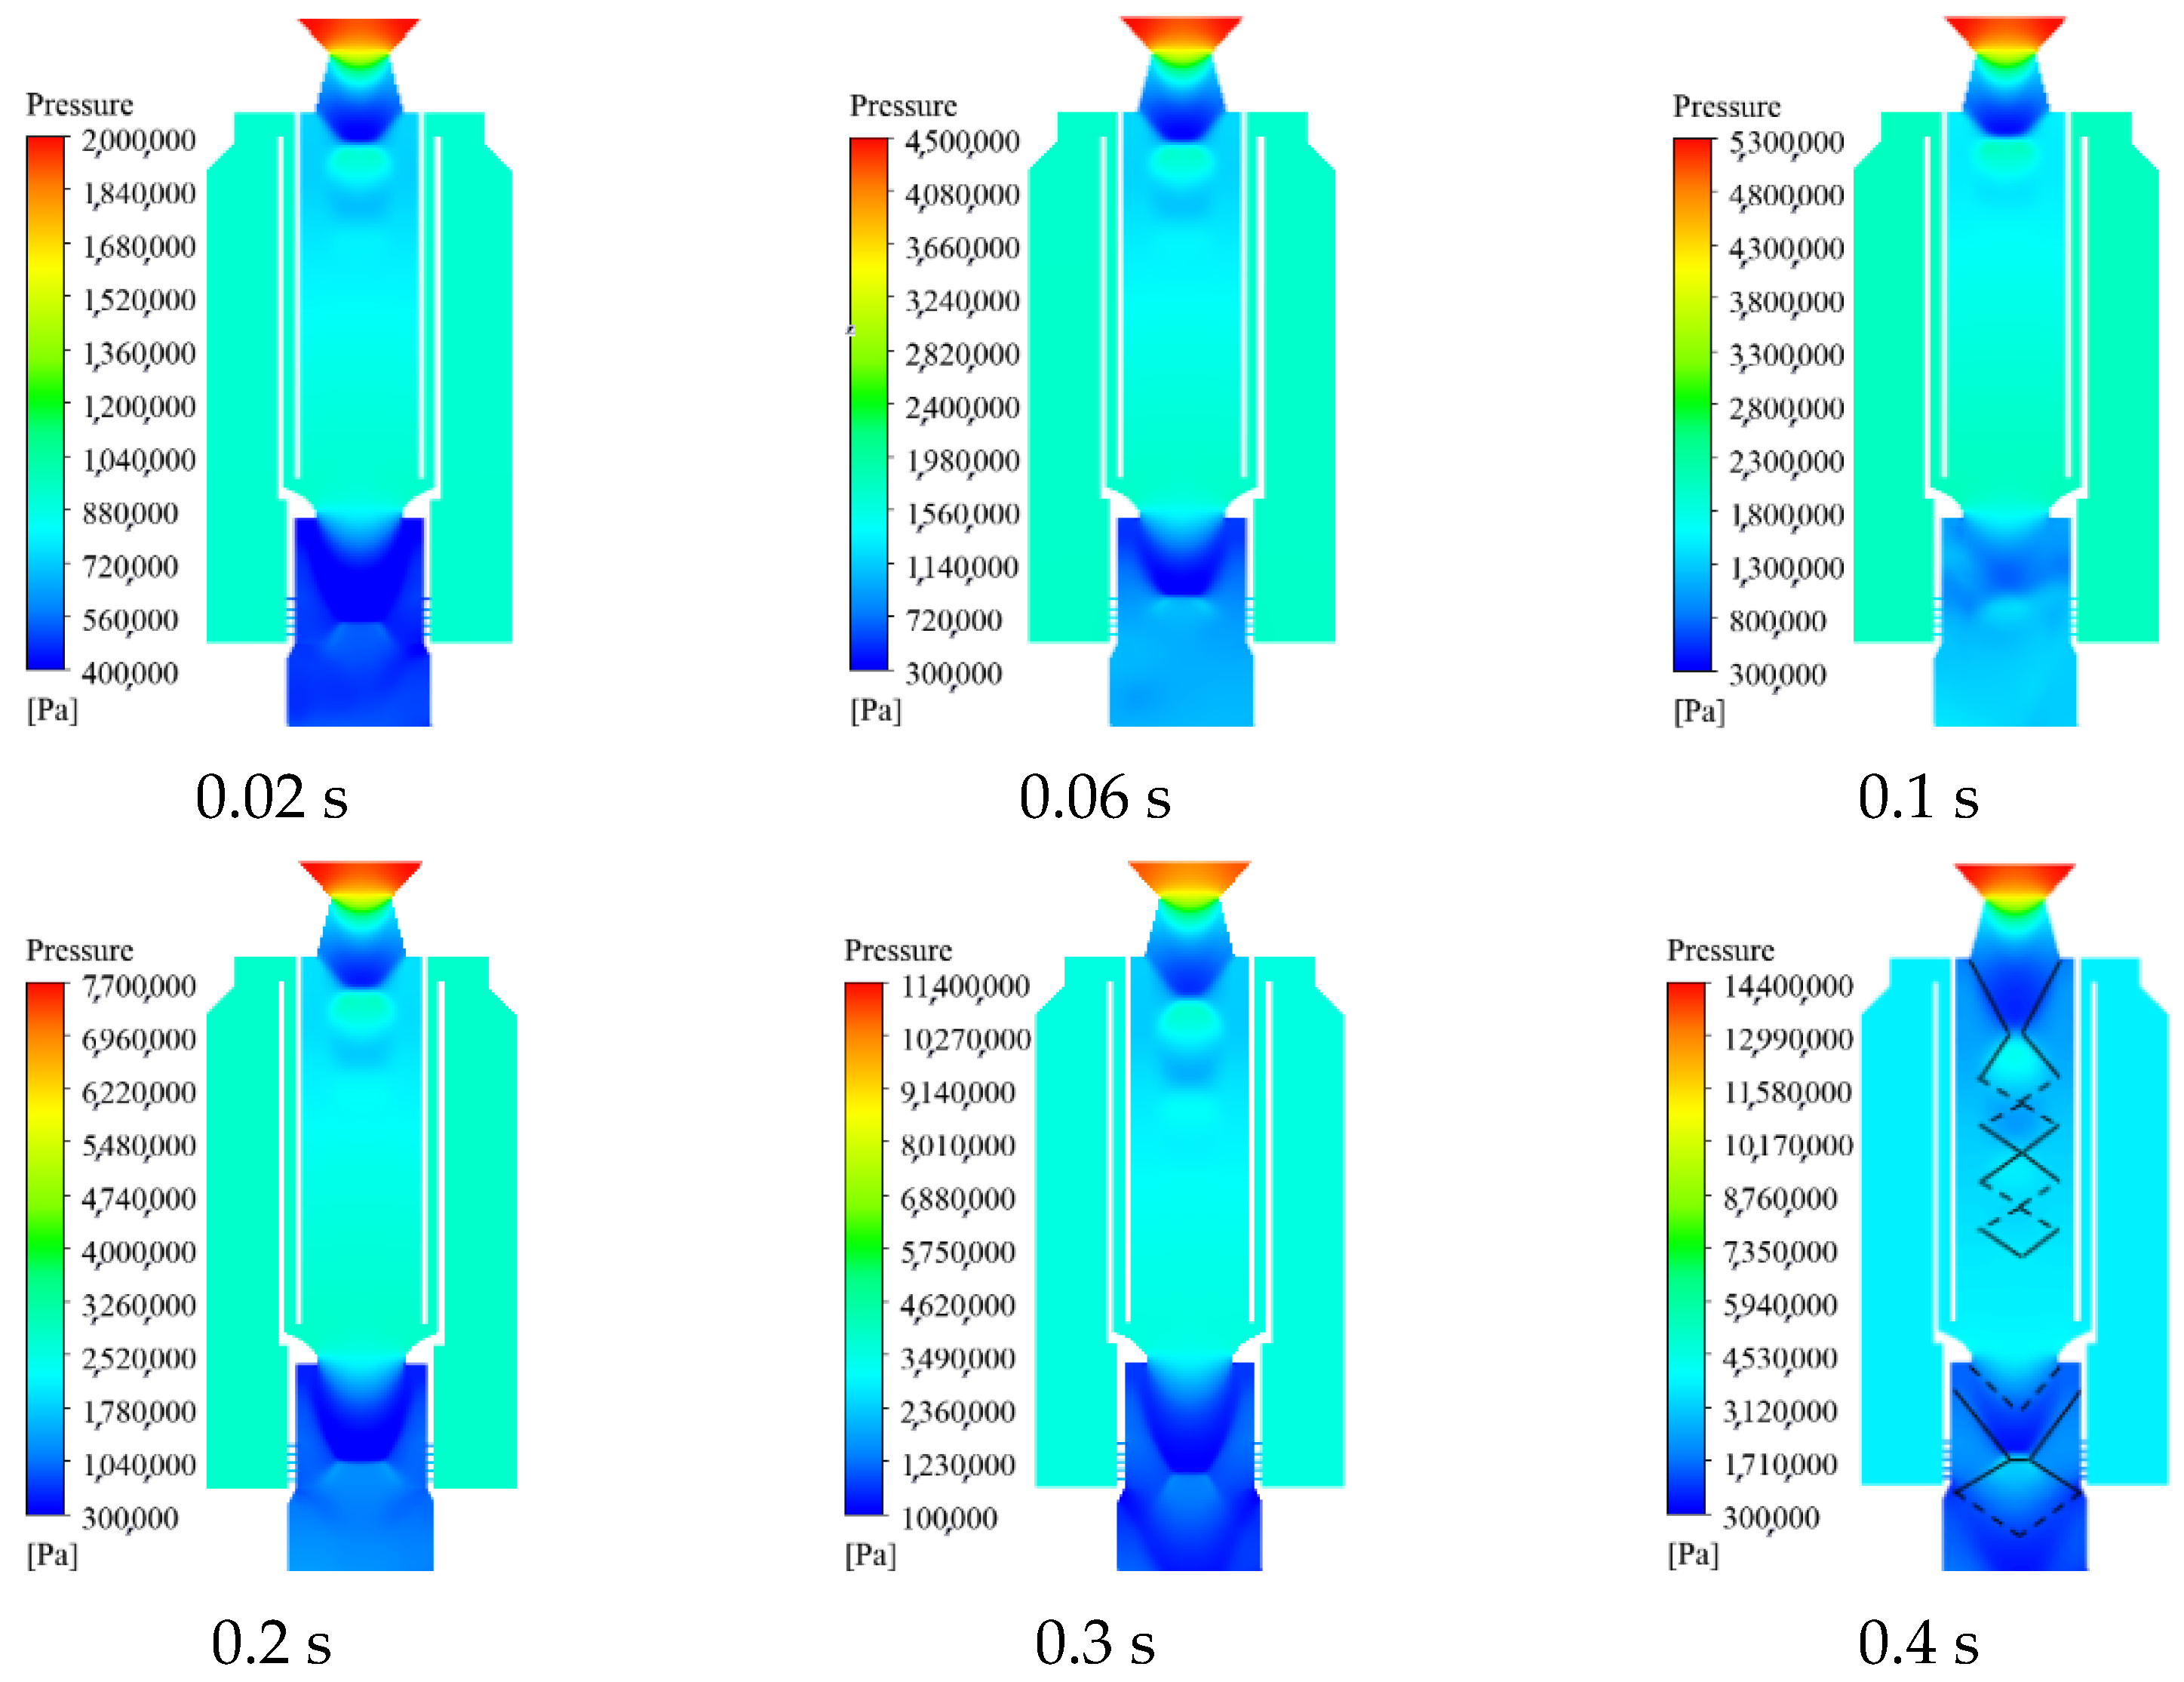
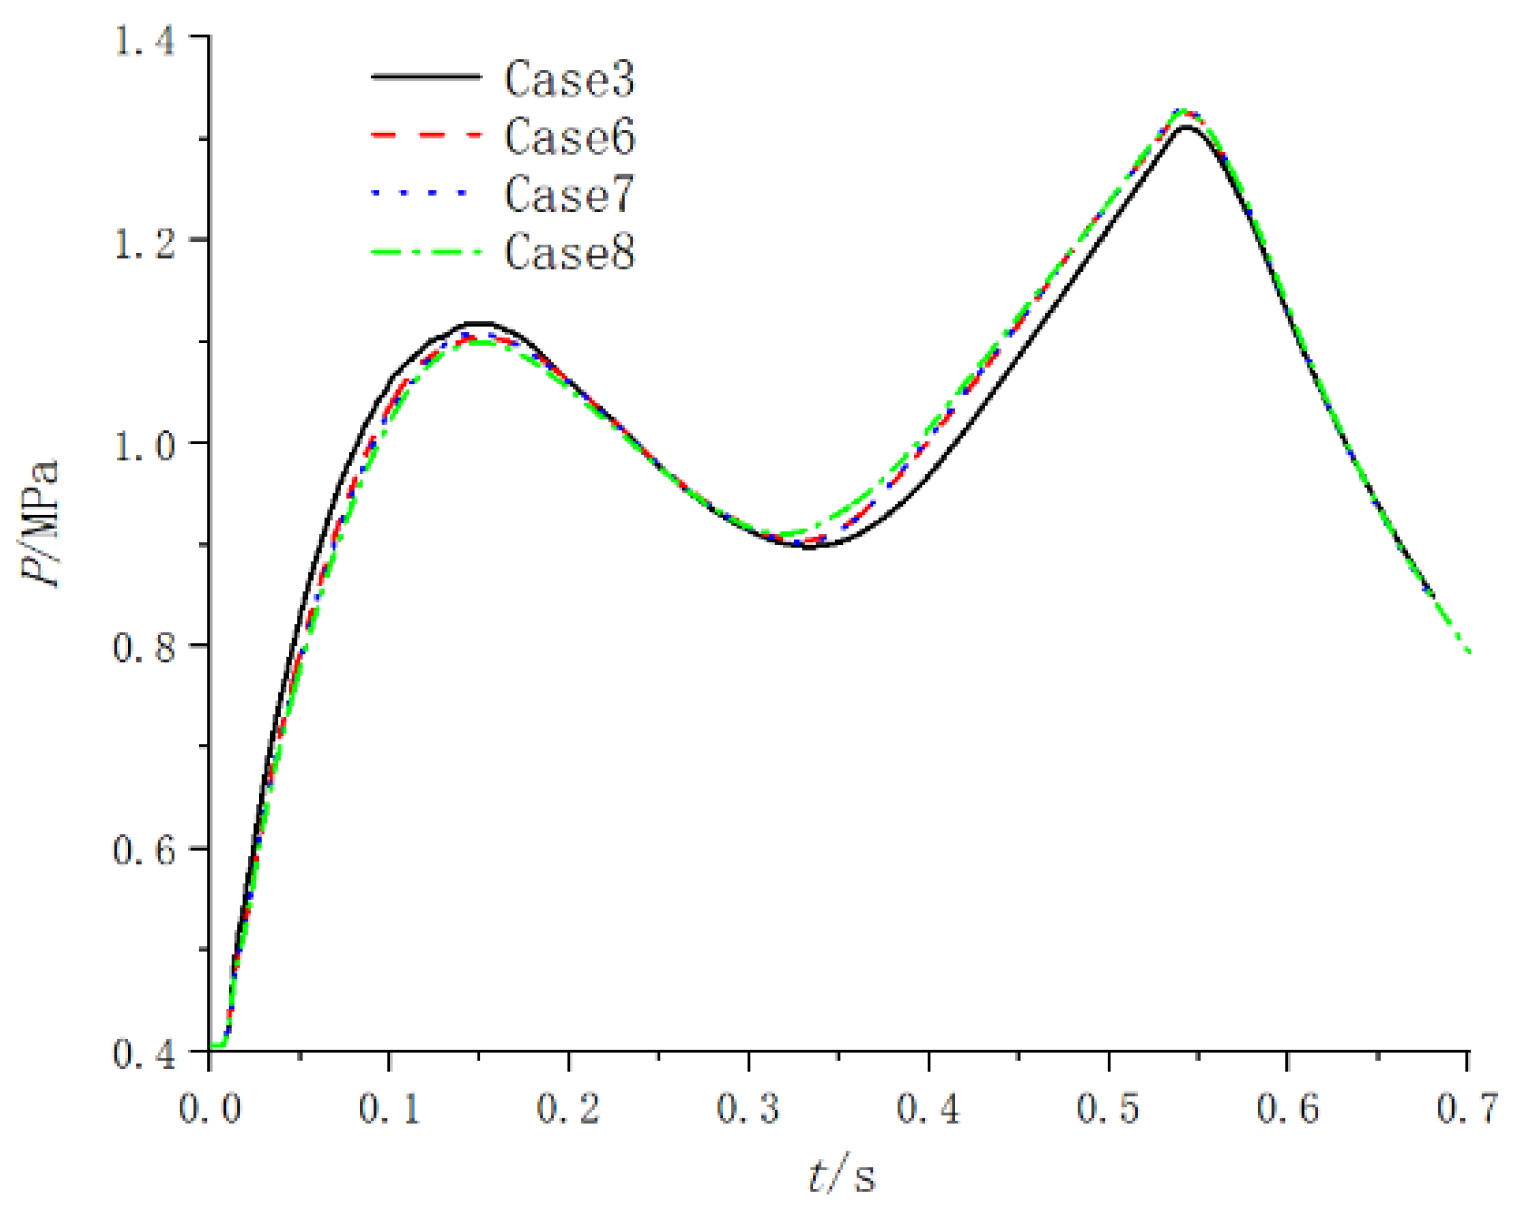
The average pressure in the launcher under different spray hole diameters is shown in Figure 21; it can be seen that the average pressure difference is relatively small. In Figure 21, there are two peaks in the pressure change inside the emission tube. The first peak is due to the continuous flow of gas into the launcher, and the missile has not yet moved; so, the pressure inside the launcher will continue to increase. When the missile begins to move, the pressure begins to decrease. The second peak is caused by the peak pressure of the gas generator at the corresponding time. The maximum pressure does not exceed 1.329 MPa during the ejection process.
Similarly, Figure 22 plots the average temperature of the gas–steam ejection flow field in the launcher under different spray hole diameters. It can be seen that the smaller the diameter of the spray hole, the more stable the corresponding temperature changes.
-
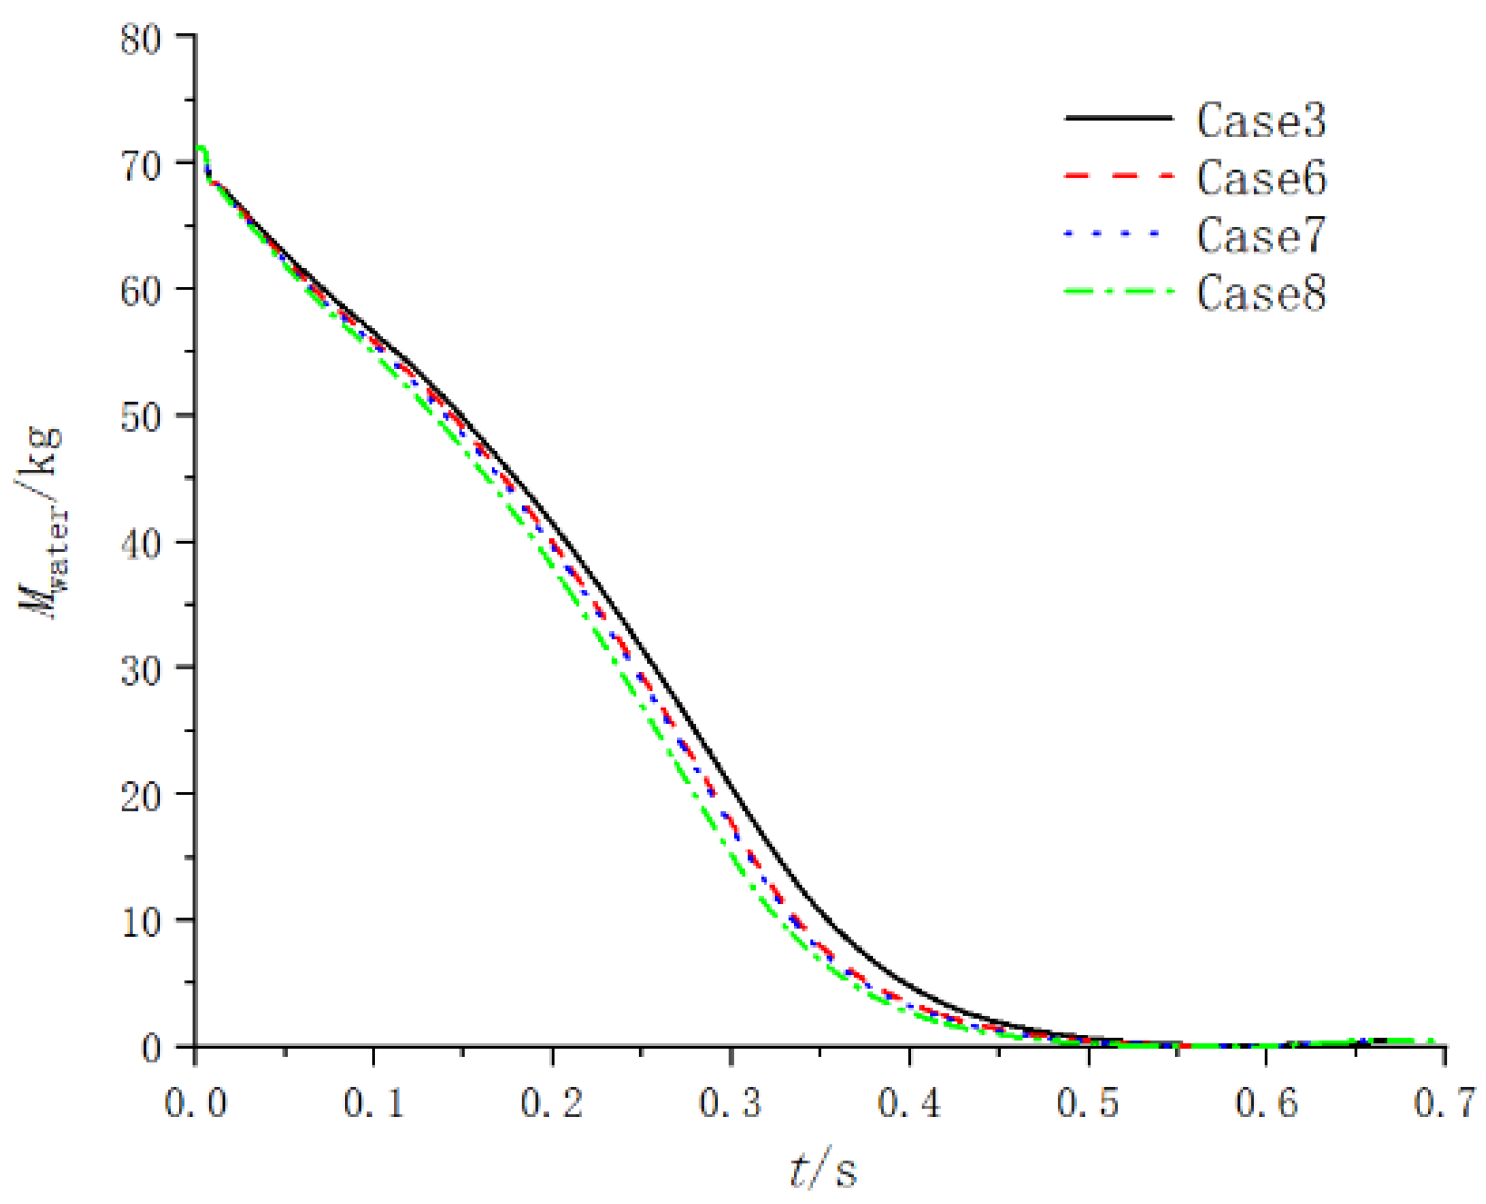
The changes in the total water mass in the launcher under different spray hole diameters are shown in Figure 23. In the early stages of the launch process, the larger diameter of the spray hole corresponds to a faster decrease in water flow quality, resulting in a lower temperature.
-
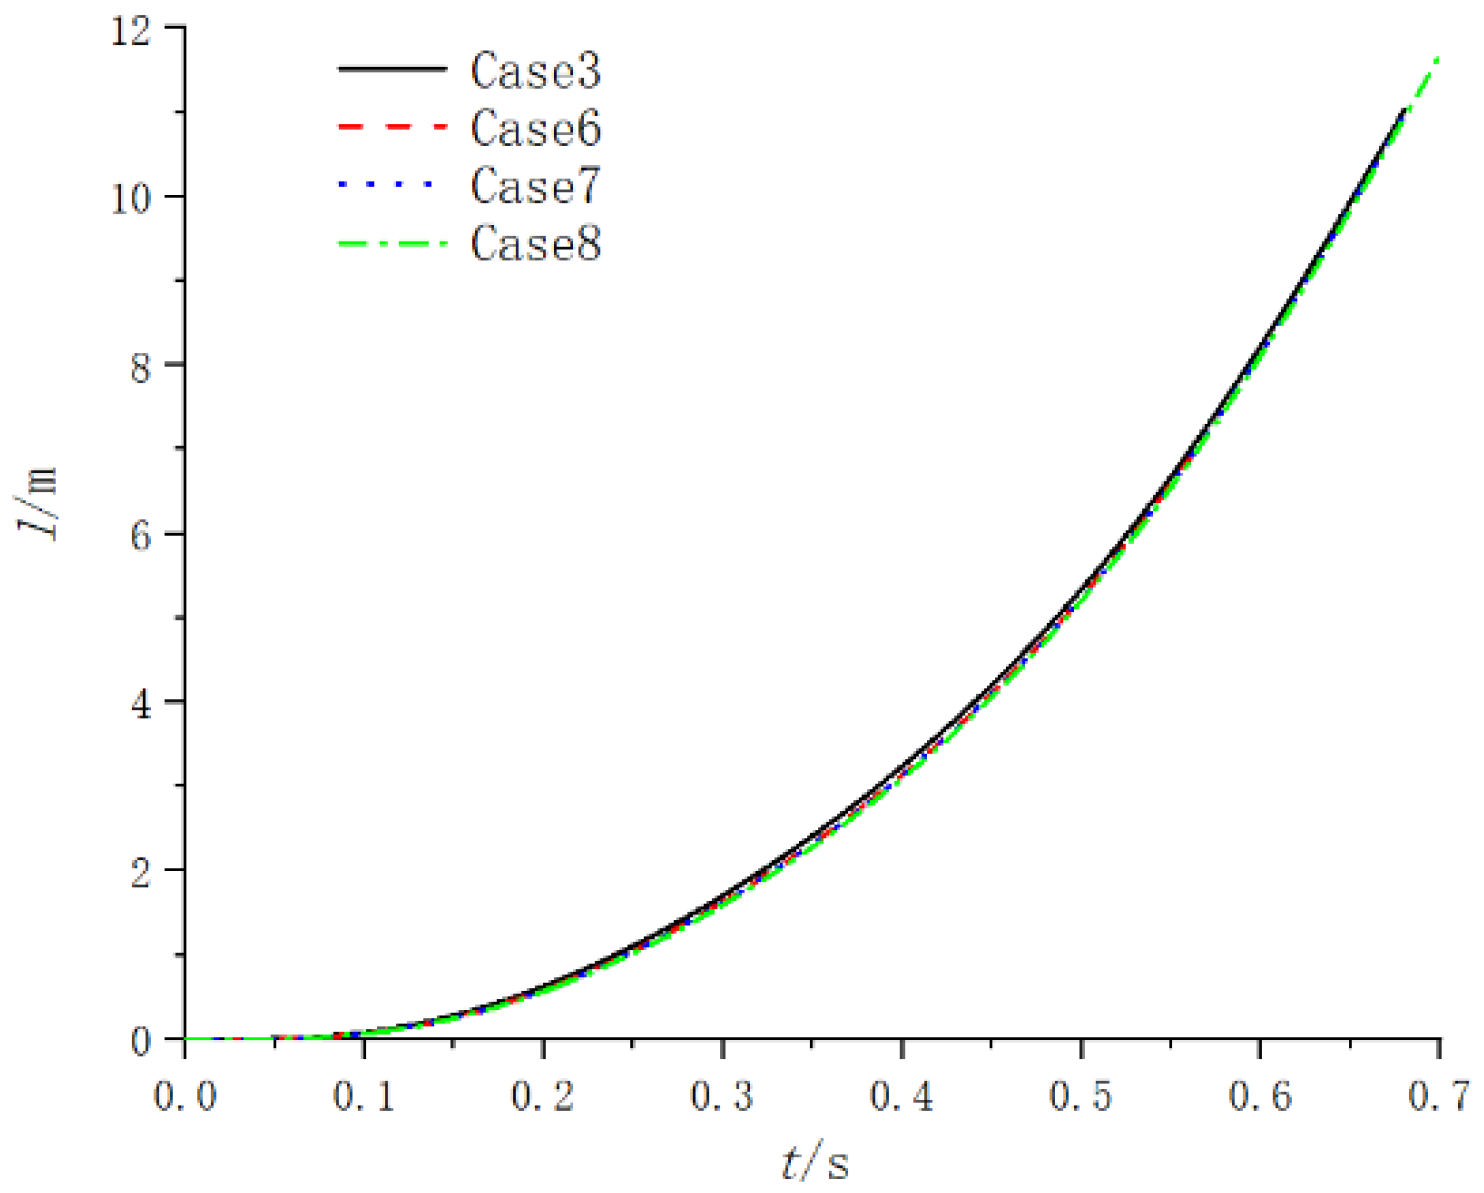
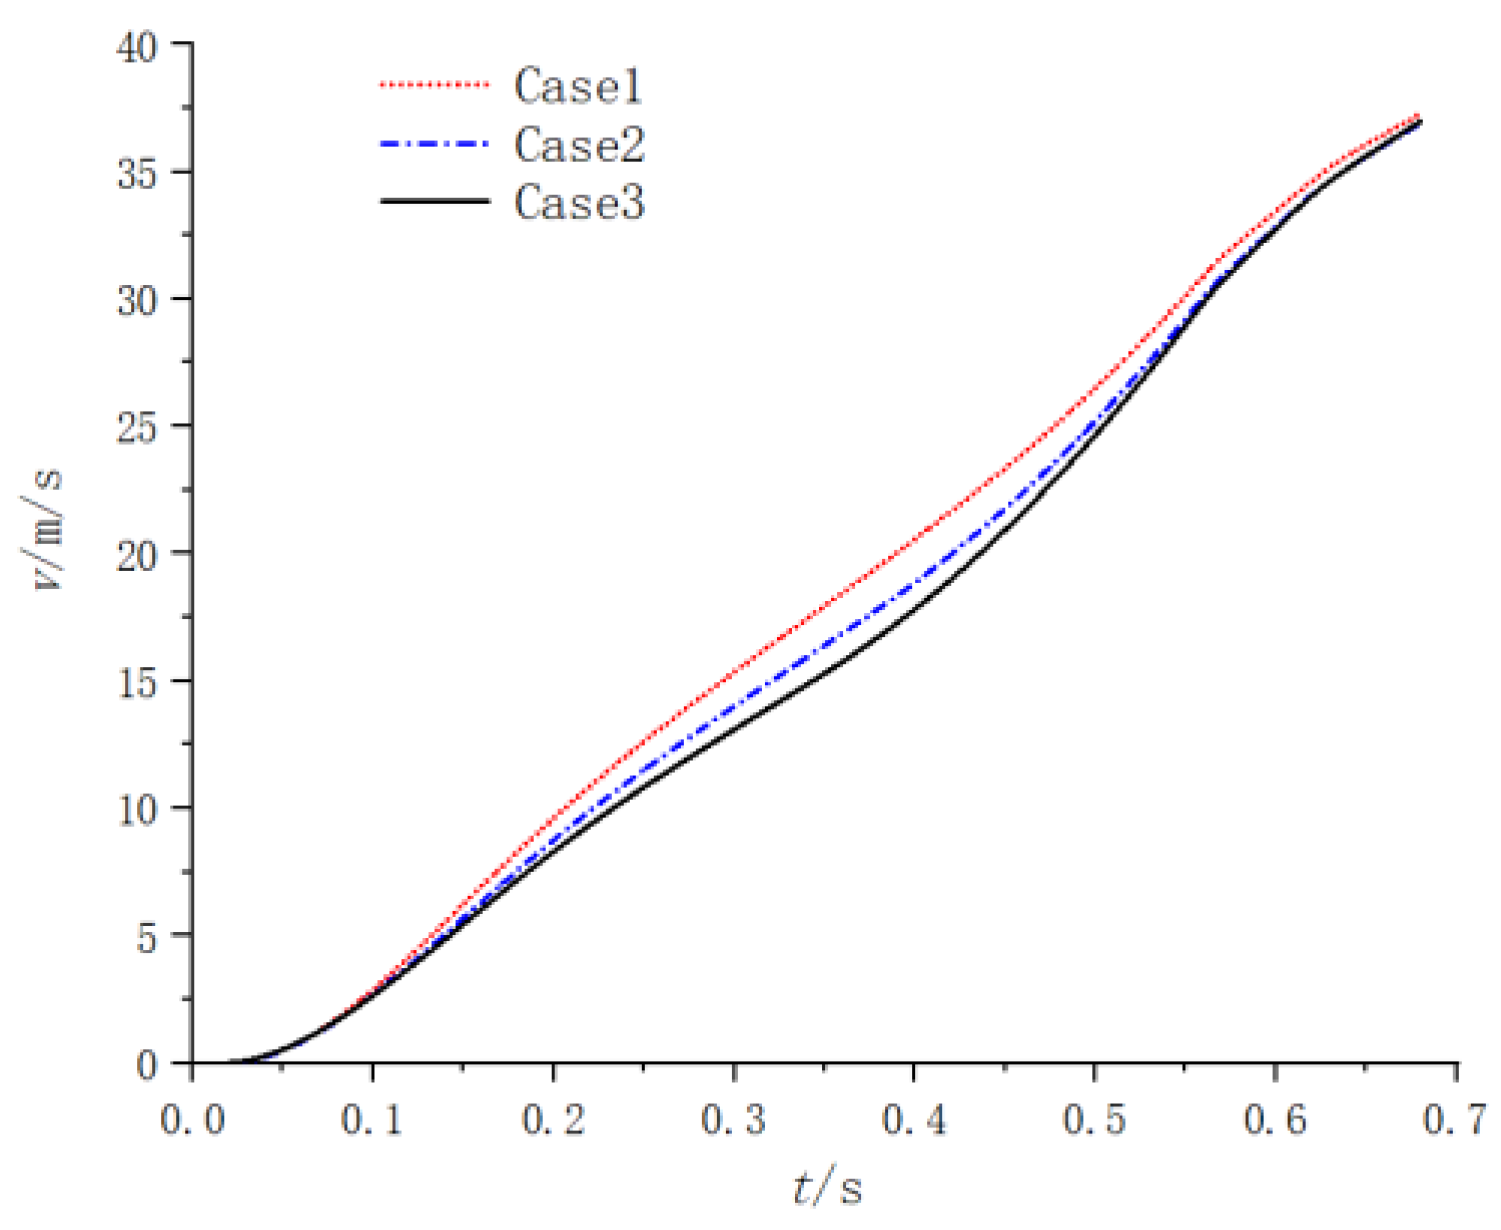
The acceleration, velocity and displacement curves of the projectile motion under different spray hole diameters are shown in Figure 24, Figure 25 and Figure 26. The difference between the interior ballistic curves corresponding to the four cases is very small. When the total spray area is fixed, the diameter of the spray hole has little influence on the flow field and internal ballistics characteristics of the gas–steam ejection device.
-
Next, the diameter of the spray hole is maintained unchanged, and the impact of total spray area on the gas–steam ejection flow field and launch tube ballistic parameters is studied. The change in total spray area is adjusted by the number of spray holes.
-
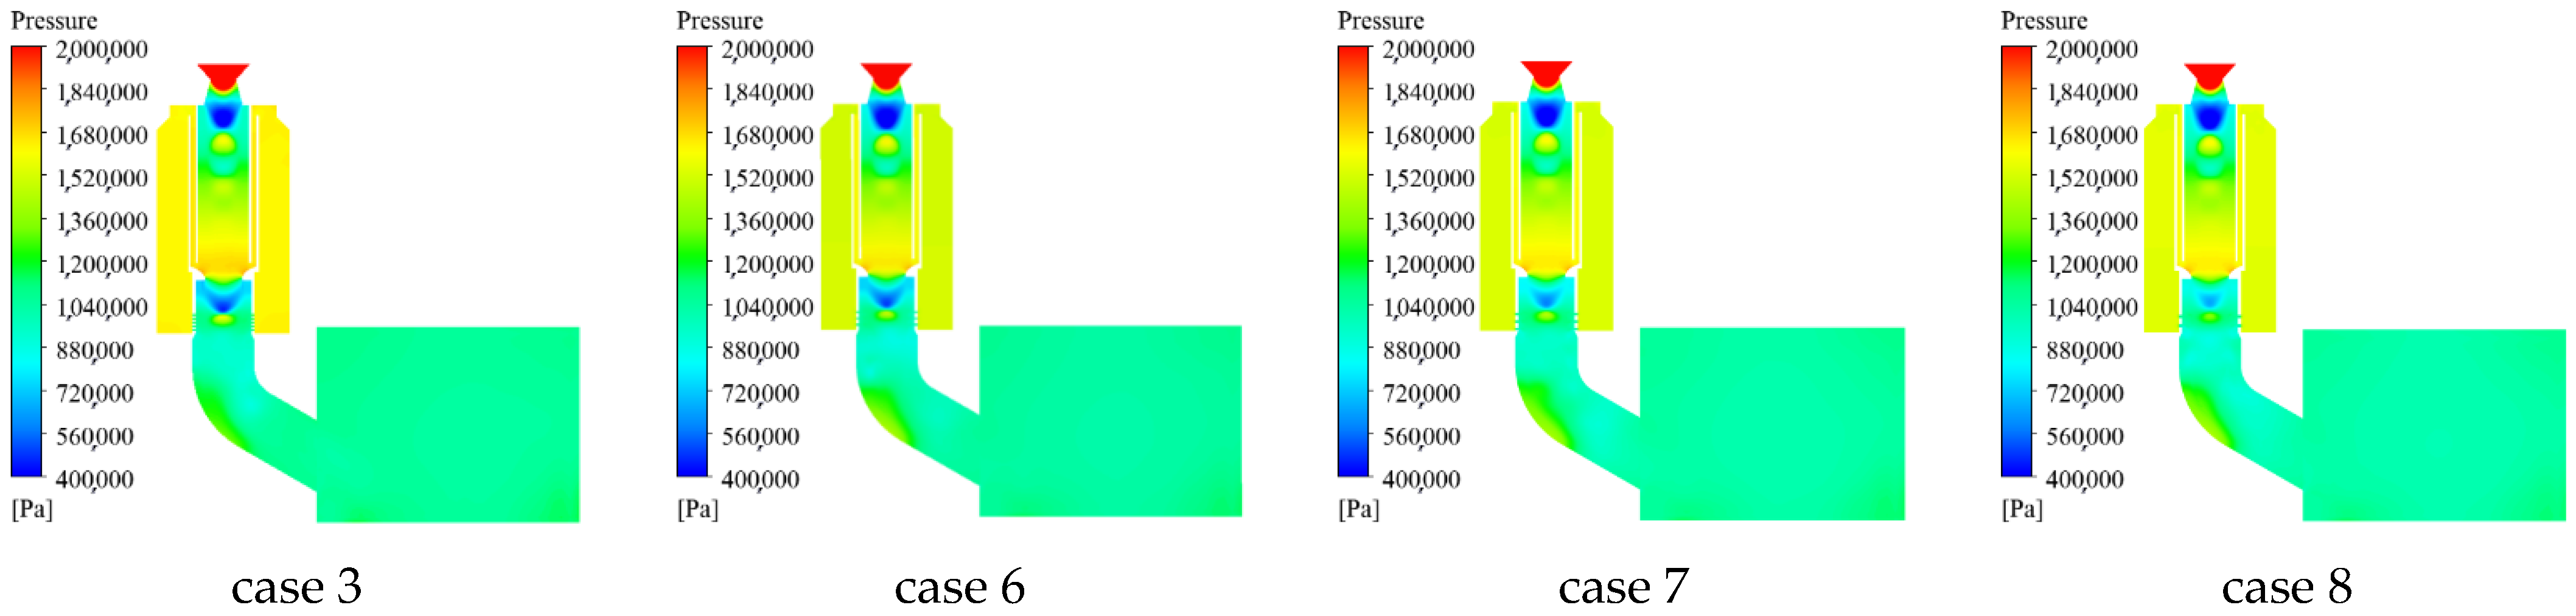
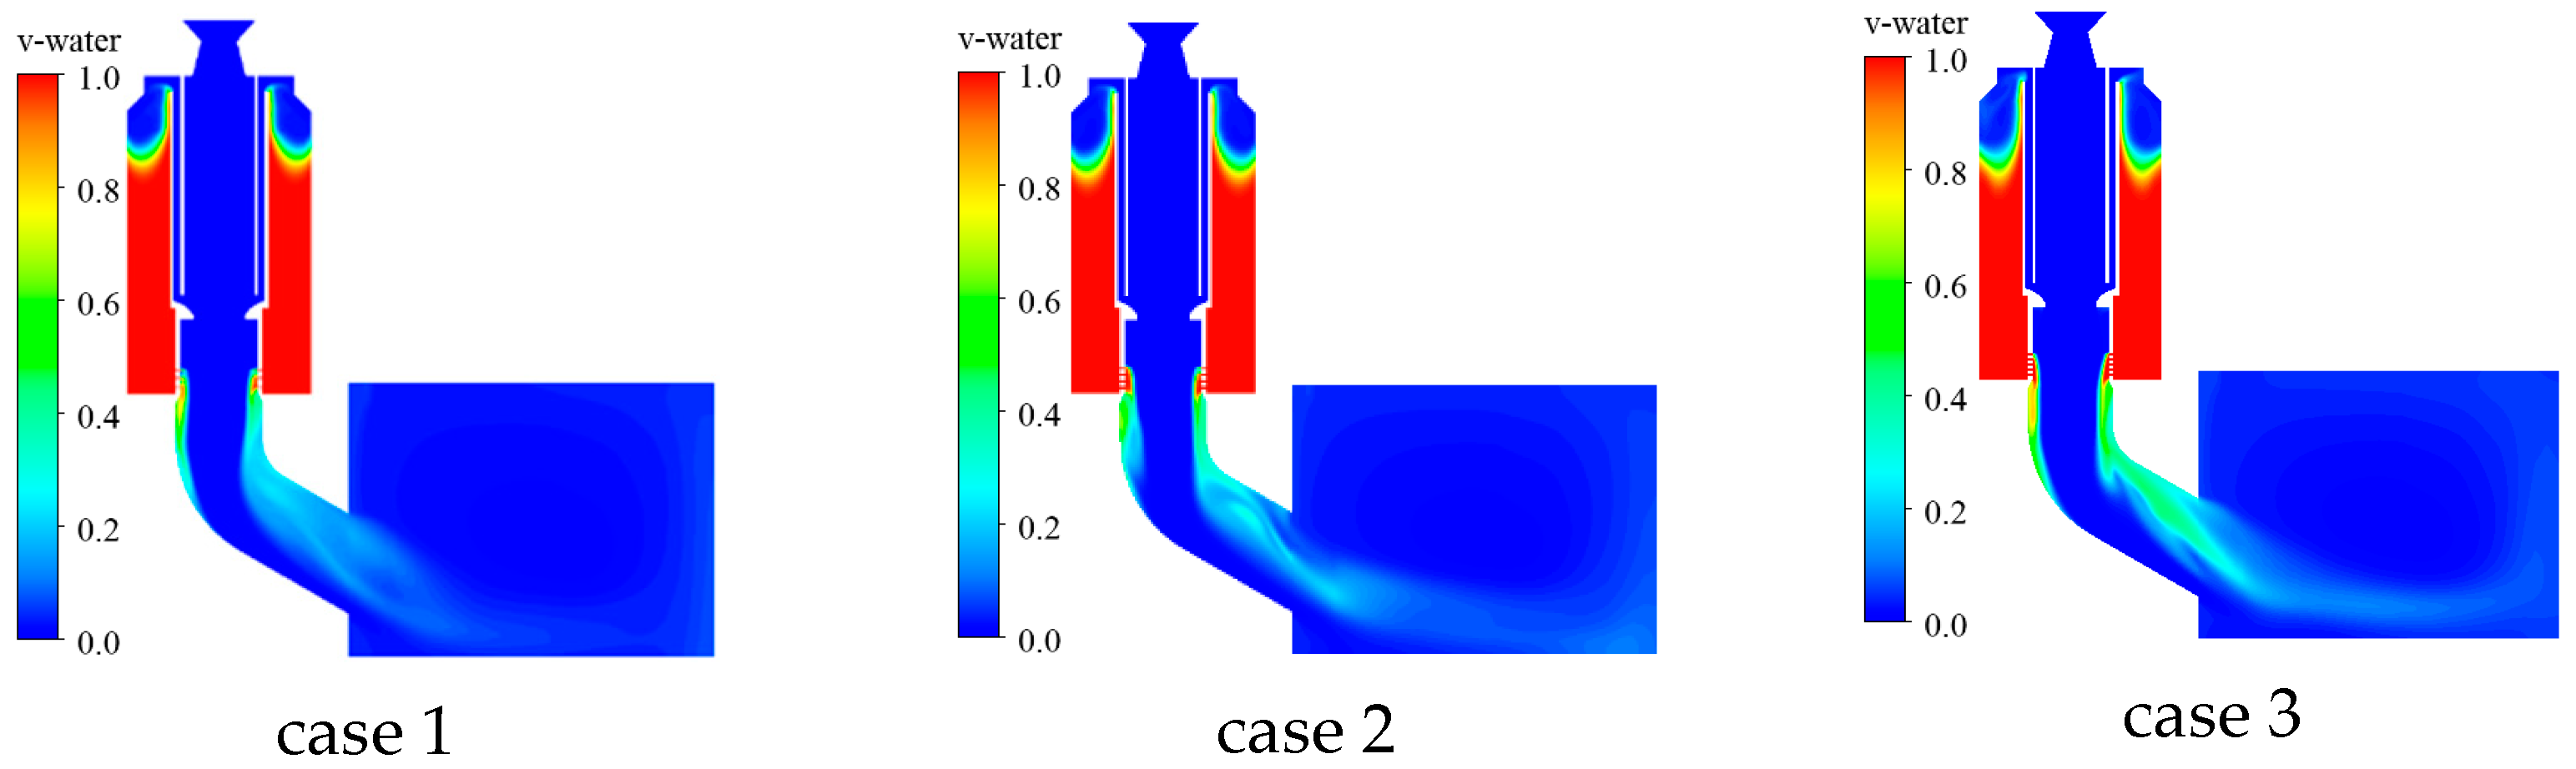
The pressure distribution within the device at two different times under different total spray areas is shown in Figure 27 and Figure 28. It can be seen from Figure 27 and Figure 28 that the larger total area there is, the lower the pressure of the ejection device. Since the number of spray holes is related to the spray flow rate, the more spray holes there are, the greater the spray flow rate value, resulting in a decrease in the pressure value.
The temperature distributions in the device at two different time instants under different total spray area are shown in Figure 29 and Figure 30. From Figure 27 and Figure 28, it can be seen that the temperature of the power device is basically the same, but the heat absorbed by the gas in the launcher varies due to the difference in water volume. The larger the water volume per unit time, the lower the average temperature inside the launcher. Therefore, the temperature value inside the launcher under case 3 is lower.
Figure 31 and Figure 32 are contours of water volume fraction in the device at two different times under different total spray area. From Figure 31 and Figure 32, it can be seen that the flow rate of water decreases as the number of spray holes is reduced. As a result, the remaining water volume in the water chamber under case 3 is the smallest.
The average pressure distribution inside the launch cylinder under different total spray areas is shown in Figure 33. It can be seen from Figure 31 that the pressure distribution is approximately consistent under the three cases. However, due to the different spray rates, the pressure in case 1 during the initial pressure rise to peak is higher than that in case 3. The first peak pressure in case 3 is the smallest. Due to the constant total amount of water, after a certain period of missile movement, the water in case 3 is first consumed. Since there is no further vaporization of liquid water, the second peak pressure in case 3 is the largest. The difference in the peak pressure inside the launcher of case 1 is the smallest, and therefore case 1 is the most stable.
The average temperature inside the launcher under different total spray areas is shown in Figure 34. From Figure 34, it can be seen that the temperature change in case 1 is smooth, while the temperature in case 3 is generally lower than other cases. The changes in the mass of water under different total spray areas are shown in Figure 35. From Figure 35, it can be seen that the more spray holes there are, the faster the decrease in water flow quality during the initial launch stage, resulting in a lower temperature in case 3. However, since the total water volume is constant, the final stable temperature is basically the same.
The acceleration, velocity, and displacement curves of the projectile motion under different total spray areas are shown in Figure 36, Figure 37 and Figure 38, and the corresponding acceleration in case 1 appears linear.

4.2. Influence of Throat

In this section, the total area and amount of water injection of the control total spray hole are kept constant, and the influence of the throat area change in the secondary nozzle on the flow field and the internal ballistics parameters is studied.
-
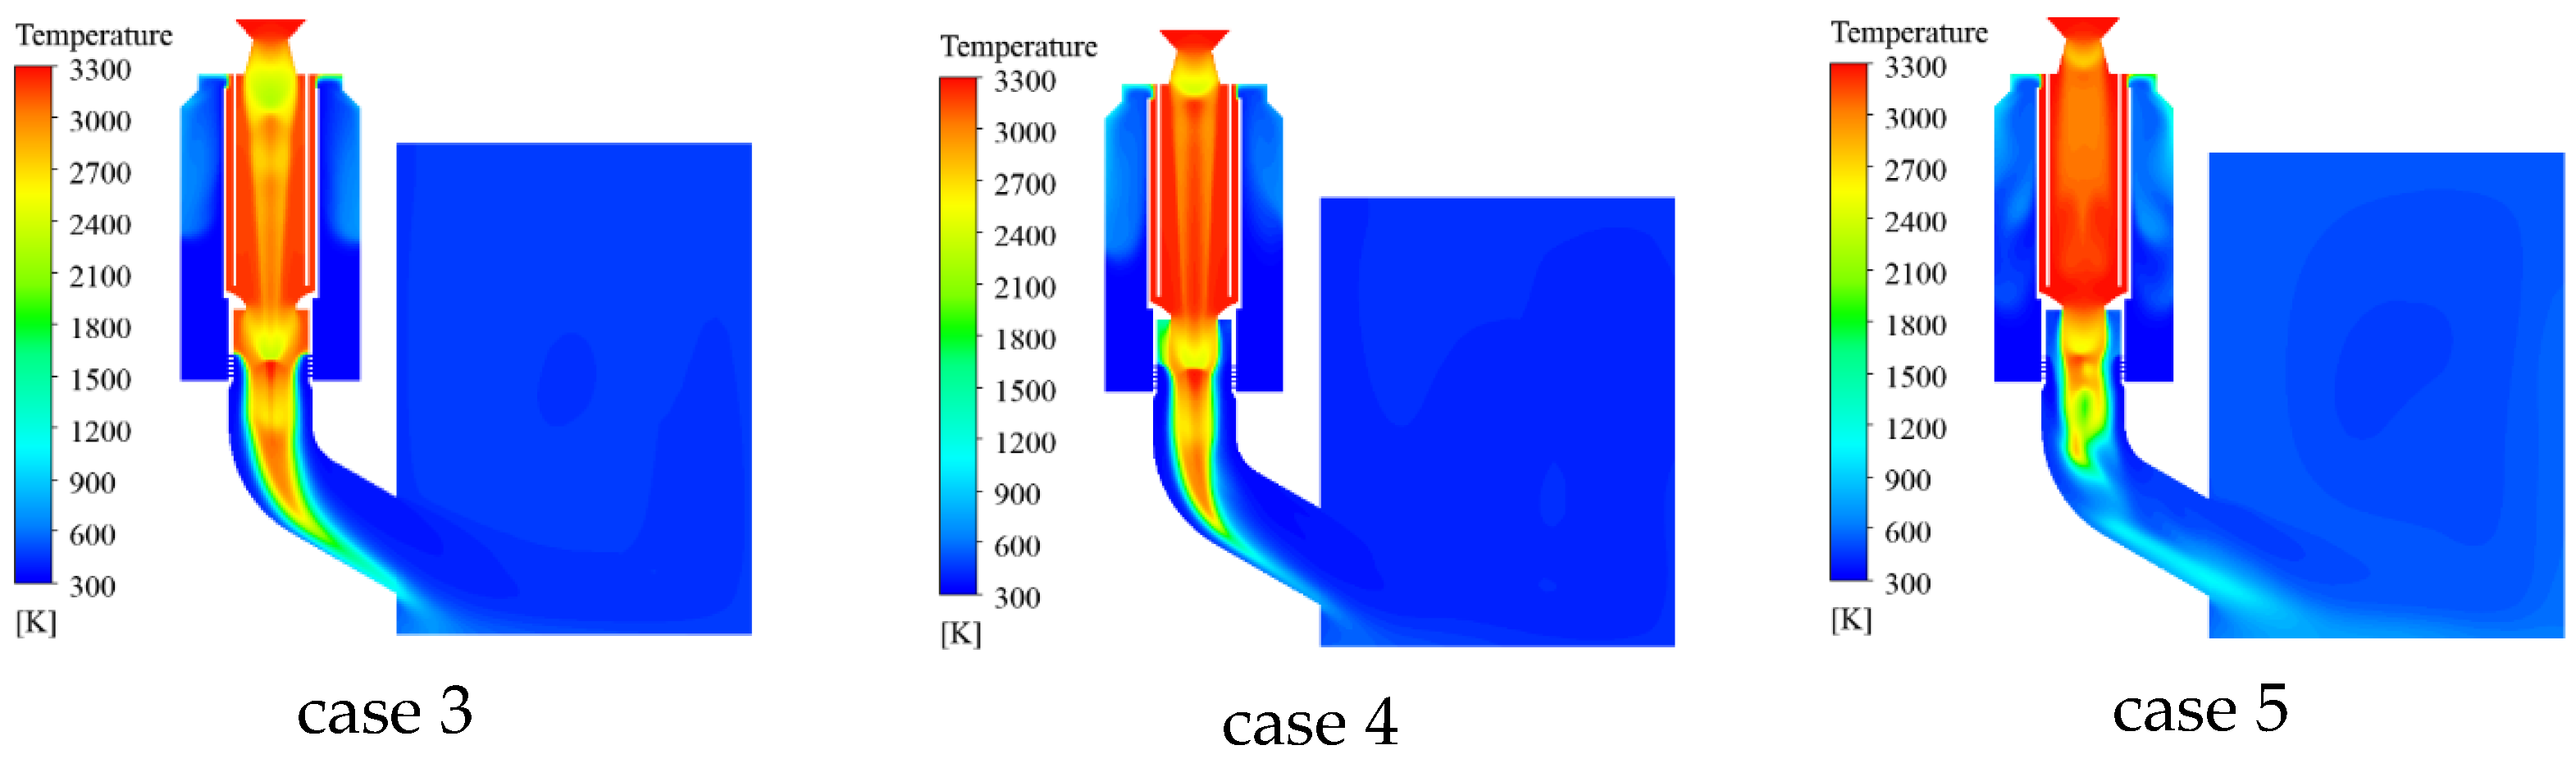
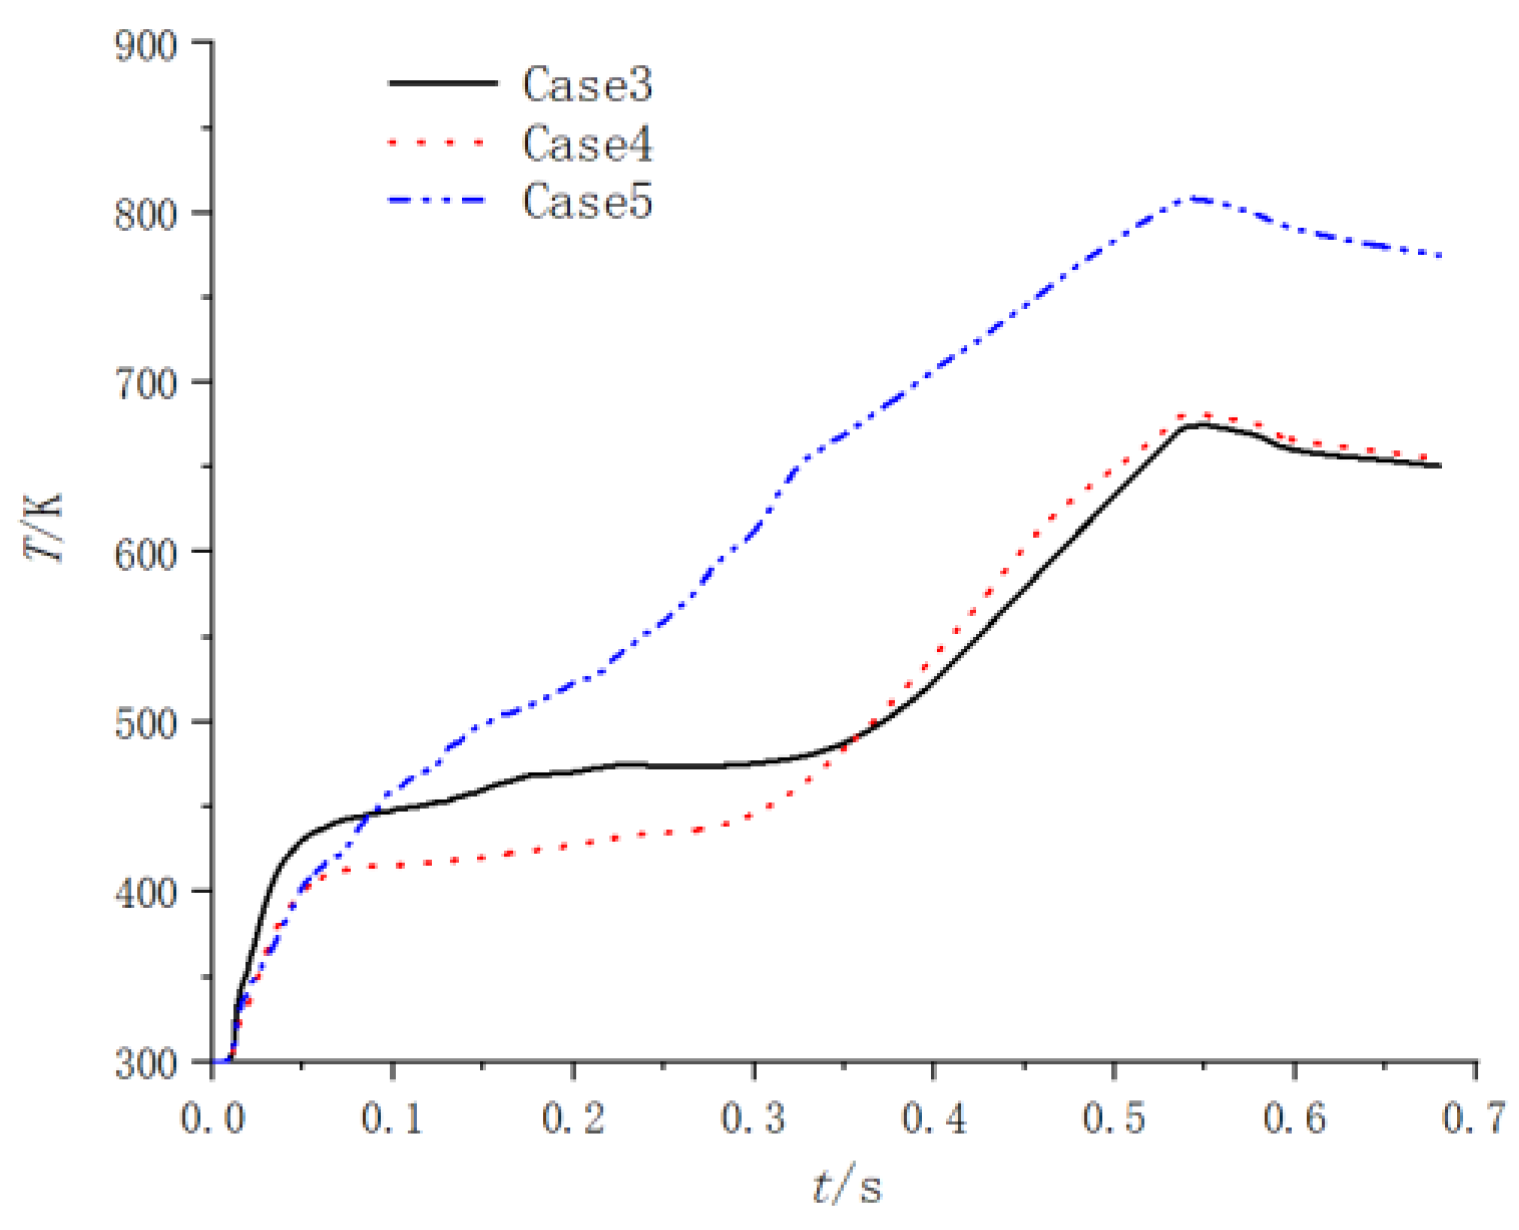
The pressure distributions at two different times under three different throat diameters of the secondary nozzle are shown in Figure 39 and Figure 40. From Figure 39 and Figure 40, it can be seen that the pressure variation pattern within the entire device is basically consistent under three cases, and a significant water spray pressure difference is generated near the water spray hole. As the throat diameter decreases, the gas is limited when it reaches the secondary nozzle, and the pressure in the water chamber within the gas action area increases. Therefore, in case 5, where the throat diameter is the smallest, the spray pressure difference value inside and outside the spray hole is the largest.
The temperature distributions of three cases with different secondary nozzle throat diameters at two different times are shown in Figure 41 and Figure 42. It can be seen from Figure 39 and Figure 40 that the temperature distributions are basically the same, but the instability occurs in the water vapor contact part after the throat diameter of the secondary nozzle decreases.
-
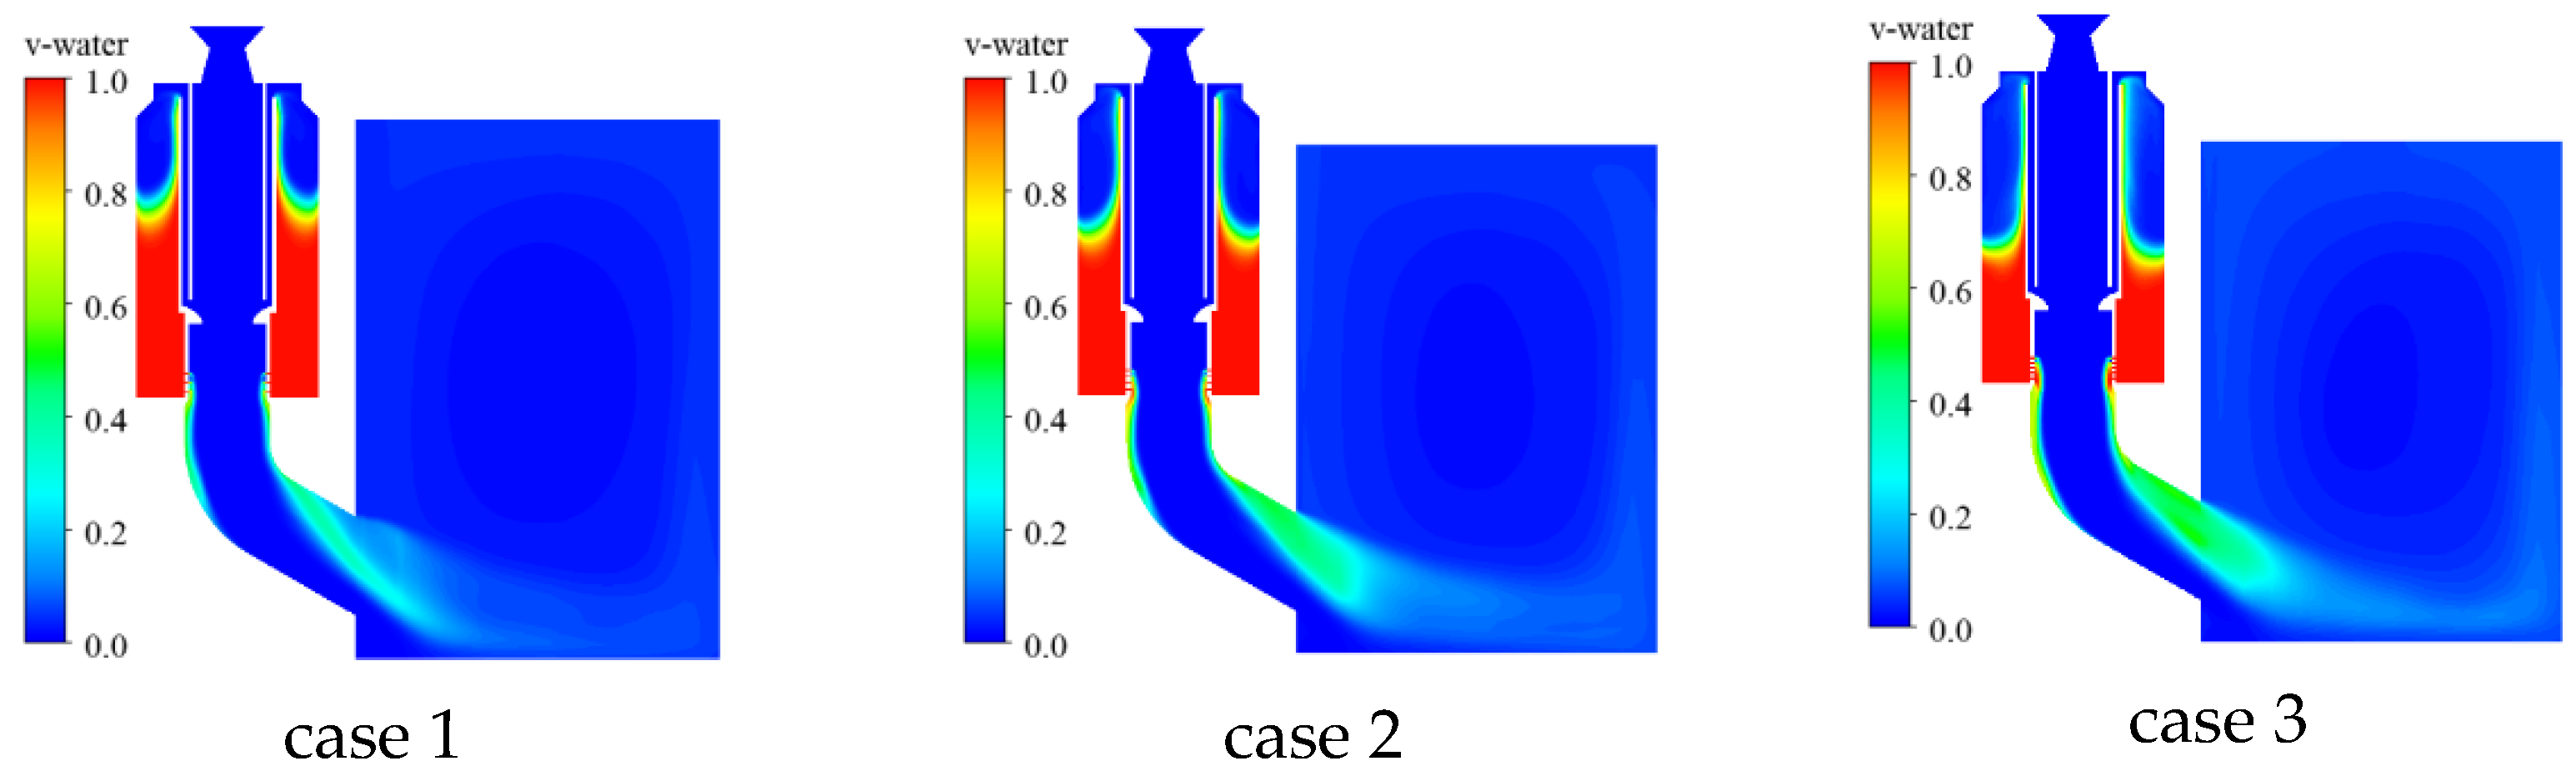
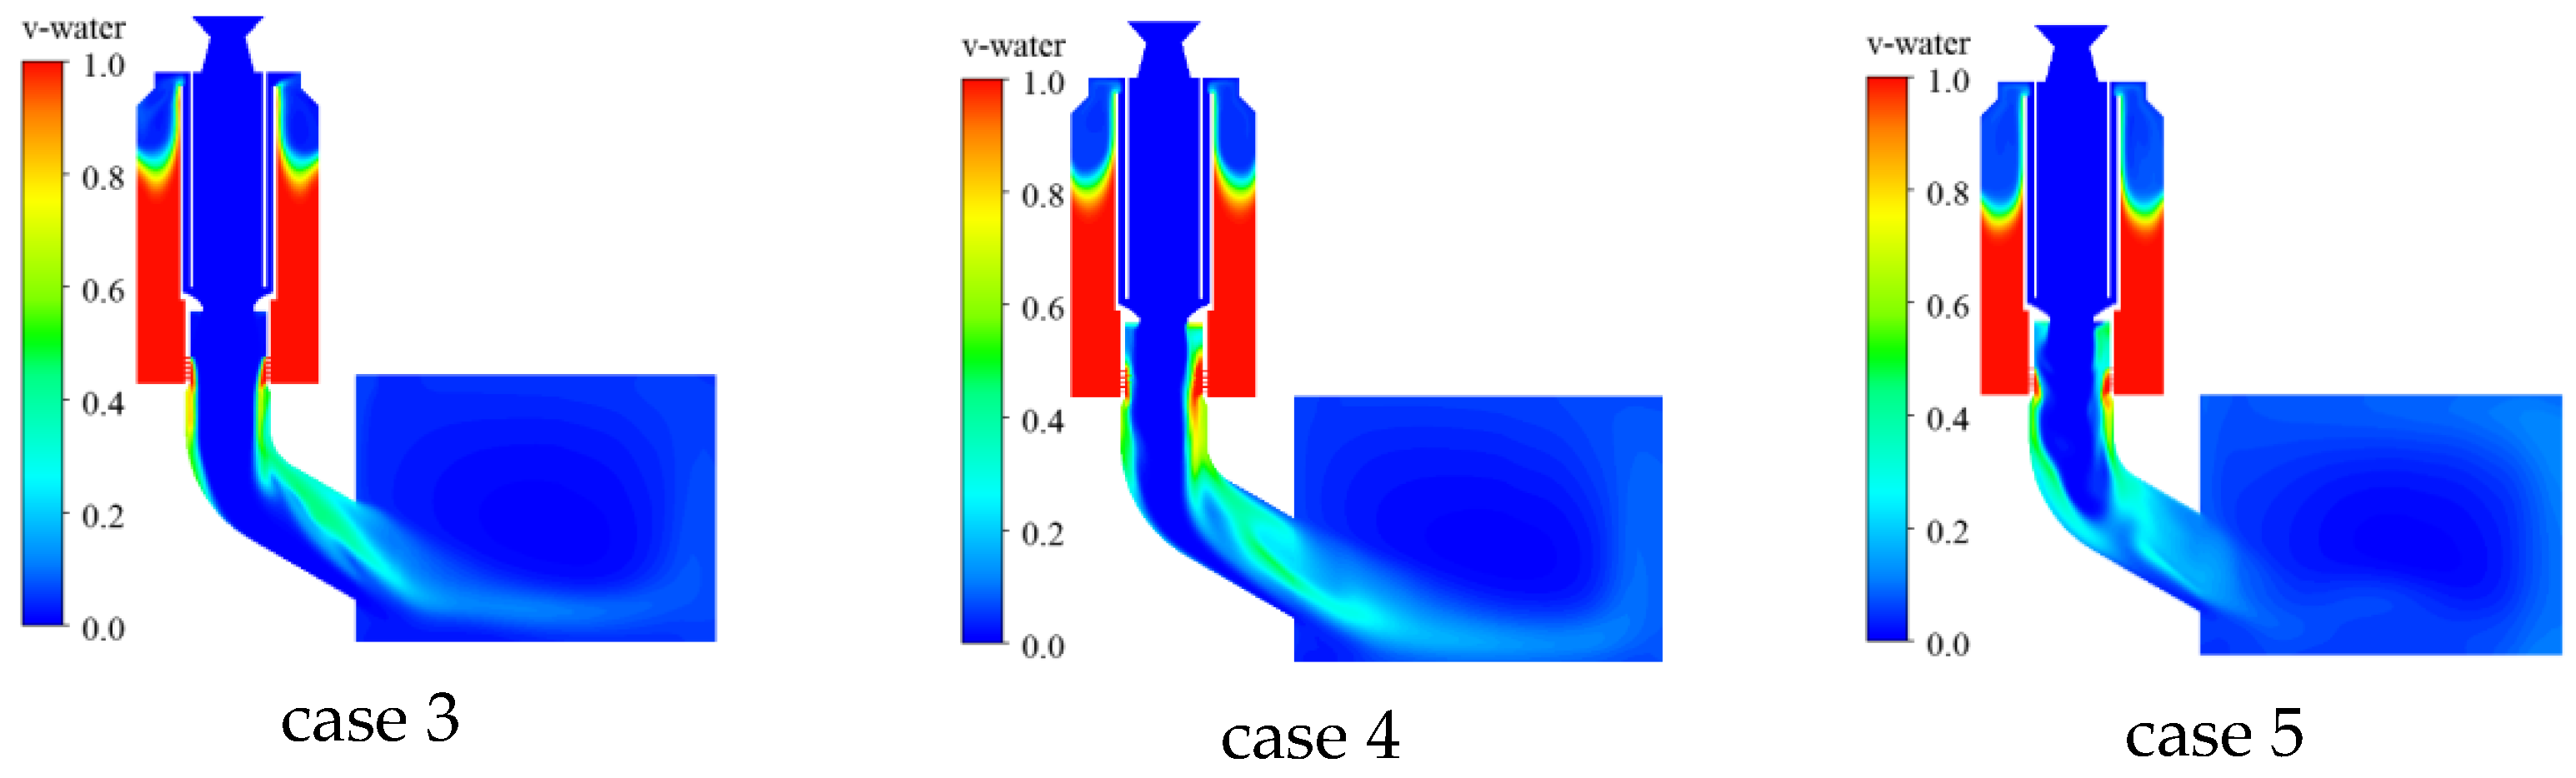
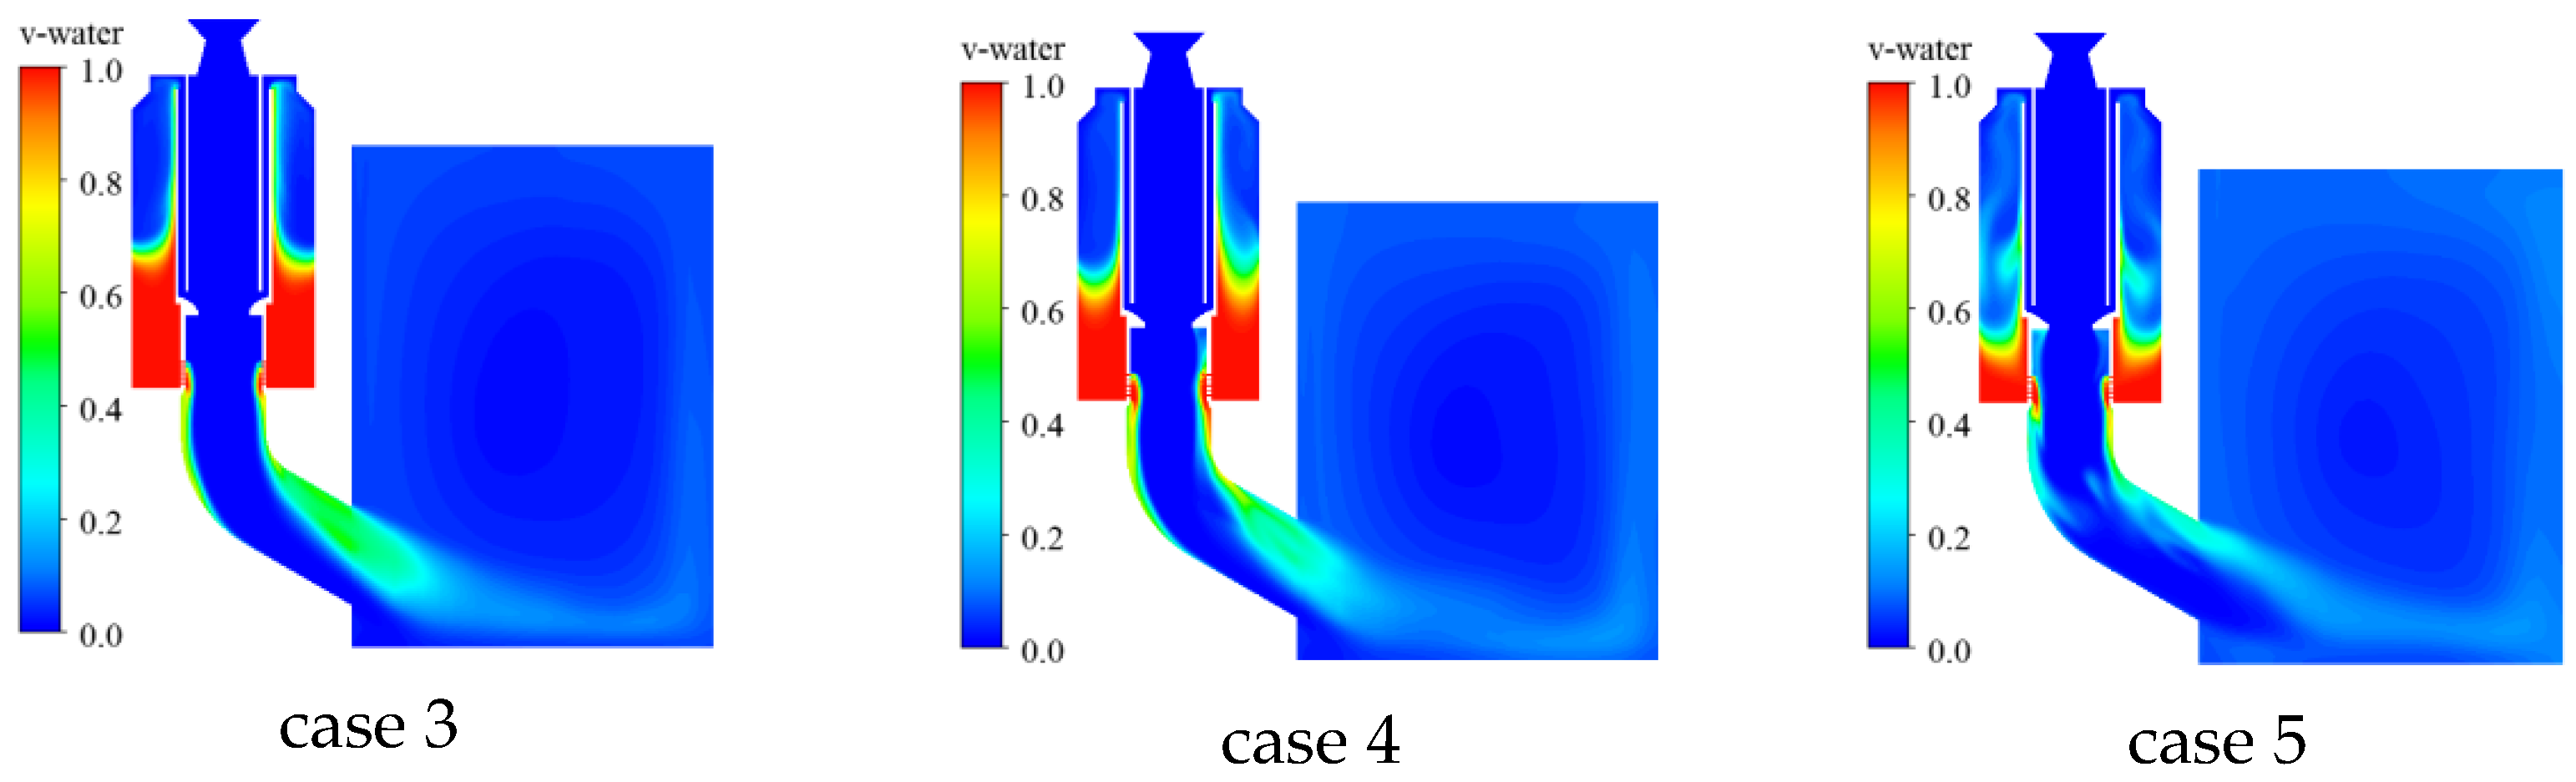
The contours of water volume fraction of three different secondary nozzle throat diameters at two different time points are shown in Figure 43 and Figure 44. It can be seen from Figure 43 and Figure 44 that the increase in spray pressure directly leads to an increase in spray flow rate, and therefore the water consumption in the water chamber of case 5 is the fastest.
The average pressure distribution inside the launch cylinder under three cases is shown in Figure 45. It can be seen that, when the secondary throat diameter decreases significantly, for example, in case 5, the pressure inside the launch cylinder increases abruptly after the water in the water chamber is consumed. The pressure of case 3 is more stable compared to those in the other two cases.
The average temperature inside the launcher is shown in Figure 44. From Figure 46, it can be seen that the temperature value corresponding to the smaller throat diameter of the secondary nozzle is relatively small in the early stage and increases rapidly in the later stage. The changes in the weight of water under different throat diameters are shown in Figure 47. The water consumption in case 5 is completed earlier, and in the later stage, due to the absence of water, the temperature increases faster.
The acceleration, velocity, and displacement curves of the projectile motion are shown in Figure 48, Figure 49 and Figure 50. The corresponding acceleration changes in case 5 are the most severe and unstable. Therefore, in order to obtain a stable launch state, it is necessary to control the diameter of the secondary throat to be above 100 mm.

5. Conclusions

Using a numerical model, the flow distribution in the gas–steam ejection device has been analyzed to study the load and interior ballistic characteristics under different spray and throat setups. The following conclusions can be drawn from our simulations:
(1)
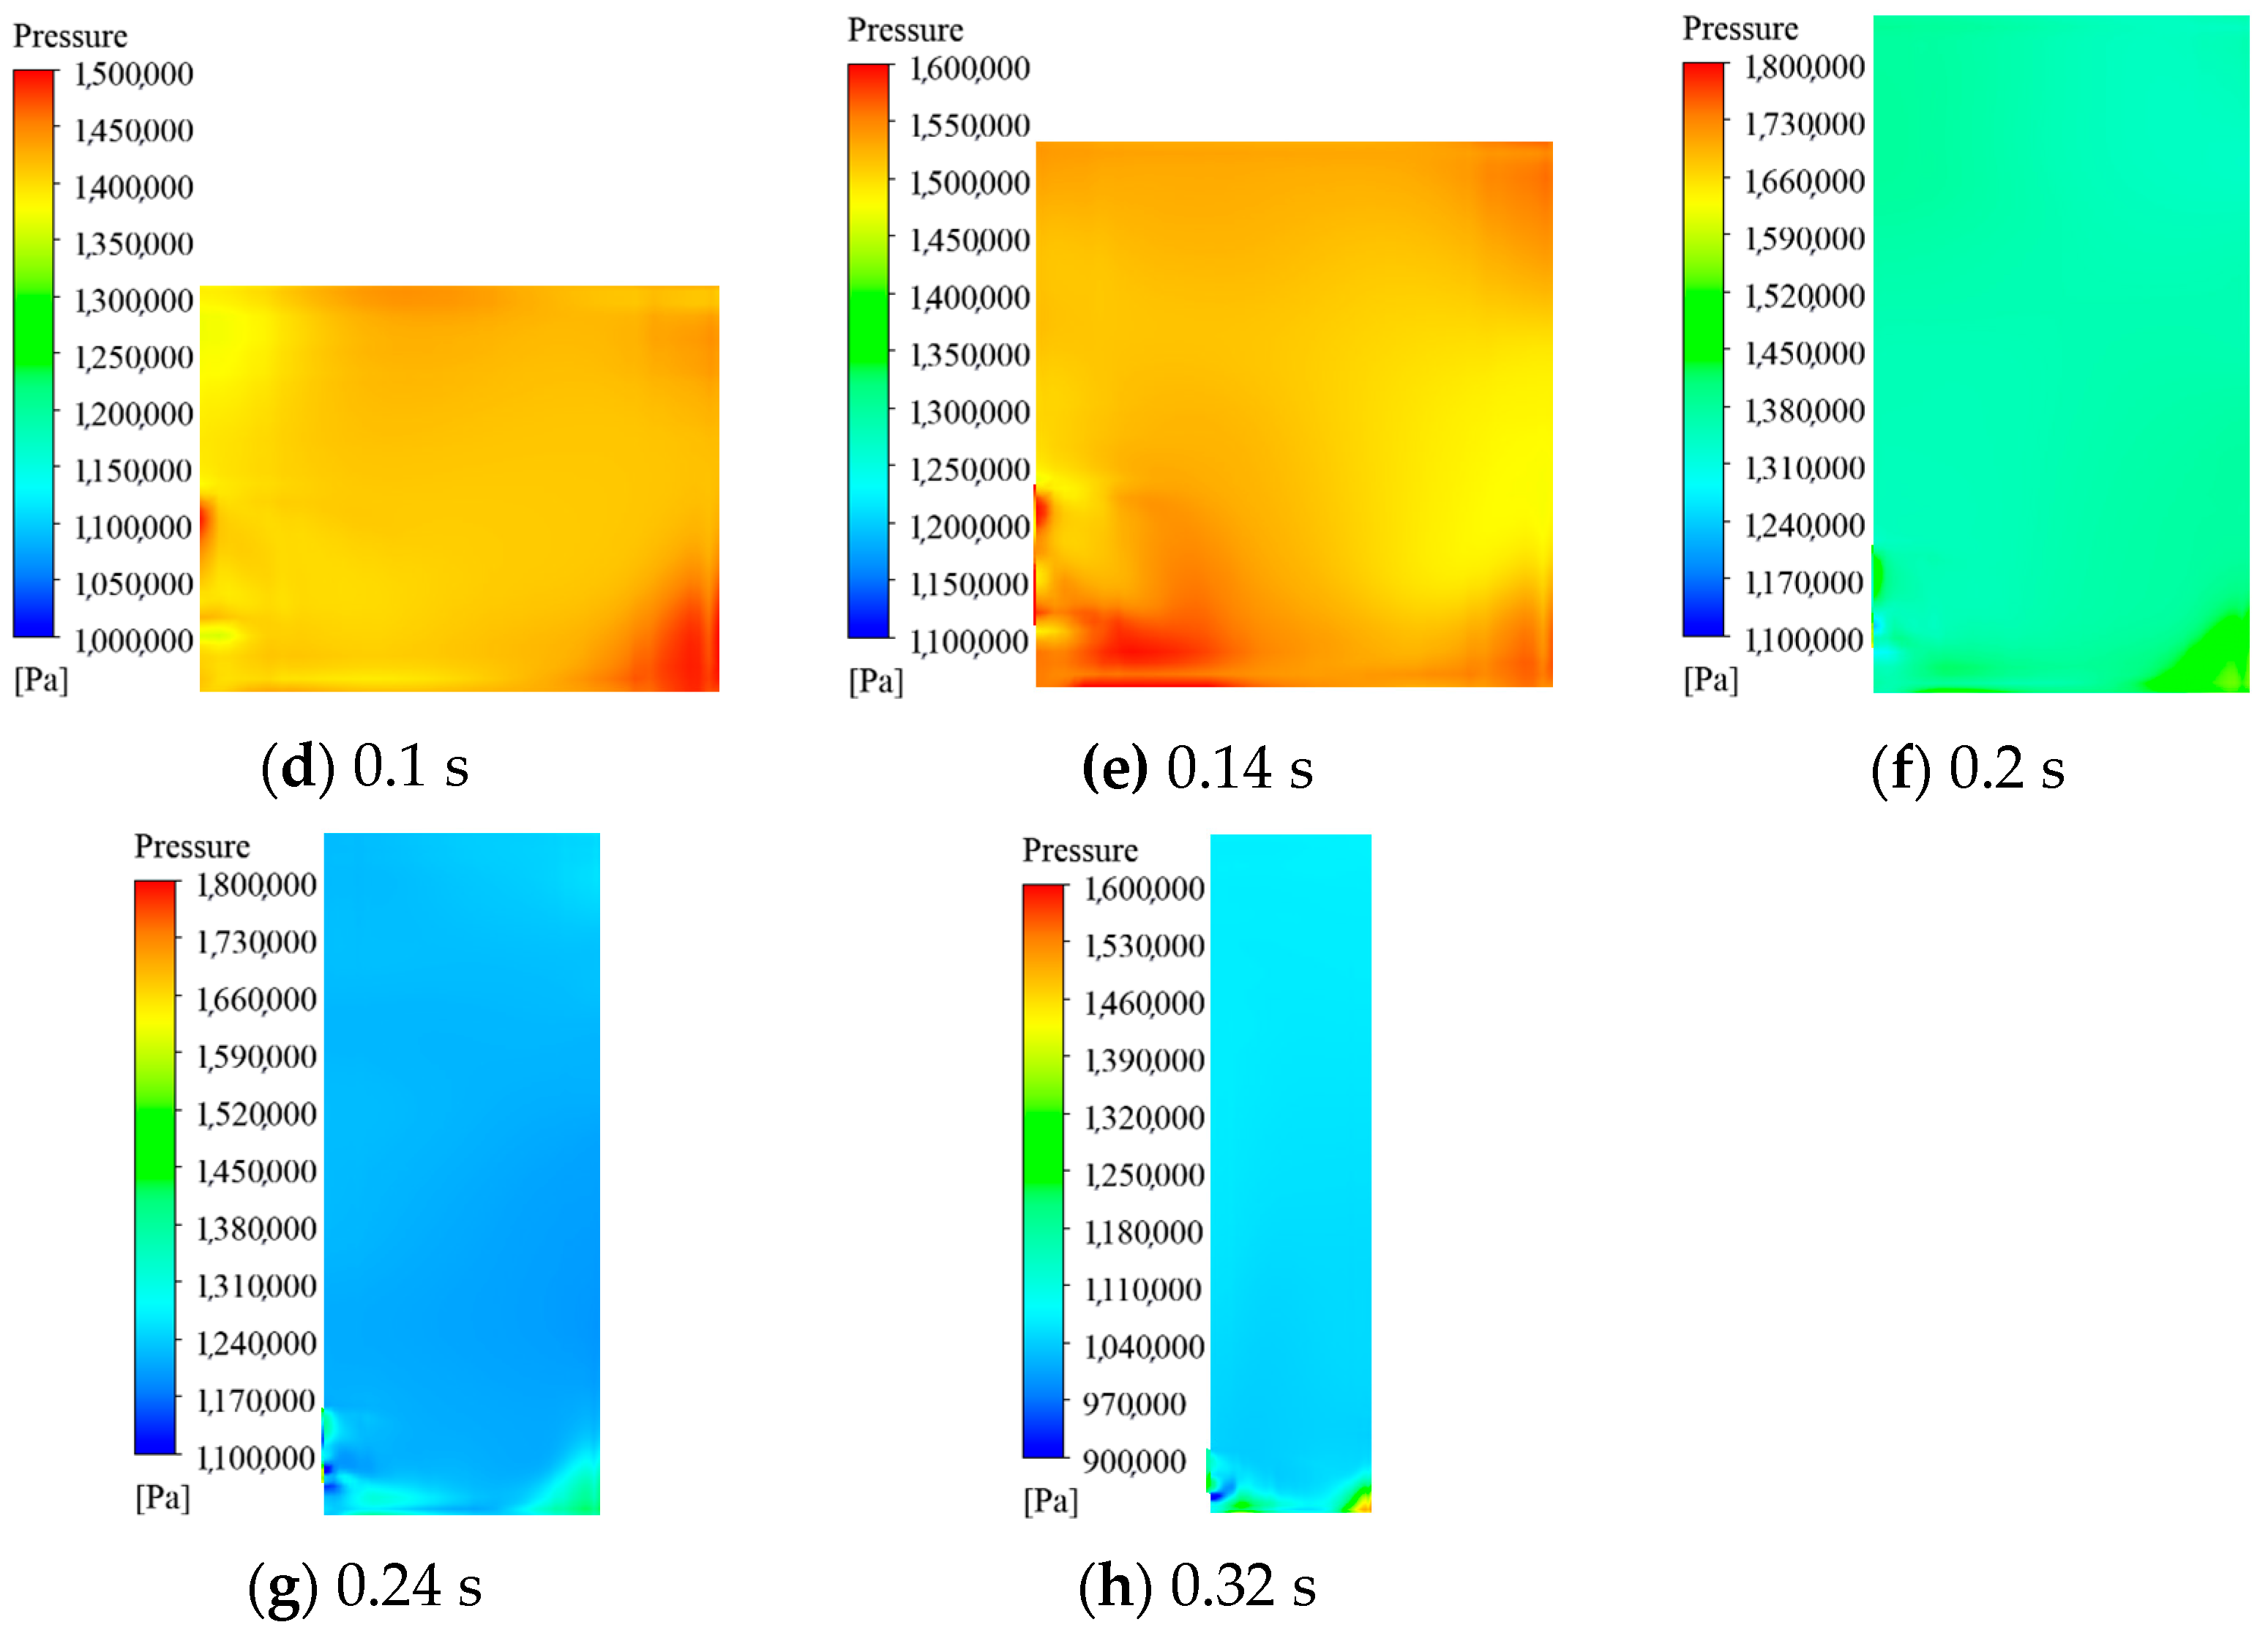
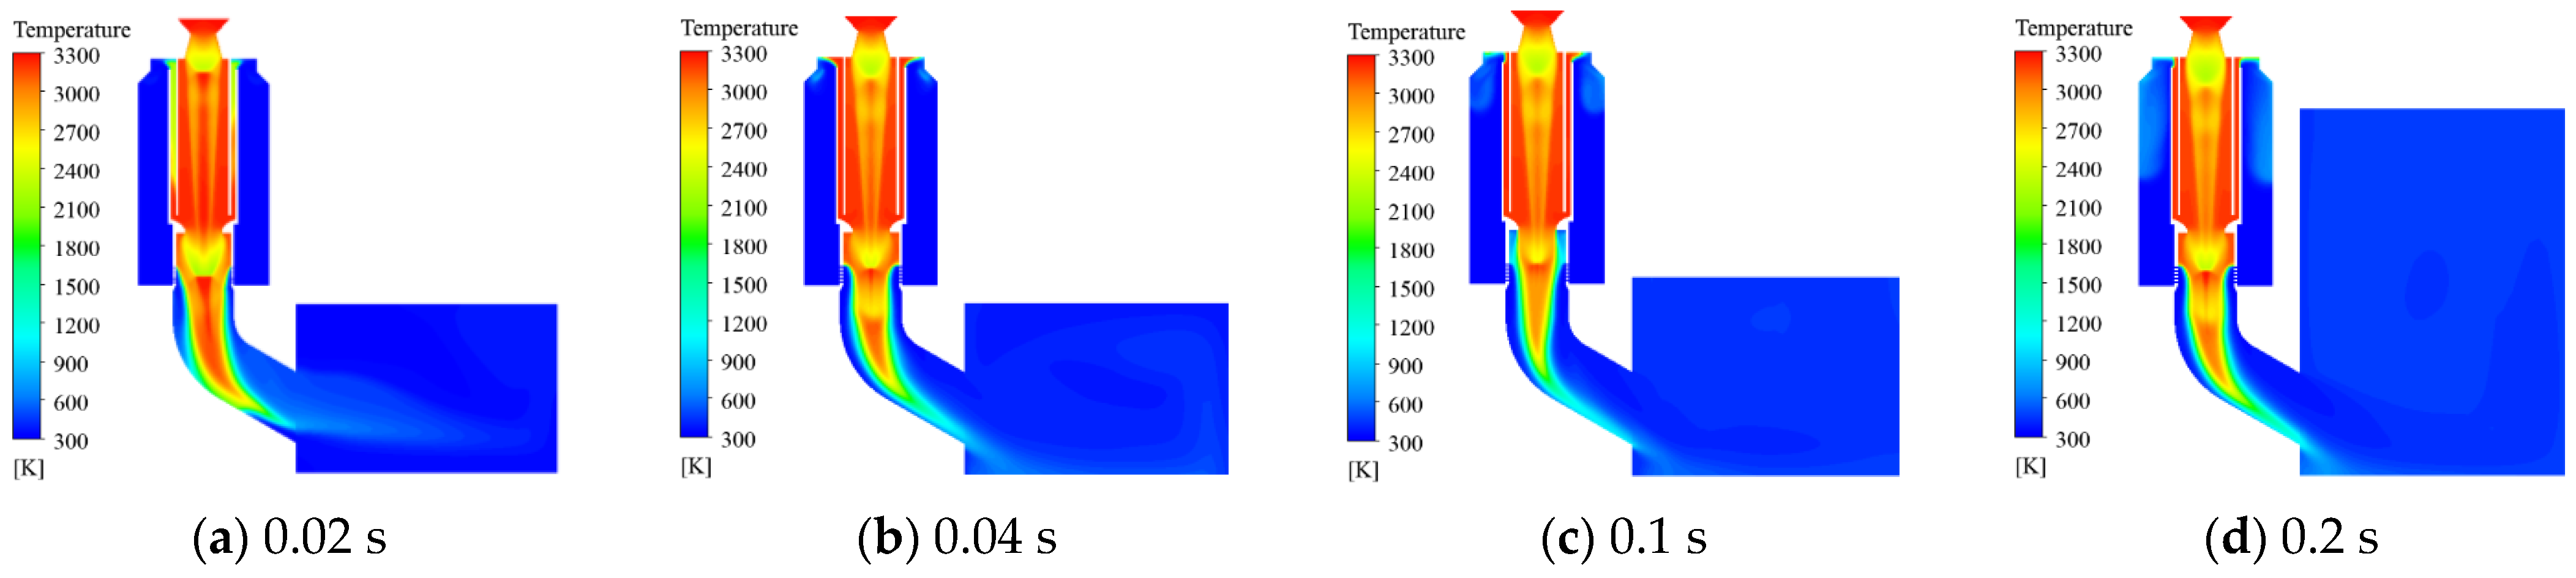
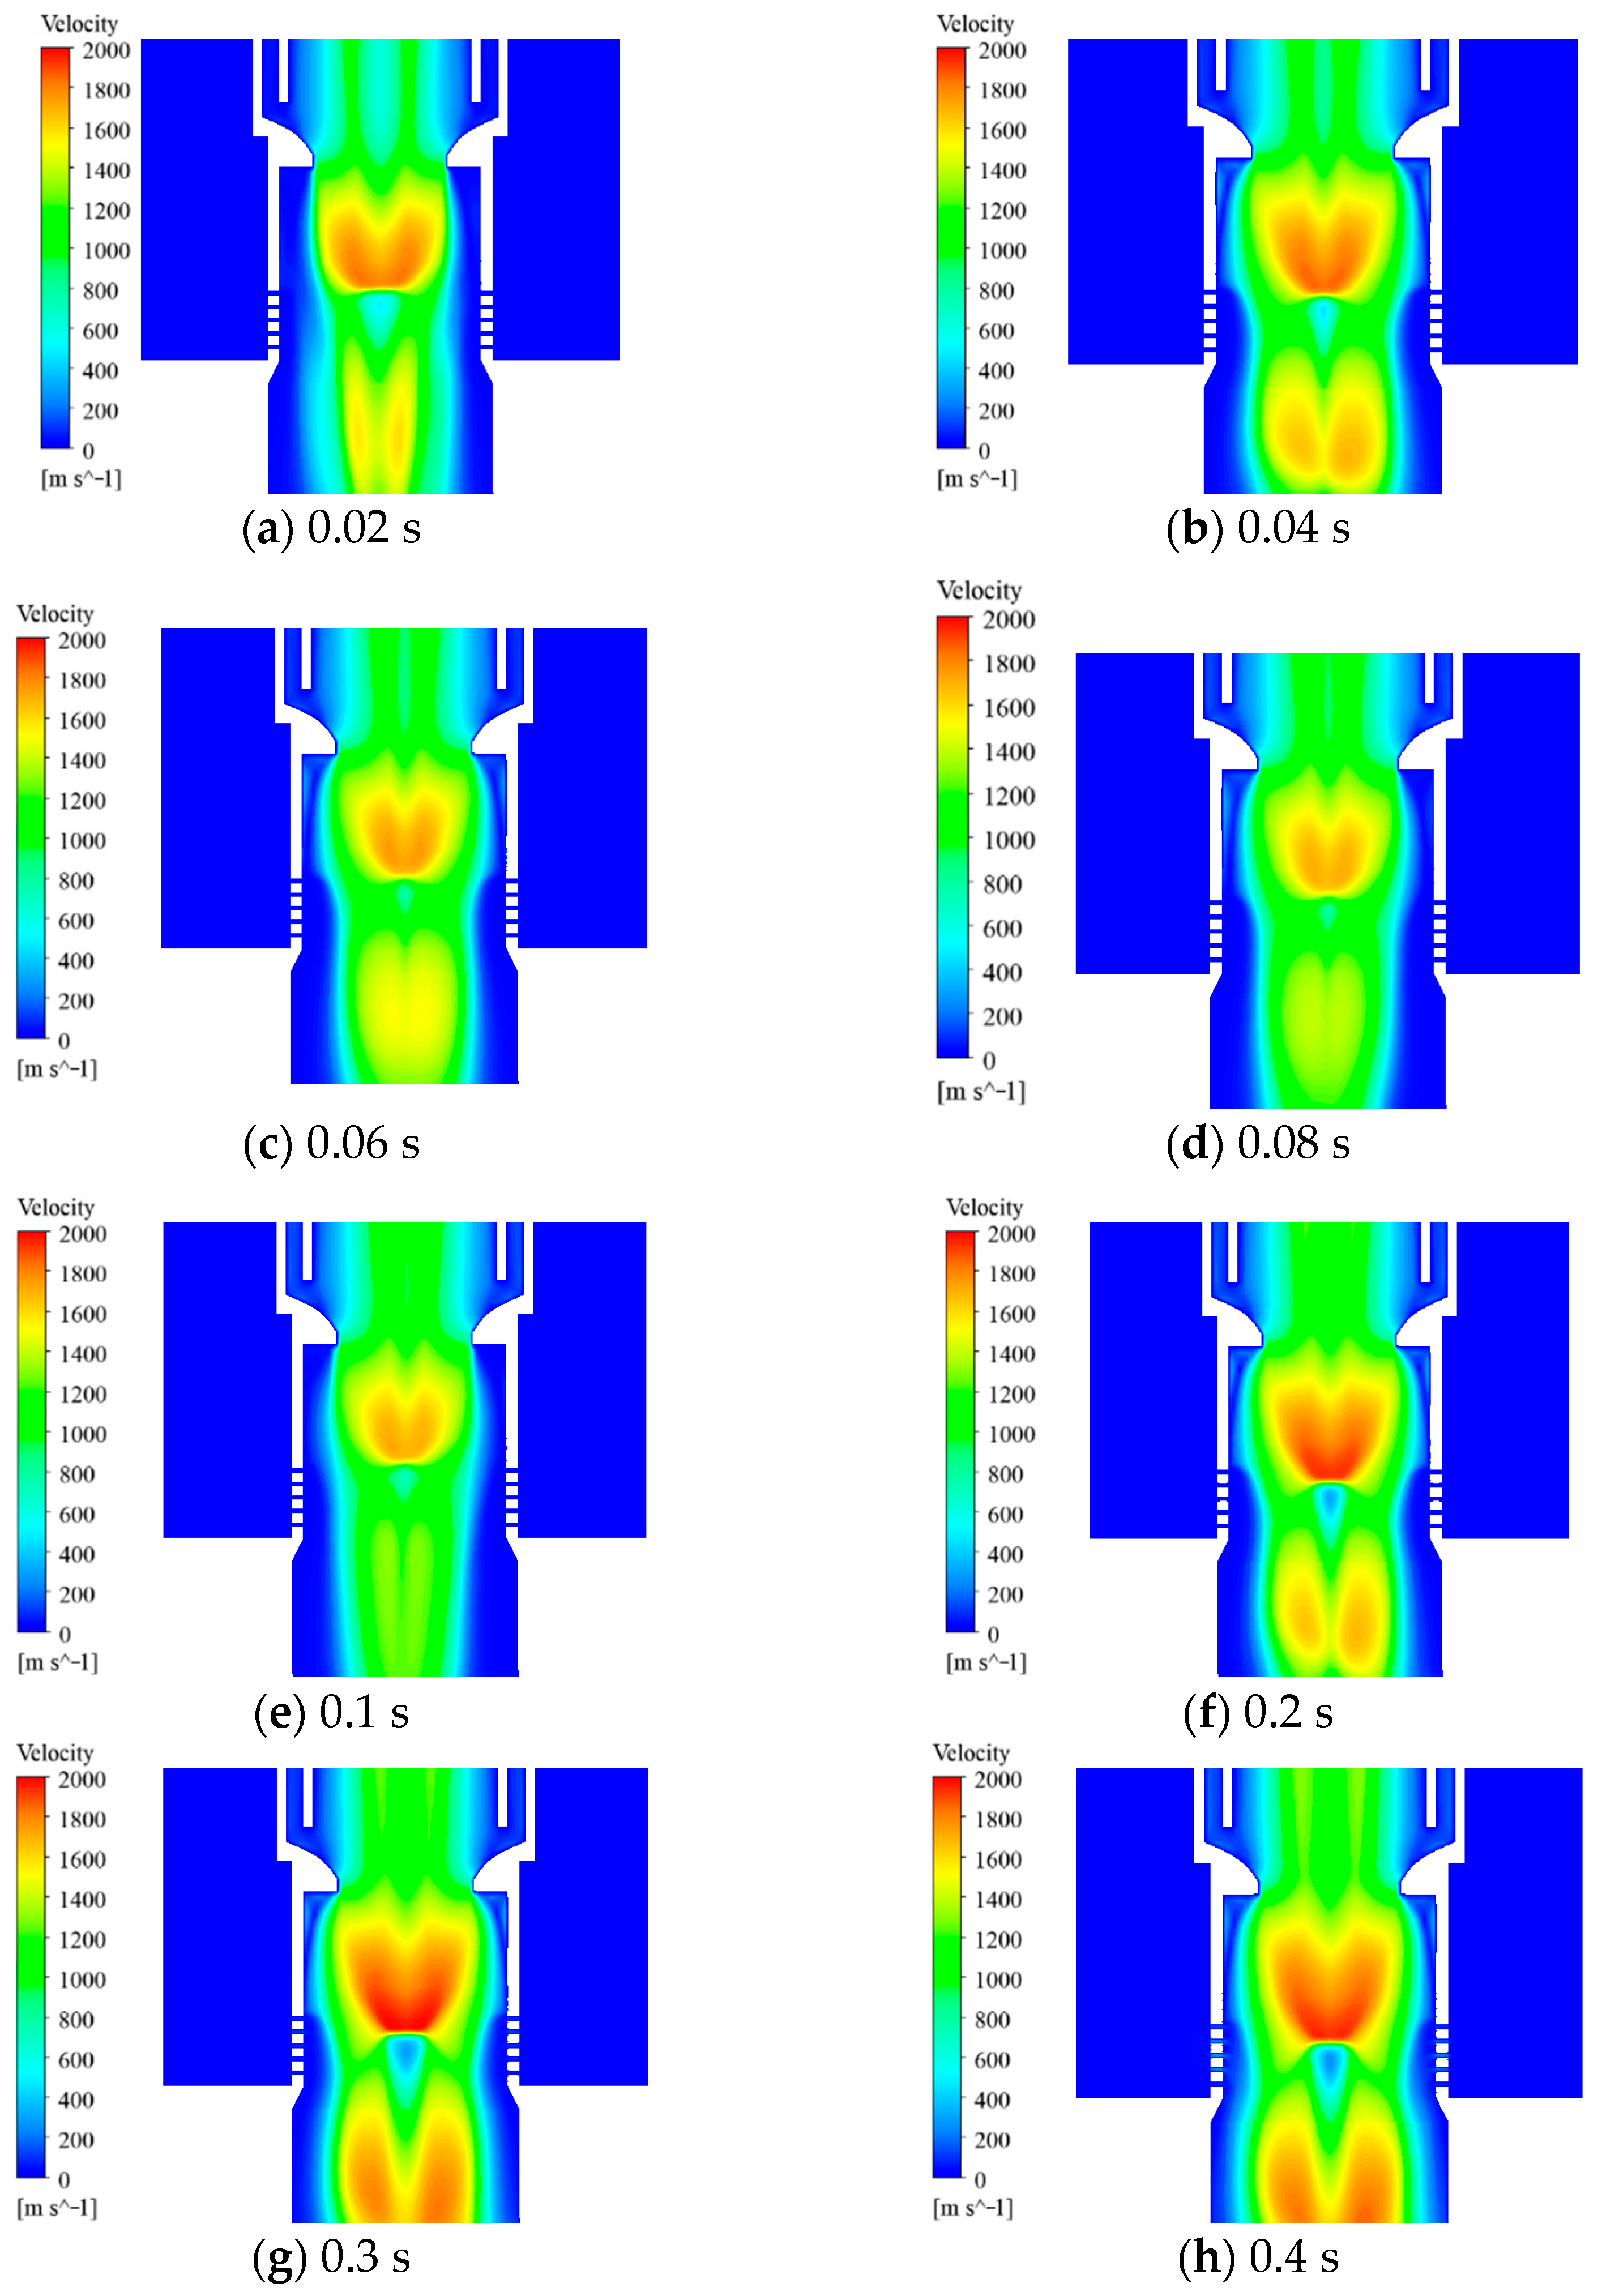
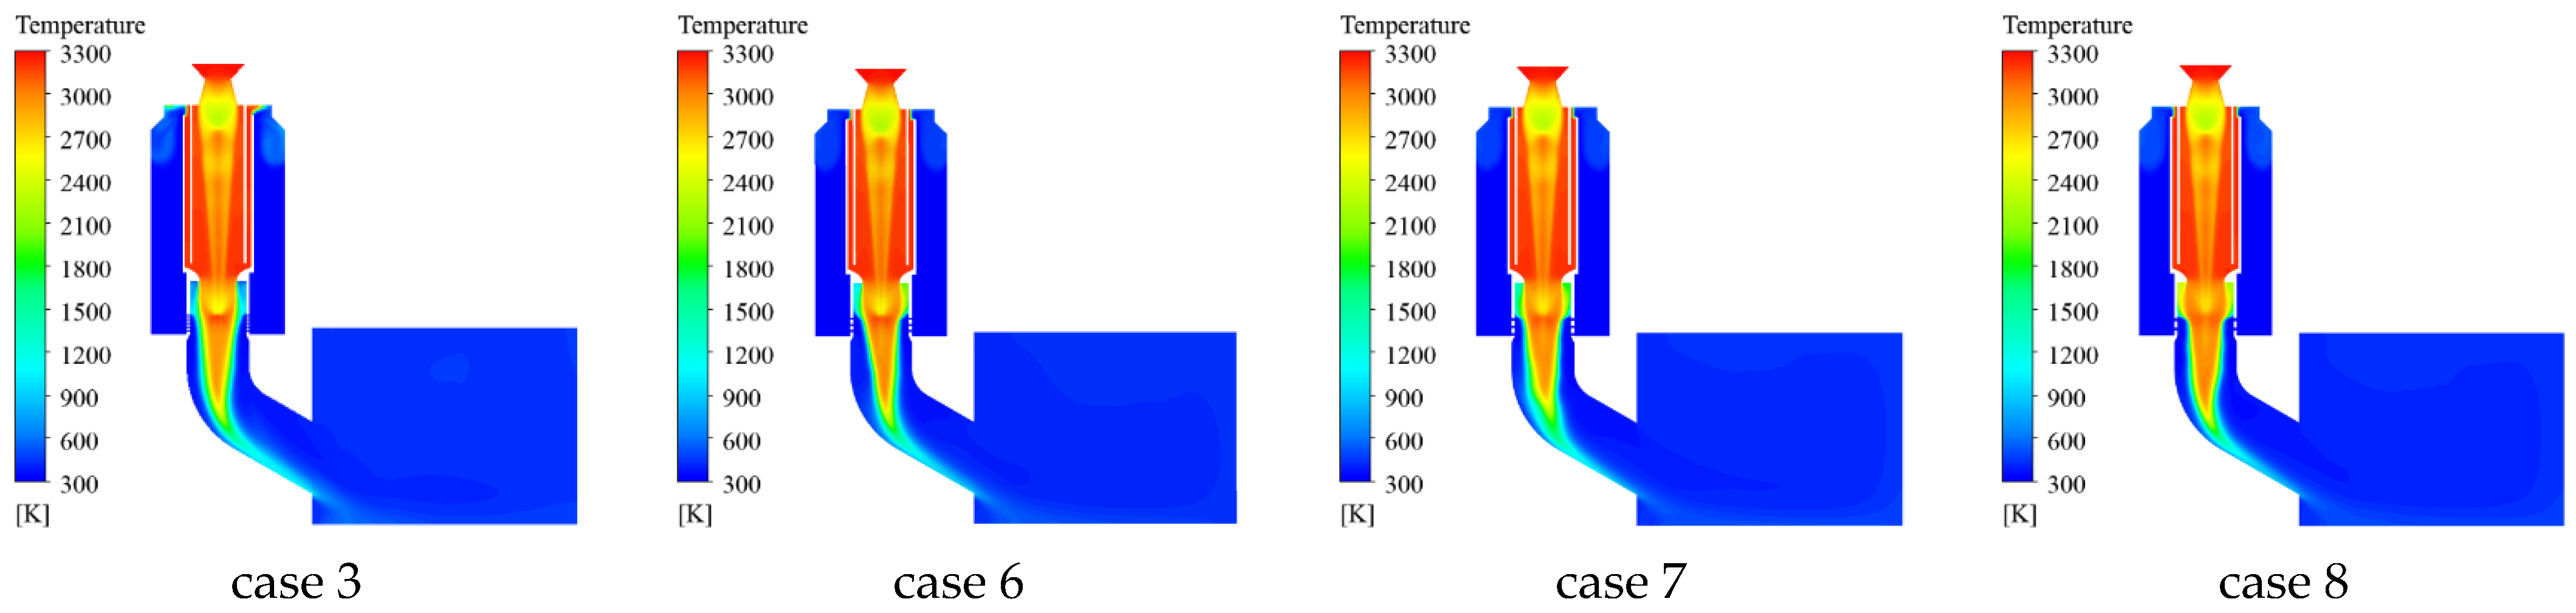
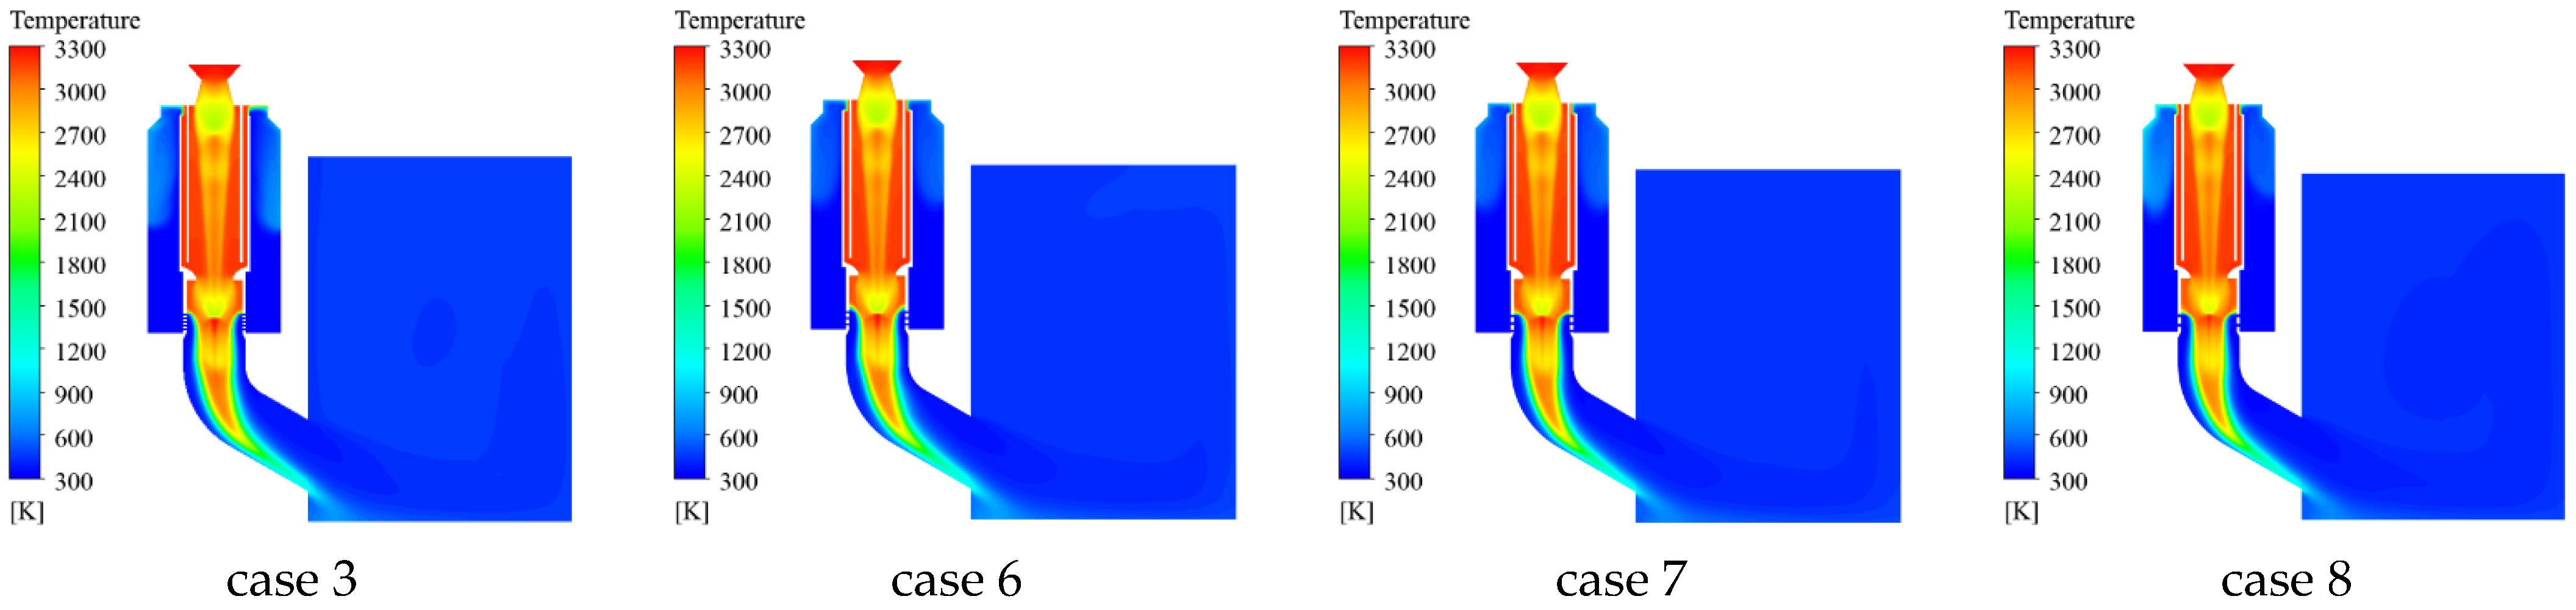
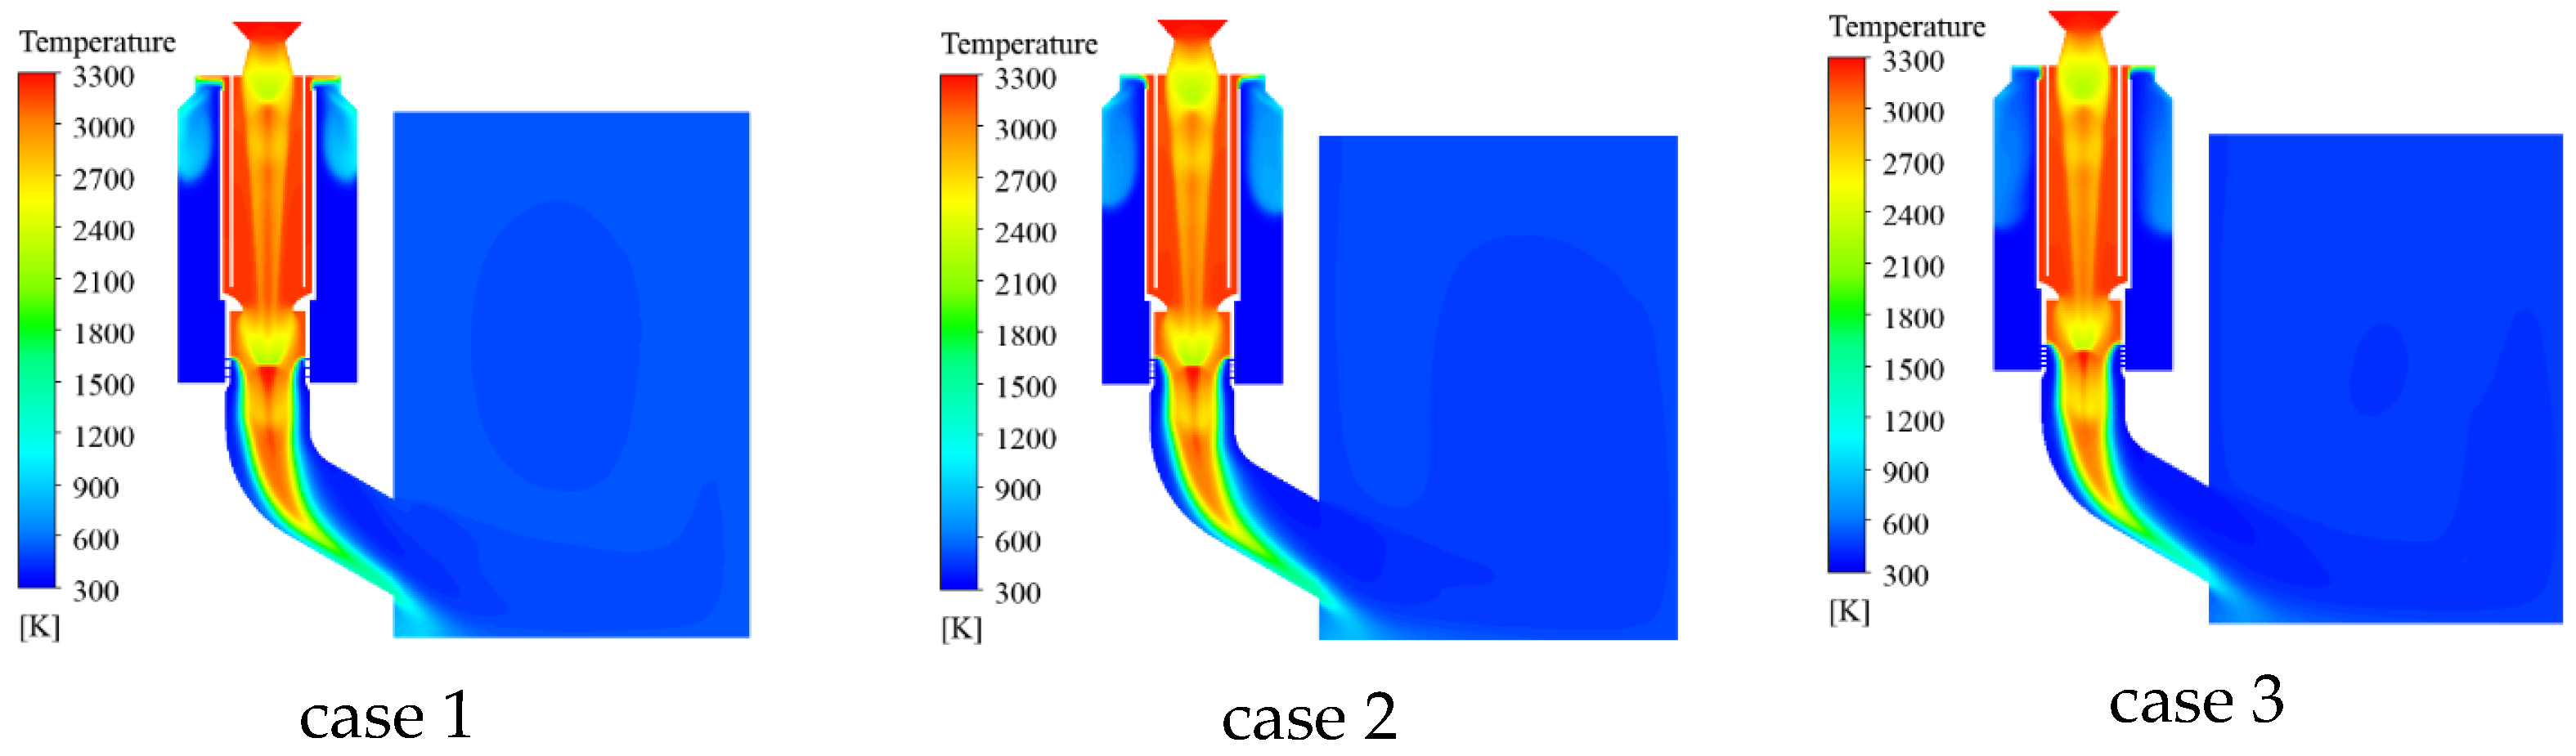
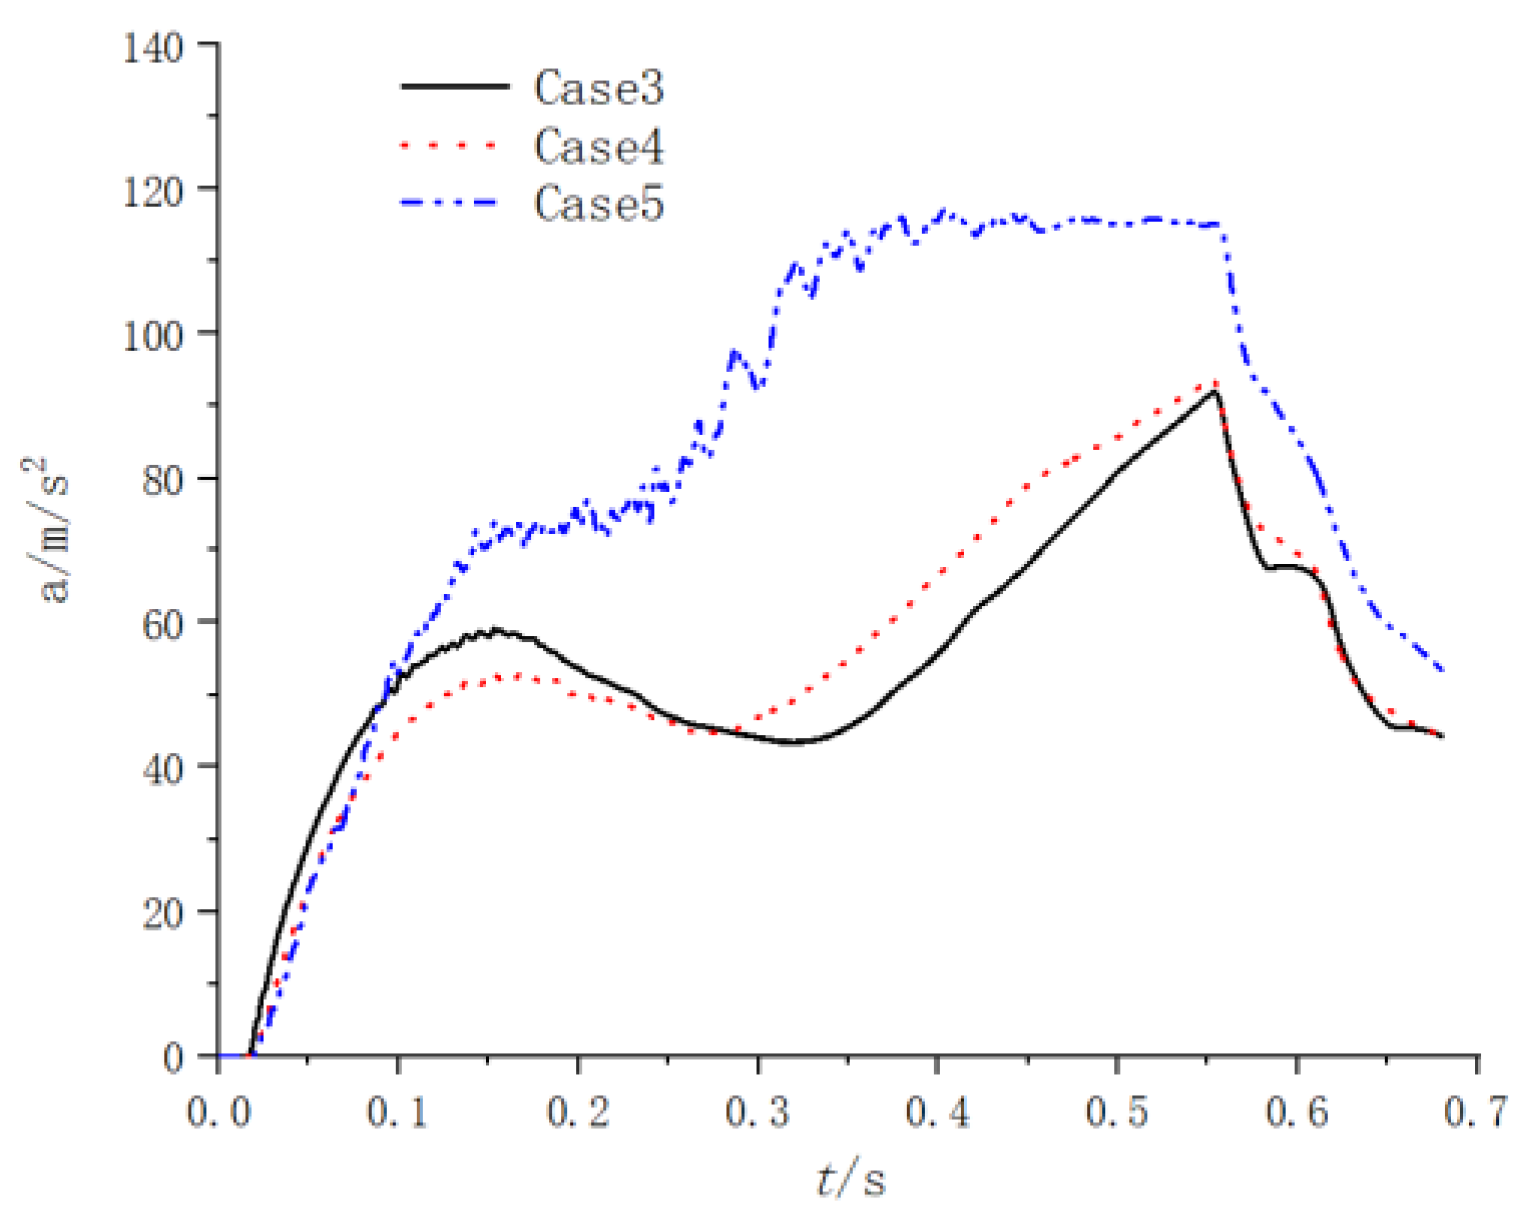
During the operation of the gas–steam ejection device, an interaction between compression waves and expansion waves is noticed in the guide tube. The generation of steam has a compression effect on the gas. The water flowing out of the spray hole vaporizes when contacting the gas vapor. Due to the action of water flow, a slight compression is also noticed in the central area of the spray hole, leading to an increase in pressure. The gas jet near the spiracle is first compressed due to the increase in water flow, and then gradually expands outward. Although there are some changes in the spray holes and throats of the gas–steam ejection device, the heat entering the launcher is gradually reduced by the action of water flow. The average temperature inside the launcher is below 820 K. The total load acting on the missile body fluctuates.
(2)
With the total spray area fixed, the change in the diameter of the spray hole has little influence on the overall system performance; however, if the spray hole is too large, its load and temperature distribution become unstable. When the diameter of a single spray hole is fixed and the total spray area increases, the pressure and temperature of the gas–steam ejection devices decrease, and the water volume in the water chamber decreases faster. The pressure fluctuation of the ejection device is unstable, and the load of the projectile body is also more unstable. It is the total spray area of the spray holes, instead of the diameter or number of the spray holes, that has a major impact on the flow field and interior trajectory of the gas–steam ejection device.
(3)
When the number and size of the spray holes are held constant, the larger the size of the secondary nozzle throat, the smaller the spray pressure difference near the spray holes, the more stable the water vapor interface, and the slower the water consumption in the water chamber. For smaller throat diameters of the secondary nozzle, the pressure of the ejection device is high, the temperature rises sharply, and the acceleration change in the projectile body is unstable. The throat diameter of the secondary nozzles should be no less than 100 mm.

Author Contributions

Conceptualization, B.L. (Bing Liu); methodology, R.L.; software, B.L. (Bing Liu); validation, B.L. (Bing Liu); formal analysis, X.C.; investigation, J.G.; resources, G.L.; data curation, B.L. (Bangming Li) and R.L.; writing—original draft preparation, B.L. (Bing Liu); writing—review and editing, G.L.; visualization, B.L. (Bing Liu); supervision, B.L. (Bing Liu); project administration, G.L.; funding acquisition, G.L. All authors have read and agreed to the published version of the manuscript.

Funding

This research received no external funding.

Institutional Review Board Statement

Not applicable.

Informed Consent Statement

Not applicable.

Data Availability Statement

Not applicable.

Conflicts of Interest

The authors declare no conflict of interest.

References

  1. Sankaran, S.; Ignatius, J.K.; Ramkumar, R.; Satyanarayana, T.N.V.; Chakravarthy, S.R.; Panchapakesan, N.R. Suppression of high mach number rocket jet noise by water injection. J. Spacecr. Rocket. 2009, 46, 1164–1170. [Google Scholar] [CrossRef]
  2. Bruce, T.V.; Bachchan, N.; Peroomian, O. Multiphase Modeling of Water Injection on Flame Deflector. In Proceedings of the 21st AIAA Computational Fluid Dynamics Conference, San Diego, CA, USA, 24–27 June 2013; pp. 24–27. [Google Scholar]
  3. Song, J.; Song, X.H.; Cai, Q.; She, H.Q. Numerical analysis of wake field characteristics in rocket self-ejection low pressure chamber. J. Solid Rocket Technol. 2021, 44, 839–849. [Google Scholar]
  4. Zhang, S.K.; Yao, Y.; Meng, X.H. Simulation of the underwater environment missiles launched and the ballistic trajectory out of water. Tactical Missile Technol. 2015, 1, 102–107. [Google Scholar]
  5. Cheng, H.J.; Chen, L.; Zhao, Y.; Liu, Z. Smoothing effect influence of annular baffle structural parameter on the pressure impact of gas-ejection. J. Vib. Shock 2018, 37, 193–199, 258. [Google Scholar]
  6. Zhao, J.P.; Zhang, L.; She, H.Q.; Guo, J.B. Study on the influence of bypass clearance on gas ejection parameters. J. Aerosp. Power 2023, 38, 2407–2414. [Google Scholar]
  7. Li, R.F.; Le, G.G.; Ma, D.W. The influence of combustion product properties on gas-ejection interior ballistic and load characteristics. Acta Armamentarii 2016, 37, 245–252. [Google Scholar]
  8. Rui, S.Z.; Xing, Y.M.; Liang, C. Numerical simulation of gas-liquid two-phase flow in high temperature and high pressure supersonic cross flow. J. Aerosp. Power 2011, 26, 991–996. [Google Scholar]
  9. Zhang, R.J.; Bao, F.T. Comparison of internal ballistic properties between gas and steam launching systems in two different models of water injection. J. Solid Rocket Technol. 2005, 28, 5–9. [Google Scholar]
  10. Hu, X.L.; Le, G.G.; Ma, D.W. Numerical study of gas-steam ejection gas-liquid two-phase flow field under water. J. Aerosp. Power 2015, 30, 164–172. [Google Scholar]
  11. Xiao, H.B.; Zhao, S.P. Numerical simulation of the complex flow field in combustion gas-steam launching system. J. Solid Rocket Technol. 2009, 32, 392–395. [Google Scholar]
  12. Yuan, Z.F. Similitude method in the interior ballistics of ejectors. Acta Armamentarii 1987, 1, 8–18. [Google Scholar]
  13. Zhao, S.P.; Bao, F.T. Analysis of several coefficients of interior ballistic evaluation for gas and steam launching system. J. Solid Rocket Technol. 2003, 26, 7–10. [Google Scholar]
  14. Ni, H.C. Changeable depth launch and energy adjustable ejection power system. Shipborne Weapons 1998, 6, 16–25. [Google Scholar]
  15. Liu, B.W.; Jiang, Y. Influence of vaporization effect on gas-liquid two-phase flow field of ejection in combustion gas and vapor mode. J. Solid Rocket Technol. 2014, 2, 156–160. [Google Scholar]
  16. Hui, W.H.; Yang, Y.L.; Ma, Y.J. Multiphase vaporization calculation and influence analysis of gas-steam ejection water injection process. J. Proj. Rocket. Missiles Guid. 2021, 41, 113–116, 119. [Google Scholar]
  17. Yan, F.; Shi, S.Y.; Jiang, Y. Research on interior ballistic of gas-steam ejection. Ship Sci. Technol. 2017, 39, 118–122. [Google Scholar]
  18. Bai, J.H.; Hu, X.B. Impact of injection angle and initial particles diameter on interior flow characteristic of silo. J. Solid Rocket Technol. 2013, 36, 165–169. [Google Scholar]
  19. Shi, Q.S.; Qiang, X.W.; Wang, H.; He, D.N.; Shen, B.L. Research on the law of the water-spray pressure difference in the gas-steam ejection power system. Ship Sci. Technol. 2020, 42, 157–160, 169. [Google Scholar]
  20. Hu, X.L.; Li, R.F.; Xie, N.G.; Liu, Q.Y.; Ma, D.W. Study on vaporization mechanism of gas-steam ejection power equipment containing water chamber. J. Solid Rocket Technol. 2018, 41, 792–798. [Google Scholar]
  21. Belhadj Mohamed, A.; Orfi, J. Evaporation of water/ammonia binary liquid film by mixed convection inside isothermal vertical plates. Desalin. Water Treat. Sci. Eng. 2013, 51, 1966–1972. [Google Scholar] [CrossRef]
  22. Zhao, X.; Cheng, H.J.; Zhao, Y.; Gao, L. Influence of nozzle structure parameters on interior ballistic property of gas ejection. J. Proj. Rocket. Missiles Guid. 2020, 40, 83–88. [Google Scholar]
  23. Ishii, M. Thermo-Fluid Dynamic Theory of Two-Phase Flow. NASA Sti/Recon Tech. Rep. A 1975, 75, 29657. [Google Scholar]
  24. Zhao, S.P. Study of calculation model of launching interior trajectory. Ship Sci. Technol. 2007, 29, 130–133. [Google Scholar]
  25. Xu, X.W.; Li, H.; Bai, Y. Numerical Simulation of Missile Vertical Thermal Launch Based on Moving Grid Layering Method. Ship Electron. Eng. 2022, 42, 98–101. [Google Scholar]
  26. Guo, J.Y.; Hu, X.L.; Sun, C.B.; Zhang, X.F.; Ma, D.W. Chamber width influence on gas-ejection load. J. Ordnance Equip. Eng. 2016, 37, 42–44, 94. [Google Scholar]
  27. Zhao, X.; Cheng, H.J.; Zhao, Y. Comparative analysis of smooth pressure effect between different obstacles on gas ejection. Tactical Missile Technol. 2020, 2, 44–50. [Google Scholar]
  28. Cheng, H.J.; Zhao, X.; Zhao, Y.; Guo, L. Influence of structural parameters of diversion cone on smooth effect of gas ejection bottom pressure impact. J. Propuls. Technol. 2019, 40, 2444–2453. [Google Scholar]
  29. Wang, L.Q.; Hao, Z.R.; Wu, D.Z. Numerical simulation of initial flow field of underwater gas jet. J. Eng. Thermophys. 2009, 30, 1132–1135. [Google Scholar]
  30. Cai, Z.W.; Kang, H.F.; Zhao, M.M. Study on launch dynamics of shipborne missile system. Sh. Sci. Technol. 2021, 43, 10–12. [Google Scholar]
  31. Li, E.Y.; Le, G.G.; Ma, D.W.; Xie, B.X. Numerical study on factors of interior ballistic for low-temperature gas-ejection. J. Aerosp. Power 2017, 32, 1296–1306. [Google Scholar]
  32. Cheng, H.J.; Chen, L.; Lin, R. Gas ejection technology of ballistic missile. J. Proj. Rocket. Missiles Guid. 2017, 37, 109–112. [Google Scholar]
  33. Pan, X.; Jiang, Y.; Wang, B.M.; Ren, Y.B. Dynamics characteristics and influencing factors of multistage canister ejection of rockets. Acta Armamentarii 2022, 43, 1277–1287. [Google Scholar]
  34. Chen, Z.; Guo, X.; Yu, R.; Yu, J.; Wang, Z.H.; Wu, M.; Deng, K.Q.; Pang, A.M. Research on interior ballistic performance of piston-type horizontal ejection device. J. Solid Rocket Technol. 2022, 45, 316–321. [Google Scholar]
  35. Zhao, C.Y.; Jiang, Y.; Wang, H.Z. Dynamics Analysis of the Vehicle-mounted Missile System Launching on the Move Based on Multi-body Dynamics. J. Proj. Rockets Missiles Guid. 2020, 40, 91–93. [Google Scholar]
  36. Zhao, X.; Cheng, H.J.; Zhao, Y.; Gao, L. Influence of diversion cone on gas-ejection internal ballistic. J. Solid Rocket Technol. 2020, 43, 243–249. [Google Scholar]
  37. Wang, H.H.; Jiang, Y.; Yang, C.Z.; Niu, Y.S. Influence of module gas pressure difference on ejection of multistage piston cylinder ejection. J. Proj. Rocket. Missiles Guid. 2022, 42, 78–84. [Google Scholar]
  38. Koutsourakis, N.; Bartzis, J.G.; Markatos, N.C. Evaluation of reynolds stress, k-ε and RNG k-ε turbulence models in street canyon flows using various experimental datasets. Environ. Fluid Mech. 2012, 12, 379–403. [Google Scholar]
  39. Li, J.; Jiang, Y.; Yu, S.Z.; Zhou, F. Cooling effect of water injection on a high-temperature supersonic jet. Energies 2015, 8, 13194–13210. [Google Scholar] [CrossRef]
  40. Kandula, M.; Lonergan, M. Effective jet properties for the estimation of turbulent mixing noise reduction by water injection. In Proceedings of the 13th AIAA (American Institute of Aeronautics and Astronautics)/CEAS Aeroacoustics Conference (28th AIAA Aeroacoustics Conference), Rome, Italy, 21–23 May 2007; American Institute of Aeronautics and Astronautics: Reston, VA, USA, 2007. [Google Scholar]
  41. Berlemont, A.; Desjonqueres, P.; Gouesbet, G. Particlelagrangian simulation in turbulent flows. Int. J. Multiph. Flow 1990, 16, 19–34. [Google Scholar] [CrossRef]
Figure 1. Numerical calculation model: (a) Structure diagram of gas–steam ejection device. (b) Schematic diagram of gas–steam ejection device.
Jmse 11 01937 g001
Figure 2. Arrangement of spray holes.
Jmse 11 01937 g002
Figure 3. Mesh model.
Jmse 11 01937 g003
Figure 4. The calculation result of the gas–steam ejection flow field in the launcher for three mesh models: (a) The average pressure in the launcher. (b) The average temperature in the launcher.
Jmse 11 01937 g004
Figure 5. Experimental device structure.
Jmse 11 01937 g005
Figure 6. Experimental jet with water injection and temperature contour with water injection.
Jmse 11 01937 g006
Figure 7. Unsteady pressure fluctuations in the power device cross-section during the ejection process of case 3.
Jmse 11 01937 g007
Figure 8. Unsteady pressure fluctuations in the launcher cross-section during the ejection process of case 3.
Jmse 11 01937 g008aJmse 11 01937 g008b
Figure 9. Temperature distribution contour of case 3.
Jmse 11 01937 g009
Figure 10. Water volume fraction contour of case 3.
Jmse 11 01937 g010
Figure 11. Pressure distributions inside the power plant for case 3.
Jmse 11 01937 g011
Figure 12. Velocity distribution at the outlet of spiracle of case 3.
Jmse 11 01937 g012
Figure 13. Water vapor two-phase mass conversion contour of case 3.
Jmse 11 01937 g013
Figure 14. Pressure distribution and steam phase volume distribution.
Jmse 11 01937 g014aJmse 11 01937 g014b
Figure 15. Pressure contours of cases 3, 6, 7, and 8 at 0.1 s.
Jmse 11 01937 g015
Figure 16. Pressure contours of cases 3, 6, 7, and 8 at 0.2 s.
Jmse 11 01937 g016
Figure 17. Temperature contours of cases 3, 6, 7, and 8 at 0.1 s.
Jmse 11 01937 g017
Figure 18. Temperature contours of cases 3, 6, 7, and 8 at 0.2 s.
Jmse 11 01937 g018
Figure 19. Water volume fraction contours of cases 3, 6, 7, and 8 at 0.1 s.
Jmse 11 01937 g019
Figure 20. Water volume fraction contours of cases 3, 6, 7, and 8 at 0.2 s.
Jmse 11 01937 g020
Figure 21. The average pressure of the gas–steam ejection flow field in the launcher under different spray hole diameters.
Jmse 11 01937 g021
Figure 22. The average temperature of the gas–steam ejection flow field in the launcher under different spray hole diameters.
Jmse 11 01937 g022
Figure 23. Changes in the weight of water in the water chamber under different spray hole diameters.
Jmse 11 01937 g023
Figure 24. Curve of projectile acceleration under different spray hole diameters.
Jmse 11 01937 g024
Figure 25. Curve of projectile velocity under different spray hole diameters.
Jmse 11 01937 g025
Figure 26. Curve of projectile displacement under different spray hole diameters.
Jmse 11 01937 g026
Figure 27. Pressure contour of cases 1, 2, and 3 at 0.1 s.
Jmse 11 01937 g027
Figure 28. Pressure contour of cases 1, 2, and 3 at 0.2 s.
Jmse 11 01937 g028
Figure 29. Temperature contour of cases 1, 2, and 3 at 0.1 s.
Jmse 11 01937 g029
Figure 30. Temperature contour of cases 1, 2, and 3 at 0.2 s.
Jmse 11 01937 g030
Figure 31. Water volume fraction contour of cases 1, 2, and 3 at 0.1 s.
Jmse 11 01937 g031
Figure 32. Water volume fraction contour of cases 1, 2, and 3 at 0.2 s.
Jmse 11 01937 g032
Figure 33. The average pressure of the gas–steam ejection flow field in the launcher under different total spray area.
Jmse 11 01937 g033
Figure 34. The average temperature of the gas–steam ejection flow field in the launcher.
Jmse 11 01937 g034
Figure 35. Changes in the weight of water in the water chamber under different total spray area.
Jmse 11 01937 g035
Figure 36. Curves of projectile acceleration under different total spray areas.
Jmse 11 01937 g036
Figure 37. Curves of projectile velocity under different total spray areas.
Jmse 11 01937 g037
Figure 38. Curves of projectile displacement under different total spray areas.
Jmse 11 01937 g038
Figure 39. Pressure contour of cases 3, 4, and 5 at 0.1 s.
Jmse 11 01937 g039
Figure 40. Pressure contour of cases 3, 4, and 5 at 0.2 s.
Jmse 11 01937 g040
Figure 41. Temperature contour of cases 3, 4, and 5 at 0.1 s.
Jmse 11 01937 g041
Figure 42. Temperature contour of cases 3, 4, and 5 at 0.2 s.
Jmse 11 01937 g042
Figure 43. Water volume fraction contour of cases 3, 4, and 5 at 0.1 s.
Jmse 11 01937 g043
Figure 44. Water volume fraction contour of cases 3, 4, and 5 at 0.2 s.
Jmse 11 01937 g044
Figure 45. The average pressure of the gas–steam ejection flow field in the launcher under different throat diameters.
Jmse 11 01937 g045
Figure 46. The average temperature of the gas–steam ejection flow field in the launcher under different throat diameters.
Jmse 11 01937 g046
Figure 47. Changes in the weight of water in the water chamber under different throat diameters.
Jmse 11 01937 g047
Figure 48. Curve of projectile acceleration under different throat diameters.
Jmse 11 01937 g048
Figure 49. Curve of projectile velocity under different throat diameters.
Jmse 11 01937 g049
Figure 50. Curve of projectile displacement under different throat diameters.
Jmse 11 01937 g050
Table 1. Geometric dimensions of the gas–steam ejection device.
Geometric DimensionGeometric Length
First stage nozzle inlet diameterDh
Length of first stage nozzleLh
Water chamber lengthLc
Second stage nozzle diameterDs
Table 2. Comparison between experimental data and numerical simulation data.
Monitoring PointT1T2T3T4
Experimental temperature (K)471.36420.38460.26413.59
Simulation temperature (K)456.61405.73445.32407.24
Error3.13%3.48%3.25%1.54%
Table 3. Spray hole parameters considered.
CaseSpray Hole Diameter d/mmNumber of Rows
of Spray Holes
Number of Roles per RowSecondary Throat
Diameter/mm
14650120
24850120
341050120
441050110
541050100
66732120
78525120
810420120
Disclaimer/Publisher’s Note: The statements, opinions and data contained in all publications are solely those of the individual author(s) and contributor(s) and not of MDPI and/or the editor(s). MDPI and/or the editor(s) disclaim responsibility for any injury to people or property resulting from any ideas, methods, instructions or products referred to in the content.

