Article

Dynamic Co-Simulation Analysis and Control of an IEA 15 MW Offshore Floating Semi-Submersible Wind Turbine under Taiwan Offshore-Wind-Farm Conditions of Wind and Wave

Department of Engineering Science and Ocean Engineering, National Taiwan University, Taipei 106, Taiwan
*
Author to whom correspondence should be addressed.
J. Mar. Sci. Eng. 2023, 11(1), 173; https://doi.org/10.3390/jmse11010173
Submission received: 14 November 2022 / Revised: 20 December 2022 / Accepted: 3 January 2023 / Published: 10 January 2023
(This article belongs to the Special Issue Frontiers in Offshore Wind Energy)

Abstract

:
This study aims to develop dynamic co-simulation and control for analyzing the IEA 15 MW semi-submersible floating wind turbine under Taiwan offshore-wind-farm conditions of wind and wave. The IEA 15 MW wind turbine is mounted on a UMaine VolturnUS-S reference platform with a mooring system designed for a water depth of 70 m, in this study. The dynamic co-simulation combines software of SIMPACK, MATLAB/SIMULINK, AeroDyn, HydroDyn, WAMIT, and MAP++ to achieve the complex dynamic simulation of aerodynamics, hydrodynamics, mechanism dynamics and control system dynamics. In addition, this study proposes a novel power-control strategy combining fuzzy sliding-mode control with additional pitching-rate feedback. Since the motion of the floating platform, especially the pitching motion, contributes to power oscillation, the proposed novel power-control strategy with additional pitching-rate feedback can reduce the influence of the floating-platform oscillation motion, and is verified under different conditions.

1. Introduction

With a sense of net-zero carbon policies arising, many countries are actively pushing forward environment-friendly policies. As for Taiwan, fossil fuel accounts for over 80 percent of energy generation. [1] It will produce greenhouse gas and speed up global warming. Therefore, to decrease carbon emissions, the government aims to build a large number of renewable-energy power-generation facilities to replace this unclean power. Therefore, it is necessary to create renewable energy. Offshore-wind energy plays one of the most important roles.
According to the report regarding potential zones around the world, from the engineering consultancy 4C Offshore in 2022, there were 16 potential wind farms in the Taiwan Strait in the top 20 of the world’s best wind farms [2]. The wind-speed diagram is shown in Figure 1. Thus, the Taiwan government planned to develop offshore wind farms in the Taiwan Strait in three phases: Phase 1, the Offshore Demonstration Incentive Program; Phase 2, the Directions of Zone Application for Planning; Phase 3, Offshore Zonal Development [3].
In Phase 1, there are two demonstration wind farms, with 237 MW in total, including Formosa 1 [4] and Taipower 1 [5]. They were completed in 2019 and 2021, respectively. In Phase 2, 5.5 GW was allocated, and was expected to be commissioned by 2025. For Phase 3 Zonal Development, the Minister of Economic Affairs (MOEA) of Taiwan plans to release 1.5 GW every year, from 2026 to 2035 [6]. In 2035, the total installation capacity will achieve 20.7 GW. To reach the goal, some developers plan to build the farm in the deeper-water area, deeper than 60 m. The floating-type foundation of the wind turbine will be in demand, as shown in Figure 1.
For the offshore wind-turbine control, the blade-pitch angle needs to be adjusted to change the input wind energy if the wind speed is over the rated value. Boukhezzar et al. [7] proposed a multivariable control strategy for variable speed and pitch by combining a state-feedback torque control. Lindeberg el al. [8] made the smooth transition between the control region by a linear model of predictive control. Frank Lemmer applied a robust gain-scheduling baseline controller for a blade-pitch control system with a DTU-10 MW floating wind turbine. This controller performance was compared with other controllers and a fixed-bottom version, and indicated possible remedies for floating wind-turbine control. Bashetty et al. [9] used an adaptive control to vary the blade-pitch angle for generating optimal power and reducing platform-motions. The simulation showed an improvement in power fluctuation and rotor speed-regulation under turbulent flow and irregular wave environmental-conditions. Based on the adaptive control theory, Plestanet al. [10] applied an adaptive second-order sliding-mode approach, which could be implemented with a nonlinear uncertain system.
The objective of this study is to develop a dynamic co-simulation and control for analyzing the IEA 15 MW semi-submersible floating wind turbine, under Taiwan offshore-wind-farm conditions of wind and wave. The IEA 15 MW wind turbine is mounted on a UMaine VolturnUS-S reference platform, with a mooring system designed for a water depth of 70 m, in this study. The dynamic co-simulation combines software from SIMPACK, MATLAB/SIMULINK, AeroDyn, HydroDyn, WAMIT, and MAP++ to achieve a complex dynamic simulation of aerodynamics, hydrodynamics, mechanism dynamics and control system dynamics. In addition, this study proposes a novel power-control strategy combining fuzzy sliding-mode control with additional pitching-rate feedback Since the motion of the floating platform, especially the pitching motion, contributes to power oscillation, the proposed novel power-control strategy with pitching-rate feedback can reduce the influence of the floating-platform oscillation motion, verified under normal and extreme conditions.

2. Simulation Software Framework

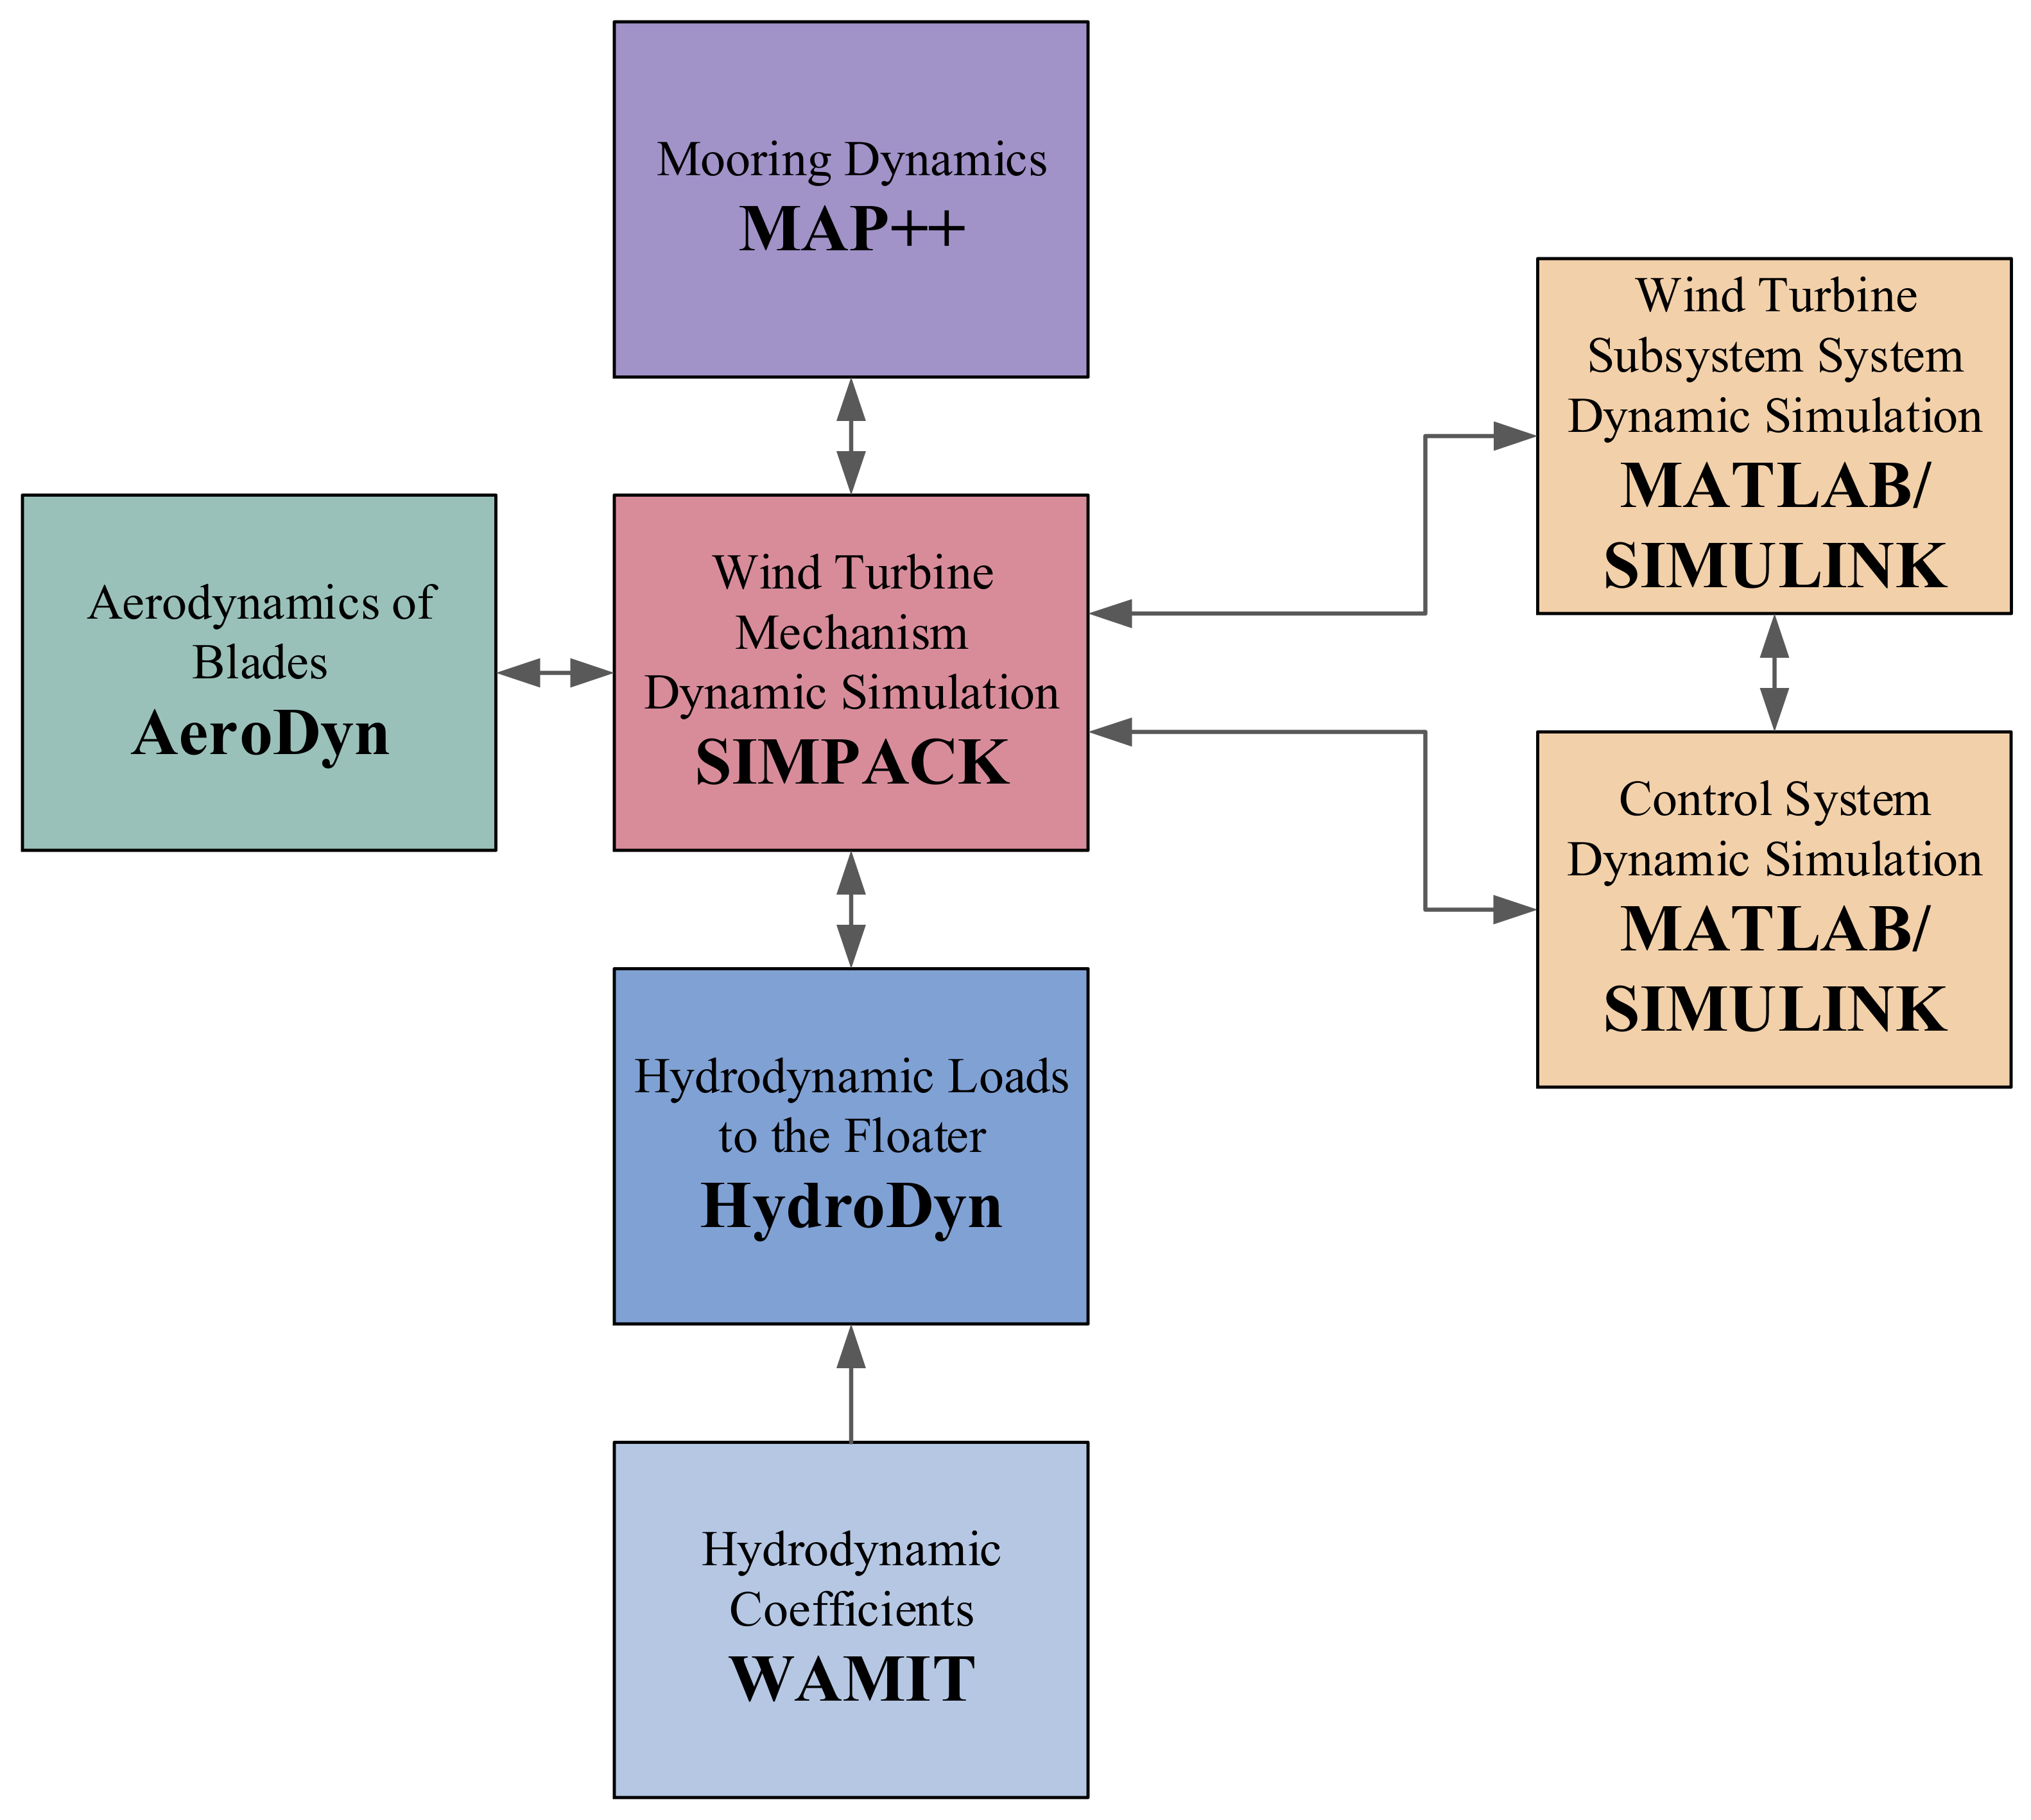
In this study, a complex dynamic co-simulation is developed for analyzing the IEA 15 MW semi-submersible floating wind turbine, which combines the software MATLAB/SIMULINK, SIMPACK, AeroDyn [11], HydroDyn [12], WAMIT, and MAP++ [13] to implement the dynamic co-simulation of aerodynamics, hydrodynamics, mechanism dynamics and control system dynamics. A floating offshore wind turbine (FOWT) is a complicated system.
In this research, the floating-wind-turbine and floating-platform model are developed in SIMPACK. The wind-turbine control systems, including the generator, grid-connected system, power control system, and the hydraulic blade-pitch control subsystem, are derived from and developed using MATLAB/SIMULINK. Combined with the software AeroDyn, HydroDyn, MAP++, which are shown in Figure 2, the aerodynamic forces, hydrodynamic loads, and the mooring-line dynamic response can be analyzed simultaneously.

3. 15 MW Floating-Wind-Turbine Model

The IEA 15 MW floating wind turbine model is implemented in SIMPACK, including the 15 MW wind turbine and the semi-submersible floating platform.

3.1. Wind-Speed and Wave Conditions

Wind speed increases with altitude. The “wind profile power law” [14] is shown as follows. For open water, the power-law component, α , is set as 0.2. In this study, the height of the floating wind turbine, z , is 150 m, as
v = v 0 ( z z 0 ) α
where v 0 indicates the wind speed at height z 0 ; z is the hub height; z 0 is the reference height, 10 m; α is the power law exponent, which is 0.2 in this study.
The JONSWAP spectrum is used to generate the irregular wave for test conditions in this study. The JONSWAP spectrum is derived from the combination of the Pierson–Moskowitz spectrum, the peak enhancement factor, γ , and the normalizing factor, A . The JONSWAP spectrum is applied to generate irregular waves for the Taiwan offshore-wind-farm conditions in this study, where the wave period is defined as 7.8 s. The current velocity is defined as 1.5 m/s. The peak enhancement factor of JONSWAP spectrum, γ , is set as 1.5 [15].
The Pierson–Moskowitz spectrum, S P M ( ω ) , is defined as Equation (2):
S P M ( ω ) = 5 16 H s 2 ω p 4 ω 5 e 5 4 ( ω ω p ) 4
ω p = 2 π T p
The JONSWAP spectrum can be derived as
S J ( ω ) = A S P M ( ω ) γ r
r = e ( ( ω ω p ) 2 2 σ 2 ω p 2 )
where Hs is significant wave height; ω p is spectral peak frequency; T p is peak frequency; A = 1 0.287 ln ( γ ) indicates the normalizing factor; γ is the enhancement factor; σ is the spectral-width parameter.
Wave height can be defined by the Beaufort scale table [16]. The Beaufort scale is a measure to observe conditions at sea or on land. Table 1 is the Beaufort scale table, including the Beaufort number, wind speed and the corresponding wave-height.

3.2. 15 MW Floating-Wind-Turbine Model

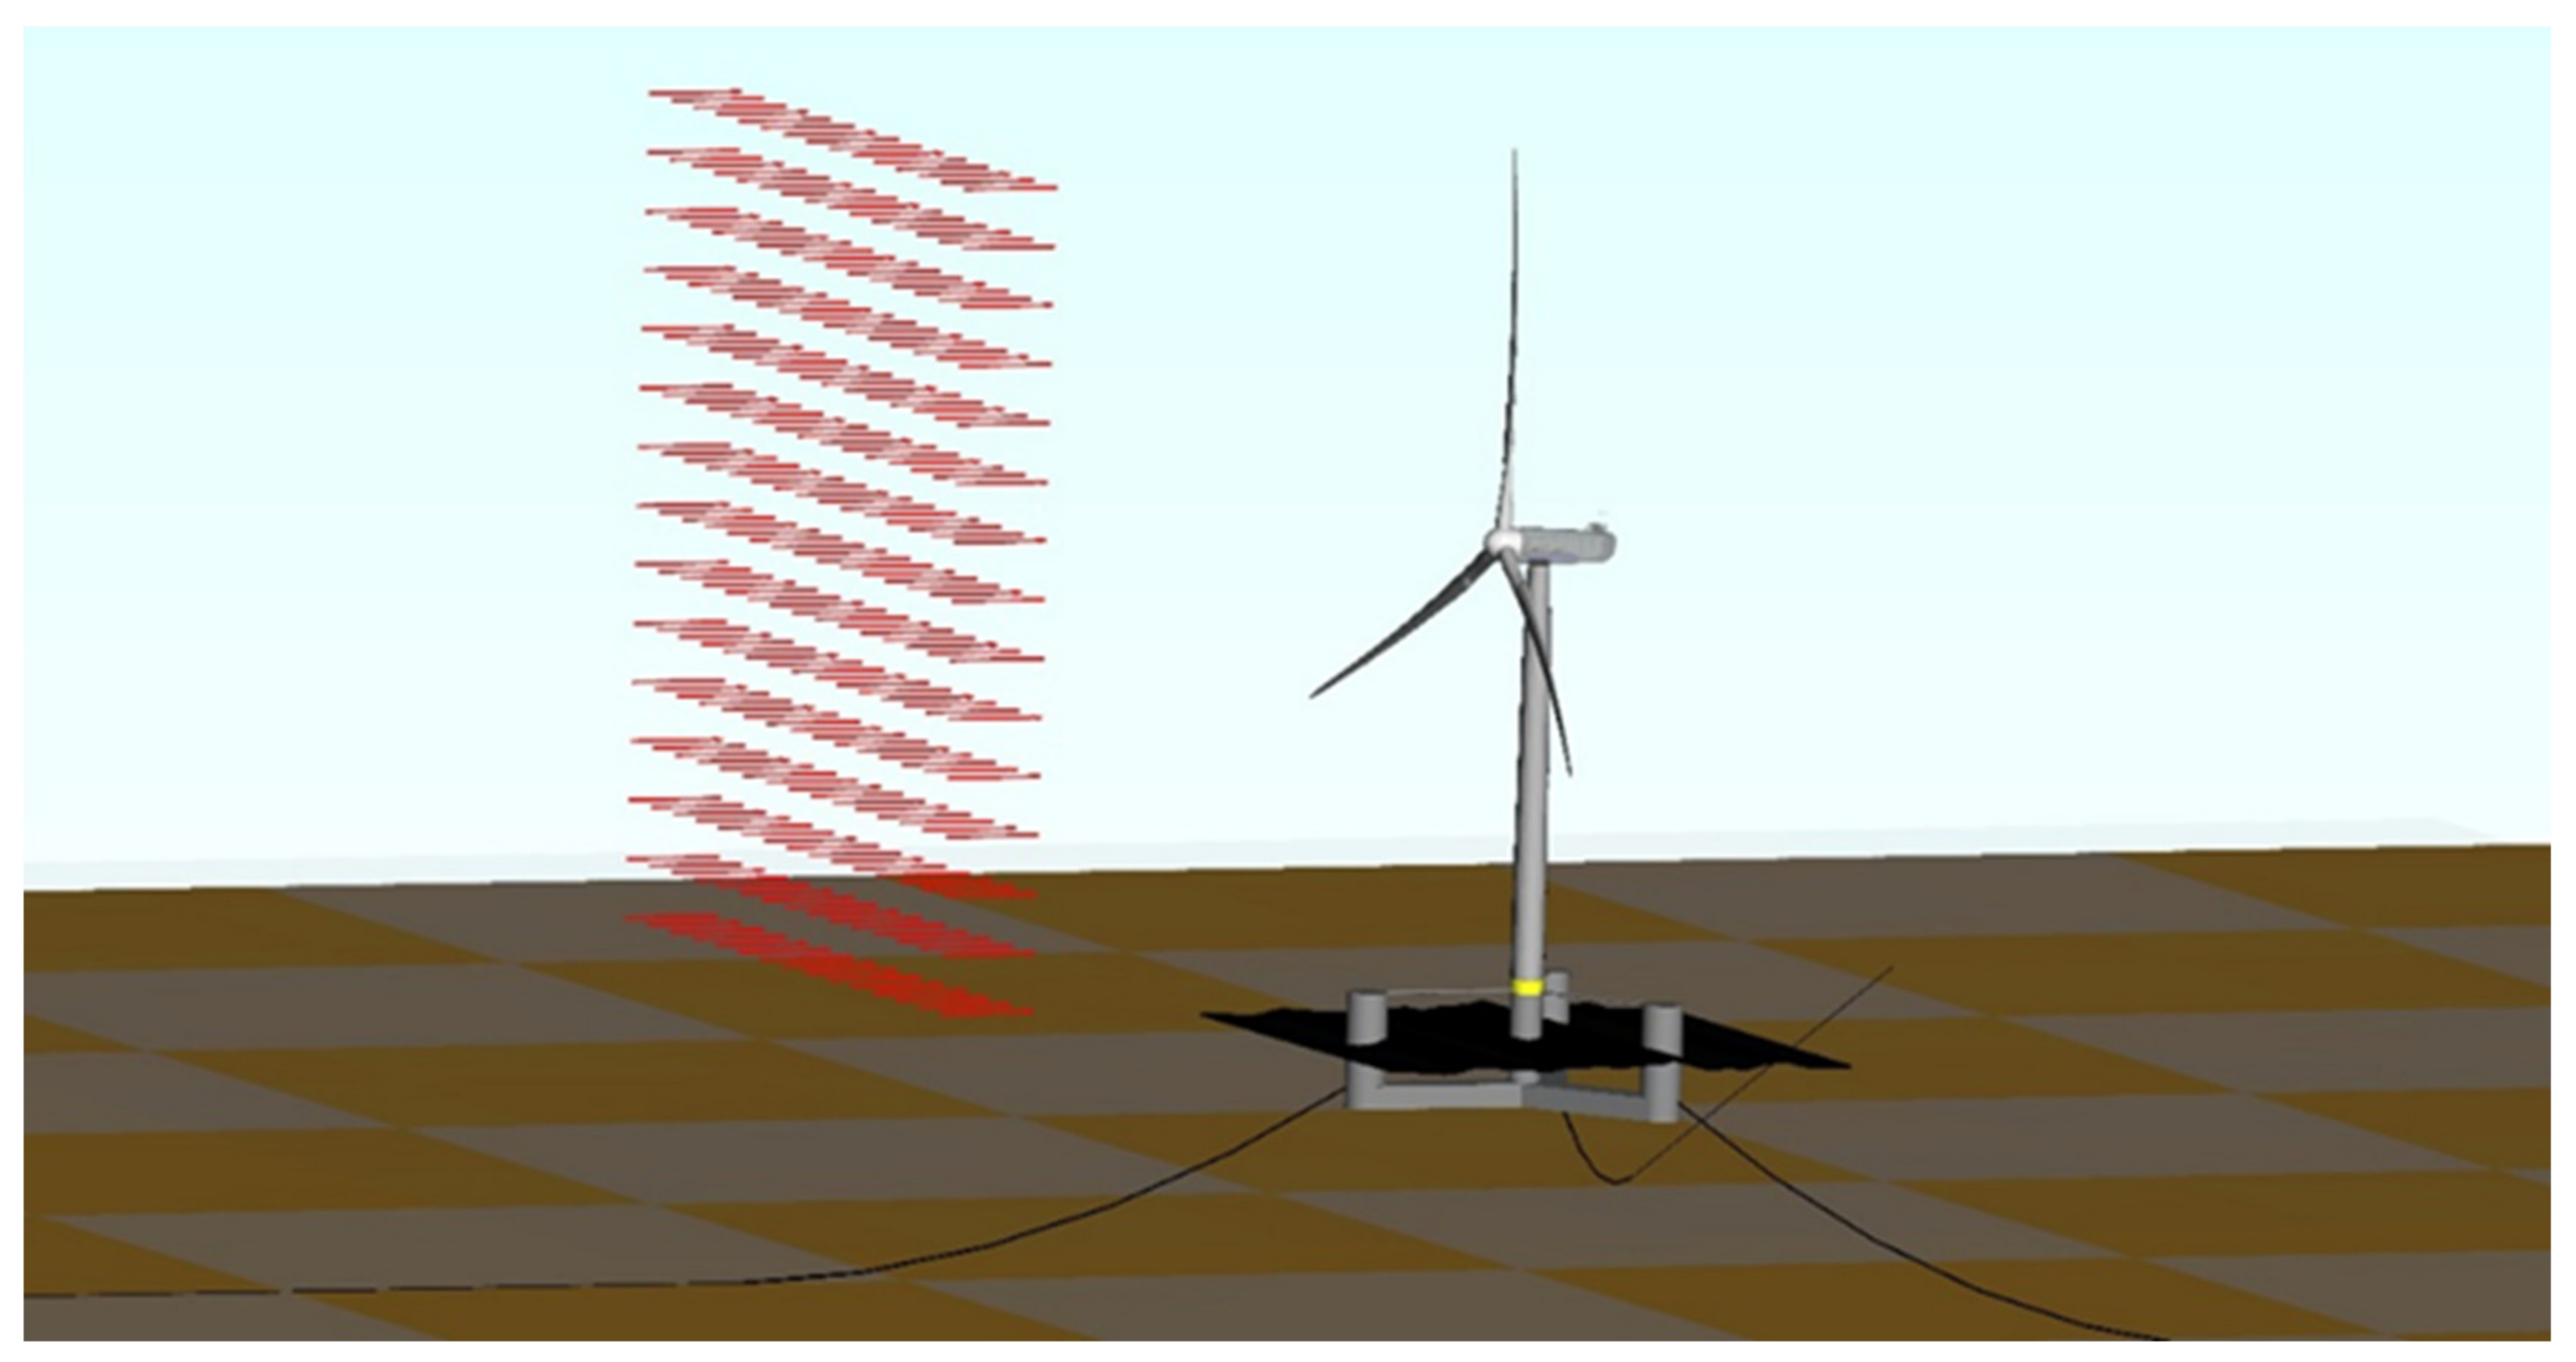
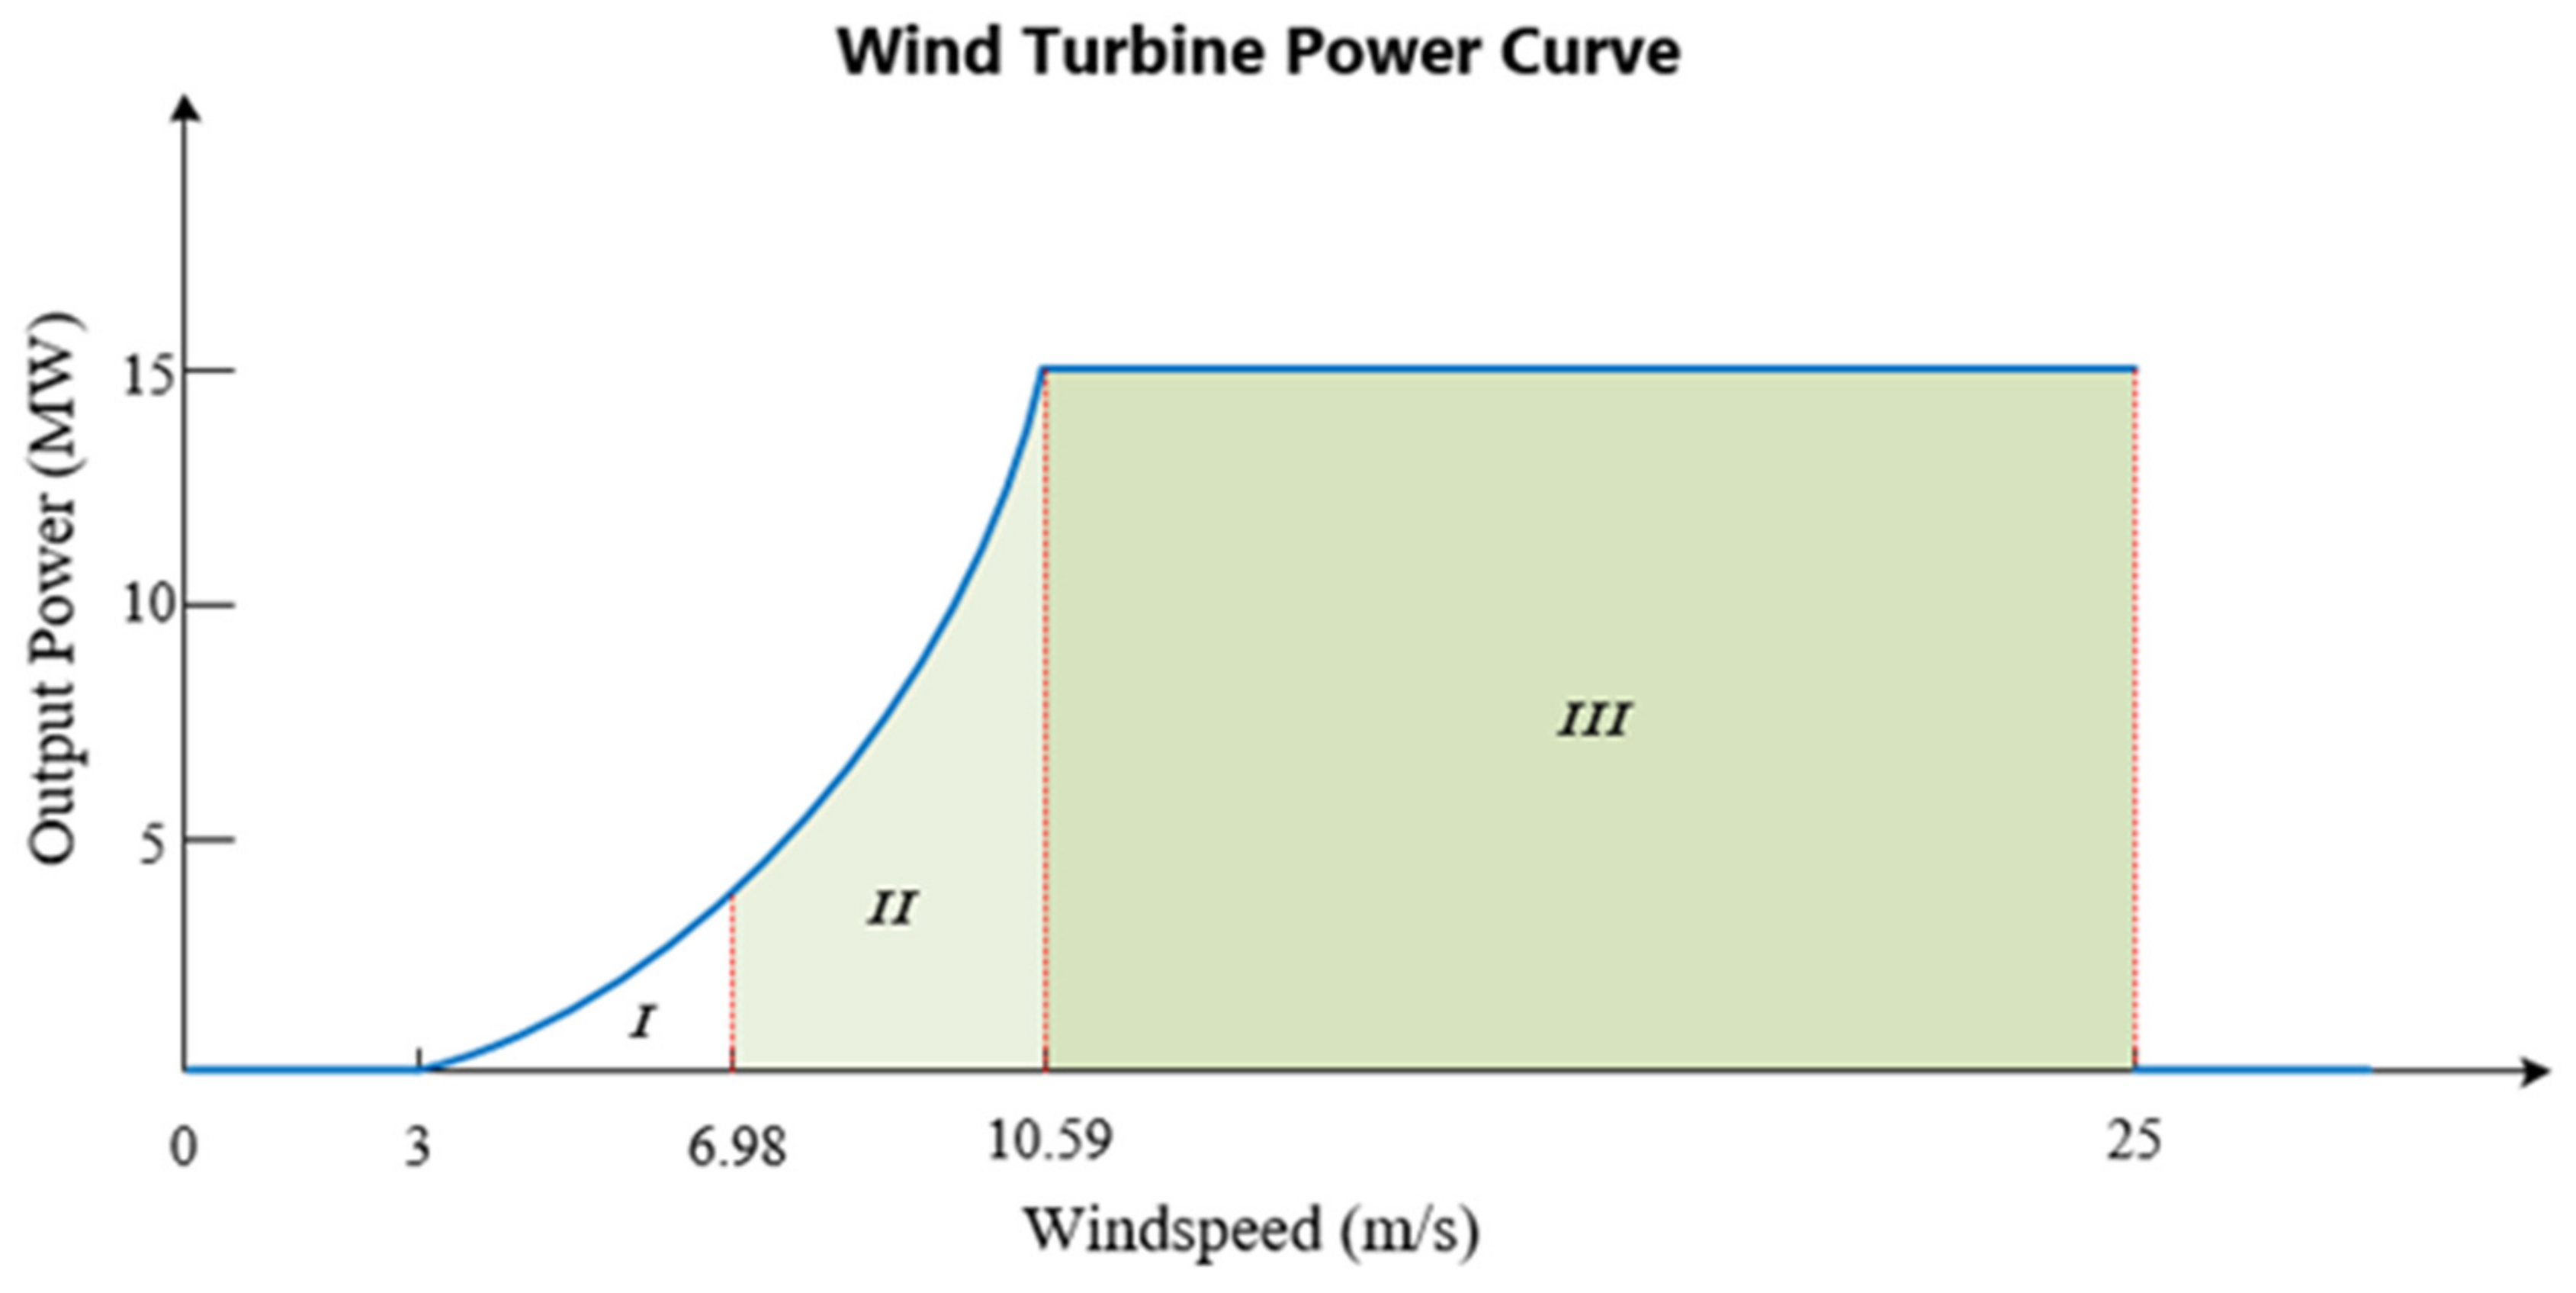
The 15 MW floating wind turbine is designed with cut-in wind speed of 3 m/s, cut-out wind speed of 25 m/s, and a rated wind speed of 10.59 m/s. The floating-wind-turbine model includes tower, blade, floating platform and mooring system. The tower, blade, rotor, and nacelle were designed by NREL and DTU [17]. The semi-submersible floating support-structure of the UMaine VolturnUS-S reference platform [18] is used, which is the mooring system designed in this study for a water depth of 70 m, to satisfy the Taiwan offshore-wind-farm condition. Figure 3 shows the simulation model of the 15 MW floating wind turbine with the UMaine VolturnUS-S semi-submersible floating platform and the mooring system for a water depth of 70 m. Table 2 shows the IEA 15 MW wind-turbine specifications. Table 3 lists the floating-tower geometric properties. The blade key parameters are shown in Table 4.

3.3. Floating-Platform and Mooring-System Model

This floating UMaine VolturnUS-S reference platform is a four-column, steel semisubmersible platform, whose properties are shown in Table 5, including hull displacement, steel mass, and ballast mass, etc. Figure 4 shows the floating platform in the SIMPACK simulation model. The wind-turbine tower is mounted on the center of the floating platform. The total mass of the floating platform is 17,854 ton, including structural steel, the fixed ballast, and the seawater-ballast flooding the majority of the three pontoons.
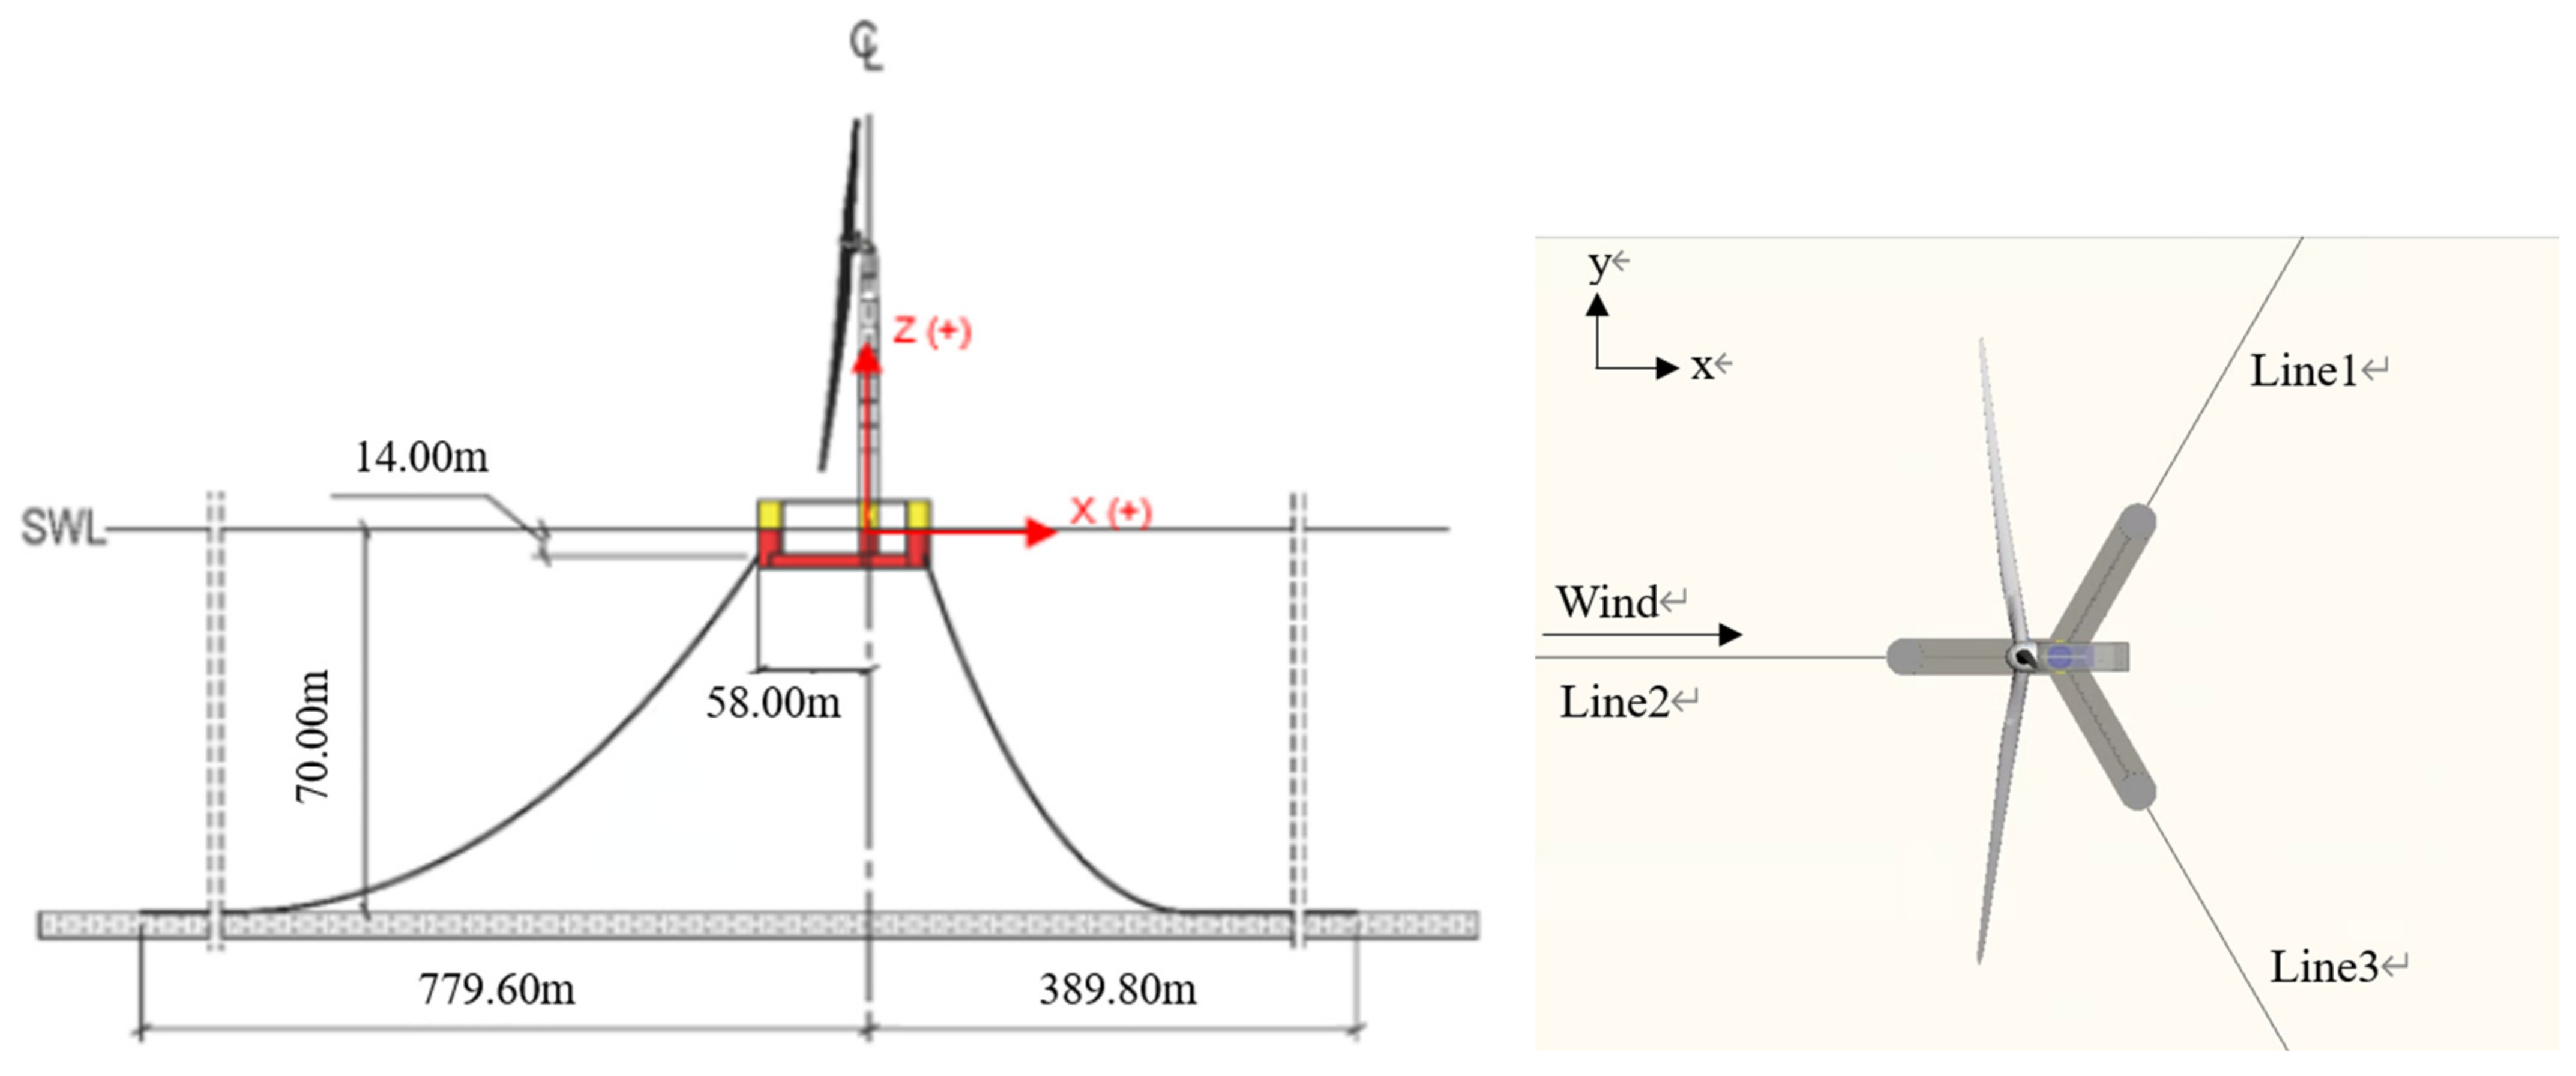
The chain-mooring-system model for the UMaine VolturnUS-S reference platform is designed for a 70 m water-depth in this paper, whose detailed mooring-system properties are listed in Table 6. This mooring system includes three 789.64 m long of catenary-chain lines. The diameter of each line is 0.185 m, and the density is 685 kg per meter. Each line is connected at the fairlead which is 14 m below the sea surface The mooring lines are located at a water depth of 70 m and spaced radially 779.6 m from the center of the tower. Figure 5 shows the configuration of the mooring lines. Line 2 is the mooring line parallel to the wind. Thus, line 2 can represent the response of the mooring system.

4. Subsystem Modeling of Floating-Wind-Turbine System

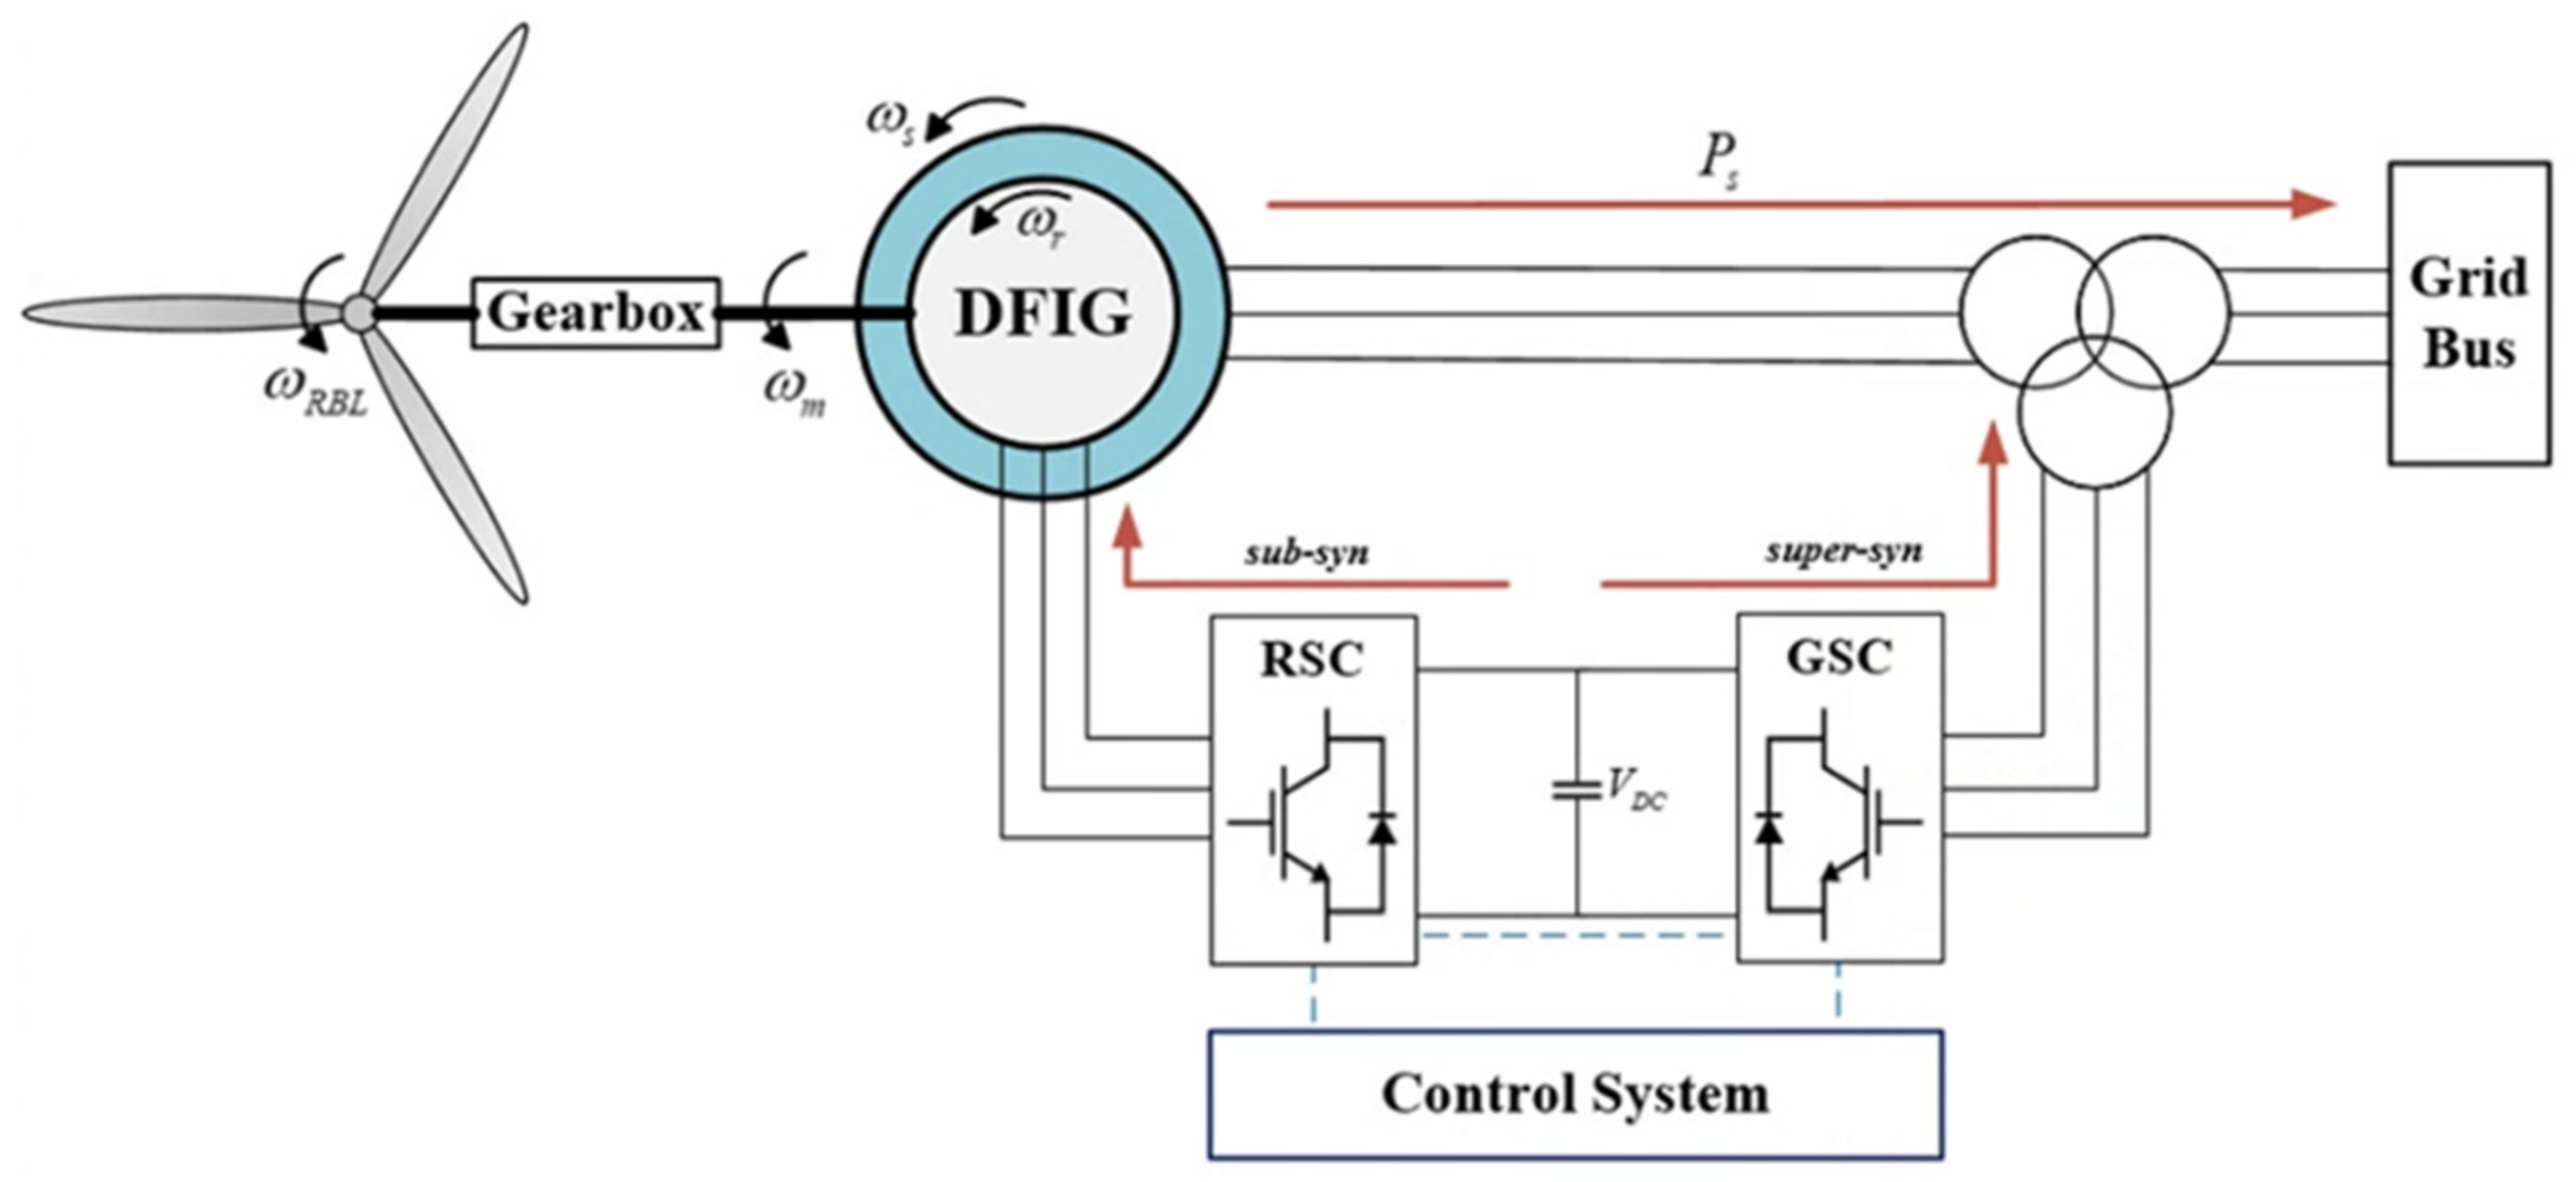
The subsystem modeling of the floating-wind-turbine system includes a doubly-fed induction generator (DFIG), grid-connected system and hydraulic pitch-control system. Figure 6 shows the subsystem modeling of the floating-wind-turbine system. The grid-connected system can be divided into a converter and a filter. Consequently, the hydraulic pitch-control system and the mathematical model are derived.

4.1. Doubly-Fed Induction Generator

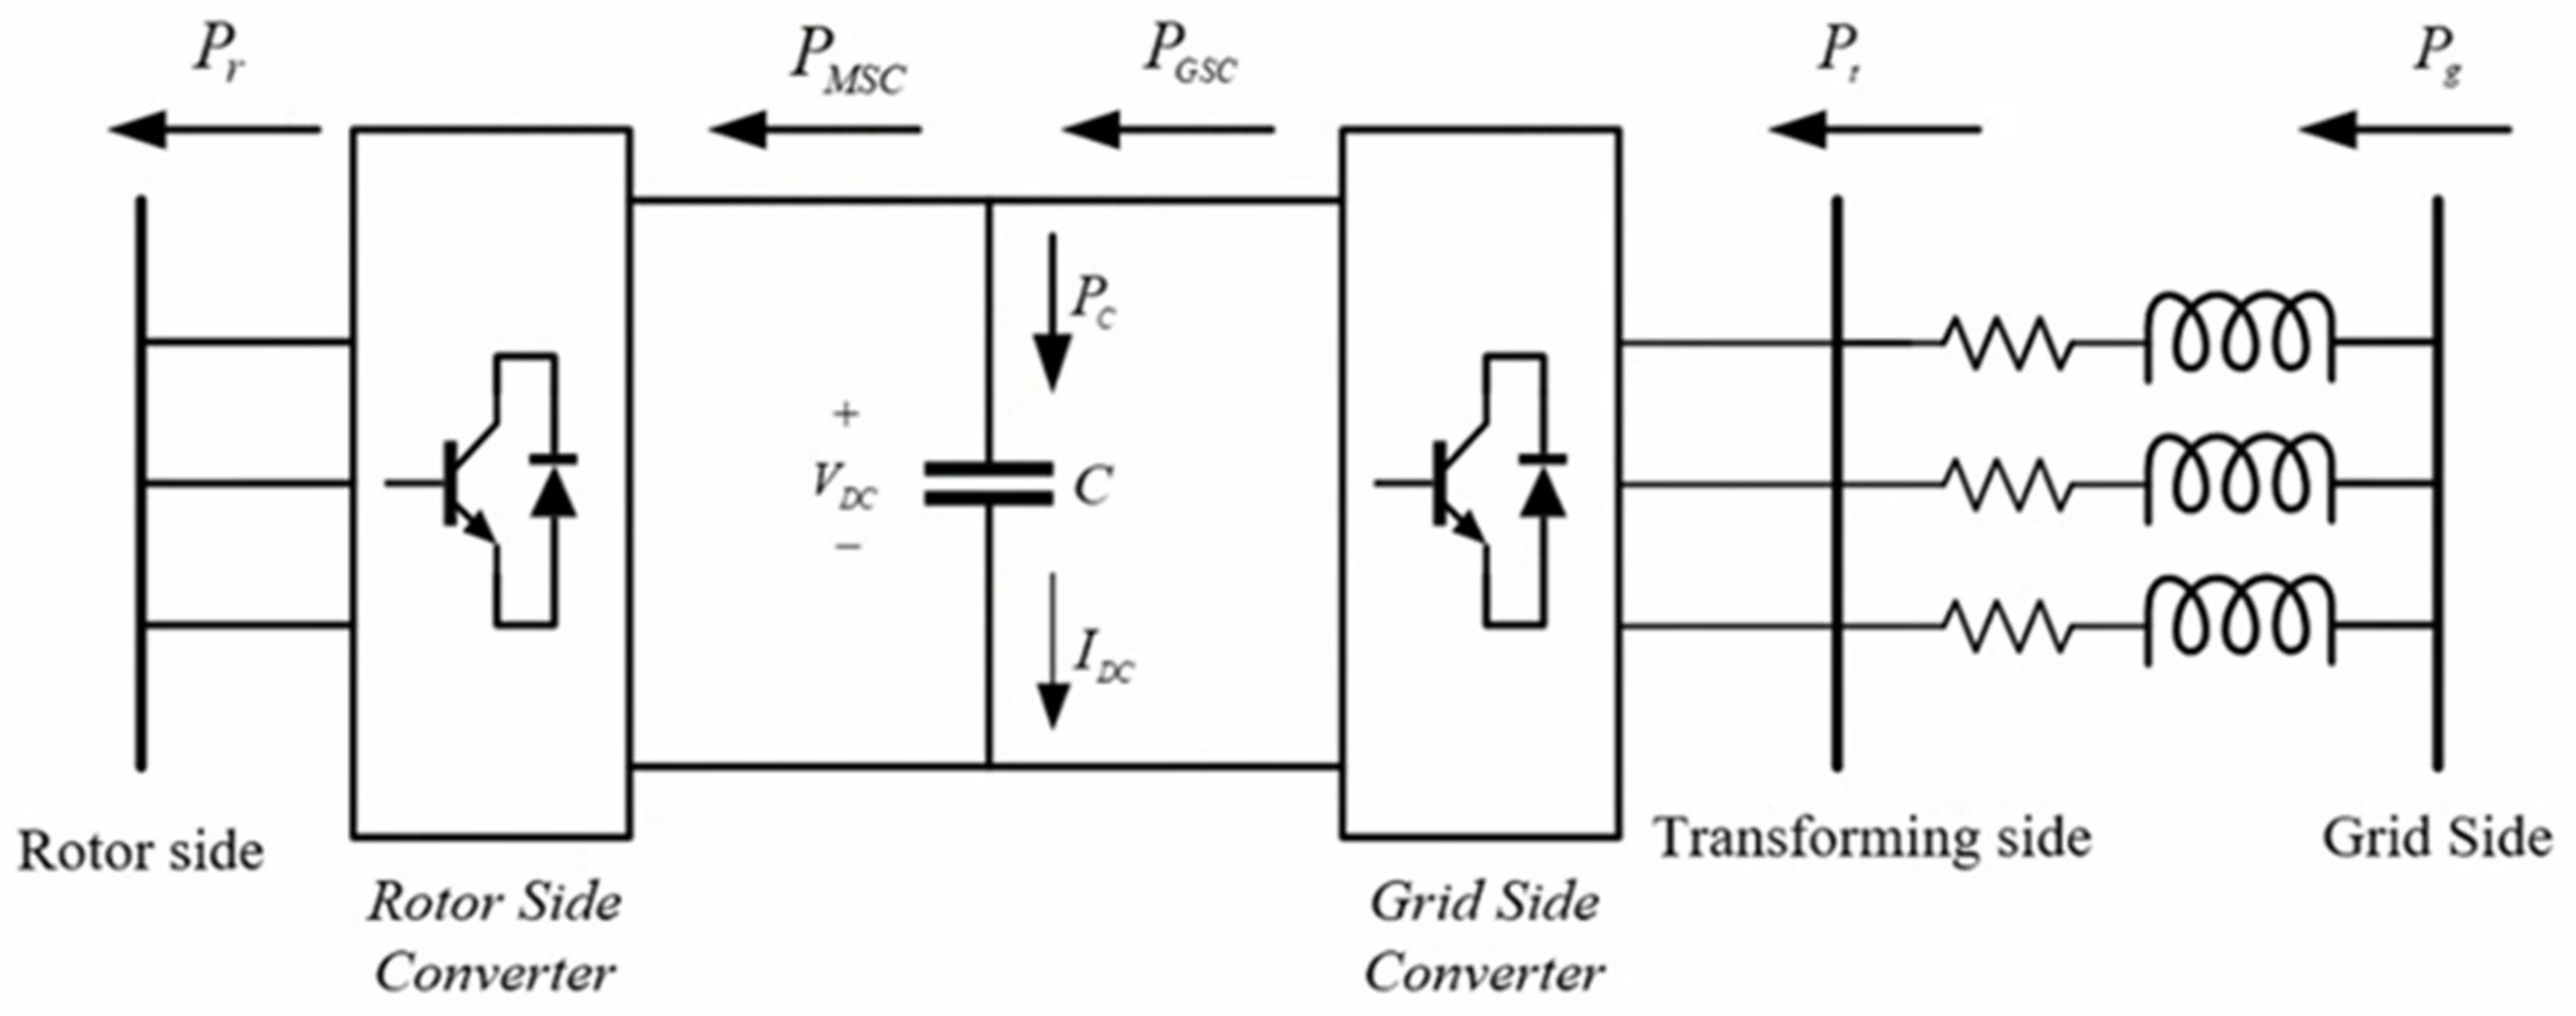
The power electronic interface controls the rotor currents to achieve variable speed in different wind conditions. The DFIG uses a back-to-back converter design between the rotor and the grid to optimize a rotor speed control with reduced cost and power losses. The rotor of the DFIG is commonly connected to the grid side by a power converter. This converter can control the voltage applied to the rotor and frequency of the magnetic field or speed. In addition, this benefit of the generator includes the separate control of active and reactive power, or the wind-turbine-control power factor. The generator also allows the output voltages to be maintained at a constant value when used in wind turbines.
For the mechanism of the generator, the wind force is exerted on the blades, to transfer the wind energy to mechanical energy through the main shaft. Following this, the blade rotor-speed increases on the generator side, by the gearbox, in order to pass to the generator. Thus, the DFIG system produces power and sends it back to the grid-bus side through the converter control system.
The stator and the rotor of the DFIG are connected to the individual three-phase power supply. On the stator side, the power supply of the stator-winding is identical to the frequency grid. On the rotor side, the converter system provides electrical power to the rotor-winding, and the magnitude, phase and frequency of the input voltage of the converter can be modulated on demand.

4.2. Grid-Connected System

The power of the DFIG is exported to the stator side and to the rotor side, in turn. The power frequency on the stator side is equivalent to the grid, so the power is fed into the grid directly. In contrast, the power frequency on the rotor side changes with the generator rotor-speed, so it has to be transferred by the grid-connected system. Figure 7 shows the DFIG grid-connected system structure, including converter and filter.

4.3. Hydraulic Variable-Pitch Control System

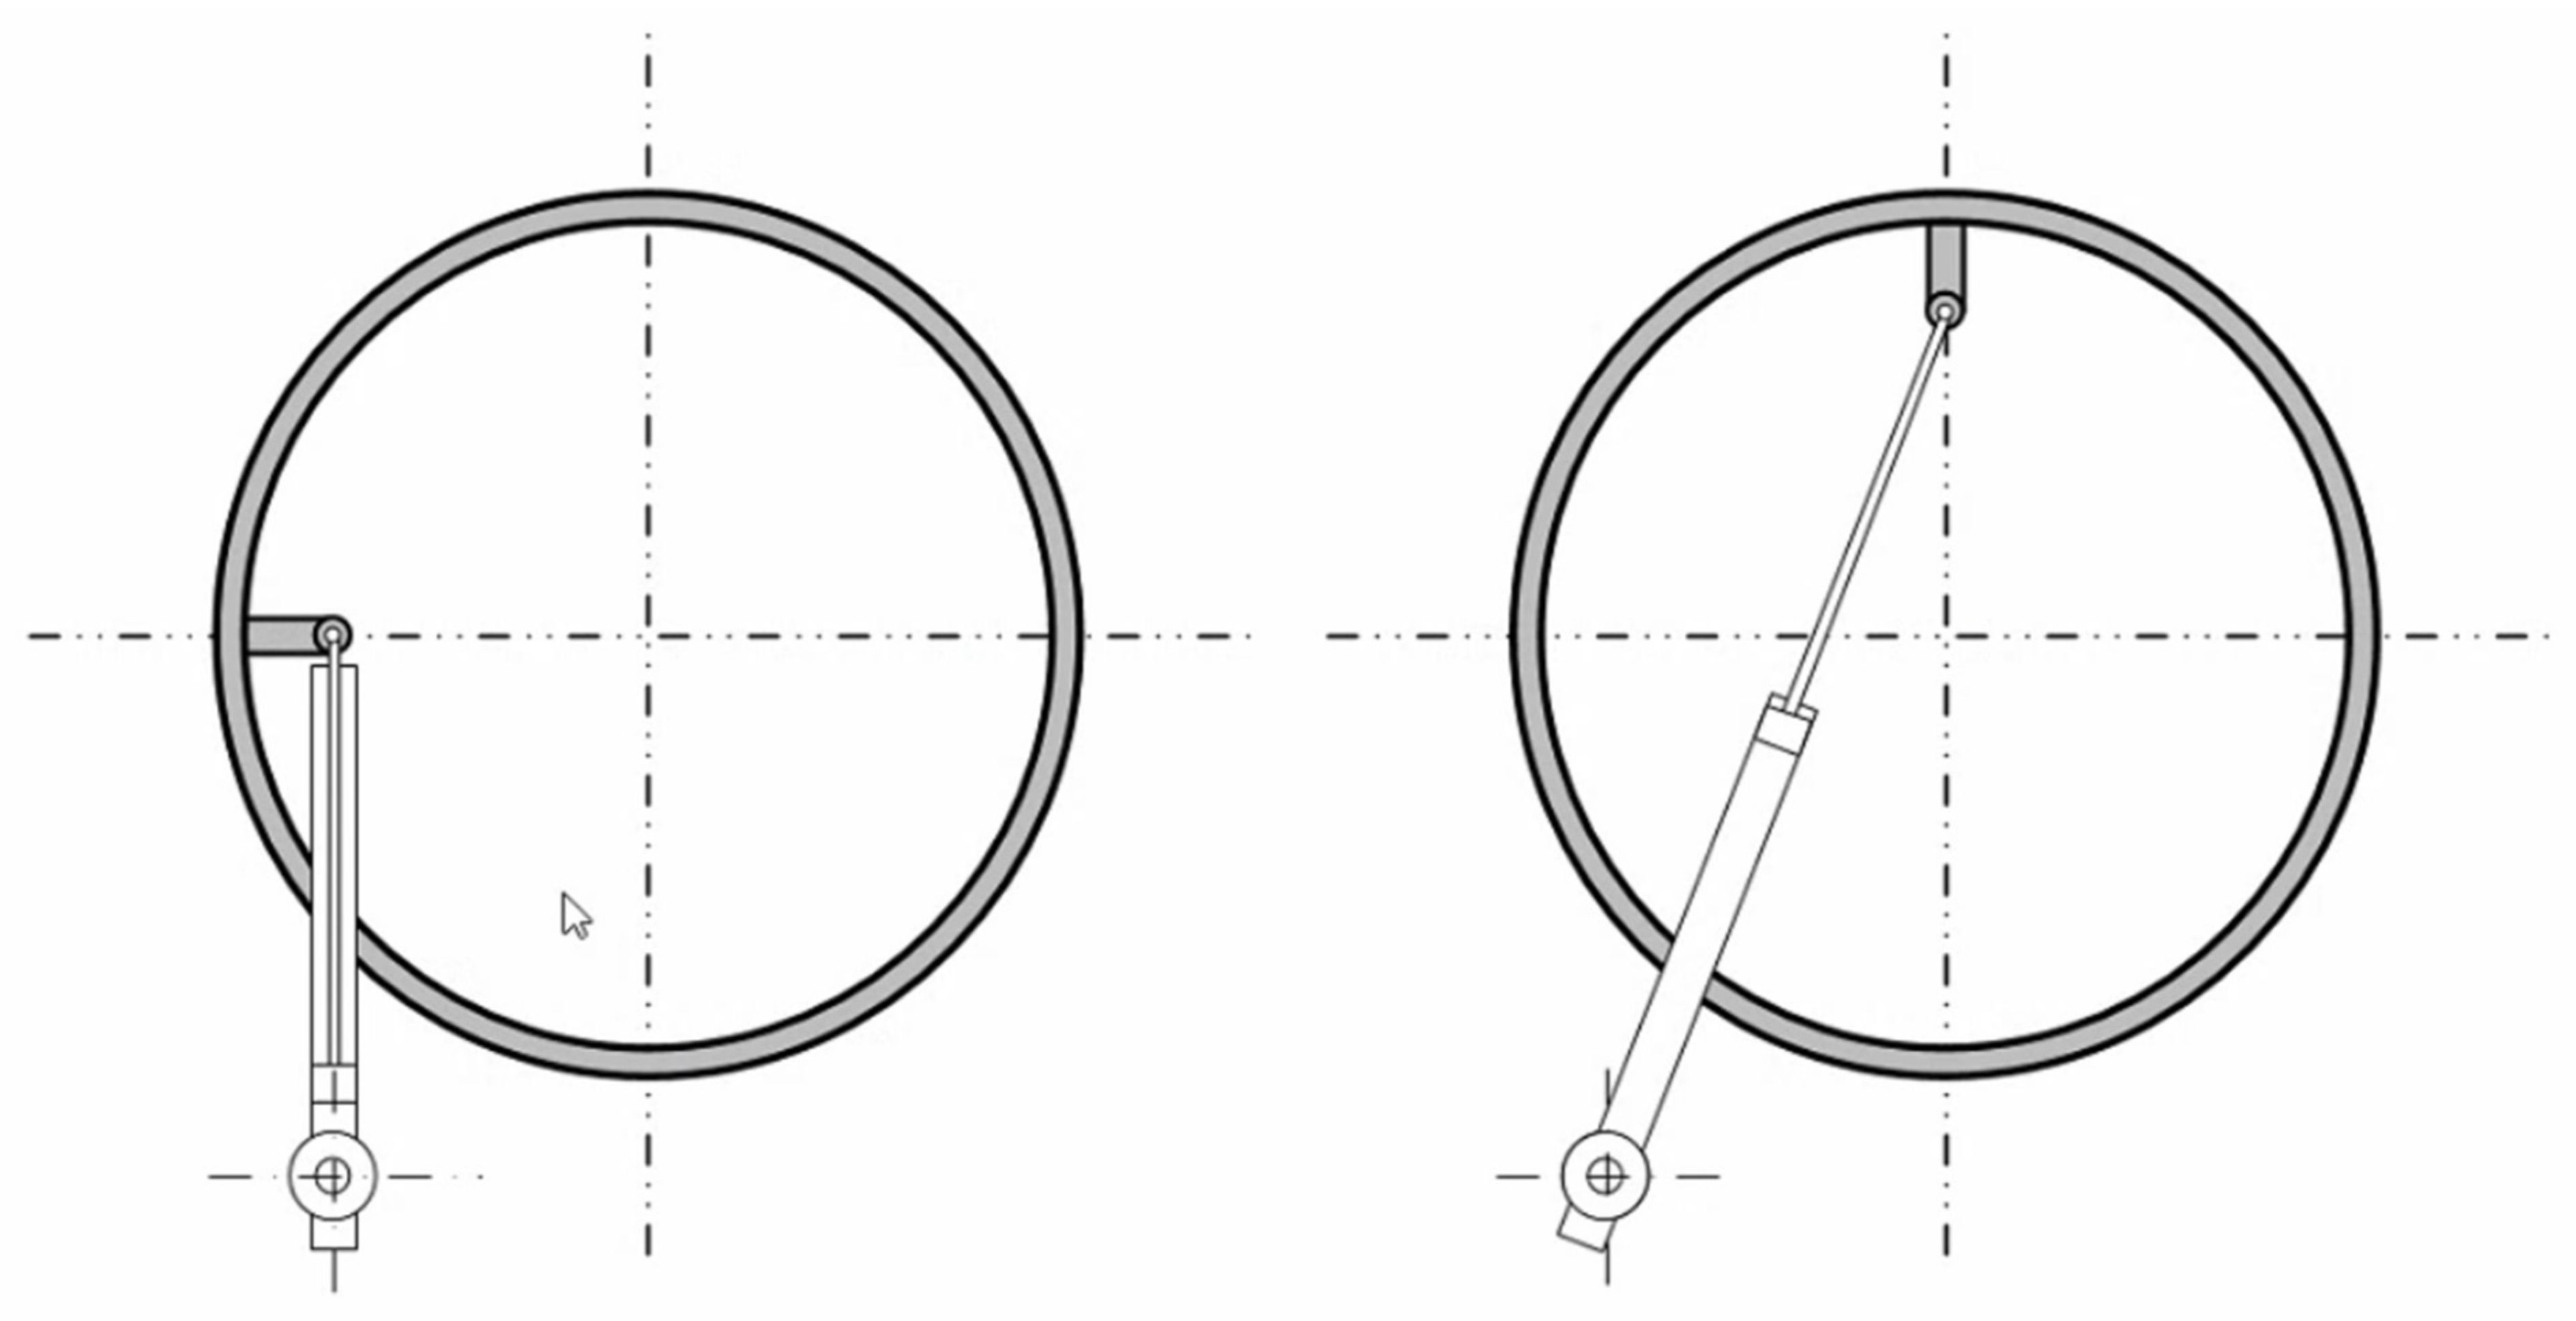
The power control system with a hydraulic variable-pitch control system aims to reduce the wind power captured above the rated wind speed and mitigate the mechanical stress. With the limitation of wind-energy capture, the wind turbine can also control the output power indirectly. In this study, the hydraulic servo-control system is used to drive the blade-pitch control system. The layout of the hydraulic pitch-control system is shown in Figure 8.

5. 15 MW Wind-Turbine Control

5.1. 15 MW Wind-Turbine Control Strategy

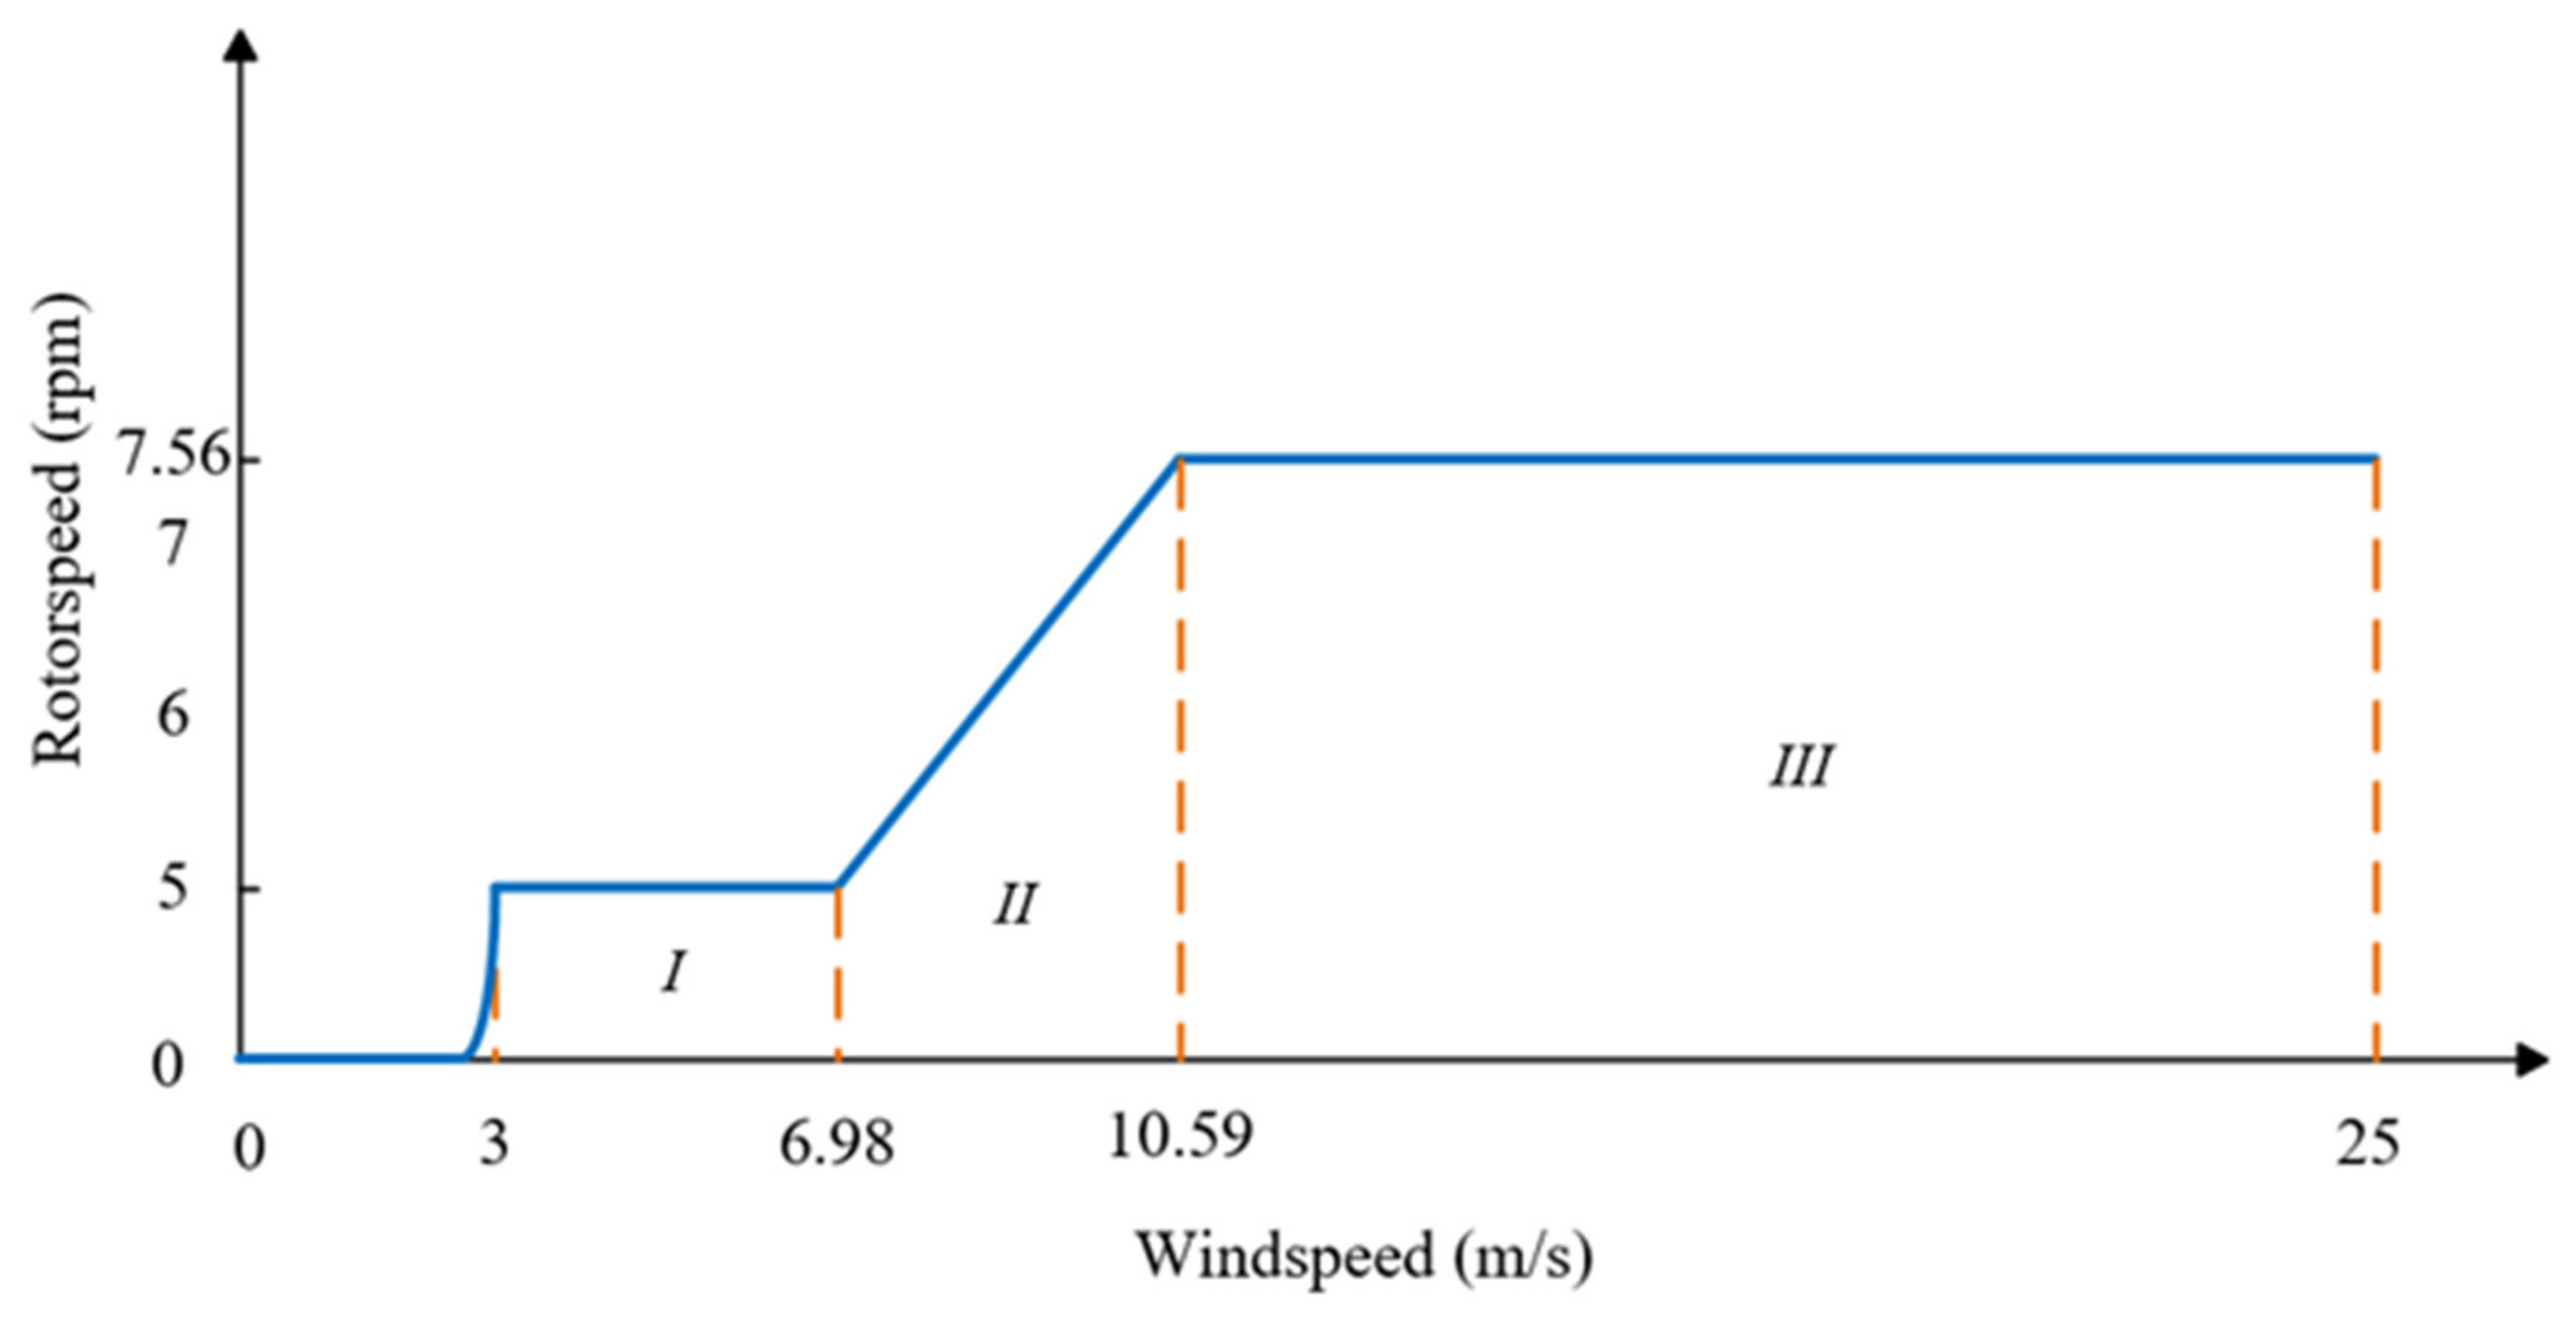
The control strategy of the 15 MW wind turbine is divided into three different parts related to the wind speed: Region I—Minimum Rotor Speed; Region II—Optimal Tip-speed Ratio; Region III—Rated Power. The wind-turbine power curve is shown in Figure 9. The relationship between wind speed and rotor speed is shown in Figure 10.
  • Region I: Minimum Rotor Speed
The control strategy aims to keep the minimum rotor speed at 5 rpm, to avoid the resonance frequency of the tower and to protect the wind turbine.
  • Region II: Optimal Tip-Speed Ratio
The rotor speed rises with the increase in wind speed, in order to keep the optimal tip-speed ratio. The blades gain all possible power through the wind, and the blade-pitch angles are fixed at 0° until the wind speed and rotor speed reach the rated speed.
  • Region III: Rated Power
As the wind speed reaches 10.59 m/s, the maximum rated output-power is achieved. Therefore, it is necessary to utilize the blade-pitch control system to limit the tip-speed ratio to keep the power rated. With the decrease in the tip-speed ratio, it means that the blades reduce the wind-energy capture. It not only reduces the excess load of the blades, but also mitigates the power for generator control.

5.2. Control Theory and Power-Controller Design

5.2.1. Fuzzy Sliding-Mode Control

The floating wind turbine is a complicated system, including blades, a generator, and a floating platform, etc. The relationship between each component and external forces is not easy to express. The mathematical model of the floating wind turbine is nonlinear, and the accurate state of the wind turbine is difficult to derive. Therefore, it is appropriate to develop the control system using a model-free controller. In this study, the power control system is developed by fuzzy sliding-mode control (FSMC).
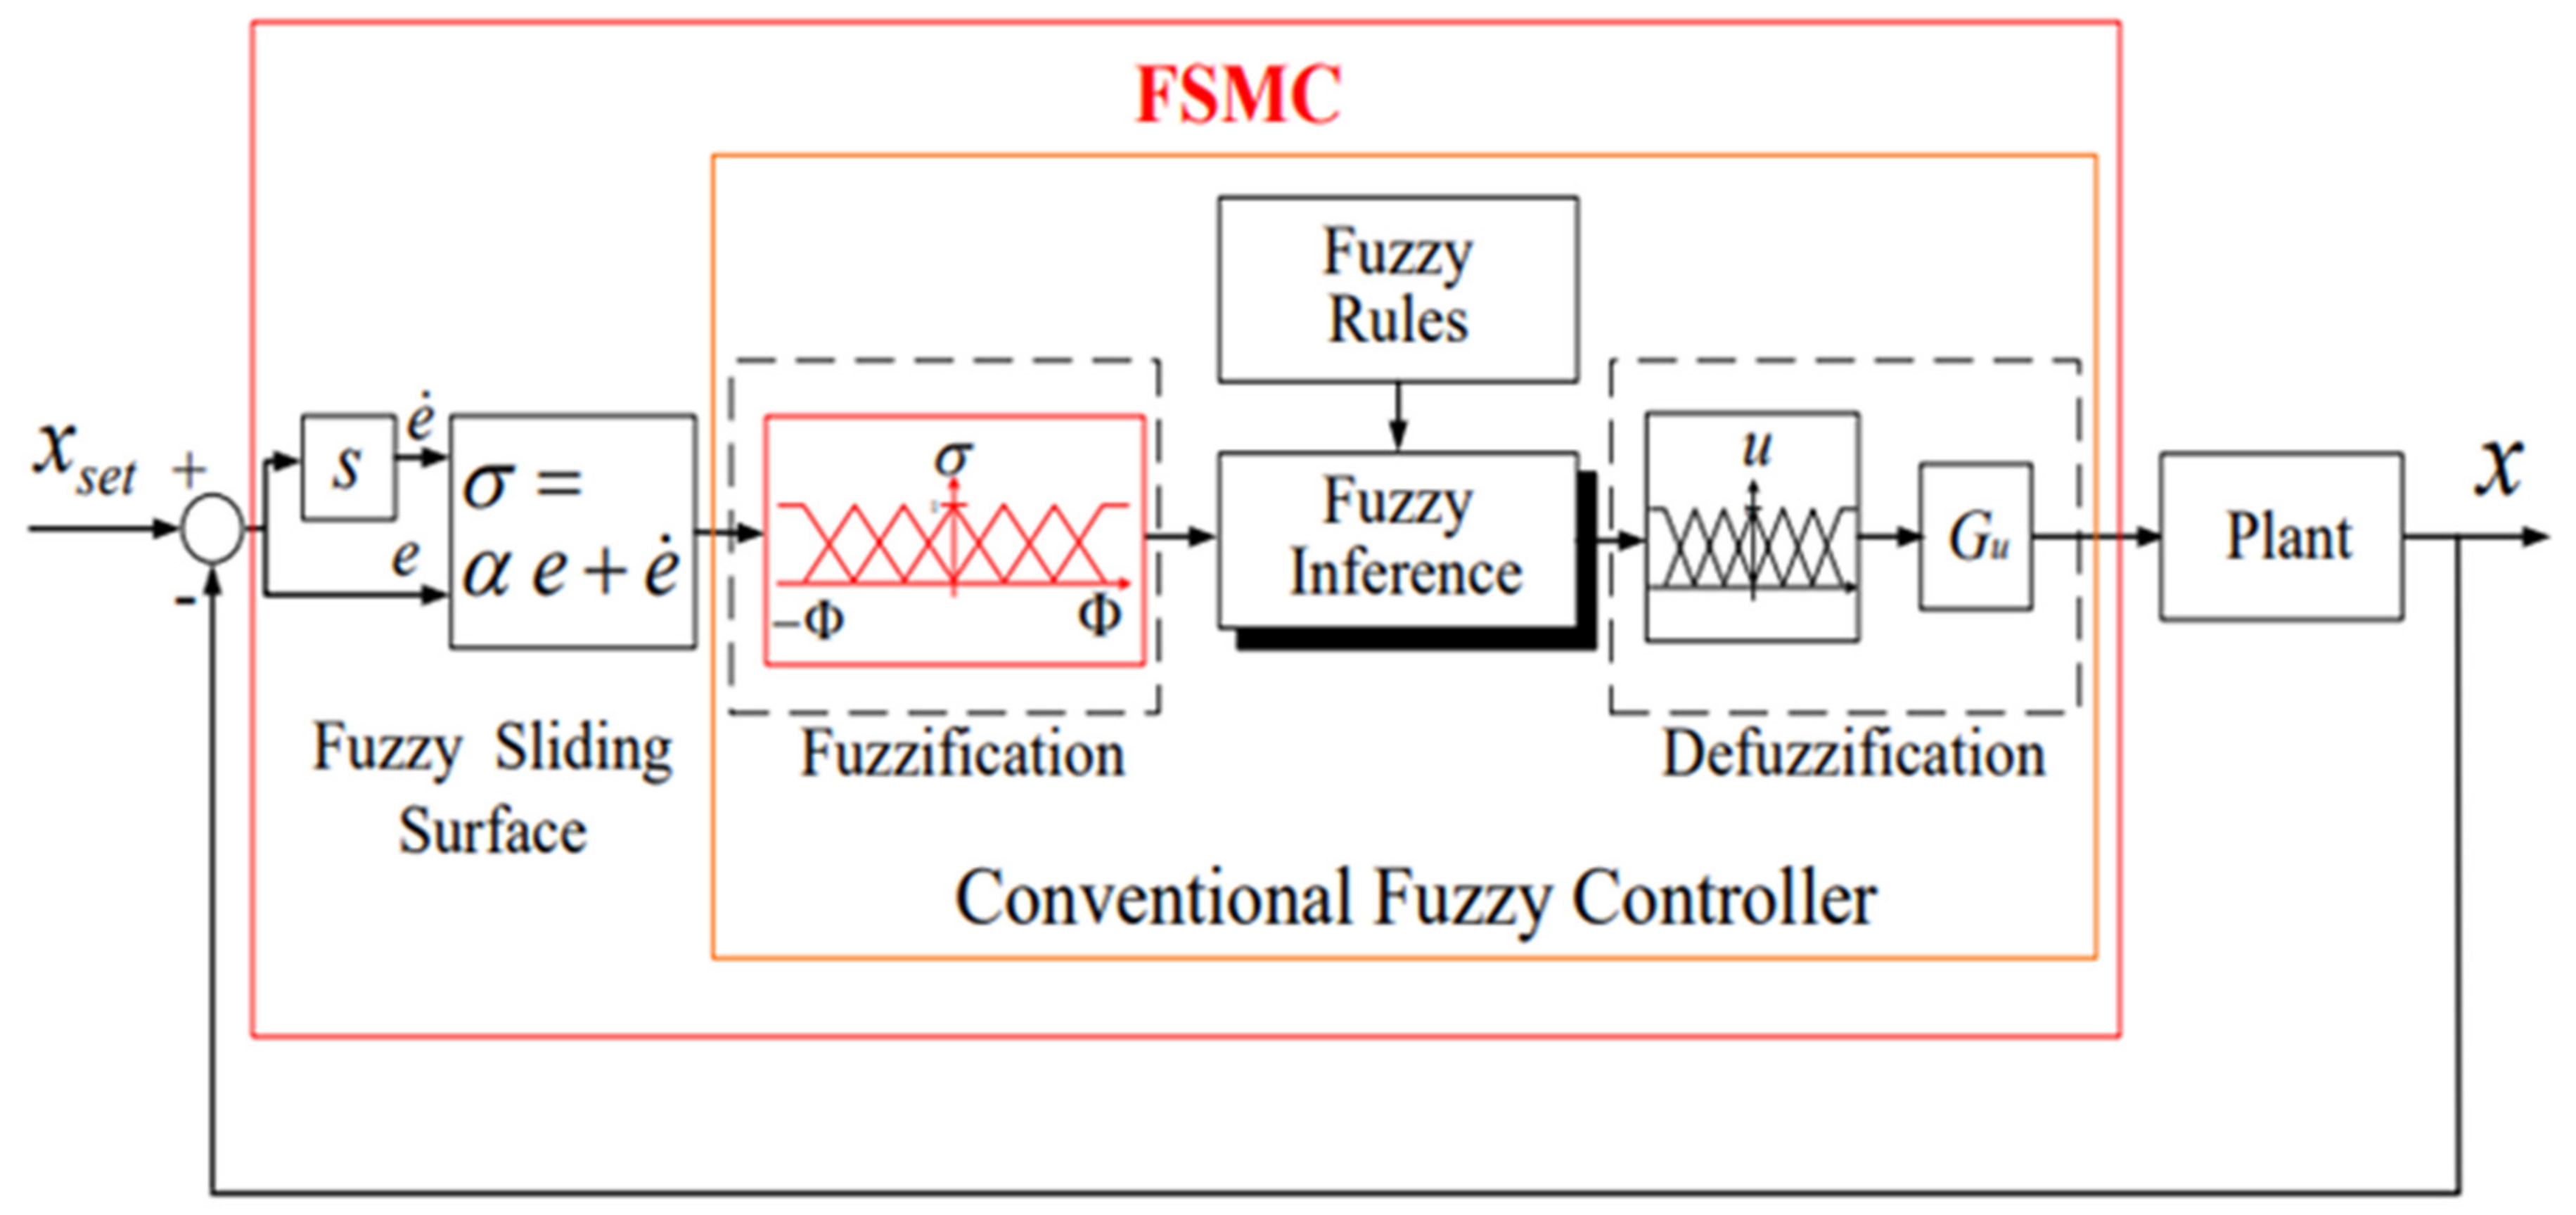
Fuzzy sliding-mode control [19] has the advantages of the fuzzy controller and the sliding-mode controller. The fuzzy logic is built using a sliding surface, σ = e ˙ + α e , which is the combination of error and rate of error-change. Therefore, the fuzzy logic is simpler than the conventional one.
The fuzzy sliding-mode controller can be divided into two parts: the sliding-surface estimator and the fuzzy controller. For the sliding-surface estimator, the error and the rate of error-change can be found by subtracting the set point value from the feedback signal. Thus, the equation of the sliding surface can be defined as σ = e ˙ + α e . The schematic diagram of the fuzzy sliding-mode surface is shown in Figure 11. For the fuzzy controller, the target of the conventional fuzzy controller is to set e ˙ and e to zero by a two-dimension fuzzy logic. However, we replace these two factors with a sliding surface. The target of this controller is to set the sliding surface to zero.

5.2.2. Novel Power Controller with Additional Floating-Platform Pitch-Rate Feedback

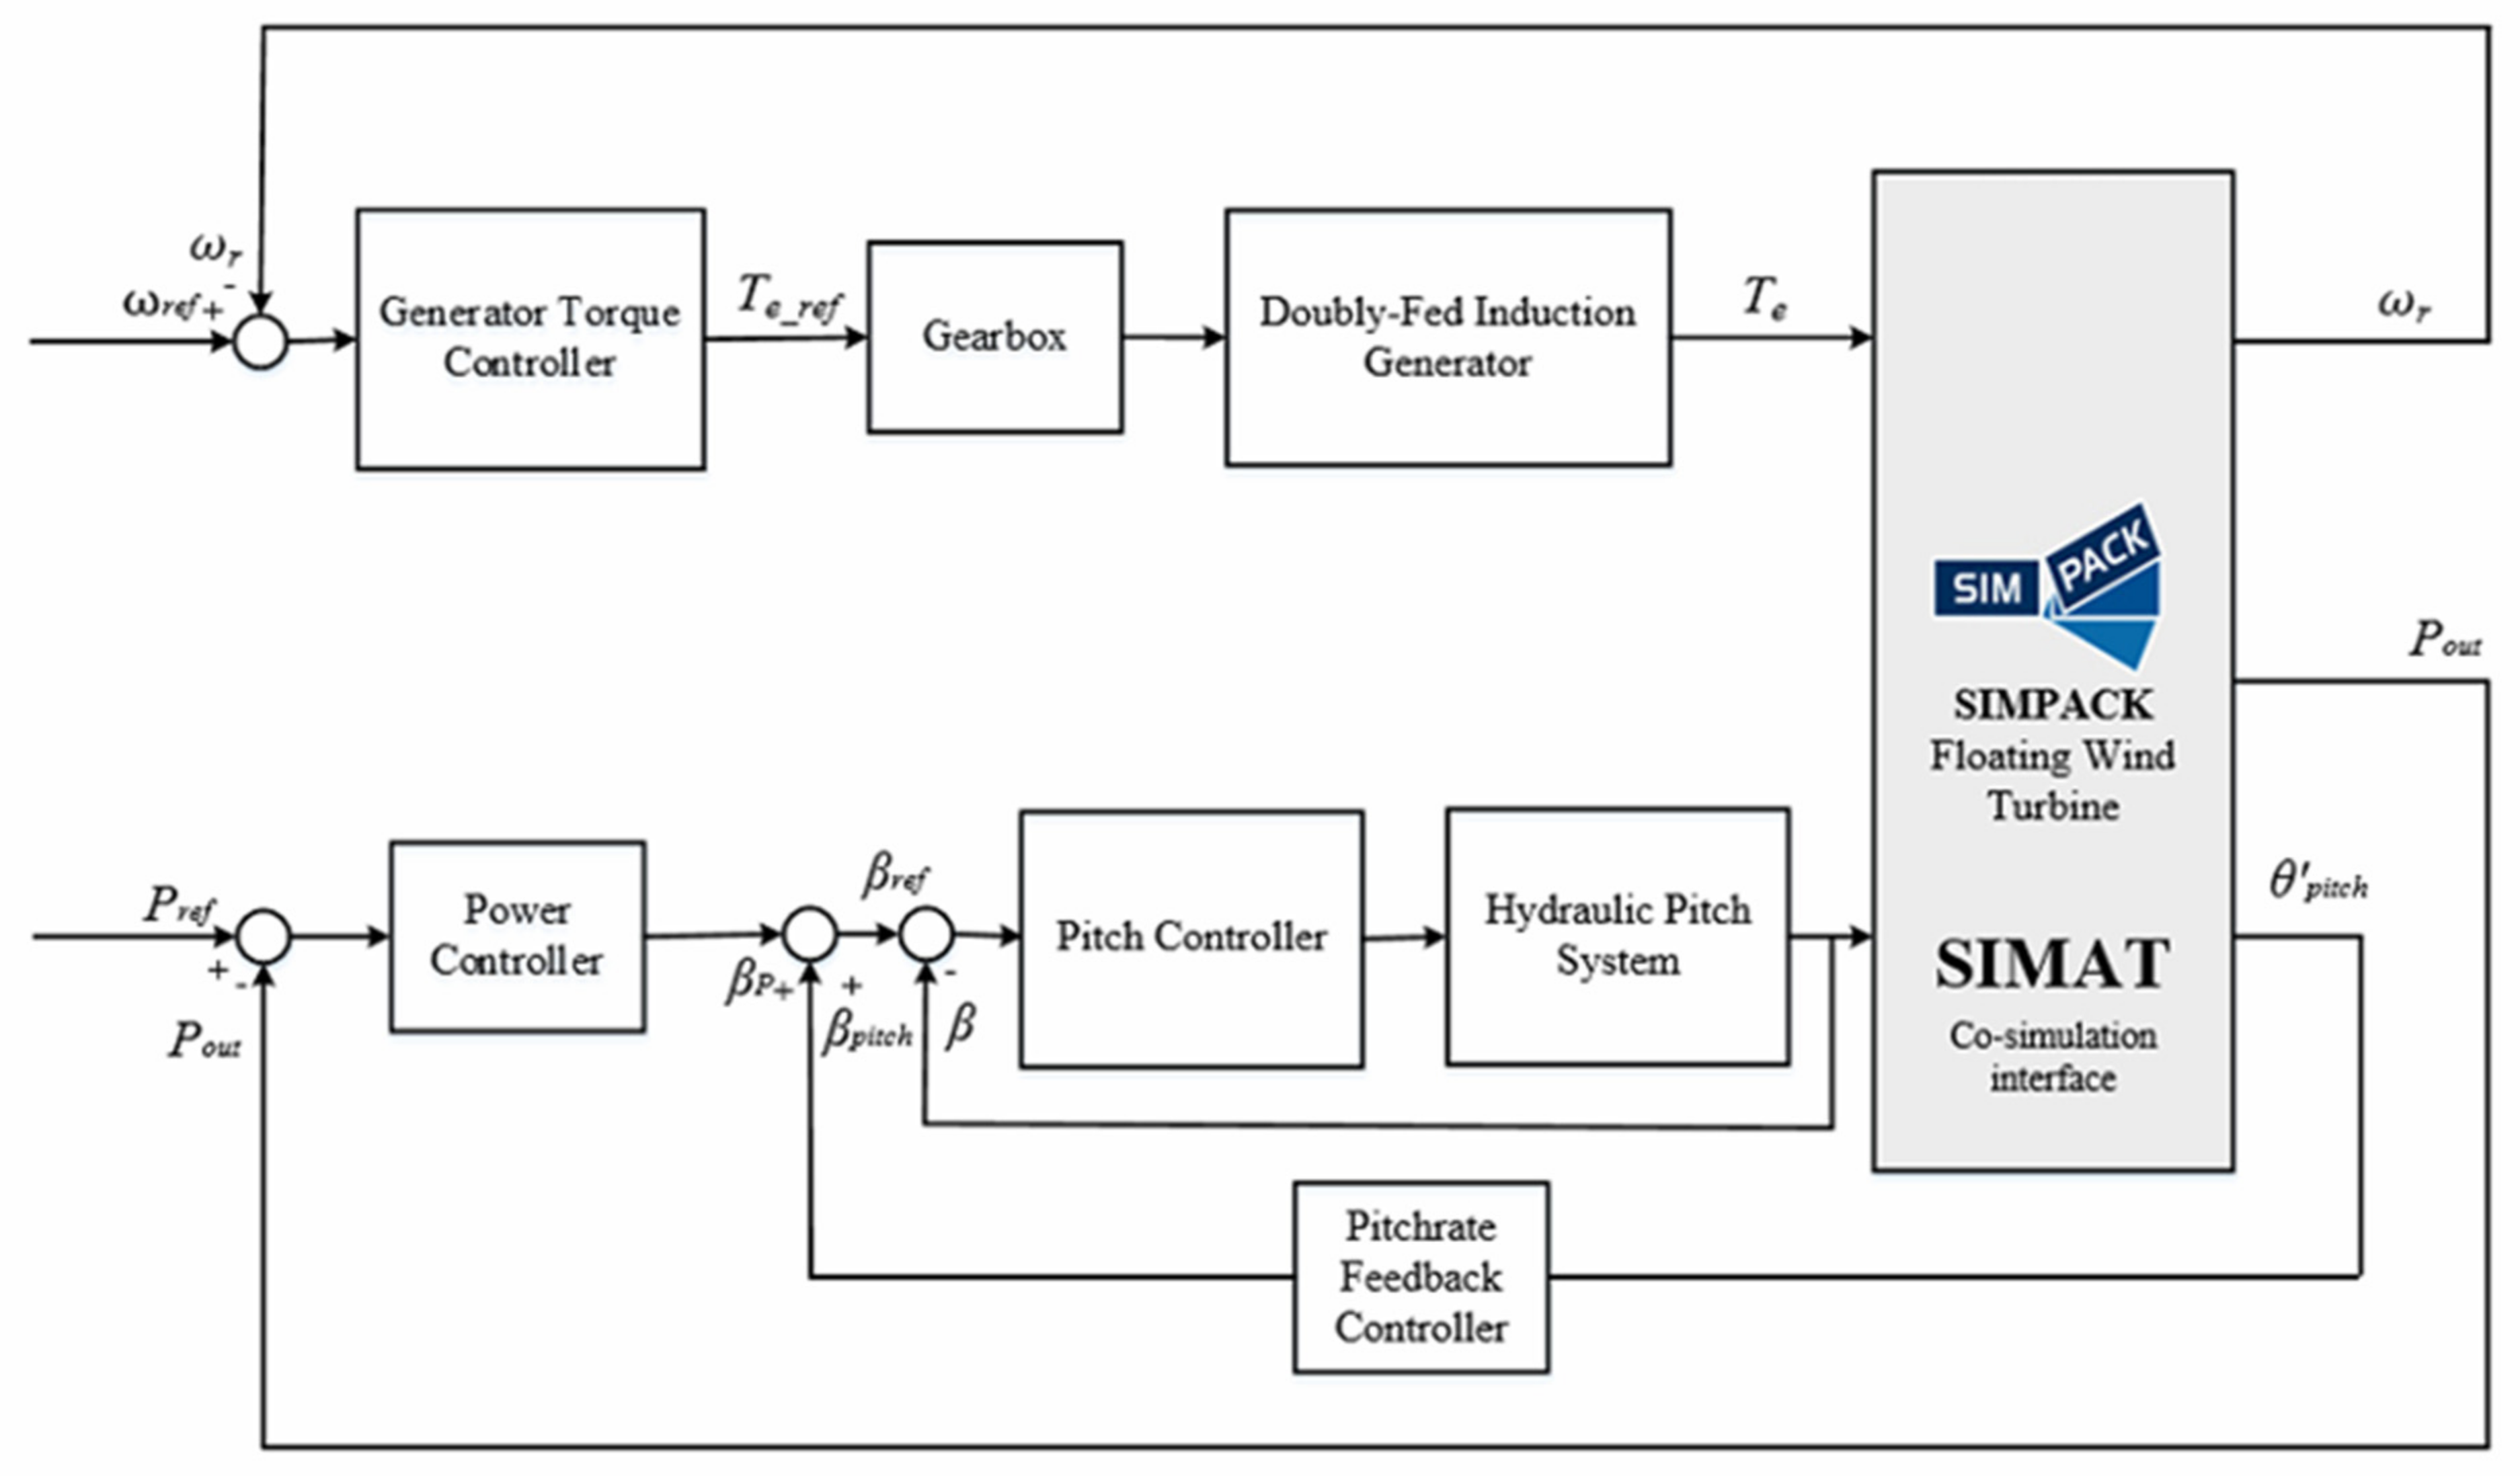
Based on the fuzzy sliding-mode control strategy, the wind-turbine control system is designed. Figure 12 shows the overall-control-system block diagram of a wind turbine. In the Region I minimum rotor speed, the rotor speed is kept at 5 rpm by the rotor-speed control system. As the wind speed increases, it enters the Region II optimal tip-speed ratio. The rotor speed increases in order to track the optimal tip-speed ratio. Therefore, the roto- speed control system also works in this region. Once the wind speed and the rotor speed are above the rated value, Region III rated power works. At this moment, the rotor-speed control system turns off; meanwhile, the hydraulic blade-pitch control system starts to work, in order to maintain the constant rated power for reducing the input wind energy and protect the wind turbine from damage. However, the motions of the floating platform contribute to the unbalanced and unstable wind-energy capture. Therefore, in this paper the additional feedback of the floating-platform pitch rate is proposed for the power control system.
With the power control system combining with the basic blade-pitch controller system, the wind turbine can obviously reduce wind-energy capture. However, differently from the bottom-fixed-type wind turbine, the inflow wind probably contributes to the unbalanced floating platform. The relative wind speed will influence the power generation. Therefore, the control system is designed to feed back the floating-platform pitch rate to the feedback controller, and combines with the result of the power controller, as shown in Equations (6) and (7), to mitigate the wind force on the blade and to prevent the floating wind turbine from being influenced by unpredictable motion.
β r e f = β p i t c h + β P
β p i t c h = G θ θ p i t c h d θ
where G θ is blade-pitch gain; θ p i t c h is floating-platform pitch-motion rate.

6. Simulation Results

6.1. Power Control by FSMC

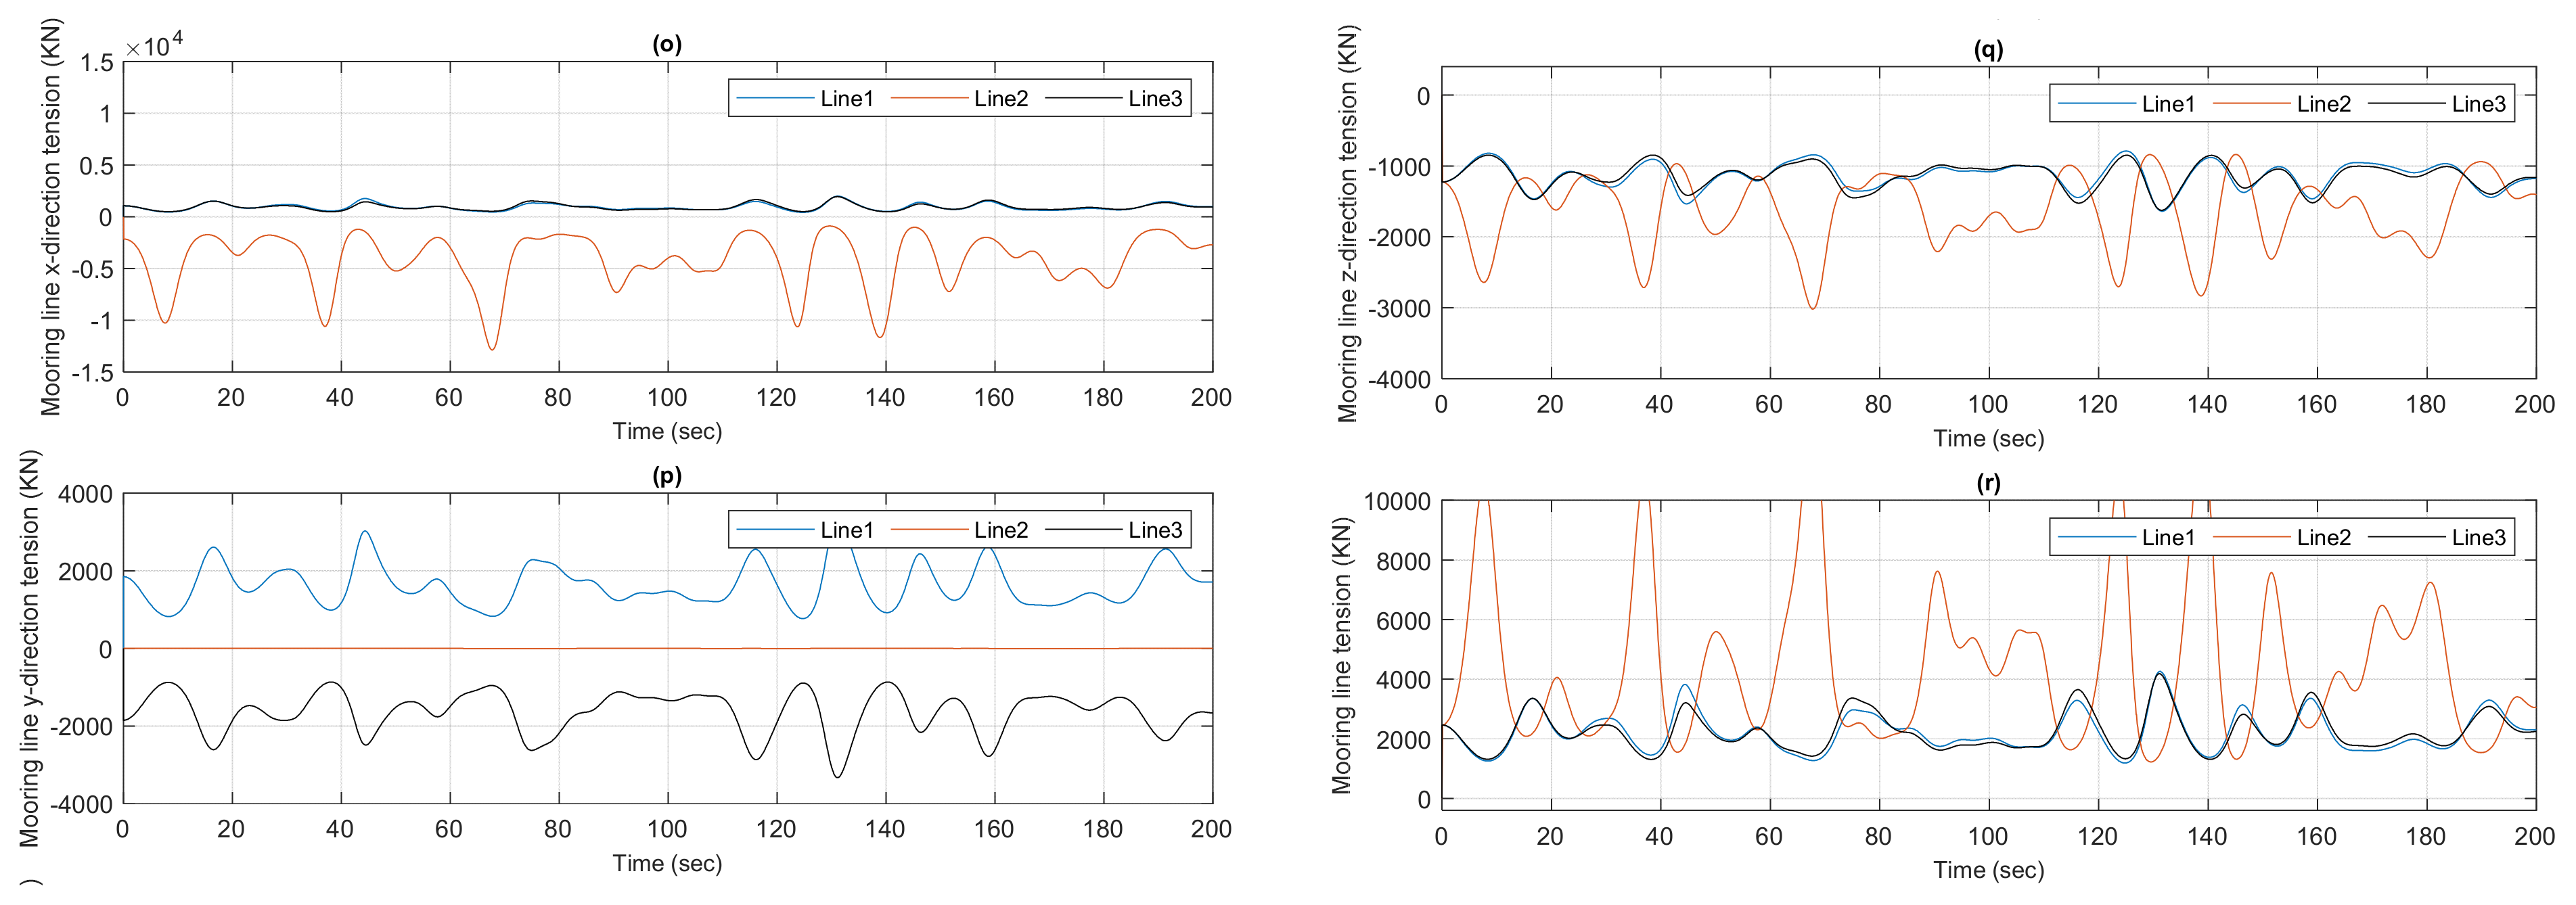
This section introduces the dynamic simulation performance of the FSMC controller with no wave, turbulence or additional compensator for a first verification of the controller performance. Figure 13 shows the simulation results of the power-control response with FSMC, with wind speed increasing from 0 to 25 m/s, including (a) wind speed, (b) wave height, (c) rotor speed, (d) rotor-speed error, (e) output power, (f) generator torque, (g) blade-pitch, (h) tip-speed ratio, (i) floater surge, (j) floater sway, (k) floater heave, (l) floater roll, (m) floater pitch, (n) floater yaw, (o) mooring-line x-direction tension, (p) mooring-line y-direction tension, (q) mooring-line z-direction tension, and (r) mooring-line tension. The power-control response in Region III is implemented by the FSMC controller. Figure 13c shows that the FSMC controller performs an obvious overshoot of approximately 12 MW, after the rotor speed reaches the rated power of 15 MW. Due to the larger overshoot, it may contribute to larger power, and result in damage to the generator and the structure, but in the steady-state FSMC still has an oscillation, as shown in Figure 13e. Figure 13f shows that the rotor speed reaches the rated value. Figure 13g shows that the blade-pitch angle increases from 0 degree to 25 degree with wind speed at 25 m/s. The force direction of mooring-line 2 is parallel to the wind direction. Therefore, Figure 13o–r provide the tension of mooring-line 2, to represent the force of the overall system.

6.2. Power Control by FSMC with Additional Floating-Platform Pitch-Rate Feedback

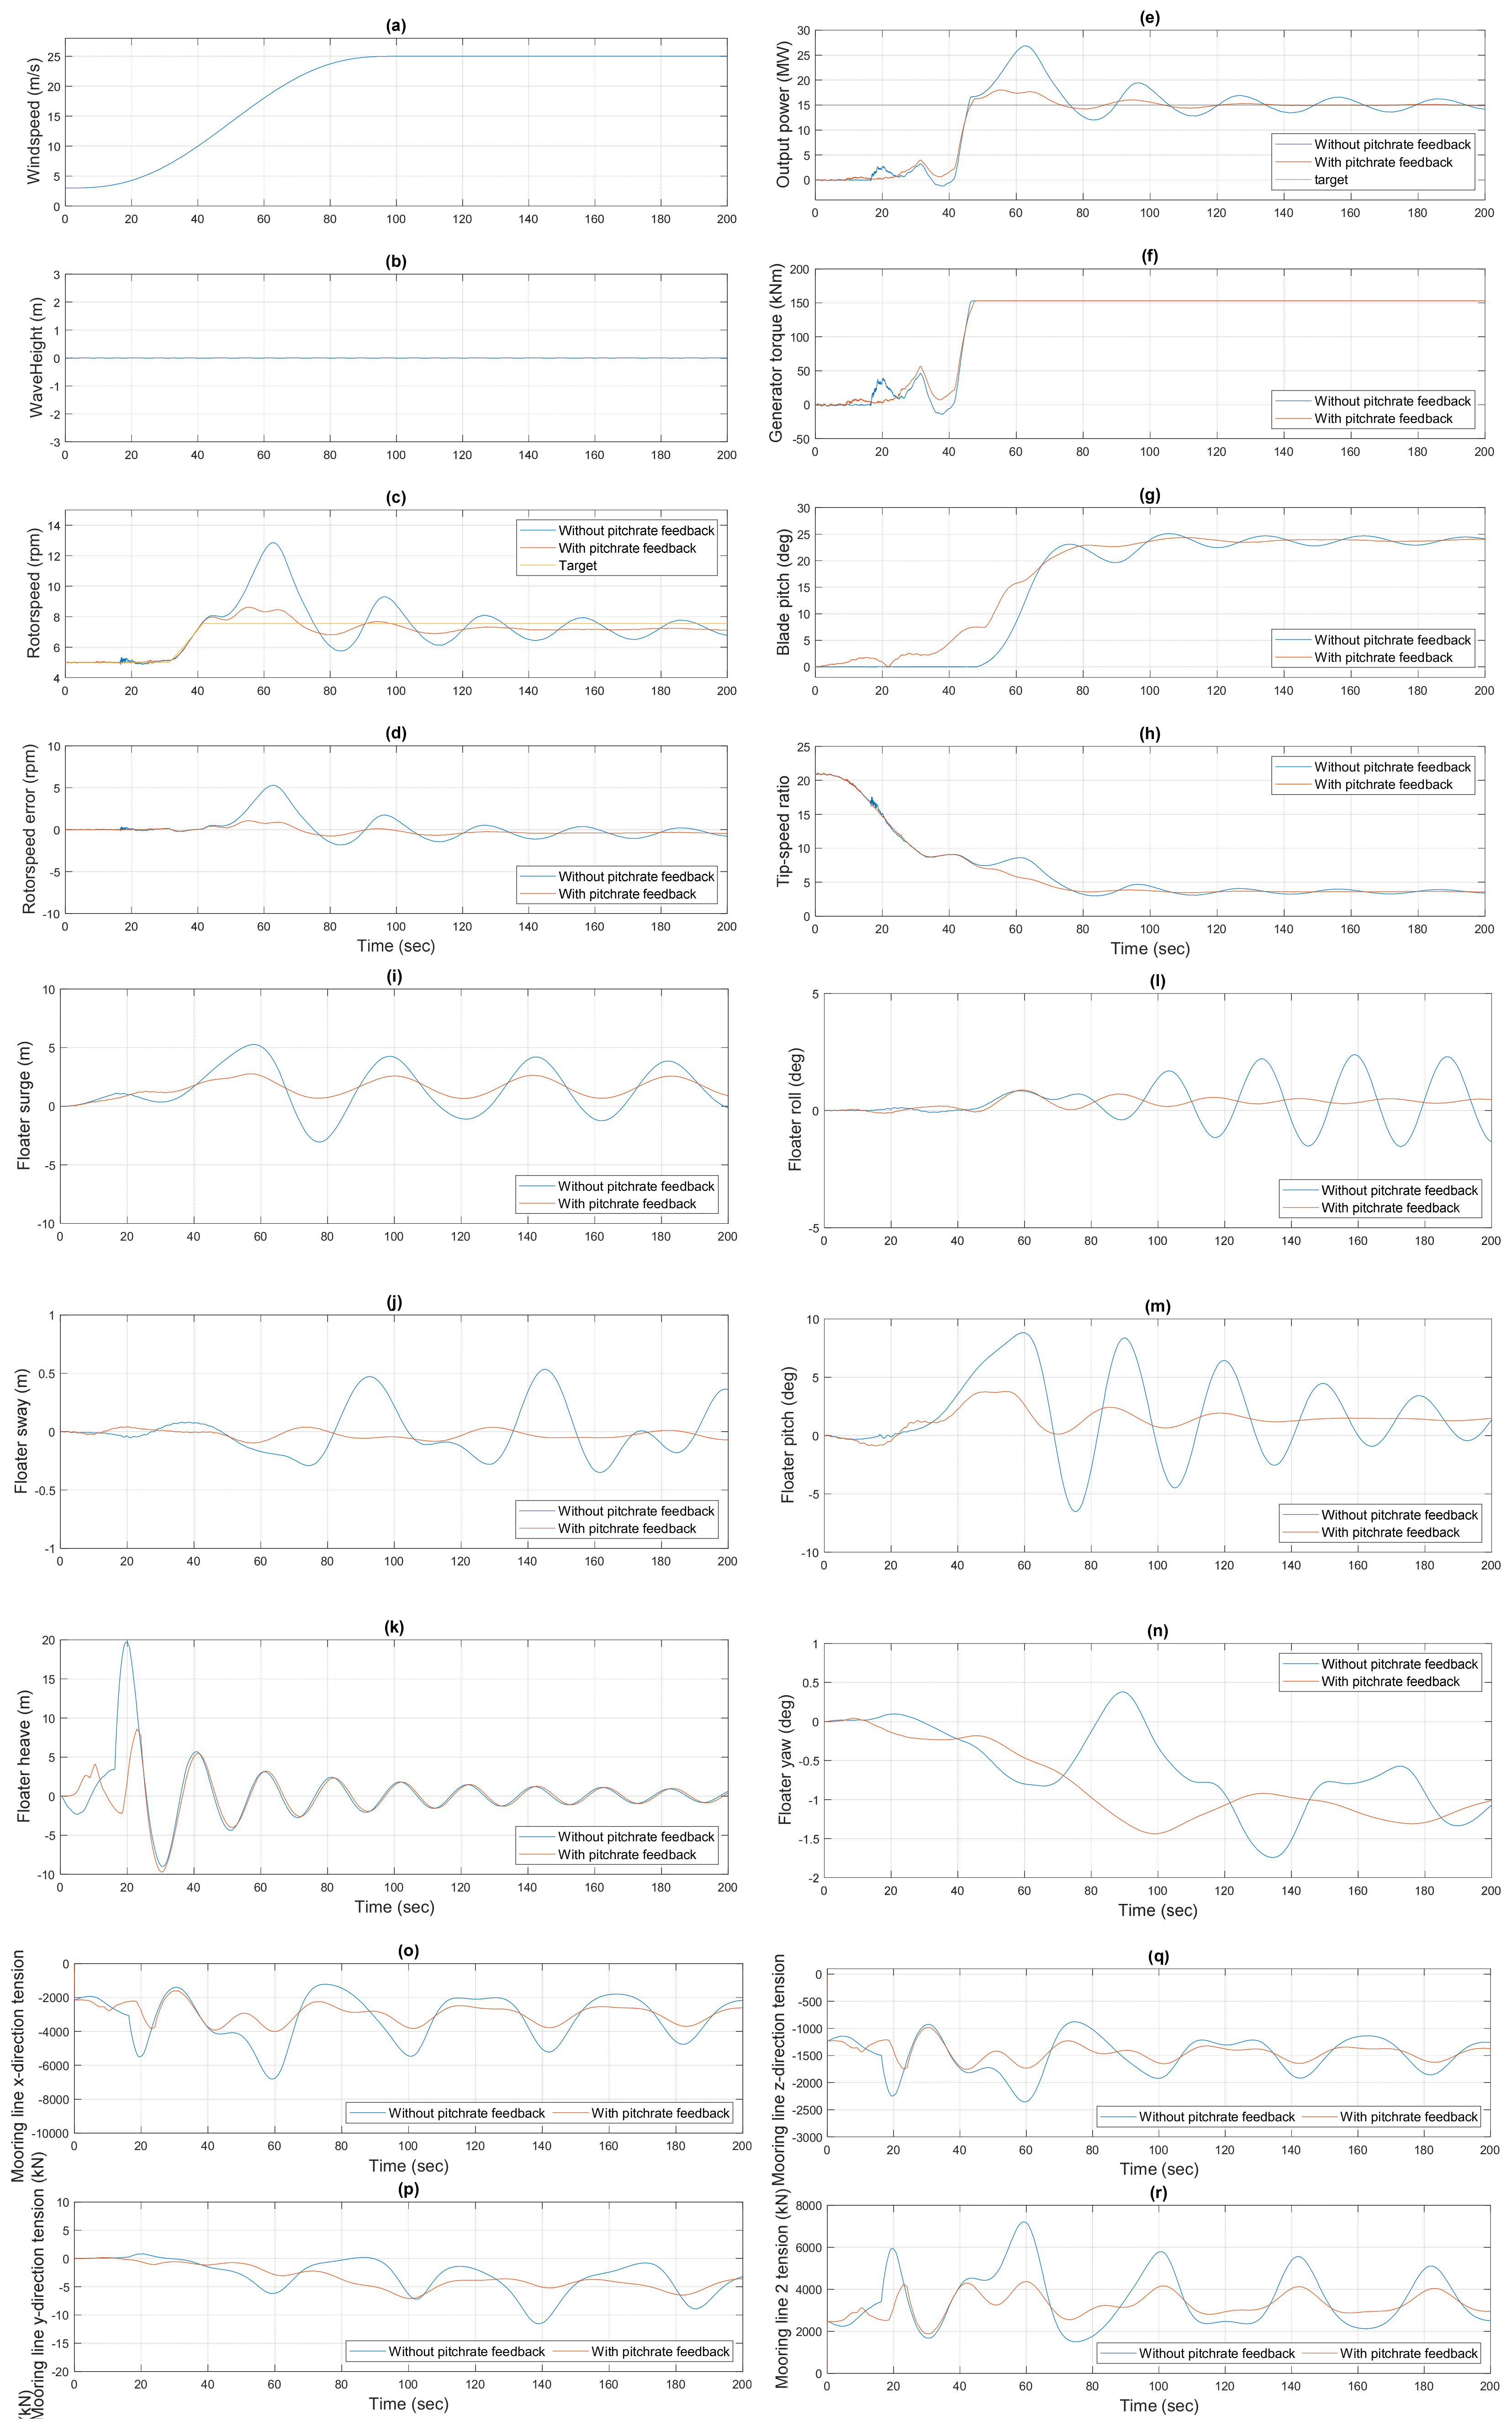
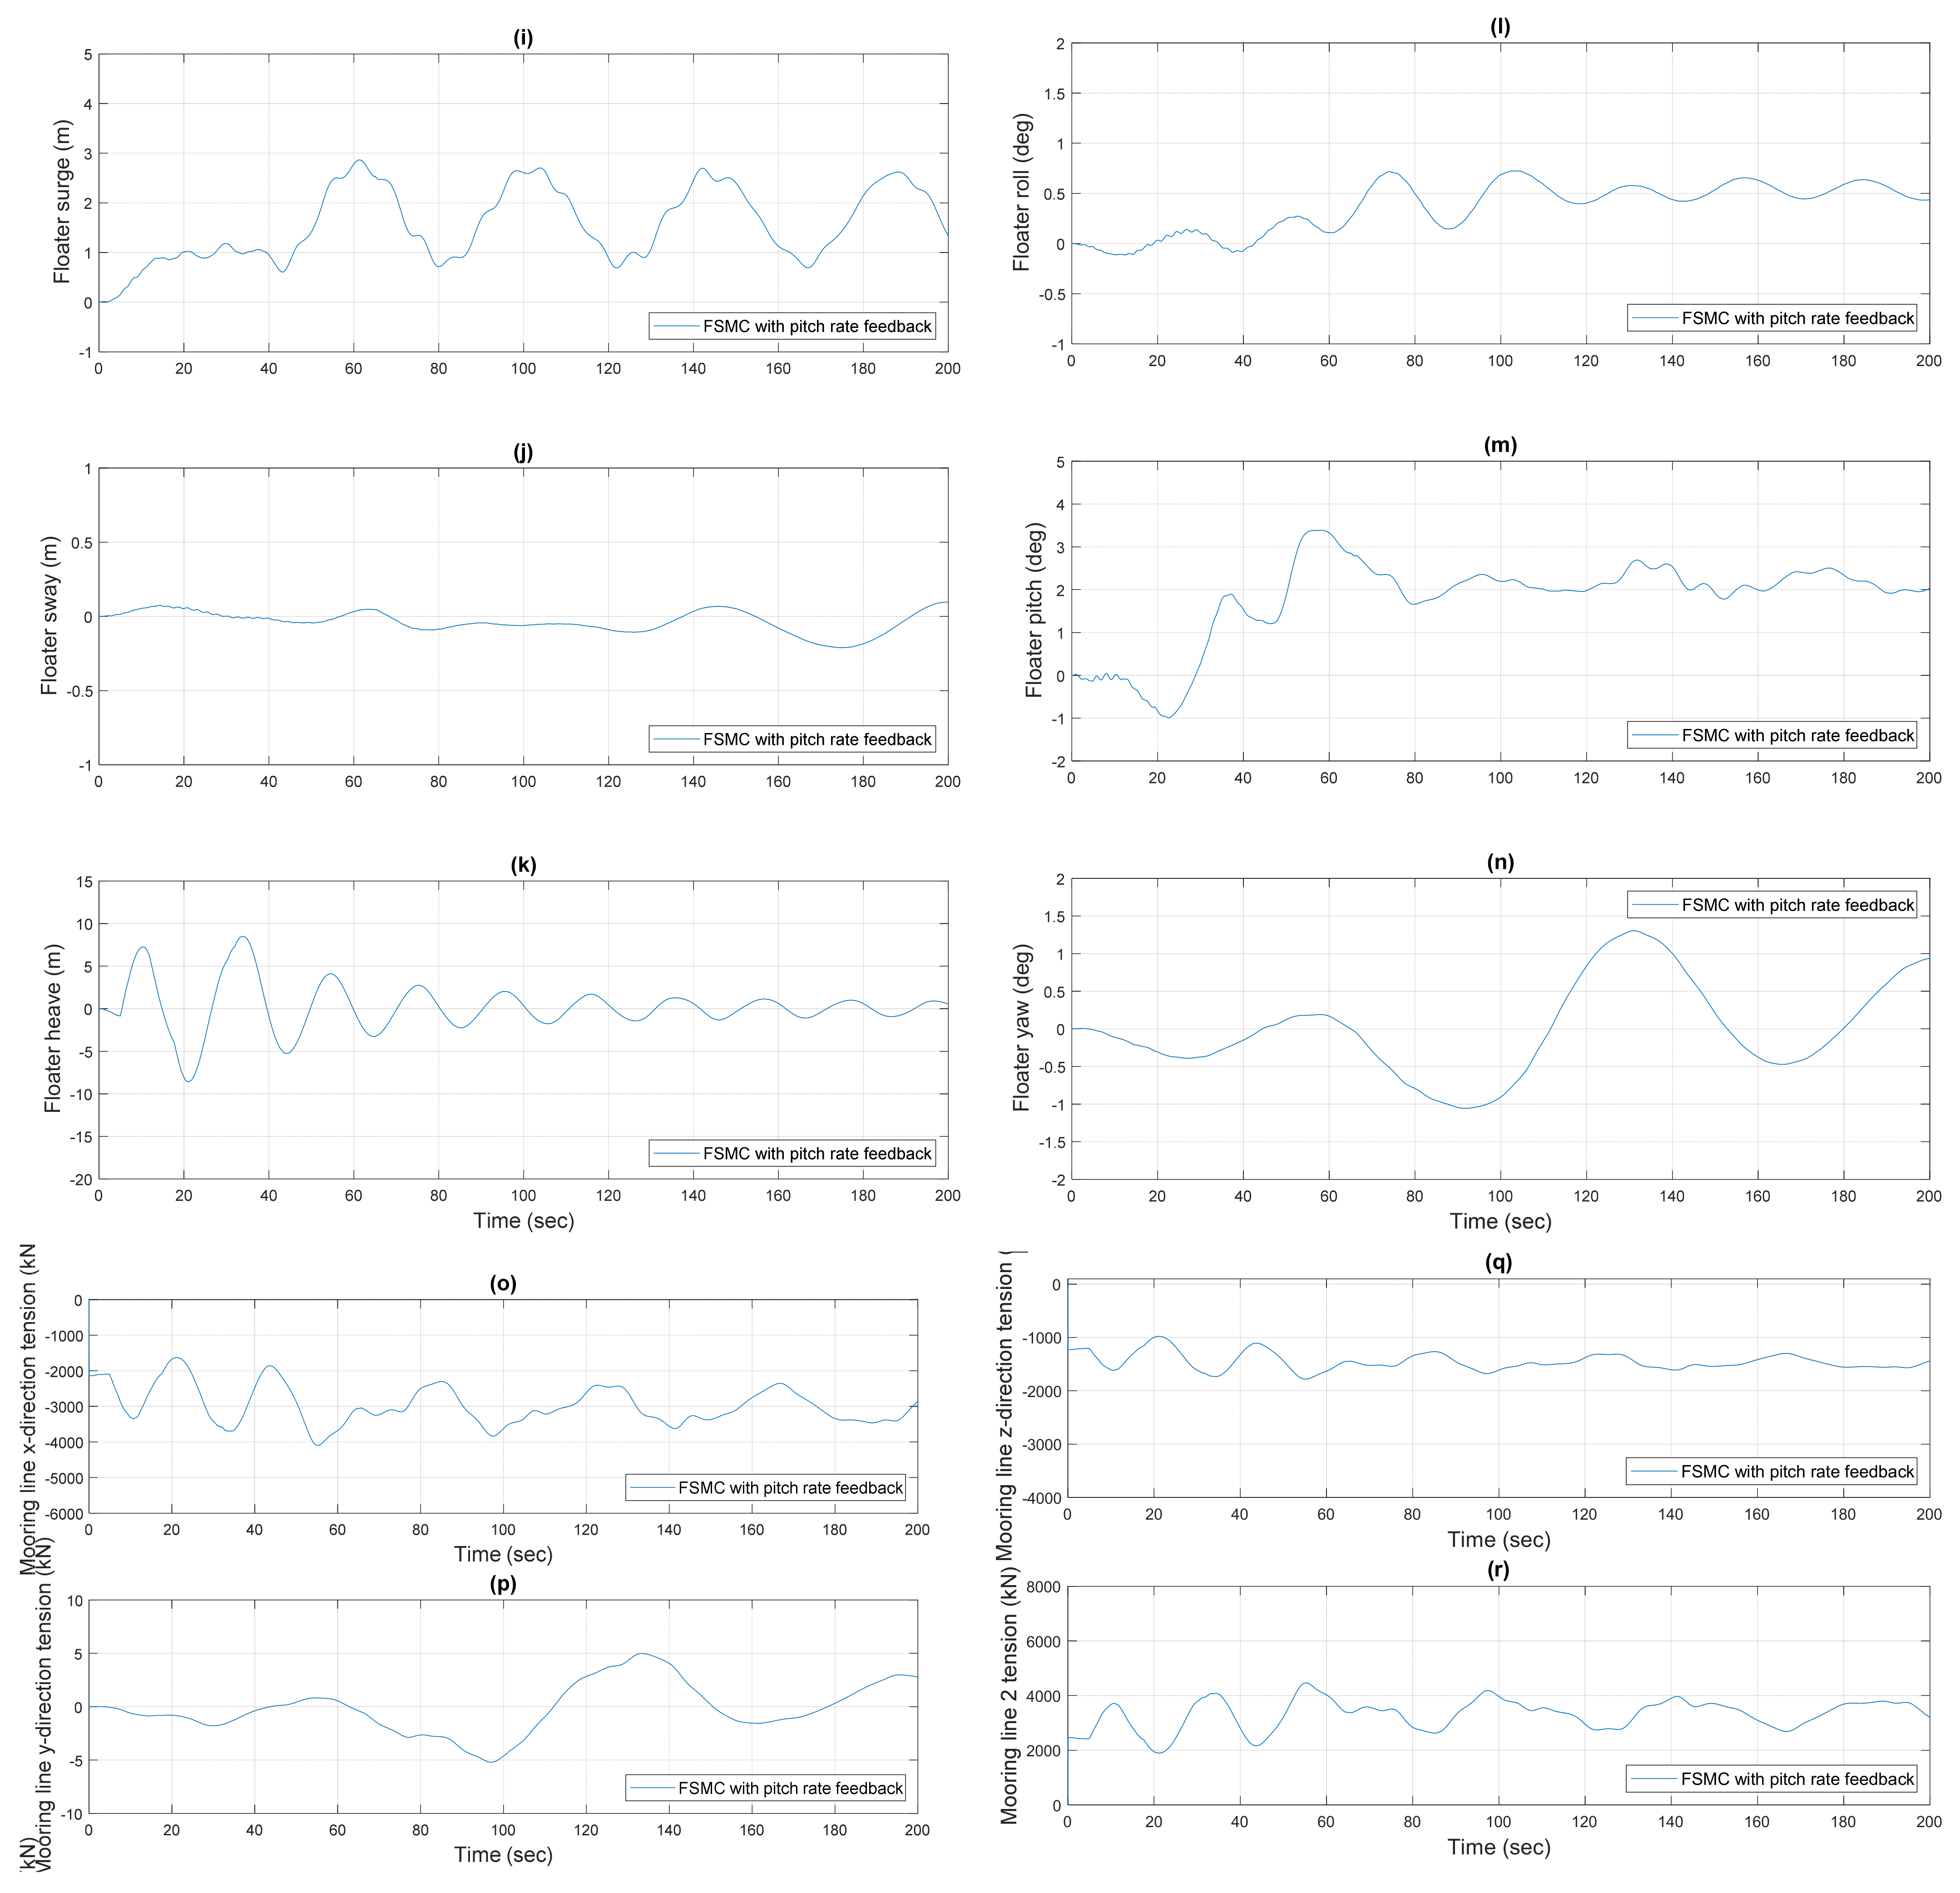
This section shows the power-control performance with additional floating-platform pitch-rate feedback, by comparing the FSMC controller with and without pitch-rate feedback. For the aforementioned-model performance in Section 6.1, the power overshoot and the motion of the floating platform are large, because of the unstable floating-platform motion and the inflow wind. To make the motion of the floating platform reflect on the wind turbine, the floating platform pitch-rate is proposed as additional feedback in this paper, to improve the overshoot of the power control. Figure 14 shows the comparison of the power control with and without the pitch-rate feedback of the FSMC under a win- speed increase from 0 to 25 m/s, including (a) wind speed, (b) wave height, (c) rotor speed, (d) rotor-speed error, (e) output power, (f) generator torque, (g) blade-pitch, (h) tip-speed ratio, (i) floater surge, (j) floater sway, (k) floater heave, (l) floater roll, (m) floater pitch, (n) floater yaw, (o) mooring-line x-direction tension, (p) mooring-line y-direction tension, (q) mooring-line z-direction tension, and (r) mooring-line tension. Figure 14c,d show the transient time is reduced and the overshoot is controlled. Figure 14e shows that for decreasing the overshoot of the rotor speed, the output power is controlled, to limit the maximum under 18 MW for the FSMC with pitch-rate feedback, i.e., 3 MW overshoot. With the platform pitch-rate feedback, the movement of the floating platform can decrease obviously, especially the pitch, as shown in Figure 14m.

6.3. Simulation under Normal Operation Conditions

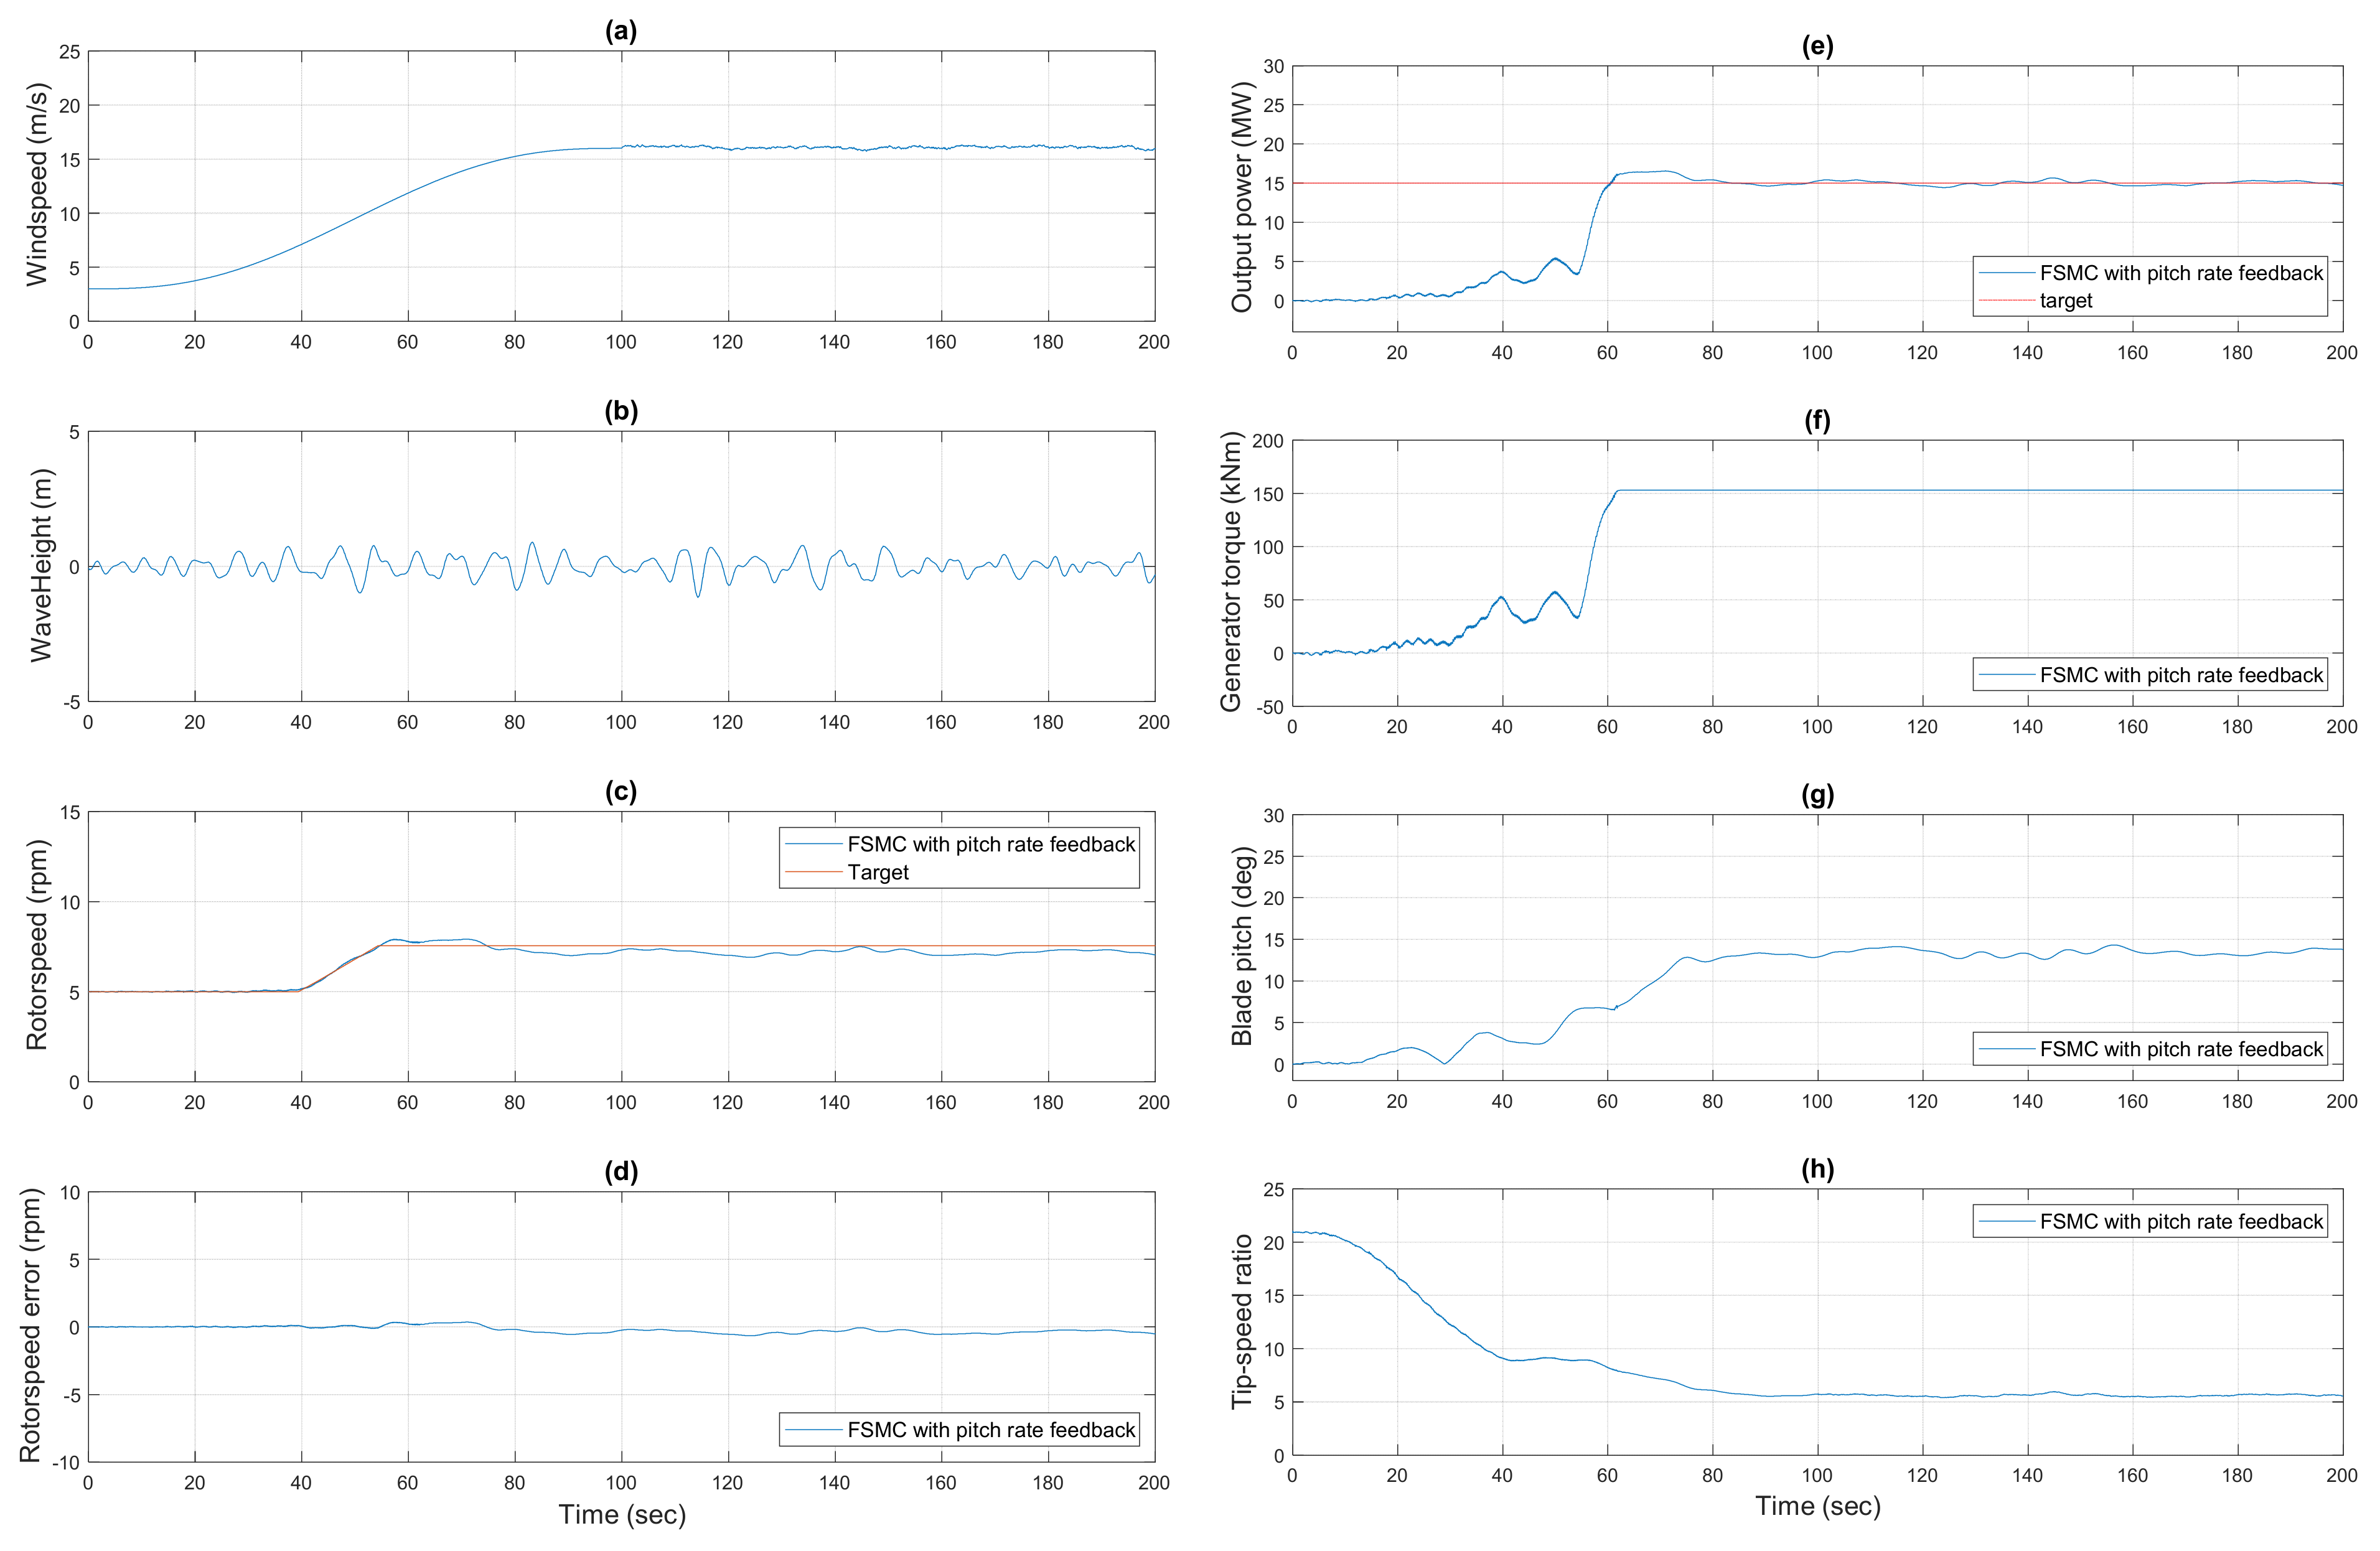
This section introduces the floating-wind-turbine-model performance controlled by FSMC with pitch-rate feedback in normal operation conditions, with wind speed from 3 m/s to 16 m/s with 3% turbulence intensity, significant wave height of 1.4 m, and wave period of 7.8 s. Figure 14 shows simulation results in normal conditions, including (a) wind speed, (b) wave height, (c) rotor speed, (d) rotor-speed error, (e) output power, (f) generator torque, (g) blade-pitch, (h) tip-speed ratio, (i) floater surge, (j) floater sway, (k) floater heave, (l) floater roll, (m) floater pitch, (n) floater yaw, (o) mooring-line x-direction tension, (p) mooring-line y-direction tension, (q) mooring-line z-direction tension, and (r) mooring-line tension. For the output power performance in Figure 14e, the maximum power is 16 MW, with an overshoot of 1 MW. Figure 14i shows the floating-platform displacement, with the surge influenced by the turbulence, due to the small oscillation. In addition to the pitch motion shown in Figure 14m, turbulence leads to oscillation. Figure 14r shows the mooring-line force. The total mooring-line oscillates more strongly than the total force in Figure 14r.

6.4. 50-Year Return-Period Extreme Conditions

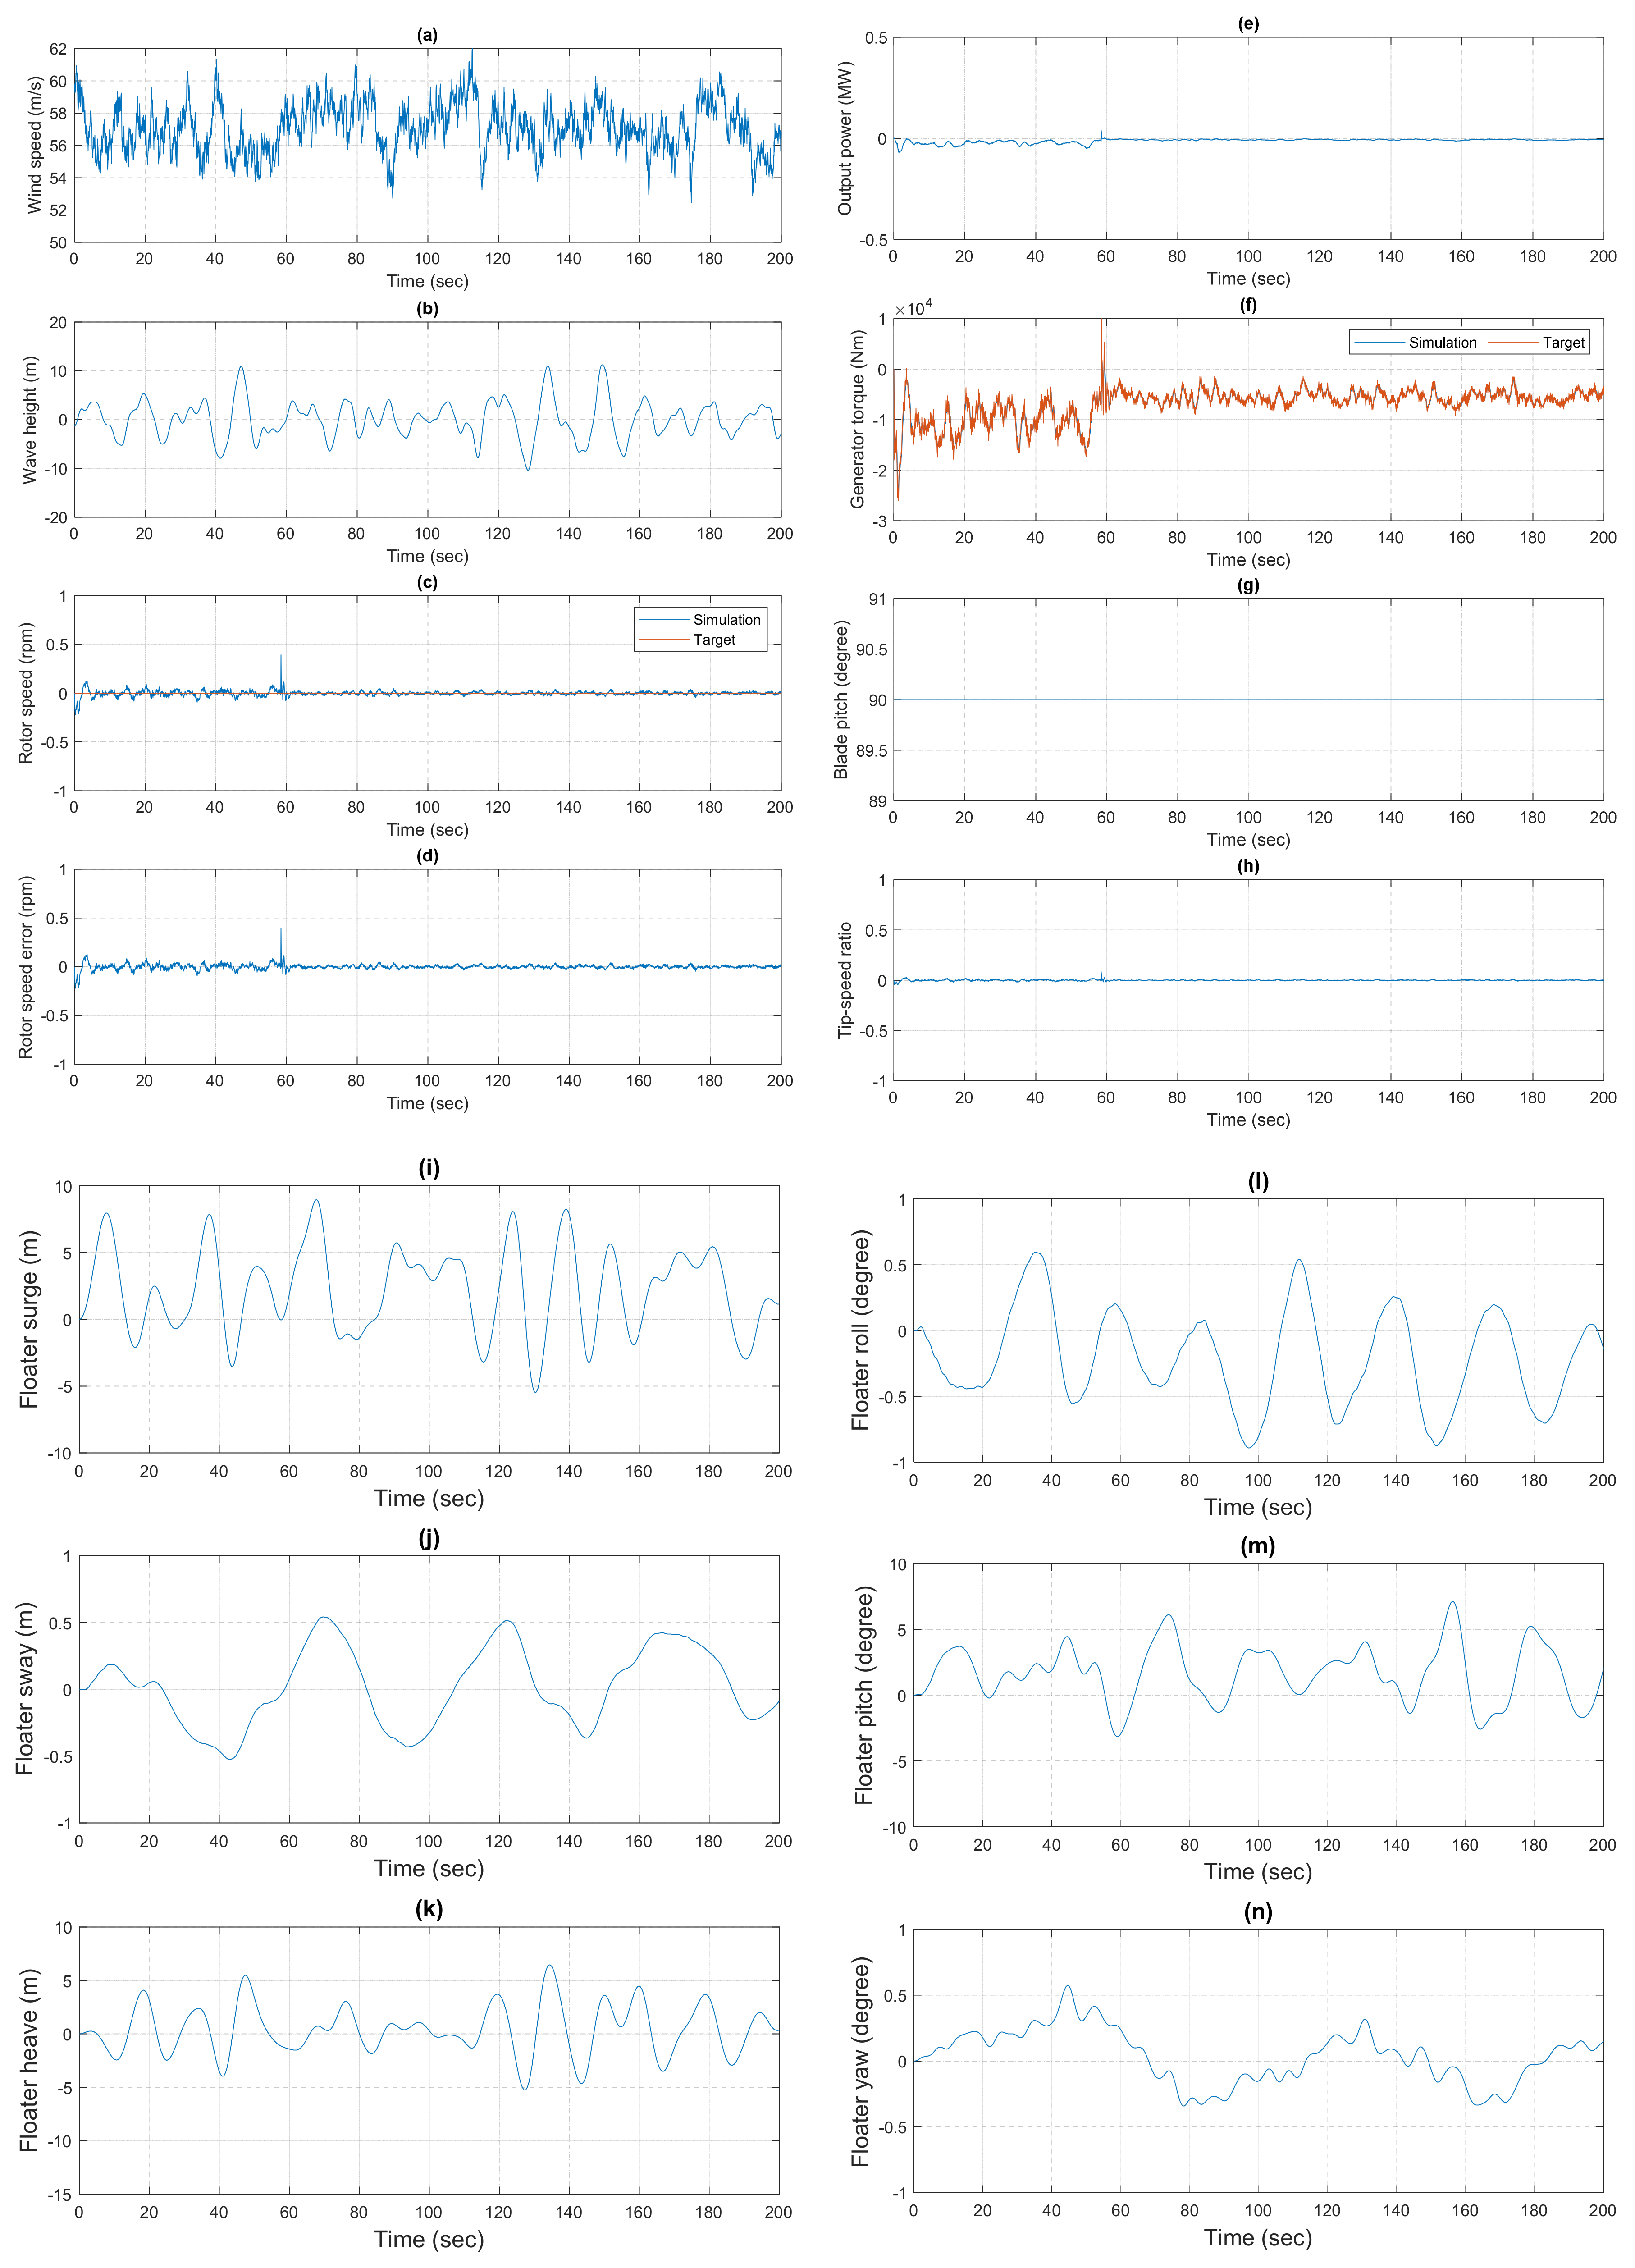
In the Taiwan offshore wind farms, typhoons are a significant issue for the floating wind turbines. Because of this, offshore wind turbines with IEC Class T are proposed for use in Taiwan. According to the IEC-61400-1 [20], the floating-wind-turbine model is tested by a 50-year return-period extreme condition, with a wind speed of 57 m/s for the IEC Class T 50-year return period, wave height of 16.3 m and wave period of 14.3 s. To face the extreme load condition, the wind turbine needs to switch to the idle mode to protect it from damage. When the floating wind turbine switches to the idle mode, the generator will turn off and the blade-pitch angle will be fixed at 90 degrees. Figure 15 shows the simulation results under extreme conditions for a wind speed of 57 m/s with 3% turbulence, including (a) wind speed, (b) wave height, (c) rotor speed, (d) rotor-speed error, (e) output power, (f) generator torque, (g) blade-pitch, (h) tip-speed ratio, (i) floater surge, (j) floater sway, (k) floater heave, (l) floater roll, (m) floater pitch, (n) floater yaw, (o) mooring-line x-direction tension, (p) mooring-line y-direction tension, (q) mooring-line z-direction tension, and (r) mooring-line tension. Figure 15c shows the rotor speed in this test without any rotor-speed control, because additional rotor-speed control might damage the generator. Figure 15g shows the blade-pitch angle, which is fixed at 90 degrees. For the extra wind speed and extra wave, the displacement of the floating platform, especially surge, has an obvious movement of approximately 8 m, in Figure 15i. For the rotational movement in Figure 15l–n, there is no obvious change compared to the normal conditions. However, for the mooring-line force in Figure 15r, the force is approximately two times higher than the normal one. Therefore, the mooring-line-structure design needs to consider the forces in extreme conditions.

7. Conclusions

This study uses dynamic co-simulation and control for analyzing the IEA 15 MW semi-submersible floating wind turbine under Taiwan offshore-wind-farm conditions of wind and wave, including wind, wave and water-depth conditions. The co-simulation system combines SIMPACK, MATLAB/SIMULINK, AeroDyn, HydroDyn, WAMIT, and MAP++, to achieve an aero-hydro-servo-elastic simulation.
Since the motion of the floating platform, especially the pitching motion, contributes to power oscillation, the novel power-control strategy of combining fuzzy sliding-mode control (FSMC) with additional floating-platform pitching-rate feedback was proposed in the stud, to reduce the influence of the floating-platform oscillation motion verified under different conditions. Comparing FSMC with and without additional pitching-rate feedback in the power control system, FSMC with additional pitching-rate feedback has the advantage of fuzzy controller and sliding-mode control and of reducing the oscillation of the platform by the additional pitching-rate feedback. Based on the simulation result of the power performance, the power-control-system performance with the FSMC controller with additional pitching-rate feedback was verified under different wind and wave conditions. Moreover, typhoons are a significant issue for the floating wind turbines in the Taiwan offshore-wind-farms; the floating-wind-turbine model was tested using the 50-year return-period extreme condition, with a wind speed of 57 m/s for the IEC Class T 50-year return period, wave height of 16.3 m and wave period of 14.3 s was implemented and verified.

Author Contributions

Conceptualization, M.-H.C.; methodology, M.-H.C.; software, C.-J.C., C.-H.C., C.L., T.-Y.L. and M.-H.C.; validation, C.-J.C., C.-H.C., C.L. and T.-Y.L.; formal analysis, C.-J.C., C.-H.C., C.L. and T.-Y.L.; writing—original draft preparation, C.-J.C. and M.-H.C.; writing—review and editing, M.-H.C.; supervision, M.-H.C.; project administration, M.-H.C.; funding acquisition, M.-H.C. All authors have read and agreed to the published version of the manuscript.

Funding

The research was sponsored by the National Science and Technology Council, Taiwan under the grant MOST 110-3116-F-002-001 and NSTC 111-3116-F-002-007.

Conflicts of Interest

The authors declare no conflict of interest.

References

  1. Taipower. History of Net Power Generated and Purchased by Energy Type. Available online: https://www.taipower.com.tw/tc/index.aspx (accessed on 1 January 2022).
  2. 4C Offshore. Global Offshore Wind Speeds Rankings. Available online: https://www.4coffshore.com/windfarms/windspeeds.aspx (accessed on 1 January 2019).
  3. Lee, C.-L. Policy of Offshore Wind in Taiwan; Bureau of Energy, MOEA: Taipei City, Taiwan, 2019; Available online: https://www.tresor.economie.gouv.fr/Articles/f27ed9b3-e7db-40bf-880c-5f1351c0a826/files/f4318f81-7d7b-44cc-a462-193ca3840d20 (accessed on 1 April 2019).
  4. Formosa I Wind Power Co., Ltd. FOWI, Formosa Offshore Wind Farm. Available online: https://formosa1windpower.com/ (accessed on 8 June 2018).
  5. Buljan, A. TPC’s 109.2MW Offshore WInd Farm in Full Array. offshoreWIND.biz. 2021. Available online: https://www.offshorewind.biz/2021/06/23/tpcs-109-2-mw-offshore-wind-farm-in-full-array/ (accessed on 23 June 2021).
  6. Bureau of Energy, Ministry of Economic Affairs. MOEA Initiates the Offshore Wind Energy Zonal Development Selection Mechanism. Available online: https://www.moea.gov.tw/MNS/english/news/News.aspx?kind=6&menu_id=176&news_id=97414 (accessed on 25 October 2021).
  7. Boukhezzar, B.; Lupu, L.; Siguerdidjane, H.; Hand, M. Multivariable control strategy for variable speed, variable pitch wind turbines. Renew. Energy 2007, 32, 1273–1287. [Google Scholar] [CrossRef]
  8. Lindeberg, E.; Svendsen, H.G.; Uhlen, K. Smooth transition between controllers for floating wind turbines. Energy Procedia 2012, 24, 83–98. [Google Scholar] [CrossRef] [Green Version]
  9. Bashetty, S.; Ozcelik, S. Effect of Pitch Control on the Performance of an Offshore Floating Multi-Wind-Turbine Platform. J. Phys. Conf. Ser. 2021, 1828, 012055. [Google Scholar] [CrossRef]
  10. Plestan, F.; Shtessel, Y.; Bregeault, V.; Poznyak, A. New methodologies for adaptive sliding mode control. Int. J. Control. 2010, 83, 1907–1919. [Google Scholar] [CrossRef] [Green Version]
  11. Jonkman, J.M.; Hayman, G.; Jonkman, B.; Damiani, R.; Murray, R. AeroDyn v15 user’s guide and theory manual. NREL Draft Rep. 2015, 46. [Google Scholar]
  12. Jonkman, J.M.; Robertson, A.; Hayman, G.J. HydroDyn user’s guide and theory manual. Natl. Renew. Energy Lab. 2014. [Google Scholar]
  13. Masciola, M. MAP++ Documentation; NREL: Golden, CO, USA, 2018.
  14. Jung, C.; Schindler, D. The role of the power law exponent in wind energy assessment: A global analysis. Int. J. Energy Res. 2021, 45, 8484–8496. [Google Scholar] [CrossRef]
  15. DNV. Available online: https://www.dnv.com/services/meteorological-and-oceanographic-studies-12401 (accessed on 1 March 2015).
  16. Huler, S. Defining the Wind: The Beaufort Scale and How a 19th-Century Admiral Turned Science into Poetry; Crown: New York, NY, USA, 2007. [Google Scholar]
  17. Gaertner, E.; Rinker, J.; Sethuraman, L.; Zahle, F.; Anderson, B.; Barter, G.; Abbas, N.; Meng, F.; Bortolotti, P.; Skrzypinski, W.; et al. IEA Wind TCP Task 37: Definition of the IEA 15-Megawatt Offshore Reference Wind Turbine; National Renewable Energy Lab. (NREL): Golden, CO, USA, 2020. [Google Scholar]
  18. Allen, C.; Viscelli, A.; Dagher, H.; Goupee, A.; Gaertner, E.; Abbas, N.; Hall, M.; Barter, G. Definition of the UMaine VolturnUS-S Reference Platform Developed for the IEA Wind 15-Megawatt Offshore Reference Wind Turbine; National Renewable Energy Lab. (NREL): Golden, CO, USA, 2020. [Google Scholar]
  19. Wu, C.-C. Simulation and Experiment of a Turbine Access System with Three-Axial Active Motion Compensation; National Taiwan University, Department of Engineering Science and Ocean Engineering: Taipei, Taiwan, 2016. [Google Scholar]
  20. Madsen, P.H.; Risø, D. Introduction to the IEC 61400-1 Standard; Risø National Laboratory, Technical University of Denmark: Roskilde, Denmark, 2008. [Google Scholar]
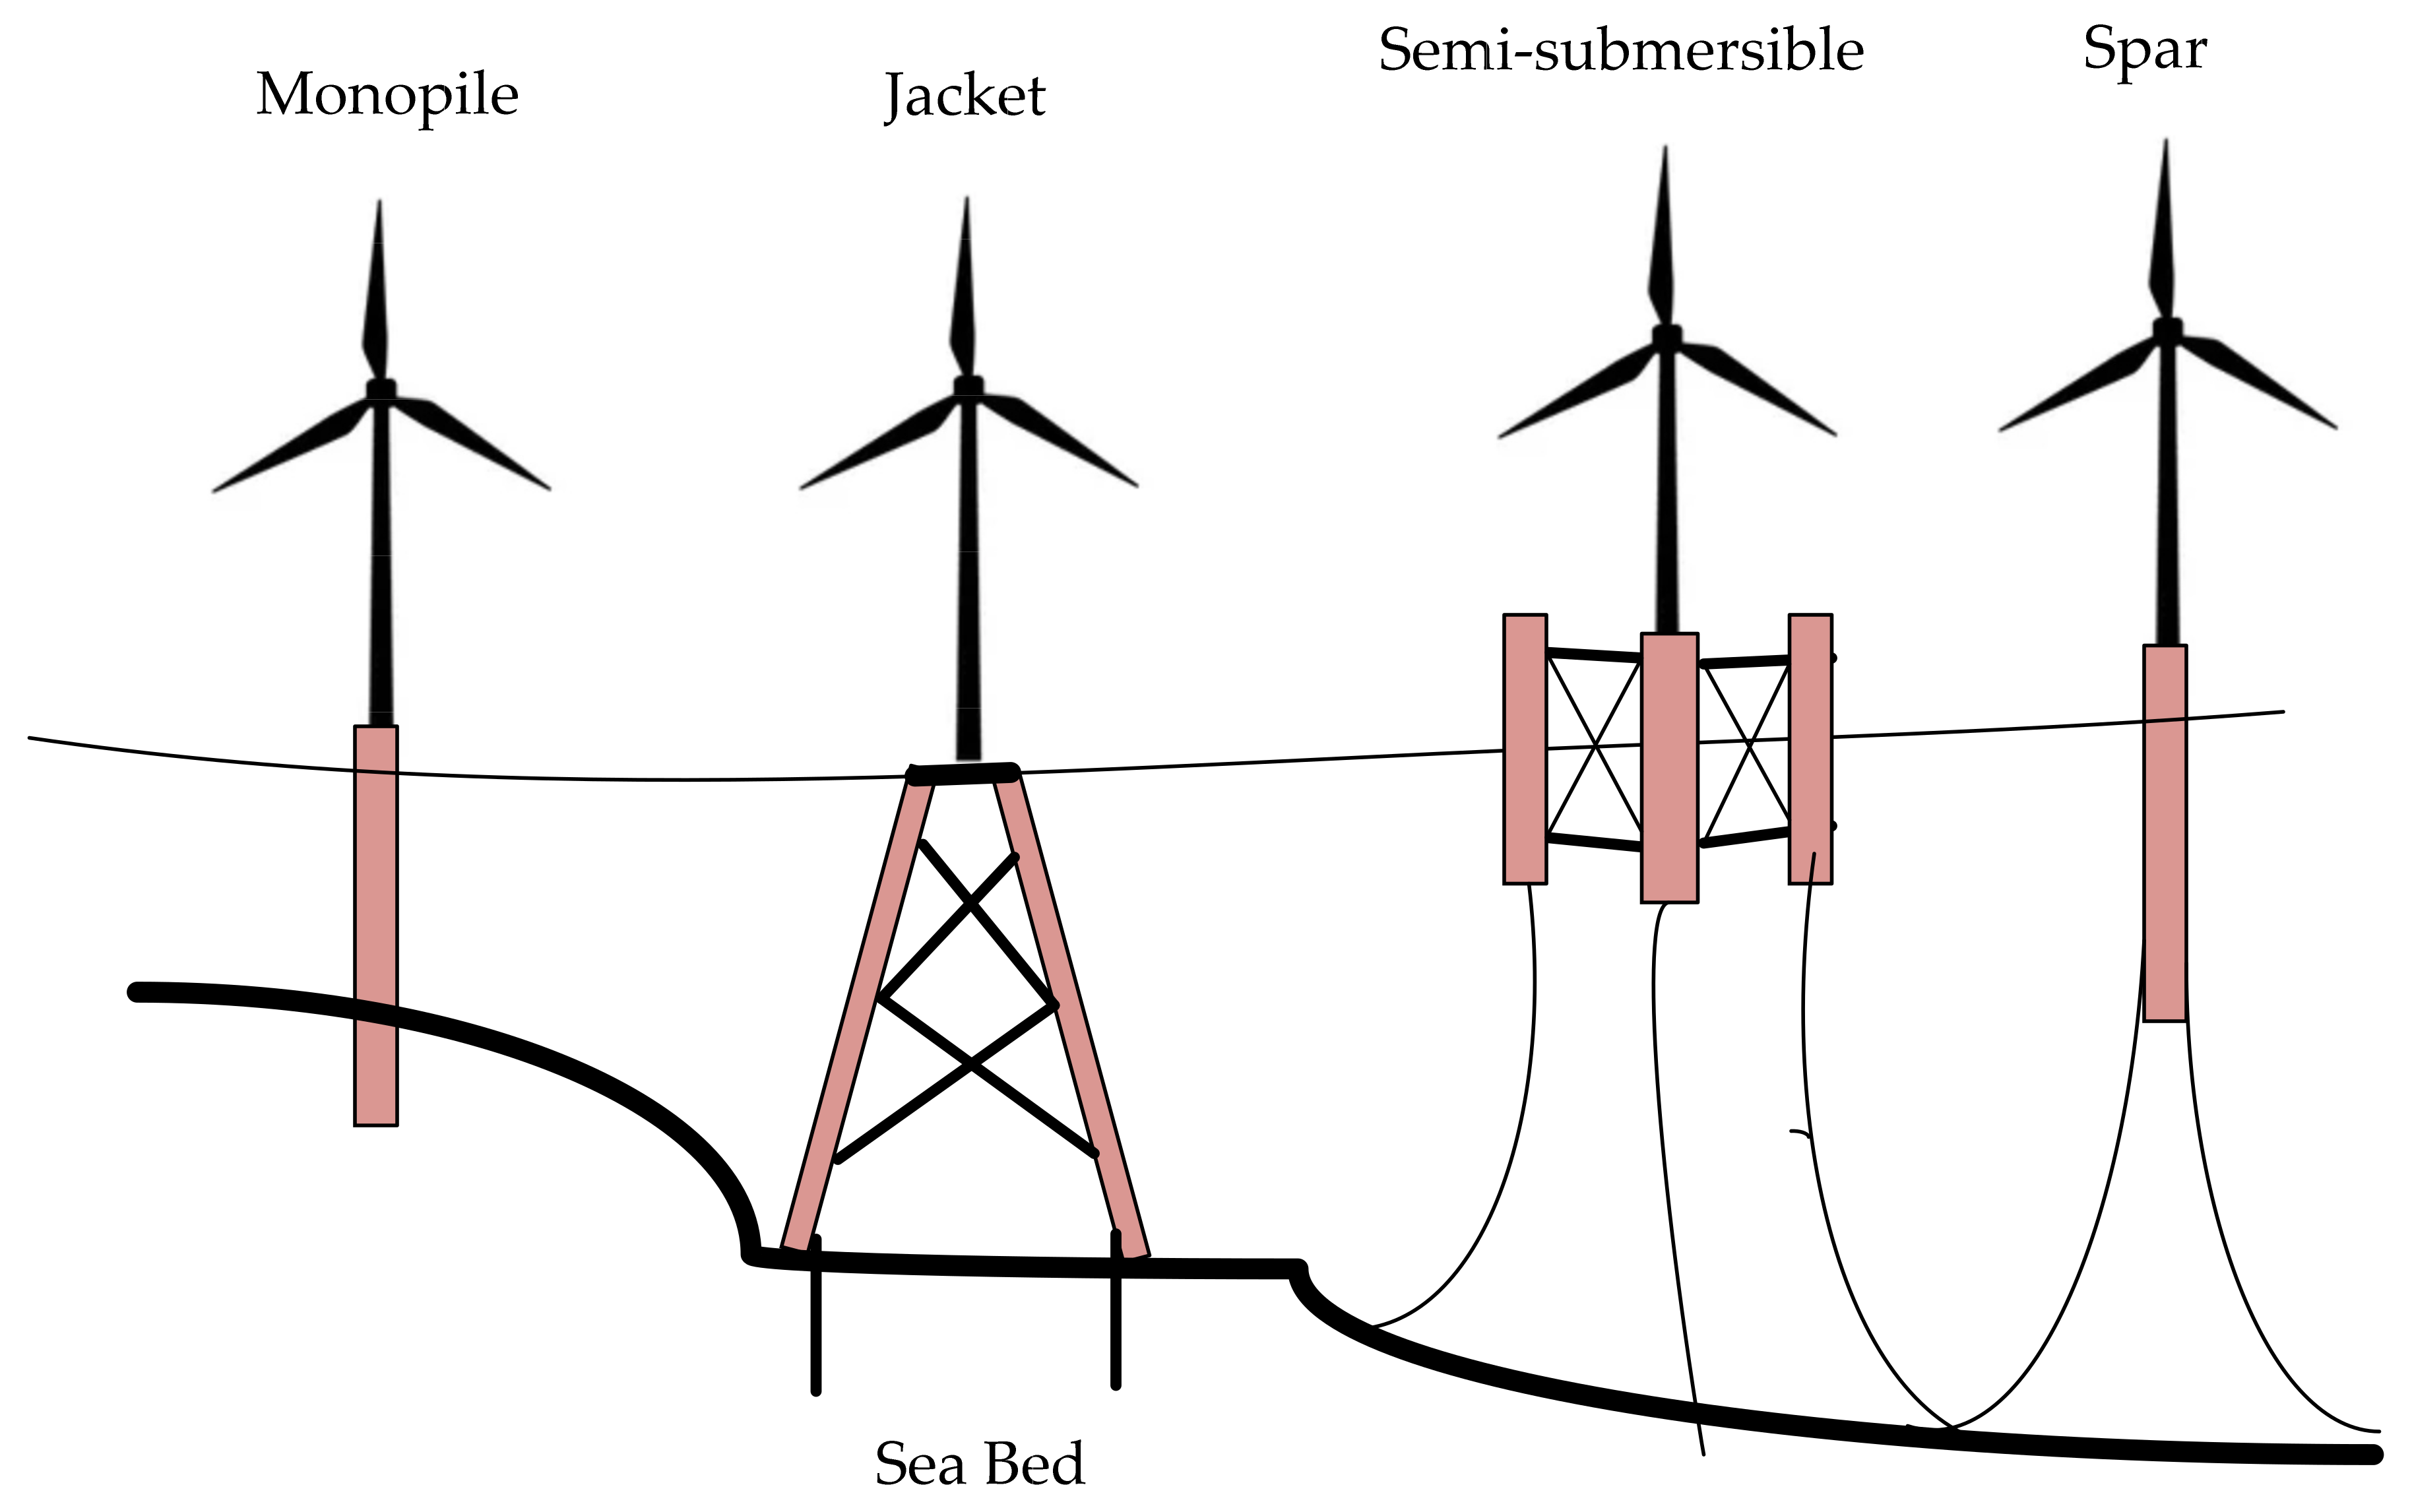
Figure 1. Wind-turbine foundation-types in different water depths.
Jmse 11 00173 g001
Figure 2. Dynamic co-simulation framework.
Jmse 11 00173 g002
Figure 3. Simulation model of 15 MW floating wind turbine with UMaine VolturnUS-S semi-submersible floating platform and mooring system for water depth of 70 m.
Jmse 11 00173 g003
Figure 4. UMaine VolturnUS-S Semi-submersible platform modeling in SIMPACK.
Jmse 11 00173 g004
Figure 5. Mooring-System Configuration.
Jmse 11 00173 g005
Figure 6. Power-generation process.
Jmse 11 00173 g006
Figure 7. DFIG Grid-Connected System.
Jmse 11 00173 g007
Figure 8. Layout of Hydraulic Pitch-Control System.
Jmse 11 00173 g008
Figure 9. 15 MW Wind-Turbine Power Curve.
Jmse 11 00173 g009
Figure 10. Relationship between Rotor Speed and Wind Speed.
Jmse 11 00173 g010
Figure 11. Fuzzy Sliding-Mode Controller.
Jmse 11 00173 g011
Figure 12. Wind Turbine Overall-Control-System Block Diagram.
Jmse 11 00173 g012
Figure 13. Simulation results of floating wind turbine with wind speed from 0 to 25 m/s and no wave by FSMC: (a) wind speed, (b) wave height, (c) rotor speed, (d) rotor-speed error, (e) output power, (f) generator torque, (g) blade-pitch, (h) tip-speed ratio, (i) floater surge, (j) floater sway, (k) floater heave, (l) floater roll, (m) floater pitch, (n) floater yaw, (o) mooring-line x-direction tension, (p) mooring-line y-direction tension, (q) mooring-line z-direction tension, (r) mooring-line tension.
Jmse 11 00173 g013
Figure 14. Simulation results of floating wind turbine by FSMC, with pitch-rate feedback in normal conditions; wind speed from 3 m/s to 16 m/s with 3% turbulence intensity, wave height of 1.4 m, and wave period of 7.8 s: (a) wind speed, (b) wave height, (c) rotor speed, (d) rotor-speed error, (e) output power, (f) generator torque, (g) blade-pitch, (h) tip-speed ratio, (i) floater surge, (j) floater sway, (k) floater heave, (l) floater roll, (m) floater pitch, (n) floater yaw, (o) mooring-line x-direction tension, (p) mooring-line y-direction tension, (q) mooring-line z-direction tension, (r) mooring-line tension.
Jmse 11 00173 g014aJmse 11 00173 g014b
Figure 15. Simulation results under 50-year return-period extreme conditions, with wind speed 57 m/s and 3% turbulence: (a) wind speed, (b) wave height, (c) rotor speed, (d) roto- speed error, (e) output power, (f) generator torque, (g) blade-pitch, (h) tip-speed ratio, (i) floater surge, (j) floater sway, (k) floater heave, (l) floater roll, (m) floater pitch, (n) floater yaw, (o) mooring-line x-direction tension, (p) mooring-line y-direction tension, (q) mooring-line z-direction tension, (r) mooring-line tension.
Jmse 11 00173 g015aJmse 11 00173 g015b
Table 1. Beaufort Scale.
Beaufort NumberWind Speed (m/s)Wave Height (m)
00–0.20–0.1
10.3–1.50.1–0.3
21.6–3.30.3–0.5
33.4–5.40.5–0.9
45.5–7.90.9–1.25
58–10.71.25–2.5
610.8–13.82.5–3
713.9–17.13–4
817.2–20.74–6
920.8–24.46–9
1024.5–28.49–11
Table 2. IEA 15 MW Wind-Turbine Specifications.
ParameterValueUnit
Rotor orientationUpwind-
ControlVariable speed-
collective pitch-
Cut-in wind speed3m/s
Cut-out wind speed25m/s
Rated wind speed10.59m/s
Rated electrical power15MW
Number of blades3
Rotor diameter240m
Table 3. Floating-Tower Geometric Properties.
ParameterValueUnit
Mass1263ton
Length129.582m
Young’s Modulus2.00 × 1011Pa
Shear Modulus7.93 × 1010Pa
Density7850kg/m3
Table 4. Blade Key Parameters.
ParameterValueUnit
Blade Mass65.228ton
Blade length117m
Tip Prebend4.00m
Max Chord5.77m
Blade Ixx4.63 × 107kg m2
Blade Iyy4.63 × 107kg m2
Blade Izz 2.02 × 10⁴kg m2
Table 5. Floating-platform properties.
ParameterValueUnit
Hull Displacement20,206m3
Hull Steel Mass3914ton
Tower Interface Mass100ton
Ballast Mass (Fixed/Fluid)2540/11,300ton
Draft20m
Freeboard15m
Table 6. Mooring-System Properties.
ParameterValueUnit
Number of Lines3-
Anchor Depth70m
Fairlead Depth14m
Anchor Radial Spacing779.6m
Fairlead Radial Spacing58.00m
Line Unstretched Length789.64m
Nominal Chain Diameter0.185m
Dry-Line Linear Density685kg/m
Extensional Stiffness3.27 × 10 9N
Disclaimer/Publisher’s Note: The statements, opinions and data contained in all publications are solely those of the individual author(s) and contributor(s) and not of MDPI and/or the editor(s). MDPI and/or the editor(s) disclaim responsibility for any injury to people or property resulting from any ideas, methods, instructions or products referred to in the content.