Article

Test System Development and Experimental Study on the Fatigue of a Full-Scale Steel Catenary Riser

1
State Key Laboratory of Hydraulic Engineering Simulation and Safety, Tianjin University, Tianjin 300072, China
2
Tianjin Key Laboratory of Port and Ocean Engineering, Tianjin University, Tianjin 300072, China
3
College of Mechanical and Marine Engineering, Beibu Gulf University, Qinzhou 535011, China
*
Author to whom correspondence should be addressed.
J. Mar. Sci. Eng. 2022, 10(9), 1325; https://doi.org/10.3390/jmse10091325
Submission received: 6 August 2022 / Revised: 6 September 2022 / Accepted: 10 September 2022 / Published: 19 September 2022
(This article belongs to the Special Issue Subsea Pipelines)

Abstract

:
This paper presents a full-scale deep-water steel catenary riser fatigue test system. The proposed system can carry out fatigue tests on steel catenary risers, hoses, and subsea pipelines up to 21 m in length, ranging from 8 to 24 inches in diameter. The test system was realized by mechanical loading with loading control systems, and could carry out axial tension and compression, bending moment, torsion, and internal pressure to simulate all load types on deep-water steel catenary risers or subsea pipelines. The counterforce was sustained by a counterforce frame. Through mechanical simulation analysis, the authors determined the size of the counterforce frame and designed the connection form of the counterforce frame and loading system. According to the required loading capacity, the appropriate cylinder thickness and diameter were obtained through calculation. After the design and construction of the test system, the authors designed a fatigue test to confirm the loading capacity and accuracy of the test system. The authors performed full-scale testing to assess the fatigue performance of pipe-to-pipe mainline 5G girth welds fabricated to BS 7608. This test was designed according to the stress level of pipelines in the Lingshui 17-2 gas field, and the test results were compared with the calculation results of the S–N curve.

1. Introduction

A deep-water riser is the only channel connecting a subsea wellhead and surface floating facilities, and it is an important facility for the development of deep-water oil and gas fields. In contemporary riser construction, steel catenary risers are preferred for deep-water oil and gas development. In deep-water environments, due to the presence of wind, waves, currents, and pressure, both inside and outside the riser, the riser structure is subjected to complex loads. Under the effect of long-term loads, fatigue damage failure occurs in the riser, resulting in structural damage, and the consequences are very serious [1,2]. Low-cycle fatigue failure occurs rapidly in a short amount of time under extreme loads [3,4]. Therefore, the fatigue life of tubular structures has received more attention [5]. Particularly for steel tubular welded structures, fatigue failure is a very general failure mode. Nassiraei et al. [6] proposed a detailed fatigue calculation method for welded tubes, which was verified by an FE model, and finally validated according to the experimental data and UK DoE acceptance criteria.
Fatigue tests are the key method to solving the problem of riser fatigue and for obtaining the fatigue life of a riser. Especially in the weld structure of a riser, the toe of the weld can easily become the fatigue crack cracking site [7,8]. Moreover, high stress concentrations [9,10] and large residual stress [11,12,13,14,15] exist at the welding point under cyclic loading. Under the action of higher stress, the structure will undergo plastic deformation [16]. According to the research, even under the action of low-cycle fatigue, the specimen will have some structural plastic deformation [17], which makes the prediction of structural fatigue life more difficult. Therefore, fatigue life prediction using experimental methods is effective in fatigue research at present. For tubular welded structures, CT specimens are mostly used for material fatigue tests. A series of fatigue tests was carried out on CT specimens, considering corrosion [18]. However, the structural form will affect the stress concentration, and the fatigue life of the structure cannot be predicted by a CT sample test. Therefore, a full-scale fatigue test is required to determine the fatigue life of the structure.
In this study, the design and construction of a full-scale riser fatigue test system were carried out, and the composition and layout of the test platform are described in detail, including the design of the reaction frame structure to withstand the load reaction force, the design of the core loading system of the test platform, and the design of the fatigue test. The experimental capability of the test platform was tested, and the experimental capability of the system was verified by comparing the theoretical calculation results with the loading test results. Finally, future functions of the test system and further improvements to the test ability of the system are proposed.

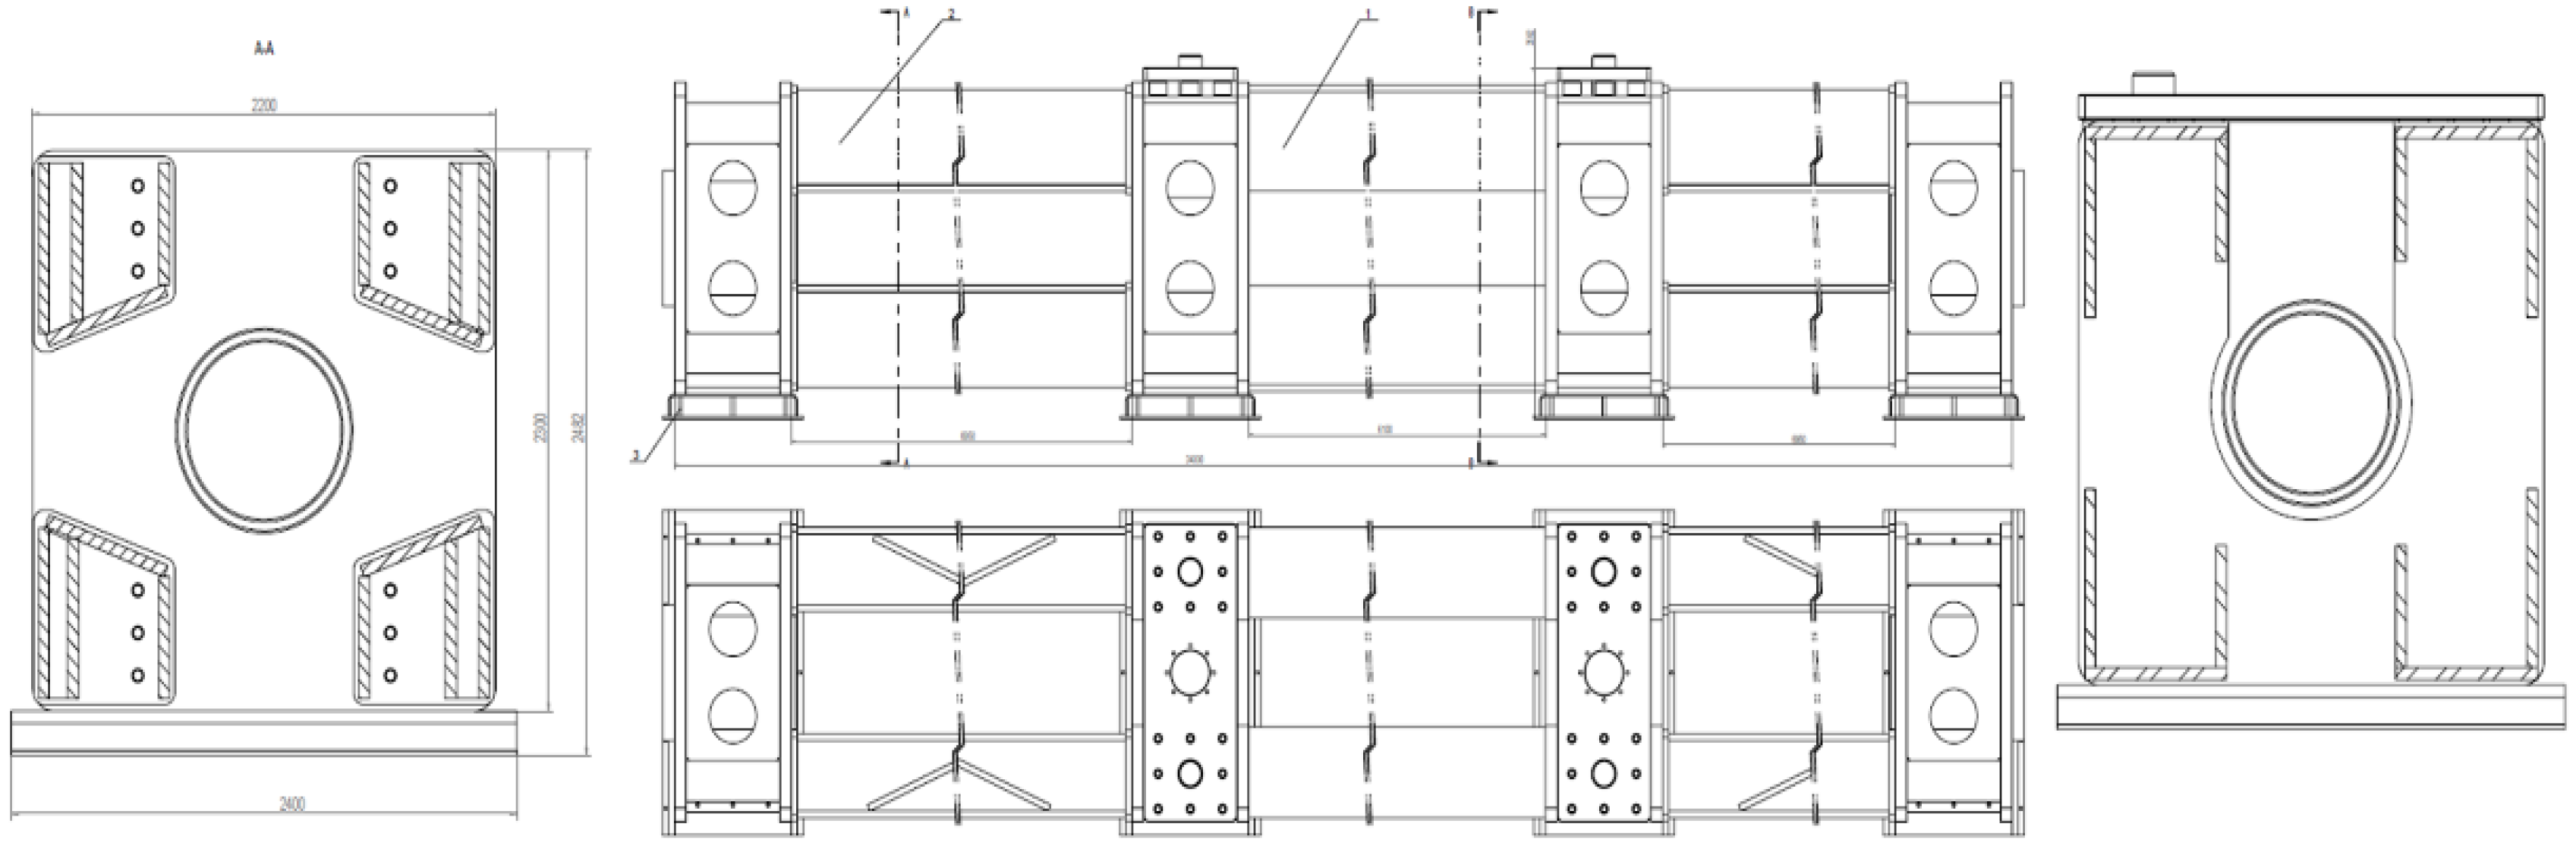
2. Development of the Counterforce Frame

The counterforce frame was developed to sustain a maximum axial tension/compression loading of 3000 kN, torque force of 200 kN, and bending moment of 1300 kN·m. Therefore, the reinforcement design was adopted for axial force, torsion force, and bending moment loading: the rest was trusswork. The external dimensions of the counterforce frame were 2.3 m× 2.3 m× 24 m (excluding the loading actuator). Its combined frame structure, which had a horizontal installation, was made of Q345 steel. Its overall structure is shown in Figure 1.

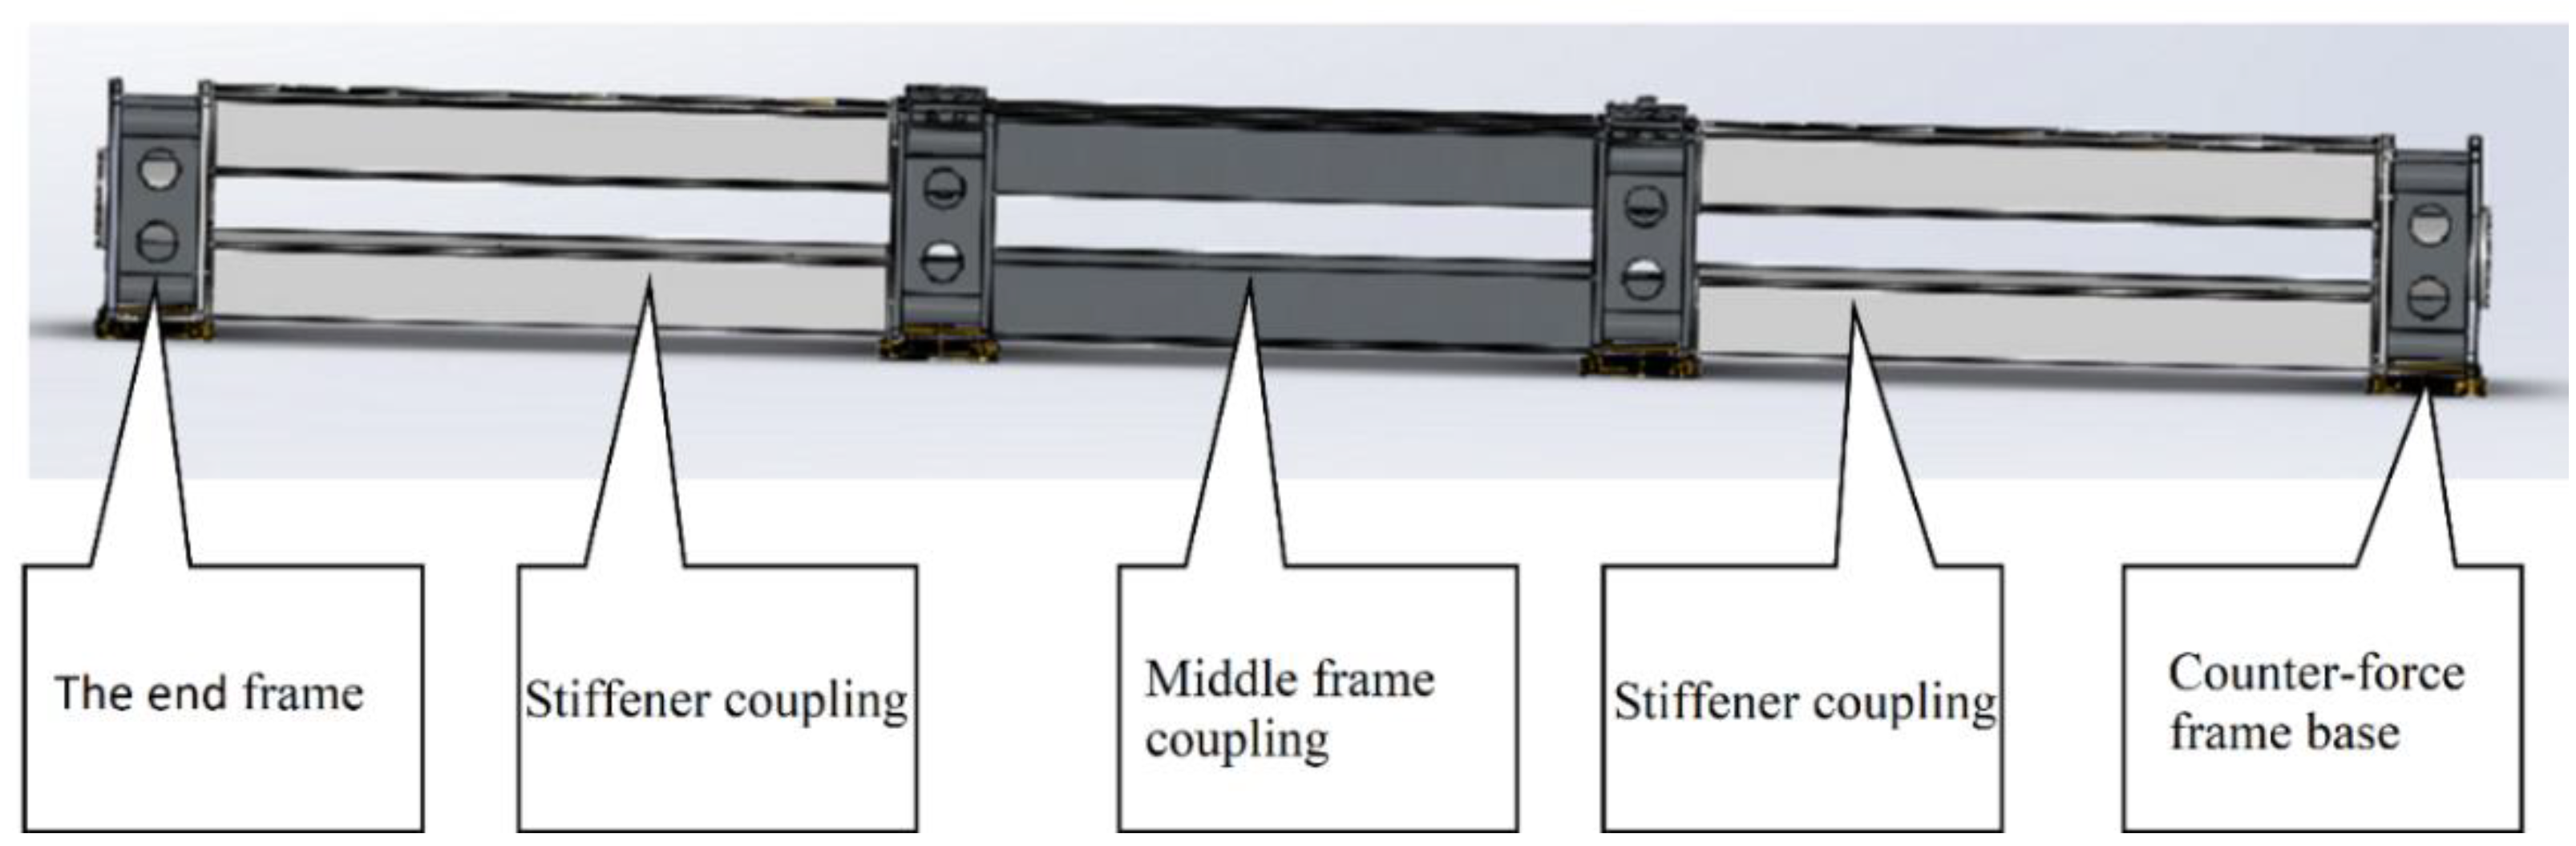
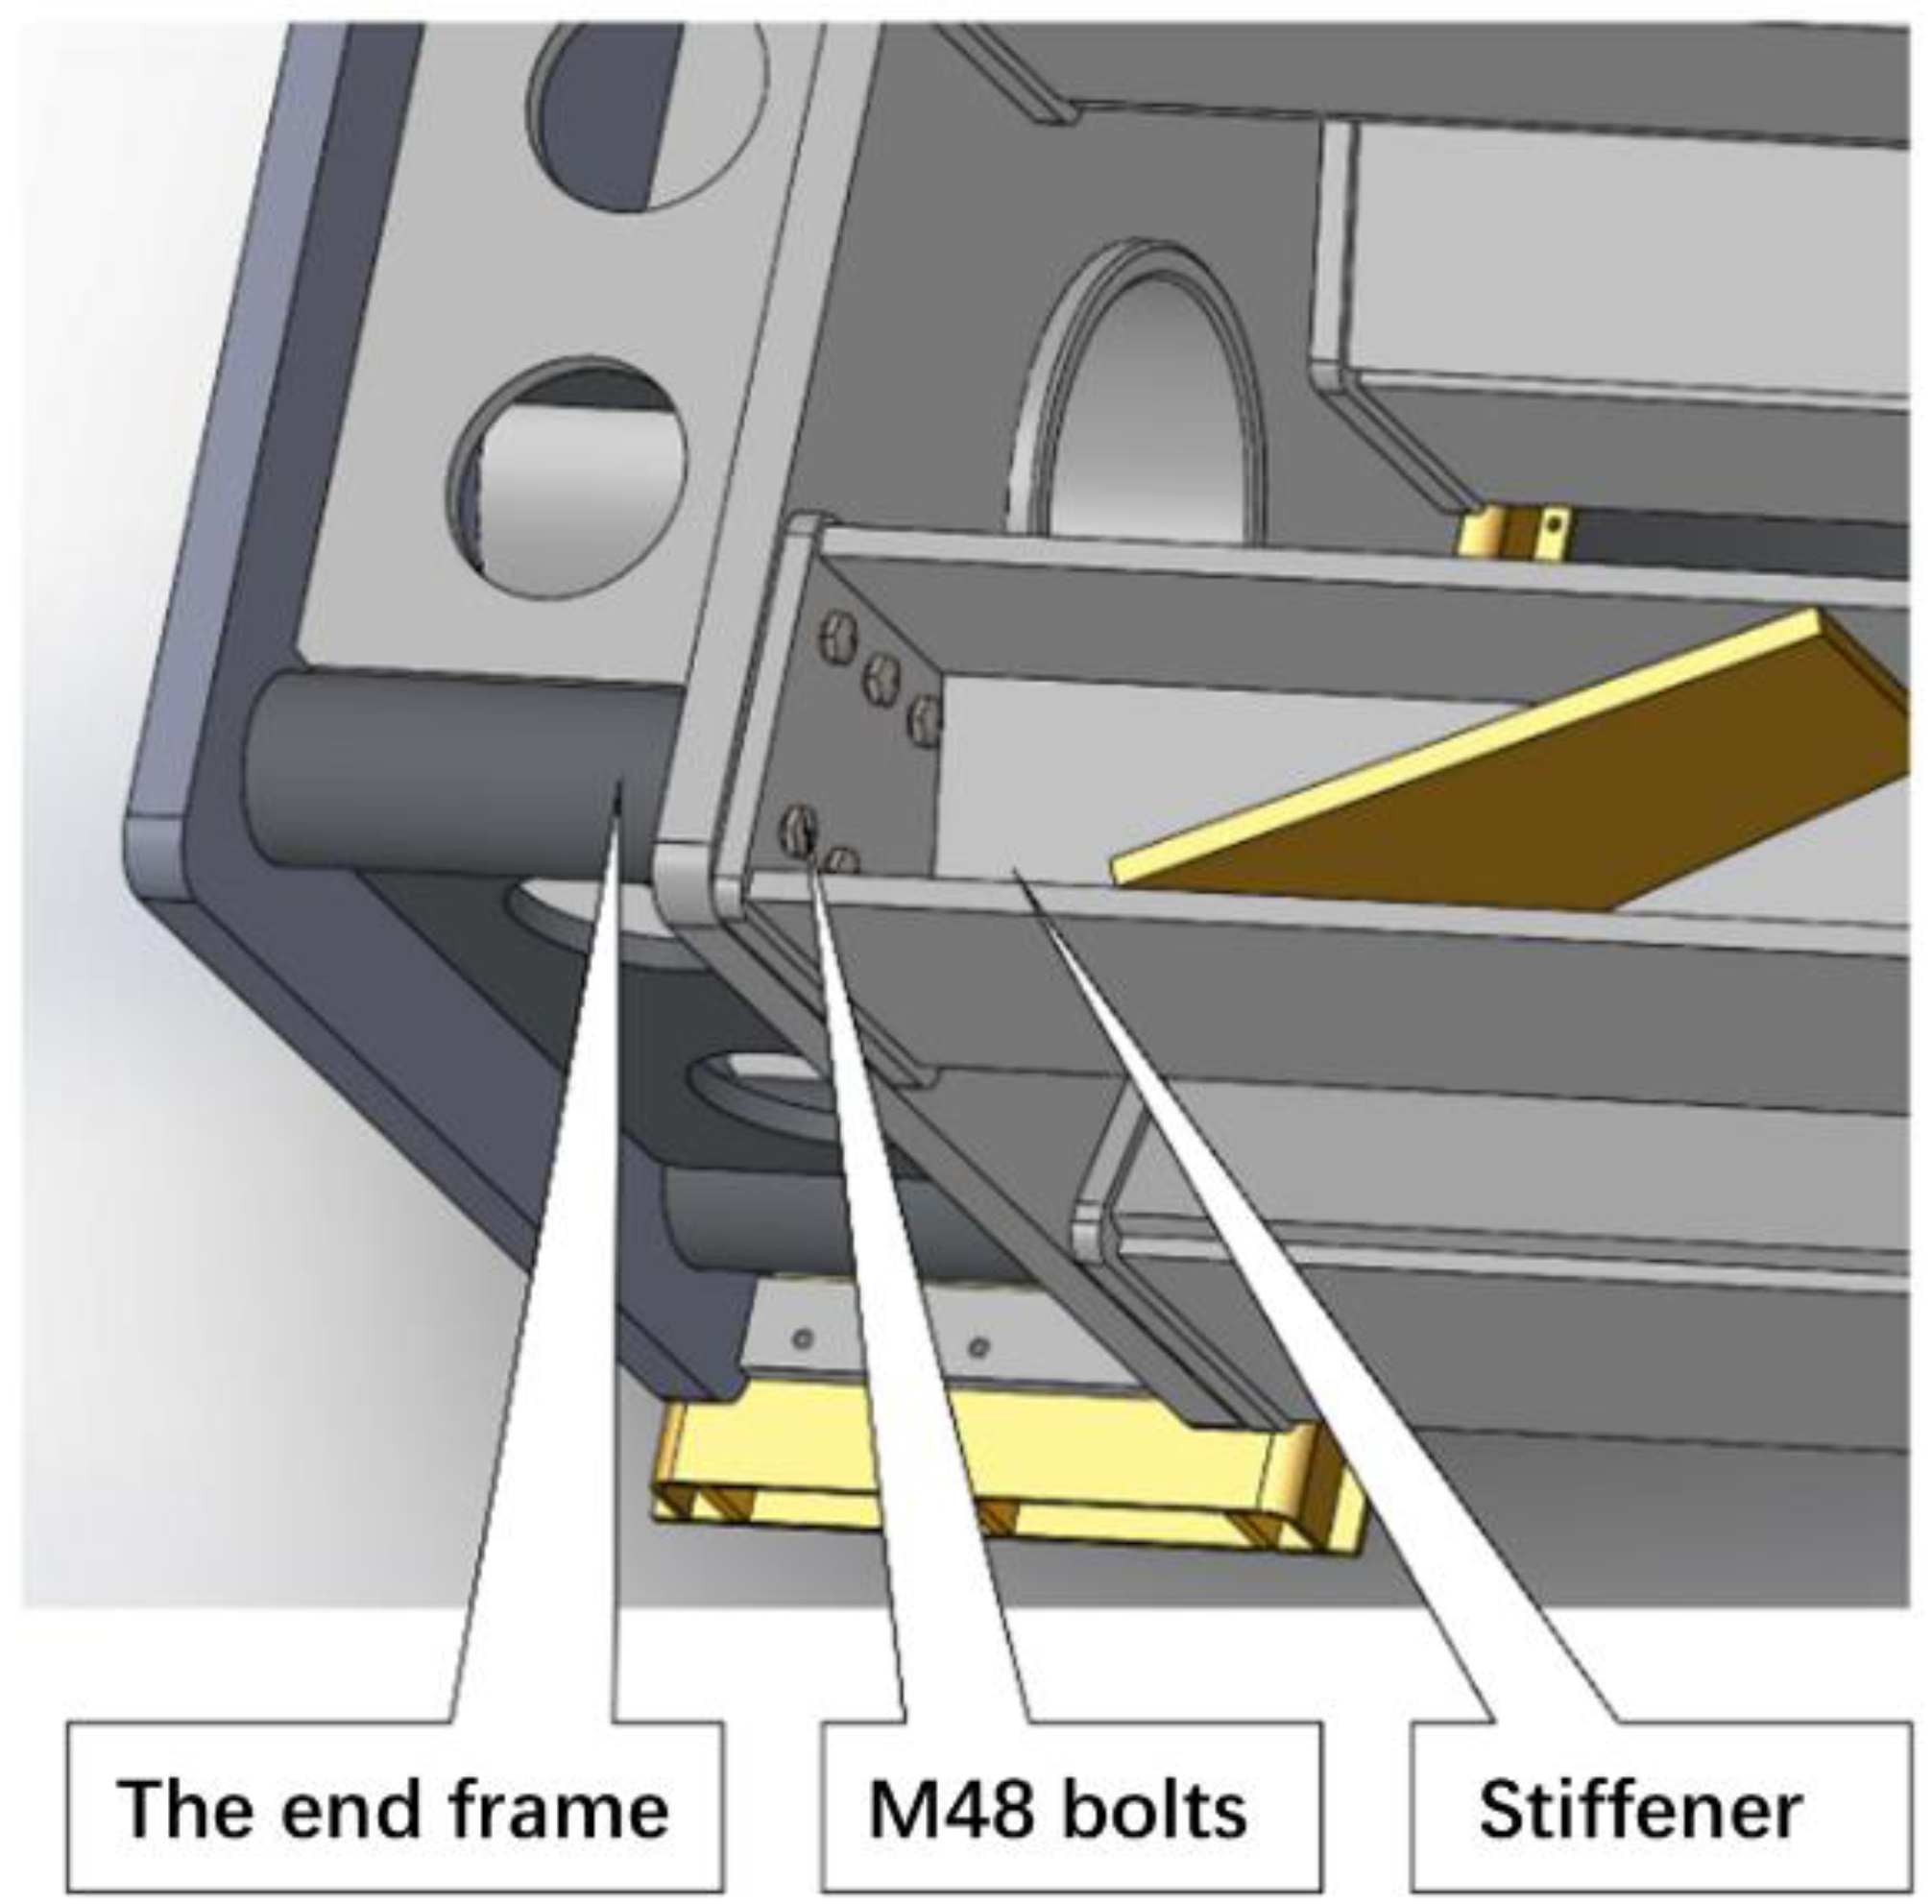
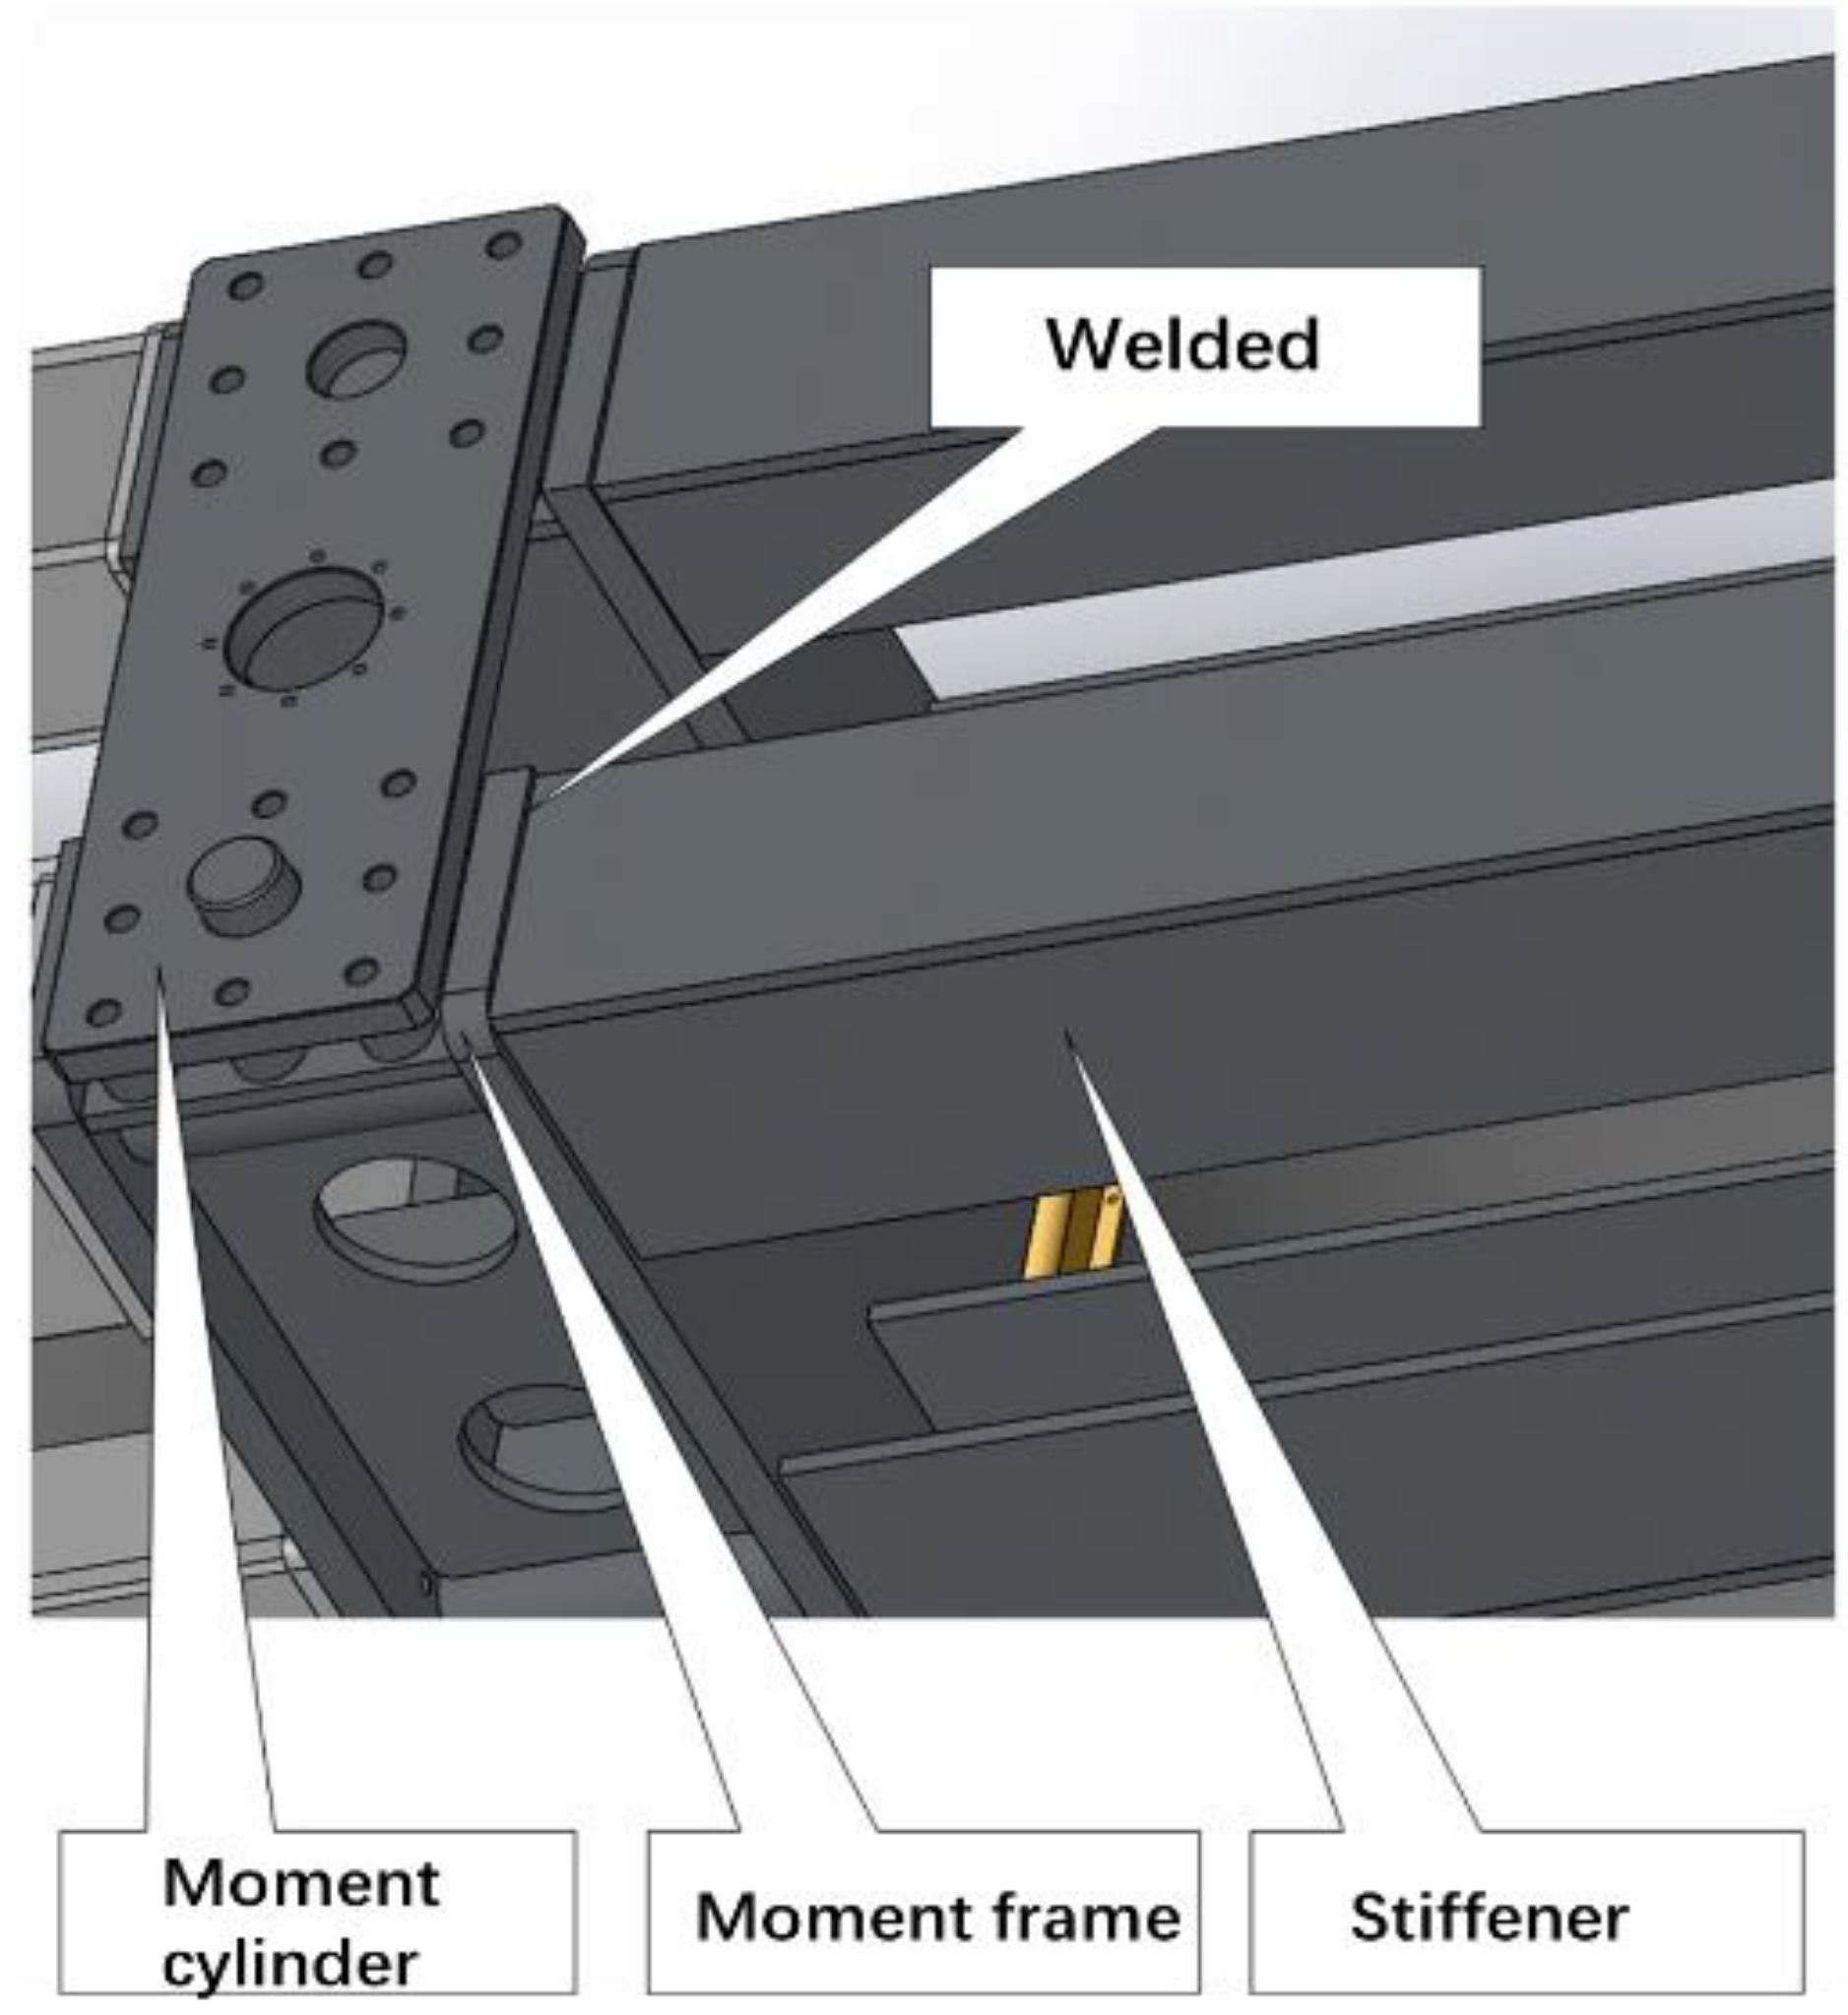
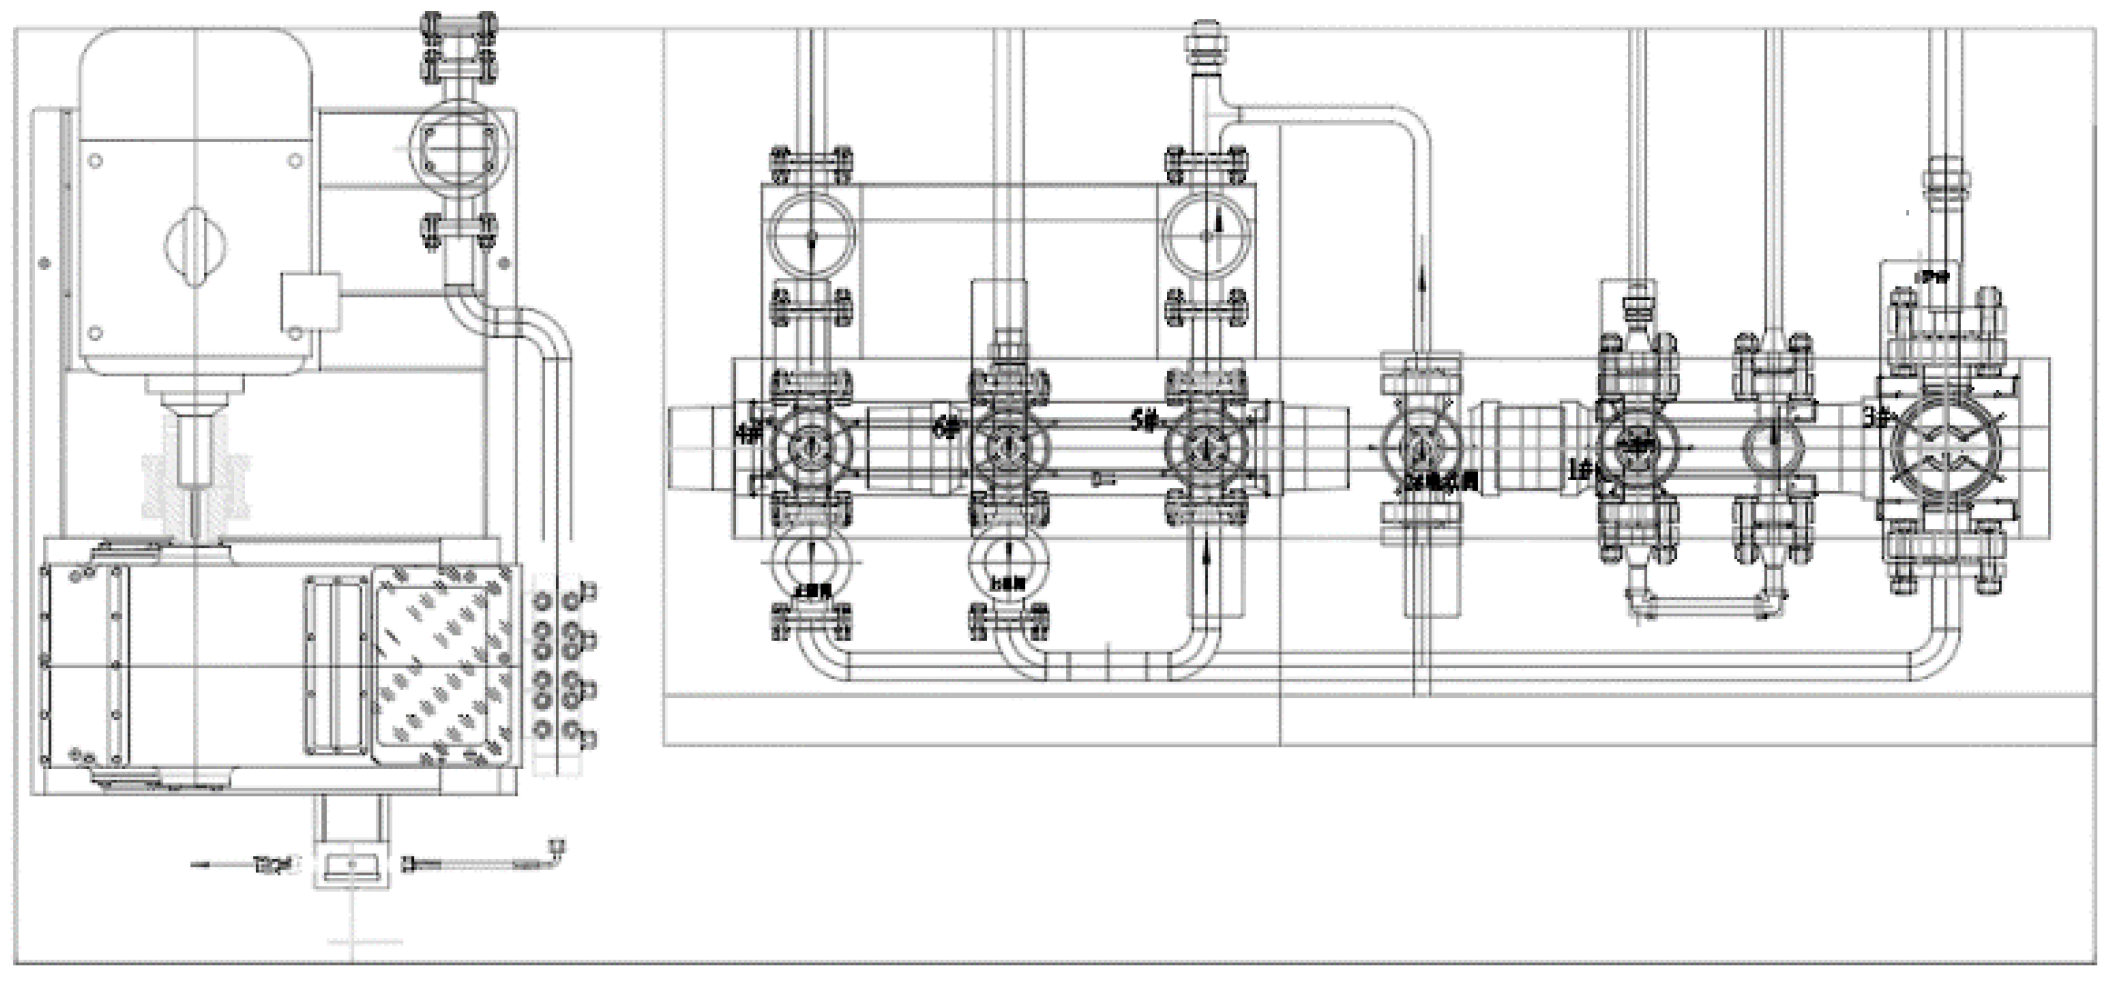
2.1. Main Components of Counterforce Frame

The counterforce frame was composed of the end frame (i.e., tension/pressure and torsional loading counterforce frame), middle frame coupling (i.e., moment loading counterforce frame), stiffener coupling, and counterforce frame base, as shown in Figure 2.
The front and rear end frames were assembled using a middle frame coupling and stiffener couplings and securely connected by 24 M48*250 12.9 high-strength bolts. The connection form of the end frame and the stiffener coupling is shown in Figure 3.
The middle frame coupling was welded together from two moment loading counterforce frames and stiffener couplings. The moment cylinder mounting plate was installed on the upper part of the moment loading counterforce frame. The moment cylinder mounting plate could be rotated 90 degrees along the horizontal direction. The upper part of the moment loading reaction frame was slotted, and the U-shaped structure was convenient for lifting the riser specimen up and down. The connection form of the frame coupling is shown in Figure 4.
The thickness of the end frame and the middle frame coupling was 100 mm, and the thickness of the stiffener coupling was 50 mm.

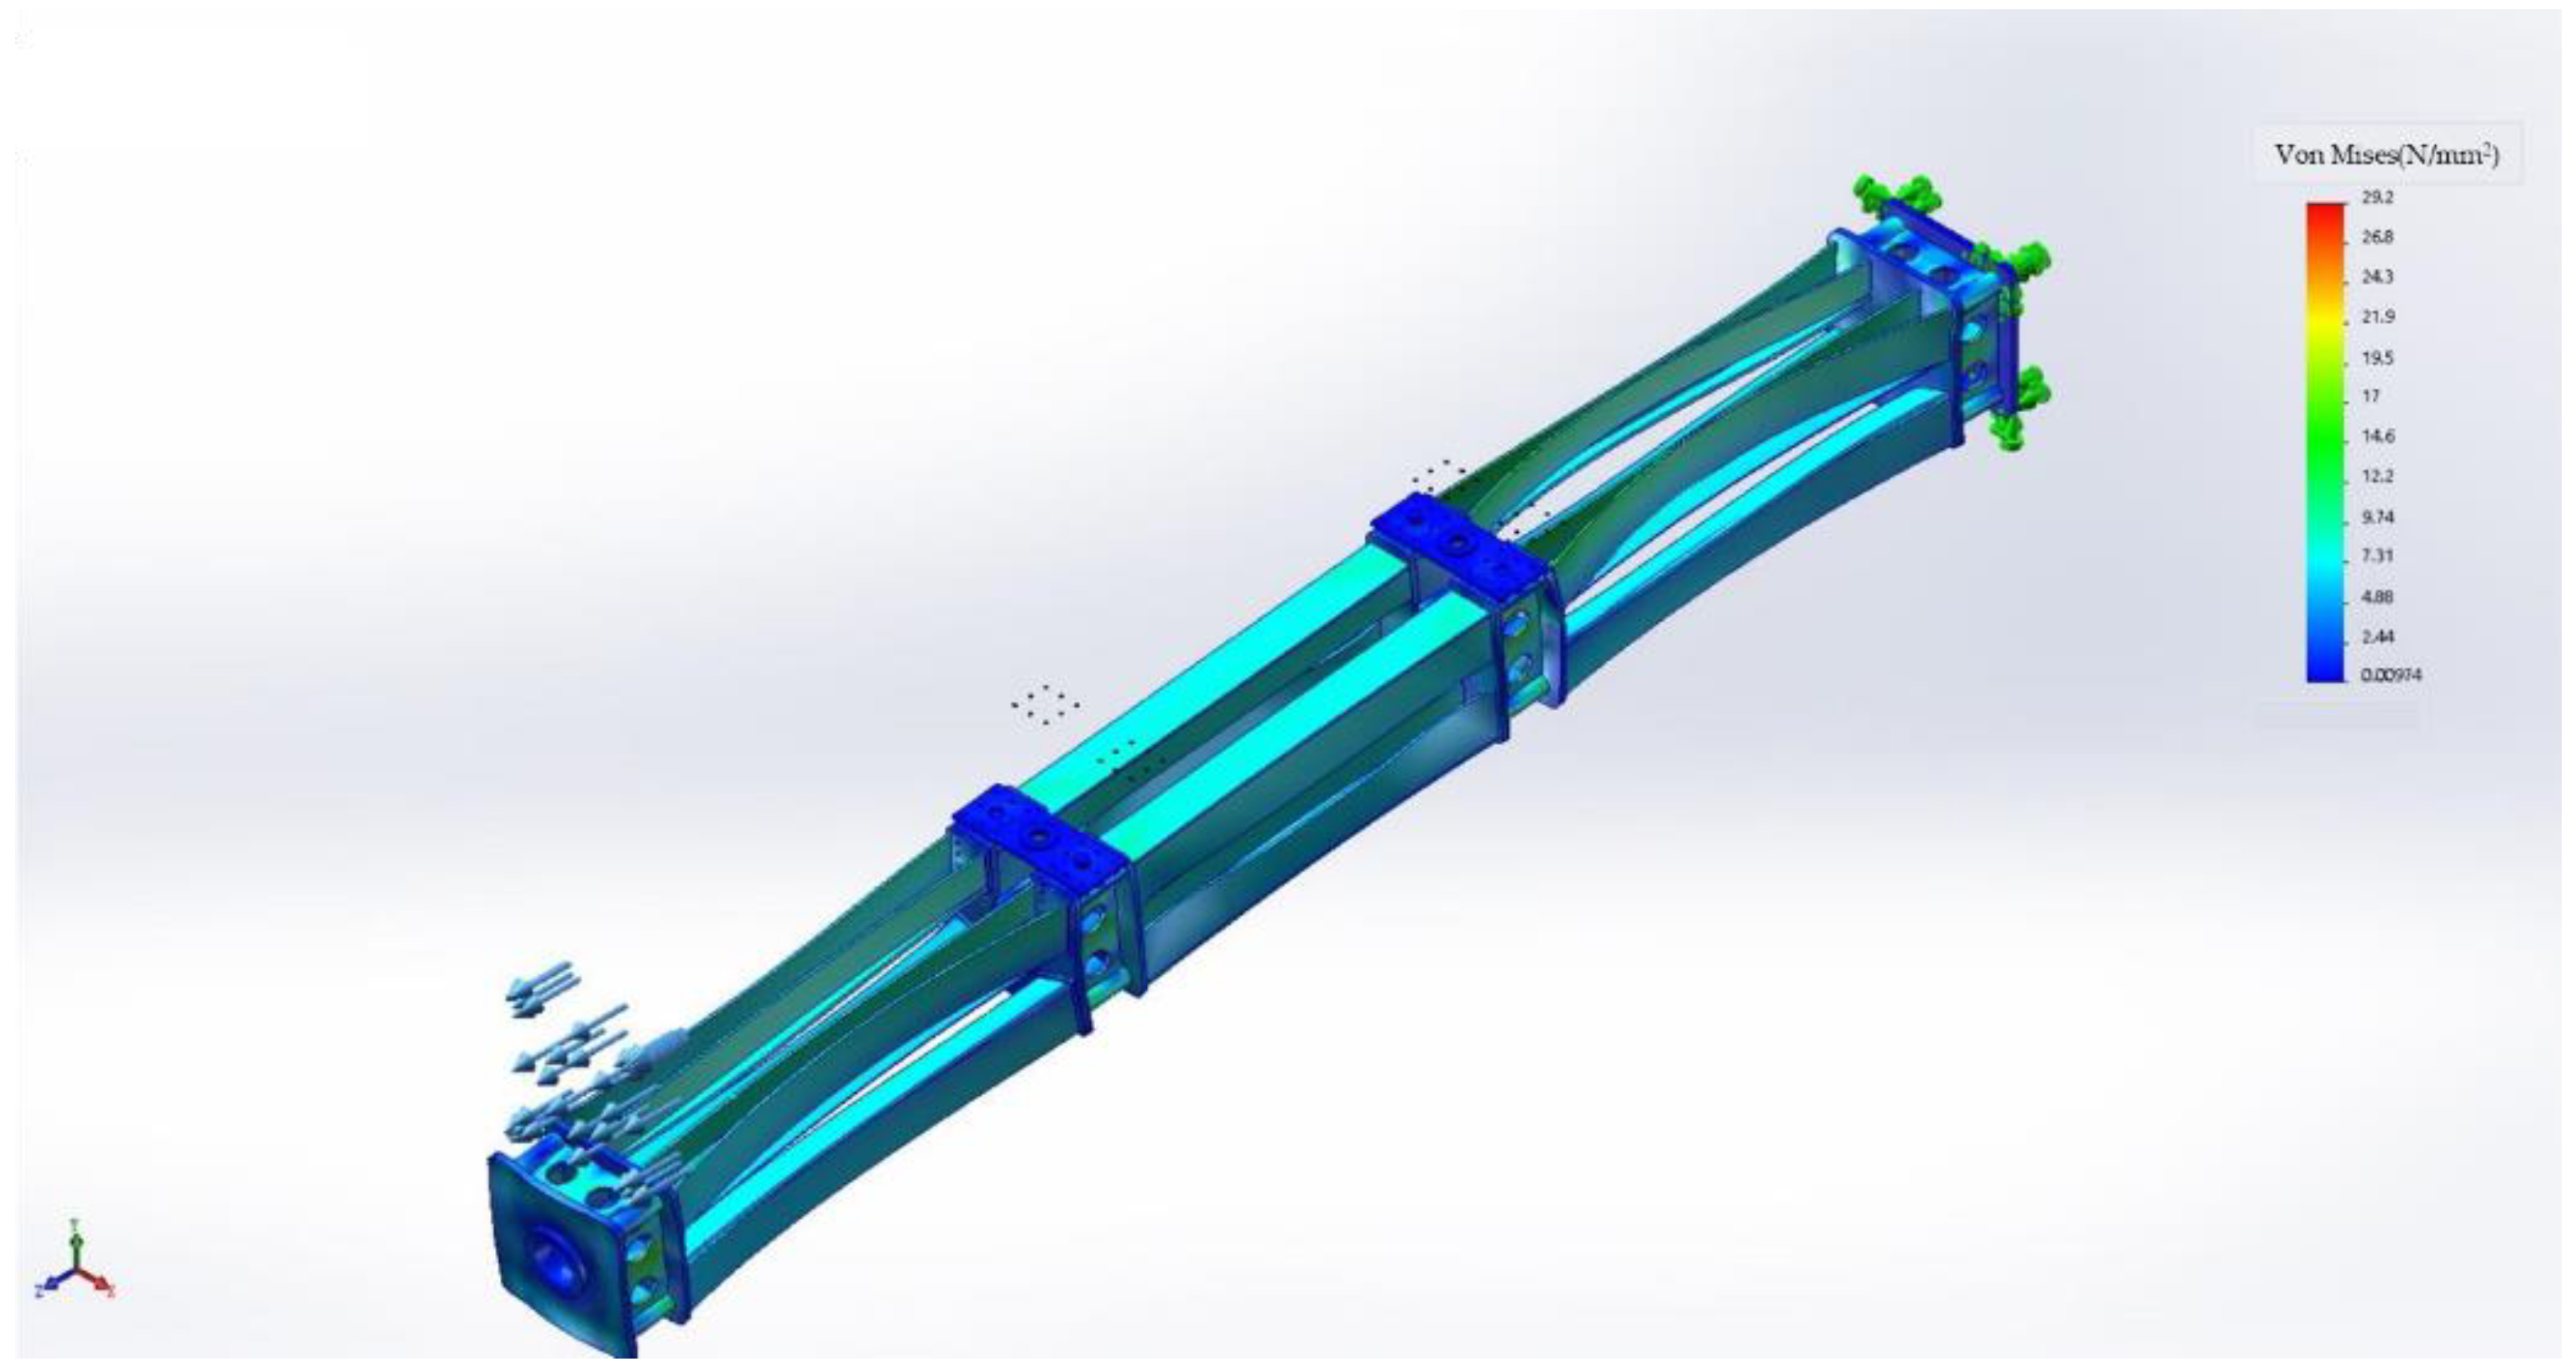
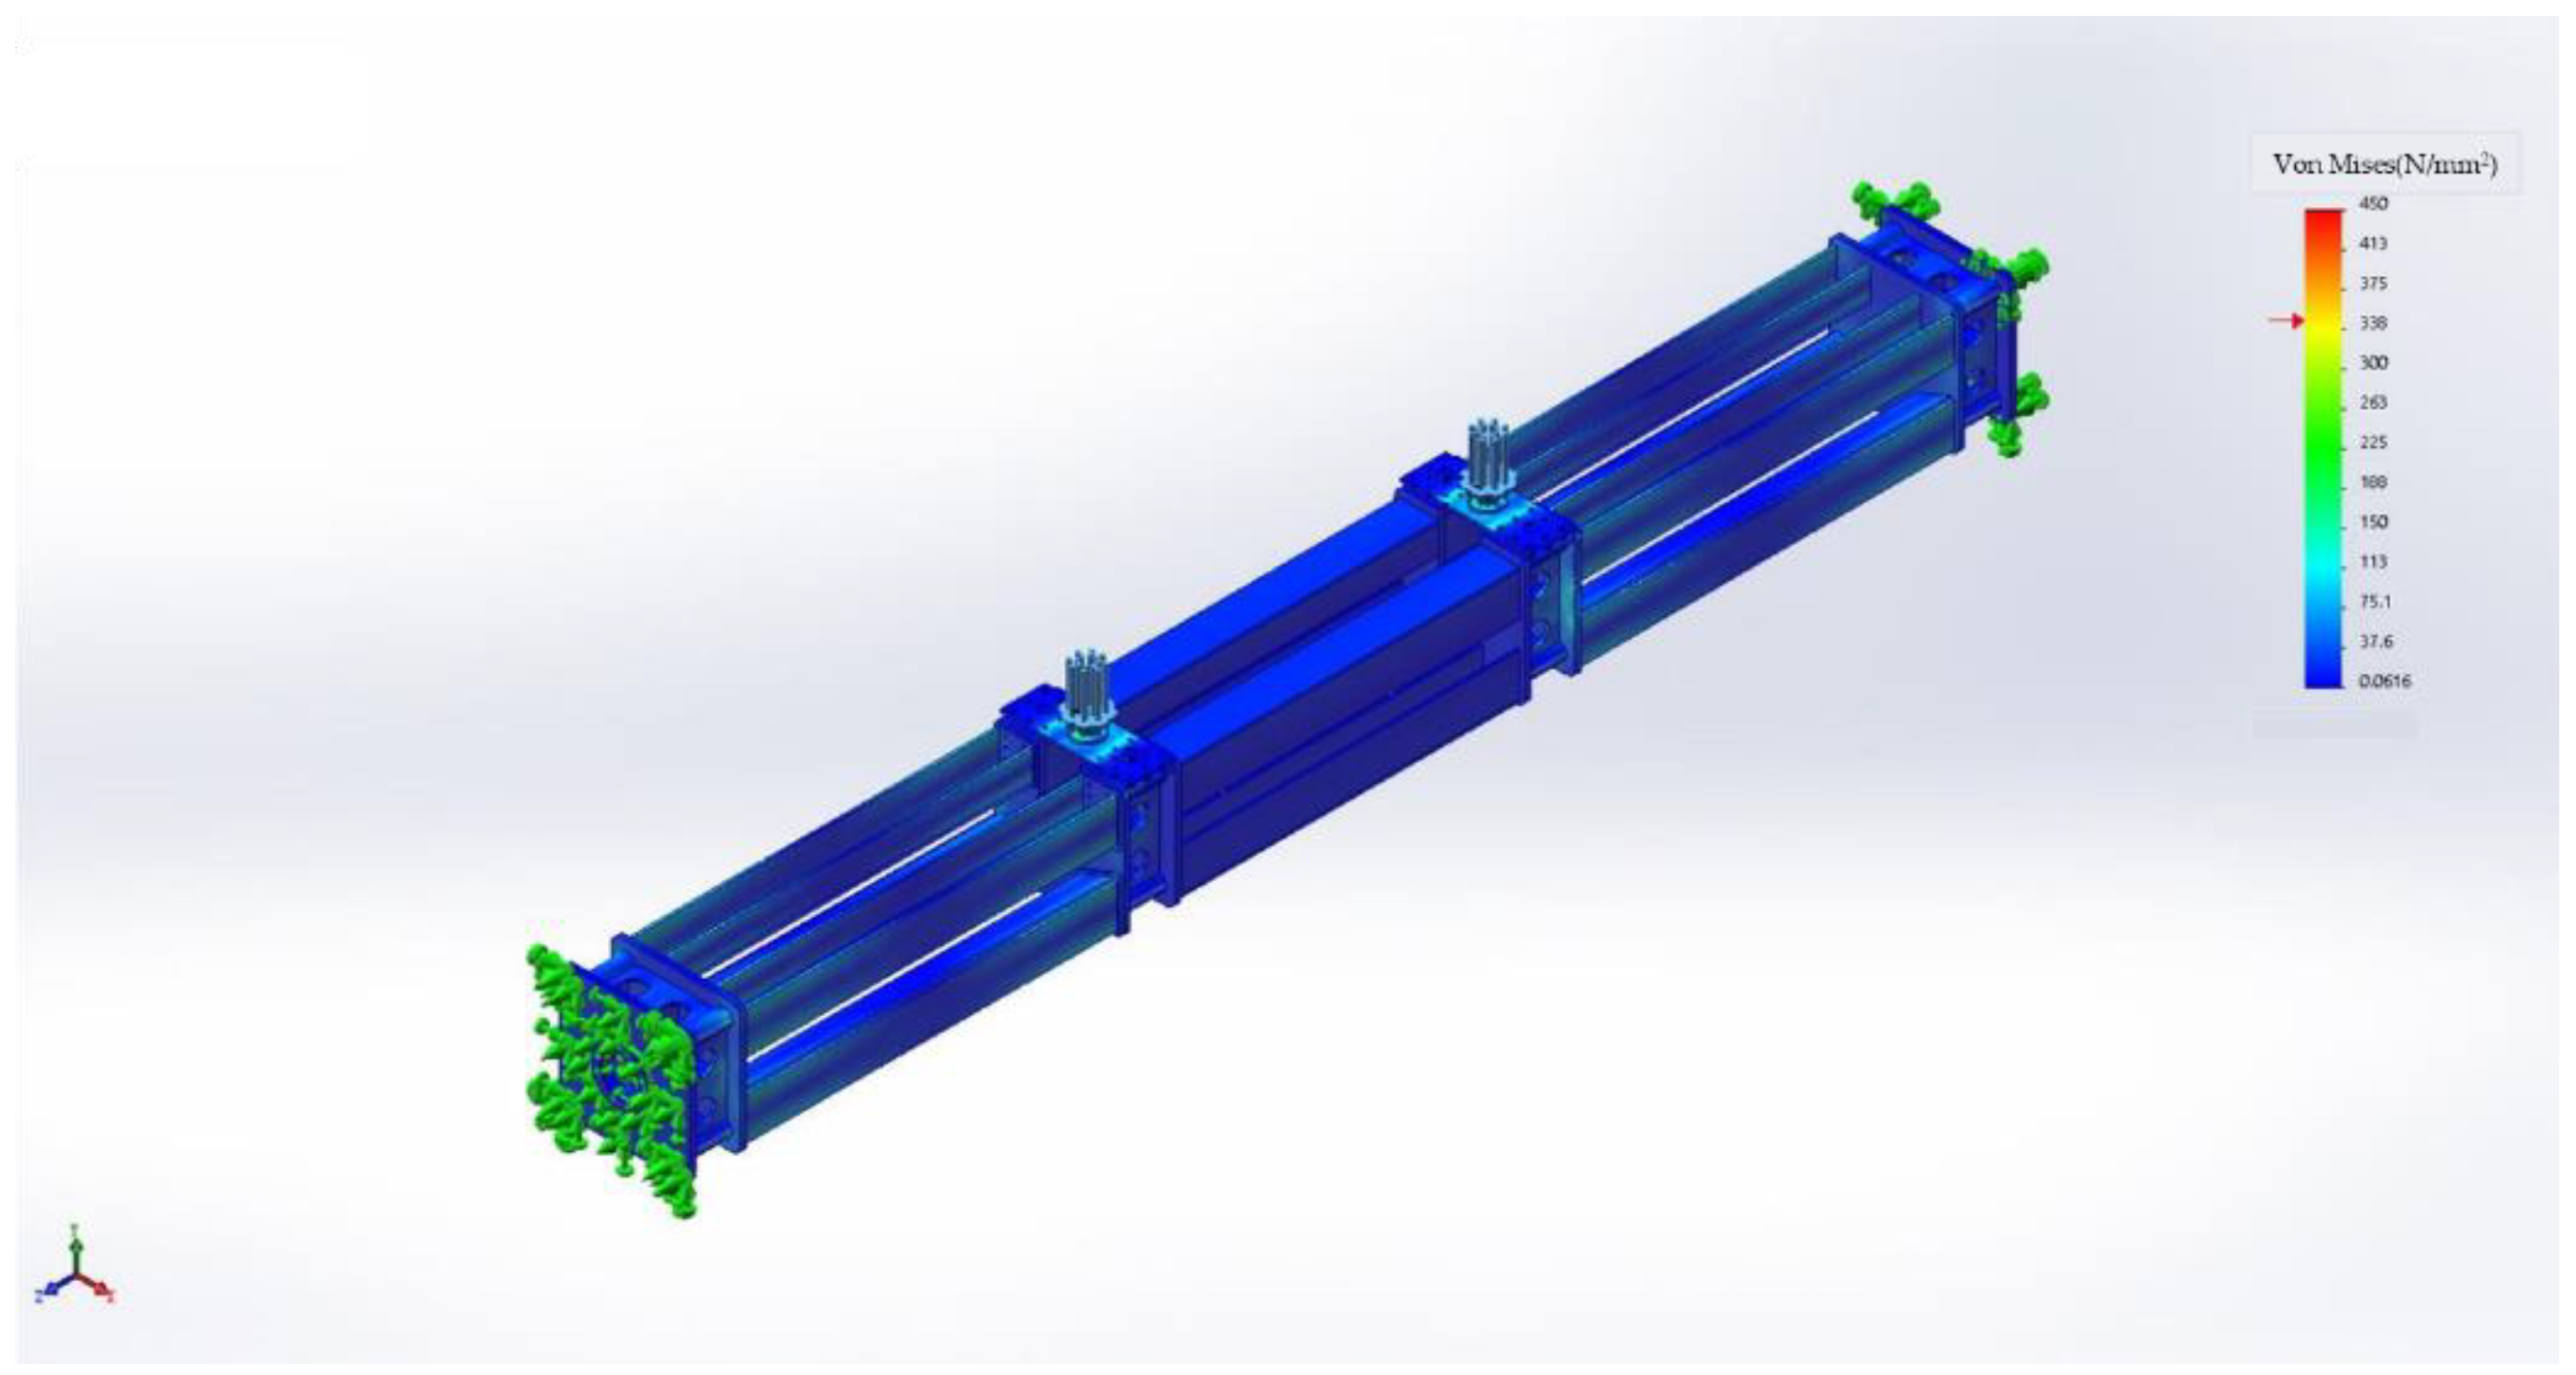
2.2. Force Analysis of the Counterforce Frame

The model of the counterforce frame was established by SOLIDWORKS, and the strength and natural frequency were analyzed. The counterforce frame was used to sustain the reaction force of the test system, and the axial load and bending moment under the maximum loading capacity of the test platform could be loaded into the model in the form of the reaction force. An axial tension and compression of 3000 kN and an out-of-plane bending moment of 1300 kN·m were applied to the model, and a stress cloud diagram was obtained in Figure 5 and Figure 6.
The maximum tensile stress was 38 MPa, and the maximum compressive stress was 29.2 MPa, much lower than the yield stress of Q345.
In order to ensure the safety of the reaction frame structure during loading, the natural frequency of the counterforce frame was calculated to avoid loading resonance. The natural frequency of the counterforce frame was 3 Hz. Therefore, a loading frequency of 3 Hz was avoided when designing the test. The natural frequency analysis results of the structure are shown in Figure 7.

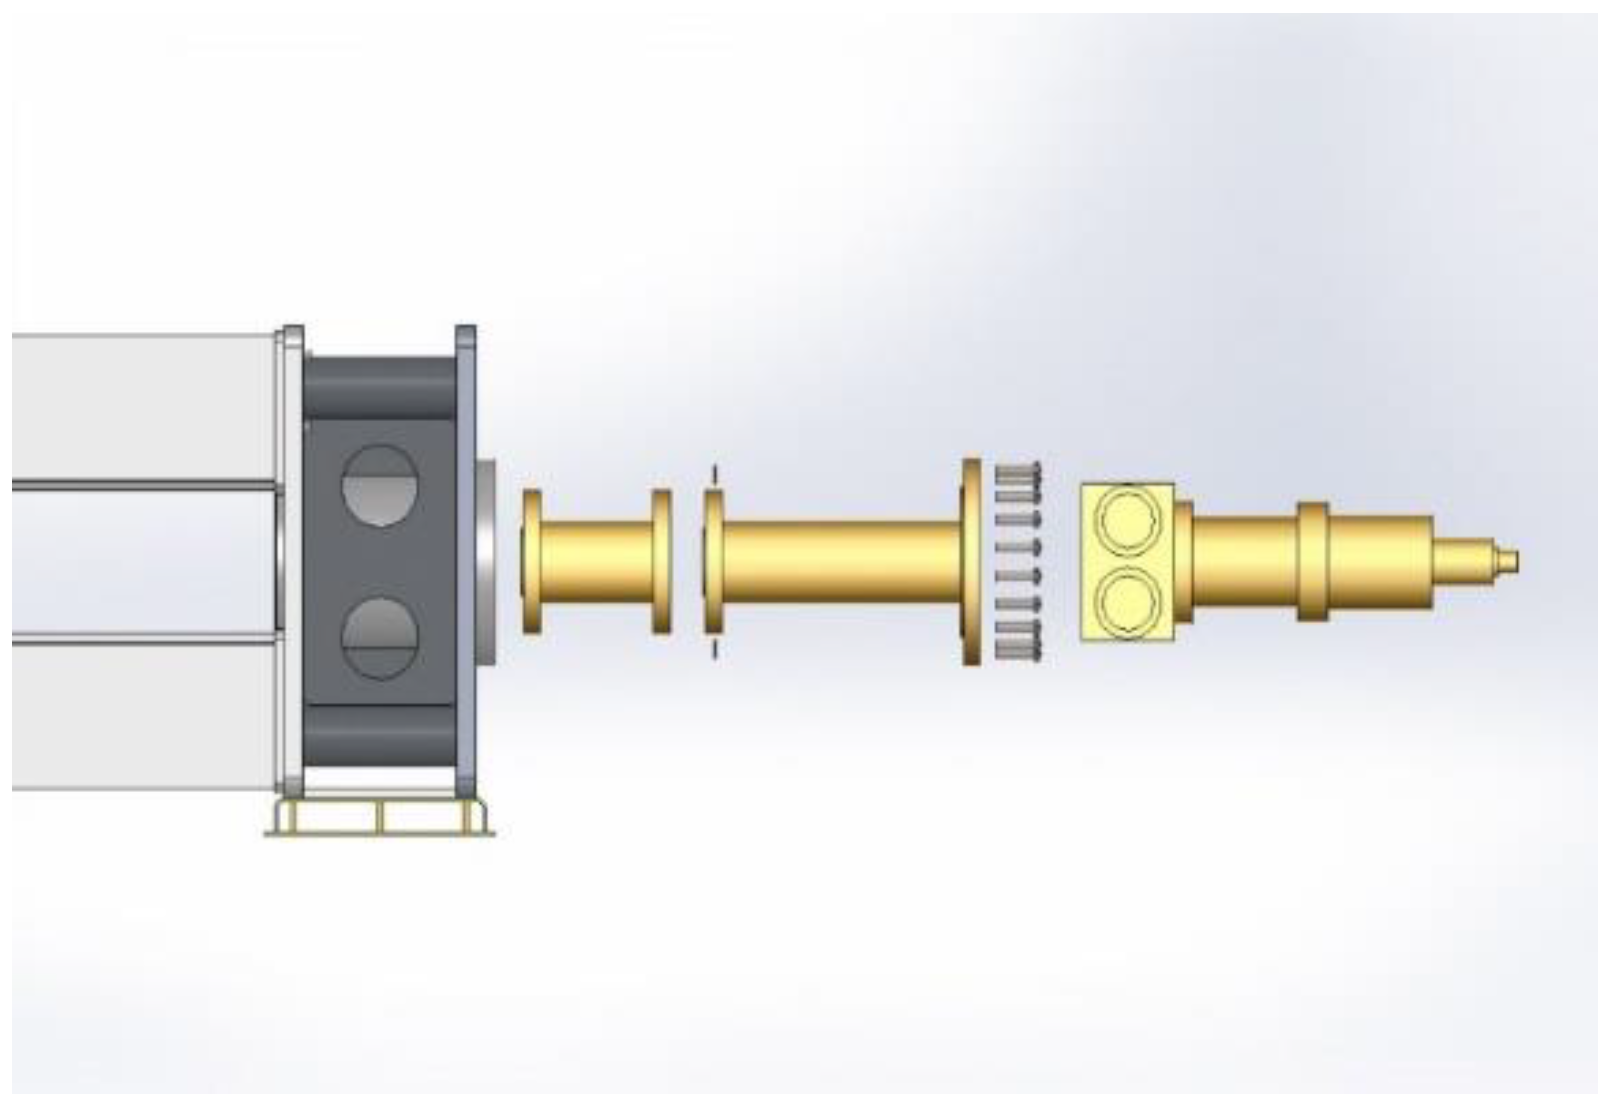
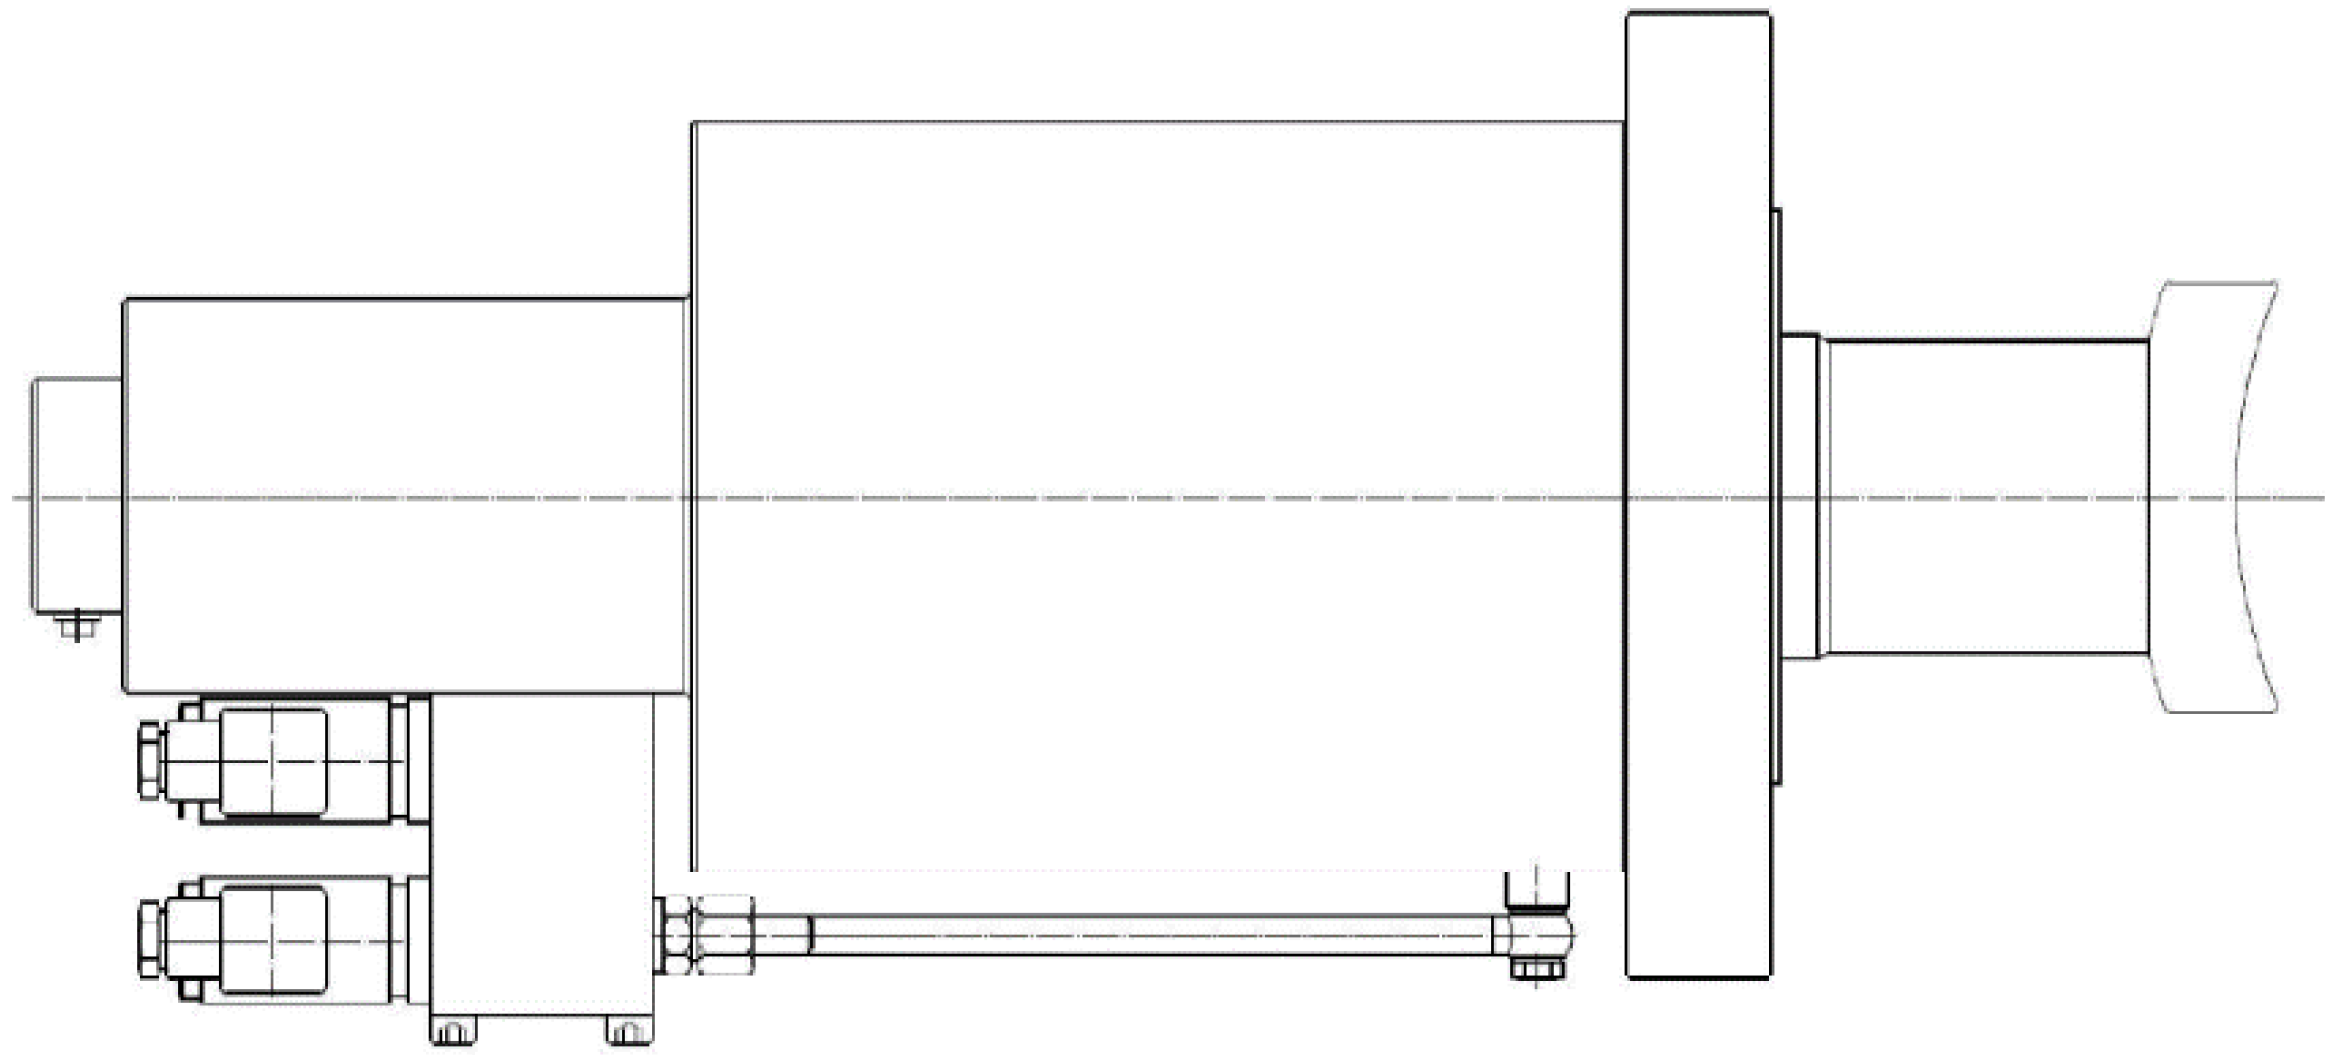
3. Development of the Loading System

The loading system included an internal water pressure loading system, axial loading system, bending moment loading system, and torque loading system. Among them, the axial loading system and bending moment loading system can provide cyclic loading, equipped with a servo mechanism. The internal water pressure loading and torque loading were static loads. The axial loading mechanism and torque loading mechanism were combined, arranged at the end of the platform, and connected with the counterforce frame. The moment loading system was arranged at one-third and two-thirds of the counterforce frame to load the moment and in the form of a four-point bending moment. The internal pressure loading system was arranged on the side of the counterforce frame. The water pipe was connected to the flange at the end of the test pieces, and the water was injected into the pieces through the flange hole to provide internal pressure.

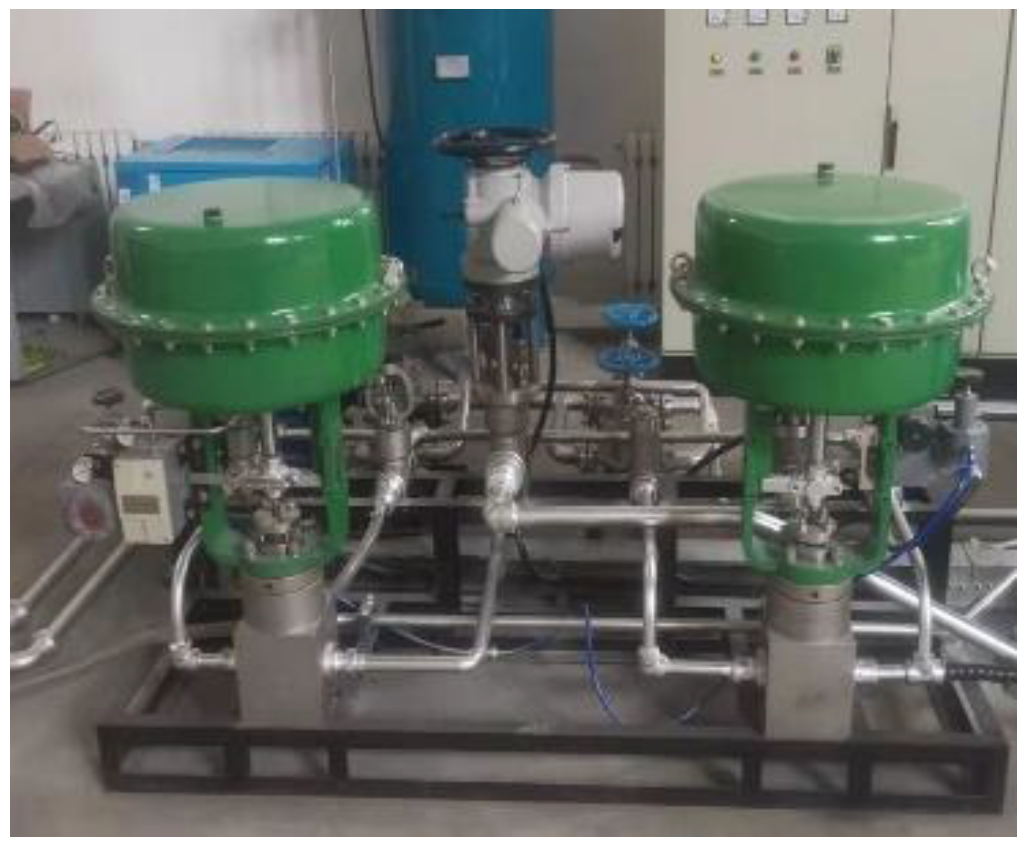
3.1. Internal Hydraulic Loading System

The maximum internal water pressure applied was 60 MPa, and the flow rate under the maximum pressure was 45 L/min. The maximum loading speed reached 10 MPa/min, and the loading control precision was less than or equal to 0.5 MPa, according to the maximum loading test pieces’ size (the maximum riser diameter was 24 inches, and the length was 21 m) of the test system. The system can be used for single maximum linear loading or cyclic fatigue loading at low frequencies. The maximum loading power of the system was 55 KW. The specific technical parameters are shown in Table 1.
When the internal hydrostatic test was applied, one end of the riser specimen was fixed to the counterforce frame, and the other end was free to extend. The free end was connected to the axial force loading cylinder by the guide shaft. During the internal water pressure fatigue loading test, the axial force loading cylinder was in the free unloading state. A schematic diagram of the internal water pressure loading system is shown in Figure 8, and the electric automatic control valve is shown in Figure 9.
The internal water pressure loading system consisted of a water injection and drainage module, a high-pressure pipeline, an integrated valve, a pressure sensor and pressure gauge, an air compressor, etc. Among them, the water injection and drainage module were calculated according to the volume of the test pipe, meeting the maximum size of the test pipe (outer diameter: 24 inches; pipe length: 21 m) to complete the water pressure loading of 60 MPa within 1 min.

3.2. Servo Mechanism for Axial Tension/Compression Loading and Torsion Bidirectional Loading

In order to exert the axial force on the test specimen, an axial tension/compression loading torque servo mechanism and a bidirectional loading mechanism were developed and installed in the counterforce frame at one end. The test specimen, which had a perforated flange at the end, was connected to the combined loading system by the loading shaft through the torsion loading system. The flange at the other end of the specimen was connected to the end of the counterforce frame. The combined loading system was installed at the end of the counterforce frame, connected with the end frame through the anchor bolt. A disassembly of the combined loading system is shown in Figure 10, and its assembled form is shown in Figure 11.
The maximum applied axial tension force reached 3000 kN, and the effective tension/compression stroke was ±150 mm, with a maximum loading speed of 40 mm/s. Cyclic fatigue loading of the axial force was realized. The maximum applied bidirectional torque was 200 kN·m, with a loading angel of ±45 °, control accuracy ≤±2%, and maximum loading speed of 1°/s.
The tension/compression loading cylinder adopted frequency conversion speed regulation and proportional pressure valve control as well as hydraulic cylinder loading proportional tension/compression adjustment to achieve proportional and constant pressure loading. While unloading, the system was controlled by a proportional pressure valve. At the same time, a displacement sensor placed in the loading cylinder monitored the loading force and displacement changes of the test specimen in the process of tension/compression loading in real time.
The torsion loading cylinder was installed on the connecting cover flange of the tension loading cylinder. A rack-connecting rod was installed on the tension piston rod and the specimen, connected to the shaft of the axial tension loading cylinder. Bidirectional torsion loading was realized on the output shaft by loading the gear and rack in the swing cylinder.
As the water pressure and axial tension/compression changed, the output shaft of the specimen deformed outward while axial tension loaded, or inward while axial compression loaded; thus, the torsion could be normally loaded. The rack stroke under torsion load allowed for the horizontal movement distance of the specimen to be 150 mm.

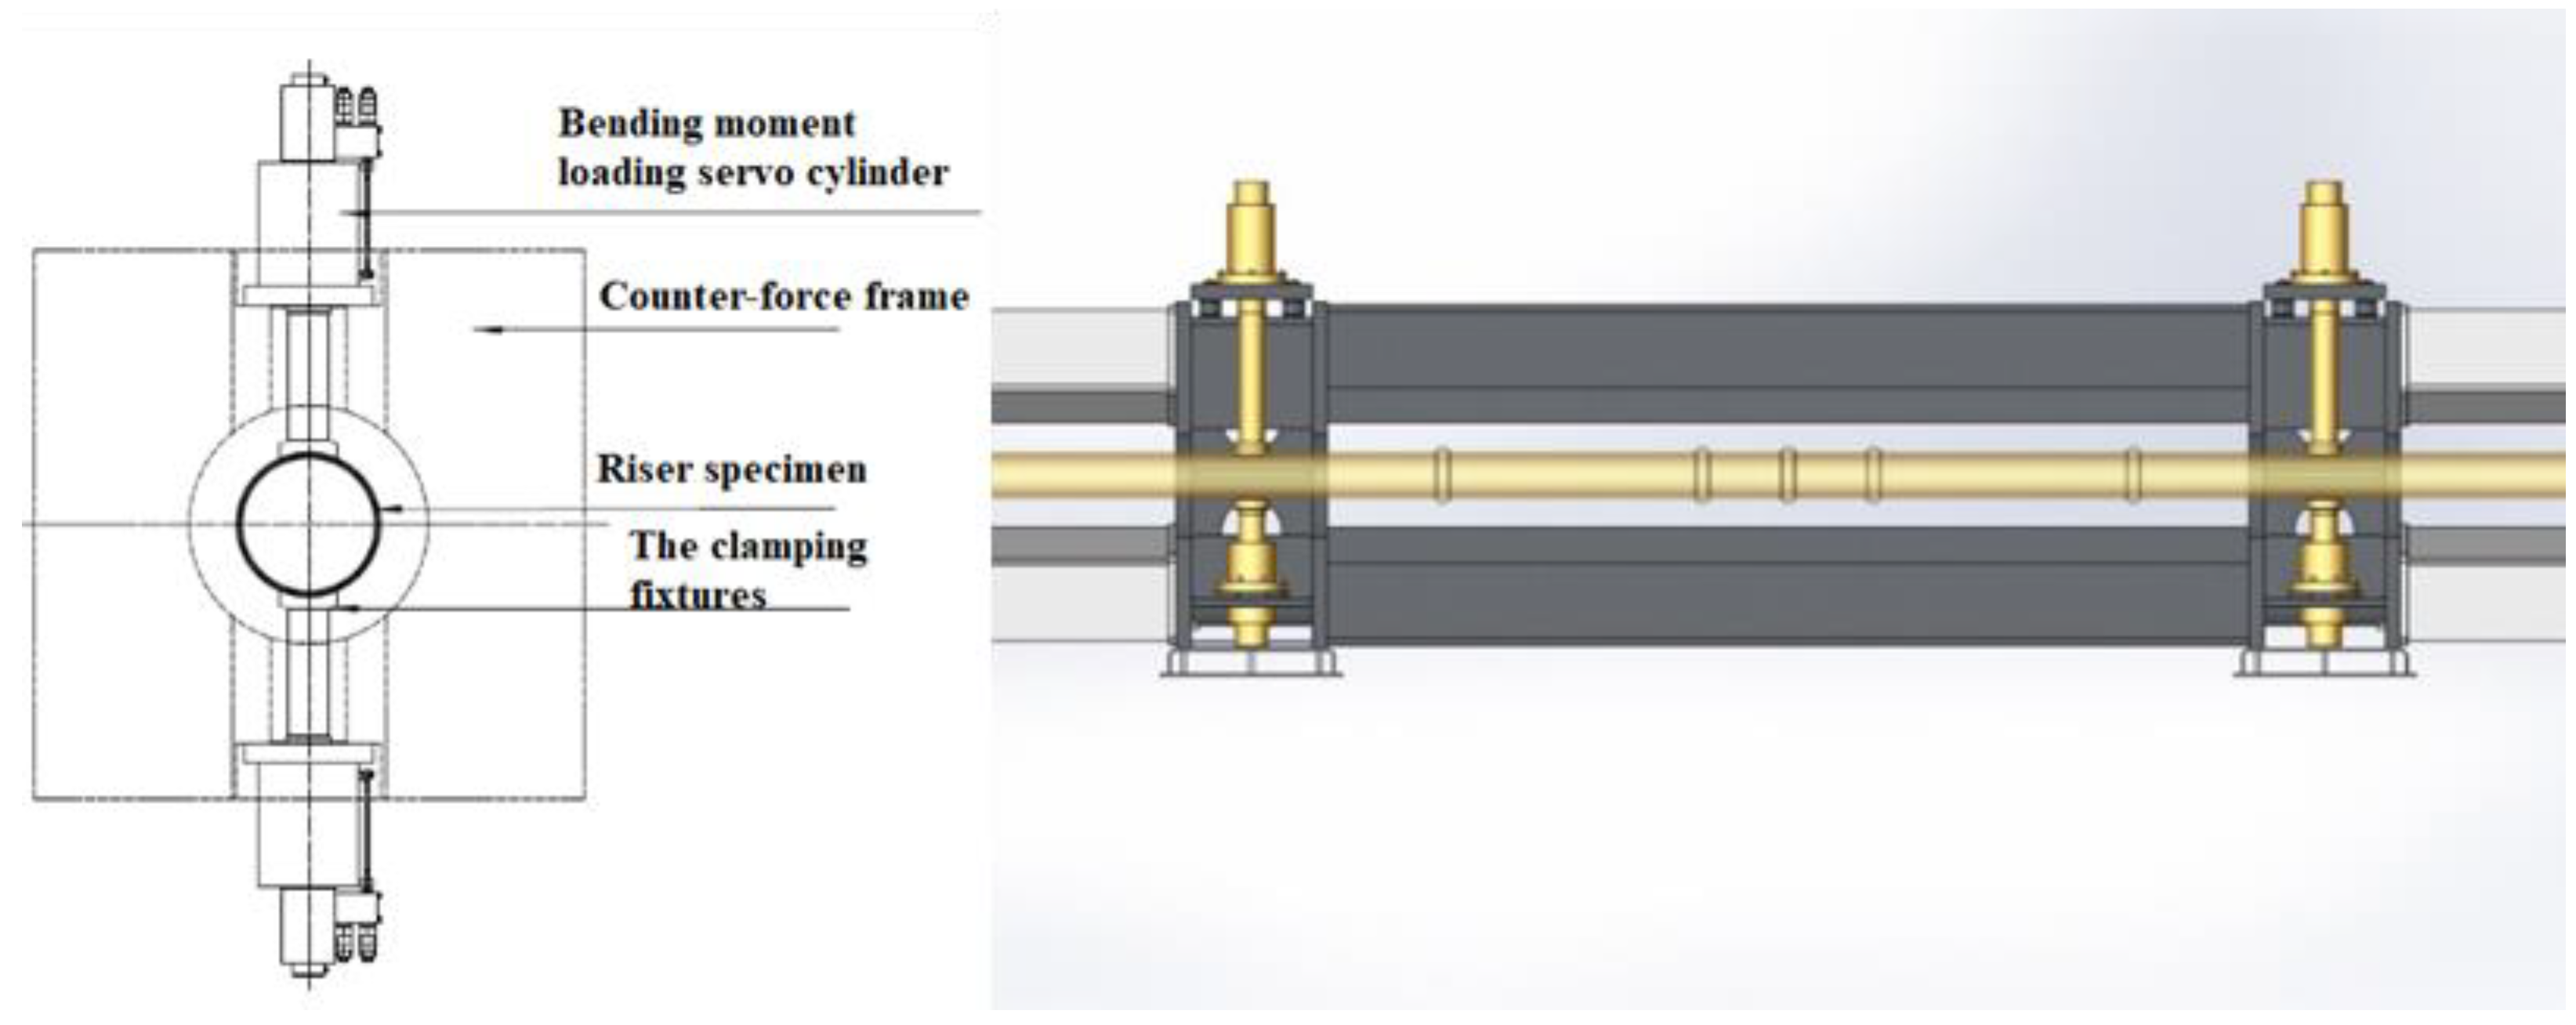
3.3. Four-Point Bending Moment Bidirectional Loading Servo Mechanism

In order to generate a bending moment load on the specimen, a four-point moment loading servo mechanism perpendicular to the specimen was developed. It was installed in the middle of Section 3 of the counterforce frame, and it vertically and symmetrically applied the bending moment. The loading shaft end was a circular arc flange, holding the riser specimen and reciprocating the compression loading in the vertical direction of the specimen. The moment loading servo cylinder was symmetrically installed on the counterforce frame perpendicular to the specimen. The installation method was as follows: The lower bending moment loading mechanism was preinstalled at the bottom of the frame. The upper moment loading mechanism was installed on the upper flange. Before lifting the specimen, the upper flange was rotated 90 degrees towards the parallel direction of the reaction frame so as to facilitate the lifting of the specimen into the reaction frame. Then, the upper flange was rotated 90 degrees, reset, and tightened with bolts. Additionally, the loading shaft was put into the flange. In this way, the bending moment could be applied to the specimen. A schematic diagram of the bending moment loading system is shown in Figure 12.
The loading device realized a maximum applied bending moment of 1300 KN·m. The effective stroke of the cylinder was ±150 mm, with a control accuracy of less than 1%. Cyclic fatigue loading was realized, with a maximum loading speed of 20 mm/s.
An MTS high-pressure magnetostrictive displacement sensor, external proportional servo valve, and pressure sensor were built into the moment loading cylinder, and displacement closed-loop loading or force closed-loop loading was realized. The bending moment loading cylinder is shown in Figure 13.
The bending moment loading cylinder adopted frequency conversion speed regulation and proportional pressure reducing valve control to load or unload the hydraulic cylinder proportionally in order to realize torque proportional and constant loading. A proportional pressure reducing valve was used for unloading control. Meanwhile, the loading cylinder had a built-in sensor that monitored the loading force of the test pipe and the displacement of the specimen’s deformation in the process of the bending moment loading. The moment loading cylinders on both sides could realize single-action/synchronous loading and unloading.

3.4. Hydraulic Loading Servo System

In order to meet the requirements of the compound loading mechanism, a hydraulic loading servo system was manufactured with a maximum power up to 400 KW. The hydraulic loading servo system was equipped with a variable frequency speed regulating motor, oil pump, servo valve, accumulator, sensor, and other hydraulic electrical components. Meanwhile, in order to meet the cyclic fatigue loading test, the system was equipped with an efficient cooling water tower. A schematic diagram of the hydraulic tank is shown in Figure 14. The servo system provides the power oil for the hydraulic cylinders.
The hydraulic pump station was equipped with a pump station electronic control cabinet. The electric control system for the pump station consisted of a sealed electric control box, a low-voltage electric pump controlled by a motor, a valve controlled by an amplifier, a servo valve real-time controller, a circuit drive board, and a connection interface with a control platform. The pumping station controller could realize basic distribution and water-cooling machine motor start, it could also realize onsite startup oil source system downtime, pressure, liquid level, temperature, and alarm signal collection and input. Meanwhile, TCP/PI ethernet interface communication with the remote central control center was also provided to realize remote monitoring control.
The test system was designed for mechanical loading. Its main characteristics were as follows:
(1)
The full size of the test system (main body of the system) was 26 m, the size of the counterforce frame was 24 m, and the longest size of the test pipe section was 22 m;
(2)
The maximum loading capacity of the test system was designed to be 3000 kN dynamic axial force, 1300 kN·m dynamic bending moment loading, 200 kN·m torque loading, and 60 MPa internal water pressure loading, with a loading frequency of 30 Hz.
The platform loading capability indicators were shown in Table 2.

4. Full-Scale Riser Fatigue Test

In order to verify the performance of the fatigue test platform and test the fatigue strength of the steel catenary riser (SCR) in the Lingshui project, we designed and carried out riser fatigue tests. The SCR for the test was produced by Hengyang Valin Steel Tube Company and covered a 5G double jointing procedure. The test section was 5.6 m, with three weld joints arranged. The length of the connecting section was 11.2 m. The outer diameter of the test riser was 12 inches, and the thickness was 27 mm. Both ends were welded with perforated flanges and connected to the end of the test platform. The structure of the test riser section is shown in Figure 15 and Figure 16.
The purpose of this experiment was to measure the fatigue life of the riser and weld under high-stress conditions in the South China Sea. Based on the measured stress in high-stress environments in the South China Sea, a stress cycle of 172 MPa (±86 MPa) was carried out on the basis of 138 MPa of stress.
The position and weld number of the test pipe section on the platform were as follows. The left side was the fixed end, and the right side was connected to the end of the extension section. The loading mechanism acted on the other end of the connecting section. From the left side, the welds were numbered G1, G2, and G3, as shown in Figure 17.
The section number of the weld is shown below, and the direction of the section Figure 17 is from left to right.

4.1. The Test Process

Before the fatigue test, the system and parameters of the specimen were tested, and the loading method was determined. The test analysis was as follows:
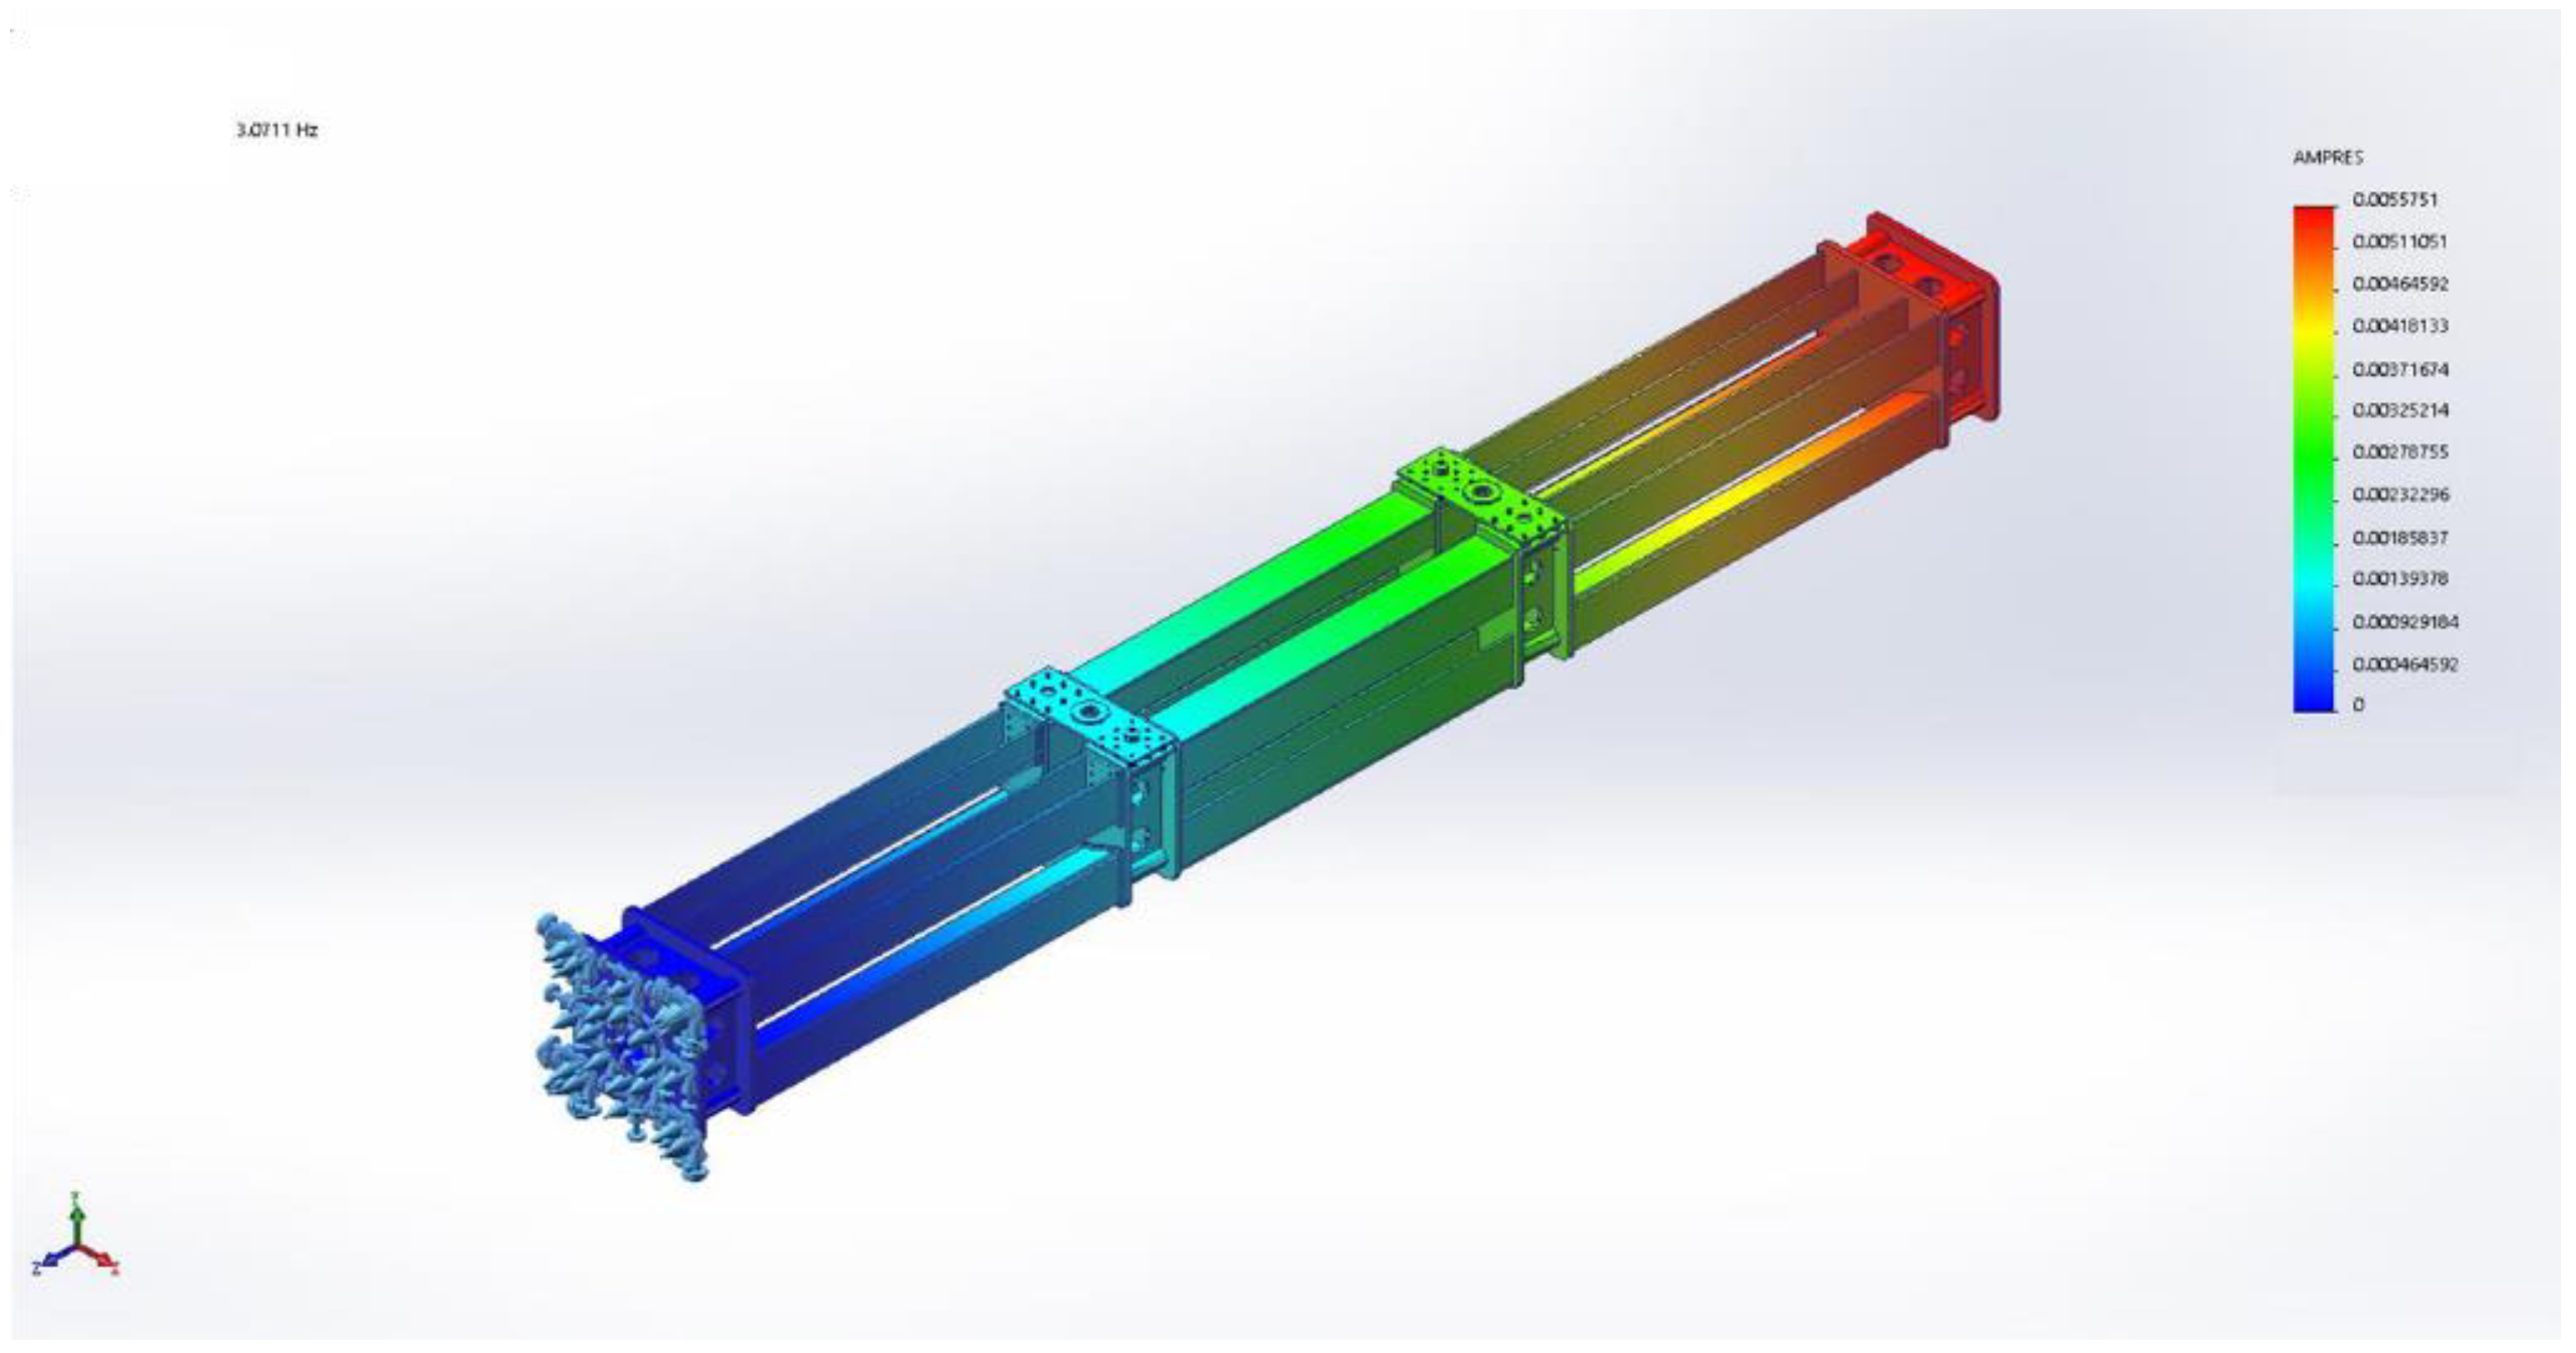
  • The first-order frequency of the filling riser was 3.4 Hz, and the effect of the rising water pressure on the first-order frequency could be ignored;
  • Under a loading of 48 MPa internal pressure, the axial displacement changed by 8.9 mm, and 732 kN axial tension continued to be applied. The overall axial displacement changed by 2.3 mm. The total change in pipeline displacement was 11.2 mm;
  • On the basis of 48 MPa internal pressure and 732 kN axial tension, when the axial tension was applied at 2900 kN, the axial displacement increased by 7 mm, and the pipeline displacement reached 18.2 mm. The stress value reached the maximum stress value in the high-stress experiment;
  • On the basis of 48 MPa internal pressure and 732 kN axial tension, when the axial pressure was applied at −1500 kN, the axial displacement decreased by 7 mm, and the pipeline displacement reached 4.2 mm. The stress value reached the minimum stress value in the high-stress experiment.
Therefore, the loading scheme of this test was set as follows:
(1)
An internal pressure of 48 MPa was applied;
(2)
A fixed axial tension of 732 kN was applied, and the average stress reached 138 MPa;
(3)
A cyclic axial force between −1500 and 2900 kN was applied. The cyclic range of axial displacement was ±7 mm, meeting 172 MPa (±86 MPa) of cyclic stress.
The stress measurement values of eight measured points for each three welding points within 15 s were intercepted, and the curves during stress generation were drawn as shown in Figure 18.
Through the stress–time history curves of the 3 welding joints and the change in the stress–time history curves of the 24 measuring points, it can be seen that the stress cycle range of the riser test reached 172 MPa, and the stress cycle value was relatively stable during the test process. Based on the number of cycles calculated by the S–N curve, the number of test settings was increased and set at 2.85 million cycles. After the completion of the test, nondestructive testing was carried out on the weld of the test pipe to check the test results.

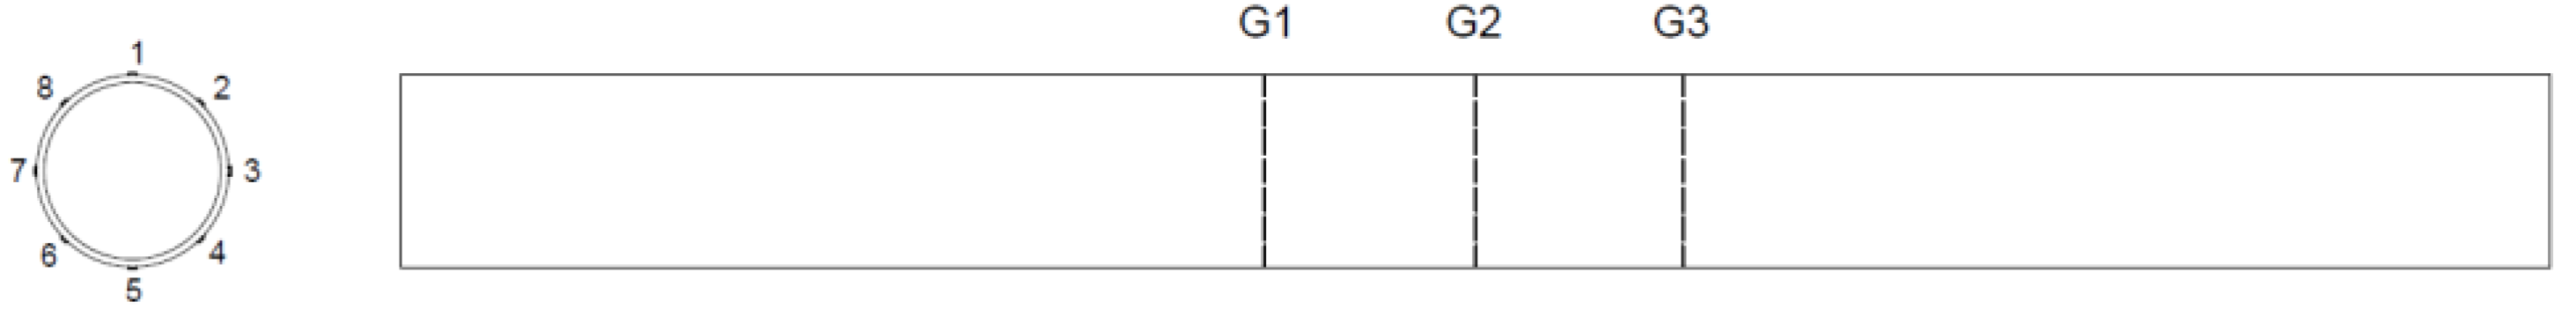
4.2. Weld Test Results

After the test, ultrasonic weld inspection of the specimen was conducted. The results of the inspection are shown in the Table 3.
It can be seen from the testing results that there were cracks caused by different degrees of fatigue stress in the three weld positions of the test riser’s section, and through-wall cracks appeared in the specimen.

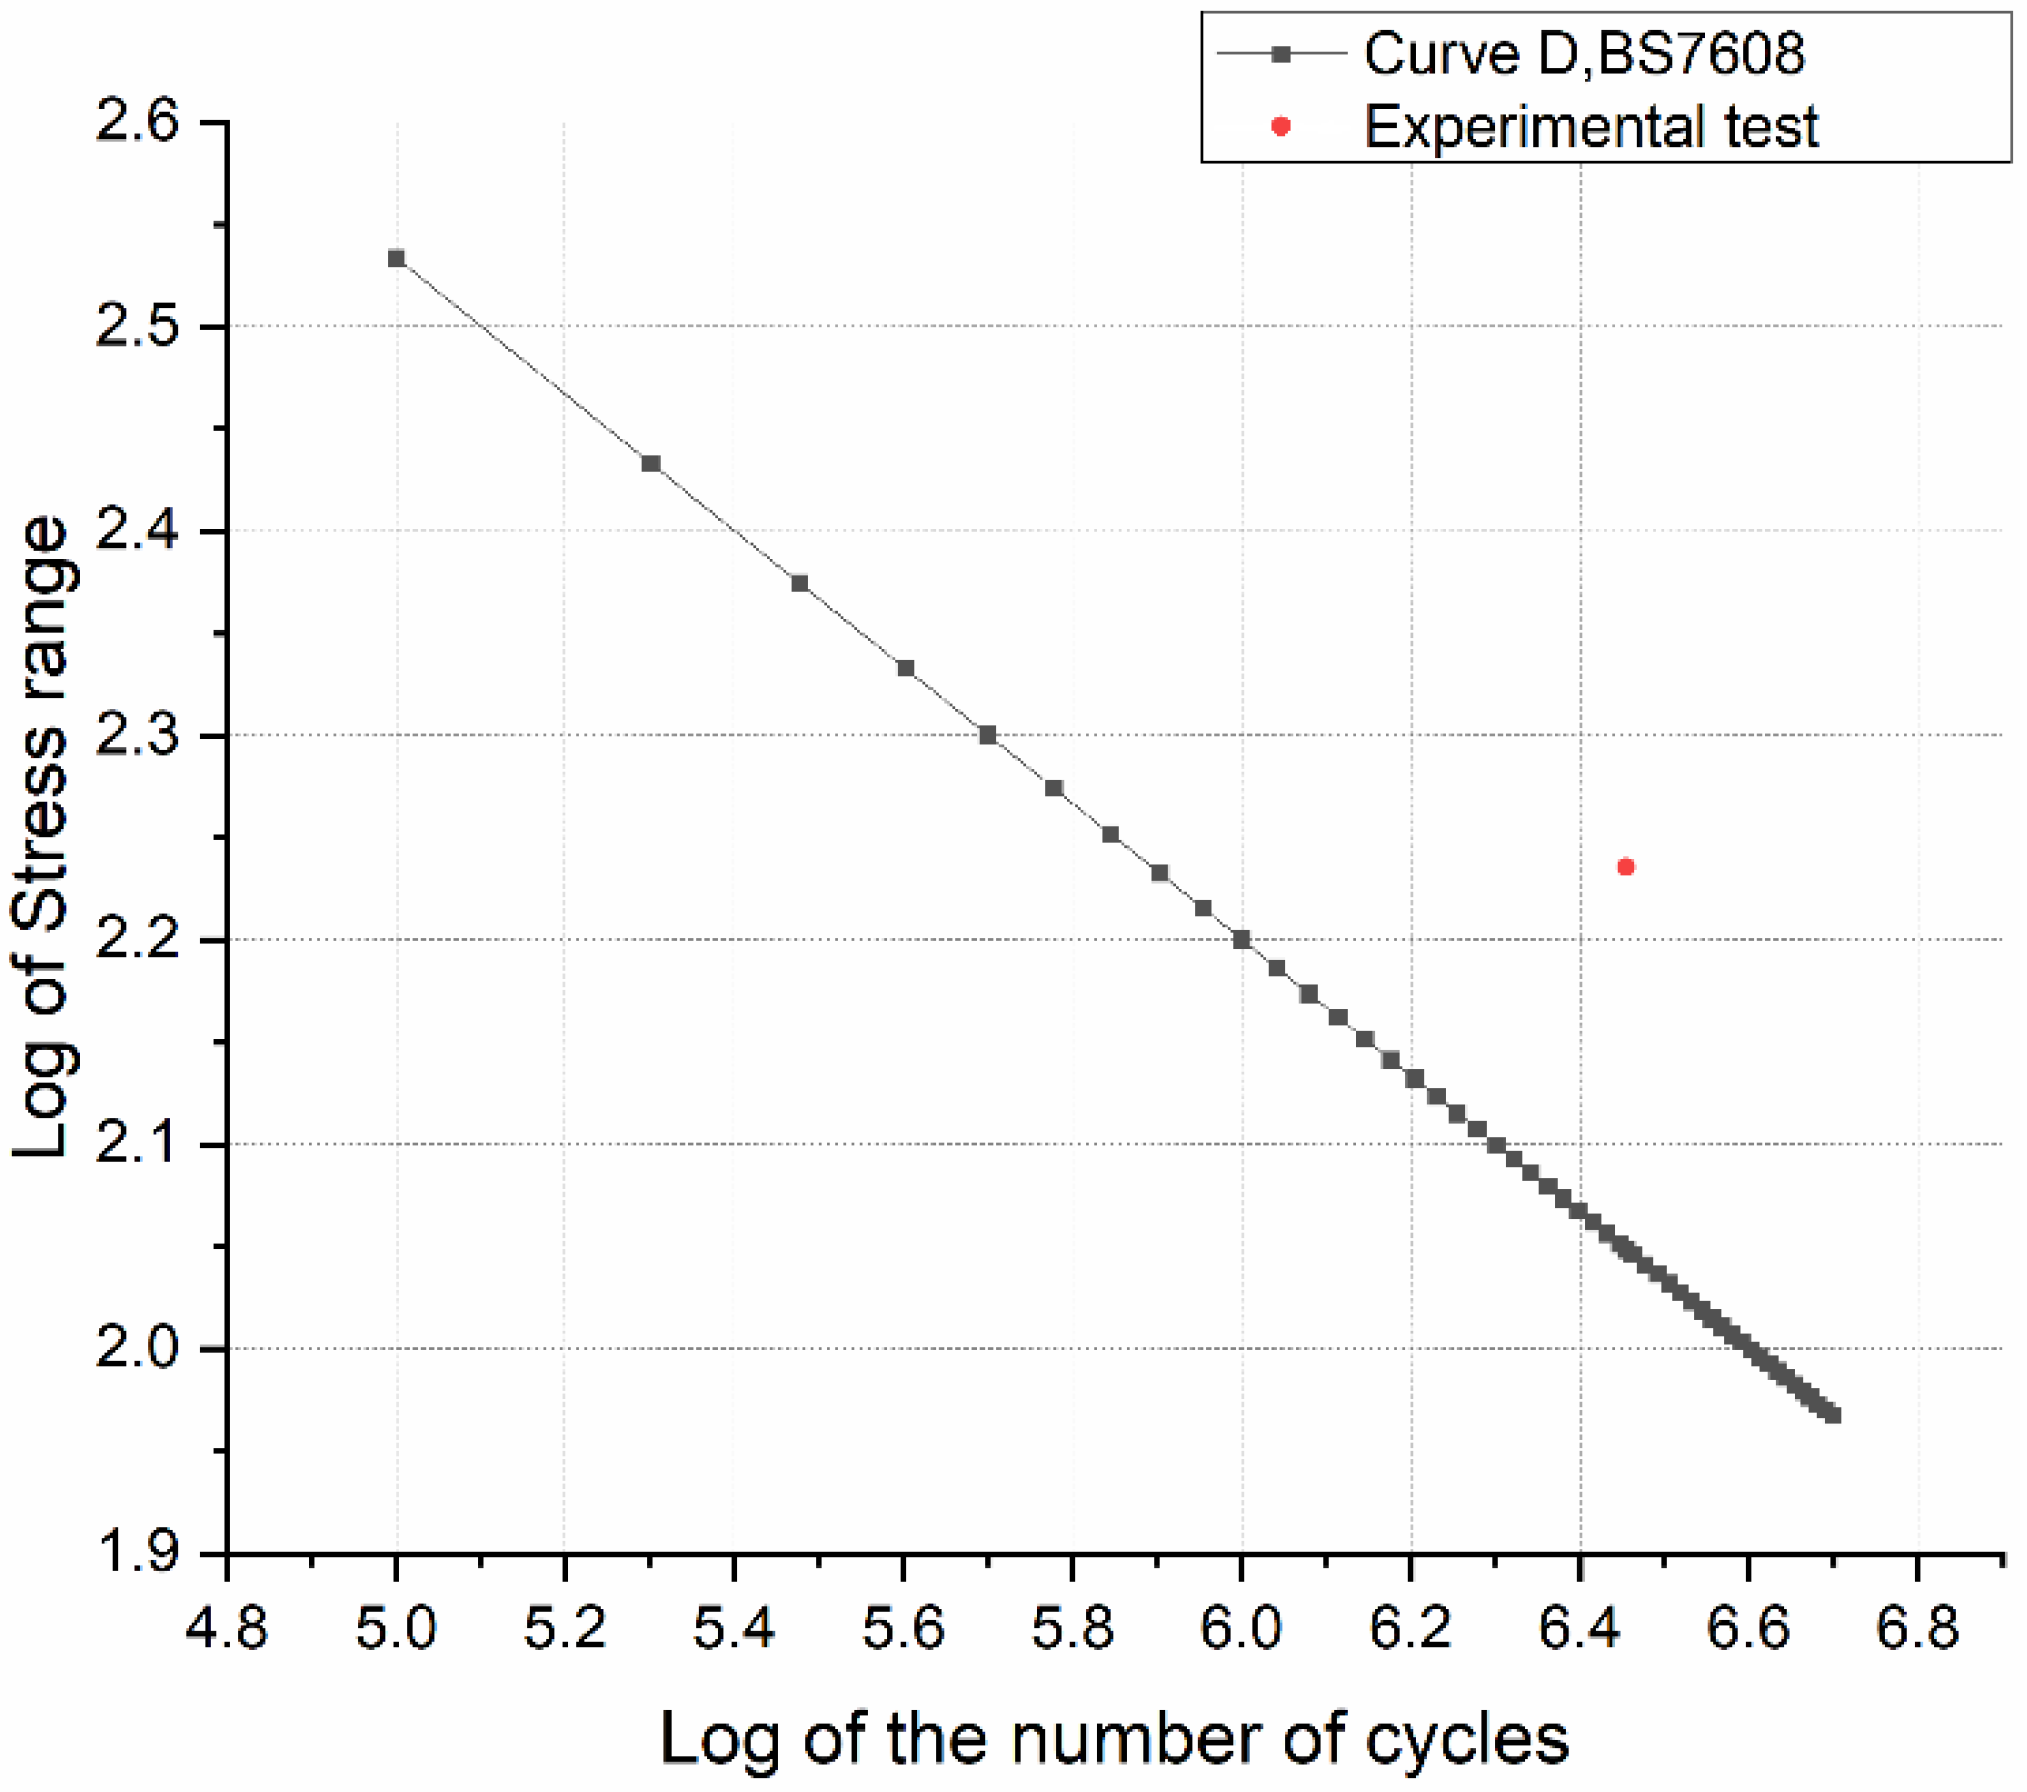
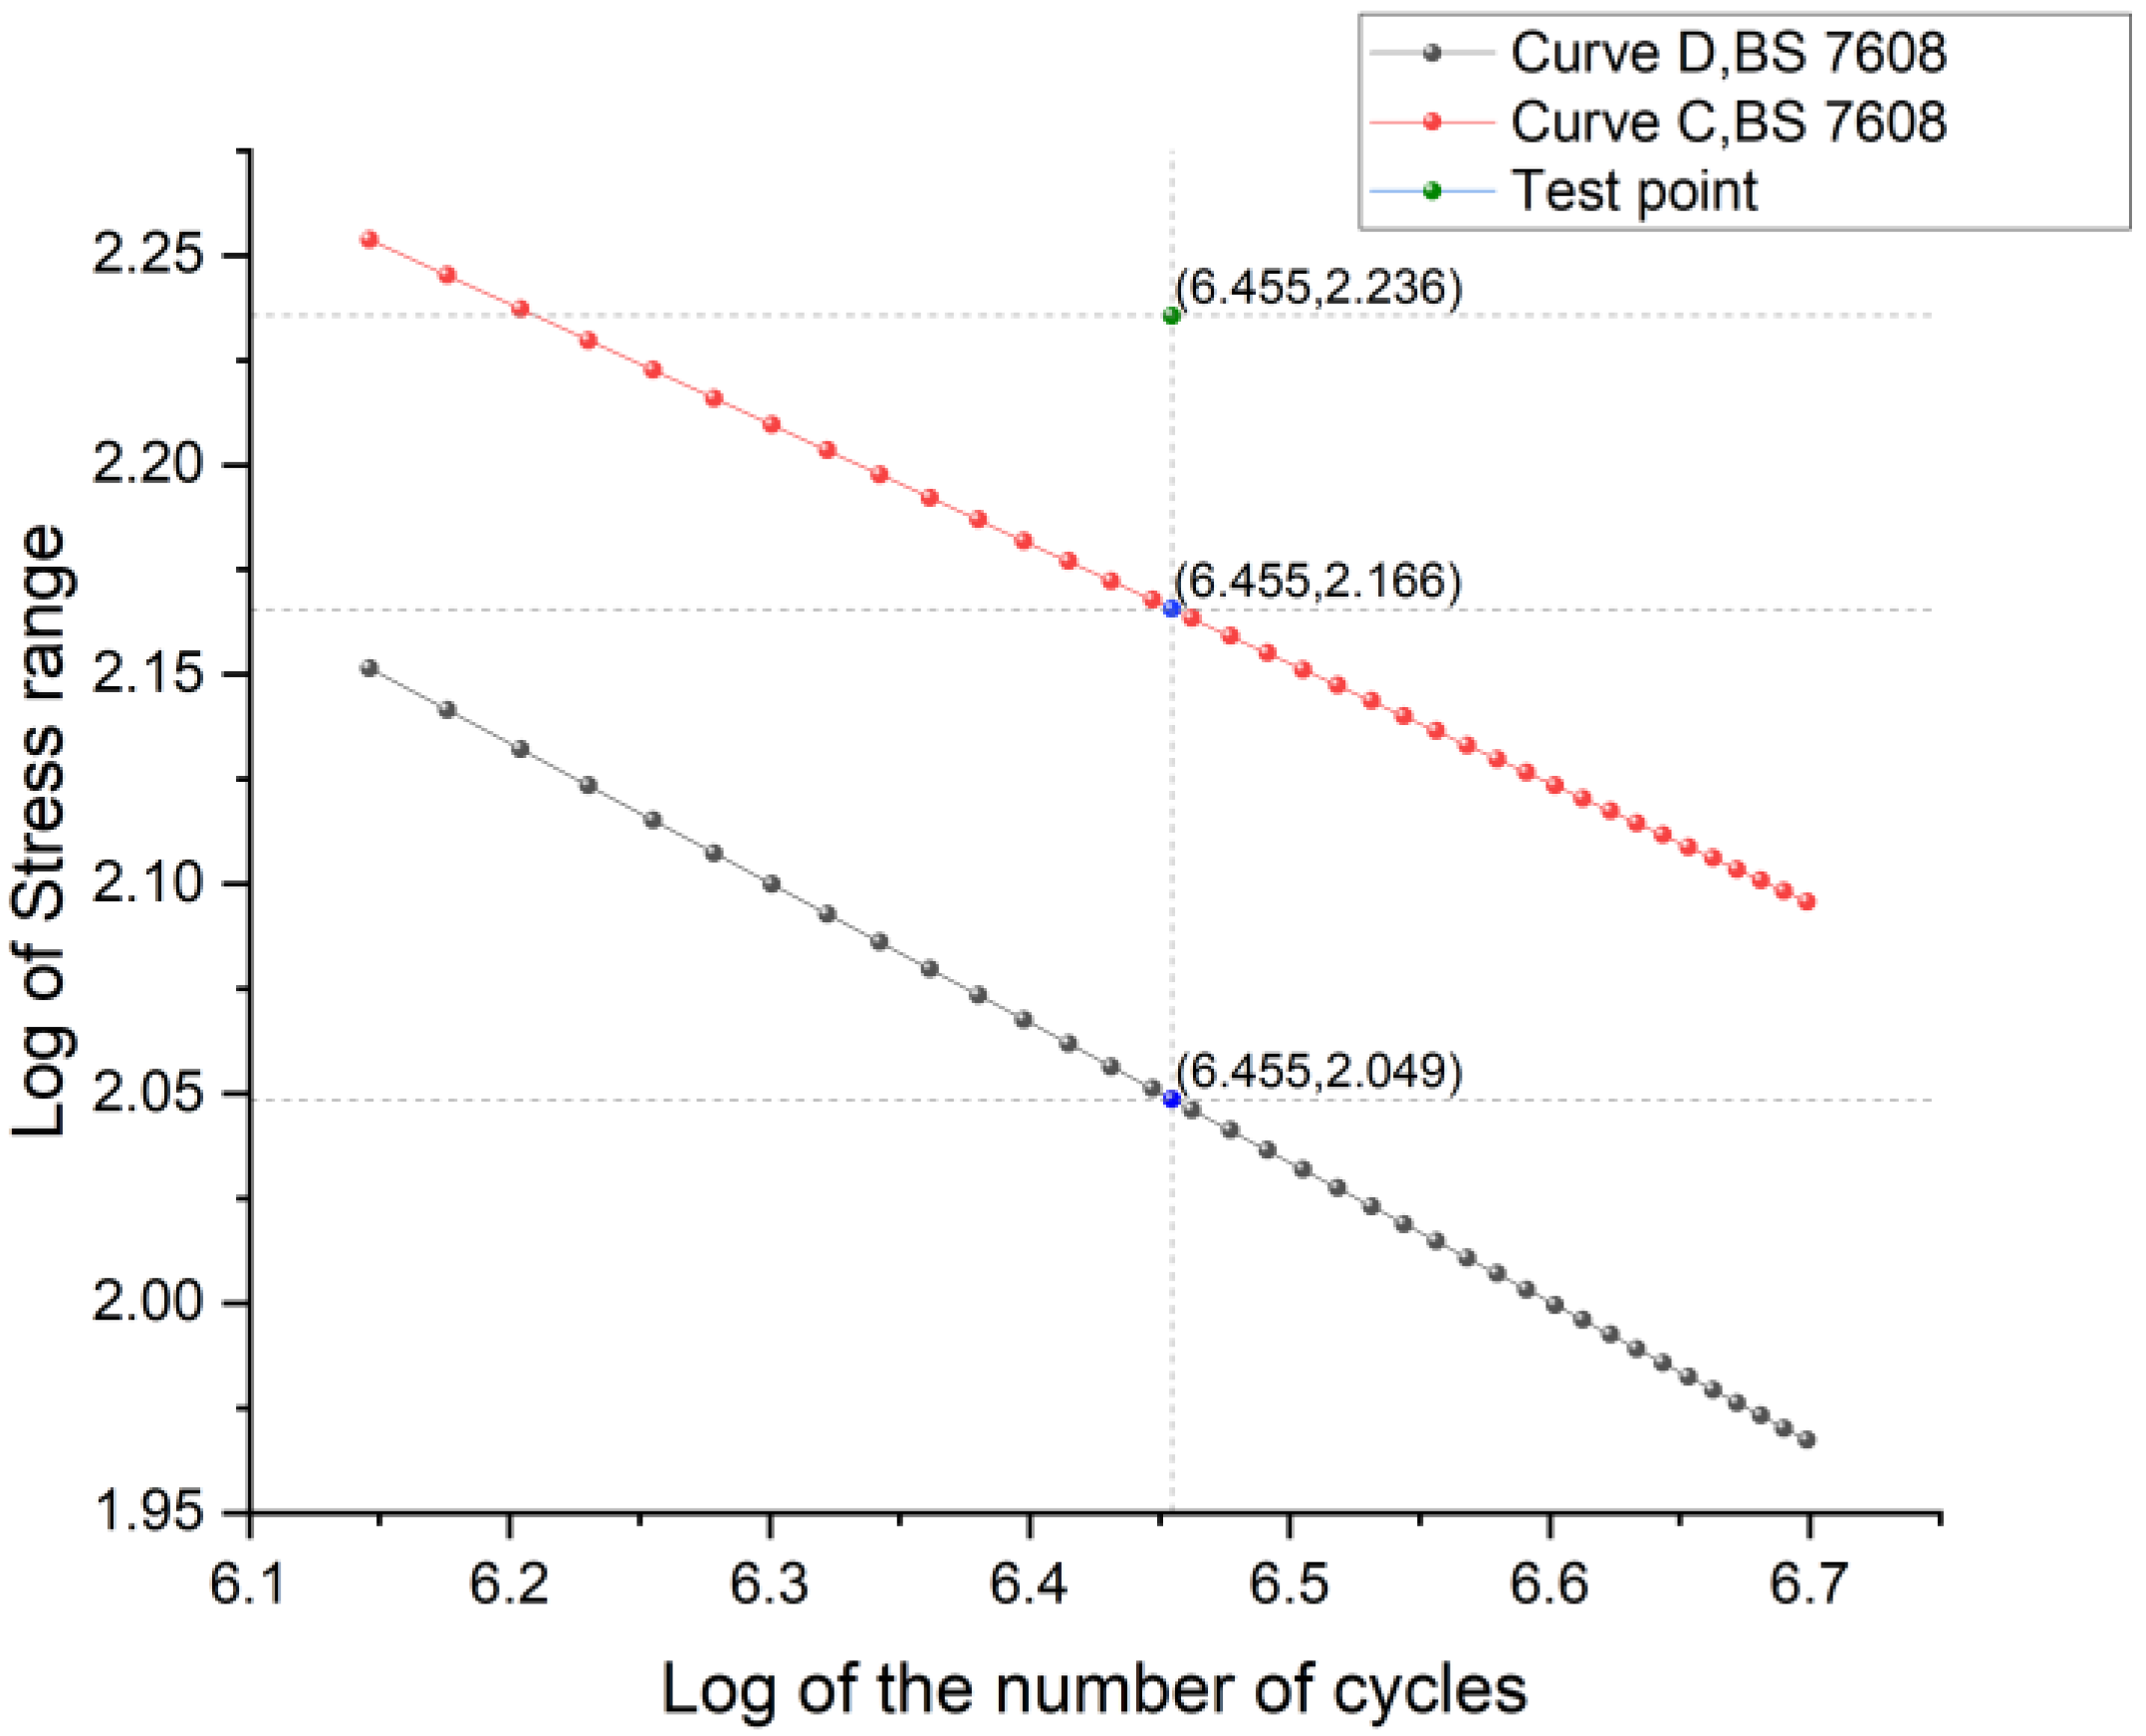
4.3. Fatigue Analysis Based on BS7608

In most cases, potential fatigue cracks will occur at the stress concentration of the base metal. In welded structures, fatigue failure mainly occurs in welded joints. Microcracks appeared near the weld as a result of welding. Under the action of alternating loads, stress concentration will appear around the microcrack, leading to crack propagation. When the length of the crack reaches a critical point, the member will suddenly fracture, causing the structure to fail. Reducing the stress concentration near the weld is the only way to solve the problem of fatigue crack in the design stage. The fatigue behavior of welded structures is a very complex phenomenon, because it depends on many factors affecting the stress/strain field at the point where the final fracture occurs. Obviously, structural fatigue, including welded joints, is much more complex than simple material fatigue.
In the British Standard 7608 (BS7608): Fatigue design and assessment of steel structures, the fatigue S–N curves of different welding forms and load types are given. Fatigue of welding joints is different from that of ordinary materials. As for the fatigue of welded joints, the applicable yield strength is between 200 MPa and 960 MPa. For each structural detail, there is a reference value for the fatigue strength limit. BS7608 provides different calculation methods for different welding types, and appropriate methods can be selected for calculation. By determining the specific form of the structure and selecting and using the appropriate S–N curve for the welding joints, the stress spectrum in the loading process is established, and the fatigue life is calculated by the stress spectrum. The S–N curve also considers the size, shape, residual stress, and crack shape in order to calculate the fatigue life of the structure more accurately. In specification BS7608, the S–N curve is calibrated according to nominal stress. However, in practical engineering, nominal stress does not strictly exist for welded joints with complex geometric shapes or under complex loads. Therefore, the generalized nominal stress is introduced. For numerical calculation, the regional stress whose stress gradient is close to zero is defined as the generalized nominal stress. Based on the above definition, BS7608 can be used to solve practical engineering problems.
In most cases, the underlying fatigue crack is located near a stress concentration in the base metal such as at the welding toes or bolt holes. It is assumed that the direction of principal stress does not change significantly during the stress cycling process. Therefore, the maximum cyclic range of the principal stress in the stress cycling process is taken as the cyclic stress range used in fatigue calculation, and the principal stress in any position near the crack on the base metal is correspondingly within this maximum cyclic stress range. It is assumed that the tensile stress is positive, whereas the compressive stress is negative. In practice, the stress component throughout the thickness has little effect and is usually negligible. When the principal stress direction changes periodically, the magnitude of the cyclic stress can be calculated by calculating the two extreme values in the process of stress change, i.e., the difference between the peak and trough of the wave. The peaks and troughs, here, are the value of the peaks and troughs in the main plane.
The S–N curve of the range of the cyclic stress and the number of cycles required to achieve fatigue is as follows:
log N = log C 0 d σ m log S r
where C0 is the correlation constant of the average S–N curve, D is the standard deviation below the mean, σ is the relative standard deviation of N, and m is the reverse slope of the S–N curve under a double logarithm.
In fatigue calculation, the influence of the material’s thickness on fatigue life should be considered. The non-joint class for which the basic S–N curve applies (i.e., corresponding the weld class B-G) requires a material thickness of no more than 16 mm. For joints of other thicknesses, the stress range of the fatigue strength should be modified by the following formula:
S = S B ( t B t ) 1 / 4
where S is the fatigue strength equivalent to the stress of the specimen, SB is the equivalent stress of the joint fatigue strength using the basic curve, t is the actual plate thickness when the thickness is greater than 16 mm, and tB is the maximum plate thickness corresponding to the basic S–N curve, which is 16 mm.
The fatigue strength of the S–N curve can be increased by 30% for welded joints with initial cracks at the welding toes by local machining or grinding the toes.
The S–N curve is selected as a D curve for butt welding. According to the basic curve parameters, the expression of the S–N curve is as follows:
log N = 12.6007 3 log S r
According to the D curve formula of the BS7608 specification and the data from the test, the S–N curve is drawn as Figure 19.
It can be seen that the measured point is above the S–N curve, indicating that the test riser met the fatigue requirements of BS7608. At the same time, the thickness of the specimen needs to be corrected. According to the thickness stress correction in Formula (2), it was calculated that for a specimen pipe with a diameter under 27 mm, the actual stress value to be substituted by the S–N curve was 150.91 MPa. The stress value was substituted into (3), and the required number of cycles was 1.16 million. After 2.85 million cycles, cracks appeared in the specimen, indicating that the specimen and welding can meet the fatigue strength requirements of BS7608.

4.4. S–N Curve Selection and Riser Thickness Correction

The test in this section was designed according to the BS7608 fatigue specification, and the index of cycles should have been 1.16 million if calculated according to the specification. In the actual test, it took 2.85 million cycles for the welded riser to break. The actual cycle times increased by more than twofold compared with the theoretical cycle times. An increase in the actual cycle time is beneficial to the safety of the structure, but it will also increase the amount of steel used in engineering, resulting in a great increase in the cost. Therefore, it is necessary to redesign the thickness of the riser based on the test results and give the minimum thickness scheme of the riser to meet the requirements of the fatigue design. This can ensure that the structure meets the fatigue safety requirements and, at the same time, obtain the maximum economic benefits.
In general, under the same sea state, the stress response of the structure will change with different structural forms and thickness. Different cyclic stresses will cause different fatigue cycle indexes. Therefore, the S–N curve corresponds the cycle index with the stress value. For a certain S–N curve, the corresponding cycle index is also fixed under a certain stress value. However, for the same stress value but with a different thickness of the riser structure, the cycle index of the complete damage will be different. From the perspective of crack growth, the time of penetration crack in the thick-walled pipe with the same crack growth rate will be correspondingly longer. This is also the reason for the thickness modification in the BS7608 specification above. In addition, because of the different welding quality, the fatigue life will be increased. Therefore, different calculation formulas are defined for different welding methods in the specification. For whole pipe structure welding, according to the BS7608 specification, the test riser in this paper is more suitable for a D curve. However, according to the inspection of the test pipe in Table 2, it was obvious that the cracks were all generated at a depth of 27 mm, i.e., the welding toe of the riser. This indicates that the riser was fractured from the internal welding toe. Therefore, a C curve is more suitable for fatigue analysis. The C curve in the specification is as follows:
log N = 14.0342 3.5 log S r
The C curve and D curve of the BS7608 specification and the test results are drawn in the Figure 20.
It is obvious that the C curve was closer to the actual test situation. Therefore, it was more appropriate to choose the C curve in the analysis. According to the modified formula of the BS7608 specification (i.e., Formula (2)), it can be determined that the thicker the riser, the smaller the equivalent stress value that should be substituted into the S–N curve, and the calculated index of the cycles under the corresponding also increased to a certain extent. In contrast, the thinner the riser, the larger the equivalent stress, and the smaller the corresponding cycle index value.
It can be concluded that when the number of cycles was 2.85 million (the response value was 6.45484), the corresponding C curve cyclic stress logarithm value was 2.166, and the cyclic stress was 146.55 MPa. By substituting the cyclic stress into the thickness correction formula, it can be calculated that under the welding condition of the test riser, its thickness was equivalent to 30.36 mm of the standard riser. The S–N curve was based on the linear accumulation of fatigue through the Palmgren–Miner rule; therefore, it can be approximated that the propagation of fatigue cracks along the thickness direction of the structure was linear. Thus, a linear formula for thickness correction is proposed based on the results of this test.
t A t = t t B
where t A is the standard thickness. Here, the thickness was 27 mm, which was selected for the experiment, as well as the reference thickness t B of this test. t′ is the standard thickness, i.e., the number of test cycles substituted into the S–N curve to obtain the corresponding cyclic stress value and corresponding the stress to the thickness correction formula to obtain the standard thickness t′.
By substituting the test results, the riser thickness t that actually met the fatigue requirements was 24.016 mm. The safety factors of the riser’s structural design are defined as follows:
β = t d t r
where t d is the designed thickness of the riser structure and t r is the calculated actual thickness of the pipe. Accordingly, the safety factor of the test riser in this paper was 1.124. It can be concluded that the thickness design of the test pipe in this paper fully considered the economic benefit of steel quantity on the basis of ensuring the fatigue strength requirements.

5. Conclusions

In this paper, the full-scale riser fatigue test system and its main component have been described in detail. The system was capable of conducting fatigue tests for full-scale risers, flexible pipes, and seabed pipeline fatigue. The test system could complete a fatigue test on risers under a severe sea state and complex loads.
The test designed in this paper was a full-size riser high-stress loading test to determine the maximum loading capacity of the test platform. Thus, the axial loading method was used for loading. For the test with high stress, the platform adopted axial cyclic loading to meet the high-frequency cycle and shorten the test time. The bending moment loading could meet the maximum loading capacity. However, with the increase in the bending moment cylinder stroke, the loading frequency decreased, thus prolonging the test time. Therefore, at present, when conducting the fatigue test with high cyclic stress, the test was designed as an axial cyclic load test. The moment cyclic load can be used in tests with low stress levels. In the future, the moment loading capacity of the test system will be upgraded in order to realize high-stress fatigue tests under cyclic bending moment load.
Due to the high cost of full-scale riser tests, only fatigue tests at high stress levels were performed this time. In a subsequent study, several more sets of tests will be conducted to draw the S–N curve of the structure, which will be compared with the specification.
In the test, the fatigue behavior of a 27 mm thick welded riser was tested. The test results showed that the fatigue performance of the welded pipe exceeded the prediction of the S–N curve in the code. The thickness design was reasonable, and the economic benefits were fully considered.
This test was a fatigue test in an air environment; however, the environment of the South China Sea is complex. Therefore, corrosion fatigue correction tests will be designed in a future study to build a complete fatigue life prediction test system.

Author Contributions

Conceptualization, J.Y. and F.W.; methodology, F.W.; software, Y.Y.; validation, F.W., P.L. and X.L.; formal analysis, Y.S.; investigation, F.W.; resources, Y.S.; data curation, F.W.; writing—original draft preparation, F.W.; writing—review and editing, F.W.; visualization, X.L.; supervision, P.L.; project administration, Y.S.; funding acquisition, J.Y. All authors have read and agreed to the published version of the manuscript.

Funding

This research was funded by The National Natural Science Foundation of China (Grant No. 51879189) and National Natural Science Foundation of China (Grant No. 52071234).

Institutional Review Board Statement

Not applicable.

Informed Consent Statement

Not applicable.

Data Availability Statement

The data presented in this study are available upon request from the corresponding author.

Conflicts of Interest

The authors declare no conflict of interest.

References

  1. Xu, J.; Jesudasen, A.S.; Fang, J.; Else, M. Wave Loading Fatigue Performance of Steel Catenary Risers (SCRs) in Ultradeepwater Applications. In Proceedings of the Offshore Technology Conference, Houston, TX, USA, 8 April 2006. [Google Scholar]
  2. Yu, J.; Xu, W.; Yu, Y.; Fu, F.; Wang, H.; Xu, S.; Wu, S. CFRP Strengthening and Rehabilitation of Inner Corroded Steel Pipelines under External Pressure. J. Mar. Sci. Eng. 2022, 10, 589. [Google Scholar] [CrossRef]
  3. Chatziioannou, K.; Karamanos, S.A.; Huang, Y. Ultra Low-Cycle Fatigue Performance of S420 and S700 Steel Welded Tubular X-Joints. Int. J. Fatigue 2019, 129, 105221. [Google Scholar] [CrossRef]
  4. Song, W.; Liu, X.; Berto, F.; Razavi, S.M.J. Low-Cycle Fatigue Behavior of 10CrNi3MoV High Strength Steel and Its Undermatched Welds. Materials 2018, 11, 661. [Google Scholar] [CrossRef]
  5. Feng, L.; Qian, X. Enhanced Crack Sizing and Life Estimation for Welded Tubular Joints under Low Cycle Actions. Int. J. Fatigue 2020, 137, 105670. [Google Scholar] [CrossRef]
  6. Nassiraei, H.; Rezadoost, P. Stress Concentration Factors in Tubular T/Y-Joints Strengthened with FRP Subjected to Compressive Load in Offshore Structures. Int. J. Fatigue 2020, 140, 105719. [Google Scholar] [CrossRef]
  7. Teng, T.-L.; Fung, C.-P.; Chang, P.-H. Effect of Weld Geometry and Residual Stresses on Fatigue in Butt-Welded Joints. Int. J. Press. Vessel. Pip. 2002, 79, 467–482. [Google Scholar] [CrossRef]
  8. Lee, C.-H.; Chang, K.-H.; van Do, V.N. Modeling the High Cycle Fatigue Behavior of T-Joint Fillet Welds Considering Weld-Induced Residual Stresses Based on Continuum Damage Mechanics. Eng. Struct. 2016, 125, 205–216. [Google Scholar] [CrossRef]
  9. Vieira Ávila, B.; Correia, J.; Carvalho, H.; Fantuzzi, N.; de Jesus, A.; Berto, F. Numerical Analysis and Discussion on the Hot-Spot Stress Concept Applied to Welded Tubular KT Joints. Eng. Fail. Anal. 2022, 135, 106092. [Google Scholar] [CrossRef]
  10. da Silva, A.L.L.; Correia, J.A.F.O.; de Jesus, A.M.P.; Lesiuk, G.; Fernandes, A.A.; Calçada, R.; Berto, F. Influence of Fillet End Geometry on Fatigue Behaviour of Welded Joints. Int. J. Fatigue 2019, 123, 196–212. [Google Scholar] [CrossRef]
  11. Jiang, W.; Chen, W.; Woo, W.; Tu, S.-T.; Zhang, X.-C.; Em, V. Effects of Low-Temperature Transformation and Transformation-Induced Plasticity on Weld Residual Stresses: Numerical Study and Neutron Diffraction Measurement. Mater. Des. 2018, 147, 65–79. [Google Scholar] [CrossRef]
  12. Jin, Q.; Jiang, W.; Gu, W.; Wang, J.; Li, G.; Pan, X.; Song, M.; Zhang, K.; Wu, A.; Tu, S.-T. A Primary plus Secondary Local PWHT Method for Mitigating Weld Residual Stresses in Pressure Vessels. Int. J. Press. Vessel. Pip. 2021, 192, 104431. [Google Scholar] [CrossRef]
  13. Peng, W.; Jiang, W.; Sun, G.; Yang, B.; Shao, X.; Tu, S.-T. Biaxial Residual Stress Measurement by Indentation Energy Difference Method: Theoretical and Experimental Study. Int. J. Press. Vessel. Pip. 2022, 195, 104573. [Google Scholar] [CrossRef]
  14. Xin, H.; Correia, J.A.F.O.; Veljkovic, M.; Berto, F.; Manuel, L. Residual Stress Effects on Fatigue Life Prediction Using Hardness Measurements for Butt-Welded Joints Made of High Strength Steels. Int. J. Fatigue 2021, 147, 106175. [Google Scholar] [CrossRef]
  15. Song, S.; Pei, X.; Dong, P. An Analytical Interpretation of Welding Linear Heat Input for 2D Residual Stress Models. In Proceedings of the ASME 2015 Pressure Vessels and Piping Conference, Boston, MA, USA, 19–23 July 2015. [Google Scholar]
  16. Kang, G.; Luo, H. Review on Fatigue Life Prediction Models of Welded Joint. Acta Mech. Sin. 2020, 36, 701–726. [Google Scholar] [CrossRef]
  17. Yang, H.; Qian, H.; Wang, P.; Dong, P. Analysis of Fatigue Behavior of Welded Joints in Orthotropic Bridge Deck Using Traction Structural Stress. Adv. Mech. Eng. 2019, 11, 1–14. [Google Scholar] [CrossRef]
  18. Wang, H.; Yu, Y.; Yu, J.; Xu, W.; Chen, H.; Wang, Z.; Han, M. Effect of Pitting Defects on the Buckling Strength of Thick-Wall Cylinder under Axial Compression. Constr. Build. Mater. 2019, 224, 226–241. [Google Scholar] [CrossRef]
Figure 1. Overall structure of the counterforce frame.
Jmse 10 01325 g001
Figure 2. Structure of the counterforce frame.
Jmse 10 01325 g002
Figure 3. Connection form of the end frame and the middle frame.
Jmse 10 01325 g003
Figure 4. Connection form of the middle frame joint.
Jmse 10 01325 g004
Figure 5. Stress cloud diagram under axial load.
Jmse 10 01325 g005
Figure 6. Stress cloud diagram under bending moment load.
Jmse 10 01325 g006
Figure 7. Natural frequency analysis.
Jmse 10 01325 g007
Figure 8. Internal hydraulic loading system.
Jmse 10 01325 g008
Figure 9. Electric automatic control valve.
Jmse 10 01325 g009
Figure 10. Disassembled diagram of the shaft end loading mechanism.
Jmse 10 01325 g010
Figure 11. Combined load shaft.
Jmse 10 01325 g011
Figure 12. Moment loading device.
Jmse 10 01325 g012
Figure 13. Bending moment loading cylinder.
Jmse 10 01325 g013
Figure 14. Hydraulic loading servo system.
Jmse 10 01325 g014
Figure 15. Schematic diagram of the loading test riser specimen.
Jmse 10 01325 g015
Figure 16. Full-size SCR test specimen.
Jmse 10 01325 g016
Figure 17. Weld diagram.
Jmse 10 01325 g017
Figure 18. Stress changes at each weld measuring point.
Jmse 10 01325 g018
Figure 19. S–N curve in the specification.
Jmse 10 01325 g019
Figure 20. Calculation points in the S–N curve.
Jmse 10 01325 g020
Table 1. Internal pressure loading system parameters.
Internal Pressure Loading Control System for the Specimen
Loading Pressure RangeMaximum Loading SpeedLoad FunctionPressure Control AccuracyPressure of the Pipeline and ValveEnvironmental Conditions
0.5~60 MPa10 MPa/minSingle linear loading or low-frequency cyclic fatigue loadingLifting and lowering accuracy: less than ±0.2 MPa under 5 MPa;Pressure load retention accuracy: less than ±0.5 MPa≥70 MPaTemperature: −5 °C~+40 °C;Medium: tap water or 3.5% saltwater
Table 2. Loading capacity of a full-scale steel catenary riser fatigue test system.
Size of SpecimenAxial ForceBending MomentTorqueInternal Pressure
MPa
L ≤ 22 m
D < 609.6 mm
3000 kN1300 kN·m
Loading schedule ± 150 mm
200 kN·m60
Table 3. Weld inspection of the full-scale domestic steel catenary riser in a high-stress fatigue test.
The Weld NumberTest ResultsTypes of Crack
Defect Wave Reflection RegionDefect Location (mm)Defect Indication Length (mm)Defect Levels
L1L2Depth
G1III573183.1~27261IIIWeld fatigue stress crack
III531855Through-wall crack324
G2III1143276.2~27213III
III6057975.6~27192III
G3III24270Through-wall crack246III
III4497352.3~27286III
III8979897.3~2792III
Publisher’s Note: MDPI stays neutral with regard to jurisdictional claims in published maps and institutional affiliations.

