Article

Automatic Identification System (AIS) Data Supported Ship Trajectory Prediction and Analysis via a Deep Learning Model

1
Jiangsu Key Laboratory of Traffic and Transportation Security, Huaiyin Institute of Technology, Huai’an 223003, China
2
Institute of Atmospheric Sciences, Fudan University, Shanghai 200438, China
3
Institute of Logistics Science and Engineering, Shanghai Maritime University, Shanghai 201306, China
4
Merchant Marine College, Shanghai Maritime University, Shanghai 201306, China
5
College of Transport & Communications, Shanghai Maritime University, Shanghai 201306, China
6
Department of Civil, Architectural and Environmental Engineering (DICEA), University of Naples Federico II, 80125 Naples, Italy
*
Author to whom correspondence should be addressed.
J. Mar. Sci. Eng. 2022, 10(9), 1314; https://doi.org/10.3390/jmse10091314
Submission received: 17 August 2022 / Revised: 13 September 2022 / Accepted: 15 September 2022 / Published: 16 September 2022

Abstract

:
Automatic Identification System (AIS) data-supported ship trajectory analysis consistently helps maritime regulations and practitioners make reasonable traffic controlling and management decisions. Significant attentions are paid to obtain an accurate ship trajectory by learning data feature patterns in a feedforward manner. A ship may change her moving status to avoid potential traffic accident in inland waterways, and thus, the ship trajectory variation pattern may differ from previous data samples. The study proposes a novel ship trajectory exploitation and prediction framework with the help of the bidirectional long short-term memory (LSTM) (Bi-LSTM) model, which extracts intrinsic ship trajectory features with feedforward and backward manners. We have evaluated the proposed ship trajectory performance with single and multiple ship scenarios. The indicators of mean absolute error (MAE), mean absolute percentage error (MAPE) and mean square error (MSE) suggest that the proposed Bi-LSTM model can obtained satisfied ship trajectory prediction performance.

1. Introduction

The development of global economic promotes goods transmission among different countries and cities via varied traffic modes, while the majority of freight volumes are transmitted by ships [1,2,3]. It can be observed that inland waterways become increasingly more congested due to the heavy raise of maritime traffic volumes, and thus, maritime traffic accidents may occur with a higher possibility. Therefore, it is of great importance to manage and monitor maritime traffic in the inland waterways via the support of varied maritime traffic data sources. The automatic identification system (AIS) is a common type of traffic data source used for maritime traffic management in the real world [4,5]. The AIS system mainly involves of ship-borne and shore-based facilities, which are used for AIS data transmission and reception, and the regular data transmission frequency ranges from 2 s to 10 min based on the ship moving speed [6,7].
The AIS system broadcasts both static and kinematic ship data to the neighboring ships and base stations, which include the ship type, Maritime Mobile Service Identity (MMSI), speed, real-time location (i.e., latitude and longitude), etc. [8]. It is noted that neighboring ships receive the AIS data with a given time interval, which is further used to explore the on-spot traffic situation [9]. Moreover, numerous AIS stations deployed at coastal areas store AIS data transmitted by ships travelling in the area, which can be used to support maritime traffic management and controlling by maritime officials and ship company as well. Many focuses are paid to control maritime traffic by predicting ship moving trajectories via the support of historical AIS data [10,11]. In that way, accurate ship trajectory plays an important role in the reasonable decision-making operation for maritime traffic management. It is observed that many studies are conduced to predict ship trajectories with conventional machine learning models, which forecast potential ship routes by exploring shallow data features from the input AIS samples [12,13].
Traditional framework may perform well when the ship moving pattern does not significantly change for a given time period (e.g., sudden acceleration/deceleration). For instance, Zhang et al. predicted traffic flow with an enhanced particle swarm optimization model supported by the back propagation mechanism [14]. Yu et al. evaluated the offshore wind farm impact on maritime traffic flow variation with steps of raw AIS data collection, data cleansing and the farm influence analysis [15]. Similar studies can be found in [16,17,18,19]. However, ship traveling in the inland waterways may maneuver its moving direction and speed to avoid potential traffic accidents due to maritime traffic jam [20,21]. In that manner, there is an urgent need to predict ship trajectories by exploring intrinsic spatial-temporal features from historical AIS data.
Deep learning models have shown its successes in the traffic flow prediction task, and the long sort term memory (LSTM) model is a common yet popular model used for traffic flow prediction [22,23]. Zhou et al. clustered ship behaviors from inland massive AIS data series, and thus, further recognized ship behavior patterns with the support of behavior clustering results [24]. Bai et al. also investigated financial operation risk for global tramp shipping industry via AIS data support [25]. Duan et al. proposed a semi-supervised deep learning method to classify ship trajectory type via the help of both of kinematic and static information from AIS data [26]. More specifically, Duan et al. aimed to classify ship trajectory category via the support of limited yet labeled AIS data. In contrast, our study intends to predict ship trajectory with the support of historical AIS data. It is found that the deep learning model maybe overfitting due to the lack of backward context training procedure. It is found that several measurements can be taken to avoid the overfitting phenomenon, which consists of data augmentation, ensemble learning technique, abnormal data removal, etc. We try to alleviate the overfitting weakness with the abnormal data removal-based logic.
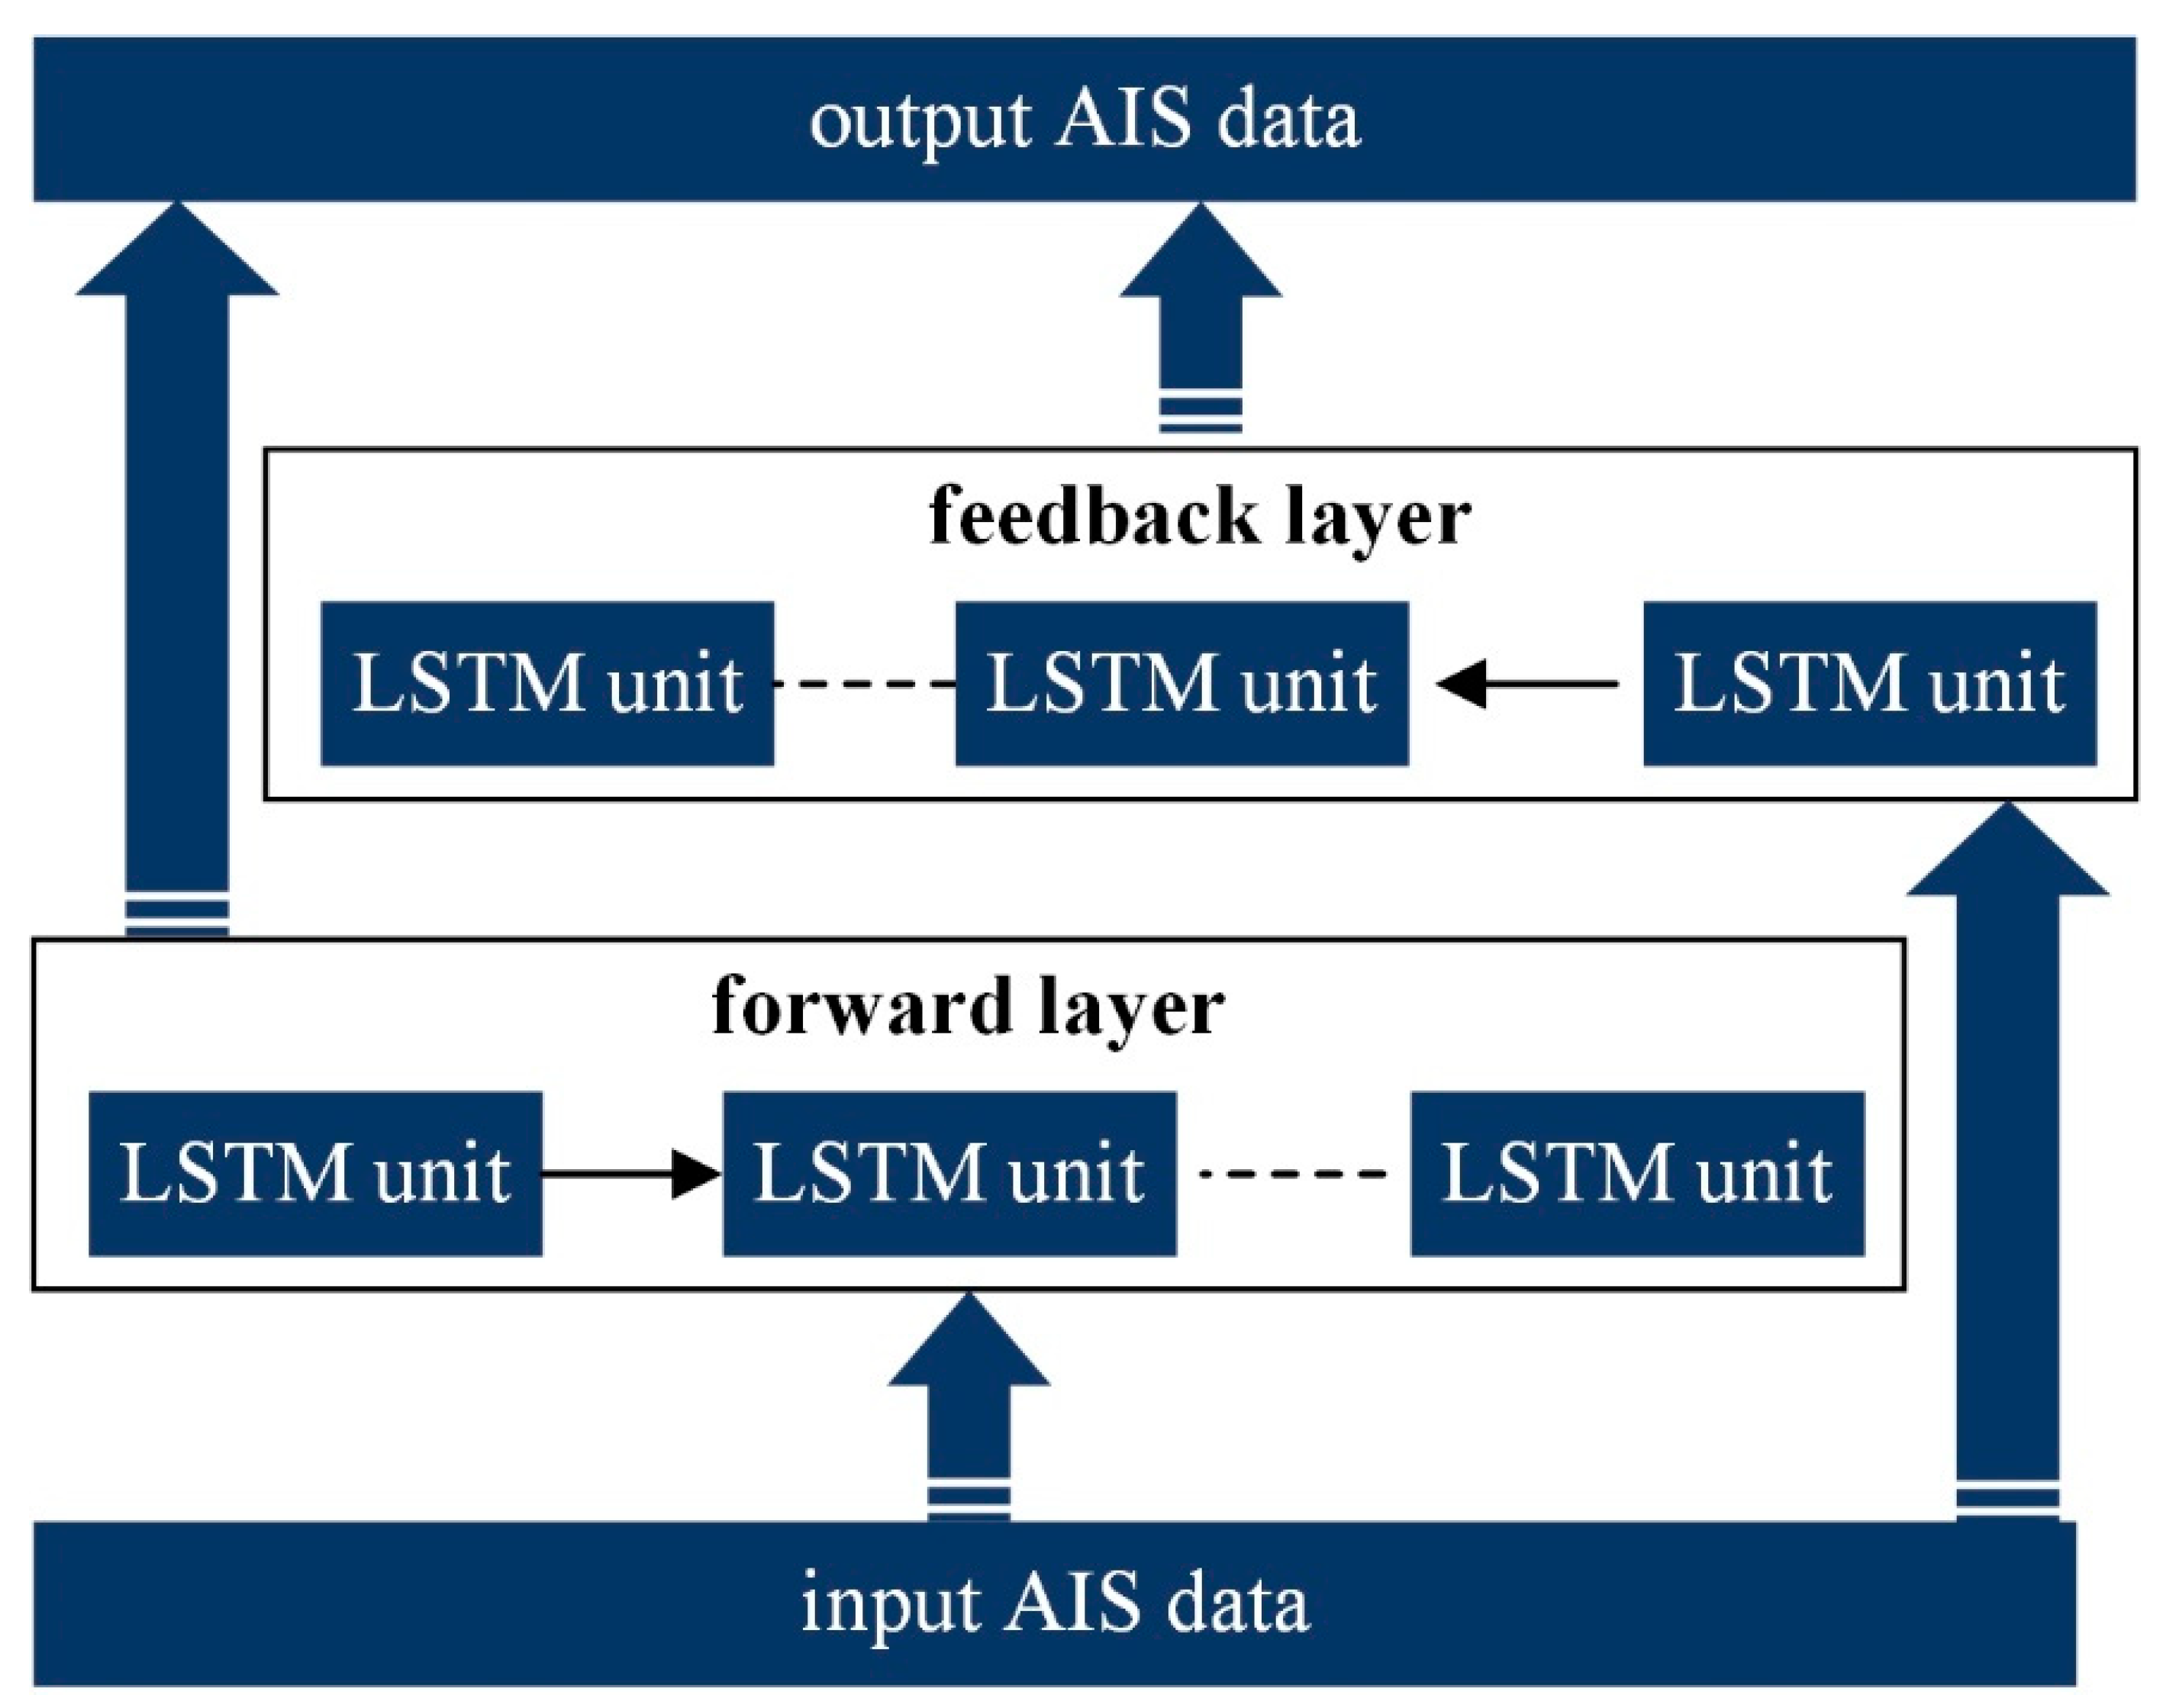
The aim of the study is to predict ship trajectory with a bidirectional LSTM (Bi-LSTM) model, and thus, further analyze trajectory variation tendency with the data prediction results. Moreover, we can also predict potential berth port by accurately forecasting ship trajectory data, especially with the support of speed-related kinematic information contained in the AIS data [27,28]. The study helps maritime traffic practitioners (e.g., maritime traffic officials, ship crew, etc.) make management and ship maneuvering operation in a more reasonable manner. The remainder of the paper is organized as follows. Section 2 describes the methodology used in the study, while Section 3 illustrates the experiment of the study. The final section briefly concludes the study and describes potential future research.

2. Methodology

2.1. AIS Data Normalization

We have downloaded the raw AIS data from the publicly accessible website https://marinecadastre.gov/ais/ [29]. Note that the website maintenance department has already conducted data outlier correction procedure to suppress obvious data outliers. The step aims to suppress potential AIS data outliers from raw AIS dataset regardless of interferences of ship type, buoy AIS, etc. More specifically, the preprocessing step in the study mainly focus on data outliers, and thus, factors triggering the data outliers are beyond the research scope. The ship position may range from varied latitude and longitude area, which may impose additional interference for maritime traffic situation analysis via the support of AIS data. We have normalized the time span between neighboring AIS data samples into 10 second in the study. Besides, both of the latitude and longitude data are mapped into interval from 0 to 1 via the help of min-max normalization method (see Equation (1)). More specifically, the raw latitude (and longitude) is mapped onto a new latitude (and longitude) value by subtracting the minimum latitude and dividing the difference between maximum and minimum latitudes. Note that the symbol lat raw denotes the raw latitude for a given AIS data sample, while the lat max and lat min are the maximum and minimum latitudes, respectively. The lat n represents the normalized latitude sample. We can obtain the normalized longitude data by following the same rule for calculating the normalization latitude data (see Equation (2)). The parameters lon raw , lon min , lon max and lon n demonstrate raw, minimum, maximum and normalized longitude AIS data sample:
lat n = lat raw   lat min lat max   lat min
lon n = lon raw   lon min lon max   lon min

2.2. AIS Data Prediction with the Bi-LSTM Model

2.2.1. Basic LSTM Model

The basic LSTM model is a type of efficient sequential data prediction model, which originated from a recurrent neural network. It is found that the prediction error will significantly increase due to iterative weight matrix multiplication. The LSTM model mitigates such a disadvantage by introducing a gate controlling mechanism for the purpose of suppressing data feature loss and non-trivial data transmission. More specifically, the LSTM learns data features by integrating the input gate, output gate and forget gate during the training and prediction procedure. We employ the symbol   L ˜ to denote the input AIS data series, and L p ˜ demonstrates the prediction result. We can obtain the formulas for the input gate (denoted as G in ), forget gate (labeled as G fgt ) and output gate (labeled as G o u t ) with Equations (3)–(5):
G in = α   ( β 1 L ˜ + β 2 V + β 3 C + b in )
G fgt = α   ( γ 1 L ˜ + γ 2 V + γ 3 C + b fgt )
G o u t = α   ( μ 1 L ˜ +   μ 2 V + μ 3 C + b out )
where β j , γ j and μ j (j = 1, 2, 3) are the weight matrices for the input gate, forget gate and output gate, respectively. Moreover, the parameters V , C and   C are activation vectors in the deep neural network.

2.2.2. Ship Trajectory Prediction with the Bi-LSTM Model

The conventional LSTM model outputs the maritime traffic data by only considering the historical data pattern. The model may obtain obvious biased results when the ship significantly changes movement state (e.g., a ship sharply varying her maneuvering direction and speed). The Bi-LSTM model can mitigate the LSTM model disadvantage since the Bi-LSTM model assumes that both the historical and future variation pattern may affect the ship data prediction performance [30]. More specifically, the Bi-LSTM model employs the prediction output to feed back into the model training procedure for the purpose of enhancing model performance. The Bi-LSTM model consists of forward layer and feedback layer (with basic LSTM units), and the overview for the Bi-LSTM network can be found in Figure 1. The Bi-LSTM model obtains final training and prediction results by learning intrinsic features from both of forward layer outputs and feedback layer. Note that the forward (feedback) layer in the Bi-LSTM model plays the role of AIS data pattern transmission in a forward (backward) manner. The information obtained by both of the forward and feedback layers generate final output of the AIS data prediction results.

2.3. Evaluation Metrics

We introduce three popular yet efficient indicators to analyze maritime traffic flow data prediction accuracy. More specifically, the indicators of mean absolute error (MAE), mean absolute percentage error (MAPE) and mean square error (MSE) are introduced to evaluate model performance by following the rules in previous studies [31,32]. The MAE indicator measures the absolute error between the ground-truth and prediction AIS data series, which are further implemented in terms of latitude and longitude (see Equation (6)). The MAPE quantifies model performance in the manner of percentage (see Equation (7)). The rule of thumb suggests that the prediction model obtains satisfied performance when the MAPE is smaller than 10. The MSE indicator represents mean value for the square error between the predicted and ground-truth AIS data samples (see Equation (8)). It is noticed that lower MAE, MSE and MAPE indicate better traffic data prediction performance.
MAE = 1 n i = 1 n | R ( i )   GT ( i ) |
MAPE = 1 n i = 1 n ( | R ( i )   GT ( i ) GT ( i ) | ) × 100 %
MSE = 1 n i = 1 n ( R ( i )   GT ( i ) ) 2
where R ( i ) demonstrates the predicted ith AIS data sample and the GT ( i ) is the counterpart of the ground-truth sample. The number n indicates overall data samples for a given AIS segment.

3. Experiment

3.1. Experimental Setups

The platform used for AIS data prediction performance analysis consists of hardware and software setups. From the perspective of hardware settings, we employ the Intel(R) Core (TM) i7–8750H with CPU frequency of 2.2 GHz. The RAM size is 16 G, and the GPU used in the study is NVIDIA GeForce GTX 1050 Ti. The software setups in the study include the win10 operation system. The coding language for implementing traffic flow prediction task is python via the support of tensorflow and the Keras deep network structure. More details for the experimental setups can be found in Table 1. We have employed the Pandas and Numpy packages to preprocess and visualize the AIS data. For the purpose of model performance comparison, we have implemented the LSTM [33], social LSTM (SOC-LSTM) [34] and social generative adversarial network (SOC-GAN) [35] to achieve ship trajectory prediction task. Note that our proposed ship trajectory prediction model was labeled as Bi-LSTM model for the purpose of readability.
It is noted that accurate ship trajectory benefits varied maritime traffic participants (e.g., maritime traffic regulation department, ship crew). More specifically, a traffic variation trend can be predicted with support of accurate ship trajectory data. In that manner, model performance is evaluated in terms of ship trajectory prediction accuracy. Moreover, we collect the ship trajectory data, while the ships are involved with typical maritime traffic scenario (i.e., head-on situation). Moreover, we have collected the AIS data from three merchant ships since that the majority of maritime goods carriages are transported by merchant ships. In that way, we can verify the model performance for the ship trajectory prediction task, which can be further used to analyze the ship maneuvering and controlling strategy. We collected the AIS data of ships with MMSI code number 413842854, 413694210 and 412592160, which were indeed merchant ships. For the purpose of readability, we labeled the ship with MMSI 413842854 as ship #1, and the latter two ships as ship #2 and #3, respectively.
It is noted that ship trajectory can be easily identified from the longitude and latitude variation from the AIS data series. In that manner, we predict ship trajectory by focusing on the longitude and latitude data. The primary parameter settings in the study are shown in Table 2. The training epoch number is set to 2000, and default learning rate is set to 1.00 × 10⁻⁴. We set the batch size into 64, and the MSE function is introduced as the loss function in the proposed deep learning framework. It is observed that model performance is also affected by network parameter settings, while input feature number and hidden layer node number play a more important role. The optimal settings for the input feature number and hidden layer node number for different models (i.e., Bi-LSTM, LSTM, SOC-LSTM and SOC-GAN) are shown as Table 3. Note that we did not provide the normalized AIS data in the following sections for the purpose of better readability.

3.2. Single-Ship Trajectory Prediction and Analysis

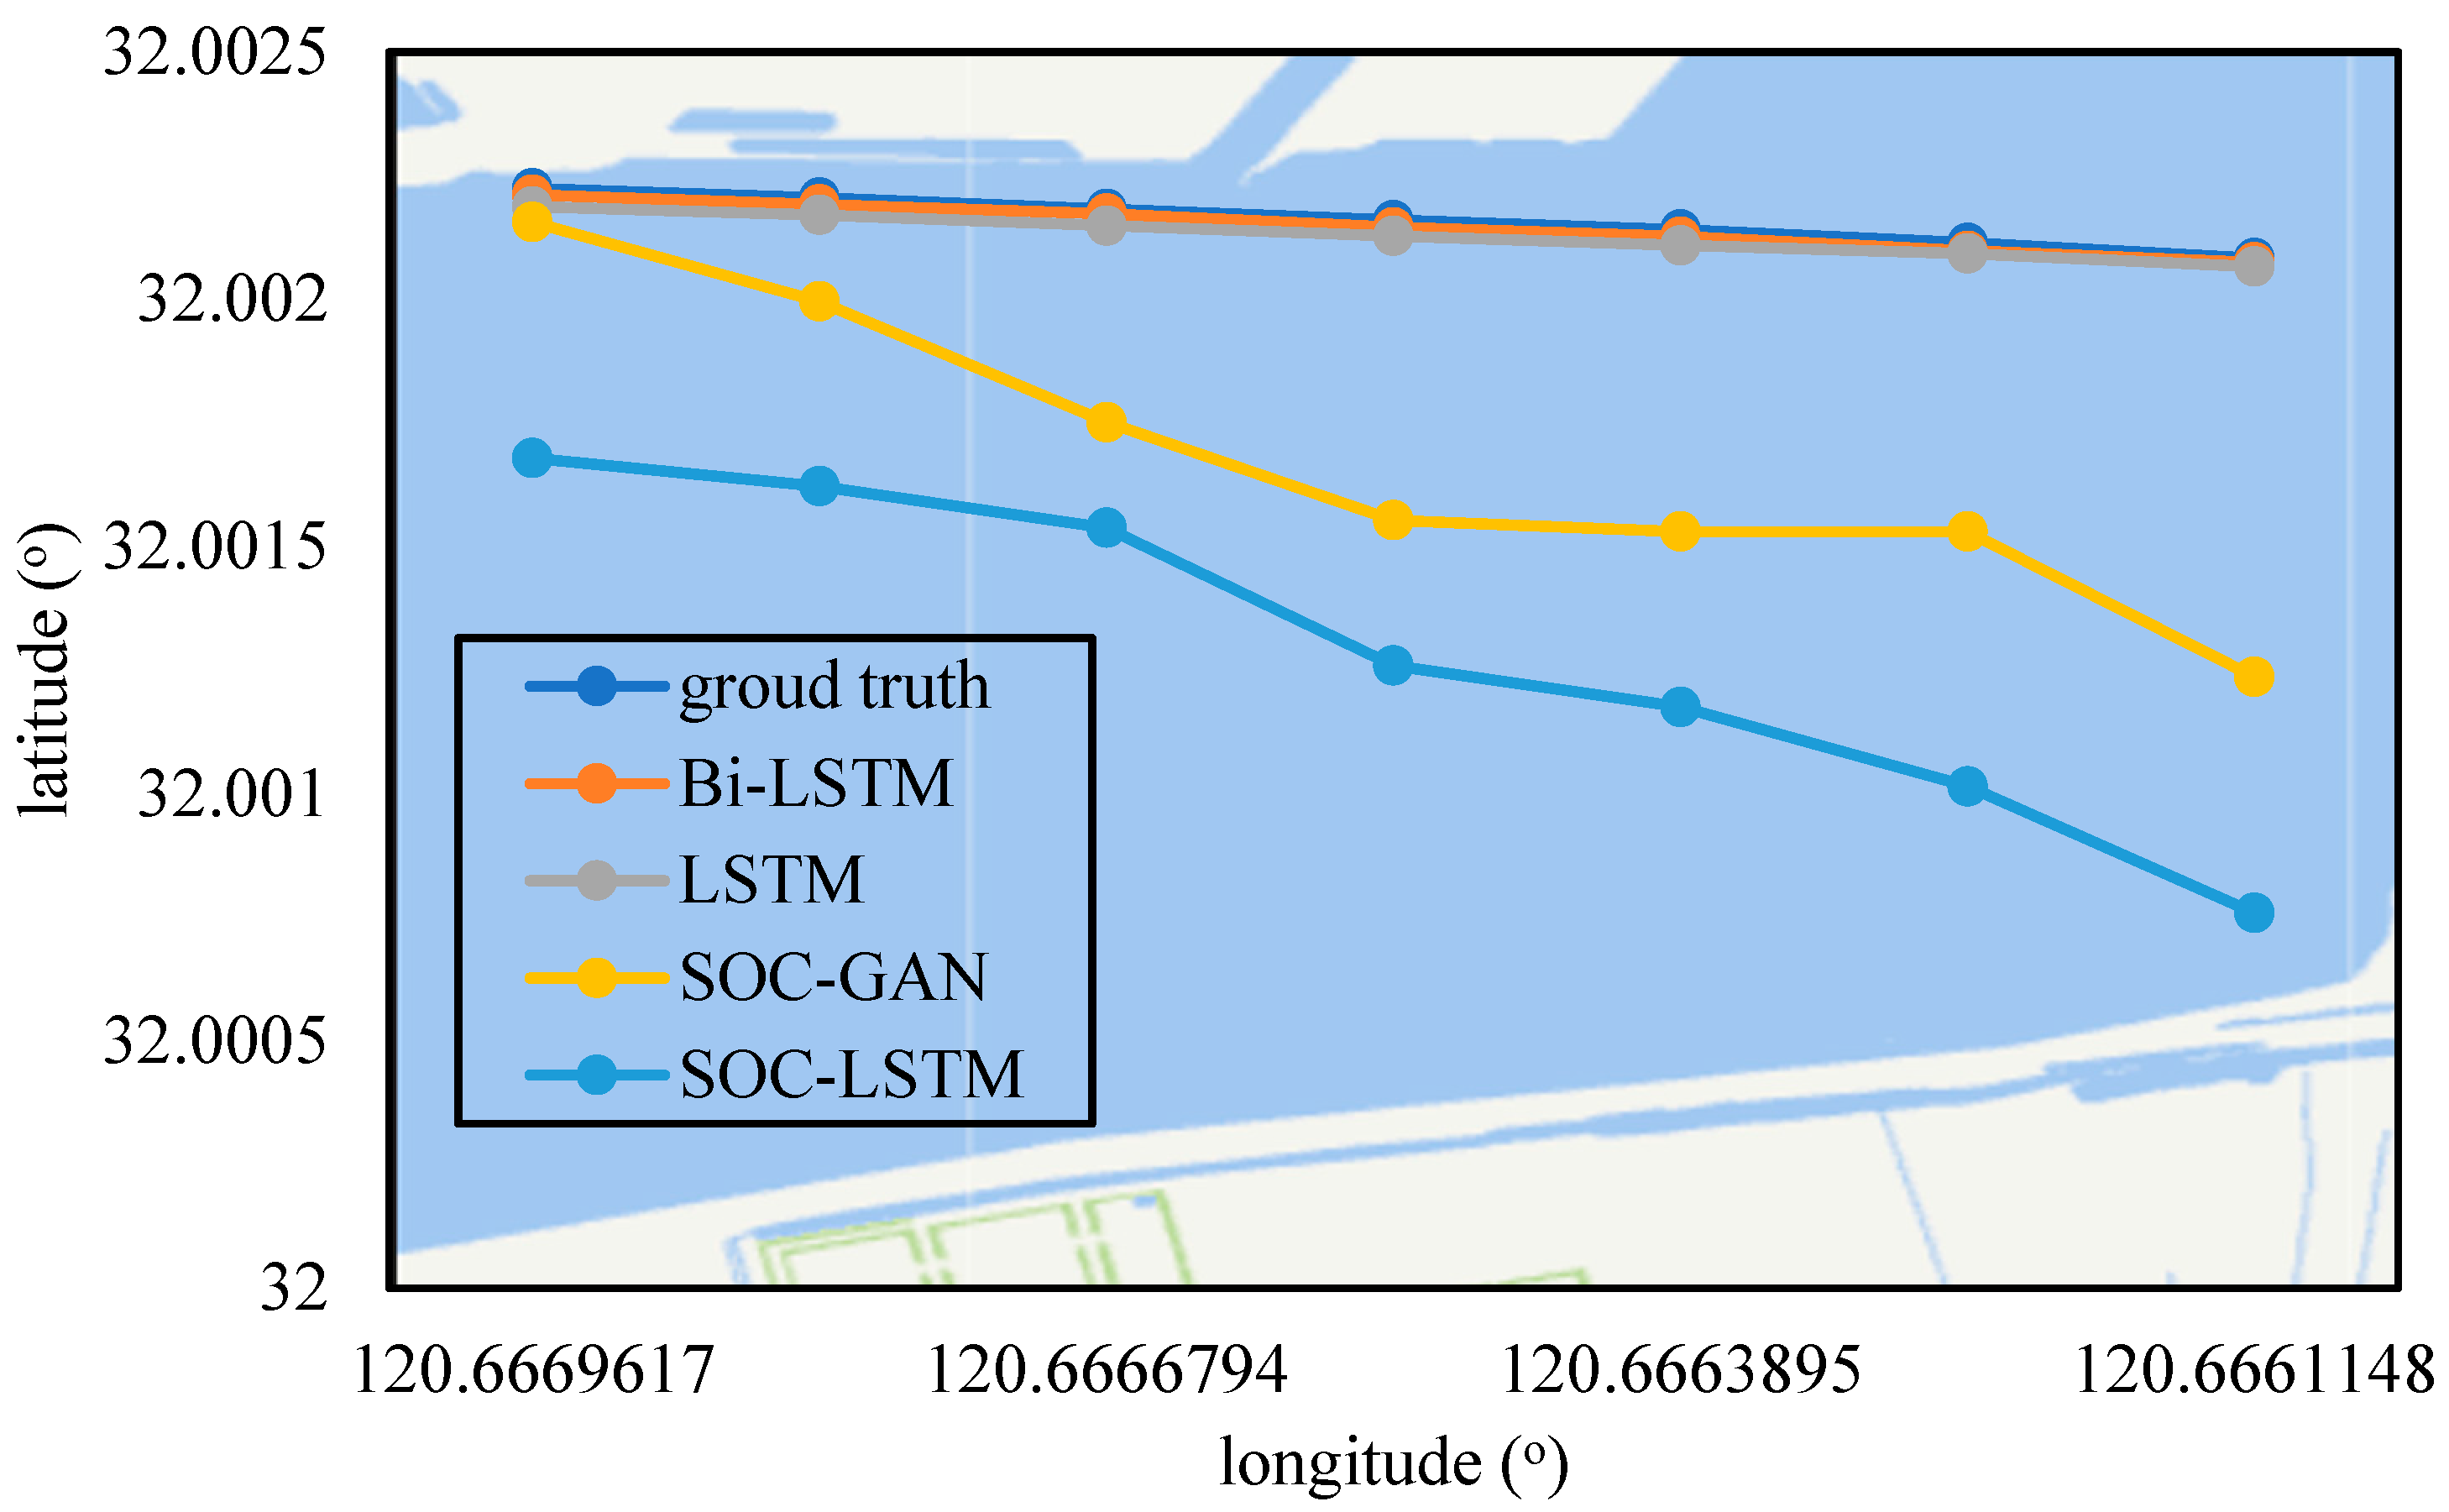
We obtained the single-ship (with MMSI 413842854) trajectory prediction performance for different models, which can be found in Figure 2. It was observed that the conventional LSTM and Bi-LSTM models obtained better performance compared to those of the social-based deep learning models (i.e., SOC-LSTM and SOC-GAN). Indeed, the ship trajectory prediction accuracy for the SOC-LSTM model was worse than the other three models. The SOC-GAN showed an obvious bias results compared to those of the ground truth AIS data samples. One possible reason may be that the model introduced some negative AIS variation tendency during the training procedure.
We have provided the ship trajectory segment prediction performance for the ship (with MMSI code 413842854) in terms of latitude and longitude data samples. Note that the unit for the latitude and longitude data was degree, without further specifications in the study. Table 4 suggested that the latitude prediction accuracy obtained by the Bi-LSTM model was higher than the counterparts of LSTM, SOC-LSTM and SOC-GAN. More specifically, we found that the latitude prediction error for the Bi-LSTM model was smaller than 1%, and the LSTM counterpart was similar yet larger than that of the Bi-LSTM model. The latitude data prediction errors for both of SOC-LSTM and SOC-GAN models were slightly larger than the Bi-LSTM and LSTM models. Table 5 demonstrated trajectory segment prediction performance on the longitude data samples for the ship with MMSI code 413842854. It was observed that the ship longitude prediction accuracy showed similar performance compared those of the latitude data prediction performance. More specifically, the Bi-LSTM model outperformed the LSTM, SOC-LSTM and SOC-GAN models in terms of the longitude data prediction task.
Table 6 demonstrated statistical indicator distributions (i.e., MAE, MAPE, MSE) for varied trajectory prediction model for the ship with MMSI code 413842854. From the perspective of MAE indicator, it was noted that the Bi-LSTM model obtained better performance compared to that of the LSTM model, while the SOC-LSTM accuracy was approximately 10% to that of the Bi-LSTM model. The MAE indictor for the SOC-GAN model was 1.64 × 10⁻¹, which was obviously larger than the counterparts of Bi-LSTM, LSTM and SOC-LSTM. The MAPE indicator variation tendency showed similar performance compared to those of the MAE indicator. More specifically, the MAPE for the Bi-LSTM was 6.74 × 10⁻⁵, which was about half to that of the LSTM model (i.e., 1.15 × 10⁻⁴).
The MAPE indicators for the SOC-LSTM and SOC-GAN models were 8.66 × 10⁻⁴ and 4.13 × 10⁻⁴, respectively. We found that the MSE values were smaller than those of the MAE and MAPE. It was observed that MSE for the Bi-LSTM model was 1.43 × 10⁻⁹, which was significantly lower than the counterparts of the MAE and MAPE. The MSE values for the LSTM, SOC-LSTM and SOC-GAN were 1.94 × 10⁻⁹, 4.63 × 10⁻⁷ and 7.79 × 10⁻², which were at least 30% larger than that of the Bi-LSTM model. In sum, the Bi-LSTM model can accurately predict ship trajectory in terms of the MAE, MSE and MAPE indicators compare to those of the LSTM, SOC-LSTM and SOC-GAN models.

3.3. Trajectory Prediction for Multiple Ships

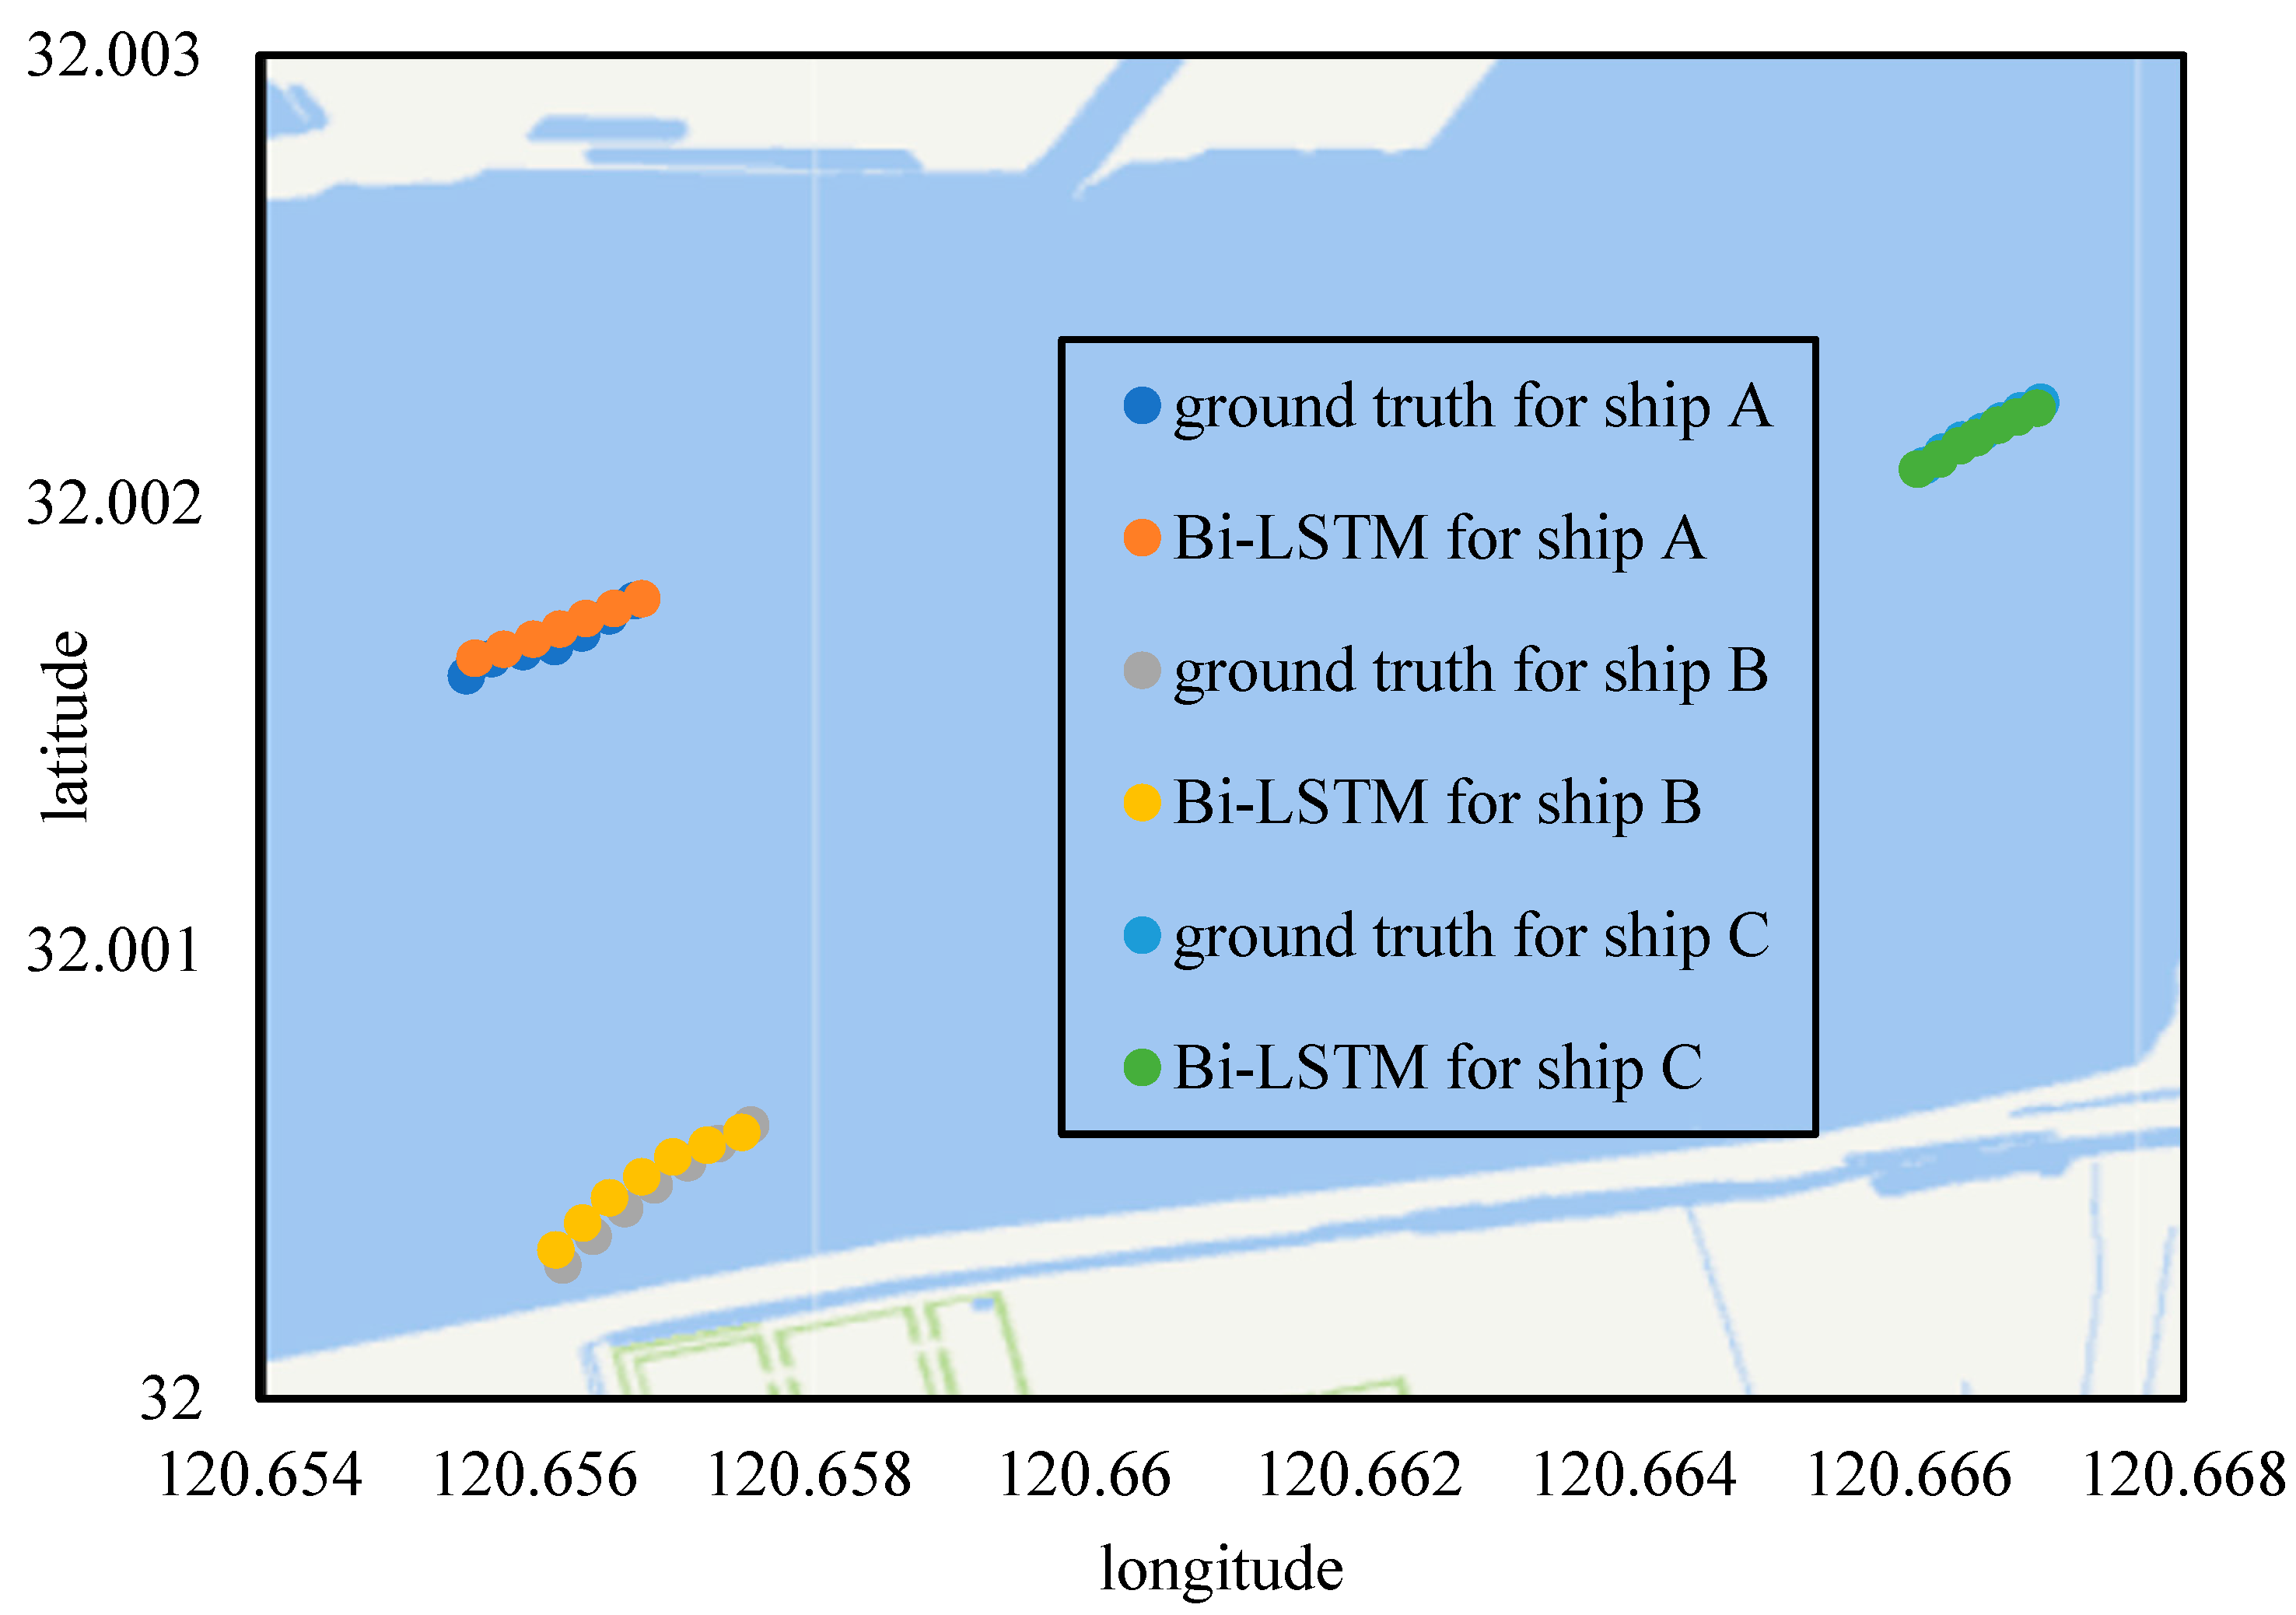
We simultaneously analyzed trajectory prediction performance for multiple ships (i.e., three ships in our study) for the purpose of model performance comparison. Note that the ships with MMSI codes 412592160, 413694210 and 413842854 were labeled as ship A, ship B and ship C, respectively, in our study. It can be observed that the Bi-LSTM model can accurately predict ship trajectory, since the predicted ship trajectory samples matched the ground truth data well (see the 
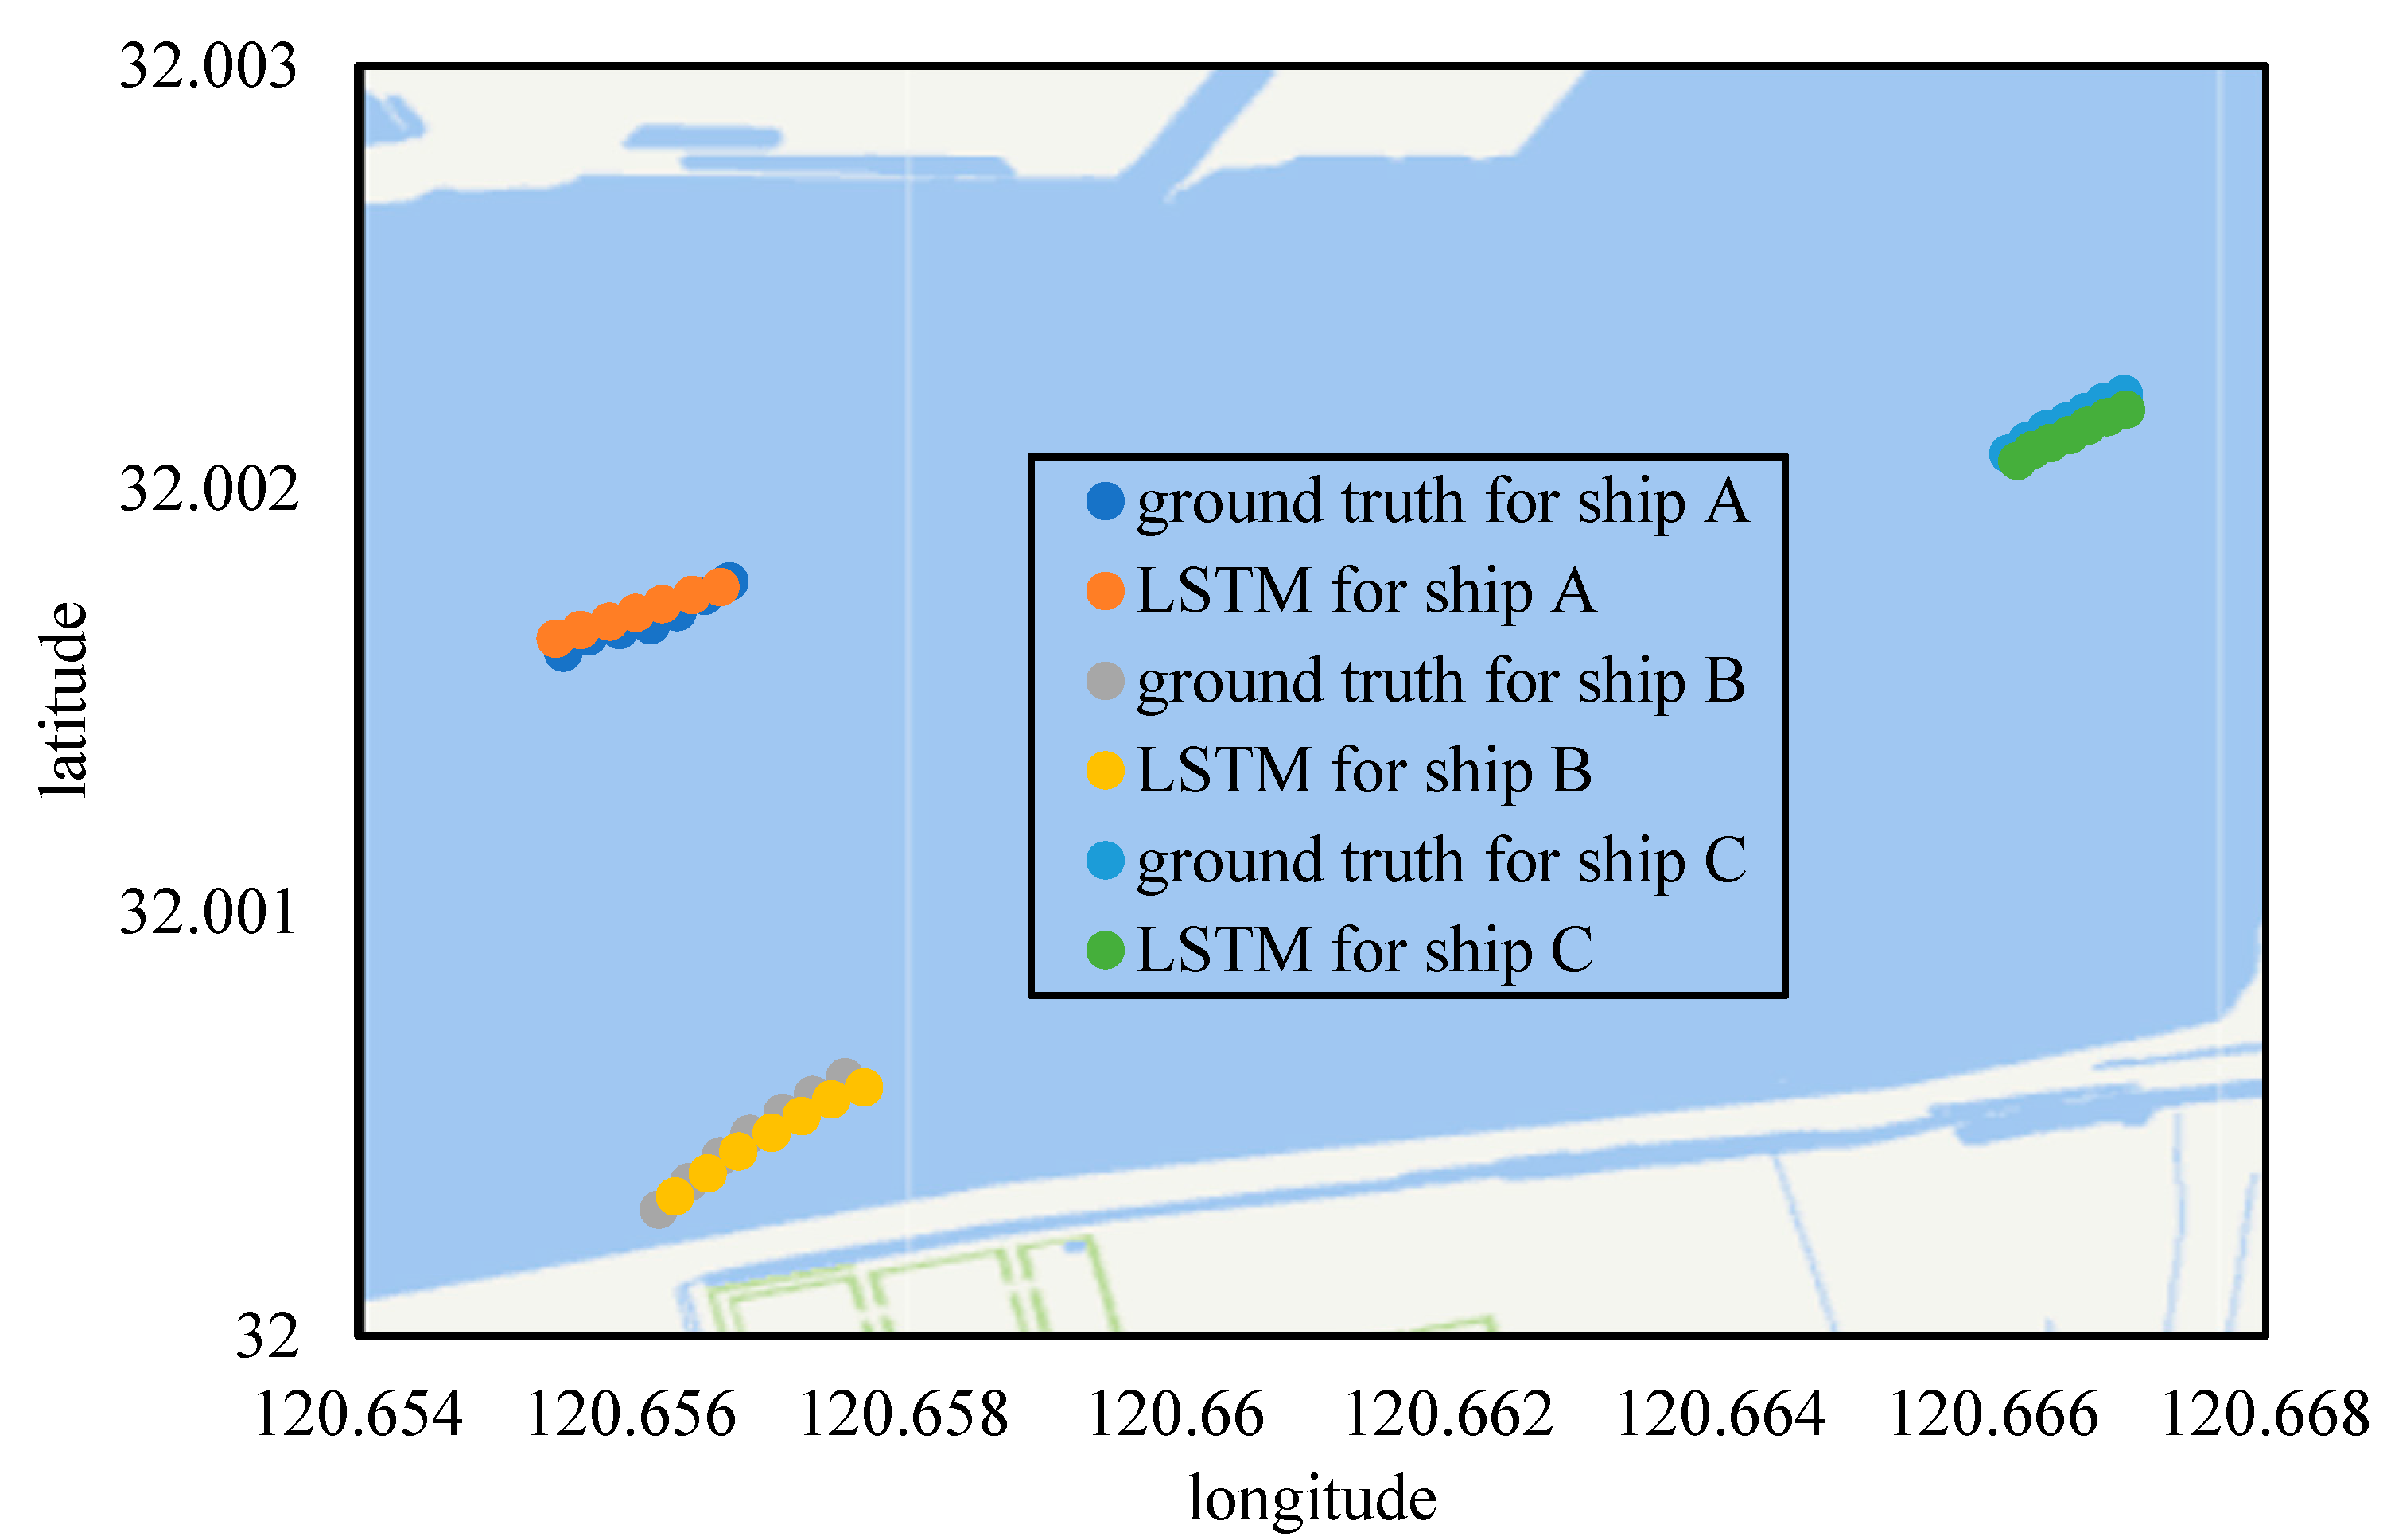
Figure 3). The LSTM model prediction performance was similar to that of the Bi-LSTM models considering that the predicted and ground truth ship trajectory samples were quite close to each other, as shown in Figure 4. Note that our study mainly focused on ship trajectory prediction with the latitude and longitude information, regardless of ship speed and heading data. The main reason was that the above-mentioned ship kinematic data variation (i.e., speed and heading data) can be inferred from ship trajectory data. More specifically, maritime traffic safety-related analysis can be fulfilled by exploring ship position data variations. Moreover, the distance was measured while the ship was considered as a particle. In that way, the distance between neighboring AIS data samples was acceptable (i.e., did not threaten maritime traffic).
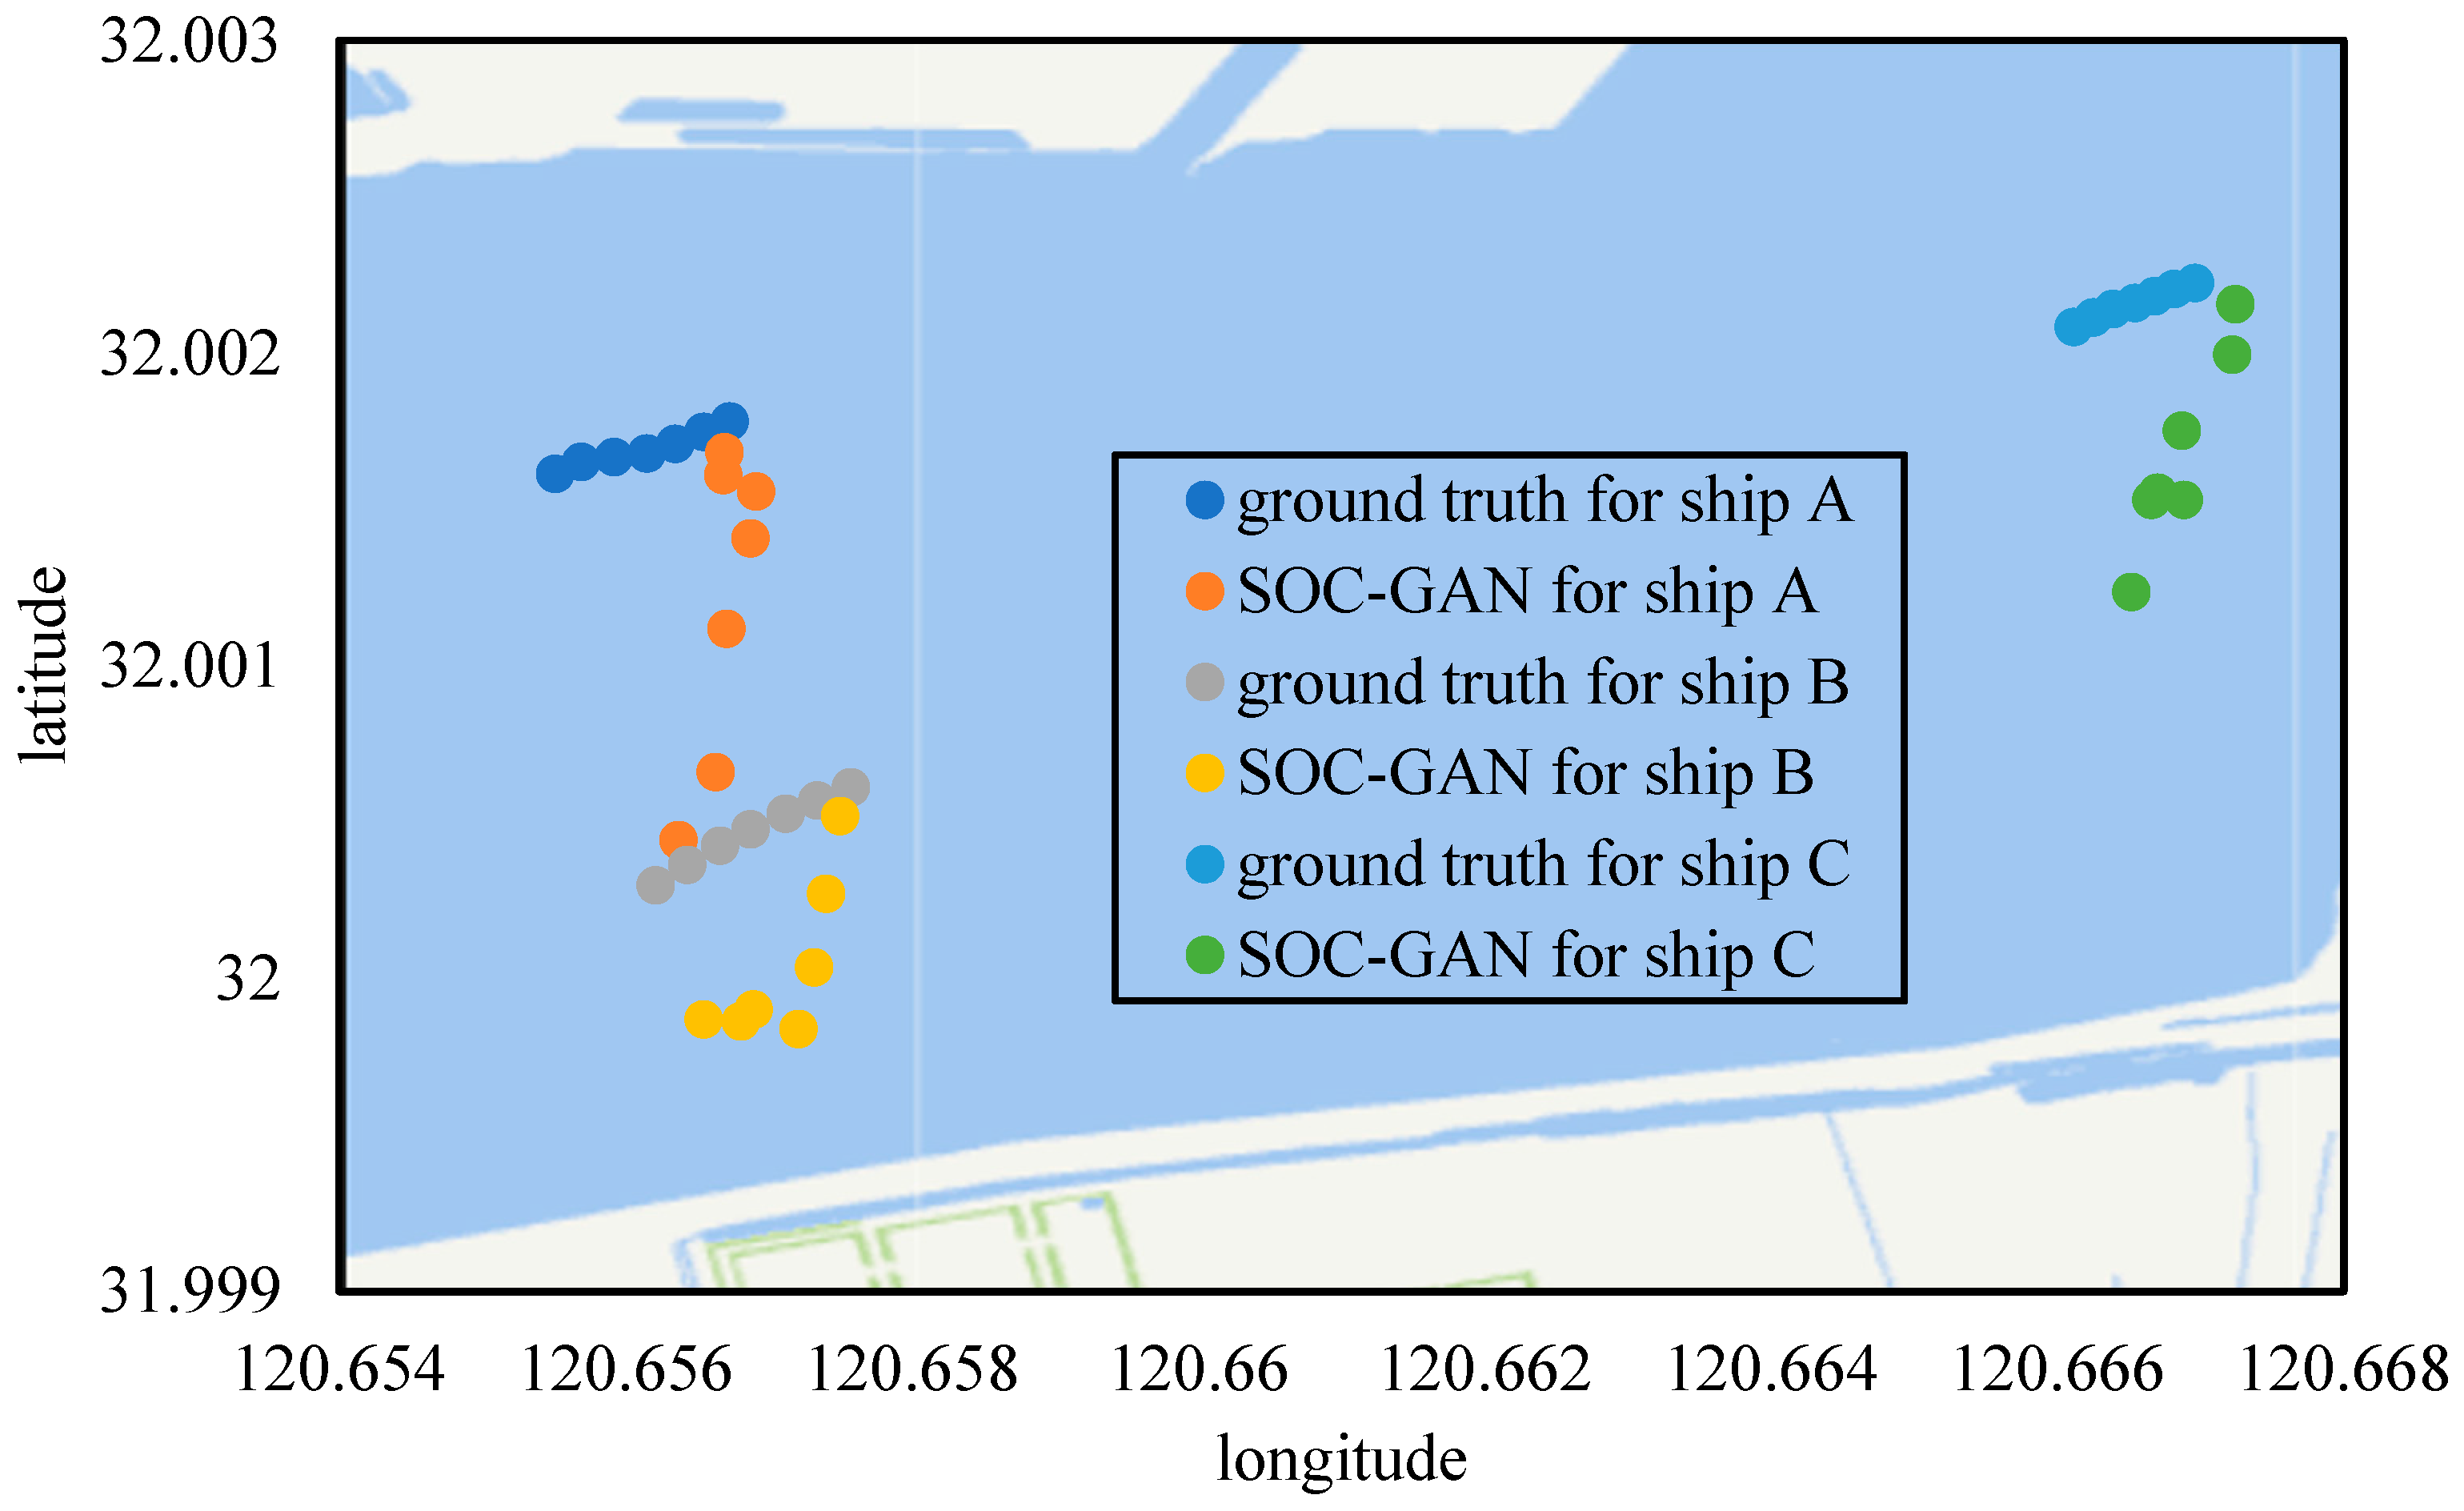
The ship trajectory segment prediction performance shown in Figure 5 and Figure 6 indicated that both of the SOC-LSTM and SOC-GAN models failed to obtain satisfied performance. It was found that the predicted trajectory for ship A for the SOC-LSTM model was obviously different from that of the ground truth data (see Figure 5). The prediction performance for ship B and ship C for the SOC-LSTM were similar to that of the ship A. It can be inferred that SOC-LSTM model output ship trajectory with similar variation tendency compared to those of the ground truth ship trajectories with a larger span. The ship trajectory prediction results for the SOC-GAN model shown in the Figure 6 suggested that the predicted ship trajectory variation tendency was different from that of the ground truth data.
More specifically, we may infer that the model may have extracted biased ship trajectory features from the training data samples. In sum, ship trajectory prediction results shown from Figure 4, Figure 5 and Figure 6 indicated that the Bi-LSTM and conventional LSTM model successfully exploited ship features from historical trajectory data samples. Meanwhile, the social based deep learning models failed to identify ship trajectory variation tendency. The ship crew can identify on-site traffic situation via the support of AIS data, which can be further determined with other common maritime data sources (such as very high frequency radio, radar, etc.). More specifically, the AIS data can help on-board ship staff identify on-site traffic situations, while emergency traffic scenarios will be further confirmed with other maritime data sources. In that manner, maritime traffic safety can be ensured by implementing efficient yet proper ship maneuvering operations.
We obtained the aggregated ship trajectory prediction performance in terms of MAE, MAPE and MSE, which can be found in Table 7. Distributions for the three indicators suggested that the Bi-LSTM model obtained better performance compared with the LSTM, SOC-LSTM and SOC-GAN models. The values for the MAE, MAPE and MSE were 6.46 × 10⁻⁵, 9.07 × 10⁻⁵ and 3.98 × 10⁻⁹, which were smaller than the counterparts of other three models. It was noted that the MAE indicator for the LSTM model was approximately three-fold larger than that of the Bi-LSTM model. The MAPE and MSE indicators of the LSTM model, which were 1.31 × 10⁻⁴ and 1.02 × 10⁻⁸, respectively, showed similar performance compared to that of the MAE indicator. The aggregated MAE, MAPE and MSE for the SOC-LSTM were at least two-fold larger than those of the LSTM model, which were 3.57 × 10⁻⁴, 7.98 × 10⁻⁴ and 3.31 × 10⁻⁷. The three indicators (i.e., MAE, MAPE and MSE) for the SOC-GAN, shown in the Table 7, were smaller than those of the SOC-LSTM.

4. Conclusions

Ship trajectory prediction and identification provides crucial traffic information to varied maritime activity practitioners, such as on-duty ship crew, maritime traffic officials, etc. The study aimed to accurately predict ship trajectory by introducing a deep learning-based framework. More specifically, we predicted trajectory variation in terms of a single ship and multiple ships with AIS data samples. Moreover, we have further evaluated our model performance against additional popular ship trajectory prediction models (i.e., LSTM, SOC-LSTM and SOC-GAN). Experimental results suggested that the proposed Bi-LSTM based framework can obtain better accuracy considering that prediction errors (quantified by the MAE, MAPE and MSE indicators) for the proposed model were smaller than the counterparts obtained by the other three models (i.e., LSTM, SOC-LSTM and SOC-GAN). Moreover, the LSTM model outperformed the SOC-LSTM and SOC-GAN models in terms of the MAE, MAPE and MSE indicators. The research findings can help maritime authorities, and ship owners make more reasonable maneuver operations in advance with the help of ship trajectory information.
We can further improve our study by exploring the following potential directions. First, ship navigation surroundings (e.g., wave, wind, buoys) may impose additional interference to ship maneuvering operations, and thus leading to different ship trajectories. We can further quantify the ship navigation interference factors by implementing the ship trajectory prediction task in future. Second, the time cost for training a deep learning model may significantly increase with an increased number of neurons. We can introduce other training mechanisms to reduce time cost without suppressing model prediction performance. Third, the model performance was verified under typical maritime traffic situation regardless of waterway conditions. The proposed framework was supposed to obtain satisfied performance in narrow channels due to that ship smoothly moves in the narrow waterways (i.e., ship movement pattern was straightforward). We can further explore traffic impact on the trajectory extraction task in future. Last but not least, we may further integrate the attention mechanism into the Bi-LSTM model by focusing on intrinsic data feature exploitation.

Author Contributions

Conceptualization, X.C., C.W. and G.Z.; methodology, X.C., C.W., H.W. and Z.W.; writing—original draft preparation, X.C., C.W. and S.A.B.; writing—review and editing, G.Z. and Z.W.; funding acquisition, X.C. and H.W. All authors have read and agreed to the published version of the manuscript.

Funding

This work was jointly supported by the National Key R&D Program of China (2021YFC2801002), the National Natural Science Foundation of China (52102397, 52071200), the Foundation for Jiangsu key Laboratory of Traffic and Transportation Security (No. TTS2021–05), and the fellowship of China Postdoctoral Science Foundation (2021M700790, 2022M712027).

Institutional Review Board Statement

Not applicable.

Informed Consent Statement

Not applicable.

Conflicts of Interest

The authors declare no conflict of interest.

References

  1. Benz, L.; Münch, C.; Hartmann, E. Development of a search and rescue framework for maritime freight shipping in the Arctic. Transp. Res. Part A Policy Pract. 2021, 152, 54–69. [Google Scholar] [CrossRef]
  2. Zhou, Y.; Daamen, W.; Vellinga, T.; Hoogendoorn, S. Review of maritime traffic models from vessel behavior modeling perspective. Transp. Res. Part C Emerg. Technol. 2019, 105, 323–345. [Google Scholar] [CrossRef]
  3. Ma, D.; Ma, W.; Hao, S.; Jin, S.; Qu, F. Ship’s response to low-sulfur regulations: From the perspective of route, speed and refueling strategy. Comput. Ind. Eng. 2021, 155, 107140. [Google Scholar] [CrossRef]
  4. Özlem, Ş.; Altan, Y.C.; Otay, E.N.; Or, İ. Grounding probability in narrow waterways. J. Navig. 2020, 73, 267–281. [Google Scholar] [CrossRef]
  5. Gao, M.; Shi, G.-Y. Ship-handling behavior pattern recognition using AIS sub-trajectory clustering analysis based on the T-SNE and spectral clustering algorithms. Ocean Eng. 2020, 205, 106919. [Google Scholar] [CrossRef]
  6. Rawson, A.; Brito, M. A critique of the use of domain analysis for spatial collision risk assessment. Ocean Eng. 2021, 219, 108259. [Google Scholar] [CrossRef]
  7. Ma, D.; Hao, S.; Ma, W.; Zheng, H.; Xu, X. An optimal control-based path planning method for unmanned surface vehicles in complex environments. Ocean Eng. 2022, 245, 110532. [Google Scholar] [CrossRef]
  8. Rodger, M.; Guida, R. Classification-aided SAR and AIS data fusion for space-based maritime surveillance. Remote Sens. 2020, 13, 104. [Google Scholar] [CrossRef]
  9. Rong, H.; Teixeira, A.; Soares, C.G. Maritime traffic probabilistic prediction based on ship motion pattern extraction. Reliab. Eng. Syst. Saf. 2022, 217, 108061. [Google Scholar] [CrossRef]
  10. Dalsnes, B.R.; Hexeberg, S.; Flåten, A.L.; Eriksen, B.-O.H.; Brekke, E.F. The neighbor course distribution method with Gaussian mixture models for AIS-based vessel trajectory prediction. In Proceedings of the 2018 21st International Conference on Information Fusion (FUSION), Cambridge, UK, 10–13 July 2018; pp. 580–587. [Google Scholar]
  11. Zhang, C.; Bin, J.; Wang, W.; Peng, X.; Wang, R.; Halldearn, R.; Liu, Z. AIS data driven general vessel destination prediction: A random forest based approach. Transp. Res. Part C Emerg. Technol. 2020, 118, 102729. [Google Scholar] [CrossRef]
  12. Murray, B.; Perera, L.P. A dual linear autoencoder approach for vessel trajectory prediction using historical AIS data. Ocean Eng. 2020, 209, 107478. [Google Scholar] [CrossRef]
  13. Herrero, D.A.; Pedroche, D.S.; Herrero, J.G.; López, J.M.M. AIS trajectory classification based on IMM data. In Proceedings of the 2019 22th International Conference on Information Fusion (FUSION), Ottawa, ON, Canada, 2–5 July 2019; pp. 1–8. [Google Scholar]
  14. Zhang, Z.-G.; Yin, J.-C.; Wang, N.-N.; Hui, Z.-G. Vessel traffic flow analysis and prediction by an improved PSO-BP mechanism based on AIS data. Evol. Syst. 2019, 10, 397–407. [Google Scholar] [CrossRef]
  15. Yu, Q.; Liu, K.; Teixeira, A.P.; Soares, C.G. Assessment of the Influence of Offshore Wind Farms on Ship Traffic Flow Based on AIS Data. J. Navig. 2020, 73, 131–148. [Google Scholar] [CrossRef]
  16. Liu, C.; Liu, J.; Zhou, X.; Zhao, Z.; Wan, C.; Liu, Z. AIS data-driven approach to estimate navigable capacity of busy waterways focusing on ships entering and leaving port. Ocean Eng. 2020, 218, 108215. [Google Scholar] [CrossRef]
  17. Chen, X.; Ling, J.; Wang, S.; Yang, Y.; Luo, L.; Yan, Y. Ship detection from coastal surveillance videos via an ensemble Canny-Gaussian-morphology framework. J. Navig. 2021, 74, 1252–1266. [Google Scholar] [CrossRef]
  18. Yang, D.; Wu, L.; Wang, S.; Jia, H.; Li, K.X. How big data enriches maritime research–a critical review of automatic identification system (AIS) data applications. Transp. Rev. 2019, 39, 755–773. [Google Scholar] [CrossRef]
  19. Yan, H.; Cui, Z.; Chen, X.; Ma, X. Distributed Multi-Agent Deep Reinforcement Learning for Multi-Line Dynamic Bus Timetable Optimization; IEEE: Manhattan, NY, USA, 2022; p. 1. [Google Scholar] [CrossRef]
  20. Kurekin, A.A.; Loveday, B.R.; Clements, O.; Quartly, G.D.; Miller, P.I.; Wiafe, G.; Adu Agyekum, K. Operational monitoring of illegal fishing in Ghana through exploitation of satellite earth observation and AIS data. Remote Sens. 2019, 11, 293. [Google Scholar] [CrossRef]
  21. Xiao, G.; Wang, T.; Chen, X.; Zhou, L. Evaluation of Ship Pollutant Emissions in the Ports of Los Angeles and Long Beach. J. Mar. Sci. Eng. 2022, 10, 1206. [Google Scholar] [CrossRef]
  22. Doğan, E. LSTM training set analysis and clustering model development for short-term traffic flow prediction. Neural Comput. Appl. 2021, 33, 11175–11188. [Google Scholar] [CrossRef]
  23. Chen, X.; Wu, S.; Shi, C.; Huang, Y.; Yang, Y.; Ke, R.; Zhao, J. Sensing Data Supported Traffic Flow Prediction via Denoising Schemes and ANN: A Comparison. IEEE Sens. J. 2020, 20, 14317–14328. [Google Scholar] [CrossRef]
  24. Zhou, Y.; Daamen, W.; Vellinga, T.; Hoogendoorn, S.P. Ship classification based on ship behavior clustering from AIS data. Ocean Eng. 2019, 175, 176–187. [Google Scholar] [CrossRef]
  25. Bai, X.; Cheng, L.; Iris, Ç. Data-driven financial and operational risk management: Empirical evidence from the global tramp shipping industry. Transp. Res. Part E Logist. Transp. Rev. 2022, 158, 102617. [Google Scholar] [CrossRef]
  26. Duan, H.; Ma, F.; Miao, L.; Zhang, C. A semi-supervised deep learning approach for vessel trajectory classification based on AIS data. Ocean Coast. Manag. 2022, 218, 106015. [Google Scholar] [CrossRef]
  27. Venturini, G.; Iris, Ç.; Kontovas, C.A.; Larsen, A. The multi-port berth allocation problem with speed optimization and emission considerations. Transp. Res. Part D Transp. Environ. 2017, 54, 142–159. [Google Scholar] [CrossRef]
  28. Toscano, D.; Murena, F.; Quaranta, F.; Mocerino, L. Assessment of the impact of ship emissions on air quality based on a complete annual emission inventory using AIS data for the port of Naples. Ocean Eng. 2021, 232, 109166. [Google Scholar] [CrossRef]
  29. Chen, X.; Ling, J.; Yang, Y.; Zheng, H.; Xiong, P.; Postolache, O.; Xiong, Y. Ship Trajectory Reconstruction from AIS Sensory Data via Data Quality Control and Prediction. Math. Probl. Eng. 2020, 2020, 7191296. [Google Scholar] [CrossRef]
  30. Xueqing, Z.; Zhansong, Z.; Chaomo, Z. Bi-LSTM Deep Neural Network Reservoir Classification Model Based on the Innovative Input of Logging Curve Response Sequences. IEEE Access 2021, 9, 19902–19915. [Google Scholar] [CrossRef]
  31. Kashinath, S.A.; Mostafa, S.A.; Mustapha, A.; Mahdin, H.; Lim, D.; Mahmoud, M.A.; Mohammed, M.A.; Al-Rimy, B.A.S.; Fudzee, M.F.M.; Yang, T.J. Review of data fusion methods for real-time and multi-sensor traffic flow analysis. IEEE Access 2021, 9, 51258–51276. [Google Scholar] [CrossRef]
  32. Wu, Y.; Tan, H.; Qin, L.; Ran, B.; Jiang, Z. A hybrid deep learning based traffic flow prediction method and its understanding. Transp. Res. Part C Emerg. Technol. 2018, 90, 166–180. [Google Scholar] [CrossRef]
  33. Chen, C.; Liu, Z.; Wan, S.; Luan, J.; Pei, Q. Traffic Flow Prediction Based on Deep Learning in Internet of Vehicles. IEEE Trans. Intell. Transp. Syst. 2021, 22, 3776–3789. [Google Scholar] [CrossRef]
  34. Alahi, A.; Goel, K.; Ramanathan, V.; Robicquet, A.; Fei-Fei, L.; Savarese, S. Social lstm: Human trajectory prediction in crowded spaces. In Proceedings of the IEEE Conference on Computer Vision and Pattern Recognition, Las Vegas, NV, USA, 27–30 June 2016; pp. 961–971. [Google Scholar]
  35. Gupta, A.; Johnson, J.; Fei-Fei, L.; Savarese, S.; Alahi, A. Social gan: Socially acceptable trajectories with generative adversarial networks. In Proceedings of the IEEE Conference on Computer Vision and Pattern Recognition, Salt Lake City, UT, USA, 18–23 June 2018; pp. 2255–2264. [Google Scholar]
Figure 1. Overview for the Bi-LSTM model.
Jmse 10 01314 g001
Figure 2. Performance of the ship trajectory prediction segment comparison for different models.
Jmse 10 01314 g002
Figure 3. Bi-LSTM model prediction performance for different ships.
Jmse 10 01314 g003
Figure 4. LSTM model prediction performance for different ships.
Jmse 10 01314 g004
Figure 5. SOC-LSTM model prediction performance for different ships.
Jmse 10 01314 g005
Figure 6. SOC-GAN model prediction performance for different ships.
Jmse 10 01314 g006
Table 1. Overview of platform setups.
hardwareCPUIntel(R) Core (TM) i7–8750H
frequency2.2 GHz
RAM16 G
GPUNVIDA GeForce GTX 1050 Ti
softwareOSWindows 10
languagePython 3.6
deep learning frameworktensoflow1.14/Keras 2.2.5
CUDA version10.1
Table 2. Crucial parameter settings for the proposed trajectory prediction framework.
EpochLearning RateBatch Size
20001.00 × 10−464
Table 3. Network parameter settings for different models.
ModelInput Feature NumberHidden Layer NodeShip Number
Bi-LSTM24200single-ship
8200multiple-ship
LSTM48120single-ship
24120multiple-ship
SOC-LSTM48128single-ship
24128multiple-ship
SOC-GAN4864single-ship
2464multiple-ship
Table 4. Ship trajectory segment prediction performance on latitude data samples.
Ground TruthBi-LSTMLSTMSOC-LSTMSOC-GAN
32.0022232.0022132.0021932.0016832.00216
32.0022032.0021932.0021732.0016232.00200
32.0021832.0021732.0021532.0015432.00175
32.0021632.0021432.0021332.0012632.00155
32.0021432.0021332.0021132.0011732.00153
32.0021132.0021032.0020932.0010132.00153
32.0020832.0020732.0020732.0007632.00124
Table 5. Ship trajectory segment prediction performance on longitude data samples.
Ground TruthBi-LSTMLSTMSOC-LSTMSOC-GAN
120.66696120.66694120.66698120.66661120.66724
120.66682120.66679120.66684120.66634120.66722
120.66668120.66665120.66669120.66605120.66687
120.66654120.66649120.66656120.6657120.66670
120.66639120.66637120.66642120.66528120.66689
120.66625120.66622120.66629120.66480120.66666
120.66611120.66606120.66618120.66456120.66652
Table 6. Statistical indicator distributions for ship trajectory prediction.
MAEMAPEMSE
Bi-LSTM4.66 × 10−56.74 × 10−51.43 × 10−9
LSTM5.76 × 10−51.15 × 10−41.94 × 10−9
SOC-LSTM4.46 × 10−48.66 × 10−44.63 × 10−7
SOC-GAN1.64 × 10−14.13 × 10−47.79 × 10−2
Table 7. Statistical indicator distributions for multiple ship trajectory prediction.
MAEMAPEMSE
Bi-LSTM6.46 × 10−59.07 × 10−53.98 × 10−9
LSTM1.87 × 10−41.31 × 10−41.02 × 10−8
SOC-LSTM3.57 × 10−47.98 × 10−43.31 × 10−7
SOC-GAN1.70 × 10−43.40 × 10−47.44 × 10−8
Publisher’s Note: MDPI stays neutral with regard to jurisdictional claims in published maps and institutional affiliations.

