Abstract
Since the 1970s, artificial reef (AR) deployment has been one of the common approaches to augment the local production of coastal fish in Malaysia. However, there is a lack of strategy to assess and evaluate the success of pre-deployed AR. Realizing the need for an effective qualitative and quantitative monitoring and evaluation of AR, this study proposes side-scan sonar coupled with scuba diving observation for the enhanced monitoring of pre-deployed Bioceramic Korean (BK) AR along the coast of Terengganu, Peninsular Malaysia. This method employs an integrated side-scan sonar with a data acquisition system for the detection of the precise location of the BK AR which were deployed at Tukun Telaga Batin off the Terengganu coastline in 2003 by the Fisheries Development Authority of Malaysia (FDAM). Following the determination of the exact location of three BK AR areas, a scuba diving team was sent to survey the physical conditions of the AR and assess the feasibility of the AR as an artificial habitat for marine life. The scan sonar images were compared with the captured photographs and videos acquired during the scuba diving session for a comprehensive value-added assessment. The collected data from the scuba diving session were also processed to measure the fish diversity, the fish biomass, and identify the fish community surrounding the AR. Based on the results, the BK AR remained in extremely good condition, physically intact, without significant breakage or damage, and with no major subsidence into the sediment after 19 years of deployment. A total of 108 BK AR modules were detected in three large groups using the mosaicked sonar images. Following cross-examination to validate the AR measurements using the AR’s shadows on the seafloor, the height of the BK AR consistently ranged from 1.7 m to 1.8 m. In addition, 34 species of fish from 14 families and 26 genera were identified, with most species classified as reef-associated (RA) fish with a biomass value of 1173.31 ± 1136.69 kg m−3, indicating the successfulness of the BK AR as fish-aggregating devices (FADs). The growth of hard corals on top of the bioceramic plate of the AR module further supported the diversified community of marine life surrounding the BK AR. In conclusion, the side-scan sonar coupled with scuba diving observation demonstrates an effective qualitative and quantitative technique for the monitoring and evaluation of pre-deployed AR. This strategy is recommended to be utilized to determine the success of pre-deployment AR.
1. Introduction
The development of artificial benthic habitats has been a long-standing global venture to enhance coastal fishery resources. The main aim of developing an artificial reef (AR) is to provide a suitable shelter ground for fish and increase fish biomass, thus contributing to the fishing and recreational industries [1]. Past studies have shown that the deployment of AR not only improves both the cost of fishing practices (by reducing the displacement costs for nearby coastal fleets) and economic benefits through the tourism sector via diving and recreational fishing [2,3,4,5], but also provides an alternative approach to forestall coastline erosion [6,7,8,9]. Benefitting from rapid advancements in technology, AR have undergone tremendous development with numerous unique designs in terms of sizes, shapes, and materials, such as concrete and ceramics. In addition, developed AR modules are often deployed at selected locations to enhance the various life stages of specific species [10,11,12].
In many regions of the world, including Malaysia, coastal waters are reserved as substantial fish breeding grounds and restricted to artisanal fishers only. In a previous survey involving the data collection of research vessels, conducted on the west coast of Peninsular Malaysia, the average catch rate recorded a drastic drop of 50% from 131.1 kg h−1 in December 1970 to 58.9 kg h−1 by December 1980 [13]. In view of the alarming decline in catch rate, the Malaysian government immediately addressed the issue by deploying AR to enhance fishery resources in potential fishing ground areas. The first AR site was established on the East Coast of Peninsular Malaysia on 26 May 1978 near Pulau Pisang in Johor using discarded tyres, followed by another setup at Pulau Ekor Tebu in Terengganu on 22 June 1979 [14]. By 1993, over three million tyres were used to develop AR in Malaysia, with 60% of them deployed on the east coast of Peninsular Malaysia [15]. The experience and knowledge gained since 1975 were then applied to coordinate effective planning and management of the AR program through two federal agencies, namely, the Department of Fisheries of Malaysia (DOFM) and Fisheries Development Authorities of Malaysia (FDAM). The total expenditure for the AR program from 1976 to 2010 was approximately RM 154.7 million [16].
While continuous efforts have been taken to deploy more AR, there are a lack of monitoring programs conducted to evaluate the effectiveness of AR for better development and productivity. A post-deployment study is crucial to determine the condition of the deployed AR’s structure and the habitat status in the target areas. Various techniques have been established to locate the position of AR and monitor their performance, which include scuba diving, video towing, fish finders, side-scan sonars, and multibeam echosounder surveys [17,18]. The most widely used technique to monitor and assess the productivity of AR is through camera photos and videos taken by scuba divers, where the fish population, fish aggregations, and benthic habitat properties are recorded [19,20,21].
However, underwater searching by divers is time-consuming and poses certain risk factors to the divers, particularly due to the issues of diving deepness, limited visibility, unexpected currents, and underwater obstructions [22,23]. The tracking and finding of the deployed AR are more challenging at deep-water AR locations. The application of remote operating vehicles (ROVs) to video-monitor and assess AR in estuaries in the AR environment also faces similar complexities and challenges [24,25,26]. Although ROVs can access deeper water areas with cost-efficient operation, the method is limited by water visibility. In contrast, the fish finder method is another inexpensive and easy method to search and relocate AR using a simple system. However, the downside of this method is the inability to produce comprehensive imaging of the structure and provide actual pictures of the AR [27].
Currently, side-scan sonar is considered the most preferable technique to monitor both artificial benthic habitats and natural benthic habitats [28,29,30,31,32,33,34] given its reliable performance to locate and characterize AR structures [22,35]. Collier et al. [29] stated that the side-scan sonar is an excellent tool to assess the structure of AR following years of deployment on the seafloor. Furthermore, the method provides real-time imaging of the geographic reference of the reef modules with acceptable quality, which allows researchers to decide on how to survey future block deployments across large areas [36]. Additional reports on its applications related to fishery studies were given by Johnson et al. [37] and Kros et al. [38]. The application of the side-scan technique is also widely used in hydrographic surveys [39,40], archaeology mapping [41,42], seafloor mapping and marine geology [43,44], and physical oceanography [45].
However, relying solely on sonar images is not preferable for AR monitoring, as other information is crucial for the determination of AR’s performance. For example, photographs and videos collected during scuba diving sessions provide a fine-scale assessment rather than broad-scale evaluation by acoustic survey [46,47]. Meanwhile, sonar images lack the fine detail needed to evaluate the function of AR, which is to protect, enhance, or restore components of the marine ecosystem. Additionally, vital information on ecological components of the AR should be evaluated since the structural complexity of the seafloor is crucial for the development of new habitats for marine organisms, such as fishes and coral surveys [46,47].
In line with the continuous effort by the Malaysian government to monitor the effectiveness of AR for sustainable fishery management, this study proposes the side-scan sonar technique coupled with the scuba diving method as a qualitative and quantitative approach to locate and assess the fish assemblages at the pre-deployed Bioceramic Korean (BK) AR along the east coast of Peninsular Malaysia, particularly the coast of Terengganu state, deployed in 2003 by FDAM [35,48]. The five-day assessment of the BK AR includes the evaluation of the physical condition and structural integrity (intact or broken) of the AR based on side-scan sonar images, image validation of the underwater side-scan sonar pictures, and the examination of fish assemblages at the AR. Note that a previous study survey at the exact location of the pre-deployed AR was performed in 2006 [49], and is used to compare the assessment in the present study.
2. Materials and Methods
2.1. Study Area
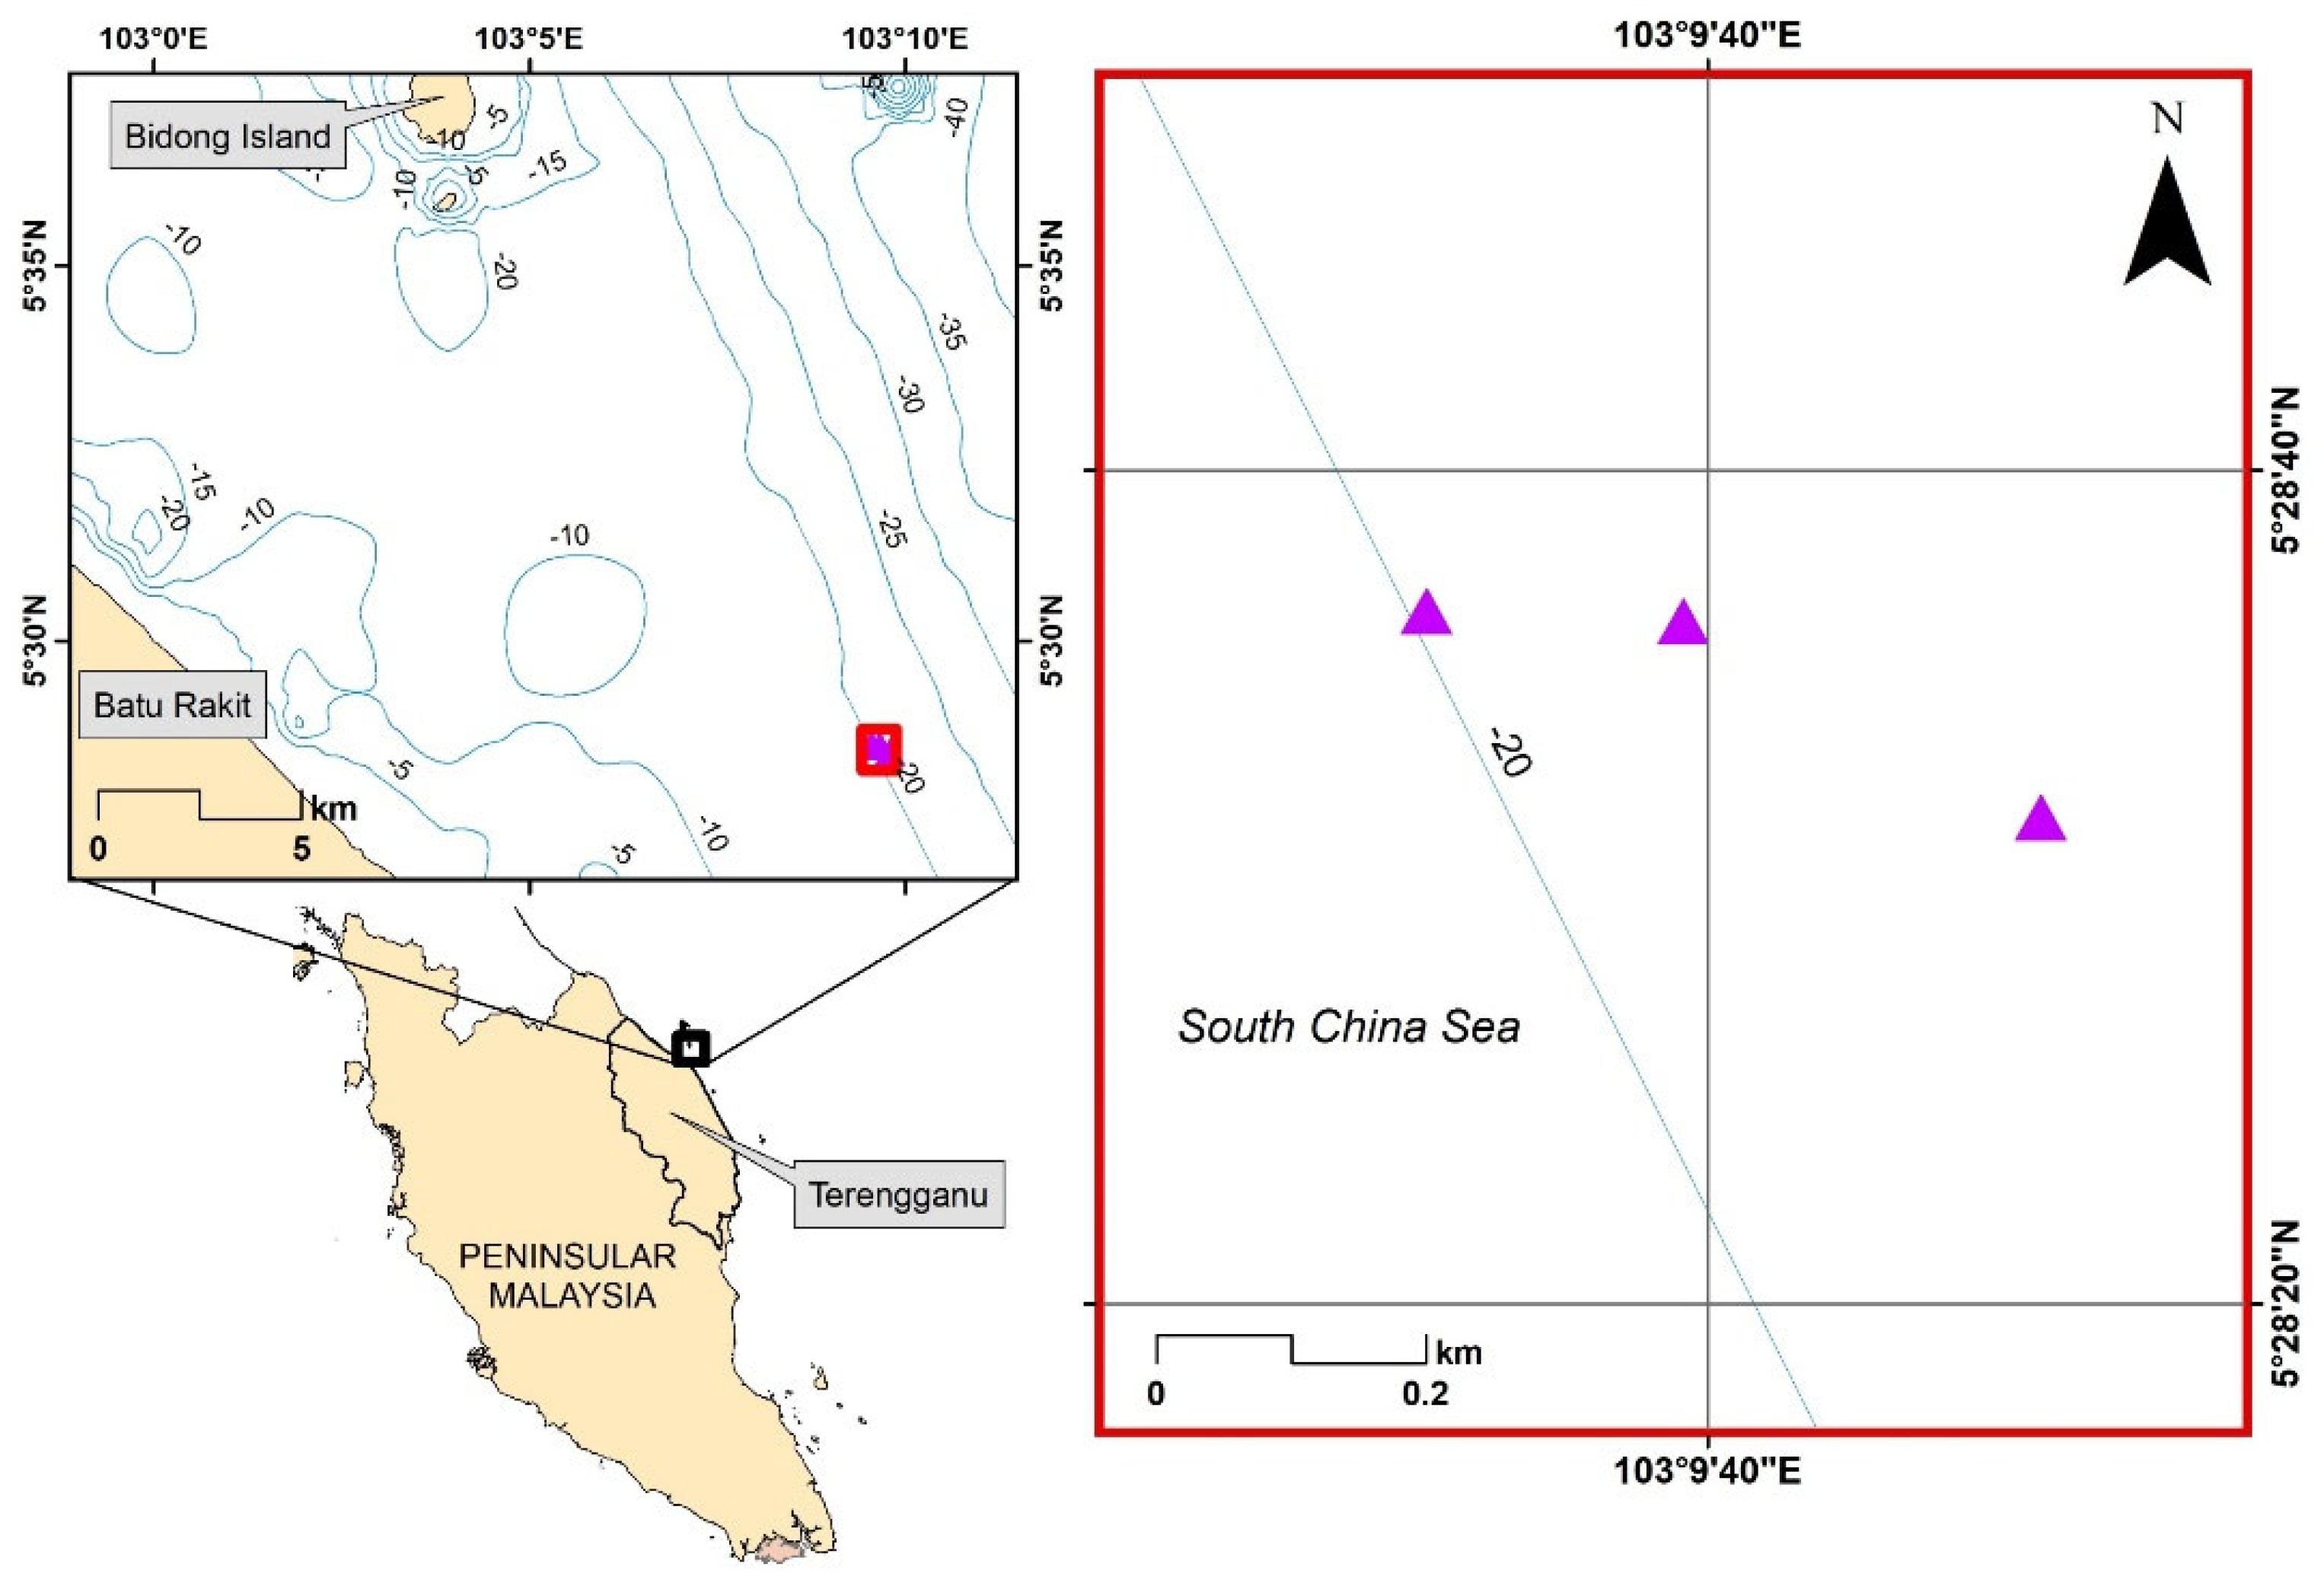
The Terengganu coastline that forms part of the east coast of Peninsular Malaysia was selected as the study area. In 2003, a total of 180 BK AR modules were deployed at 3 specific areas at a depth of 21 m below sea level across Tukun Telaga Batin, which is 6 nautical miles (nmi) off the Terengganu coastline (Figure 1). The area is influenced by two monsoon seasons, the northeast monsoon (November to March) and the southwest monsoon (May to September). The region has an average depth range of 15–45 m, an average water temperature range of 29–32 °C, and a varying salinity of 28–35 ppt [50,51]. Two monitoring surveys of the AR have been conducted in the past decade, one from April to June 2006 (3 years after deployment) and one in May 2022 (19 years after deployment). The 2006 survey was the first monitoring effort taken by FDAM to ensure the deployment location of the AR in 2003. In 2006, the survey was conducted using the GeoAcoustics dual-frequency (114/410 kHz) side-scan sonar and visual verification by scuba divers. Meanwhile in this study, we use the side-scan sonar and ground truthing survey via scuba diving.
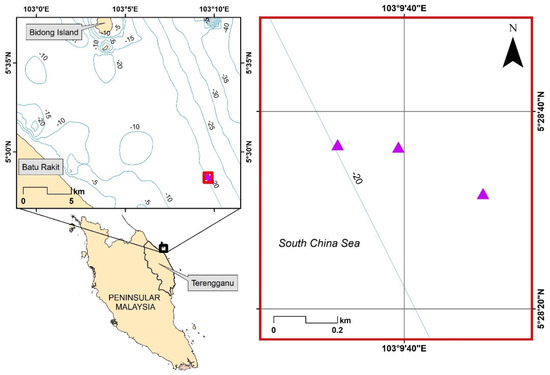
Figure 1.
The three deployment locations of the BK AR across the Tukun Telaga Batin.
2.2. Bioceramic Korean AR Module
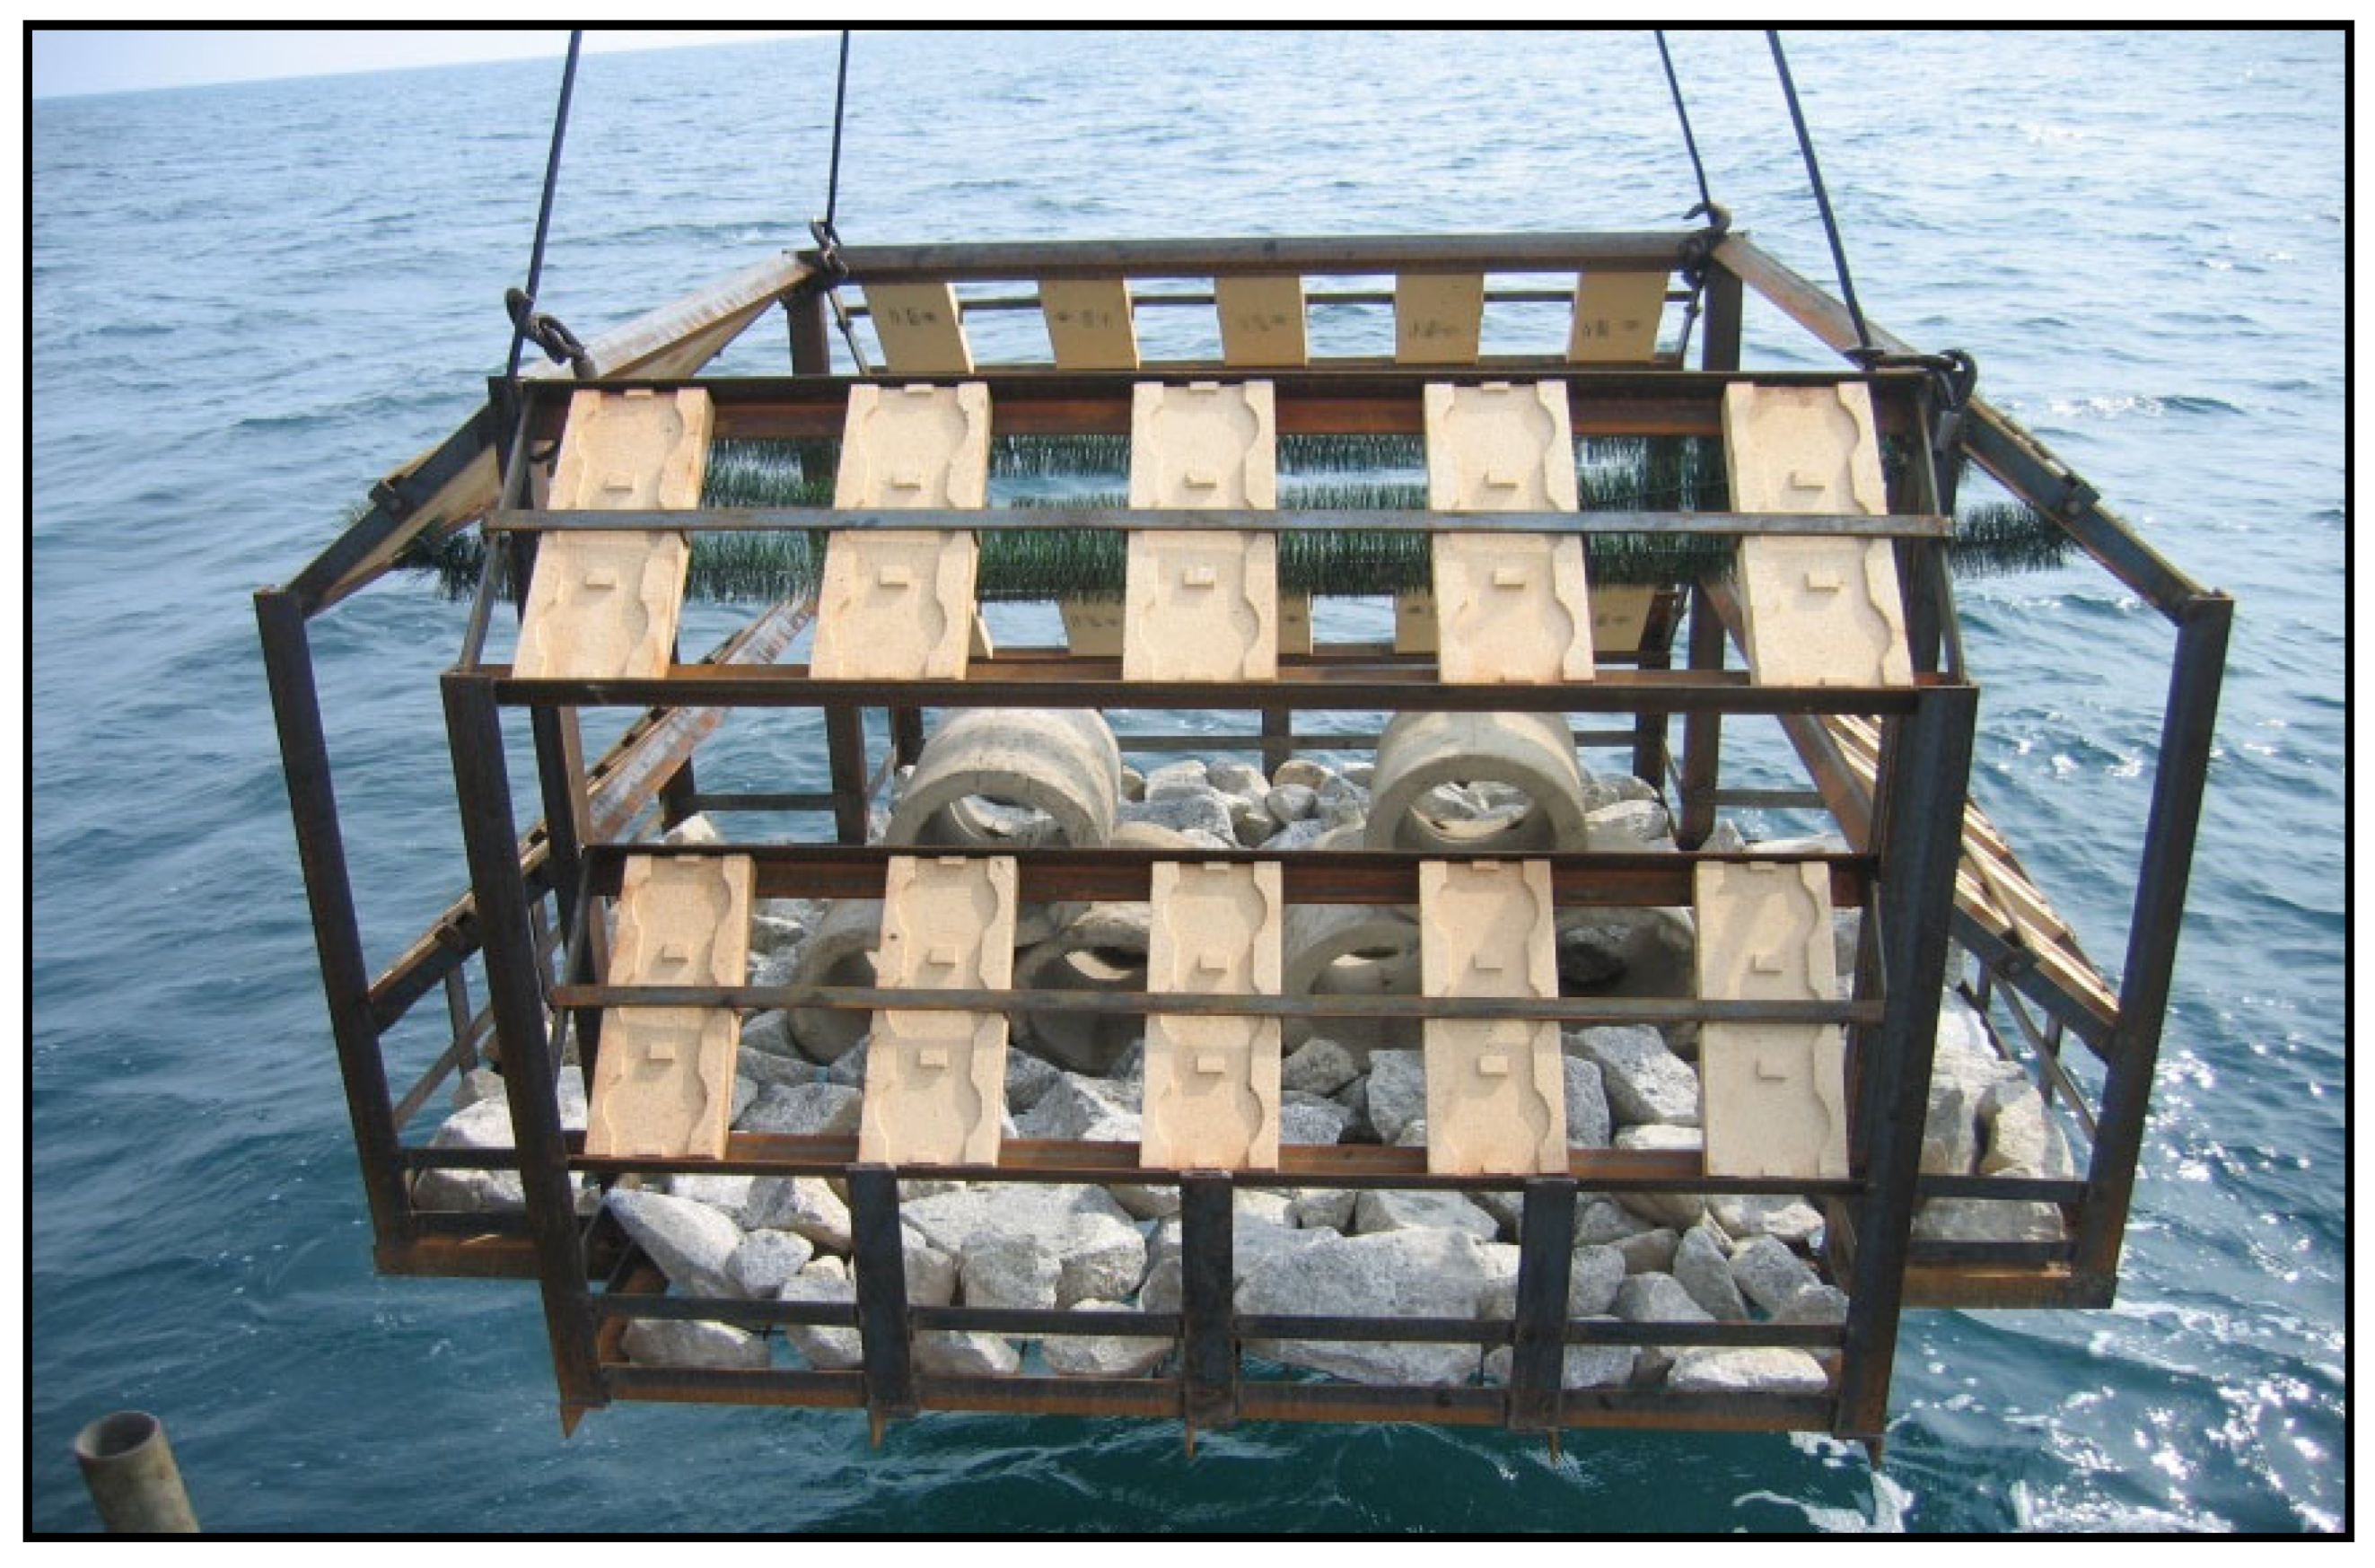
The type of AR module surveyed in this study is the Bioceramic Korean (BK). Figure 2 shows the photograph of the BK AR module during its deployment. The module has an approximate height, width, and length of 1.8 m, 3 m, and 3 m, respectively. The frame was made from steel iron with a ceramic board attached on top of the AR frame. Several cylindrical cuboid units with concrete boulders were placed within the AR module frame.
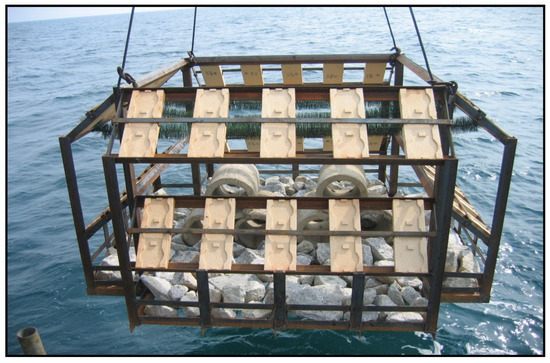
Figure 2.
Photograph of the BK module prior to being deployed at Tukun Telaga Batin off the coast of Terengganu in 2003.
2.3. Side-Scan Sonar Survey
The side-scan sonar system comprises mainly the monitoring unit and a transducer towed at a certain depth using an extended cable attached to the rear of a survey vessel. The system works by transmitting sound pulses into the water to produce echoes or reflections of objects from the seafloor, known as backscatter [52]. The backscatter received by the transducers is then recorded, and varies in intensity based on the density of the material [29]. Subsequently, accurate results are obtained by synchronizing the data acquisition from the sonar and the global positioning system (GPS) navigation, as well as the image processing method. Given that the intensity of the sound pulse depends on the type and material of the detected objects on the seafloor, different materials produce different intensities, which are quantified in terms of the relative decibel (dB) value.
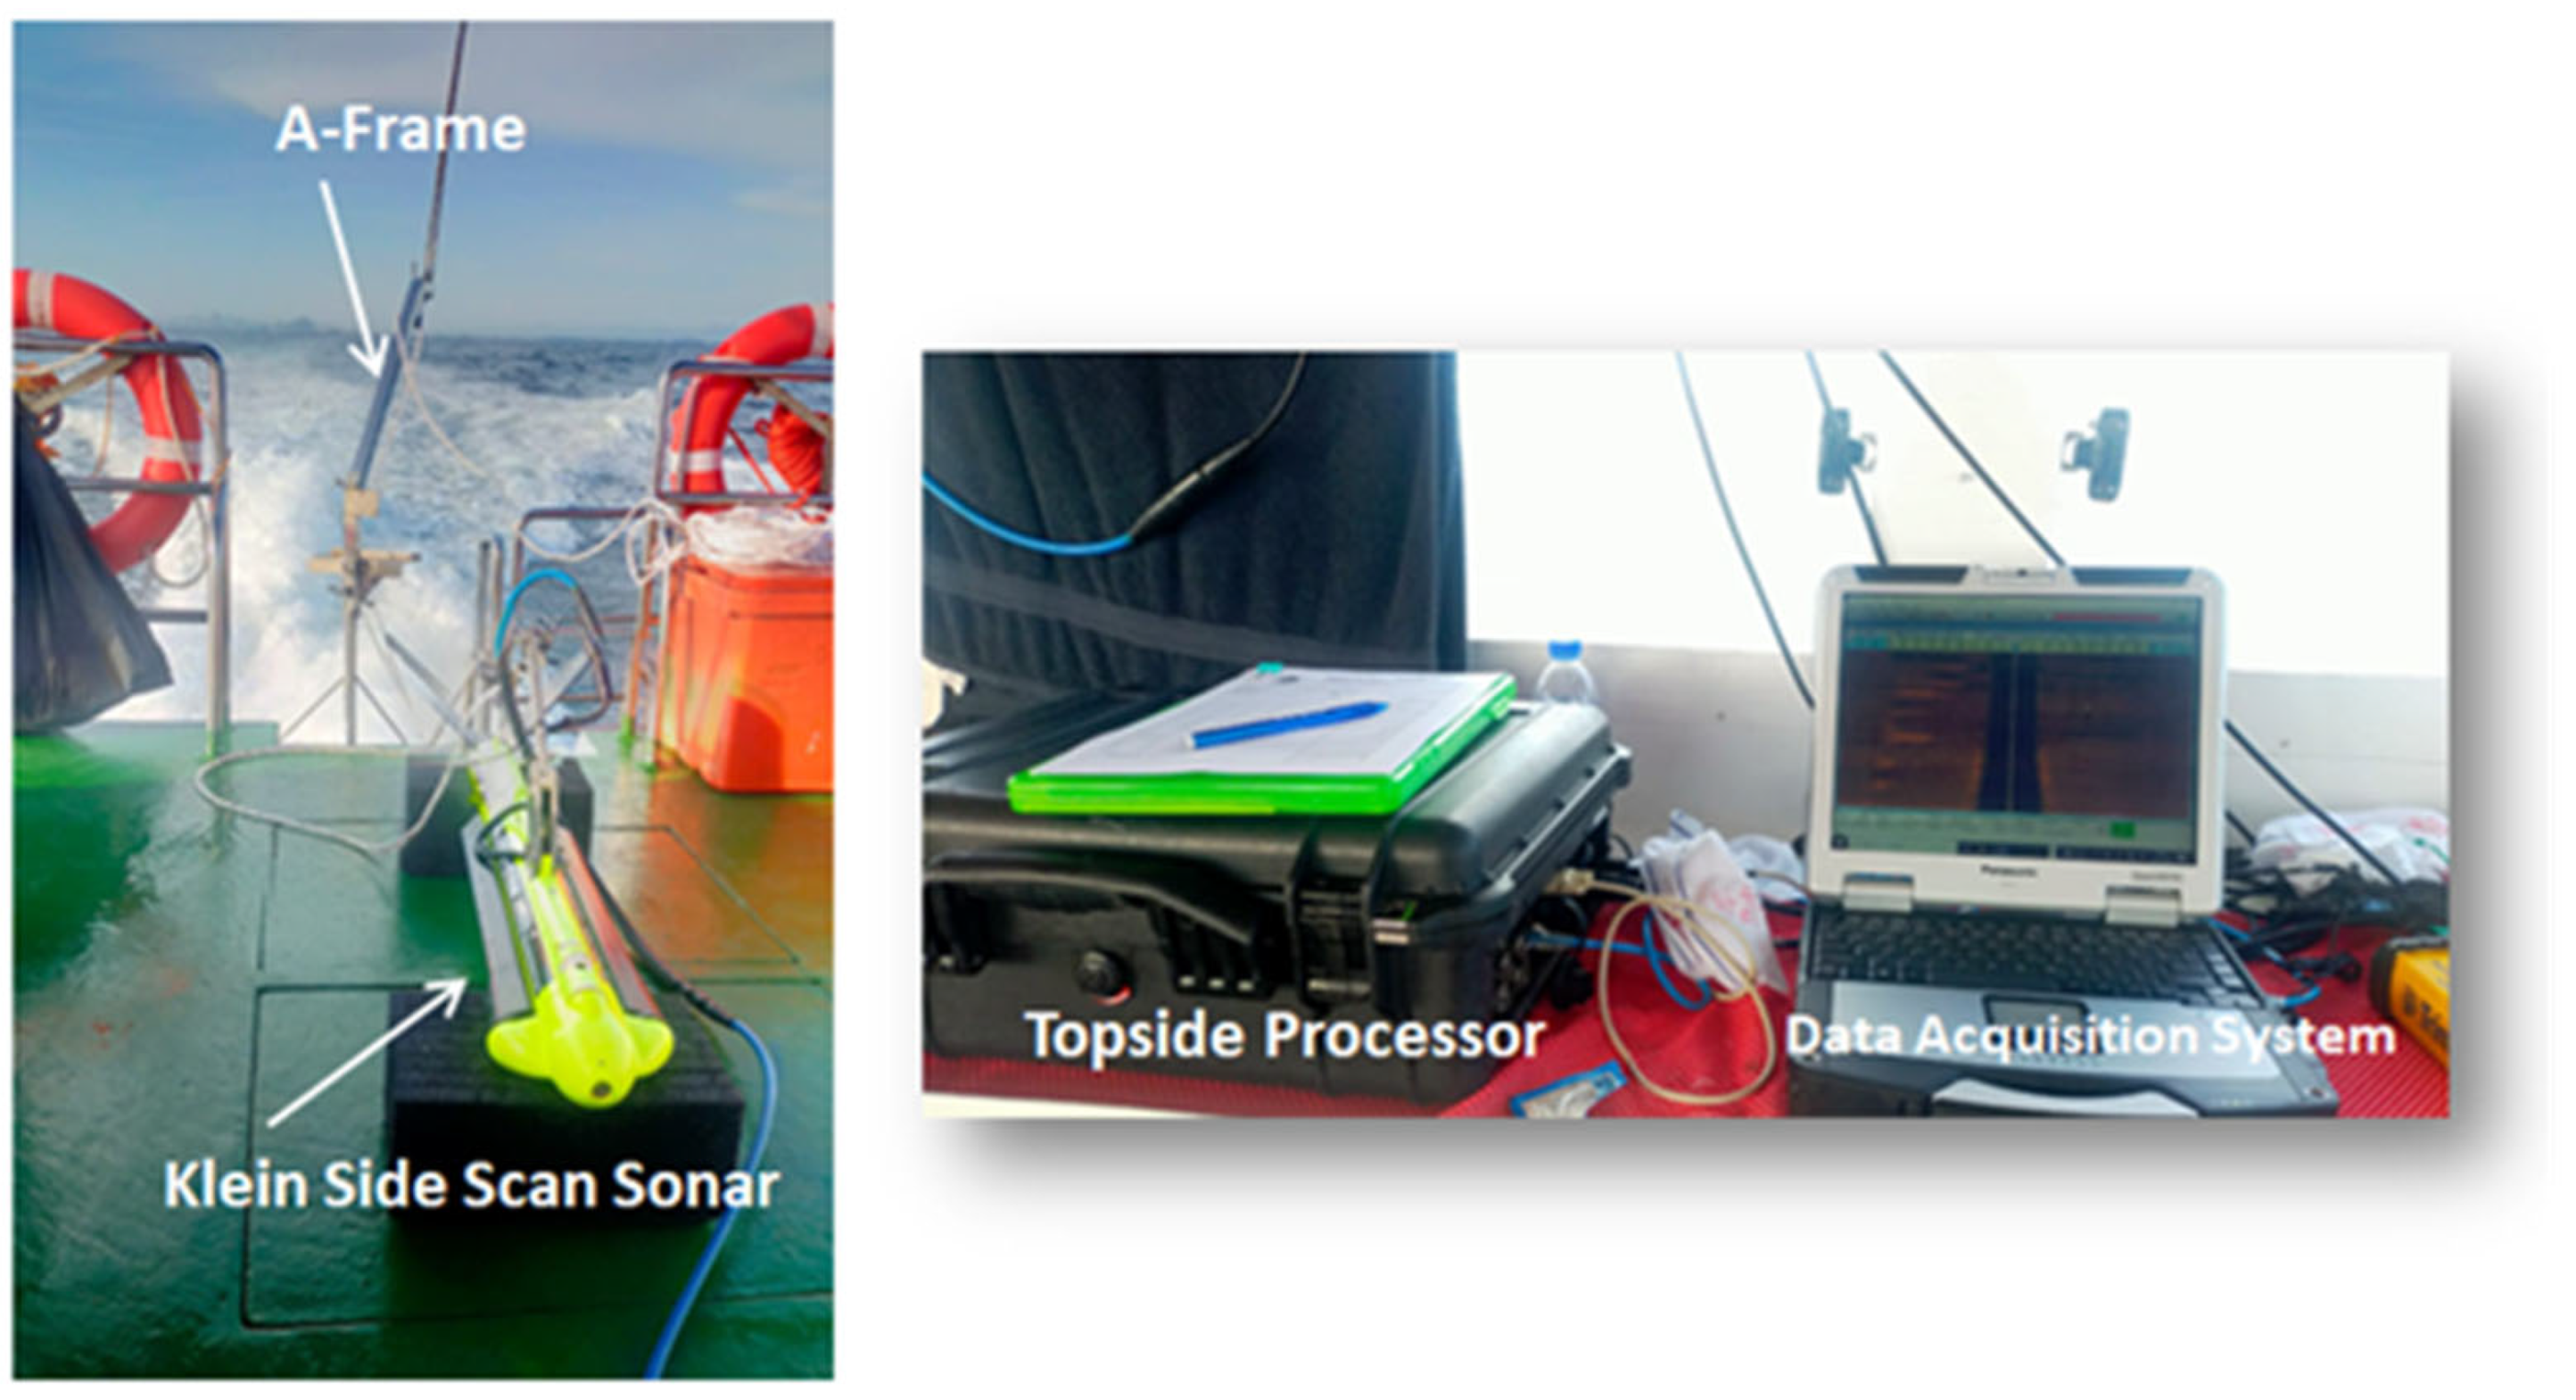
Here, we used the Klein 4900 sonar dual-frequency (455/900 kHz) towfish system for the 2022 monitoring survey (Figure 3). A differential geographic positioning system (DGPS) was also employed for navigation, which utilized an Omnistar 3200 LR12 DGPS receiver with the capability to receive updates at 10 Hz (10 times per second). The setup was integrated with the HypacMax survey software to design the survey planning, which serves as a navigation guide and charting system, in addition to marking the detected AR’s locations. During the survey, the software receives the DGPS signals and applies them to calculate the offset and layback distances between the side-scan transducer and the DGPS antenna. Once the sonar determined the location of the AR and the DGPS pinpointed the exact position, the site was marked using an anchor and buoy.
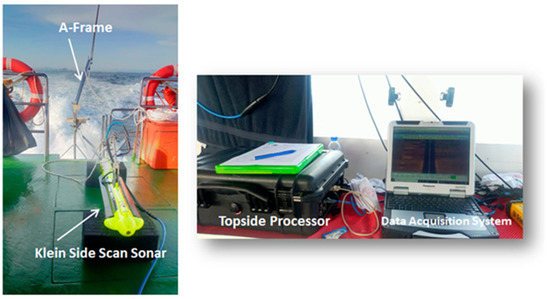
Figure 3.
Side-scan sonar setup on board.
The interval of the survey lines was set at approximately 100 m to ensure 100% coverage of the AR at each site, which covered an area of approximately 2 km2. The sonar system was set up at a high frequency of 900 kHz with 100 microseconds (µs) and a range of 50 m during the data acquisition to scan the AR sites, which covered an area of approximately 1 km2. The vessel was navigated at a constant speed of 5–7 knots to ensure that the towfish was constantly and steadily towed approximately 10 m above the seabed.
The collected sonar data were digitized in the field using a Triton Elias data acquisition system, followed by post-processing to geo-reference each record, corrected for distortion, and assembled side-by-side into a mosaic. Sonarwiz map mosaic software was used to generate the mosaic maps of the AR. The relief of an object can be interpreted by observing the shape of the acoustic shadow produced by the object. Similar to a light shadow, a long shadow indicates a taller object that protrudes from the surrounding surface at a given distance and angle from the transducer (sound source and receiver).
2.4. Ground Truthing
The scuba diving method was employed to assess the changes in the physical condition of the deployed AR compared to their original structure. The physical condition of the AR was assessed following the index table, as proposed by Sheng [53] (Table 1). The index is numbered from 1 (highest degradation) to 5 (minimum/zero degradation) based on the physical condition of the AR. In addition to writing down records of physical changes or damaged parts, photograph and video observations were captured during the diving session for detailed post-diving assessment. The photographs and videos were also used to cross-examine data from the side-scan sonar results.

Table 1.
The AR physical condition evaluation based on the index table adopted from Sheng [53].
2.5. Fish Assemblage Data
2.5.1. Field Survey
The underwater video recording technique (Olympus® Stylus TG-4 Tough and Olympus® Stylus TG-5 Tough) was employed to conduct the fish survey on three units of BK AR during a scuba diving session in May 2022. Basically, each fish that swam inside and within a 3 m radius of each AR was recorded. The data were used to represent the fish assemblages near the AR. A total of 3–6 min of video time was taken for each video recording in the stationary phase to prevent any movement that could interrupt the natural environment of the surrounding area.
The recorded videos were extracted and converted into frames using Video Images Master Pro V1.2.8. The frame areas around the BK AR were fixed at a width and height of 3 m and 3 m, respectively, which produced a coverage area volume of 16.2 m3. A total of 50 video frames were extracted from a single video recording of each AR. The image frames were saved into a .jpg format for compatibility with the image analysis software. All the video frames were processed in DotDot Goose (version 1.5.1) image analysis software to count the total number of individual fish [54]. Fish taxonomics of each species were determined based on the standard fish identification procedures using the Field Guide to Fishes and Crustaceans of the Southeast Asian Region [55], the FishBase website [56], and Reef Fish Identification: Tropical Pacific [57].
The estimated length of the fish was determined using the white buoy as a reference during the video recording. The estimated fish length was applied to calculate the fish biomass according to FishBase [56], which uses the length–weight relationship equation to determine the fish biomass. Finally, the total fish biomass was summed up and denoted in kilogram per cubic meter (kg m−3).
where:
W = weight of fish (g);
L = total length of fish (cm);
a and b = constants for the allometric growth equation (FishBase.org).
2.5.2. Fish Data Analysis
The fish data collected from each station were entered into Microsoft Excel to analyze the fish density and univariate analysis. A summation of the data across rows or columns provided the density of fish expressed as:
where:
ρ = density;
m = total number of individual fish;
V = volume.
The univariate analysis describes the diversity of fish species at each station using the Shannon Diversity Index, H′ [58] ith
where
The Diversity Index values were used to determine the health status of each habitat [59] and compare the diversity of the communities between different habitats. A community with a higher Diversity Index value is generally considered to have a greater abundance of more equitable and diverse species distribution compared to others with a lower Diversity Index value. A more recent study has also used the Diversity Index values to classify the health status of fish habitats [60]. Furthermore, the Pielou Evenness Index, J′, refers to the measure of species biodiversity, which numerically quantifies the distribution level of species in the environment. A smaller species in the community is indicated by a high J′ value (between 0 and 1), while a high-level J′ value indicates that the community exhibit no dominant numerical pattern of distribution among the various species [61]. The J′ value is formulated as follows:
where:
H′ = measured Shannon Diversity Index
S = total number of species
3. Results
3.1. Side-Scan Sonar and Ground Truthing
The quality of the side-scan sonar image depends on several crucial factors, including the acoustic range, sonar frequency, ping rate, angle of insonification, and environmental conditions [61]. For the AR survey, the materials used to construct the AR and the choice of sonar frequency strongly affect the backscatter resolution based on the scattering of the acoustic energy received by the transducer. Apart from that, the morphological characteristics of the surface, the intrinsic nature of the targets, as well as the size and density, significantly contribute to the final image. The composition of AR, which are mostly made of concrete (sand, cement, and steel), are represented as rigid structures with comparatively high density and are sufficiently recognizable compared to seabed materials due to the stronger reflection of acoustic energy.
Achieving 100% accuracy for the AR location was impossible due to the influence of current that may have affected the pitch and roll of the towfish. Potential errors were also considered during the survey, including noise interferences from other electrical equipment, the engine, the radio, cable faults, and propellers. Hence, the scan range was initially set at 75 m before resetting the scan range to 50 m once AR were detected to enable closer and higher image resolution. In this case, the layback was set between 13 and 15 m to correct the actual DGPS antenna location on the survey vessel. The closest line to the target location was labelled as the first survey line to reduce the cost and survey time. Generally, the AR detected at close range would show a sufficient image resolution.
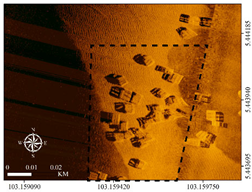
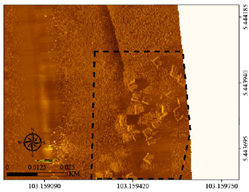
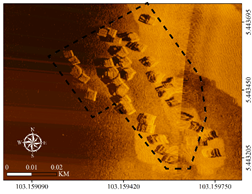
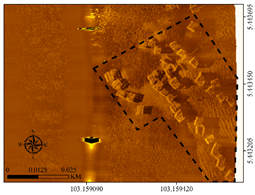
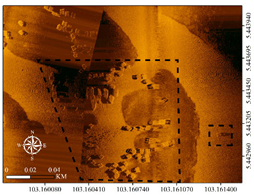
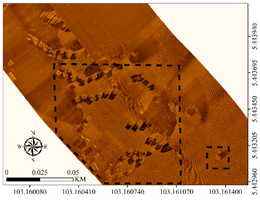
The sonar images from 2006 and 2022 revealed that the BK AR were intact without any significant breakage or damage. The presence of scouring was also detected around the AR’s structure, although it was considered minor and negligible since this did not compromise the main function of the AR as a fish shelter. The results also confirmed that the surveyed locations of the AR were identical to the deployment location in 2003, as shown in Table 2. Hence, no significant difference was observed between the scan results conducted in both years. The distribution of AR remained within the same range between 1200 m2 and 6000 m2 in different clusters without major breakdown due to the base current.

Table 2.
Mosaicked sonar imagery of BK AR from 2006 and 2022 survey. The bounding box (black dotted lines) indicates the area that the BK AR can be confidently crosschecked between the two surveys.
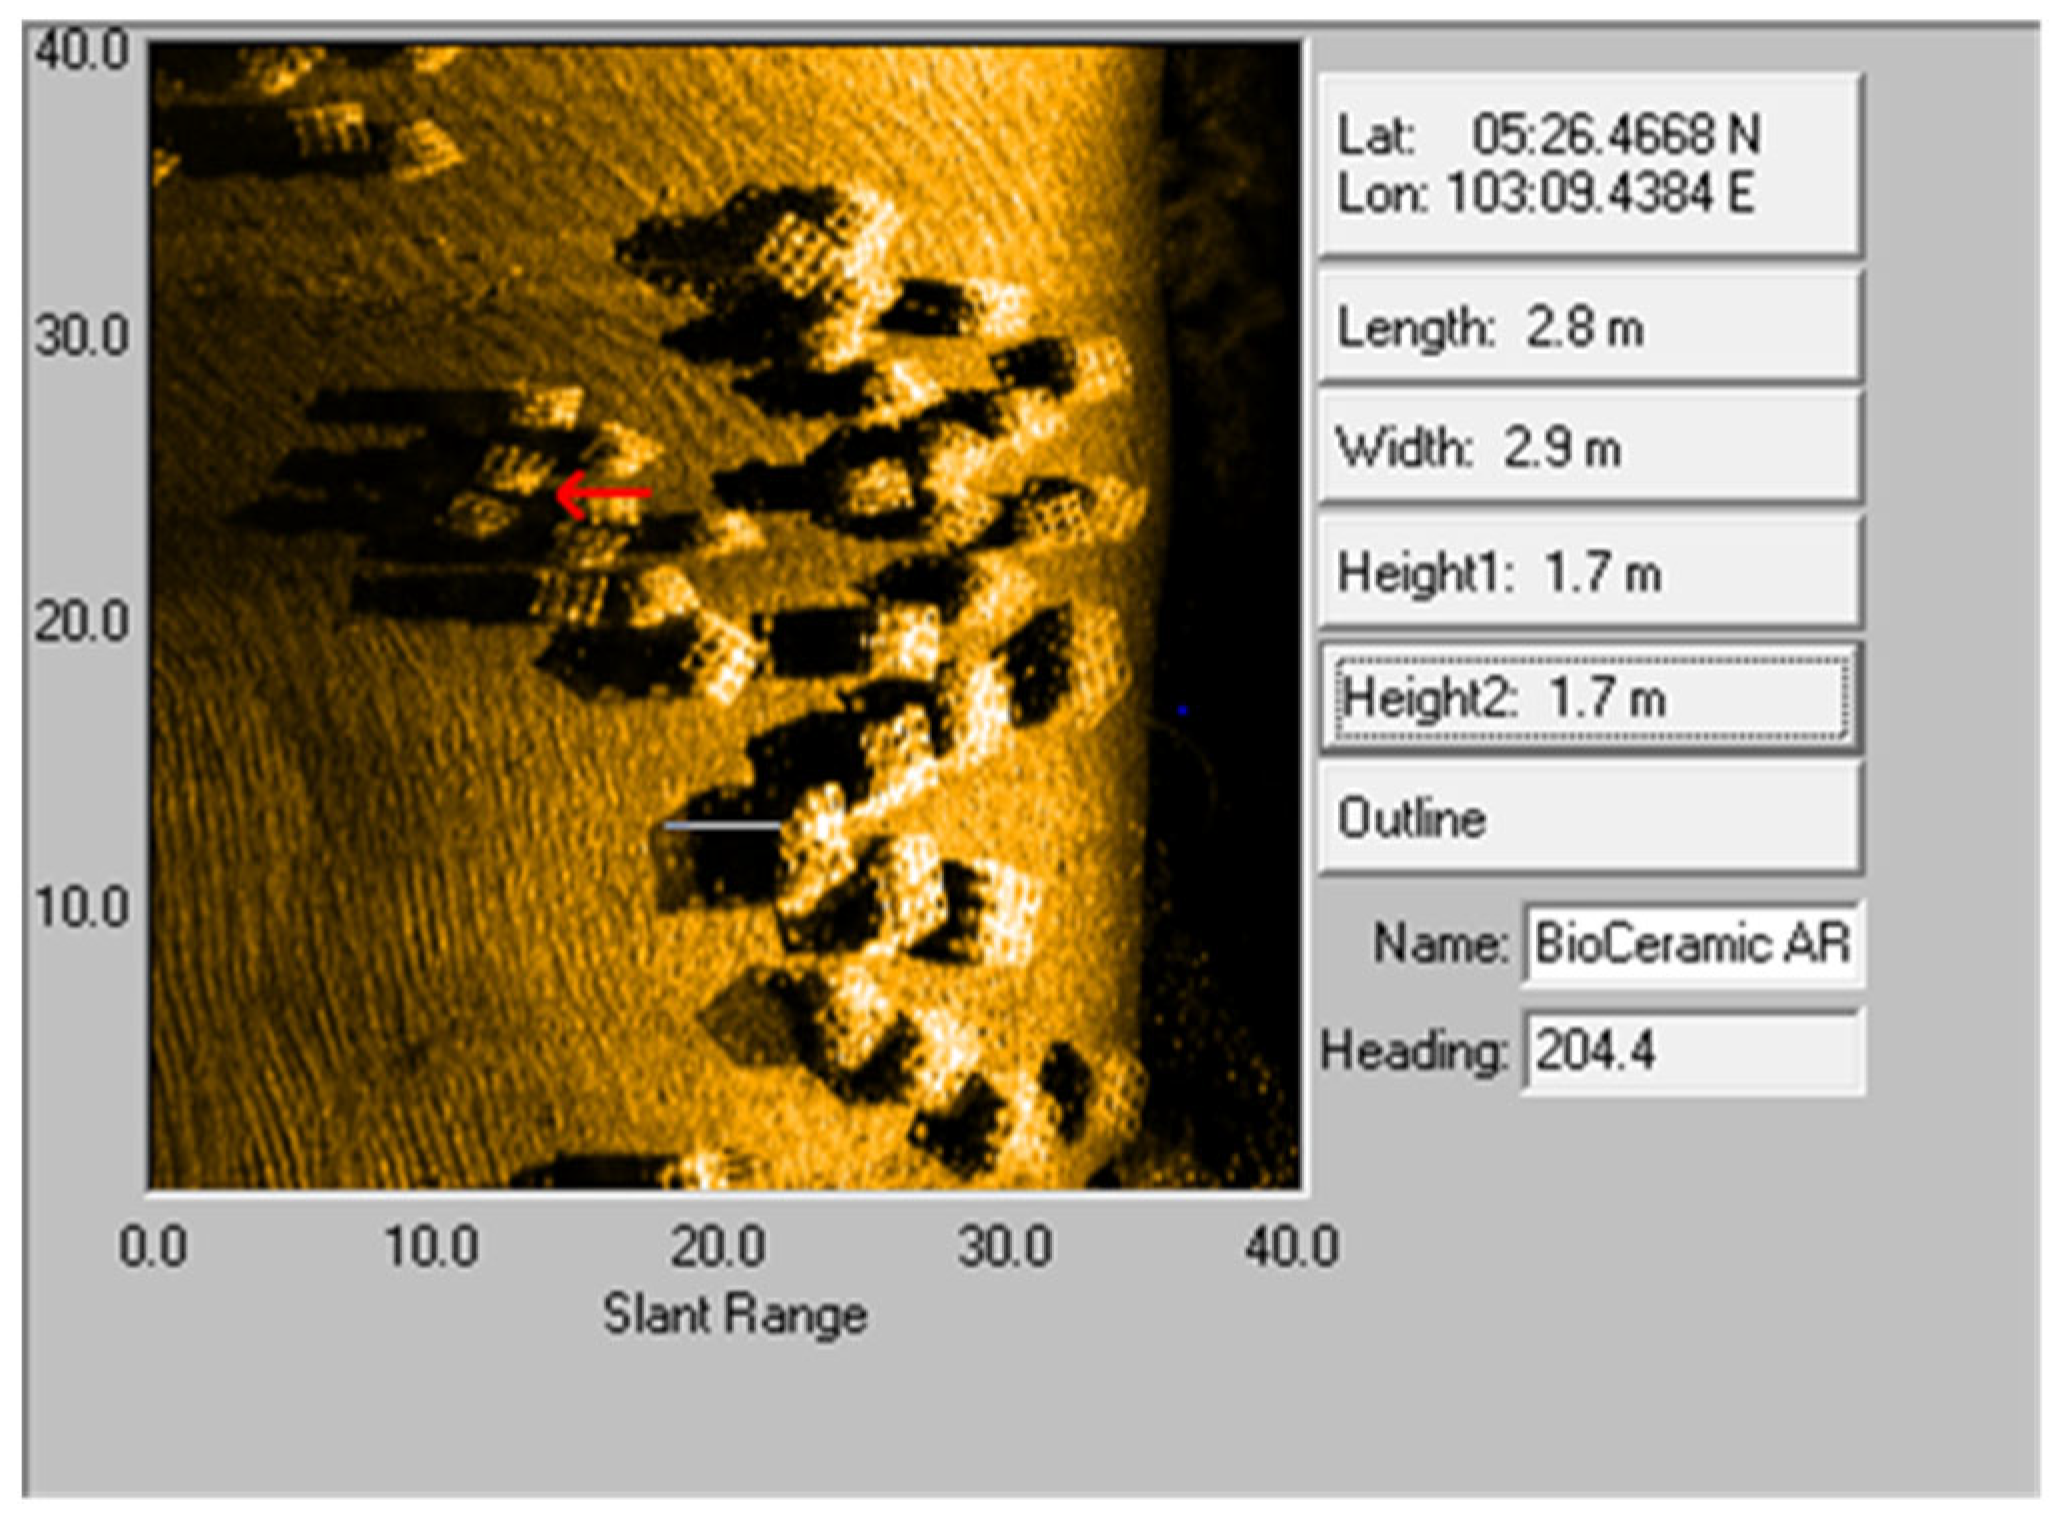
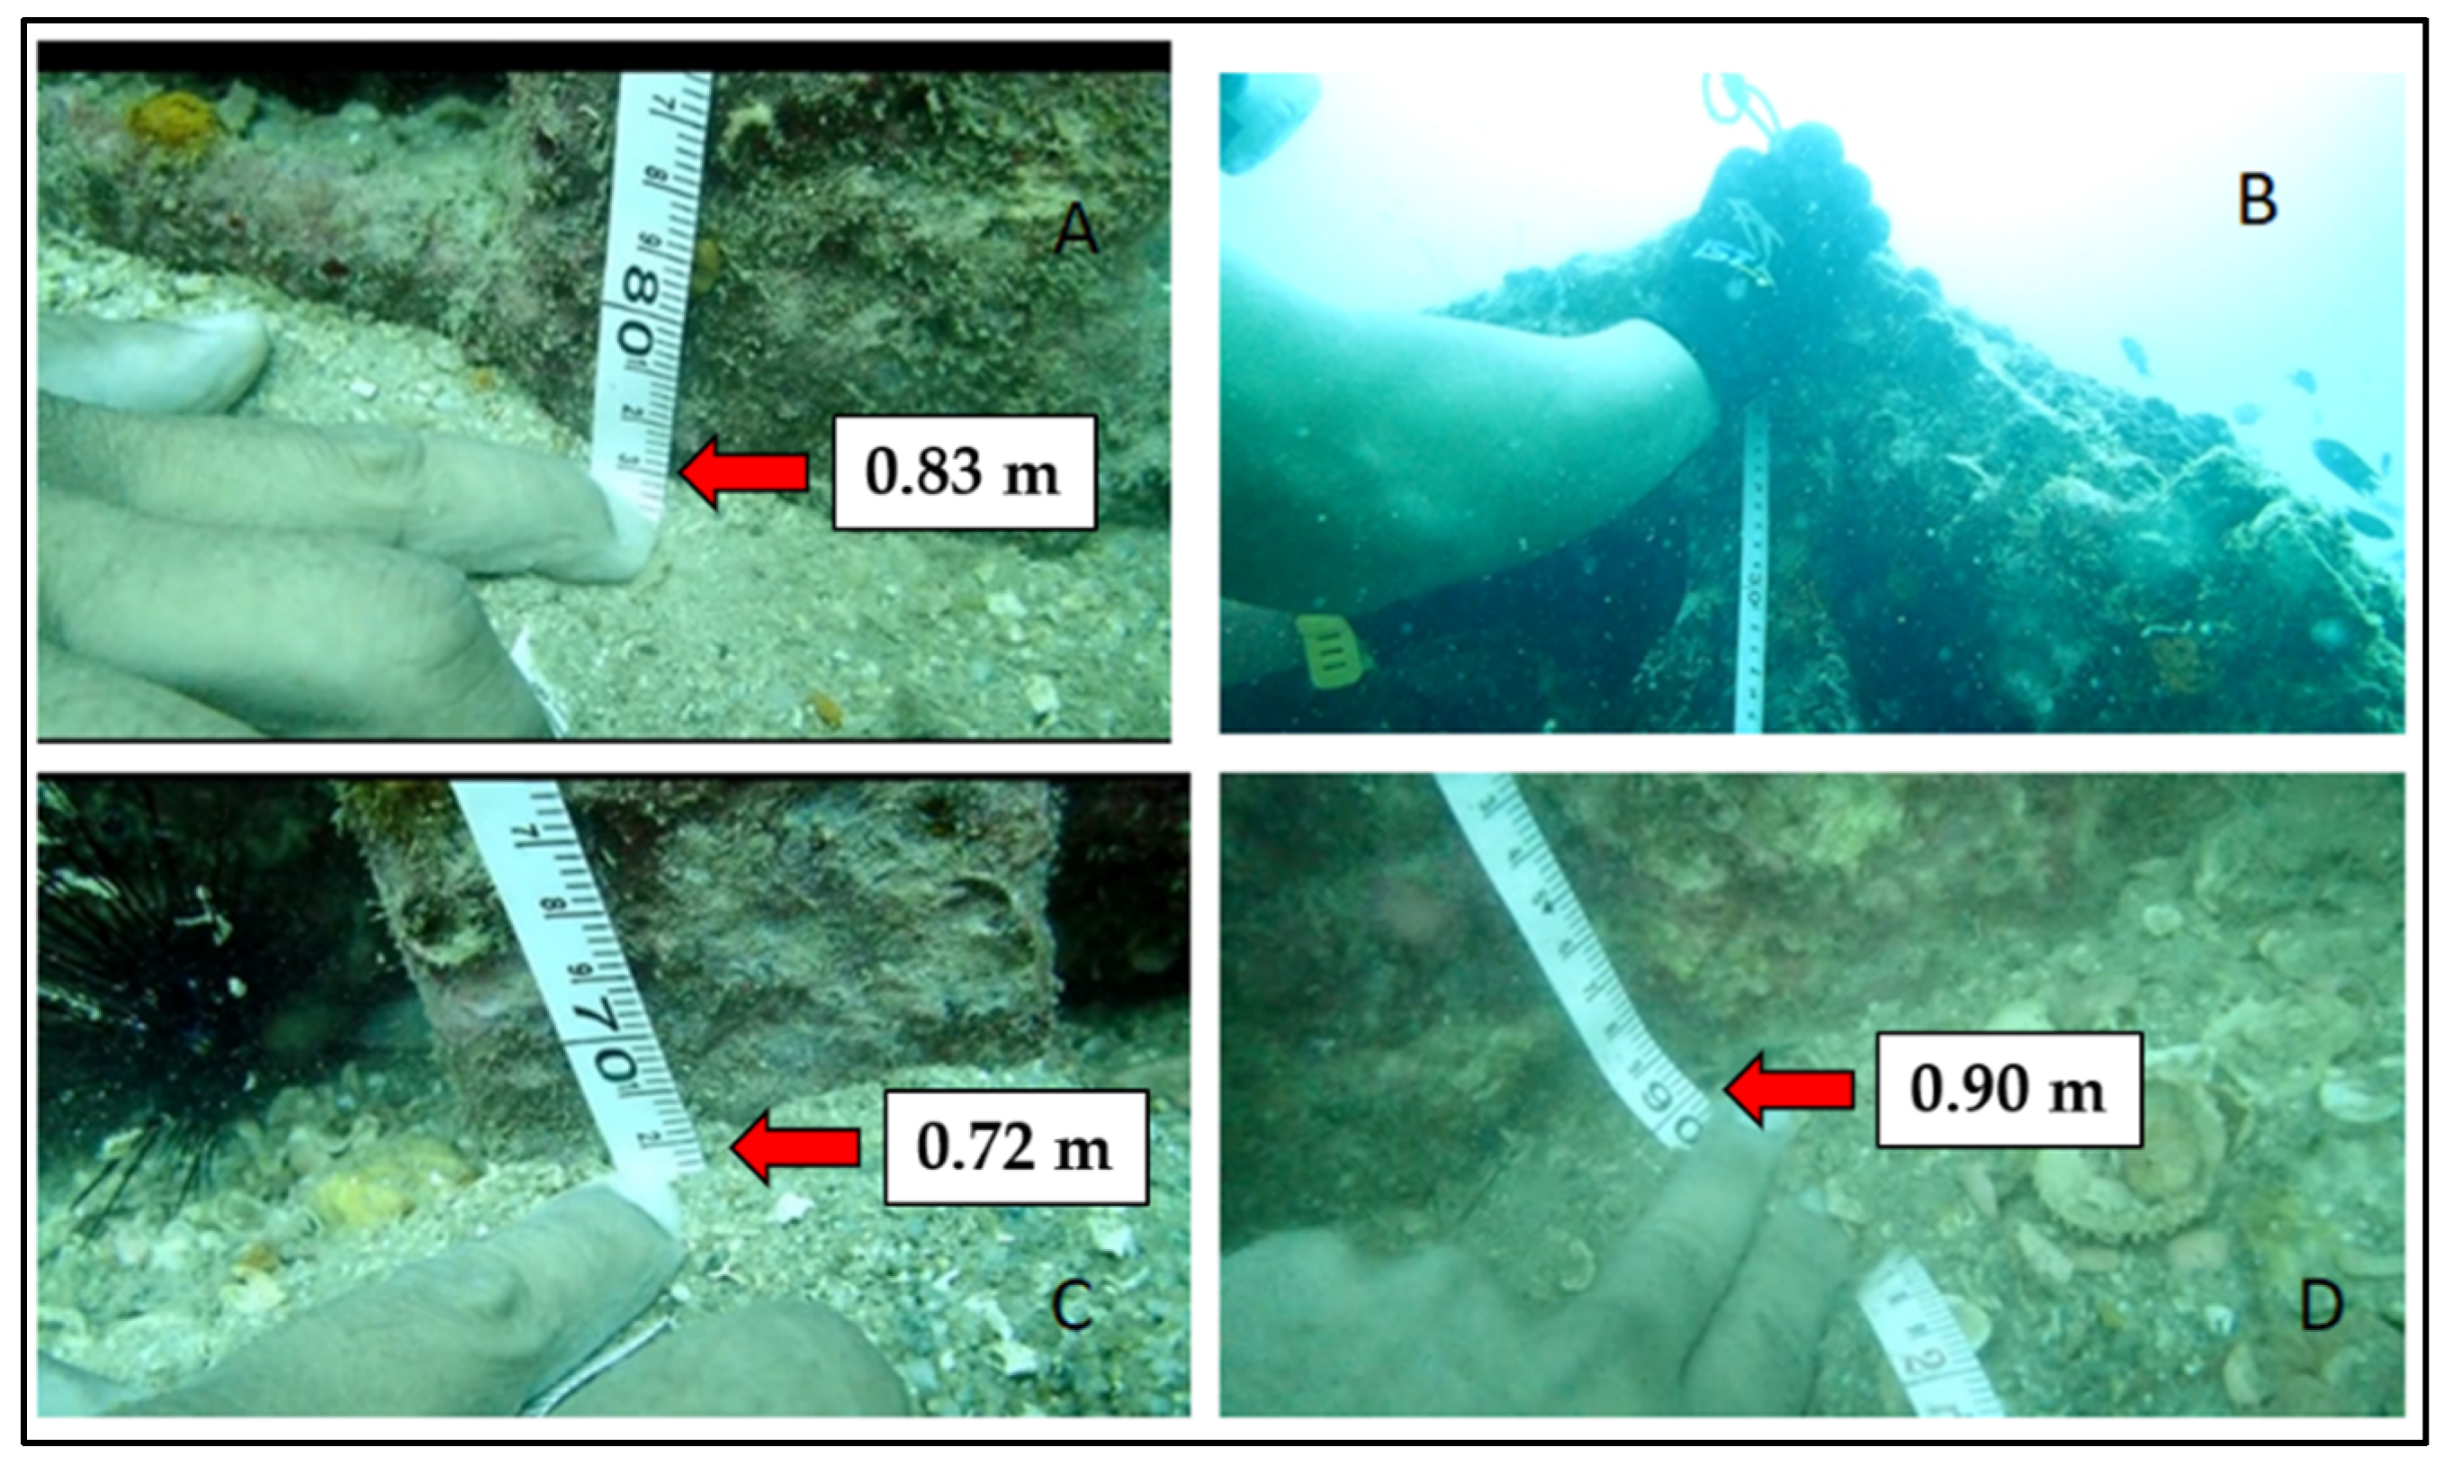
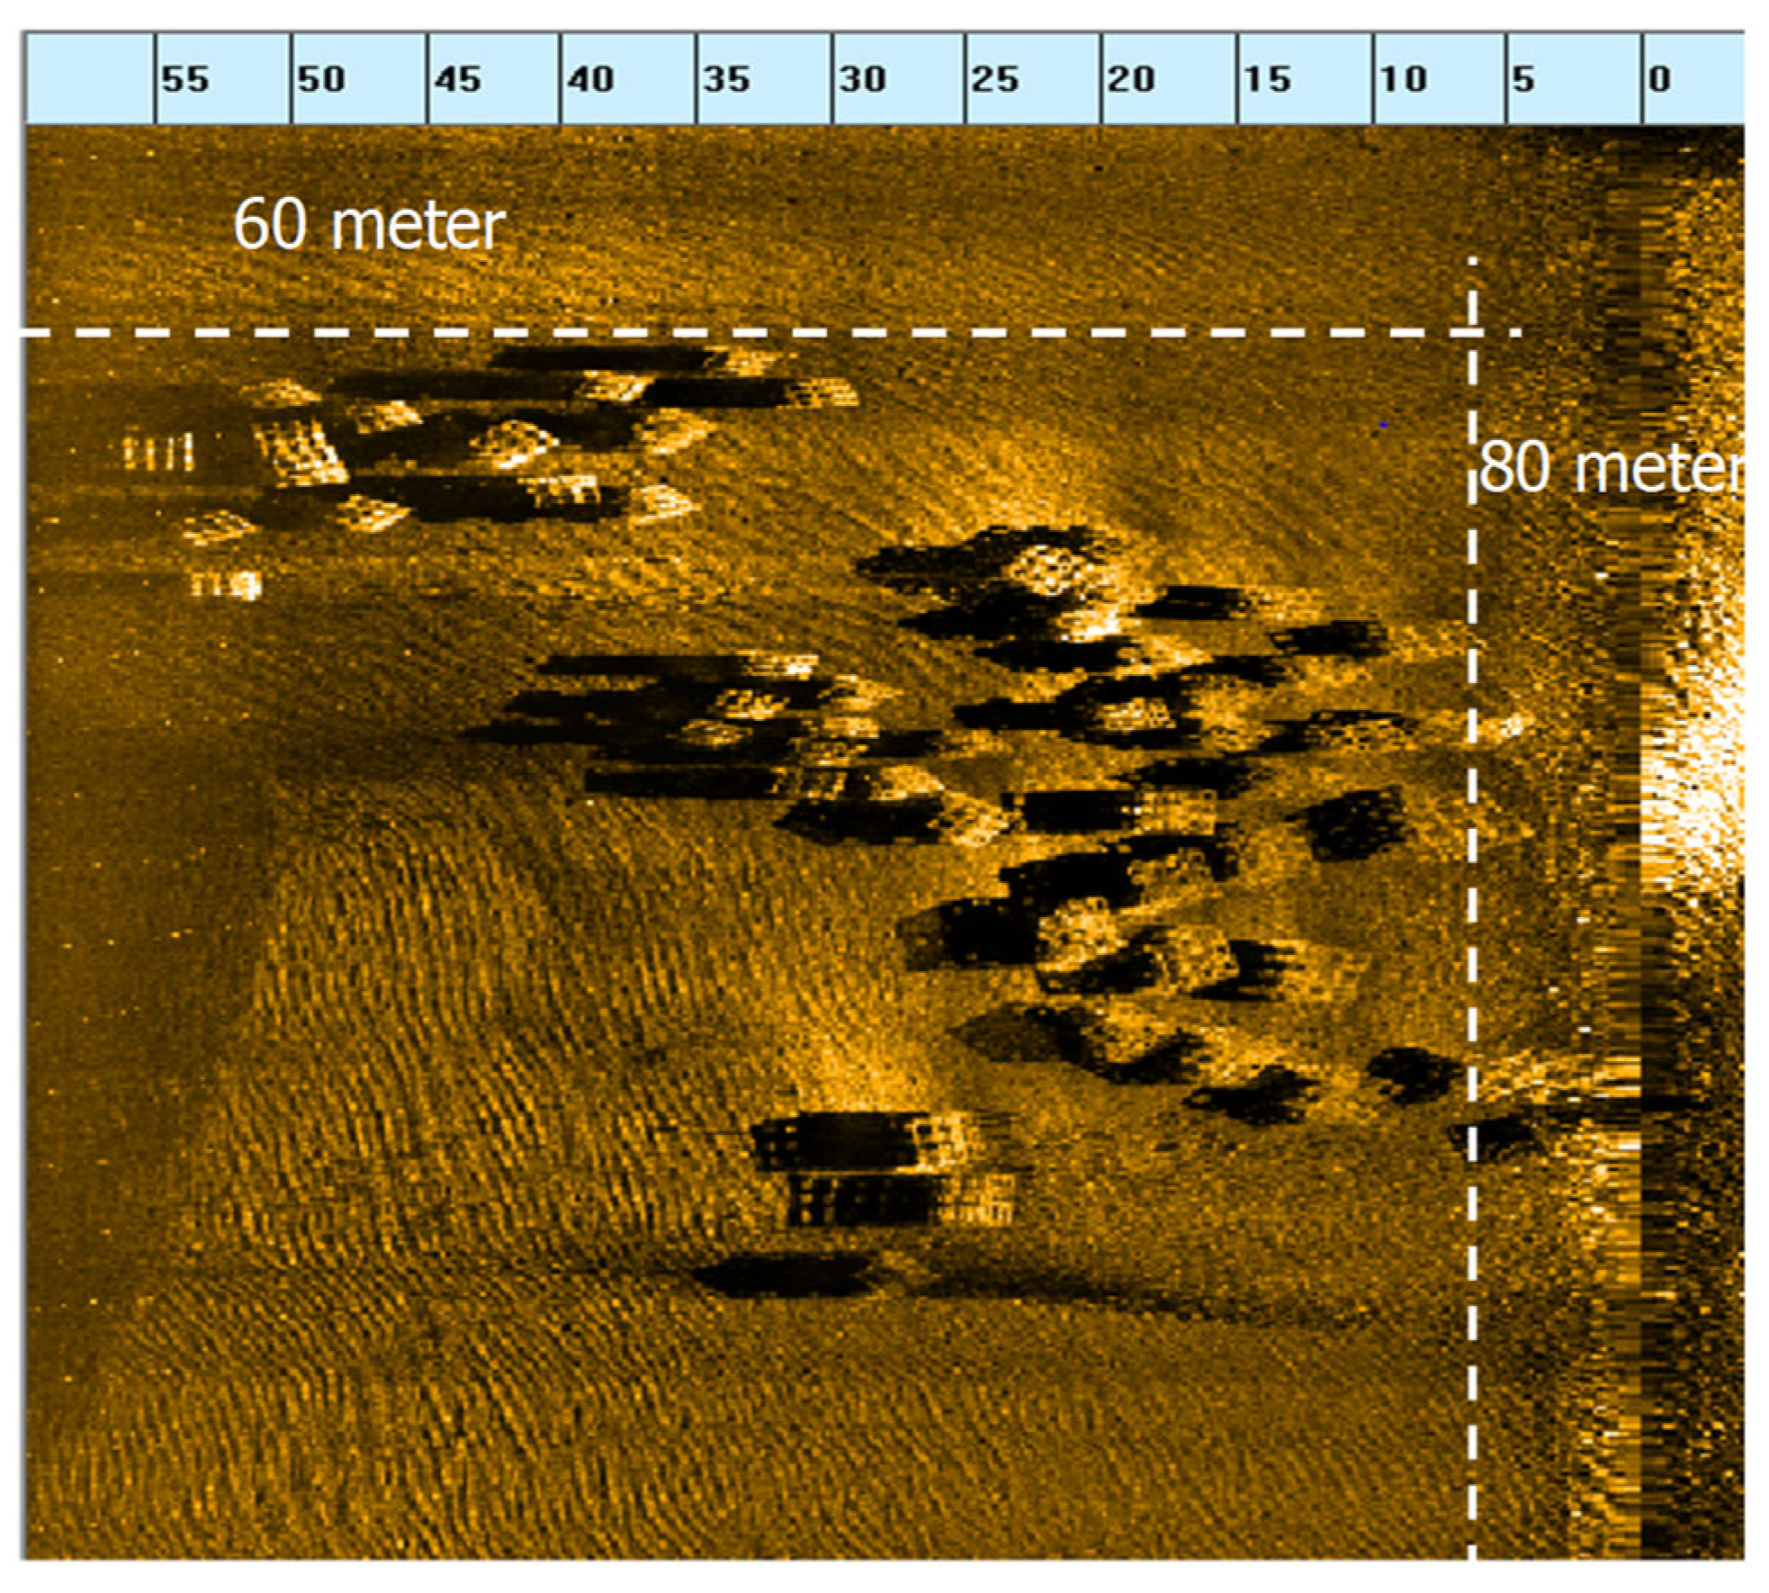
Sonar images from the scanning process conducted in 2006 and 2022 were used to compare the AR’s structure integrity, durability and height measurement. As mentioned in the methodology, the sonar range was set at 60–75 m to ensure that the structures were measured as accurately as possible. The height measurement of each BK AR module via the sonar images is shown in Figure 4. Expert interpretation of the sonar images revealed that the BK AR could be detected and outlined individually using the AR’s shadows on the seafloor. Figure 5 depicts the underwater image of a diver conducting the height measurement of the structure from the seabed, while Figure 6 shows the measurement of distribution areas of the AR modules. Following cross-examination to validate the AR measurements, the results showed that the heights of the BK AR were consistent for both years, ranging from 1.7 m to 1.8 m. This shows that the BK modules have not sagged into the sediment, and stand firm 19 years after deployment into the sea.
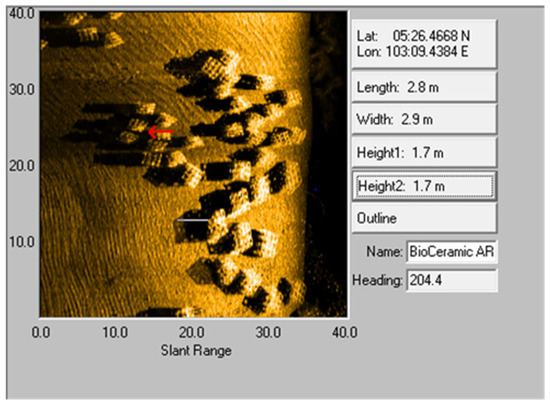
Figure 4.
Measurement of height of the AR unit based on the sonar image from the side-scan Klein 4900 system acquisition interface.
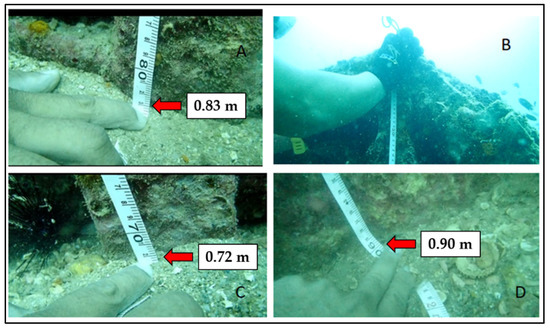
Figure 5.
Underwater images showed the measurements taken for a BK AR module at different angles (A–D). It shows that there are slight variations across the angle, and that the differences are less than 0.1 m.
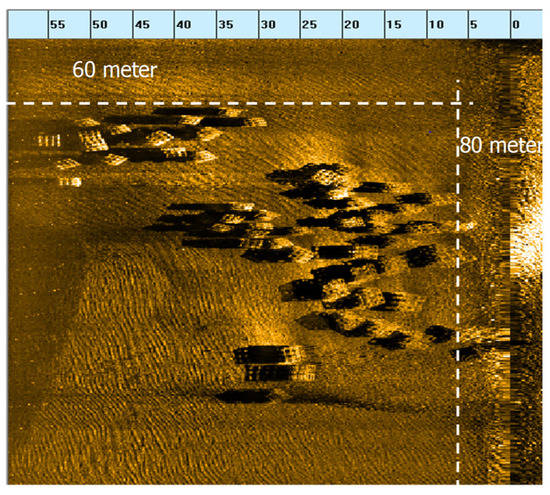
Figure 6.
Measurement of distribution areas of the AR modules.
The sonar images were mosaicked to analyze the overall condition of the study area. The positioning of each group of AR was then recorded, and the location of each module was identified. Based on Table 2, the number of BK AR was determined using the mosaicked sonar images for the three large groups of AR. The total number of BK AR is in agreement in both 2006 and 2022, totalling 108. Although the reported deployed BK AR comprised 180 units in 2003, due to obstruction during the survey in 2022, some deployed areas could not be surveyed. Therefore, we could not confidently crosscheck the remaining 72 units of the total deployed BK AR. Additionally, the survey outcome showed no signs or evidence of any trawler line in the areas surrounding the AR, signifying that the presence of the AR served as a barrier to trawler activities and promoted a sustainable resource for coastal and small-scale fisheries.
Meanwhile, the direct observation of the AR during the scuba diving session provided an in-depth outlook on their physical condition. Figure 7 shows the sonography and underwater images of the BK AR modules in the study area captured in 2022. Generally, the physical structure of all modules remained intact in their original structure. However, a single broken module was observed in a specific area that is considered prone to a strong current during the monsoon season, and a trawler’s ghost net was found on top of these modules. In addition, the underwater images show that the AR were in excellent condition on the sea floor, and the base of the structure was buried in the sand up to 5 cm deep. The underwater images also displayed that the modules were relatively positioned in rows and that none of them were broken or inverted, which corresponded to the overlapping modules in a group, as detected from the sonar side scans. Based on the index table [45] (Table 1), the conditions of the BK AR at Tukun Telaga Batin were classified as Index Number 5, where the AR were in extremely good condition with mostly intact structures, no sign of degradation, and strong linkages (80–100%).

Figure 7.
Underwater photo of BK AR modules at different angles at Tukun Telaga Batin.
3.2. Fish Diversity in the Deployed BK AR Modules
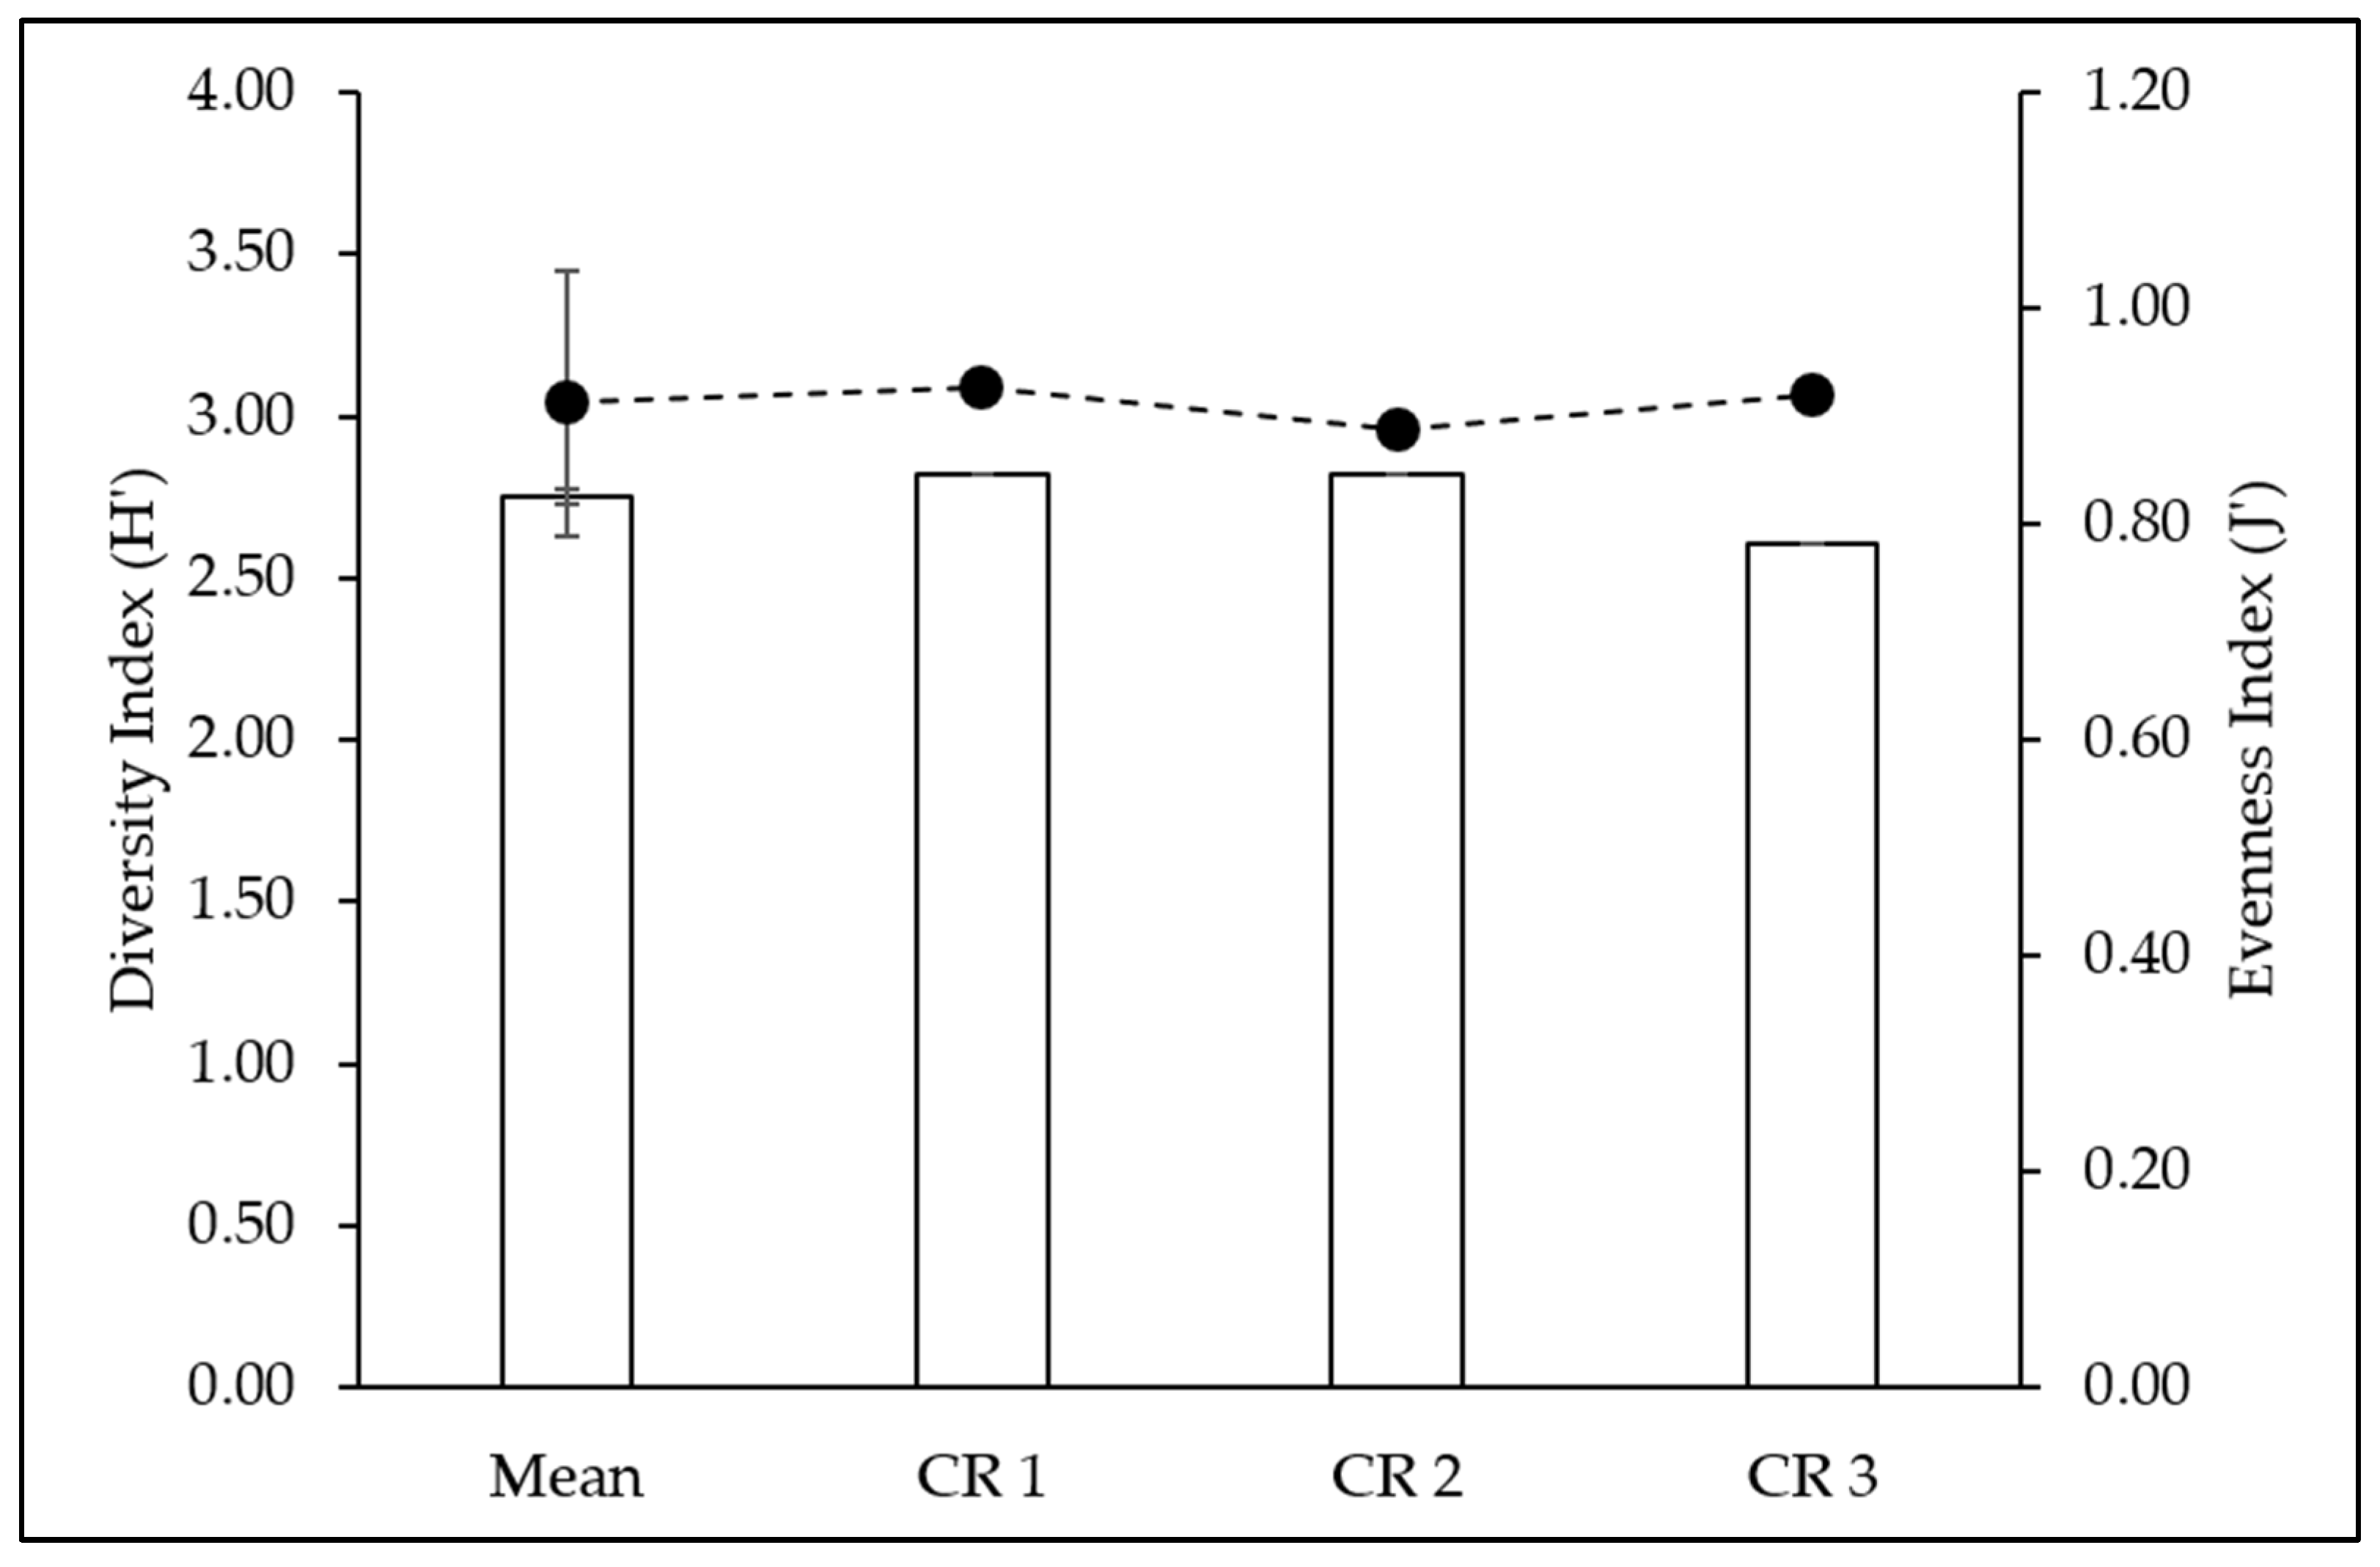
A total of 34 different fish species from 14 families and 26 genera were identified from 3 units of the BK AR (Table 3). Among the detected families, Pomacanthidae comprised the highest number of species (seven species), followed by Serranidae (four species). Based on the IUCN Red List criteria, most of the identified species were categorized as Least Concern (LC), while seven species evaluated were not on the list (Table 3). All identified species were classified as reef-associated (RA) fish, indicating that AR provide a convenient structural habitat for certain coral reef species (Table 4). Moreover, the presence of 13 non-migratory (nonM) species, which chose the AR as their permanent residence, indicates the successfulness of the AR as a fish-aggregating device (FAD). On top of that, two types of Oceanodromous (OD) species (Lutjanus johnii and Siganus javus) were migratory fishes that travel afar to the AR for specific reasons, such as searching for food. As shown in Figure 8, the Shannon Diversity (H′ = 2.75 ± 0.021) and Pielou Evenness (J′ = 0.912 ± 0.123) Indices recorded a range of 2.61–2.82 and 0.89–0.93, respectively. Relatively, all units of AR observed in this study showed no clear differences in the Diversity or Evenness Indices, showing that each unit of the BK AR harbor diverse fish species at the same time.

Table 3.
List of fish species identified at three BK AR units based on IUCN Red List status (NE = not evaluated; LC = least concern) and habitat preference for each species based on FishBase® (RA = reef-associated; NonM = non-migratory; OD = oceanodromous; DE = demersal).

Table 4.
Fish biomass of each species found in all three BK AR. Values are in kg m−3.
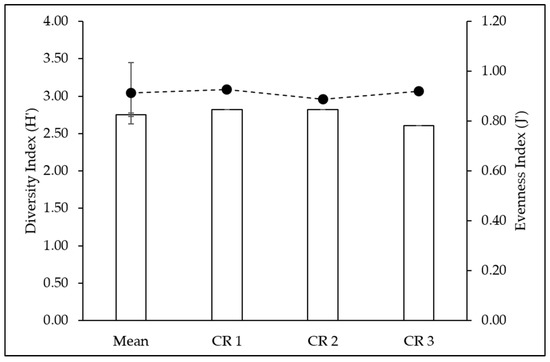
Figure 8.
Shannon Diversity, H′ (bar), and Pielou Evenness, J′ (•), Indices of the fish detected in the BK AR. Error bars indicate the standard deviation.
3.3. Fish Biomass
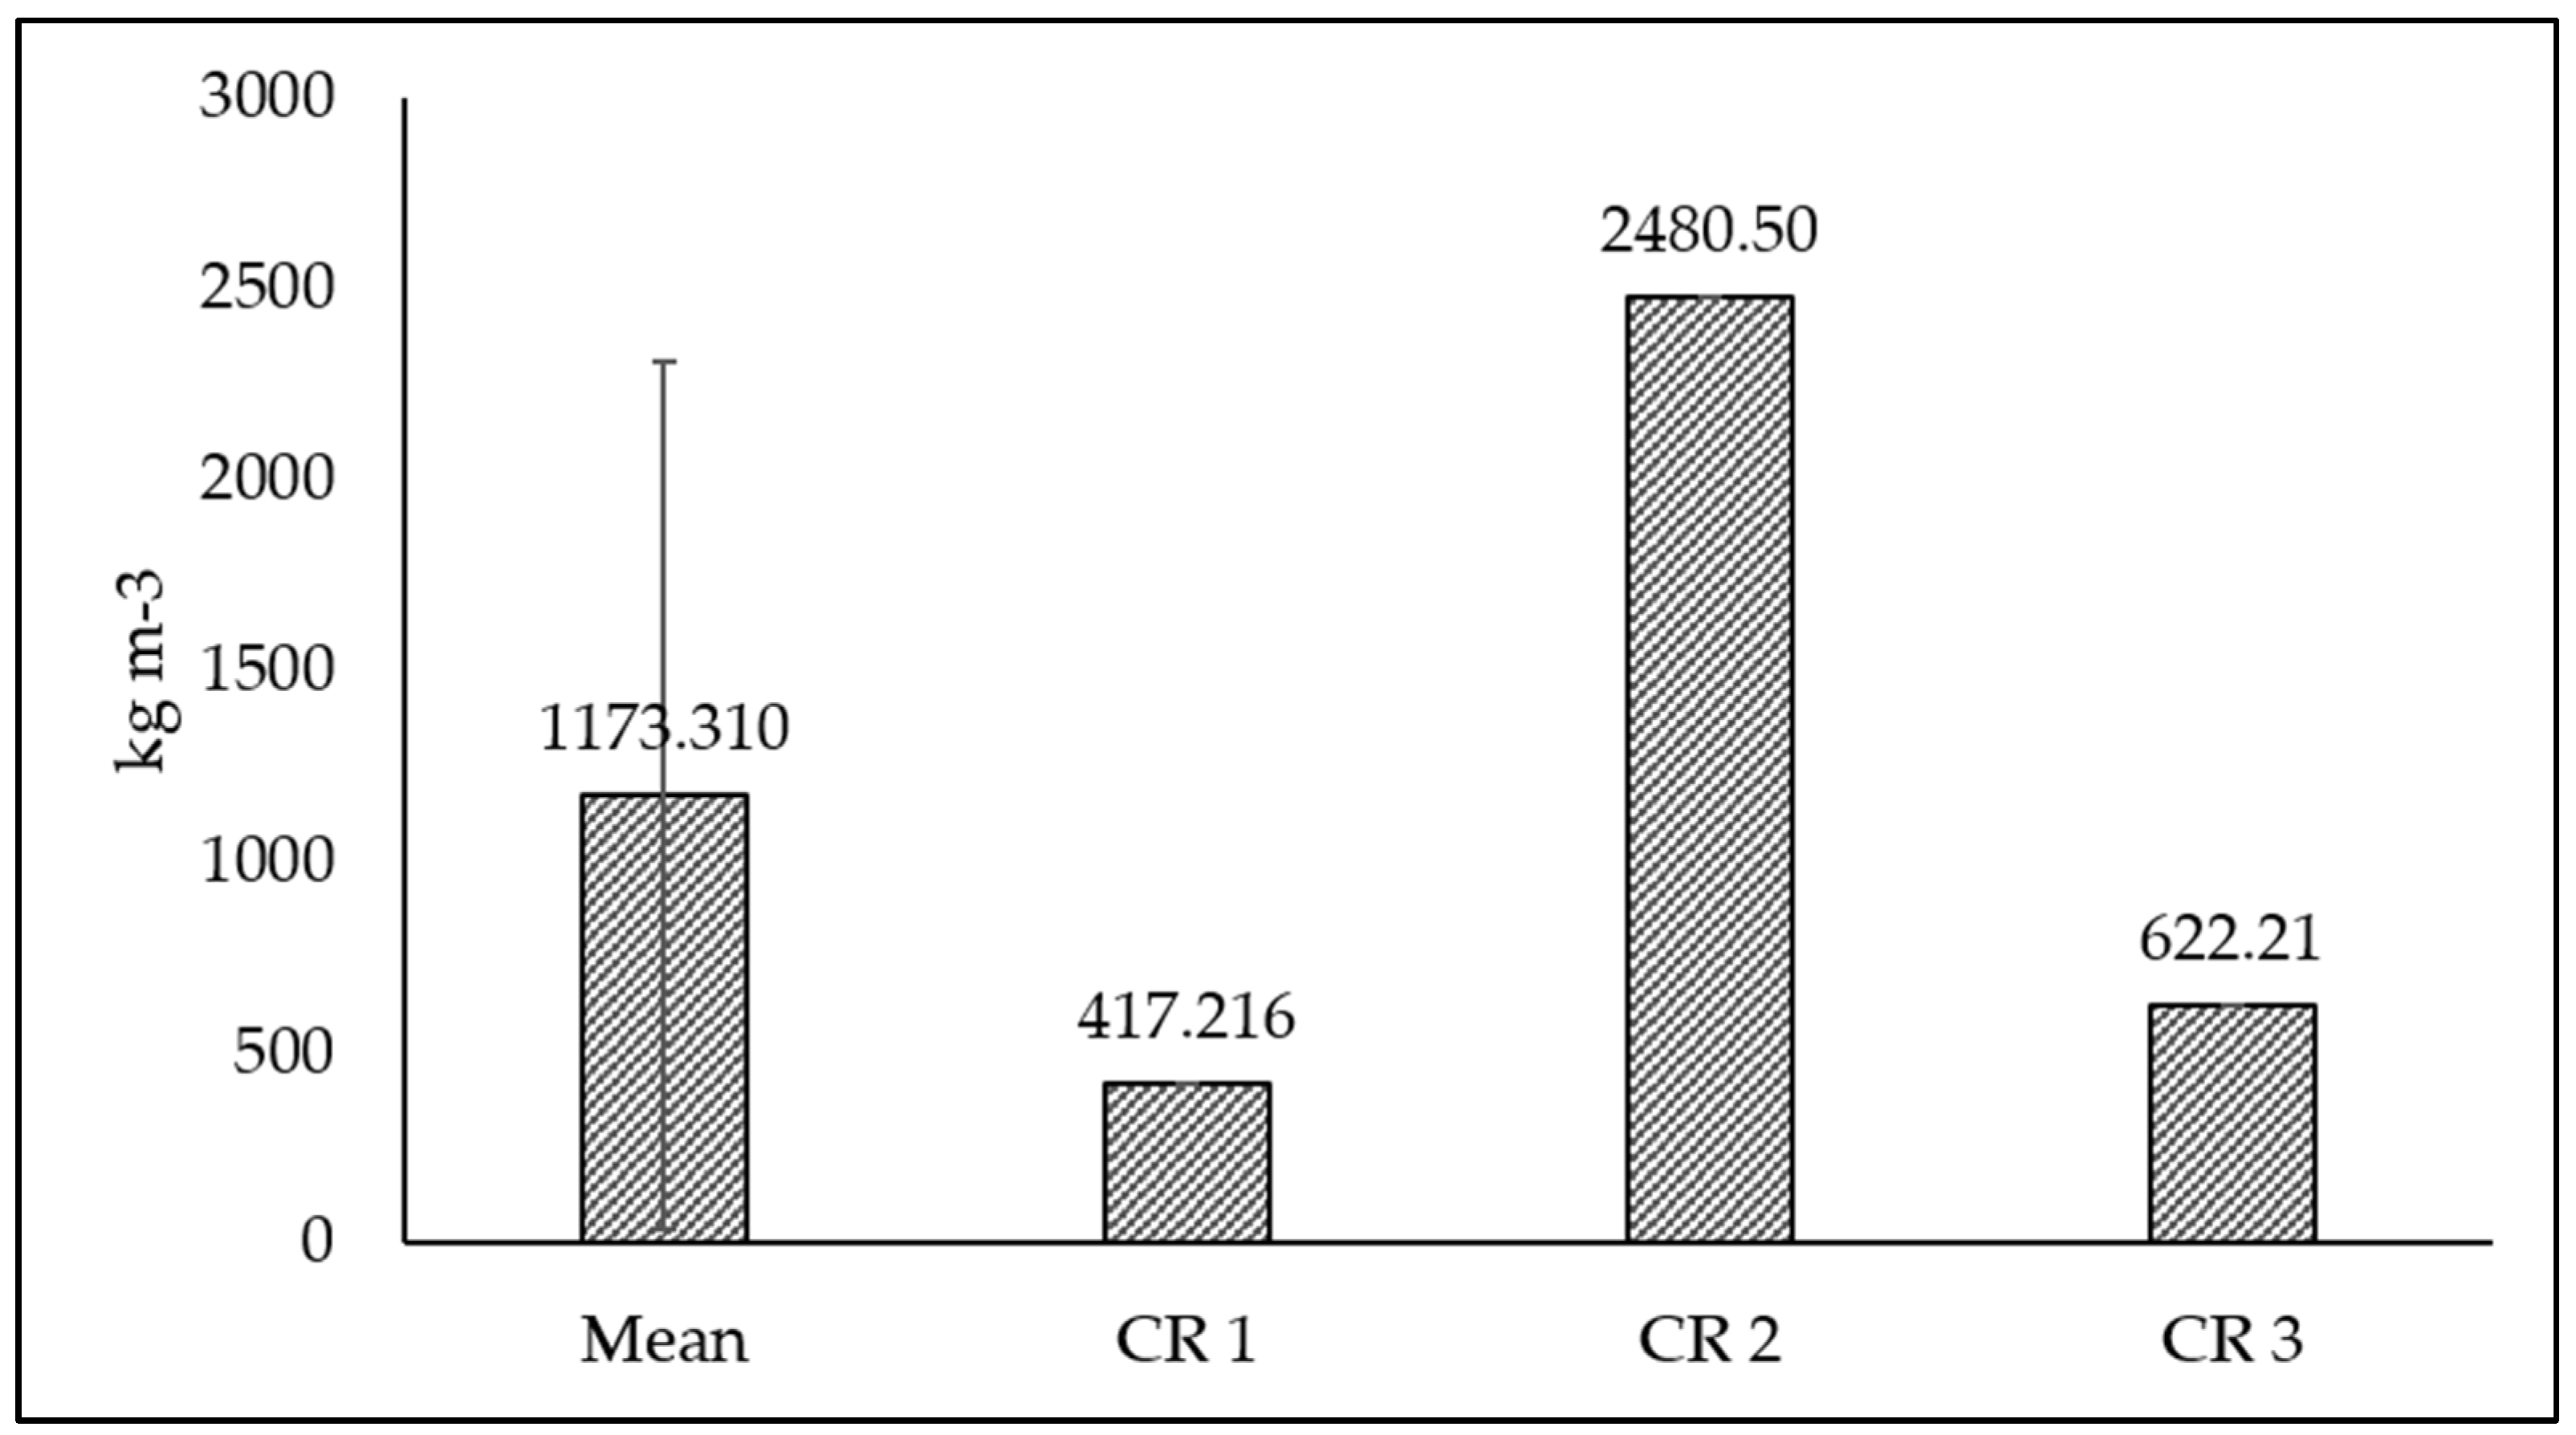
Figure 9 shows the calculated total fish biomass from the three BK AR units. There was uneven range of fish biomass among the three BK AR units with a value range of 471.22–2480.50 kg m−3 and a mean value of 1173.31 ± 1136.69 kg m−3. In particular, the difference in fish biomass in CR 2 was associated with the bigeye snapper (Lutjanus lutjanus) (Table 4). Nevertheless, regal demoiselle (Neopomacentrus cyanomos) were found in all observed BK AR units with higher biomasses in CR1 and CR3. Apart from these two species, other fishes contributed less than 30 kg m−3 of biomass.
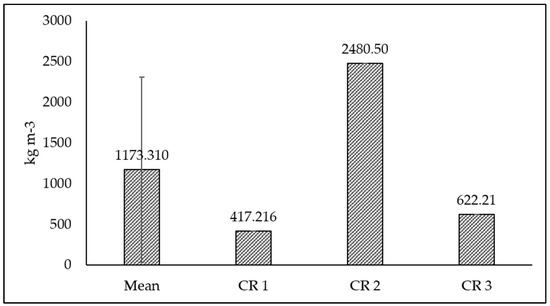
Figure 9.
Total fish biomass in all three BK AR. Error bars indicate the standard deviation.
4. Discussion
The ongoing efforts and available governmental funding for AR programs should include an effective AR monitoring strategy to ensure that the primary goal of AR deployment is achieved. Unfortunately, the assessment of AR performance post-deployment, which includes the evaluation of each objective achievement, has long been neglected since the first AR deployment in the 1970s. Often, the immediate issues of AR material selection, siting, and the deployment of AR take precedence only in the short term and may not provide a sustainable solution to counter fishery productivity. Hence, the proposed periodical monitoring of the deployed AR in this study could be a time-effective and feasible strategy to monitor AR deployment and possibly duplicate this deployment elsewhere across the Malaysian waters. Such practice may facilitate informed decision making to ensure that AR material selection, siting, and deployment fits a particular purpose.
Here, the performance of the BK AR can be considered beneficial to the surrounding deployment areas. The material used to construct the modules was suitable, resistant to breakage and damage, and could withstand harsh monsoon conditions. Furthermore, the findings indicate that the BK AR in the study area provide a favorable artificial habitat for various fish species. For instance, the presence of numerous species from the pomacentrid family showed that the fish chose the AR as their residential area. Generally, the pomacentrid species prefer to live in coral reef areas with complex structures, such as reef-building coral [62]. They are also known as territorial fish with limited home range, commonly sheltering on branching coral as their home [63,64], and are highly abundant in coral reef areas [65]. Thus, the three-dimensional (3D) structure of the AR provides a suitable habitat for pomacentrid species.
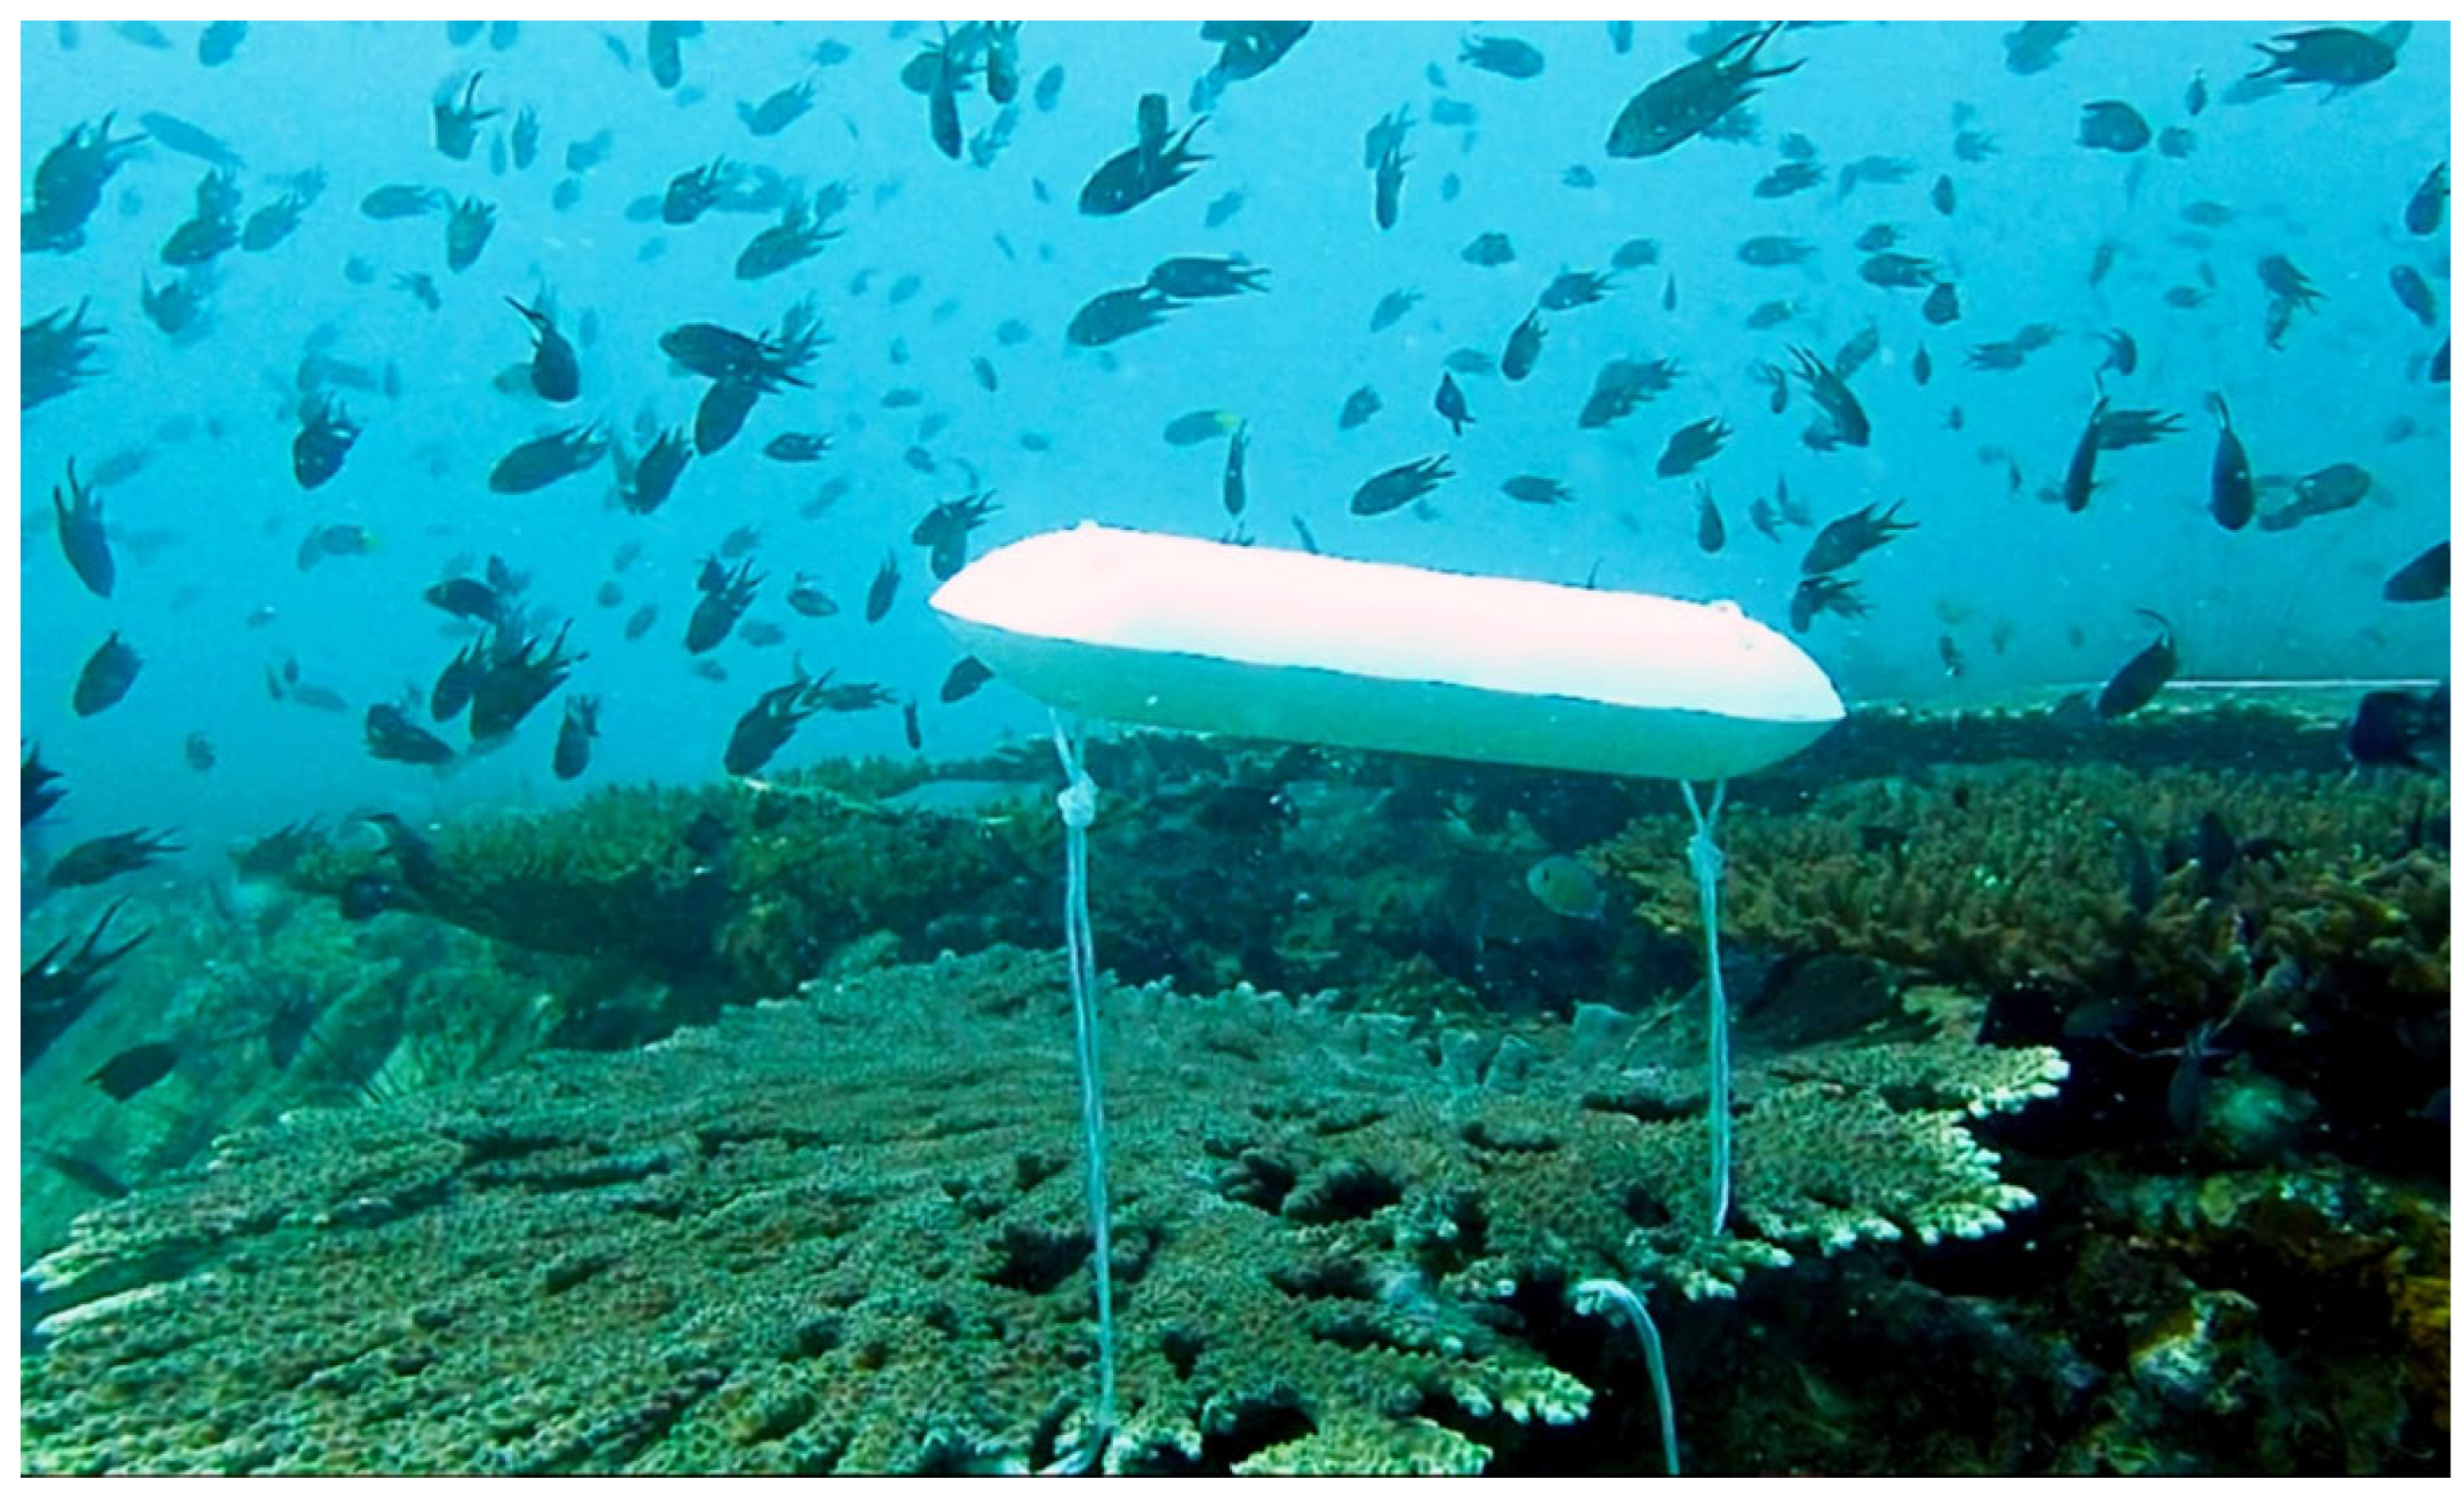
Moreover, the bioceramic plate attached to the AR provides a perfect substrate for benthic organisms, such as corals, to grow. The presence of thriving corals on the AR also provides additional structural complexity to the AR, hence providing a suitable habitat for RA fish, such as pomacentrid species (Figure 10). Except for Scolopsis taenioptera, all species were identified as RA fish, and 13 species were classified as nonM fish, indicating the successful deployment of the AR as an effective FAD to augment the fish population.
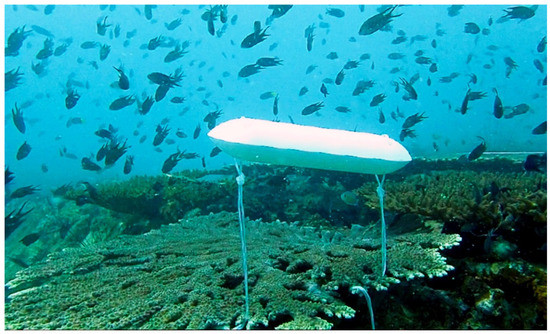
Figure 10.
A school of pomacentrid fish (damselfish) surrounding hard corals that grew on top of the bioceramic plate of the BK AR module. A white-color buoy was placed on top of the AR as a reference for estimating the length of the fish.
The fish diversity in the AR shows a moderate value of the H′ Index based on the classification by Quindo et al. [65], indicating that the AR exhibit a fairly diverse fish community. However, the number of species present in the AR was relatively higher than those observed in a single section of the area of the coral reef [66,67]. Furthermore, the J′ Index value of close to 1 for each AR showed that various fish species contributed to the diverse fish assemblages in the AR [61]. Meanwhile, the fish biomass was relatively higher than those reported in the coral reef area. For instance, Ismail et al. [68] reported that the fish biomass in the reef of Pulau Anak Datai, Langkawi, was low, with a value range of 9.77–28.09 g m−2.
In comparison, this study measured the fish biomass based on the density of the AR, which possess a much smaller area than natural reefs. Considering this situation, introducing AR in non-coral reef areas would support forming a new artificial habitat for marine organisms, mainly fish, promoting fish assemblages and enhancing their biomass. This agrees with the primary objective of AR deployment, which is to promote fishery industries with increased fish catches, especially for small-scale and artisanal fisheries [69,70]. However, Islam et al. [69] previously noted the conflict between the efficiency of AR and the income of local fisheries using multiple fishing gears. This contention could be reduced by marking the location of AR for the use of various fisher groups. Hence, relocating the AR from this study could improve the efficiency of AR for an effective AR program.
5. Conclusions
This study provides a comprehensive baseline assessment of AR in Malaysia using the side-scan sonar technology coupled with scuba diving observation. The approach managed to fulfil the need for the effective AR detection, searching, positioning, and evaluation of BK AR structures at Tukun Telaga Batin off the Terengganu coastline, deployed in 2003. Side-scan sonar technology enables the precise positioning of the AR location. The mosaicked sonar images showed that the overall condition of the BK AR was physically intact and in extremely good condition after 19 years of deployment. Meanwhile, sonar images of the BK AR at each location revealed more detailed information, such as the spaces between the clusters that could be useful for the future deployment of AR in the same area. Overall, the BK AR’s performance displayed remarkable effectiveness and efficiency in terms of durability to withstand harsh monsoon conditions. Most of the BK AR remained in their original position and condition, with minimal sediment settlement surrounding them (approximately 0.1–0.2 m from the seafloor).
A closer look at the AR’s structure during the scuba diving assessment confirmed the extremely good condition of the AR, with mostly intact structures, no signs of degradation, and strong linkages which was classified as Index Number 5 (Table 1). Interestingly, a total of 34 different fish species from 14 families and 26 genera were identified from 3 units of BK AR. Furthermore, the insignificant Shannon Diversity (H′ = 2.75 ± 0.021) and Pielou Evenness Indices (J′ = 0.912 ± 0.123) indicated that each BK AR unit simultaneously harbors a diverse range of fish species. In addition, the thriving coral growth on the AR modules encourages the conversion of the AR into a convenient FAD, which further accommodates various fish species.
Based on this study’s outcome, recommendations can be concluded for the AR post-deployment survey monitoring guideline. Monitoring efforts should focus on answering the following:
- i.
- Fulfilment of the pre-deployment aim(s);
- ii.
- Location and condition of the AR physical structure;
- iii.
- Evaluating the performance of the AR structures and the habitats they create.
In order to assess all of the above, the monitoring exercise can be divided into different phases and timelines. For example, assessing the location and condition of the AR physical structure using side-scan sonar technology is not something that needs to be executed frequently. As no significant changes occurred after almost two decades, a visual assessment via scuba diving will be more cost-effective and time-efficient for overall AR condition. However, a side-can sonar survey should be included in long-term monitoring efforts with a longer time interval between surveys compared to visual assessment via scuba diving.
Evidently, the clear sonar images improved the observation of the AR distribution, which facilitated calculating the number of modules and their size. In addition, digital information enables the potential establishment of an AR national database to be used to conduct comparative studies of AR post-deployment performances. Therefore, the precise mapping of the AR site via side-scan sonar could aid proper deployment planning in the future.
However, sonar images have limitations, such as the detection of detailed features such as ghost nets and scour on the AR. Therefore, cross-examination with photographs and video is preferable, and would offer value-added information to the overall structure detection from the sonar images. These photographs and videos can be utilized to evaluate the performance of the AR structures and the habitats they create. Even though there was no drastic change in the AR’s physical structure, a time series survey is required to monitor the biological components that contribute to the successfulness of the AR [49]. Therefore, an optimal time frame of at least five years of monitoring is essential for assessing the biological components, as suggested by previous studies [48,71].
The marine environment is very dynamic, which may cause subsidence and the degradation of materials used to construct the AR. Therefore, a future survey would enable reef managers to detect any shifts or significant movement of reefs over time. It is crucial to save and appropriately keep the results obtained from the coupled side-scan sonar survey and scuba diving images as permanent records and archives, which would be easily traceable and serve for future reference. Moreover, it is imperative to include an effective monitoring approach of the BK AR to ensure the AR functions as an effective FAD that provides a meaningful underwater structure for marine organisms, mainly fish, considering their function for fishery resources.
An information database system could be developed based on this study to inform the stakeholders of the present condition of the AR. The database would include vital information regarding the AR, including the exact position, number of active modules/units, distribution pattern, distances between clusters or modules, types of surface sediment, and bathymetry data. These data and records are essential as a reference for future development activities in the area. Subsequently, this would provide preliminary information to local fisheries and divers to locate the AR for fishing and recreational purposes. Thus, this project provides a potential steppingstone for FDAM to establish a national AR monitoring program as the country’s leading government agency responsible for deploying and monitoring AR.
Author Contributions
Conceptualization, A.A., C.D.M.S. and K.I.; methodology, A.A., C.D.M.S., A.M.A.-F., K.I. and Z.B.; software, A.A., K.I., R.L., A.M. and A.M.A.-F.; validation, C.D.M.S., A.M.A.-F. and Z.B.; formal analysis, A.A., A.M.A.-F., R.L., A.M. and T.H.S.; investigation, A.A., R.L., A.M., C.D.M.S., A.M.A.-F. and Z.B.; resources, A.A. and M.R.A.; data curation, A.A., C.D.M.S. and A.M.A.-F.; writing—original draft preparation, A.A., K.I., C.D.M.S. and A.M.A.-F.; writing—review and editing, A.R. and K.I.; visualization, A.A, C.D.M.S. and A.M.A.-F.; supervision, A.A., M.F.M.A. and Z.B.; project administration, A.A. and M.F.M.A.; funding acquisition, A.A., M.F.M.A. and M.R.A. All authors have read and agreed to the published version of the manuscript.
Funding
This research was funded by the Higher Institution Centre of Excellence (HICoE) grant awarded to the Institute of Oceanography and Environment (INOS), Universiti Malaysia Terengganu (UMT) by Ministry of Higher Education (MoHE), Malaysia.
Institutional Review Board Statement
Not applicable.
Informed Consent Statement
Not applicable.
Data Availability Statement
Not applicable.
Acknowledgments
The authors greatly acknowledged the Fisheries Development Authorities of Malaysia (FDAM) for their collaboration through the intergovernmental research fund.
Conflicts of Interest
The authors declared no conflict of interest. The funders had no role in the design of the study; in the collection, analyses, or interpretation of data; in the writing of the manuscript, or in the decision to publish the results.
References
- Bohnsack, J.A.; Sutherland, D.L. Artificial reef research: A review with recommendations for future priorities. Bull. Mar. Sci. 1985, 37, 11–39. [Google Scholar]
- Stevenson, T.C.; Brian, N.T.; William, J.W. Socioeconomic consequences of fishing displacement from marine protected areas in Hawaii. Biol. Conserv. 2013, 160, 50–58. [Google Scholar] [CrossRef]
- Davis, K.J.; Vianna, G.M.S.; Meeuwig, J.J.; Meekan, M.; Pannell, D. Estimating the economic benefits and costs of highly-protected marine protected areas. Ecosphere 2019, 10, e02879. [Google Scholar] [CrossRef]
- Paxton, A.B.; Shertzer, K.W.; Bacheler, N.M.; Kellison, G.T.; Riley, K.L.; Taylor, J.C. Meta-Analysis Reveals Artifical Reefs Can Be Effective Tools for Fish Community Enhancement but Are Not One-Size-Fits-All. Front. Mar. Sci. 2020, 7, 282. [Google Scholar] [CrossRef]
- Ramm, L.A.; Florisson, J.H.; Watts, S.L.; Becker, A.; Tweedley, J.R. Artificial reefs in the Anthropocene: A review of ge-ographical and historical trends in their design, purpose, and monitoring. Bull. Mar. Sci. 2021, 97, 699–728. [Google Scholar] [CrossRef]
- Woohhead, P.M.J.; Jacobson, M.E. Epifauna settlement, the process of community development and succession over two years on an artificial reef in New York Bight. Bull. Mar. Sci. 1985, 37, 364–376. [Google Scholar]
- Chou, L.M. Artificial reefs of Southeast Asia-Do they enhance or degrade the marine environment? Environ. Monit. Assess. 1997, 44, 45–52. [Google Scholar] [CrossRef]
- Baine, M. A review of their design, application, management and performance. Ocean Coast. Manag. J. 2001, 44, 241–259. [Google Scholar] [CrossRef]
- Sutton, S.G.; Bushnell, S.L. Socio-economic aspects of artificial reefs: Considerations for the Great Barrier Reef Marine Park. Ocean Coast. Manag. 2007, 50, 829–846. [Google Scholar] [CrossRef]
- Clark, S.; Edwards, A.J. An evaluation of artificial reef structures as tools for marine habitat rehabilitation in the Maldives. Aquat. Conserv.: Mar. Freshw. Ecosyst. 1999, 9, 5–21. [Google Scholar] [CrossRef]
- Brock, R.E. Beyond fisheries enhancement: Artificial reefs and ecotourism. Bull. Mar. Sci. 1994, 55, 1181–1188. [Google Scholar]
- Claudet, J.; Pelletier, D. Marine protected areas and artificial reefs: A review of the interactions between management and scientific studies. Aquatic 2004, 17, 129–138. [Google Scholar] [CrossRef]
- Wong, F.H. Construction of artificial reefs in Malaysia (In Malay). Ber. Nelayan 1981, 27, 16–19. [Google Scholar]
- Saharudin, A.H.; Ahmad, A.; Lokman, M.H.; Wan Salihin, W.A. Historical Development and Management of Malaysian Artificial Reefs (Ars). Environ. Sci. 2012. [Google Scholar] [CrossRef]
- Sukarno, W.; Raja Mohammad Noordin, R.O.; Che Omar, M.H. Assement of artificial reefs in Terengganu (In Malay). In Proceedings of the Fisheries Research Seminar 1991, Gelugur Pulau Pinang, Malaysia; 1991; pp. 418–428. [Google Scholar]
- Latun, A.R.B. Artificial Reefs in Malaysia: The Malaysian Experience in Resource Rehabilitation. In Proceedings of the 1st Regional Workshop on Enhancing Coastal Resources: Artificial Reefs, Stationary Fishing Gear Design and Construction and Marine Protected Areas, Bangkok, Thailand, 30 September–3 October 2003; pp. 143–146. [Google Scholar]
- Kenny, A.J.; Cato, I.; Desprez, M.; Fader, G.; Schuttenhelm, R.T.E.; Side, J. An overview of seabed-mapping technologies in the context of marine habitat Classification. ICES J. Mar. Sci. 2003, 60, 411–418. [Google Scholar] [CrossRef]
- Anderson, J.T.; Holliday, D.V.; Kloser, R.; Reid, D.G.; Simard, Y. Acoustic seabed classification: Current practice and future directions. ICES J. Mar. Sci. 2008, 65, 1004–1011. [Google Scholar] [CrossRef]
- Arney, R.; Froehlich, C.; Kline, R. Recruitment Patterns of Juvenile Fish at an Artificial Reef Area in the Gulf of Mexico. Mar. Coast. Fish. Dyn. Manag. Ecosyst. Sci. 2017, 9, 79–92. [Google Scholar] [CrossRef]
- Bortone, S.A.; Brandini, P.P.; Fabi, S.; Otake, S. Artificial Reefs in Fishery Management; CRC Press: Boca Raton, FL, USA, 2011; 350. [Google Scholar]
- Tessier, E.; Chabanet, P.; Pothin, K.; Soria, M.; Lasserre, G. Visual censuses of tropical fish aggregations on artificial reefs: Slate versus video recording techniques. J. Exp. Mar. Biol. Ecol. 2005, 315, 17–30. [Google Scholar] [CrossRef]
- Froehlich, C.Y.M.; Kline, R.J. Using fish population metrics to compare the effects of artificial reef density. PLoS ONE 2015, 10, e0139444. [Google Scholar] [CrossRef]
- Hicks, D.; Cintra-Buenrostro, C.E.; Kline, R.; Shively, D.; Shipley-Lozano, B. Artificial Reef Fish Survey Methods: Counts vs. Log-Categories Yield Different Diversity Estimates. In Proceedings of the 68th Gulf and Caribbean Fisheries Institute Meeting, Panama, Panama, 9–13 November 2015; pp. 74–79. [Google Scholar]
- Lowry, M.B.; Glasby, T.M.; Boys, C.A.; Folpp, H.; Suthers, I.; Gregson, M. Response of fish communities to the deployment of estuarine artificial reefs for fisheries enhancement. Fish. Manag. Ecol. 2013, 21, 42–56. [Google Scholar] [CrossRef]
- Ajemian, M.J.; Wetz, J.J.; Shipley-Lozano, B.; Shively, J.D.; Stunz, G.W. An analysis of artificial reef fish community structure along the Northwestern Gulf of Mexico shelf: Potential impacts of ‘‘Rigs-to-Reefs’’ programs. PLoS ONE 2015, 10, e0126354. [Google Scholar] [CrossRef] [PubMed]
- Bo, M.; Bava, S.; Canese, S.; Angiolillo, M.; Cattaneo-Vietti, R.; Bavestrello, G. Fishing impact on deep Mediterranean rocky habitats as revealed by ROV investigation. Biol. Conserv. 2014, 171, 167–176. [Google Scholar] [CrossRef]
- Wen-Miin, T. Side-Scan Sonar Techniques for The Characterization of Physical Properties of Artificial Benthic Habitats. Braz. J. Oceanogr. 2011, 59, 77–90. [Google Scholar]
- Wen-Miin, T. The Application of Side-Scan Sonar System in Monitoring Benthic Artificial Reefs. In Proceedings of the 1998 International Symposium on Underwater Technology, Tokyo, Japan, 17 April 1998. [Google Scholar]
- Collier, J.S.; Brown, C.J. Correlation of sidescan backscatter with grain size distribution of surficial seabed sediments. Mar. Geol. 2005, 214, 431–449. [Google Scholar] [CrossRef]
- Greene, H.G.; Yoklavich, M.M.; Starr, R.M.; O’Connell, V.M.; Wakefield, W.W.; Sullivan, D.E.; Cailliet, G.M. A classification scheme for deep seafloor habitats. Oceanol. Acta 1999, 22, 663–678. [Google Scholar] [CrossRef]
- Grove, R.S.; Zabloudil, K.; Norall, T.; Deysher, L. Effects of El Nino events on natural kelp beds and artificial reefs in southern California. ICES J. Mar. Sci. 2002, 59, S330–S337. [Google Scholar] [CrossRef]
- Degraer, S.; Moerkerke, G.; Rabaut, M.; Van Hoey, G.; Du Four, I.; Vincx, M.; Van Lancker, V. Very-high resolution side-scan sonar mapping of biogenic reefs of the tube-worm Lanice conchilega. Remote Sens. Environ. 2008, 112, 3323–3328. [Google Scholar] [CrossRef]
- Rabaut, M.; Vincx, M.; Degraer, S. Do Lanice conchilega (sandmason) aggregations classify as reefs? Quantifying habitat modifying effects. Helgol. Mar. Res. 2008, 63, 37. [Google Scholar] [CrossRef]
- Prada, M.C.; Appeldoorn, R.S.; Rivera, J.A. The effects of minimum map unit in coral reefs maps generated from high resolution side scan sonar mosaics. Coral Reefs 2008, 27, 297. [Google Scholar] [CrossRef]
- Bollinger, M.A.; Kline, R.J. Validating sidescan sonar as a fish survey tool over artificial reefs. J. Coast. Res. 2017, 33, 1397–1407. [Google Scholar] [CrossRef]
- Cuevas, K.J.; Buchanan, M.V.; Moss, D. Utilizing side scan sonar as an artificial reef management tool. In Proceedings of the Oceans ’02 MTS/IEEE, Biloxi, MI, USA, 29–31 October 2002. [Google Scholar]
- Johnson, K.R.; Nelson, C.H. Side-scan sonar assessment of gray whale feeding in the Bering Sea. Science 1984, 225, 1150–1153. [Google Scholar] [CrossRef] [PubMed]
- Kros, P.; Bernhard, M.; Werner, F.; Hukriede, W. Otter trawl tracks in Kiel Bay (Western Baltic) mapped by side-scan sonar. Meeresforschung 1990, 32, 344–353. [Google Scholar]
- Blackinton, J.G.; Hussong, D.M.; Kosalos, J.G. First results from a combination side-scan sonar and seafloor mapping system (SeaMARC II). In Proceedings of the Offshore Technology Conference, Houston, TX, USA, 2–5 May 1983. [Google Scholar]
- Rusby, S. A long-range side-scan sonar for use in the deep sea (Gloria project). Int. Hydrogr. Rev. 2015, 47, 1–15. [Google Scholar]
- Ballard, R.D.; McCann, A.M.; Yoerger, D.; Whitcomb, L.; Mindell, D.; Oleson, J.; Giangrande, C. The discovery of ancient history in the deep sea using advanced deep submergence technology. Deep Sea Res. Part I: Oceanogr. Res. Pap. 2000, 47, 1591–1620. [Google Scholar] [CrossRef]
- Singh, H.; Adams, J.; Mindell, D.; Foley, B. Imaging underwater for archaeology. J. Field Archaeol. 2000, 27, 319–328. [Google Scholar]
- Henry, P.; Le Pichon, X.; Lallemant, S.; Foucher, J.P.; Westbrook, G.; Hobart, M. Mud volcano field seaward of the Barbados Accretionary Complex: A deep-towed side scan sonar survey. J. Geophys. Res.: Solid Earth 1990, 95, 8917–8929. [Google Scholar] [CrossRef]
- Johnson, H.P.; Helferty, M. The geological interpretation of side-scan sonar. Rev. Geophys. 1990, 28, 357–380. [Google Scholar] [CrossRef]
- Thorpe, S.A.; Hall, A.J. The characteristics of breaking waves, bubble clouds, and near-surface currents observed using side-scan sonar. Cont. Shelf Res. 1983, 1, 353–384. [Google Scholar] [CrossRef]
- Quinn, R.; Forsythe, W.; Breen, C.; Dean, M.; Lawrence, M.; Liscoe, S. Comparison of the maritime Sites and Monuments Record with side-scan sonar and diver surveys: A case study from Rathlin Island, Ireland. Geoarchaeology: Int. J. 2002, 17, 441–451. [Google Scholar] [CrossRef]
- Switzer, T.S.; Tyler-Jedlund, A.J.; Keenan, S.F.; Weather, E.J. Benthis habitats, as derived from classification of side-scan sonar mapping data, are important determinants of reef-fish assemblage structure in the eastern Gulf of Mexico. Mar. Coast. Fish. 2020, 12, 21–32. [Google Scholar] [CrossRef]
- Vivier, B.; Dauvin, J.; Naxon, M.; Rusig, A.; Mussio, I.; Orvain, F.; Boutouil, M.; Claquin, P. Marine artificial reefs, a meta-analysis of their design, objectives and effectiveness. Glob. Ecol. Conserv. 2021, 27, e01538. [Google Scholar] [CrossRef]
- Ali, A.; Ali, A.; Arsad, S.; Kameel, F.; Latif, R. Detecting and Mapping of Artificial Reefs Using Side Scan Sonar & Sub Bottom Profiler; Institute of Oceanography and Environment & Department of Fisheries: Terengganu, Malaysia, 2014. [Google Scholar]
- Kok, P.H.; Wijeratne, S.; Akhir, M.F.; Pattiaratchi, C.; Roseli, N.H.; Mohamad Ali, F.S. Interconnection between the Southern South China Sea and the Java Sea through the Karimata Strait. J. Mar. Sci. Eng. 2021, 9, 1040. [Google Scholar] [CrossRef]
- Kok, P.H.; Akhir, M.F.; Tangang, F.T. Thermal frontal zone along the east coast of Peninsular Malaysia. Cont. Shelf Res. 2015, 110, 1–15. [Google Scholar] [CrossRef]
- Savini, A. Side-scan sonar as a tool for seafloor imagery: Examples from the Mediterranean Continental Margin. In Sonar Systems; IntechOpen: London, UK, 2011. [Google Scholar]
- Sheng, Y.P. Physical characteristics and engineering at reef sites. In Artificial Reef Evaluation; Seaman, W., Ed.; with Application to Natural Marine Habitats; CRC Press: Boca Raton, FL, USA, 2000; pp. 51–94. [Google Scholar]
- Lim, A.P.K.; Ahmad, A.; Nor Azman, Z.; Mohd Saki, N. Field Guide to Fishes and Crustaceans of the Southeast Asian Region. Malaysia; Jabatan Perikanan Malaysia: Putrajaya, Malaysia, 2018. [Google Scholar]
- Froese, R.; Pauly, D. FishBase. World Wide Web Electronic Publication. Available online: www.fishbase.org (accessed on 22 May 2022).
- Allen, G.; Steene, R.; Humann, P.; Deloach, N. Reef Fish Identification—Tropical Pacific; New World Publications: Delhi, India, 2003; p. 502. [Google Scholar]
- Shannon, C.E. A mathematical theory of communication. Bell Syst. Tech. J. 1948, 27, 379–423. [Google Scholar] [CrossRef]
- Loya, Y. Plotless and transect methods. In Coral Reefs: Research Methods; Stoddart, D.R., Johannes, R.E., Eds.; UNESCO: Paris, France, 1978; pp. 197–217. [Google Scholar]
- Muxika, I.; Borja, A.; Bonne, W. The suitability of the marine biotic index (AMBI) to new impact sources along European coasts. Ecol. Indic. 2005, 5, 19–31. [Google Scholar] [CrossRef]
- Pielou, E.C. The measurement of diversity in different types of biological collections. J. Theor. Biol. 1966, 13, 131–144. [Google Scholar] [CrossRef]
- Hernández-Velasco, A.; Fernández-Rivera-Melo, F.J.; Melo-Merino, S.M. Occurrence of Holacanthus clarionensis (Pomacanthidae), Stegastes leucorus, and Stegastes acapulcoensis (Pomacentridae) at Magdalena Bay, B.C.S., Mexico. Mar. Biodivers. Rec. 2016, 9, 49. [Google Scholar] [CrossRef]
- Medeiros, P.R.; Souza, A.T.; Ilarri, M.I. Habitat use and behavioral ecology of the juveniles of two sympatric damselfishes (Actinopterygii: Pomacentridae) in the south-western Atlantic Ocean. J. Fish Biol. 2010, 77, 1599–1615. [Google Scholar] [CrossRef]
- Sale, P.F. Apparent effect of prior experience on a habitat preference exhibited by the reef fish, Dascyllus aruanus (Pisces: Pomacentridae). Anim. Behav. 1971, 19, 251–256. [Google Scholar] [CrossRef]
- Afiq-Firdaus, M.A.; Lim, C.S.; Din, M.S.C.; Kadir, S.T.S.A.; Ramasamy, A.M.A.; Ab Manaf, N.; Bachok, Z. Coral Reef Fish Community at Pulau Bidong, Terengganu, South China Sea. J. Sustain. Sci. Manag. 2021, 16, 48–66. [Google Scholar] [CrossRef]
- Quindo, J.P.V.; Bucol, L.A.; Bucol, A.A.; Wagey, B.T. Abundance and Diversity of Fishes in Bayawan river, Negros Oriental, Philipines. J. Ilm. Sains 2019, 19, 118–133. [Google Scholar] [CrossRef]
- Ismail, M.; Ilias, Z.; Ismail, M.; Goeden, G.B.; Yap, C.K.; Al-Mutairi, K.A.; Al-Shami, S.A. Coral health assessment in Malaysia: A case study of Pulau Anak Datai, Langkawi. Environ. Sci. Pollut. Res. 2022, 29, 45860–45871. [Google Scholar] [CrossRef] [PubMed]
- Jani, J.M.; Olson, E.; Patenaude, G. Re-exploring the application of artificial reefs for community-based fishery management in Malaysia. In Proceedings of the American Fisheries Society Symposium, Alexandria, Virginia, 17–19 July 2018; Volume 86, pp. 235–249. [Google Scholar]
- Islam, G.M.N.; Noh, K.M.; Sidique, S.F.; Noh, A.F.M. Economic impact of artificial reefs: A case study of small-scale fishers in Terengganu, Peninsular Malaysia. Fish. Res. 2014, 151, 122–129. [Google Scholar] [CrossRef]
- Islam, G.M.N.; Noh, K.M.; Sidique, S.F.; Noh, A.F.M.; Ali, A. Economic impacts of artificial reefs on small-scale fishers in Peninsular Malaysia. Hum. Ecol. 2014, 42, 989–998. [Google Scholar] [CrossRef]
- Perera, A.D.; Gunathilaka, M.D.E.K. Rapid Assessment Survey Using Side Scan Sonar: International Obligations and Role of Hydrography in Ensuring Safety of Navigation–Case Study of the Aftermath of MV X-Press Pearl Incident. J. Geospat. Surv. 2022, 2, 7–10. [Google Scholar] [CrossRef]
- Higgins, E.; Metaxas, A.; Scheibling, R.E. A systematic review of artificial reefs as platforms for coral reef research and conservation. PLoS ONE 2020, 17, e0261964. [Google Scholar] [CrossRef]
Publisher’s Note: MDPI stays neutral with regard to jurisdictional claims in published maps and institutional affiliations. |
© 2022 by the authors. Licensee MDPI, Basel, Switzerland. This article is an open access article distributed under the terms and conditions of the Creative Commons Attribution (CC BY) license (https://creativecommons.org/licenses/by/4.0/).

