Article

An Improved Hydraulic Power Take-Off Unit Based on Dual Fluid Energy Storage for Reducing the Power Fluctuation Problem in the Wave Energy Conversion System

by
Mohd Afifi Jusoh
,
Zulkifli Mohd Yusop
,
Aliashim Albani
,
Muhamad Zalani Daud
and
Mohd Zamri Ibrahim
*
Renewable Energy & Power Research Interest Group (REPRIG), Eastern Corridor Renewable Energy Special Interest Group, Faculty of Ocean Engineering Technology and Informatics, Universiti Malaysia Terengganu, Kuala Nerus 21030, Terengganu, Malaysia
*
Author to whom correspondence should be addressed.
J. Mar. Sci. Eng. 2022, 10(8), 1160; https://doi.org/10.3390/jmse10081160
Submission received: 30 June 2022 / Revised: 14 August 2022 / Accepted: 16 August 2022 / Published: 21 August 2022

Abstract

:
The power take-off (PTO) stability is one of the most important concerns for wave energy converters (WECs). The PTO unit converts the mechanical energy produced by the wave absorber (WA) unit into useful electrical energy. Due to the drastic input energy variation of real wave motions, the generated electrical power from the PTO unit significantly fluctuates and is potentially harmful to electrical and electronic appliances. This paper proposes an improved hydraulic PTO (HPTO) for the WECs. An improved HPTO unit comprises a dual high-pressure accumulator (HPA) module and fluid energy control (FEC) module, which significantly enhances the generated electrical power from the generator under irregular wave circumstances. A complete model of wave absorber device with conventional and improved HPTO units was built in MATLAB/Simulink using a Simscape fluids toolbox. The parameters of the FEC control strategy were optimized using a genetic algorithm. The improved HPTO unit model was simulated with five irregular wave inputs to evaluate its performance in irregular conditions. The effects of the HPA pressure constraints on the improved HPTO unit performance were also investigated. Overall, the simulation results indicate that the improved HPTO unit was able to generate a stable power up to 87.3% of WECs in an irregular sea state.

1. Introduction

Renewable energy sources have a vast potential to reduce the negative impacts caused by the combustion of fossil fuels. Ocean waves are one of the emerging renewable energy sources that have a great potential to contribute to global green energy production. Over the past several decades, the generation of electricity from the ocean waves has received much interest among researchers [1,2]. As a result, several wave energy converter system (WECs) concepts through various harnessing techniques have been designed, developed, tested, and patented worldwide [3,4,5]. These existing WECs can be categorized according to their operational principles, such as overtopping, oscillating water column, and wave-activated-body (WAB) devices [6,7,8].
Basically, WECs are made up of three primary parts: the wave absorber (WA) unit, power take-off (PTO) unit, and control system (CS) unit. The WA unit is a front-end device that captures energy from ocean wave motions. The PTO unit is a device that converts the mechanical energy produced by the WA into useful electrical energy. The CS unit is used to monitor and control the operation of the WA and PTO units. The PTO unit is one of the most important element of the WECs. The performances of the PTO unit directly correlate to the amount of generated electricity from the absorbed ocean wave energy. In addition, the size and mass of the PTO unit can directly contribute to the overall design and behavior of the WA unit. From the literature, the various concepts of the PTO unit have been invented for different types of WA [9,10]. These PTO concepts can generally be classified into four main categories: direct-mechanical drive, direct-electrical drive, direct-turbine drive, and mechanical-hydraulic drive [10,11]. From the recent study by the authors in [10], the hydraulic PTO (HPTO) is among the most efficient PTO for various kinds of WA devices due to its significant advantages, such as being well-adapted to any ocean wave condition, high efficiency, and high controllability [12]. The HPTO unit is easy to build using standard hydraulic components that are widely applied in different hydraulic system applications [13].
From the literature, many kinds of HPTO concepts have been developed for different types of WECs [9,10,14]. Commonly, the HPTO unit combines several modules, such as actuation, rectification, fluid energy storage, power generation, and reservoir [10]. The actuation module, which commonly comprises single or multiple hydraulic actuators, is used to absorb the mechanical energy produced from the interaction of the ocean waves and WA device into fluid energy. From previous studies, several different types of hydraulic actuators, such as single-acting cylinder [15], double-acting cylinder [16,17], and multi-chamber cylinder [18,19,20], have been utilized in the actuation module of the HPTO unit. Aside from that, the rectification module is used to ensure the unidirectional flow through the generation module. The configuration of the rectification module directly depends on the actuation module configuration. Normally, the rectification module is a combination of two or four non-return valves, and its structure depends on the configuration of the hydraulic actuation module [10]. In a few studies [18,19,20,21], the rectification modules based on the combination of some electronic directional valves were proposed to increase the efficiency of the HPTO unit. Moreover, the fluid energy storage module consists of a single or multi hydraulic accumulator. The fluid energy storage module is used to smooth the overall pressure and prevent cavitation incidents in the HPTO unit. Finally, the power generation module converts the fluid energy to usable electrical energy. The power generation module combines the hydraulic motor and electrical generator.
The electrical power generated from the WECs majorly depends on the efficiency of the HPTO unit. According to [22], two major issues of the HPTO unit need to be emphasized in order to improve the efficiency of the HPTO unit, as follows: (1) an appropriate selection of the HPTO unit architecture and (2) the accurate selection of the parameters of the HPTO unit components. Several works have been conducted by researchers to increase the efficiency of the HPTO unit by optimizing the architecture of the HPTO unit. In [20], the use of a multi-chamber or hydraulic actuator in the actuation module and the digital rectification module were proposed in the HPTO unit architecture. In [23], several incremental modifications to the HPTO unit architecture were carried out, such as adding more accumulators in the energy storage module, using two kinds of rectification modules, and adding bypass circuits in the generation module. In [24,25], the hydraulic transformer unit was applied in the generation module to solve the variable pressure of the HPTO unit. In [26], several numbers of hydraulic accumulators have been added to the energy storage module of the HPTO unit, and the experiment result shows the HPTO unit was able to generate electricity at smaller wave conditions. In [27], multi hydraulic actuators in the actuator module sharing a single generation module were presented, and the experiment results indicated that the WECs could generate more stable energy.
Moreover, the HPTO unit efficiency can also be enhanced by optimizing its important parameters. In [28,29,30,31,32,33], several important HPTO unit parameters were identified, including the hydraulic actuator size, hydraulic accumulator capacity, hydraulic motor displacement, etc. In [28,29,30], the influences of the important HPTO unit parameters on the WECs effectiveness in various sea conditions were investigated. The overall result indicates that these important parameters highly influence the efficiency of the HPTO unit. For this reason, several studies have been conducted to enhance the efficiency of the HPTO unit by optimizing its important parameters [22,34,35,36,37,38]. Authors in [22] employed the genetic algorithm (GA) and non-linear programming by quadratic Lagrangian (NLPQL) for determining the optimal parameters of the HPTO unit. While in [38], the HPTO unit optimization was conducted for different sea states using the optimization toolbox in MATLAB software. Similarly in [36], the optimization of the hydraulic energy storage module was conducted, and the result indicated that optimization of the hydraulic energy storage module helps to increase the system efficiency and the electrical energy generated from the HPTO unit.
Apart from that, the voltage fluctuations generated from the electrical sources are potentially harmful to electrical and electronic appliances [39,40]. Thus, the stability of the electrical energy generated from the HPTO unit is a crucial issue that should be emphasized; however, it is challenging to stabilize the electrical energy generated from the HPTO unit. The instability of the generated electrical energy from the HPTO unit is due to the unstable speed of the electrical generator and the hydraulic motor, which depends on the internal pressure of the HPTO unit. Authors in [10], suggest that the HPTO unit pressure can be regulated by controlling several components of the HPTO unit, such as hydraulic motor, hydraulic accumulator, hydraulic rectifier, battery energy storage, etc. Several solutions have been proposed to improve the stability of the generated electrical energy from the HPTO unit as addressed in [16,41,42,43,44,45,46,47,48]. In [41], the control strategy based on the fuzzy controller was designed to regulate the displacement of the hydraulic motor. The simulation results for the irregular wave condition verified that the proposed control strategy could mitigate the fluctuations in the output of the HPTO unit; however, the variable-displacement hydraulic motor requires more expense and more attention than the fixed-displacement hydraulic motor, as reported in [10]. In [42], a control strategy for the HPTO unit was proposed to realize the flexible rectification and hydraulic motor speed control simultaneously. From the results, the control strategy was able to accelerate the hydraulic motor slowly during the starting operation of the HPTO unit to reduce the negative impact on the power grid; however, the regular wave input was in used instead of irregular wave input in [42]; thus, the efficiency of the control strategy in irregular wave condition was unidentified.
The primary goal of this paper is to improve the stability of the generated electrical power output from the HPTO unit of WECs. The main contributions of the present paper are given as follows: (1) a novel fluid energy control (FEC) to regulate the flow of fluid entering the hydraulic motor is proposed; (2) a novel control strategy for FEC module for improving the stability of the generated electrical power from the HPTO unit is proposed. This paper is organized in four sections. Section 2 presents the technical descriptions of the considered WECs, including the configuration and the operation of the improved HPTO unit. Section 3 describes the dynamic modeling of the WA device and improved HPTO unit. The findings and discussions are presented in Section 4. Finally, Section 5 discusses the conclusion and future work.

2. WECs Concept

A similar concept of WECs in [22] was considered in the present study; however, several modifications to the HPTO unit are proposed to improve the quality of the electrical power generated from the WECs. In this section, the descriptions of WA device are firstly presented. Then, the configuration of the improved HPTO unit concept are described.

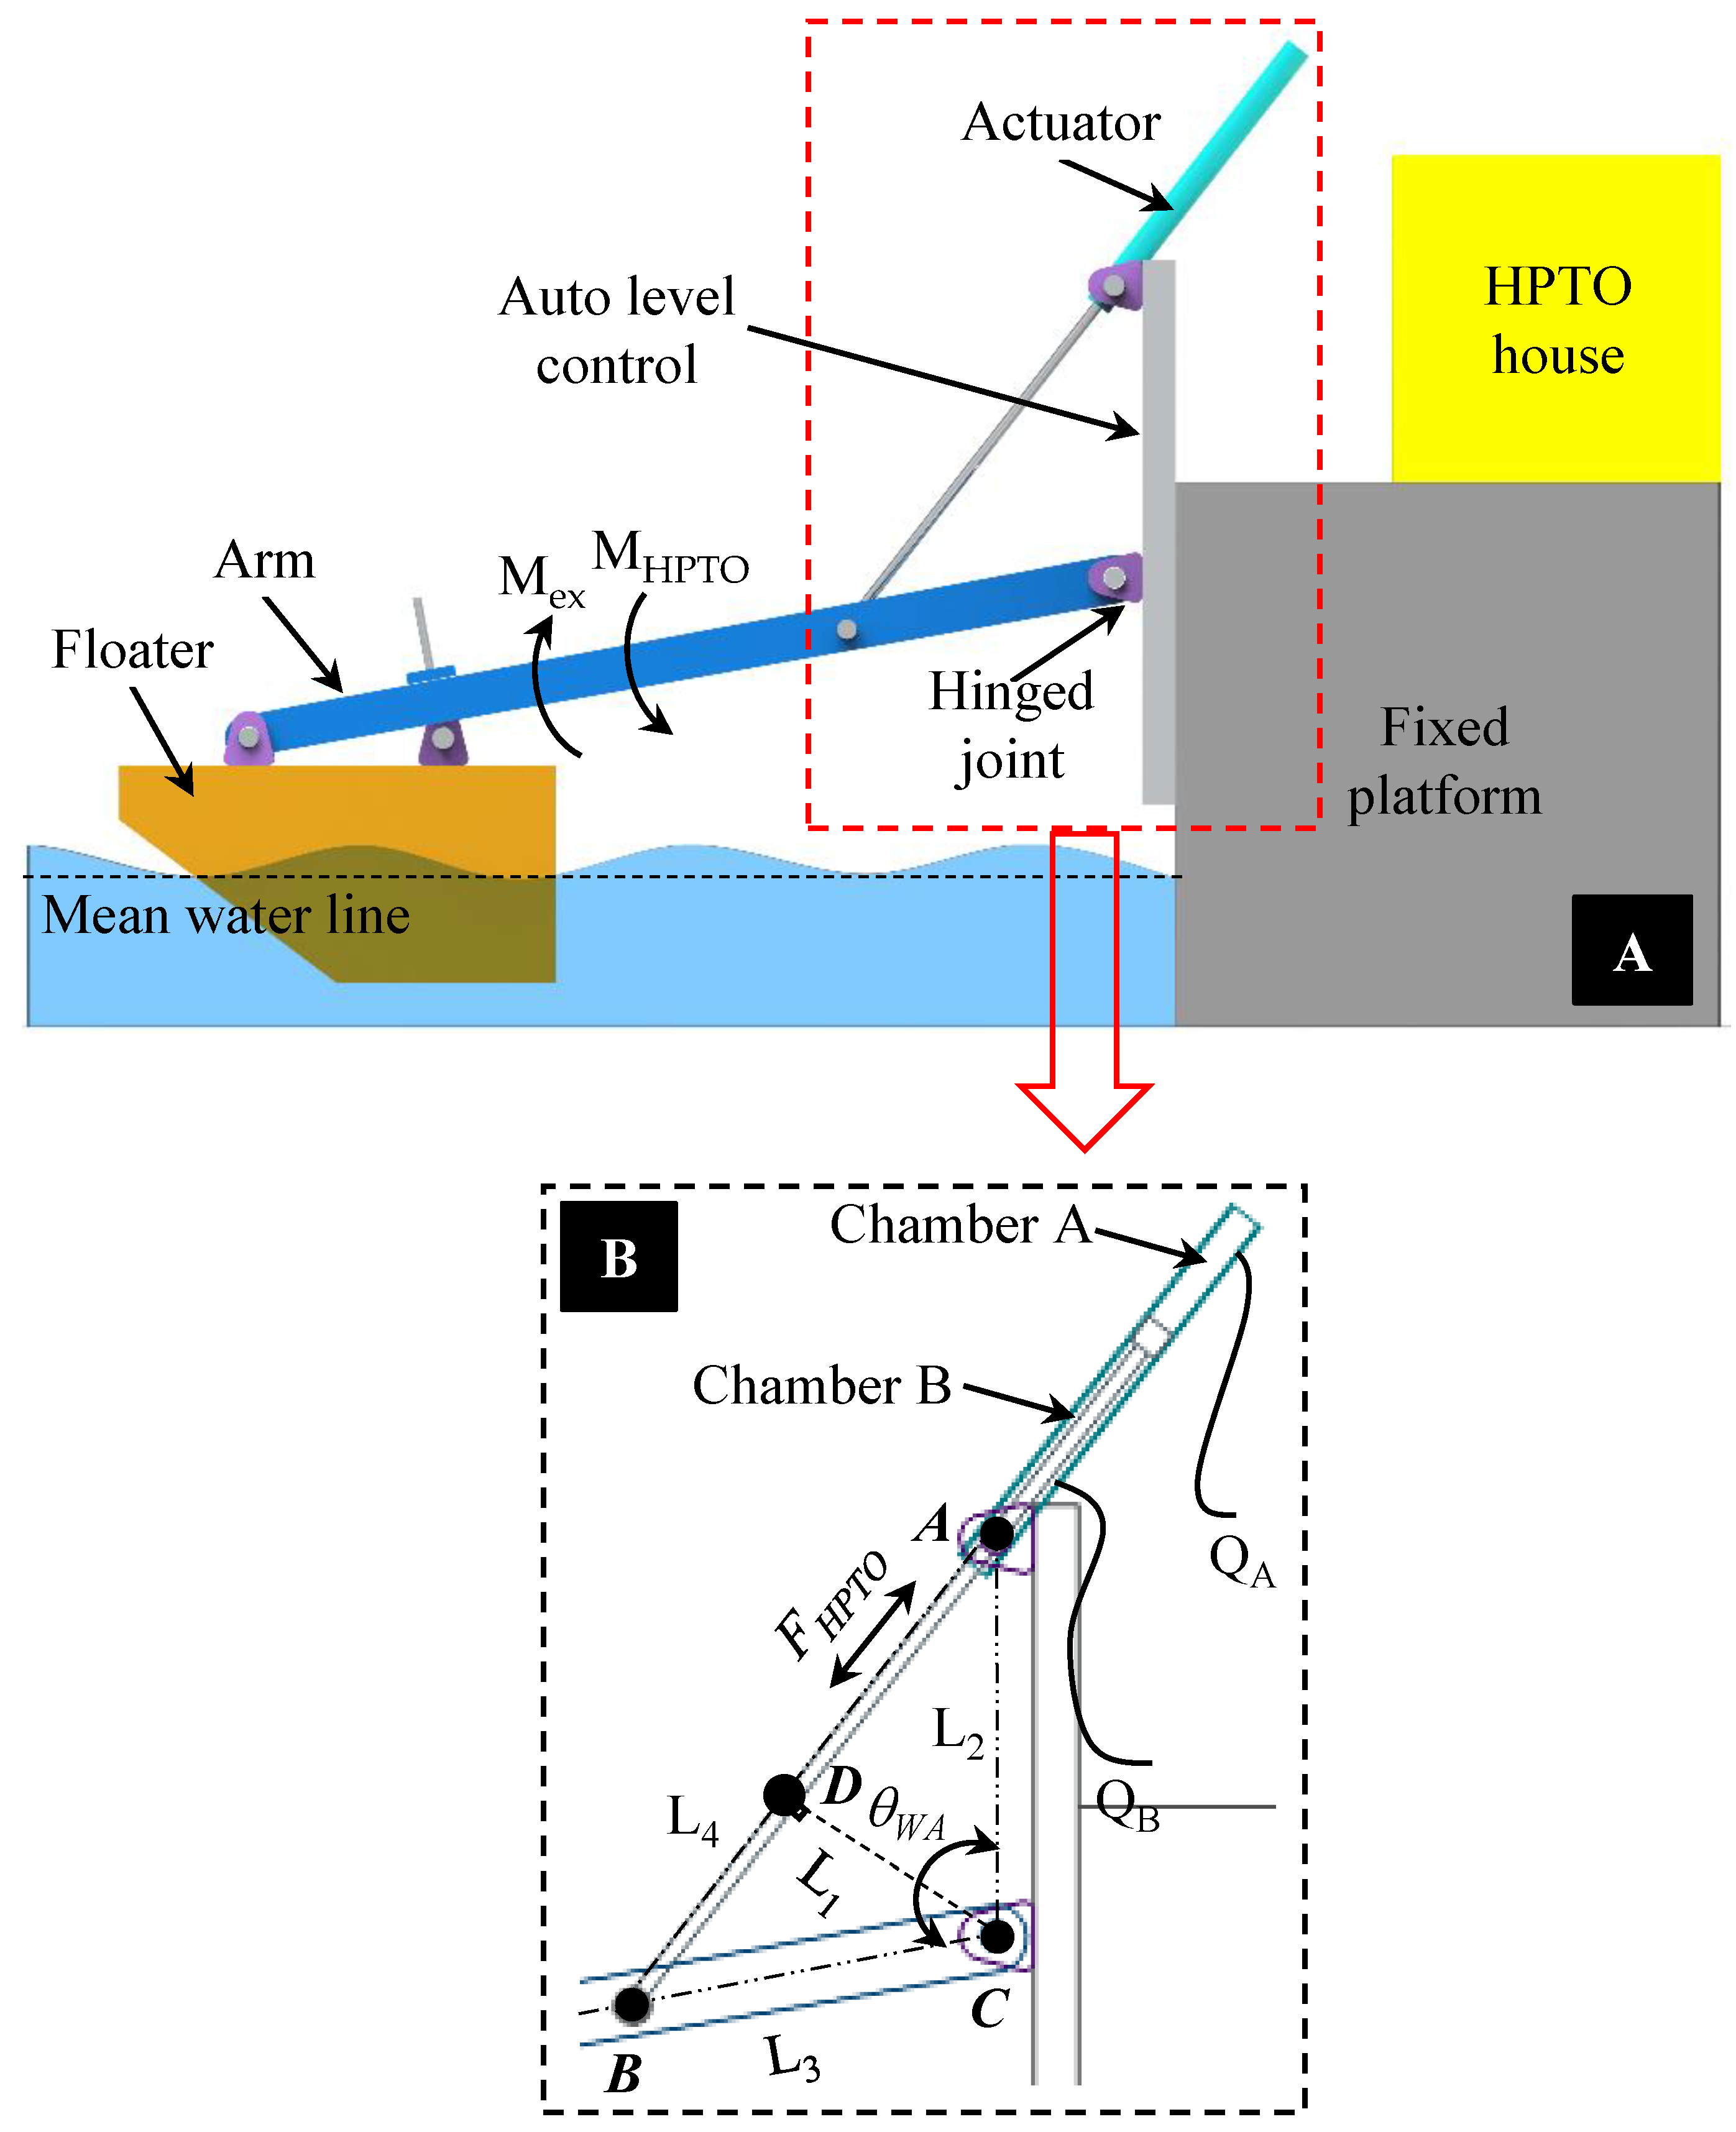
2.1. Descriptions of WA Concept

The simplified layout of the considered WECs in the present study is given in Figure 1. From the figure, the WA device consists of a floater and hingeable arm attached to automatic floater level control and the static platform facing the dominant ocean wave direction. An automatic floater level control is designed in the wave absorber device to ensure the wave absorber device can operates at any sea level. Thus, the effect of the sea tide level can be significantly reduced. The WA device is then connected to the HPTO and the CS units, separately located in the HPTO house through a hydraulic actuator (HA) module. A single-rod double-acting type of hydraulic cylinder is utilized as a hydraulic actuator to ensure the mechanical energy produced during the bi-directional pitch motion of the WA device can be maximally absorbed, as suggested in [10]. The hydraulic actuator barrel is attached to the fixed platform, while the piston rod is connected to the floater’s arm. The hydraulic actuator is then connected to the rest of the HPTO unit components using two hydraulic hoses. The working principle of the considered WA device is almost similar to the WA device concept used in [19,20]. The passing ocean waves through the floater initially cause the WA device to pitch up and down. The WA device directly drives the hydraulic actuator and operates the HPTO unit.

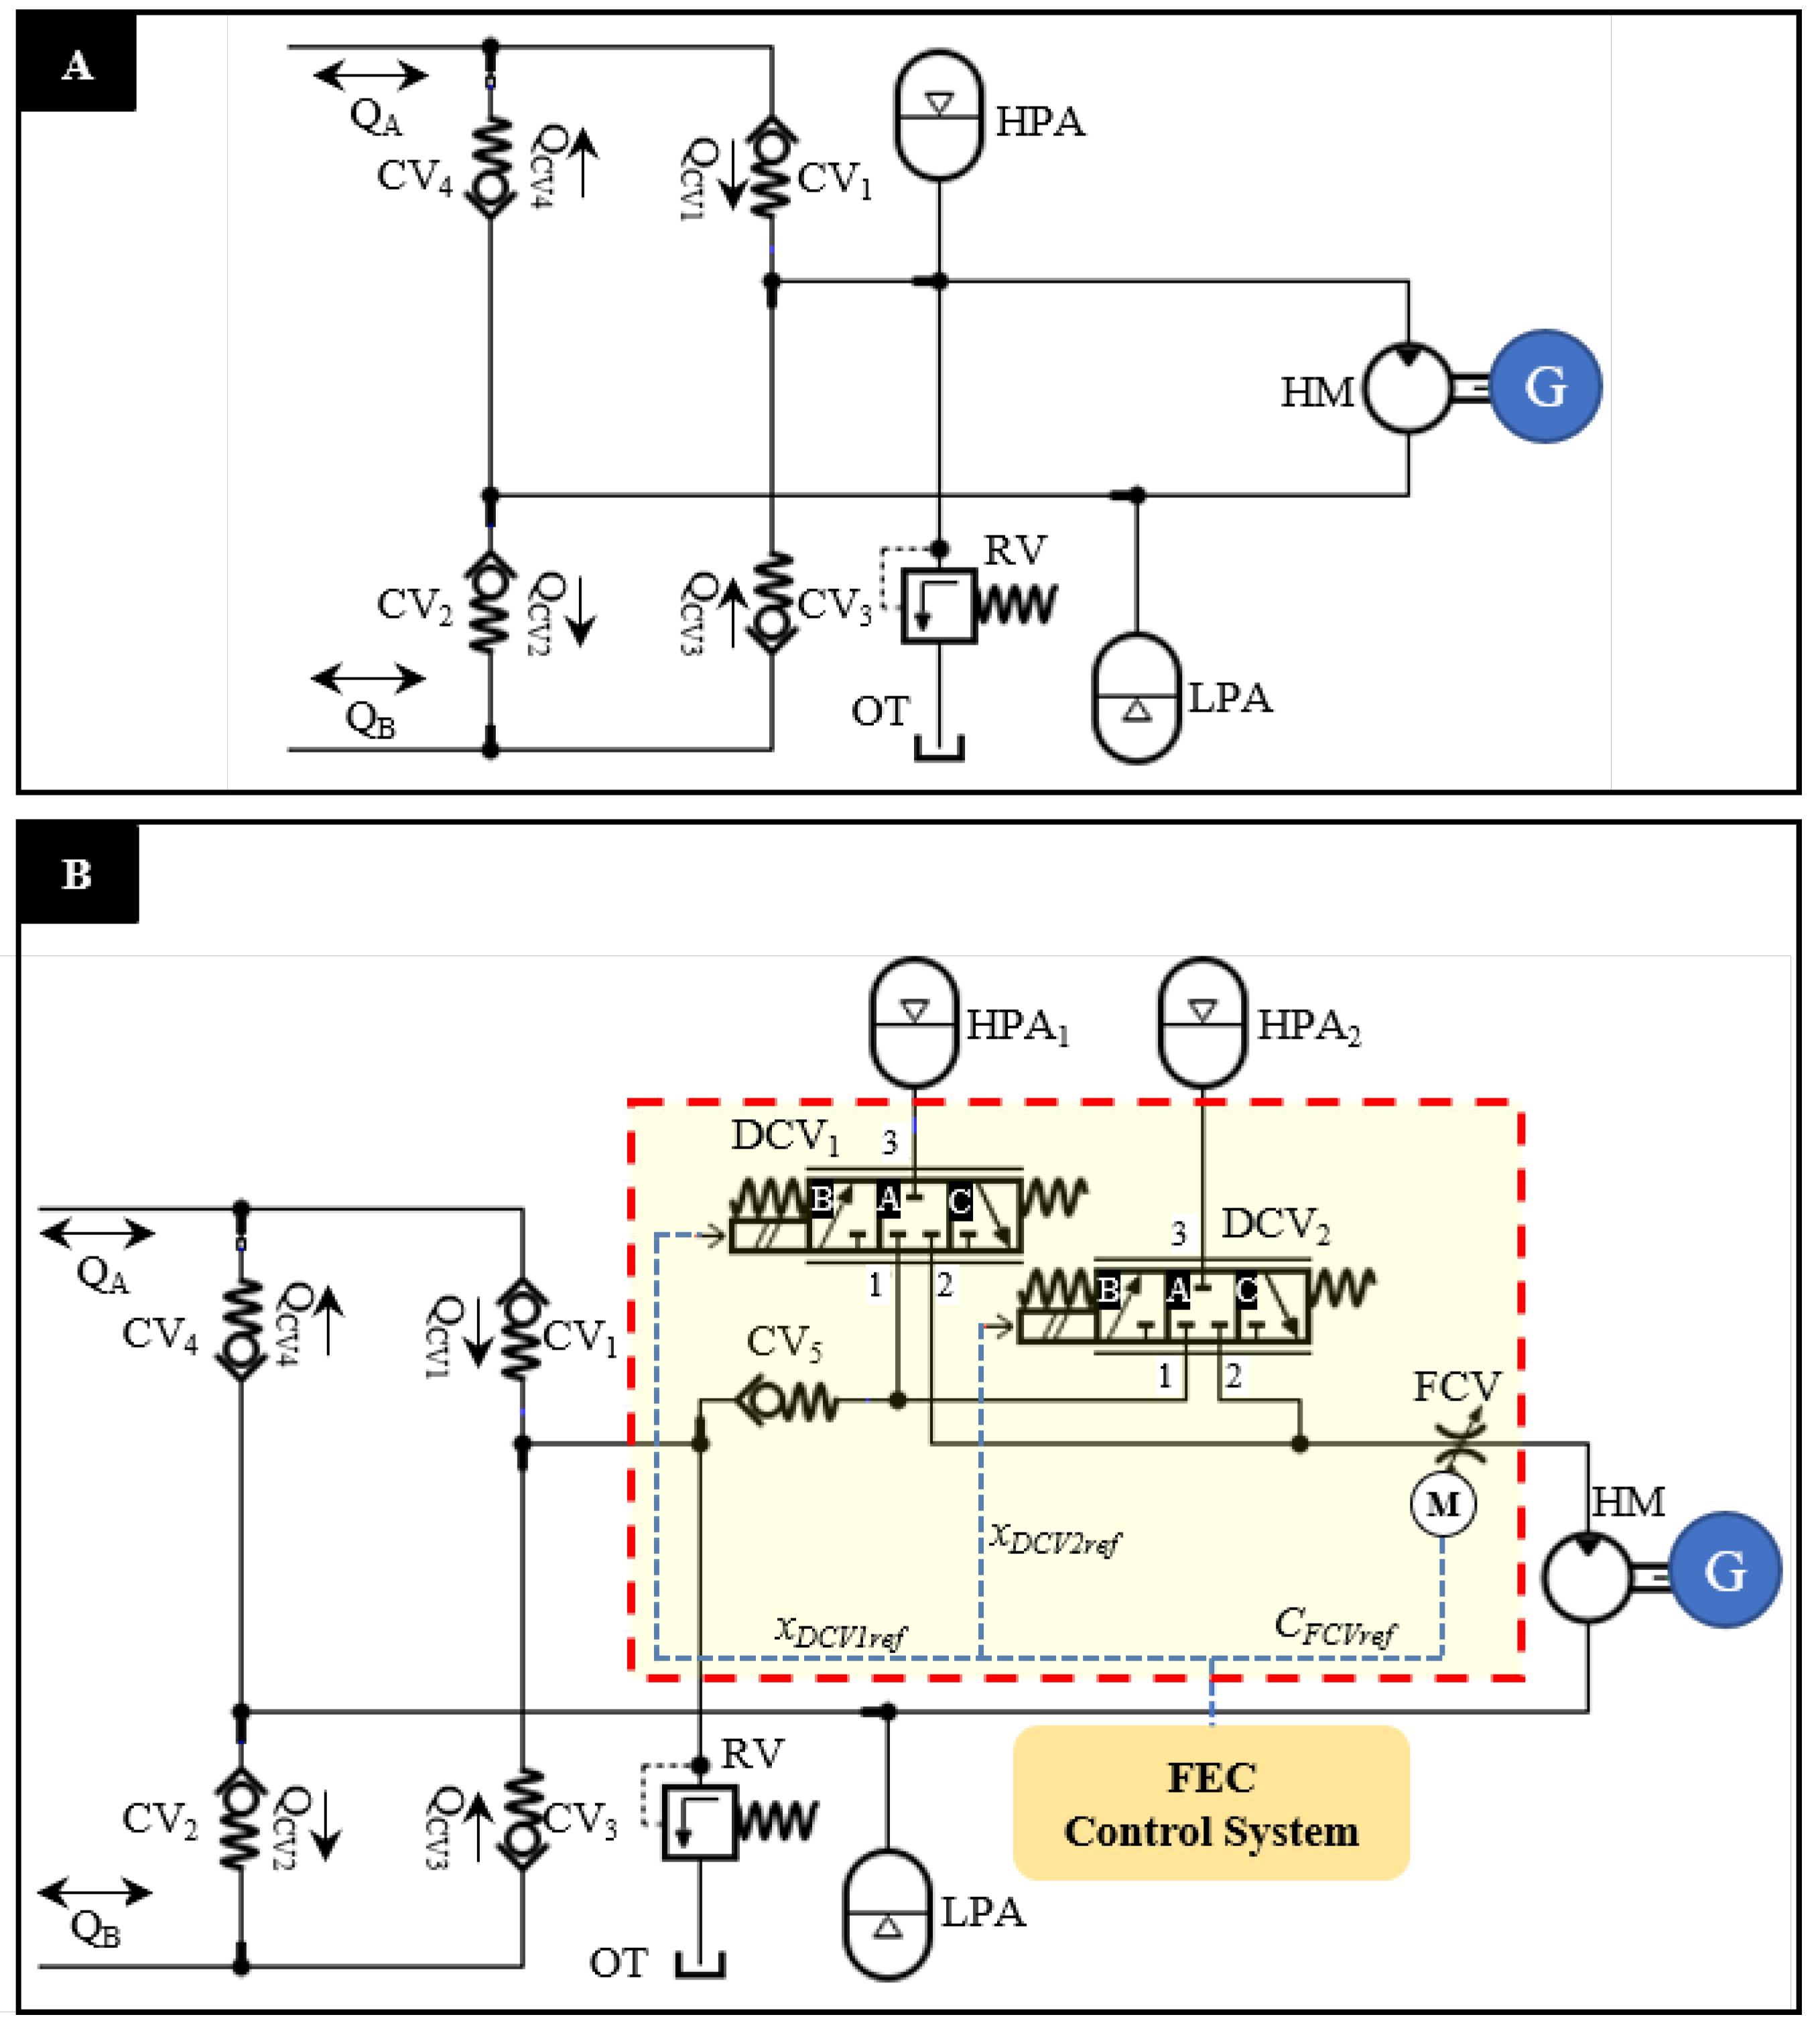
2.2. Descriptions of the Improved HPTO Concept

Figure 2 illustrates the simplification of the conventional HPTO concept previously was used in [22] and the improved HPTO unit concept proposed in the present study. In the conventional HPTO concept, the hydraulic actuator module is connected to the rectification module, which consists of the four non-return check valves (CV1, CV2, CV3, and CV4) through hydraulic hoses. By relating Figure 1B and Figure 2A, the CV1 inlet and CV4 outlet terminals are connected to the top side of the hydraulic actuator barrel. The inlet and outlet terminals of CV3 and CV2 are connected to the bottom side of the hydraulic actuator barrel. The rectification module is then connected to the generation module, which includes a fixed displacement hydraulic motor (HM) coupled with the permanent magnet synchronous generator (G). The fluid energy storage module comprises two bladder-type hydraulic accumulators, namely a high-pressure accumulator (HPA) and a low-pressure accumulator (LPA), placed between the rectification module and generation module. Additionally, the pressure relief valve (RV) is installed on the high-pressure line to avoid the over-pressurized event in the HPTO unit.
During the operation, the back-and-forth motions of the hydraulic actuator due to the WA device motion generate high-pressure fluid in the hydraulic actuator barrel. The high-pressure fluid from the top side of the hydraulic actuator barrel flows through CV1, HPA, HM, LPA, and CV2 to the bottom side of the hydraulic actuator barrel during the upward pitch motion. Conversely, during the downward pitch motion, the high-pressure fluid from the bottom side of the hydraulic actuator barrel flows through CV3, HPA, HM, LPA, and CV4 to the top side of the hydraulic actuator barrel. Finally, the high-pressure fluid flowing through the hydraulic motor forces the hydraulic motor and generator to rotate synchronously in the same direction, resulting in useful electrical power; thus, the generated electricity from the generator significantly depends on the hydraulic motor speed, which is subjected to the ocean wave input characteristics.
In [22], the operation of the conventional HPTO unit was optimized using a genetic algorithm. The optimization process was intended to maximize the generated electrical power from the HPTO unit. Seven important parameters of the conventional HPTO unit, for example, hydraulic motor displacement, hydraulic cylinder size, hydraulic accumulator capacity, etc., were considered during optimization process. Overall, the findings demonstrated that the conventional HPTO unit could generate electrical power reached up to 62% of the rated capacity under irregular wave circumstances; however, the generated electrical power from the conventional HPTO unit highly fluctuated under irregular wave circumstances; thus, as suggested by the authors, some improvements should be implemented on the conventional HPTO unit to ensure it can generate a better quality of electrical power at the maximum capability.
The output power of the generator, as well as the frequency of the electricity, can be maintained if the hydraulic motor speed remains consistent. For the variable-displacement hydraulic motor case, the hydraulic motor speed can be controlled either by adjusting the volumetric displacement or the volumetric flow rate of the hydraulic motor; however, the variable-displacement hydraulic motor requires more expense and more attention than the fixed-displacement hydraulic motor [10]. Since the fixed-displacement hydraulic motor was considered in the conventional HPTO concept, the hydraulic motor speed only can be controlled by adjusting the volumetric flow rate of the hydraulic motor. To reduce the hydraulic motor speed, mechanical fluctuation, and electrical power fluctuation, several modifications to the conventional HPTO concept were proposed, as presented in Figure 2B. First, a dual HPA module is used instead of a single HPA module was used in the conventional HPTO unit. Second, the FEC module is added to provide a less-fluctuated and more constant fluid flow to the hydraulic motor by managing the charge/discharge processes of the dual HPA module and controlling the volumetric flow rate.
In the modified HPTO unit, the dual HPA module is used to eliminate the fluctuations of the hydraulic oil flow to the hydraulic motor. HPA1 is used as a primary fluid energy storage, while HPA2 is used as a backup fluid energy storage. As indicated in Figure 2B, the HPA1 and HPA2 with similar volume capacity are connected in parallel to the FEC module. FEC module consists of a hydraulic check valve (CV5), 3-way direction control valves (DCV1 and DCV2), an electrical motorized flow control valve (FCV), a control strategy, and other electronic components. CV5 is added at the charging line to prevent the reverse hydraulic oil flow from the HPA1 and HPA2 during their high-pressure state. DCV1 and DCV2m which is operated by the electric solenoid valve are used to control the charging and discharging processes of the HPA1 and HPA2 by regulating their hydraulic flows directions. DCV1 and DCV2 are composed of three ports and three blocks. Ports 1 and 2 of DCV1 and DCV2 are connected to the charging and discharging lines. Ports 3 of DCV1 and DCV2 are connected to the HPA1 and HPA2, respectively. In addition, FCV is used to control the volumetric flow rate from the HPA1 and HPA2 to hydraulic motor. In the improved HPTO unit model, the FEC module was assumed to be powered by external power supply, such as solar power or local power sources.
The overall operation of the FEC module is driven by a proposed control strategy, as depicted in Figure 3. The control strategy is divided into two parts. Part A is designed to control the charging and discharging process of the dual HPA module within the pressure constraint. The minimum and maximum hydraulic oil pressure constraints of HPA1 and HPA2 are set to 47 Bar and 48.5 Bar, respectively. The feedback output of the HPA1 pressure is used as input for the control strategy in part A. The reference positions of DCV1 and DCV2 ( x D C V 1 , r e f and x D C V 2 , r e f ) are the outputs from the control strategy in part A. Part B of the control strategy is designed to regulate the volumetric flow from HPA1 and HPA2 to the hydraulic motor. Figure 4 presents a closed-loop PID controller that is used in part B of the control strategy. The generator rated power ( P G , S e t ) and the instantaneous electrical power generated output ( P G ) are the inputs of the closed-loop PID controller. In this case, the P G , S e t is set to 100 W. A proportional–integral–derivative (PID) controller automatically adjusts the FCV flow coefficient ( C F C V ) with respect to P G , S e t . C F C V , r e f is the output from the closed-loop PID controller.
The operation of the FEC module is started with analyzing the pressure state of HPA1 ( P H P A 1 ), whether it reaches the lowest ( P H P A 1 , m i n ) or highest ( P H P A 1 , m a x ) of considered constraints. When P H P A 1 reaches P H P A 1 , m a x , the FEC module controller automatically regulates DCV1 and DCV2 to positions C and B in order to change HPA1 and HPA2 to discharge and charge mode. Conversely, the FEC module controller automatically regulates DCV1 and DCV2 to positions B and C once P H P A 1 reaches P H P A 1 , m i n in order to change HPA1 and HPA2 to charge and discharge mode. During P H P A 1 is within the constraint, DCV1 and DCV2 positions remain as previously mentioned. The charging and discharging processes of HPA1 and HPA2 are completed once P H P A 1 reaches P H P A 1 , m i n and P H P A 1 , m a x , respectively. Finally, the PID controller automatically regulates C F C V , r e f according to the deviation of P G , S e t and P G . The overall FEC module process iteratively loops until the end of the HPTO unit operation.

3. Wave-to-Wire Model of the Considered WECs

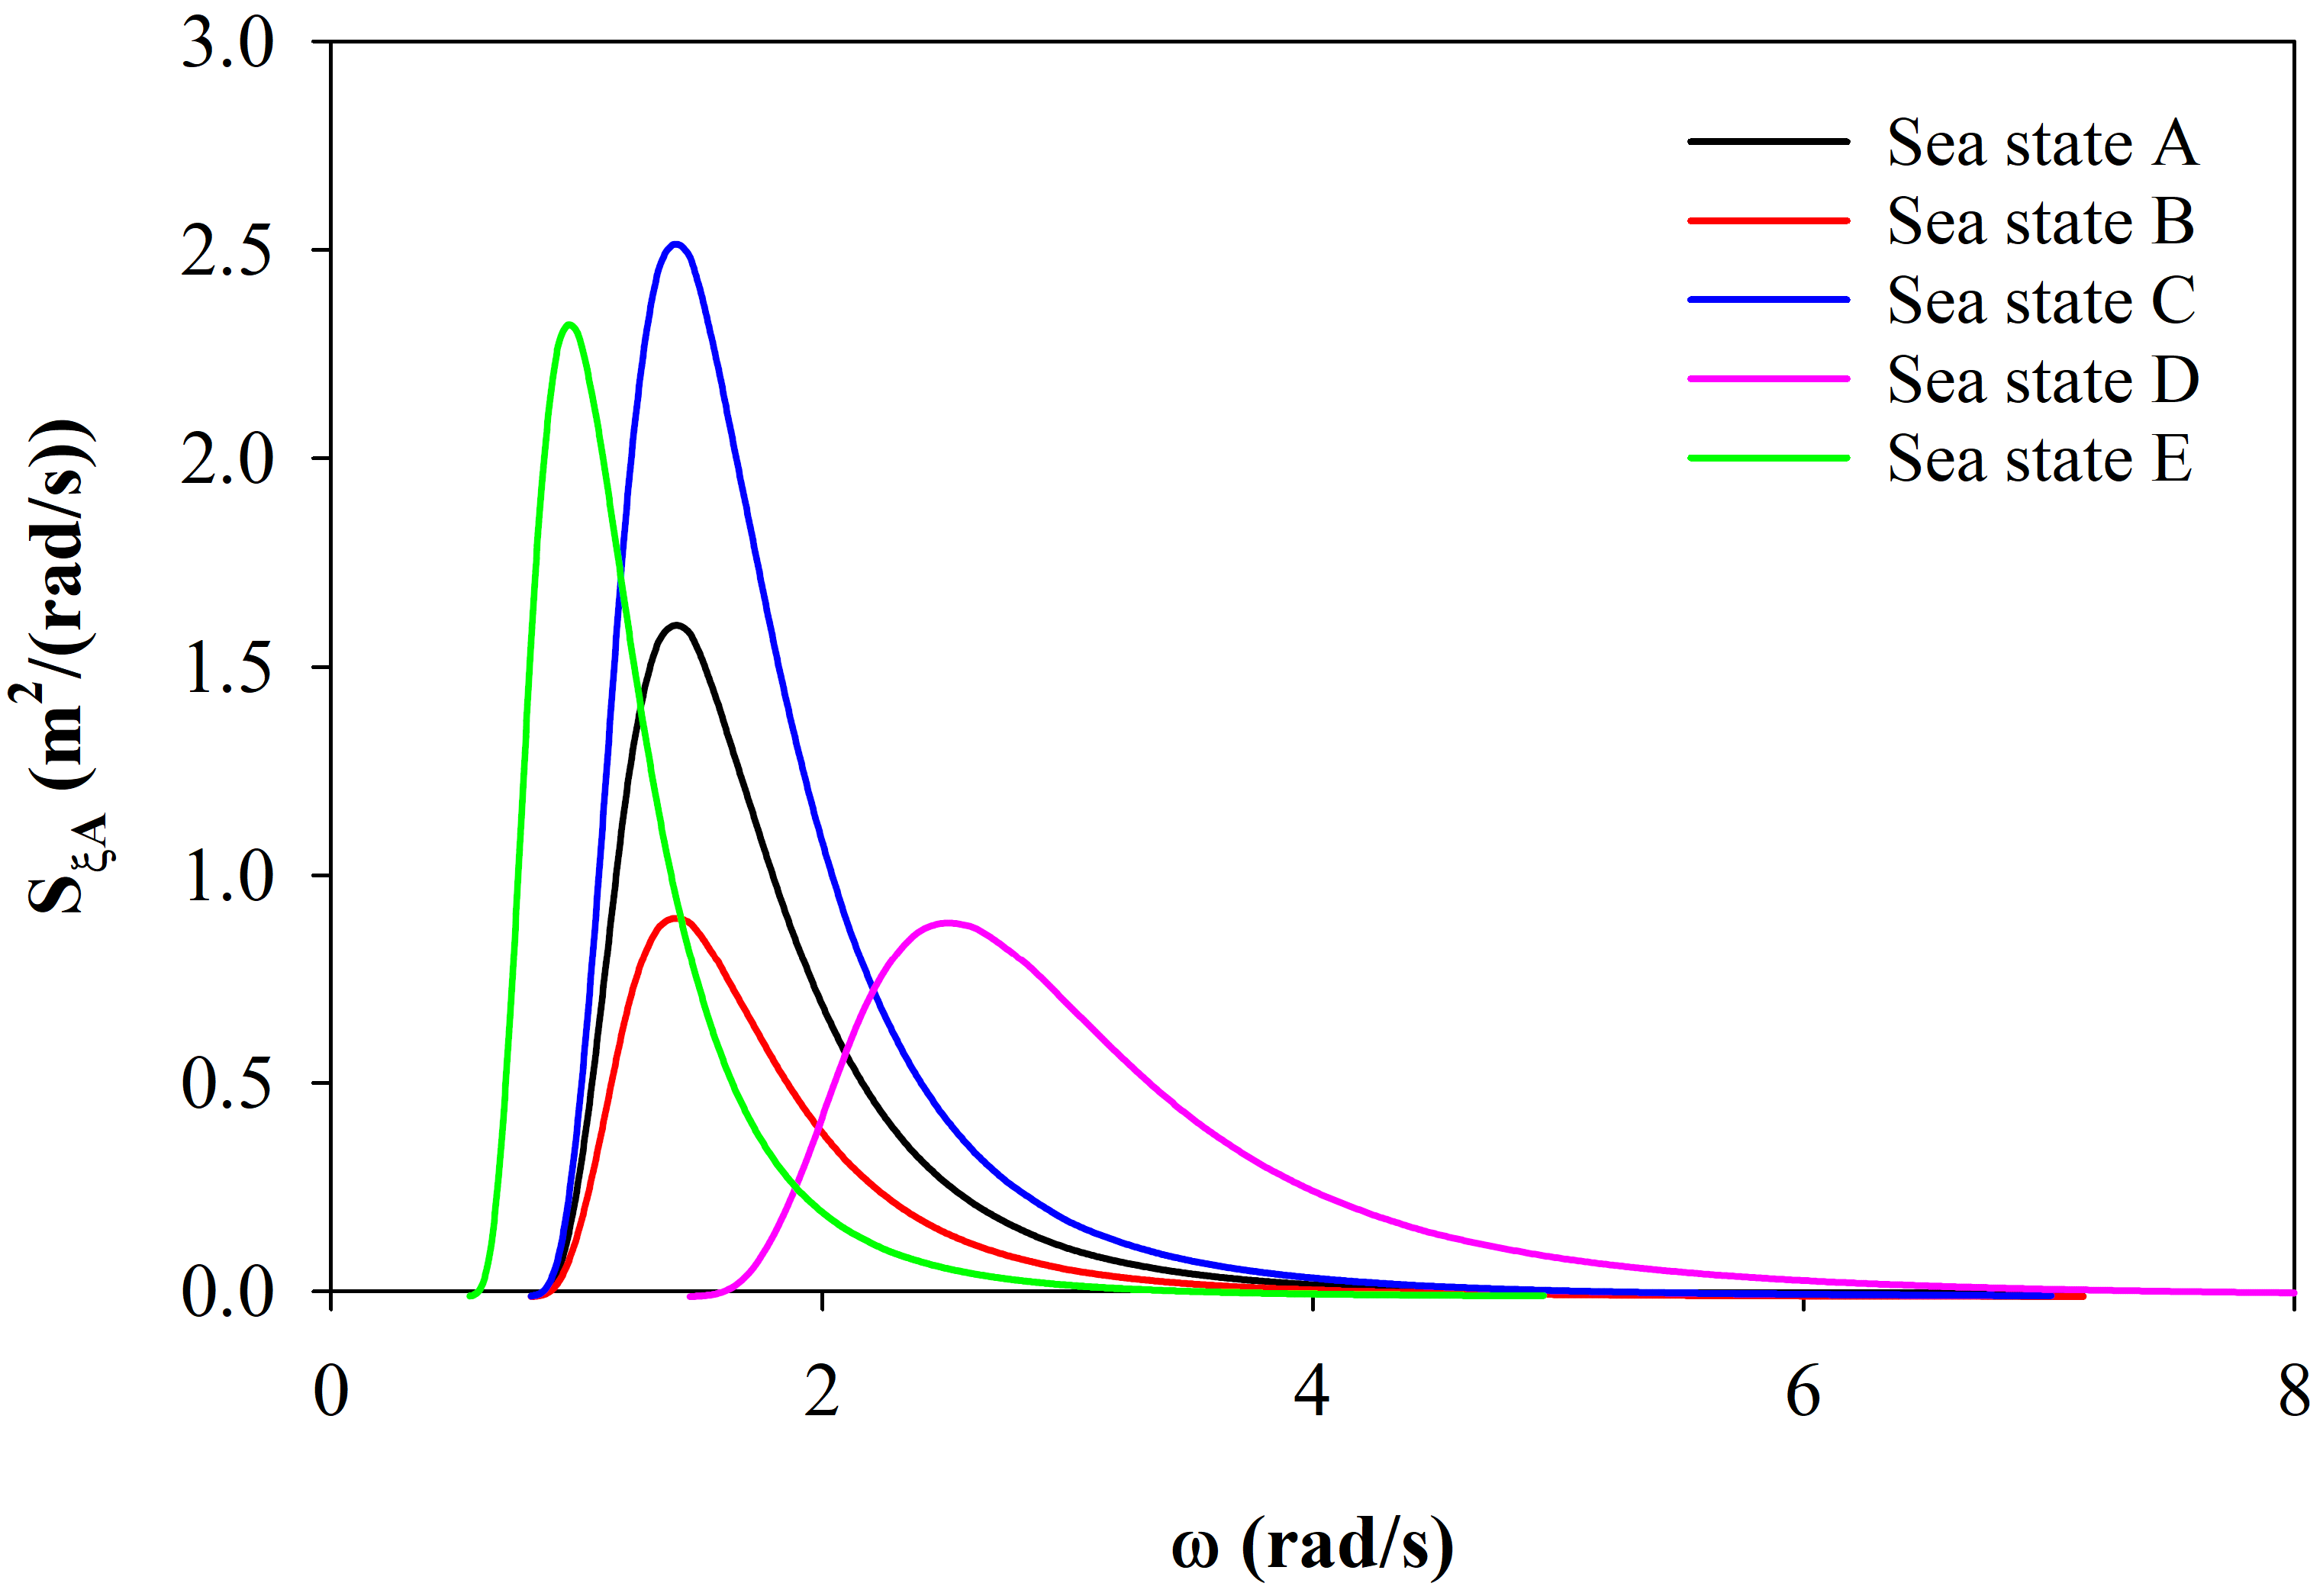
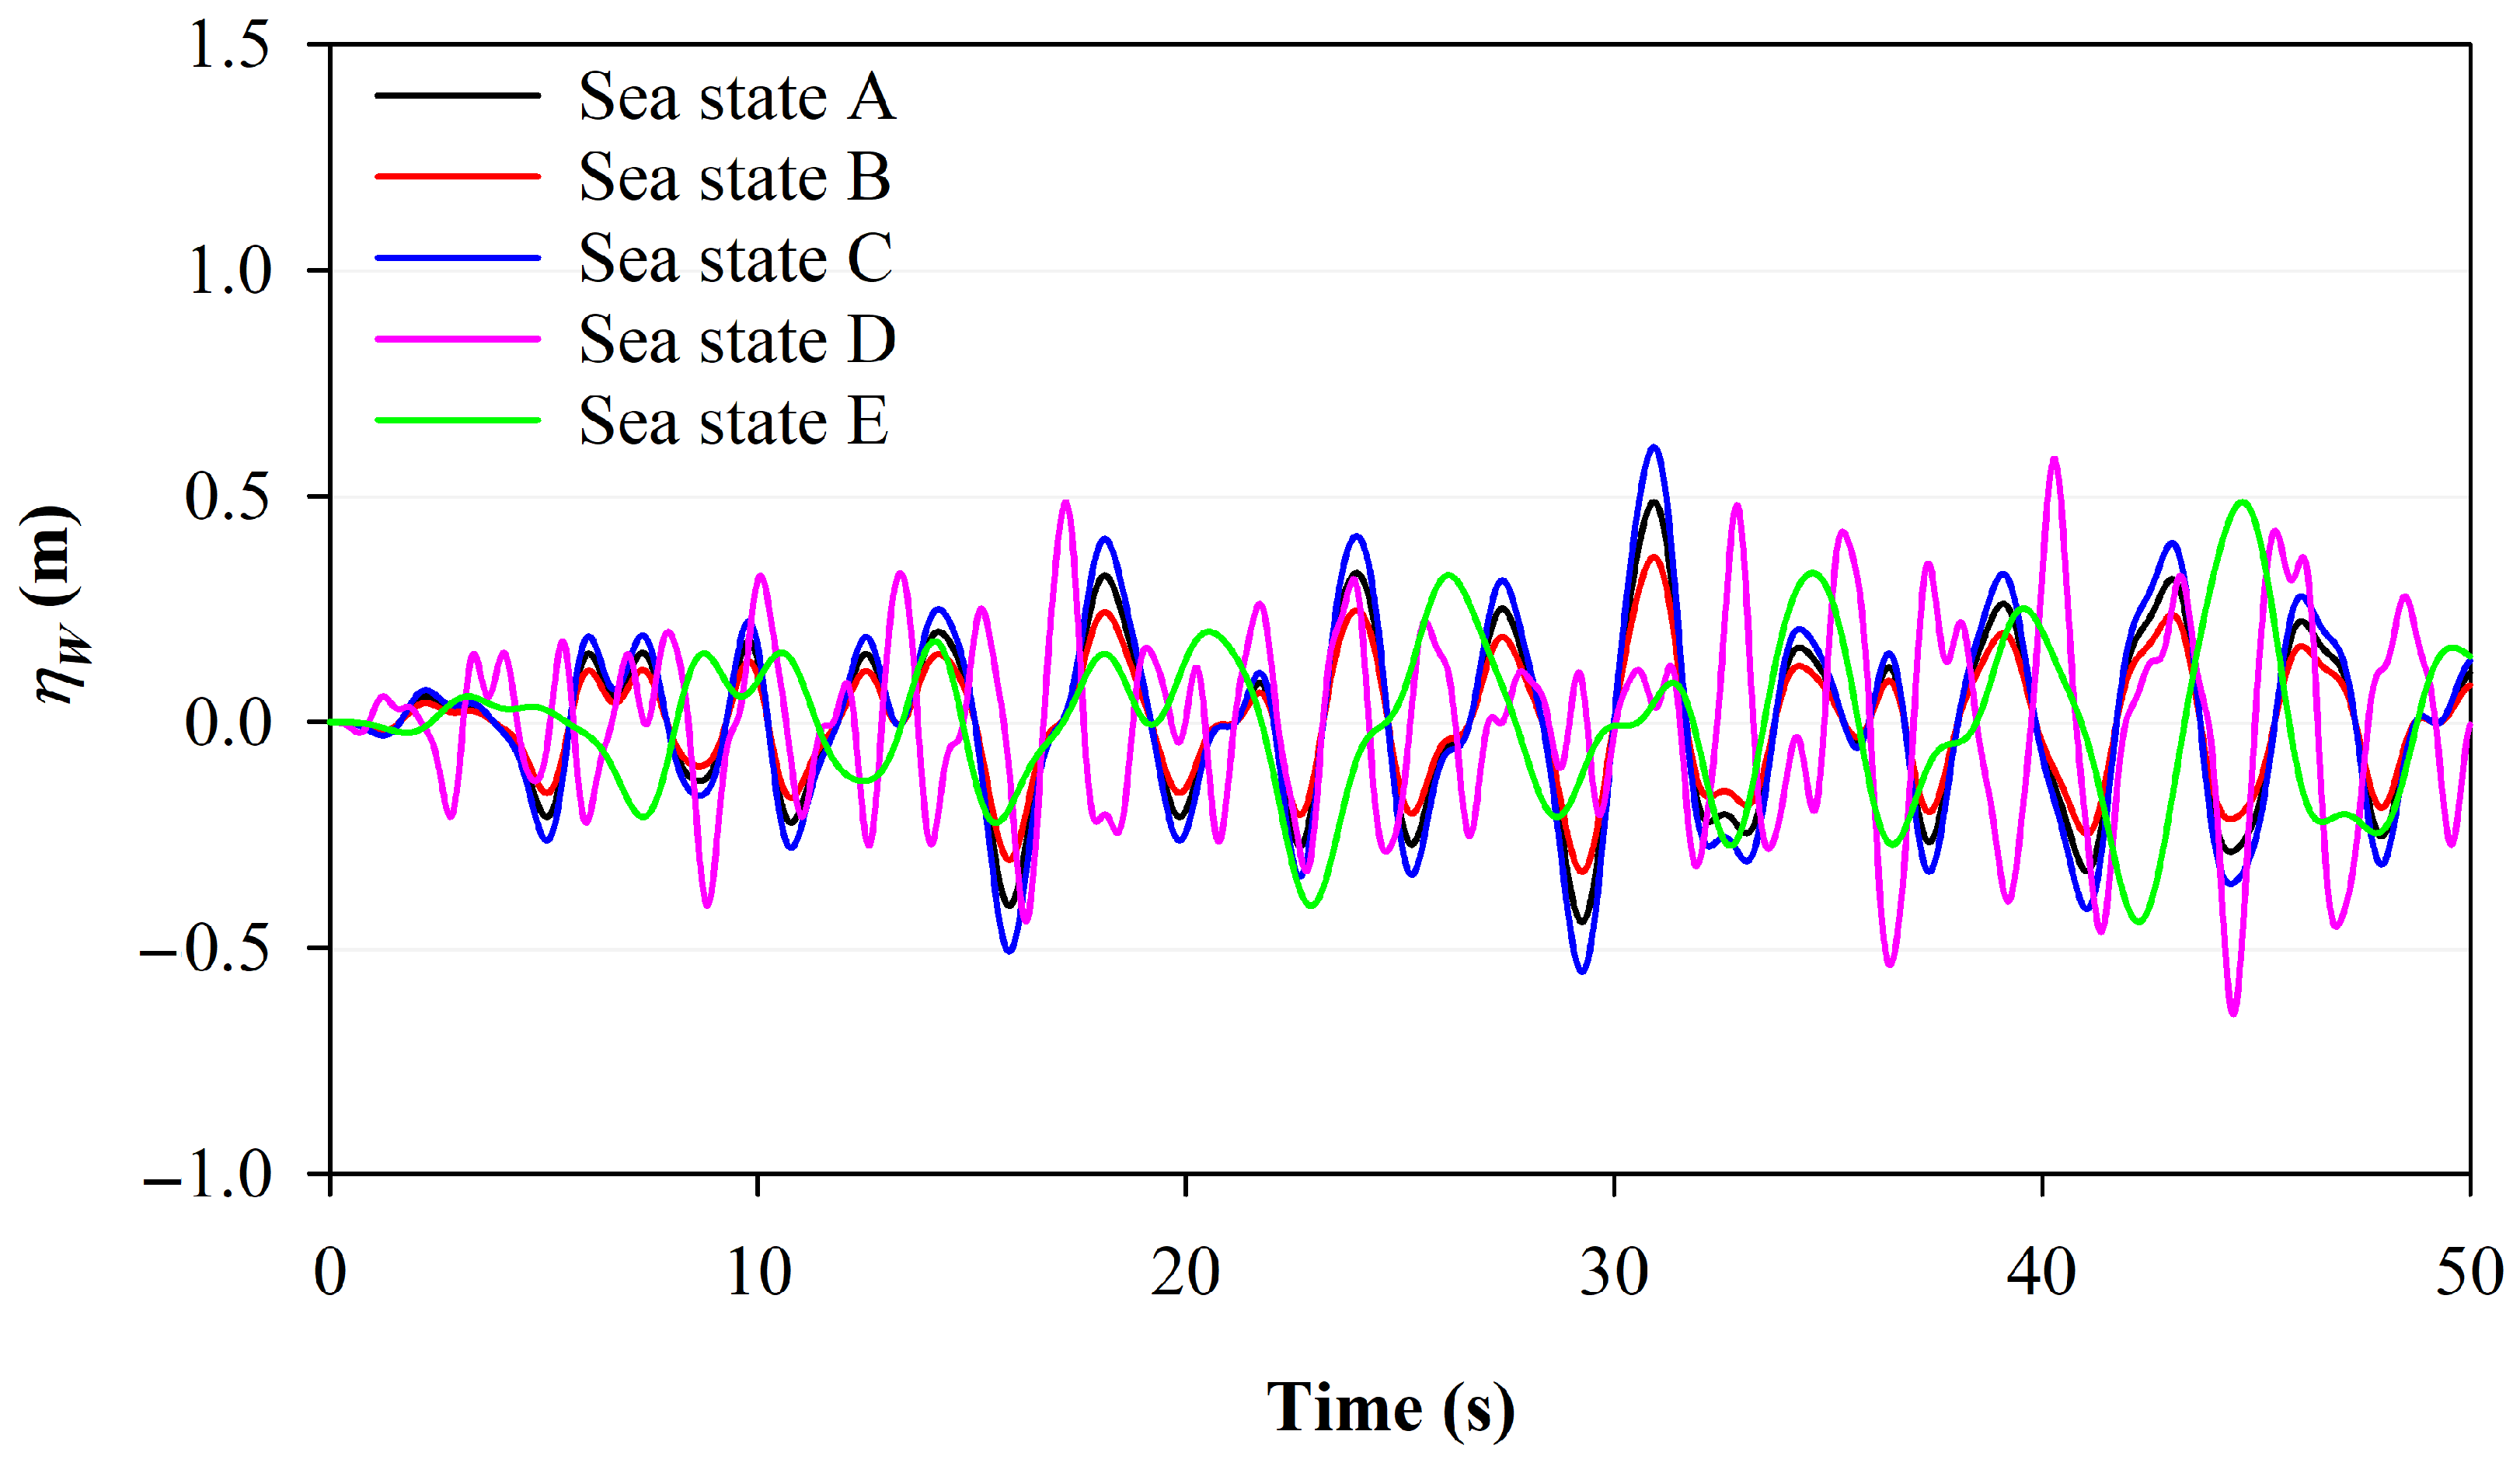
3.1. Irregular Wave Inputs

In the present study, five different irregular wave profiles are created in order to evaluate the robustness of the proposed control strategy in mitigating the power fluctuations of HPTO unit. The different irregular wave profiles are created based on the Pierson–Moskowitz spectrum using AQWA toolbox in ANSYS (Pennsylvania, United States). The characteristics of five different irregular wave profiles with different H s and T p are summarized in Table 1. Sea state A is considered as the nominal wave condition. Sea states B and C are used for the different H s cases, while sea states D and E are considered for the different T p cases. For sea state A, the values of H s and T p are set to 0.8 m and 4.5 s. For sea states B and C, the H s is set to 0.6 m and 1.0 m (±0.2 m of nominal H s ), while T p is maintained at the nominal value for both cases. Meanwhile, for sea states D and E, H s is maintained at the nominal value while T p is set to 2.5 s and 6.5 s (±2.0 s of nominal T p ). The wave profiles of sea states A to E are generated for a 500 s time period. The wave spectra and the example of generated irregular wave profiles for 50 s time period are presented in Figure 5 and Figure 6.

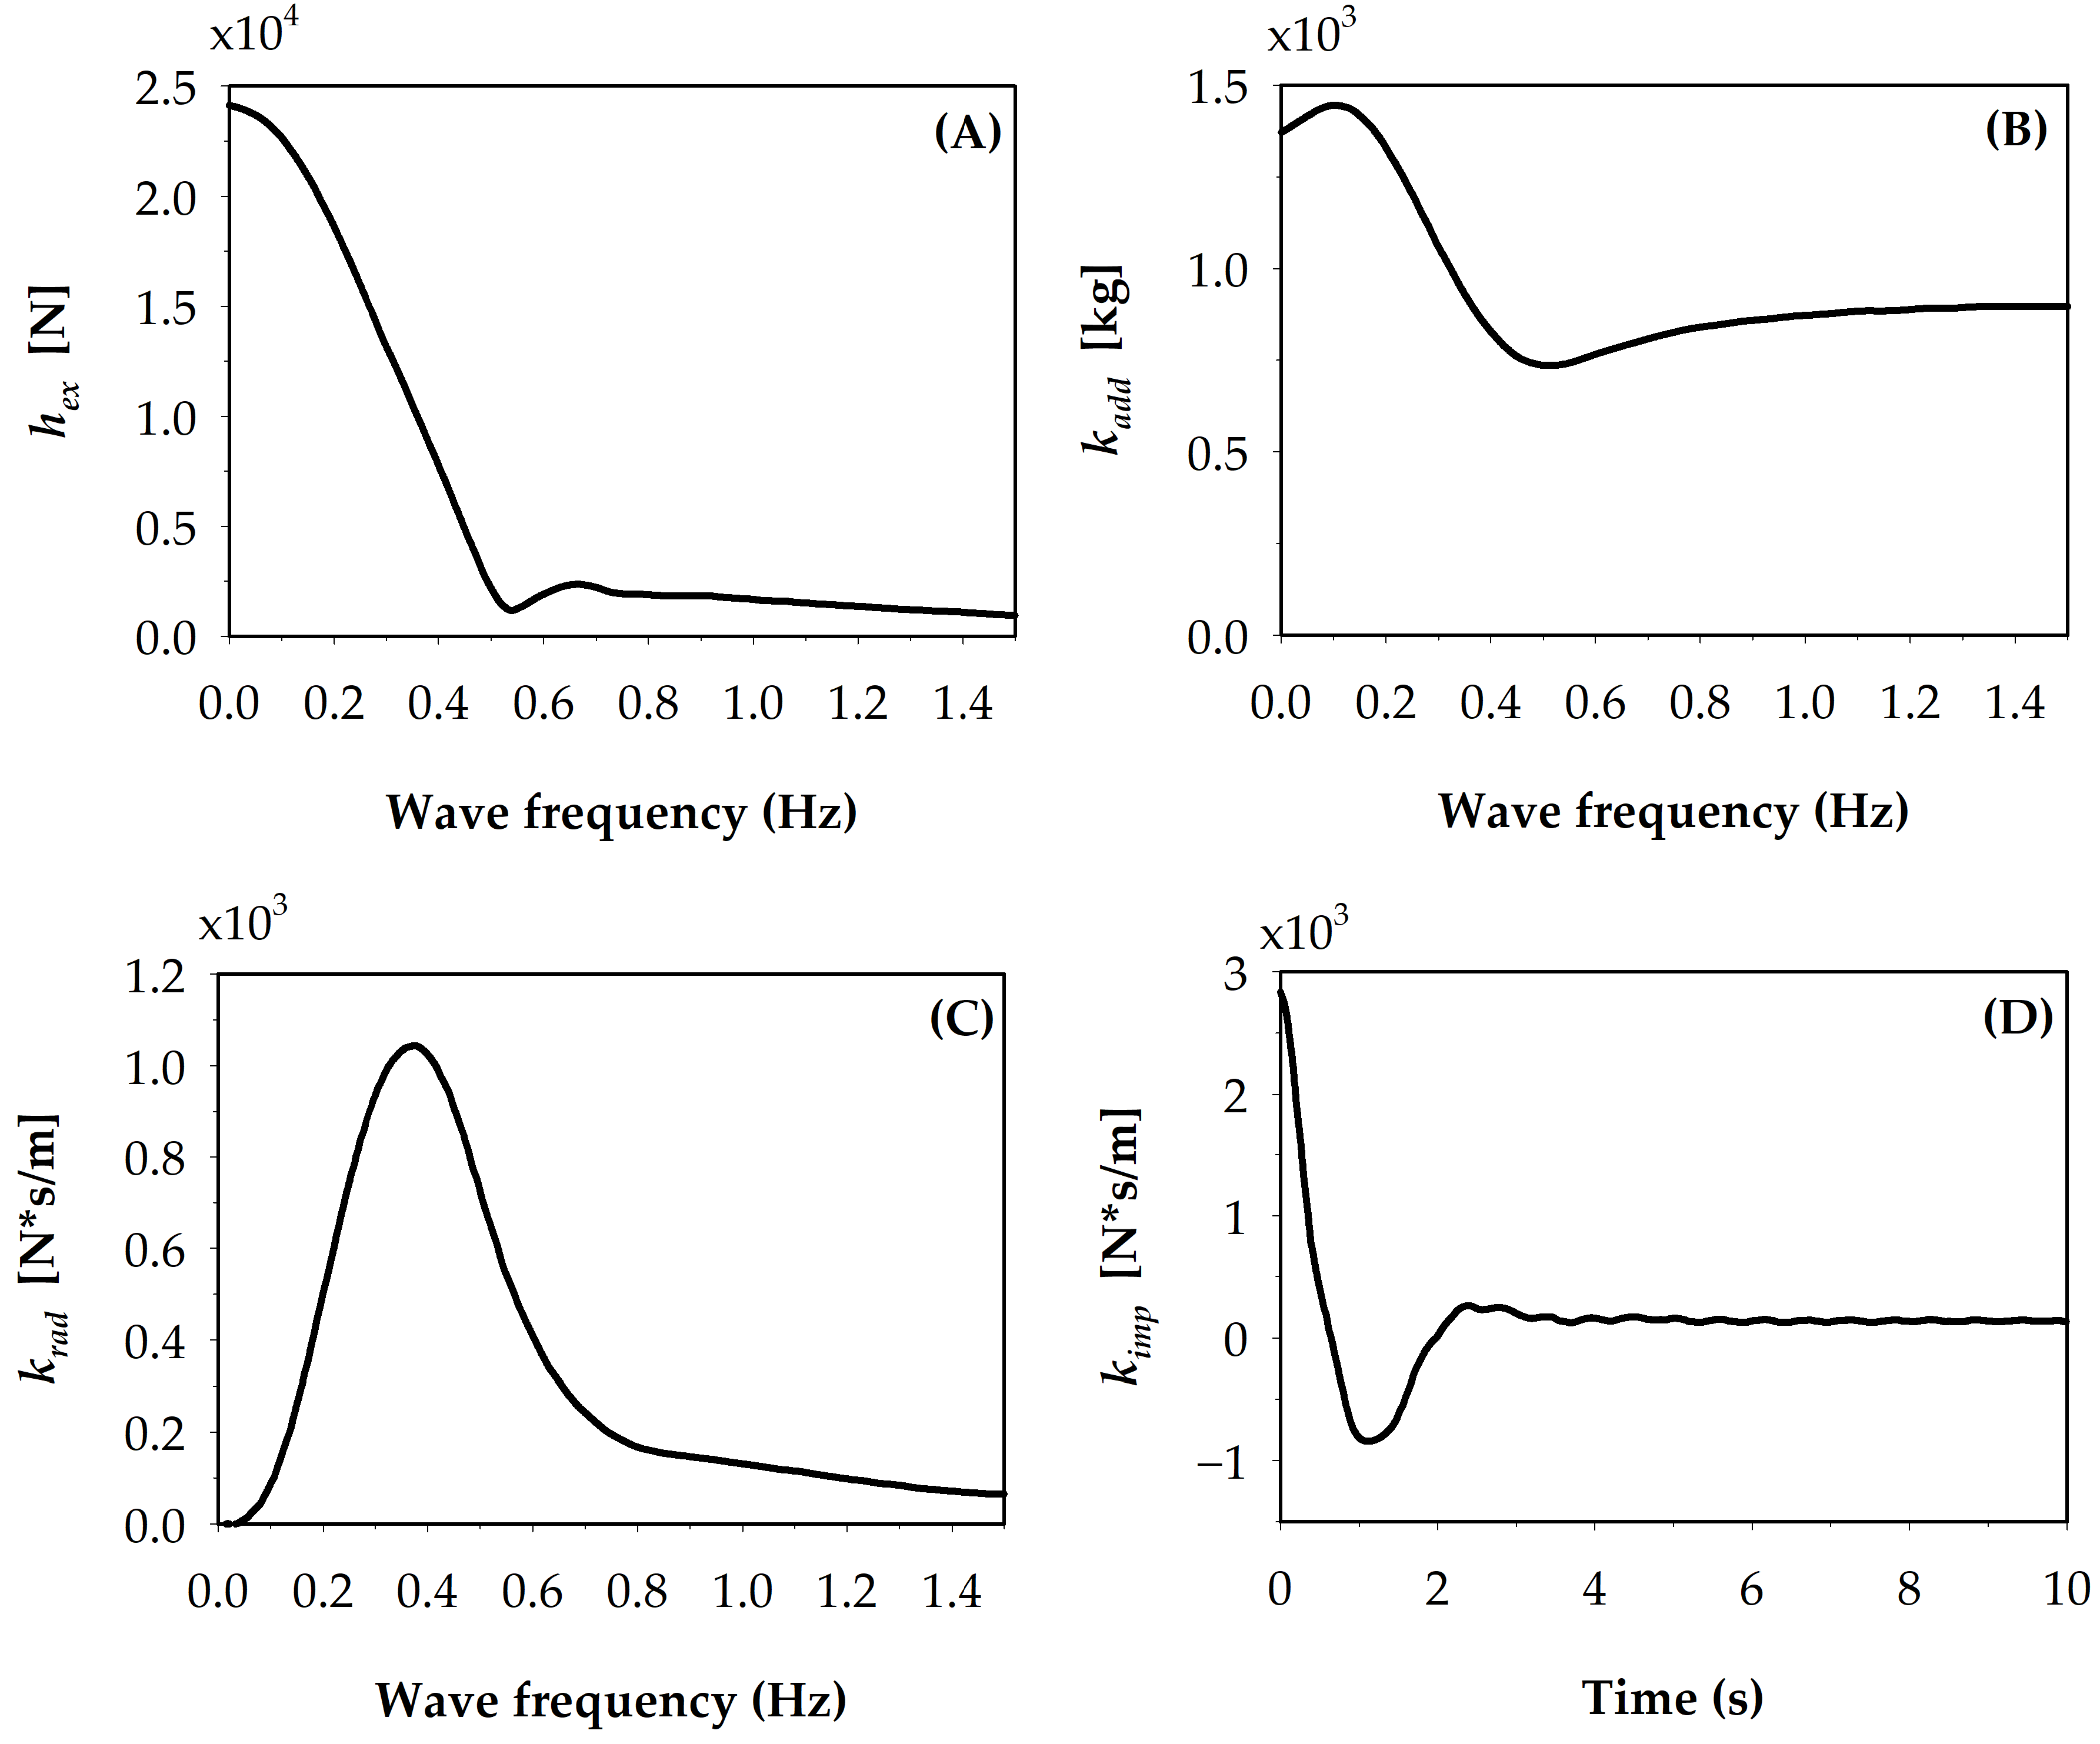
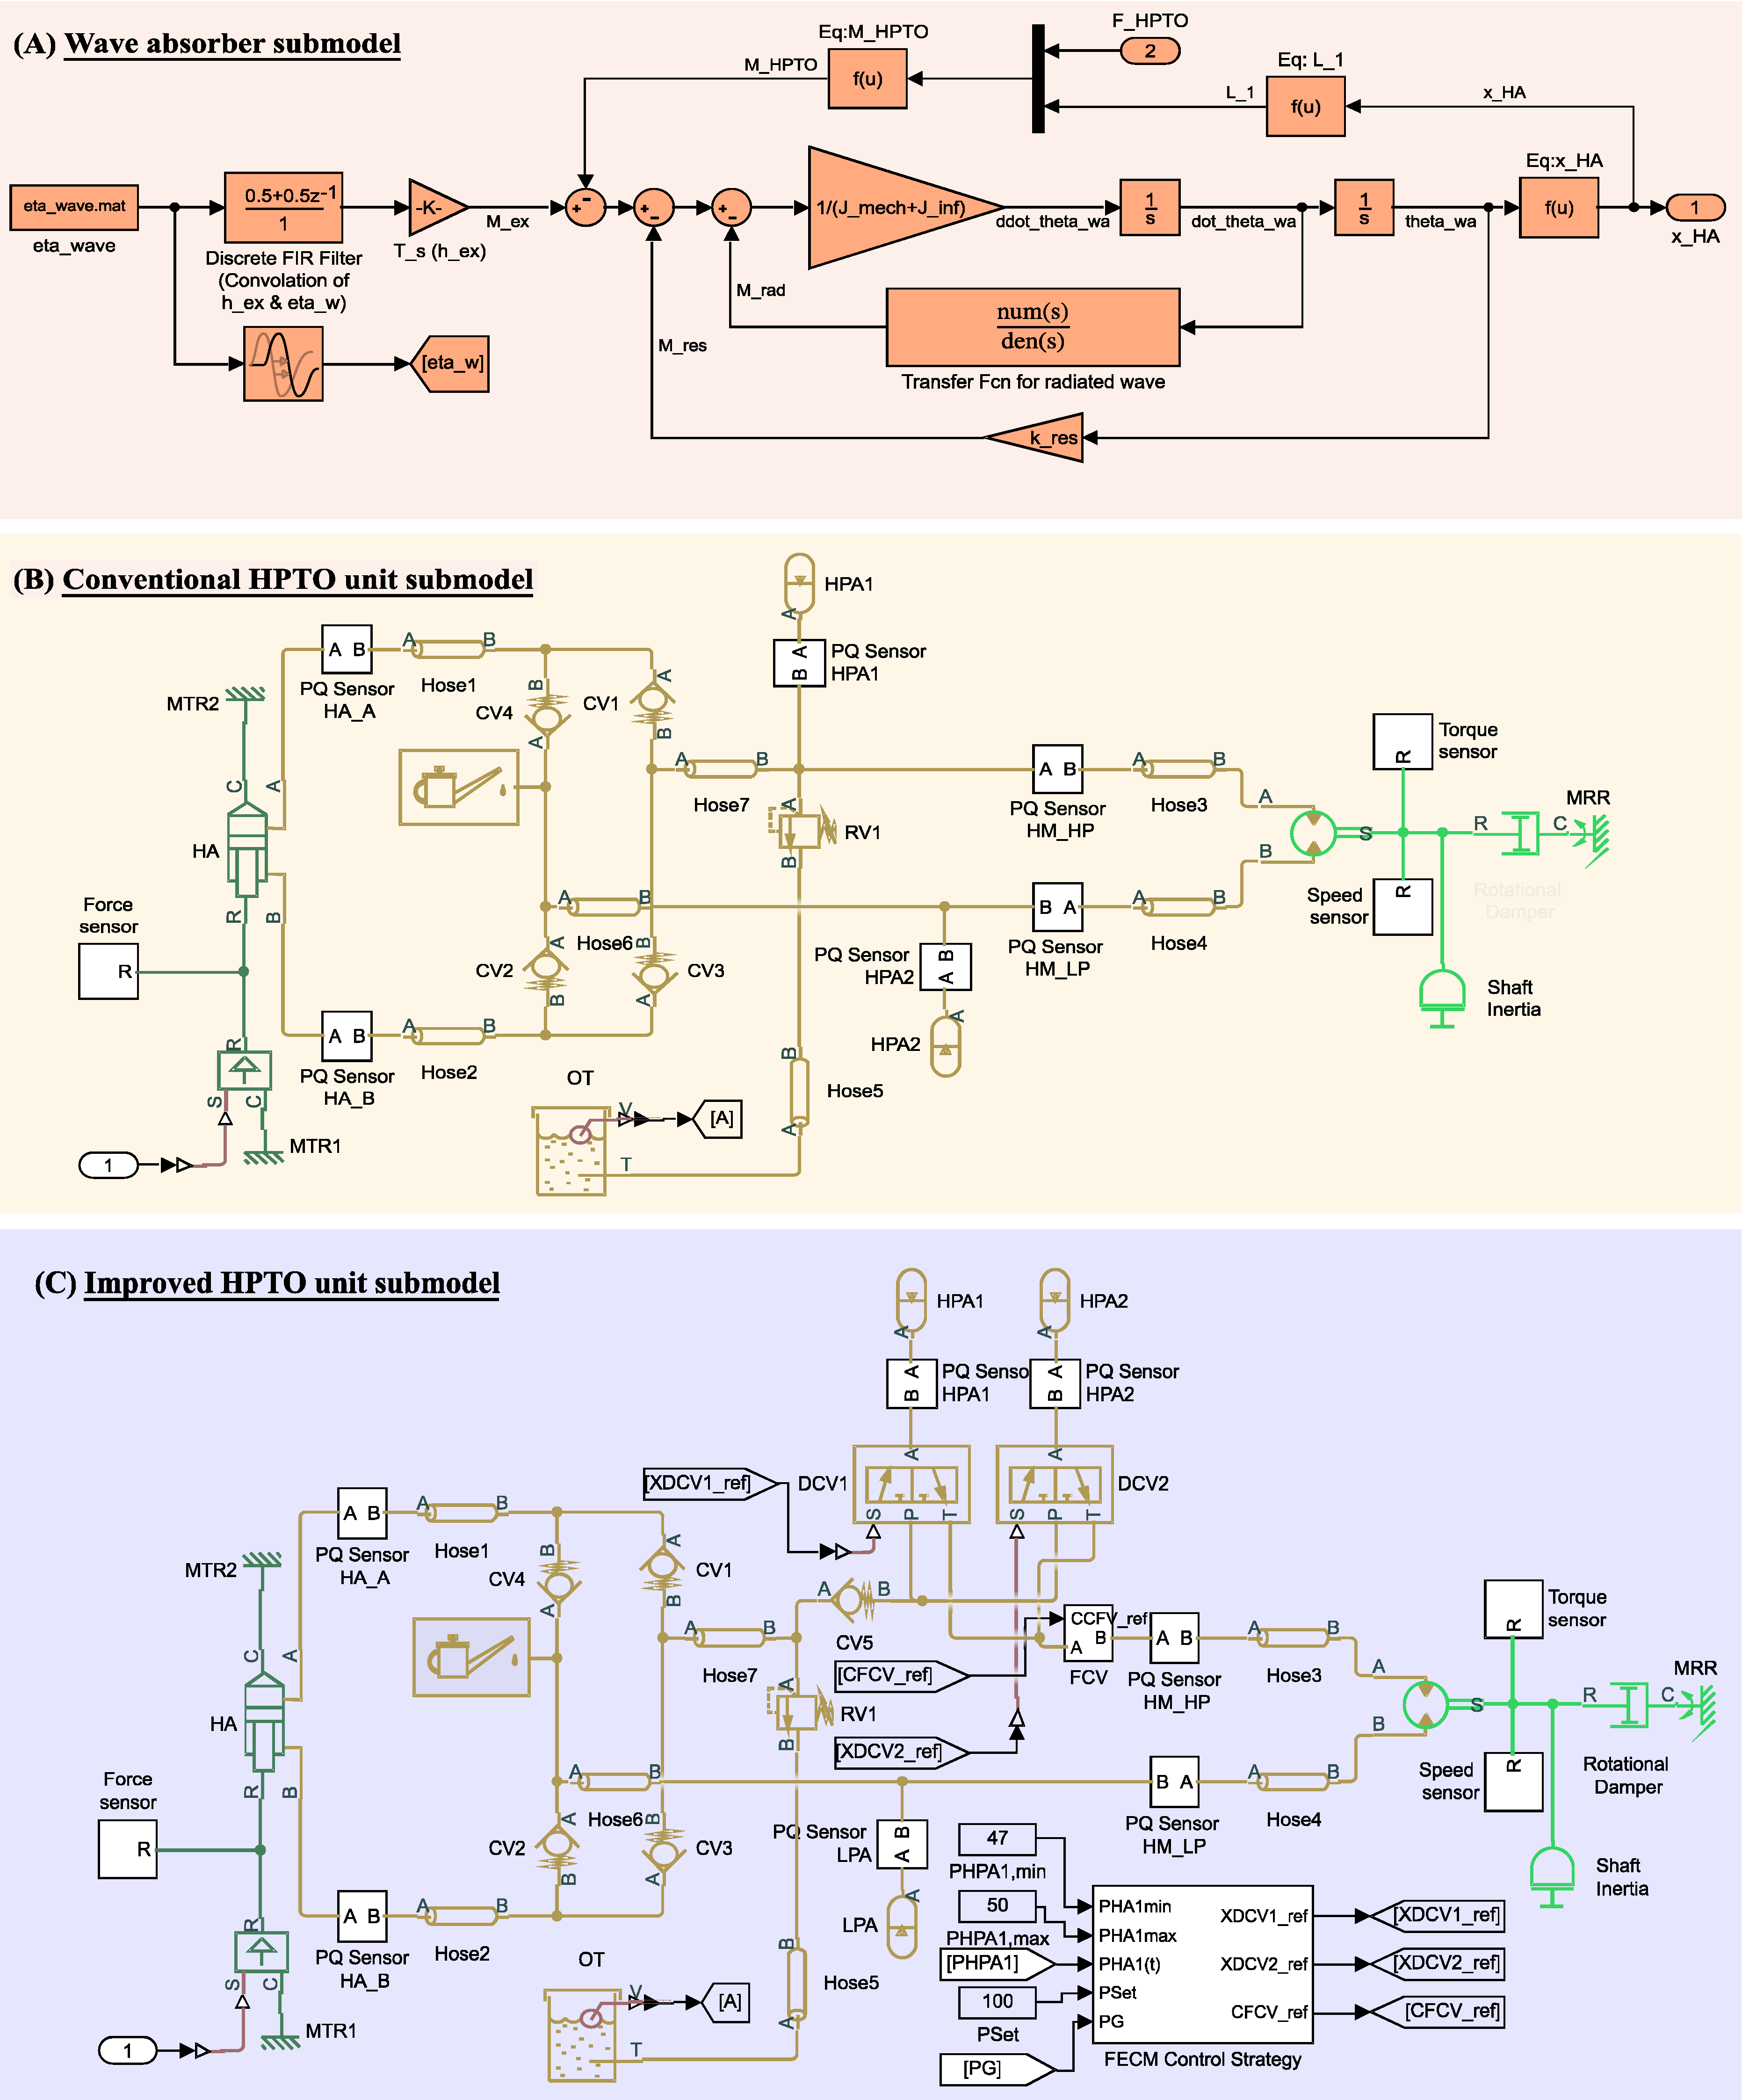
3.2. Dynamic Model of the WA Device

The hydrodynamic pitch motion of the WA device in the actual ocean waves are described based on the time-domain equation as given in Equation (1) [19,38]. J W A and J a d d , refers to the inertia moment of the WA device and the added mass at the infinite frequency. h e x is the excitation force coefficient, k r a d is the radiation impulse response function coefficient, and k r e s is the hydrostatic restoring coefficient. θ ¨ W A , θ ˙ W A and θ W A are the instantaneous angular acceleration, velocity, and position of the WA device during the pitch motion, respectively. In the present study, the hydrodynamic diffraction analysis using ANSYS/AQWA computational fluid dynamics (CFD) software was used to determine the h e x , k r a d , and k r e s coefficients, as previously implemented in [49,50,51]. The results from the preliminary hydrodynamic diffraction simulation are presented in Figure 7.
( J W A + J a d d , ) θ ¨ W A ( t ) + 0 t k r a d ( t τ ) θ ˙ W A ( t ) + k r e s θ W A ( t ) + M H P T O ( t ) = h e x ( t τ ) η W d τ
Meanwhile, the moment of due to the HPTO unit force ( M H P T O ) in Equation (1) can be calculated using Equation (2), where F H P T O refers to the feedback force from the hydraulic actuation module applied to the WA device during the pitch motion, as depicted in Figure 1. L 1 is the perpendicular length from point C to the hydraulic actuator rod. L 1 can be calculated using Equation (3), where L 2 , L 3 and L 4 are the length from points A to C and B to C and A to B, respectively. θ W A , 0 is the angular position of the WA device during the default position. x H A refers to the linear displacement of the hydraulic actuator, which can be described using Equation (4).
M H P T O = F H P T O L 1
L 1 = L 2 L 3 s i n ( θ W A , 0 θ W A ) L 4 + x H A
x H A = L 4 L 2 2 + L 3 2 2 L 2 L 3 c o s ( θ W A , 0 θ W A )
The WA device submodel was built based on the hydrodynamic pitch motion functions in Equations (1)–(4) using a mathematical function block, as depicted in Figure 8A. The inputs of the WA device submodel are the irregular wave profile ( η W ), and the feedback force from the hydraulic actuation module of the HPTO unit, F H P T O . The linear displacement of the hydraulic actuator, x H A is the output of the WA device submodel. The hydrodynamic coefficients of the WA device, such as h e x , k r a d , and k r e s were determined from the hydrodynamic diffraction analysis conducted using ANSYS/AQWA software (version 2019 R3).

3.3. HPTO Unit Models

The HPTO unit submodels were built using the Simscape Fluids toolbox provided in the MATLAB/Simulink based on the conventional and improved concepts in Figure 2A,B. The HPTO unit submodels were built using the available hydraulic components in the Simscape Fluids toolbox. The detail descriptions of each components in the Simscape Fluids can be obtained in [52]. For hydraulic actuation module, a single rod double chamber with a fixed body actuator was used. This actuator model includes pressure dynamics in the volumes either side of the piston and viscous friction. The piston diameter, rod diameter, stroke length, and initial piston displacement are some examples of the important parameters used in the hydraulic actuator. The ideal translational velocity source block was used to convert x H A input from the WA device submodel into velocity dimension ( x ˙ H A ).
For rectification module, a combinations of four spring check valve blocks (CV1 to CV4) were used. In these check valve models, a functional hysteresis was specified to the model in order to take into account dry friction effects. The maximum cross-sectional area and flow discharge coefficient are the main parameters of the check valve model. For the fluid energy storage, the blocks model of a gas-charged accumulator (HPA1, HPA2 and LPA) were used. The accumulator blocks consists of a precharged gas chamber and a fluid chamber. The accumulators gas were assumed to obey an adiabatic polytropic gas law, where the hydraulic fluid within the accumulators were assumed to have the same pressure as the gas. The gas precharge pressure, accumulator volume, and adiabatic index are the vital parameters of the accumulator blocks.
For the generation module, the fixed displacement hydraulic motor block was coupled with a rotational damper with a variable damping. A rotational damper with a variable damping was used to replicate the electric generator behavior of the generation module in order to reduce the HPTO submodel complexity. The damping coefficient of the considered generator ( d G ) was used in the rotational damper to represent the actual resistive torque of the electric generator imposed on the hydraulic motor. The instantaneous electrical power produced by the generator ( P G ) was calculated using Equation (5), where ω G is generator speed, τ G is generator torque and η G is generator efficiency.
P G = 2 π ω G τ G η G
For the improved HPTO unit model, the FEC module was modeled using 3-way directional valve (DCV1 and DCV2) and variable orifice valve (FCV) blocks. The 3-way directional valve block represents a directional control valve with three ports and two positions, or flow paths. The dynamic behavior of the 3-way directional valve blocks were set based on the second-order system between input signal and valve opening. The model parameterization of DCV and FCV blocks were set based on the maximum cross-sectional area and valve opening factor. The detail descriptions of the DCV and FCV blocks parameters setting can be obtained in [52]. The flow charge coefficient, leakage area, and maximum opening area are the important parameters of the DCV and FCV blocks. Furthermore, the control strategy of the FEC module was modeled using mathematical blocks and PID controller block based on the concept in Figure 3.
In addition, the hydraulic pipeline block was used to connect all the modules in the HTPO unit models. The hydraulic pipeline block accounts for friction loss along the pipe length and for fluid compressibility. In addition, several sensors such as force, pressure, flow rate, etc., were included in both HPTO unit models. Finally, all the parameters setting of both HPTO unit models are given in the Table 2.

3.4. Determination of Optimal Parameters of FEC Control Strategy Using Genetic Algorithm

A FEC module control strategy consists of four important parameters, such as proportional gain ( k p ), integral gain ( k i ), derivative gain ( k d ), and P H P A 1 , m a x . In this study, the control strategy parameters were preliminarily determined using a genetic algorithm. Figure 9 illustrates the generalized simulation set-up diagram for parametric estimation using the genetic algorithm. In this estimation process, the genetic algorithm program based on Figure 10 was separately built in the MATLAB/M-file. The parameter settings of the genetic algorithm are gathered in Table 3. The genetic algorithm in the MATLAB/M-file was then linked to the WECs model in MATLAB/Simulink. The irregular wave profile based on the nominal condition (sea state A) was used as the wave input of WECs model. A specific objective function ( O F ( x C S )) was created for genetic algorithm based on the FEC module control strategy in Figure 3. O F ( x C S ) can be described using Equations (6)–(8). M A A P D is the moving average of the absolute power deviation ( P D ). T s is the simulation period. Using O F ( x C S ), the P G generated from the HPTO unit is maximized by genetic algorithm through selecting the best values for the FEC module control strategy parameters.
The parameters determination process using genetic algorithm was initially started by randomly generating a population of chromosomes for k p , k i , k d , and P H P A 1 , m a x . Thereafter, for the first iteration, the random values from the generated population were chosen for each study parameter. The WECs model was then evaluated based on the O F ( x C S ). The chromosomes of the population were then sorted according to the least cost or highest fitness. Some percentages of the best chromosomes were transferred directly to the next generation based on their merit. Then, three genetic algorithm operators named as selection, crossover, and mutation were implemented to manipulate the rest of the chromosomes for the next generation. During the selection rule, the parent’s chromosome that contributed to the current population was selected for the next generation process. Then, pairs of selected parents were recombined by a crossover operator to produce new chromosomes. A mutation rule was then applied to the new chromosomes to avoid the genetic algorithm converging to the local optimum. This process was iterated until the satisfactory fitness level was reached.
O F x C S = min L R α
M A A P D = 1 T s 0 t P D t d t
P D = P G , R a t e d P G

3.5. Simulation Analysis of the Improved HPTO Unit

The simulation analysis of the improved HPTO unit consists of two main parts. The first part of the simulation study was aimed to compare the performance of the conventional and improved HPTO unit under irregular wave circumstances; thus, the conventional and improved HPTO unit models were simulated using five different sea state inputs with different significant wave heights ( H s ) and the peak wave periods ( T p ). For the second part, the simulation study was aimed to investigate the effects of the P H P A 1 , m a x on the generated electrical power from the improved HPTO units performance; thus, the simulation of the improved HPTO unit model was repeatedly performed by adjusting the P H P A 1 , m a x value from 47.5 to 51.5 bar, respectively. In addition, three evaluation criteria, as derived in Equations (7)–(9), were considered to evaluate the generated electrical power in the simulation studies in part 1 and 2. N P D in Equation (9) represents the number of P D at a certain level.
O P P D = N P D 0 T s N P D × 100

4. Results and Discussions

The simulation results are presented and discussed in this section: Section 4.1 presents the optimal parameters of FEC control strategy obtained using genetic algorithm. Section 4.2 and Section 4.3 present the evaluation of an improved HPTO unit under different irregular sea states. Section 4.4 describes the effect of the P H P A 1 , m a x on the improved HPTO unit performance.

4.1. Optimal Parameters of FEC Control Strategy

Figure 11 depicts the chronological variation of the best variable for objective function, PID, and P H P A 1 , m a x parameters with the respect to the number of generations obtained from the optimization process performed by genetic algorithm. From the figure, the red vertical line indicates the termination point of the control strategy parameters optimization process by the genetic algorithm. Figure 11A shows that the overall optimization process of the best control strategy parameters was completed after 15 number of iterations once the genetic algorithm had satisfied its accuracy requirement. The overall parameters optimization process by genetic algorithm was carried out for 7 h 30 min. The lowest objective function was found equal to 0.05601, as depicted in Figure 11A. Figure 11B illustrates the chronological variation of the best variable for PID controller parameters throughout the optimization process. From the figure, the best values for PID controller, k p , k i , and k d , were found to be equal to 0.989, 0.869, and 0.112, respectively. Figure 11C depicts the chronological variation of the best variable for P H P A 1 , m a x parameter and the optimal P H P A 1 , m a x was equal to 48.5 bar.

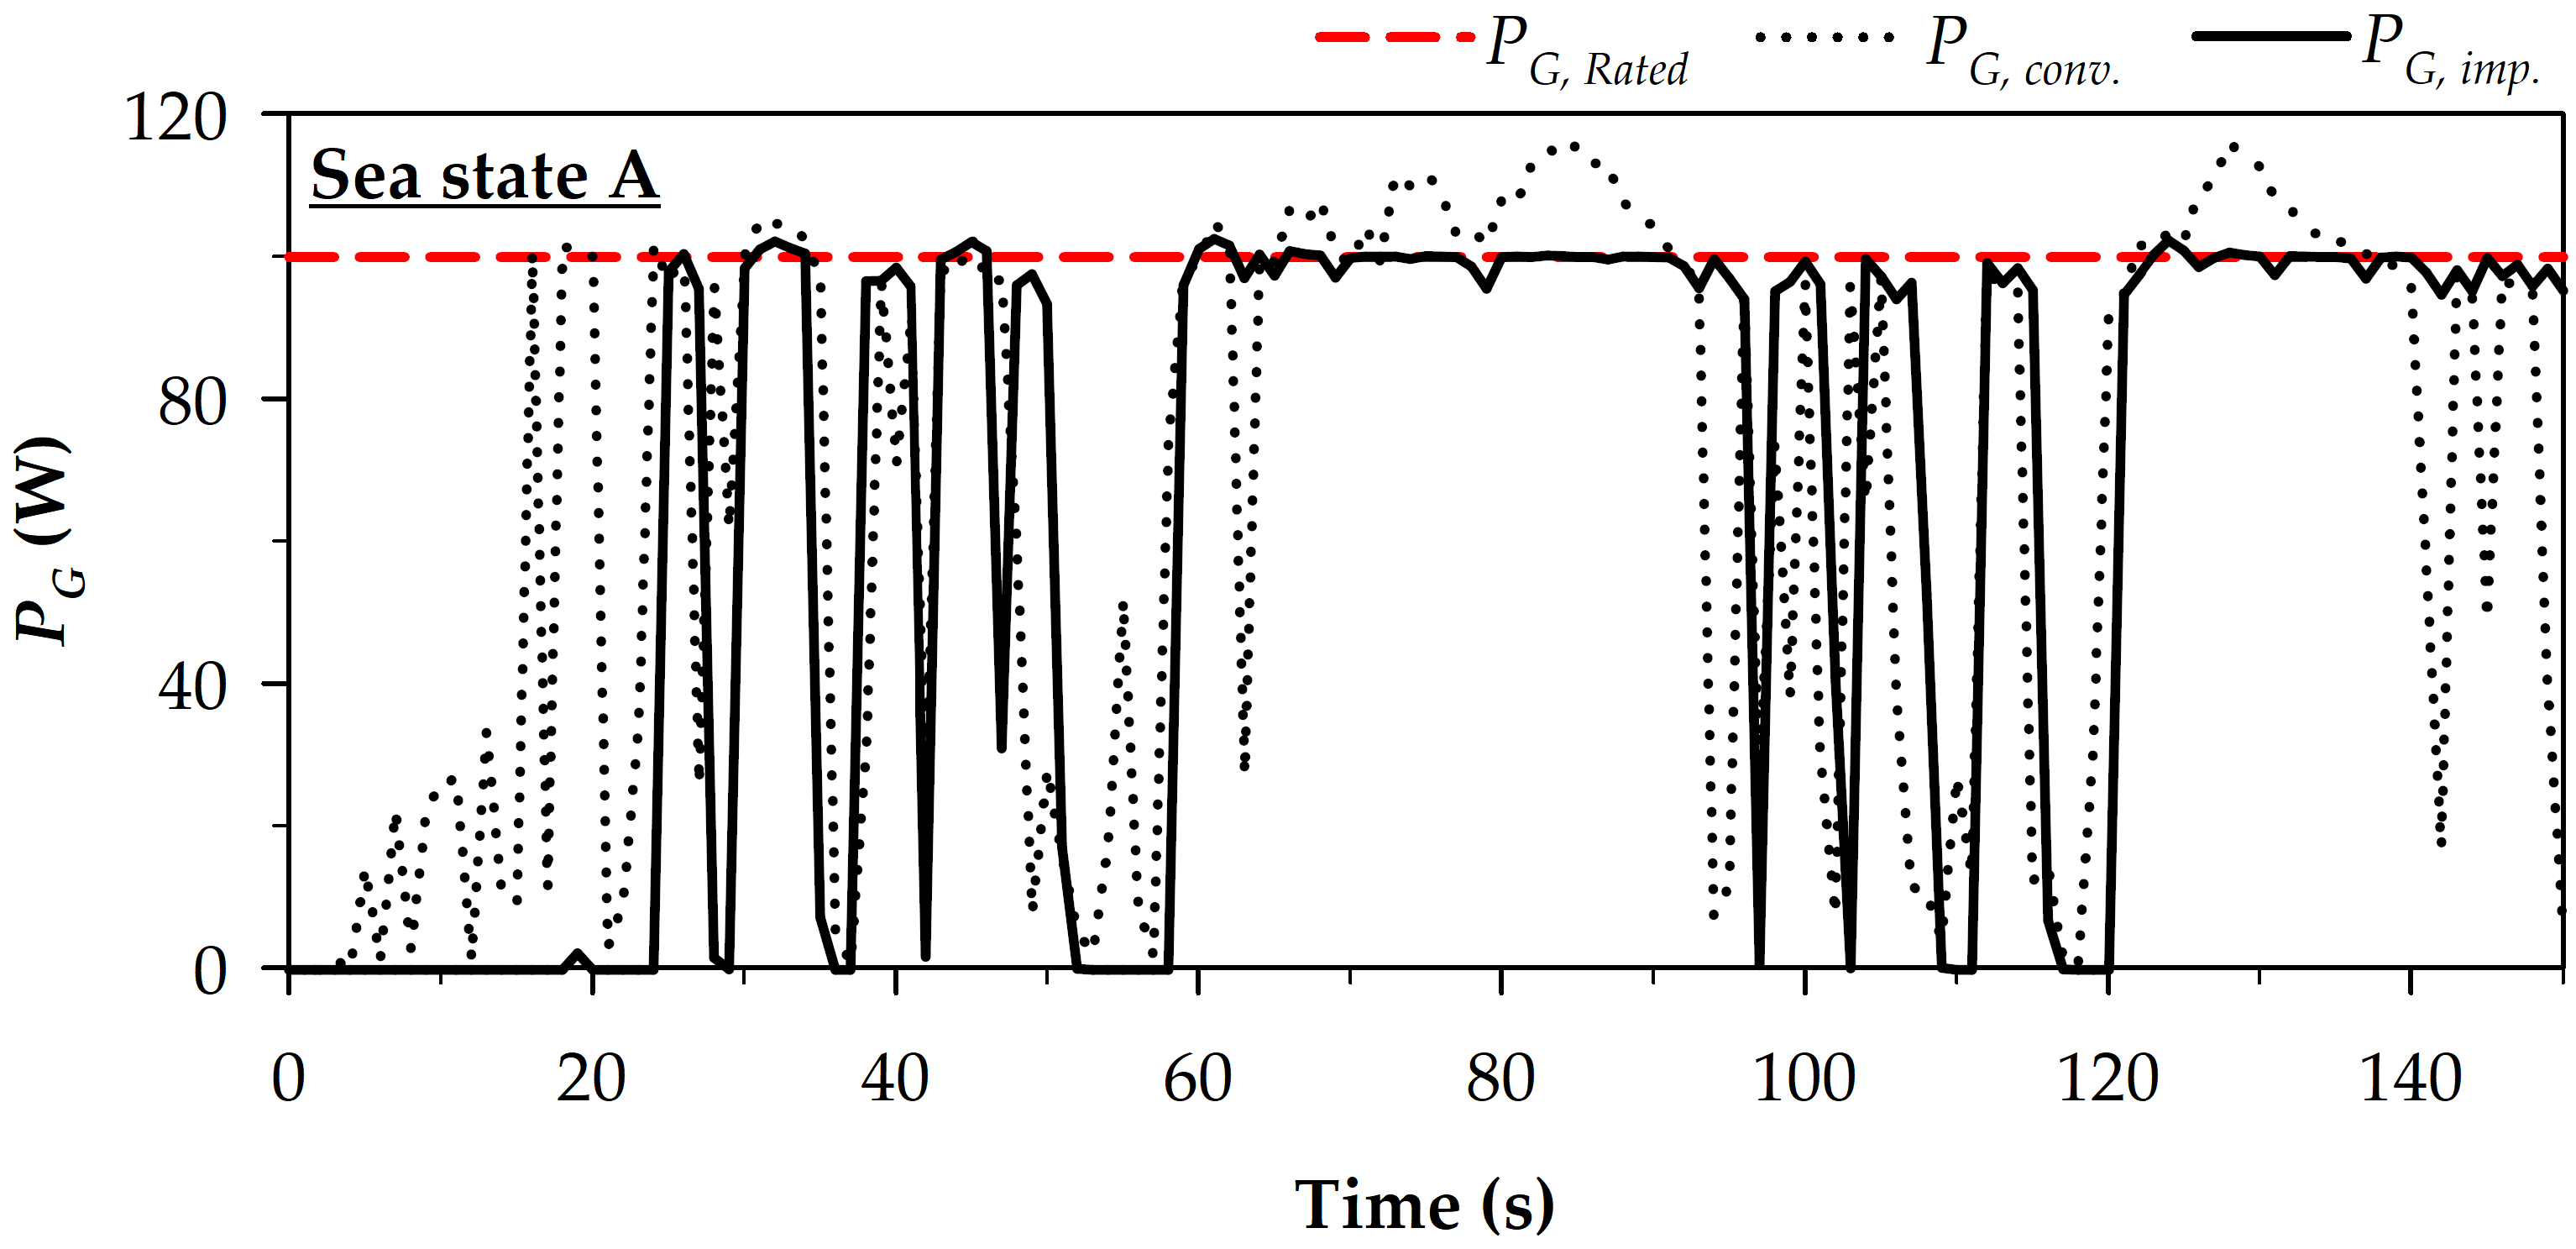
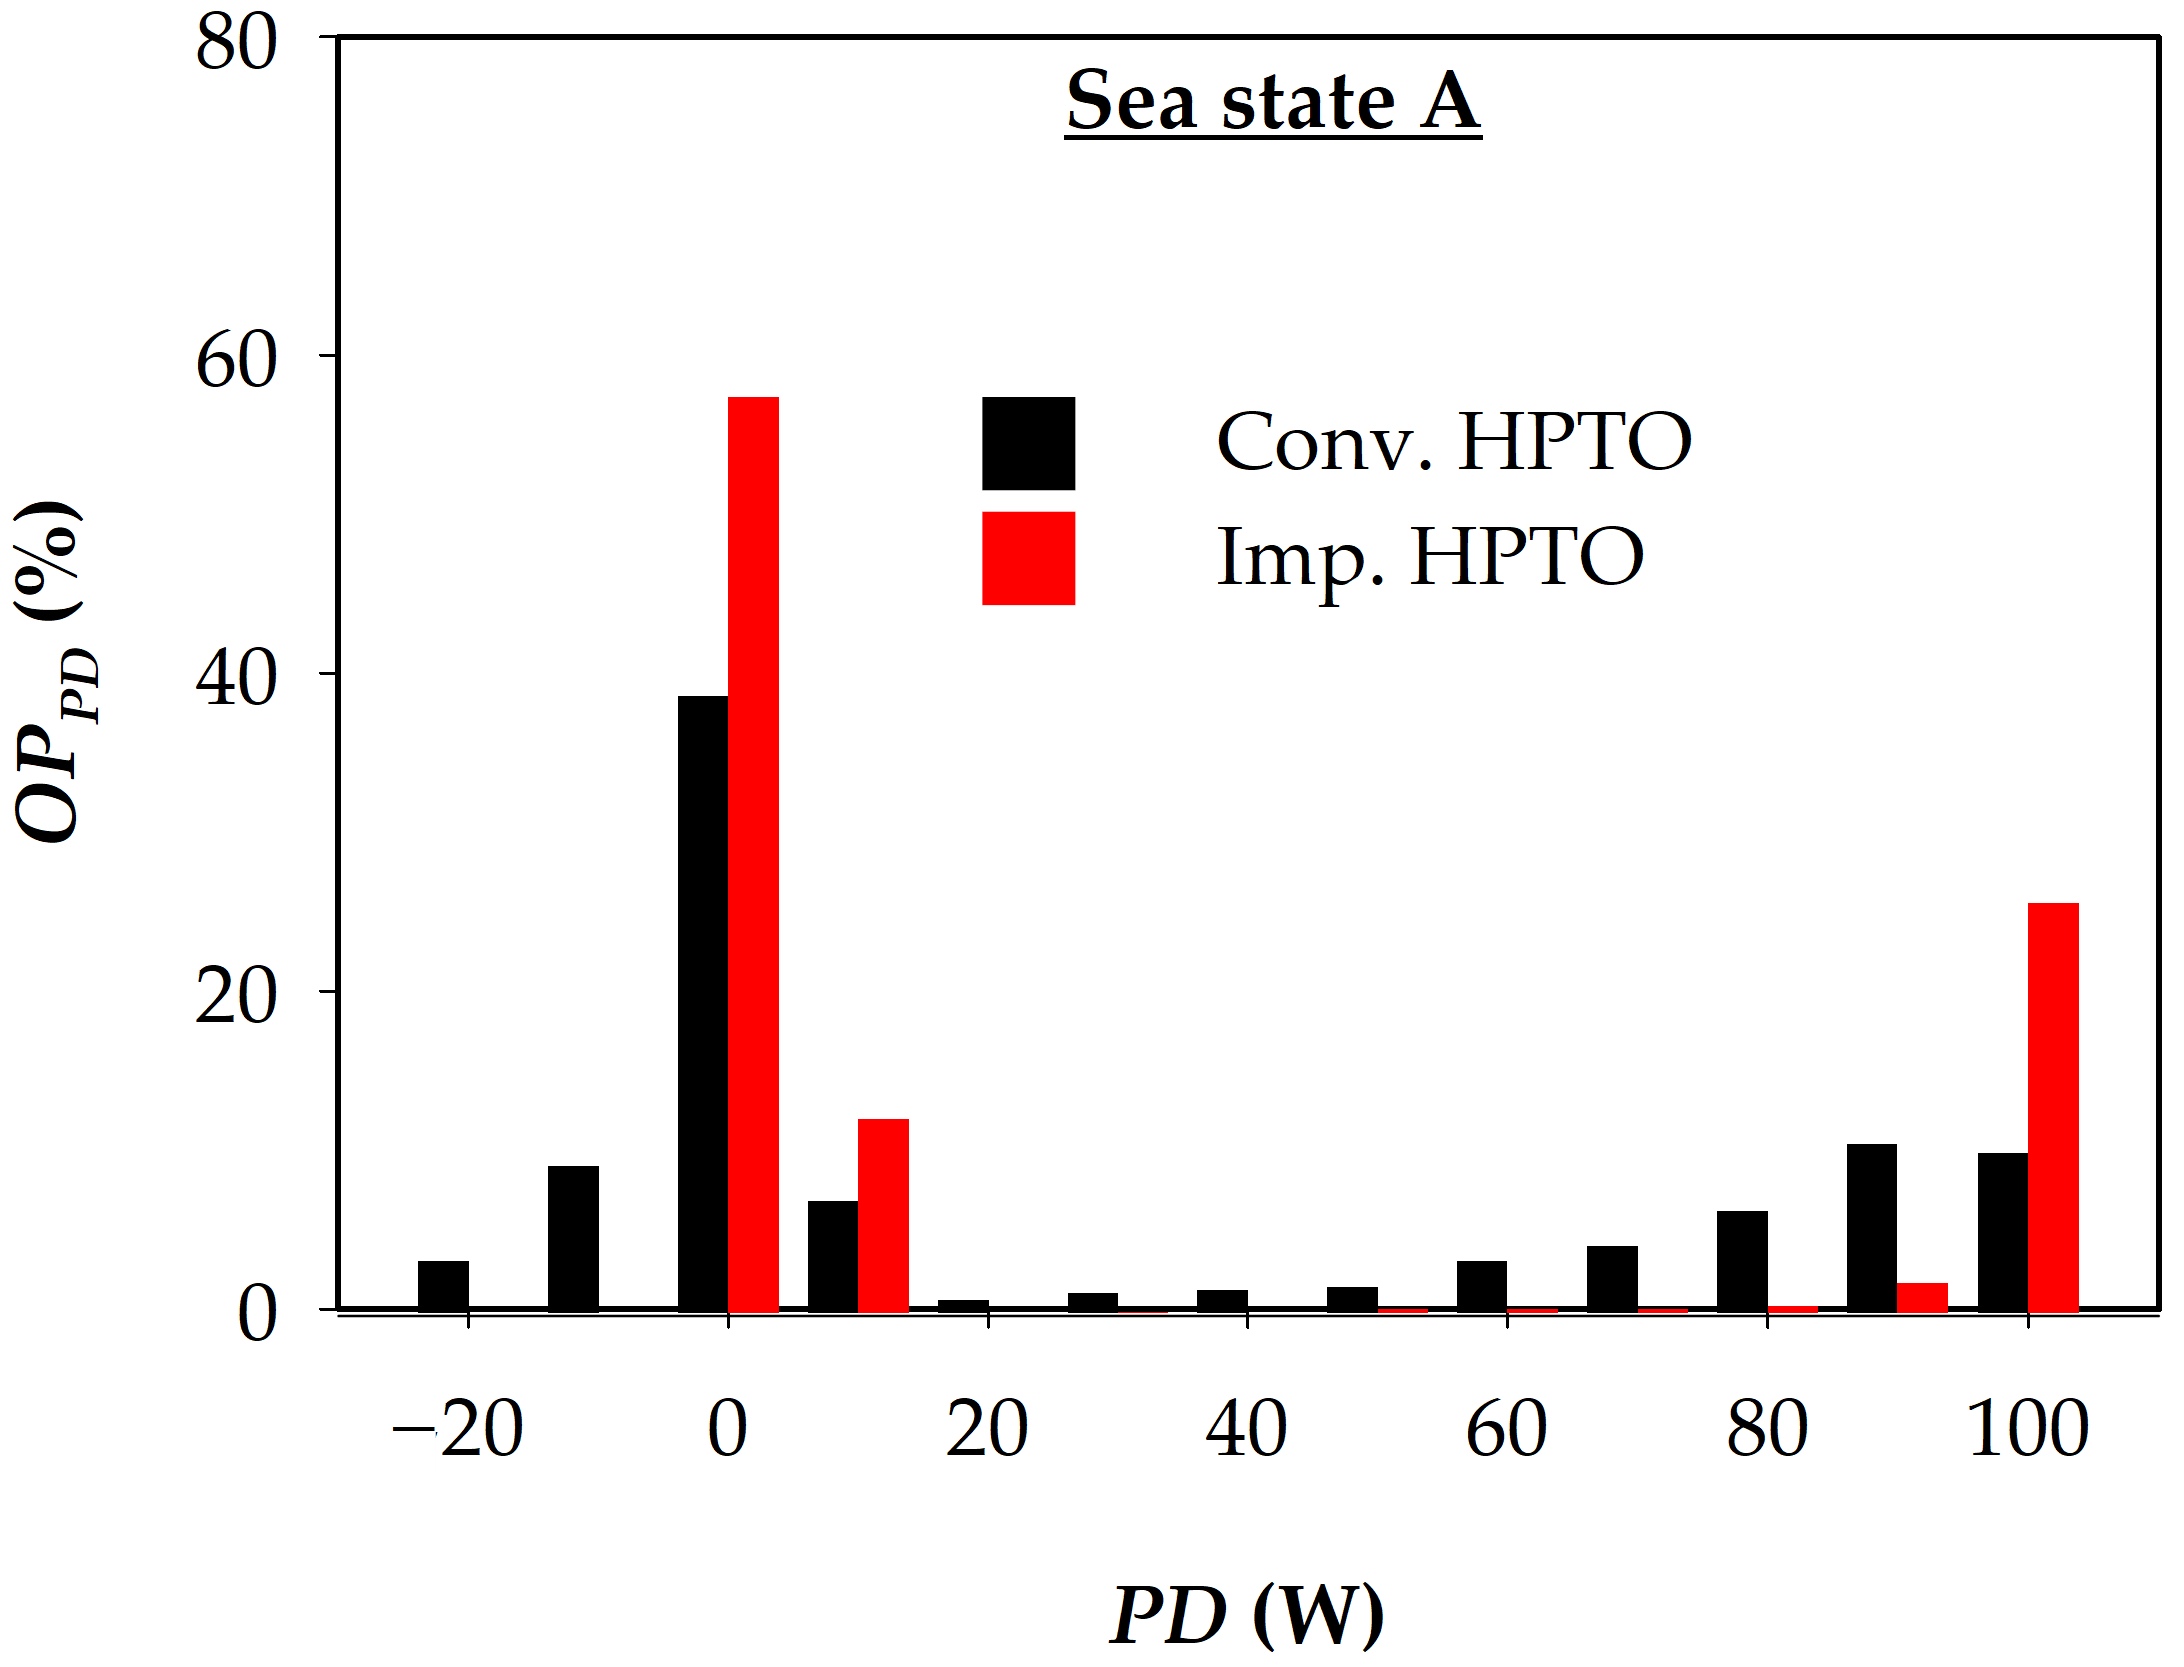
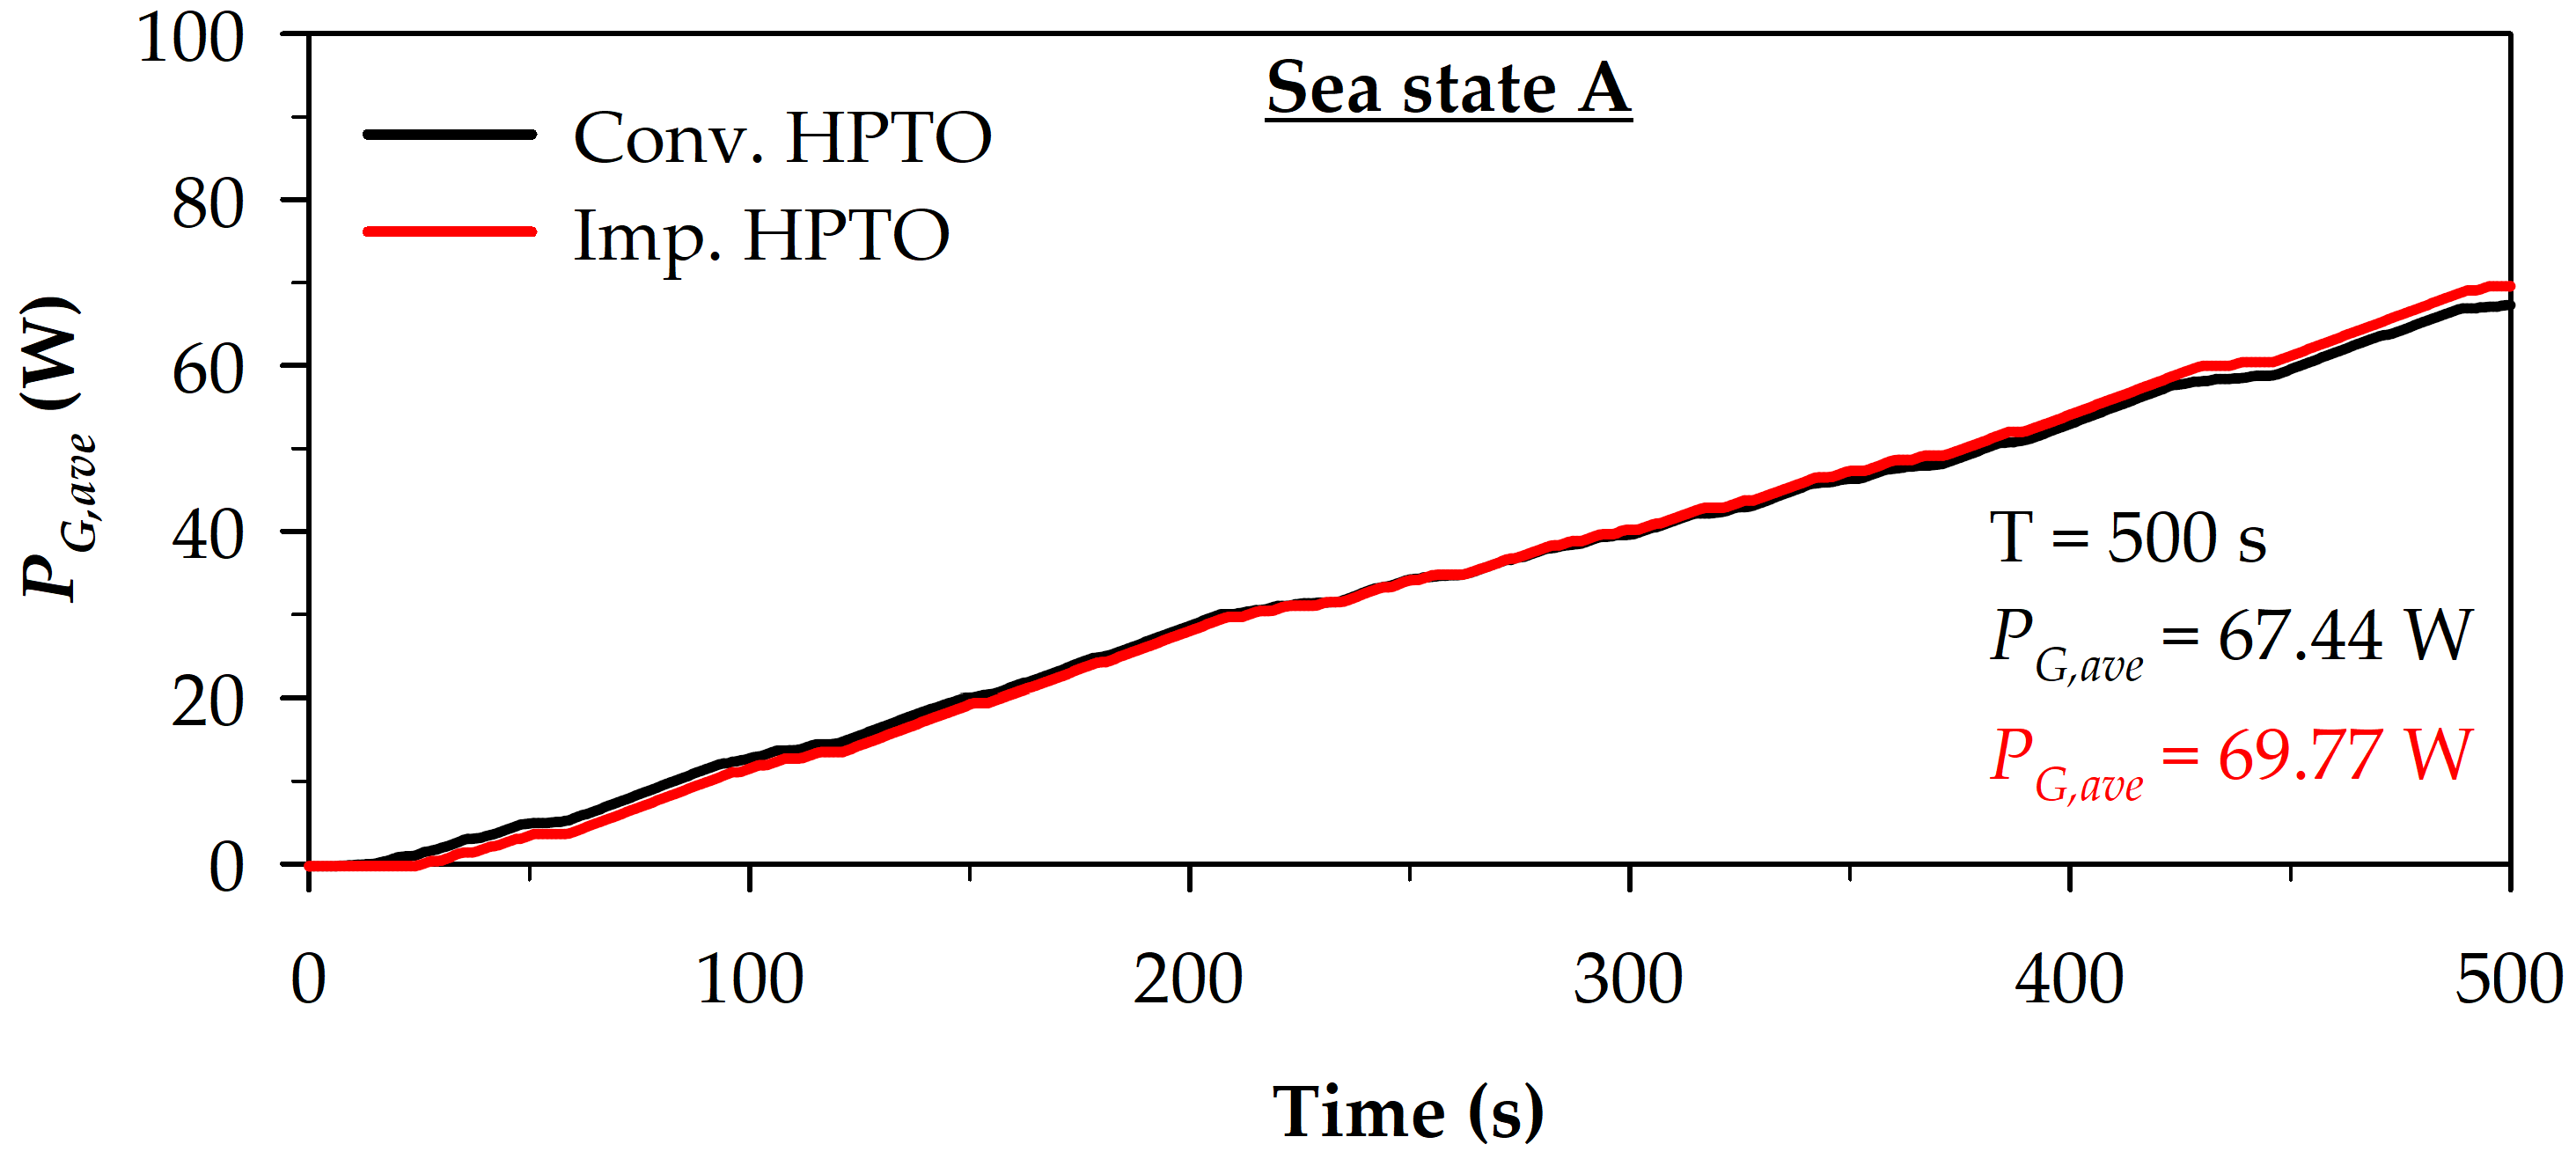
4.2. Evaluation of an Improved HPTO Unit Nominal Sea State (Sea State A)

This section presents the comparison of the conventional and improved HPTO unit performances in the nominal sea state (sea state A). The performance evaluations were conducted by comparing the quality and the amount of the generated electrical power, P G from both HPTO unit. Figure 12 presents the profiles of the electrical power generated from the conventional ( P G , c o n v . ) and improved ( P G , i m p . ) HPTO units for a 150 s of a 500 s total time simulation period (for better visualization). The figure shows that the P G , c o n v . frequently fluctuated below the rated capacity (100 W) and potentially fluctuates within a second. The fluctuation of the generated electrical power is due to the irregular behavior of the ocean wave input, which produces inconsistent high-pressure flow to the power generation module.
Technically, the fluctuation occurrences in the mechanical and electrical side of the HPTO unit may produce several negative impacts. For the mechanical side, the fluctuation of high-pressure flow may cause sudden vibrations on HPTO unit components and directly produce unnecessary noise and heat. The vibration also may increase the leakage potential on the components involved [10]. For the electrical side, the fluctuation of the generated electrical power from the HPTO unit may cause a disastrous impact on the electrical appliances. The lower voltage generated from the HPTO unit causes the electrical equipment to not function at the expected load. The higher voltage generated from the HPTO unit can damage the equipment insulation.
The unnecessary power fluctuations in the generated electrical power were significantly reduced by employing the improved HPTO unit, as illustrated in Figure 12. The figure indicates that the improved HPTO unit, which consists of the FEC module, can transform the high-fluctuation electrical power to a more stable electrical power. The stability power generated by the improved HPTO unit depends on the pressure level of HPA1 and HPA2. During the high-pressure state of HPA1 and HPA2, the improved HPTO unit can generate electricity at its rated capacity. During a low-pressure state, the generation module of improved HPTO unit is deactivated from the power generation process.
P D and O P P D evaluation criteria, as described in Equations (8) and (9), were used to measure the quality of the generated electrical power in Figure 12. Figure 13 illustrates the O P P D results of both HPTO unit cases for 500 s of WECs operation. P D represents the power deviation between P G and P G , R a t e d ; O P P D represents the percentage of P D occurrences. The negative and positive value of P D refers to the higher and lower P G rather than the P G , R a t e d . P D equal to 0 W means the P G is generated at the P G , R a t e d level. P D equal to 100 W means the electrical power is not generated from the HPTO unit. Figure 13 depicts that the P D occurrences for the conventional HPTO unit case were found between −20 W to 100 W. The P G , c o n v . was above the rated capacity during 12.8% of WECs operation. For 38.1% of WECs operation, the P G , c o n v . was below the rated capacity. The P G , c o n v . was at the rated capacity only during 10.2% of WECs operation.
Meanwhile, for improved HPTO unit case, P D was significantly found at 0 W, 10 W, 90 W, and 100 W only; therefore, the over-generated electrical power apparently does not exist in the improved HPTO unit case. P G , i m p . was at the rated capacity during 57.6% of WECs operation. For 16.4% of WECs operation, P G , i m p . was lower than the rated capacity. Figure 13 also indicates that the generation module in both HPTO units was not operated (off-time) several times. The figure shows that the generation module off-time of the improved HPTO unit was longer than the conventional HPTO unit. The longer off-time may be due to the dual HPA module used in the improved HPTO unit instead of the single HPA module used in the conventional HPTO unit. The occurrences of generation module off-time for the improved HPTO unit was 25.9% of WECs operation. In contrast, the occurrences of generation module off-time for the conventional HPTO unit was 10.2% of WECs operation. Technically, a longer off-time can increase the lifespan of the components in the generation module, such as the hydraulic motor and generator, due to the higher heat reduction.
Figure 14 presents a comparison of moving average of absolute power deviation, M A A P D for both HPTO units in sea state A. R 1 and R 2 represent the linear regression lines of M A A P D for conventional and improved HPTO units ( M A A P D c o n v . and M A A P D i m p . ), respectively. In overall, the variation of M A A P D c o n v . & M A A P D i m p . can be linearized based on the R 1 and R 2 functions. The slope coefficients of R 1 and R 2 indicate the average change rate of M A A P D c o n v . and M A A P D i m p . , where the greater slope coefficient indicates the greater the rate of change. The slope coefficient of the R 1 and R 2 were obtained equal to 0.066 and 0.057, as shown in Figure 14A. From the figure, the R 2 was higher than R 1 during the early state, which means that the M A A P D i m p . was greater than M A A P D c o n v . during the early state. This due to a longer off-time of generation module (up to 20 s) in improved HPTO unit during early state operation, as depicted in Figure 12. A longer off-time of generation module at early state operation is due to the high charging process of the dual HPA module; however, the R 2 was lower than R 1 after 320 s, which means that the M A A P D i m p . was smaller than M A A P D c o n v . , as depicted in Figure 14A. A smaller M A A P D i m p . was due to the efficient control of FEC module used in the improved HPTO unit. The intercept point between R 1 and R 2 was found at 177.5 s with the magnitude of 12.5 W, as depicted in Figure 14B.
Figure 15 compares the moving average of P G , c o n v . and P G , i m p . . To be fair, in comparison, the P G , c o n v . and P G , i m p . were limited up to the rated capacity during the moving average. Based on the figure, a longer off-time of the generation module of the improved HPTO unit during the early stage operation does not affect the amount of P G , i m p . . The figure shows that the final average of P G , i m p . was higher than that of P G , c o n v . . The final average of P G , i m p . and P G , c o n v . were equal to 69.77 W and 67.44 W, respectively.
The behavior profiles of selected components in the improved HPTO unit are depicted in Figure 16. Figure 16A presents the active position of DCV1 and DCV2 profiles during the improved HPTO unit operation. At positions B and C, HPA1 and HPA2 are, respectively, connected to the charging and discharging line, as depicted in Figure 2B. Figure 16A shows that the HPA1 and HPA2 operations were interchangeable throughout the HPTO unit operation with respect to the HPA1 pressure constraint. The switching periods of DCV1 and DCV2 depend on the charging and discharging period of HPA1. Figure 16B illustrates that the initial fluid pressures of HPA1 and HPA2 were set to 0 bar. At the initial operation of the improved HPTO unit, the HPA1 was first connected to the charging line since it was assumed as a primary fluid energy storage, as depicted in Figure 16A. At the same time, HPA2 was connected to the discharging line. The charging and discharging process were interchangeable after 25 s after P H P A 1 reached P H P A 1 , m a x constraint, as depicted in Figure 16B.
Figure 16C shows the variation of FCV flow coefficient, C F C V , throughout the improved HPTO unit operation. The FCV operation depends on the hydraulic motor speed as well as the generated electrical power from the generator, as depicted in Figure 4. Technically, the C F C V can be varied between 0 to 1; however, in this case, the C F C V was approximately varied from 0.2 to 1 during the high-pressure to low-pressure states of the P H P A 1 , as presented in Figure 16C. In this regard, the fluid flow through the hydraulic motor was approximately regulated to 1.68 L/min during the highest pressure state to ensure the hydraulic motor operates at its rated speed, as depicted in Figure 16D. In contrast, the fluid flow from the dual HPA module to the hydraulic motor was unregulated during the low-pressure state of P H P A 1 .

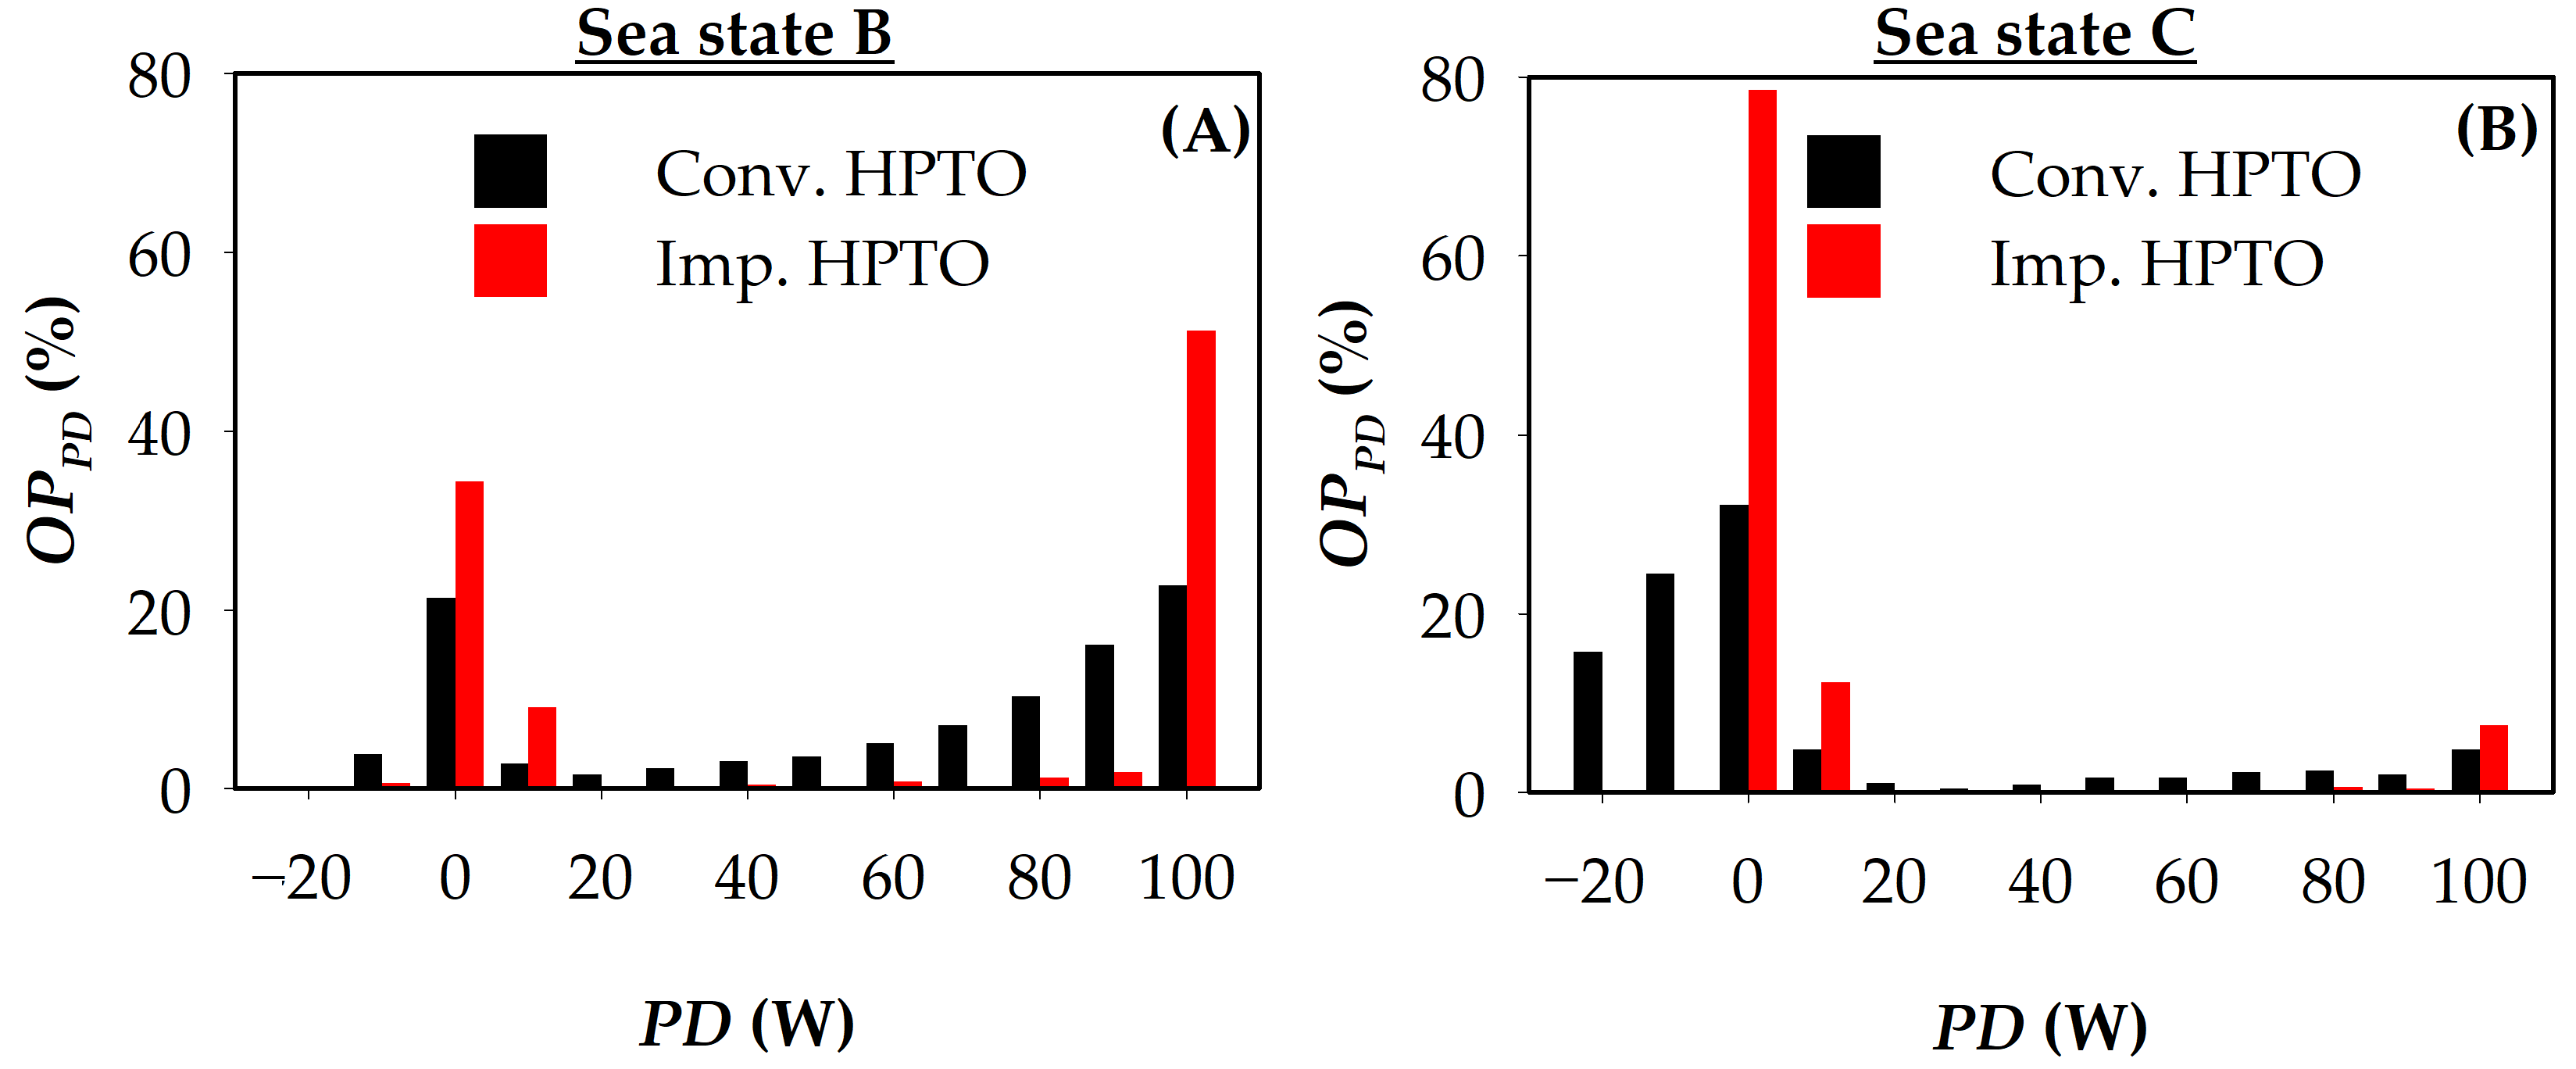
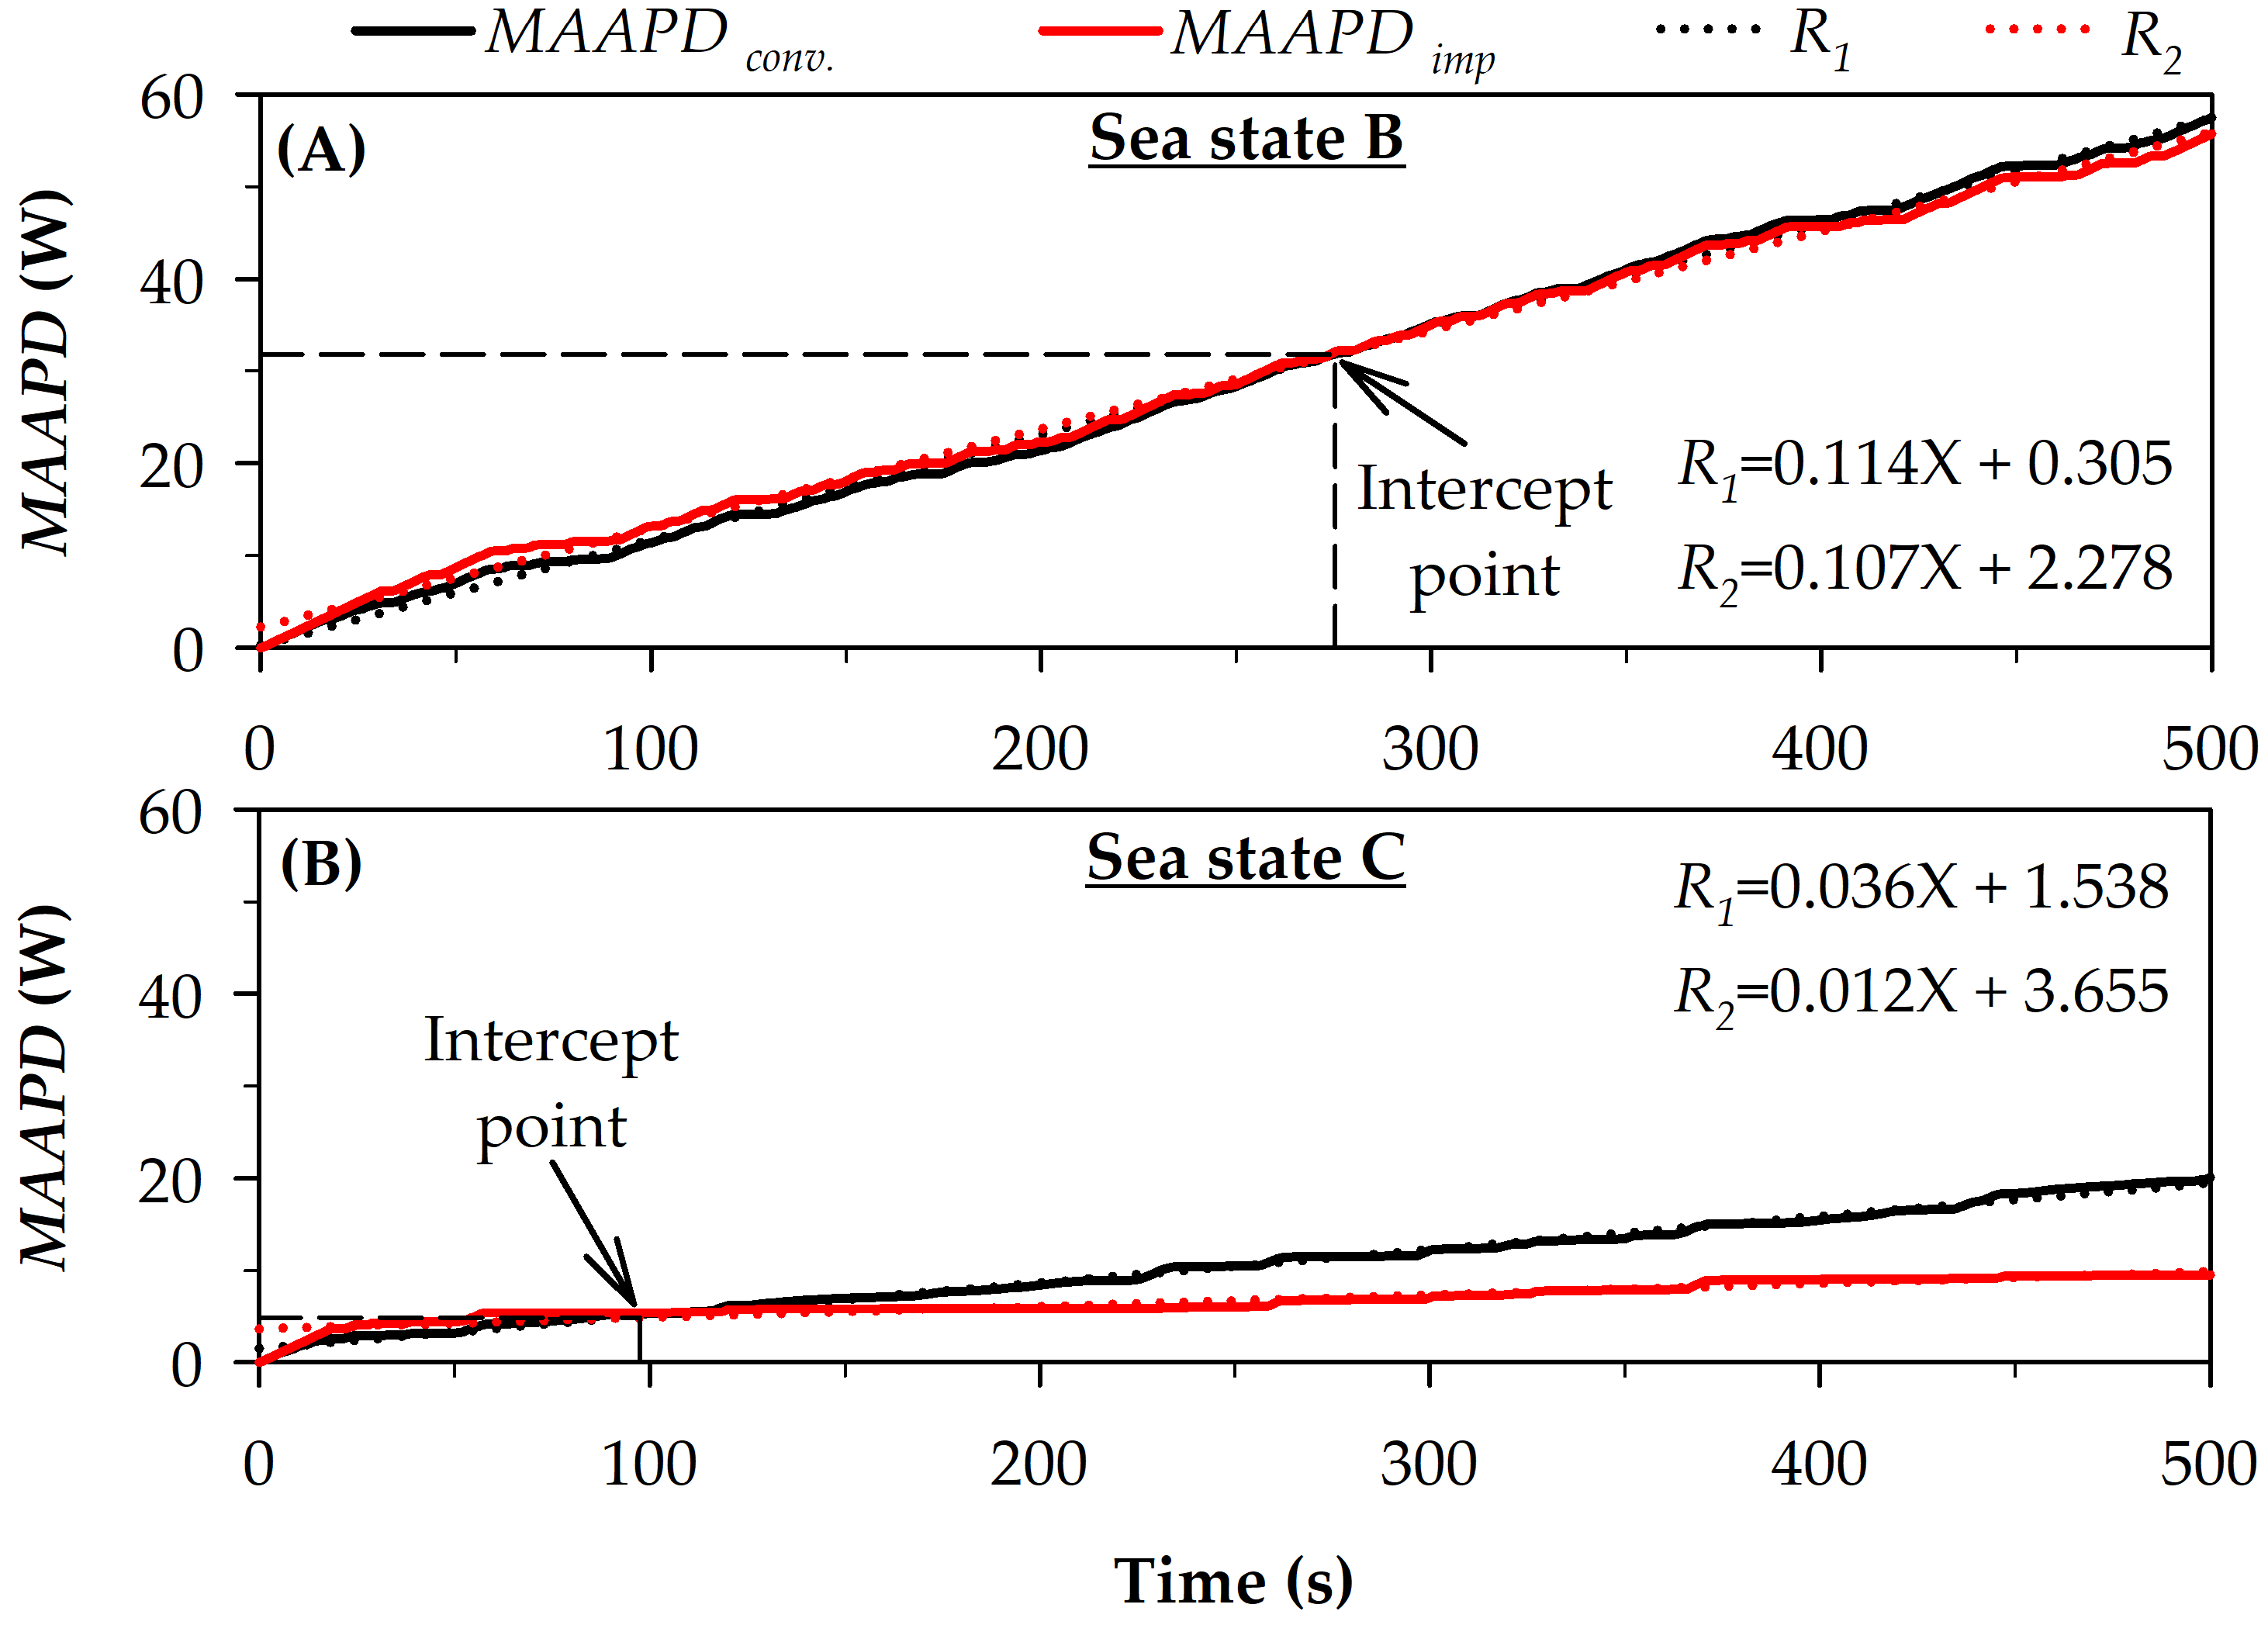
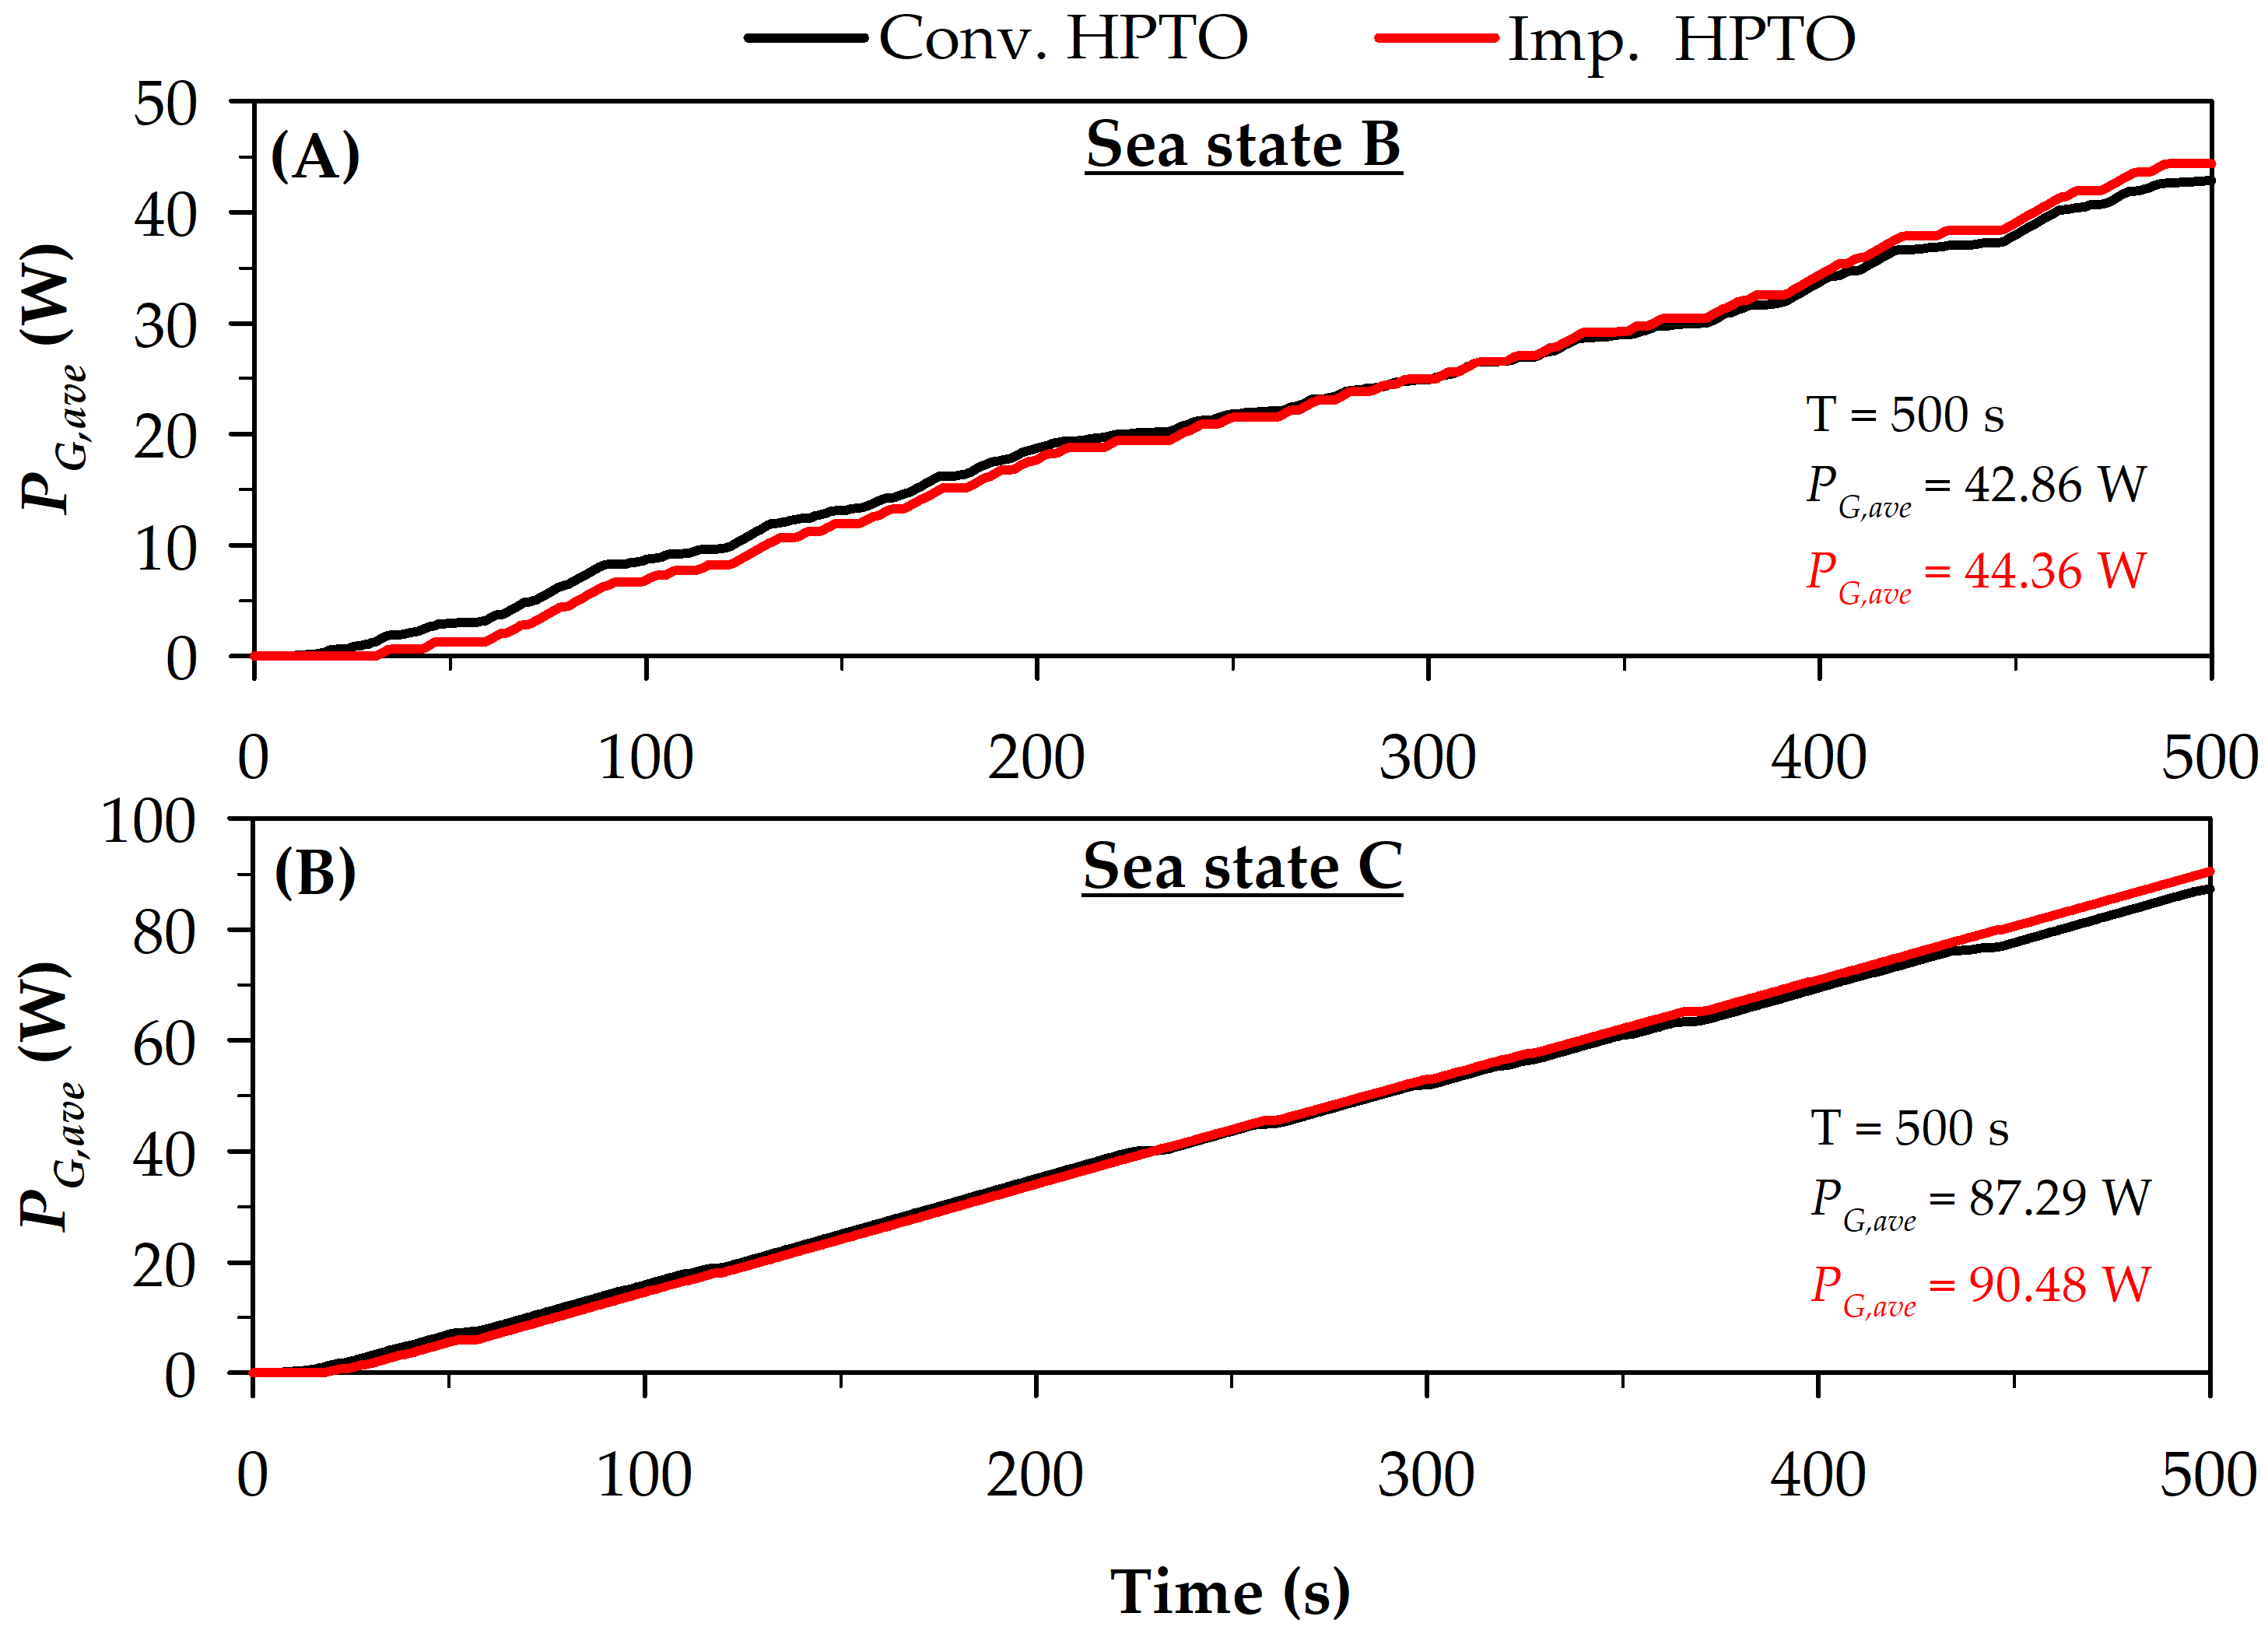
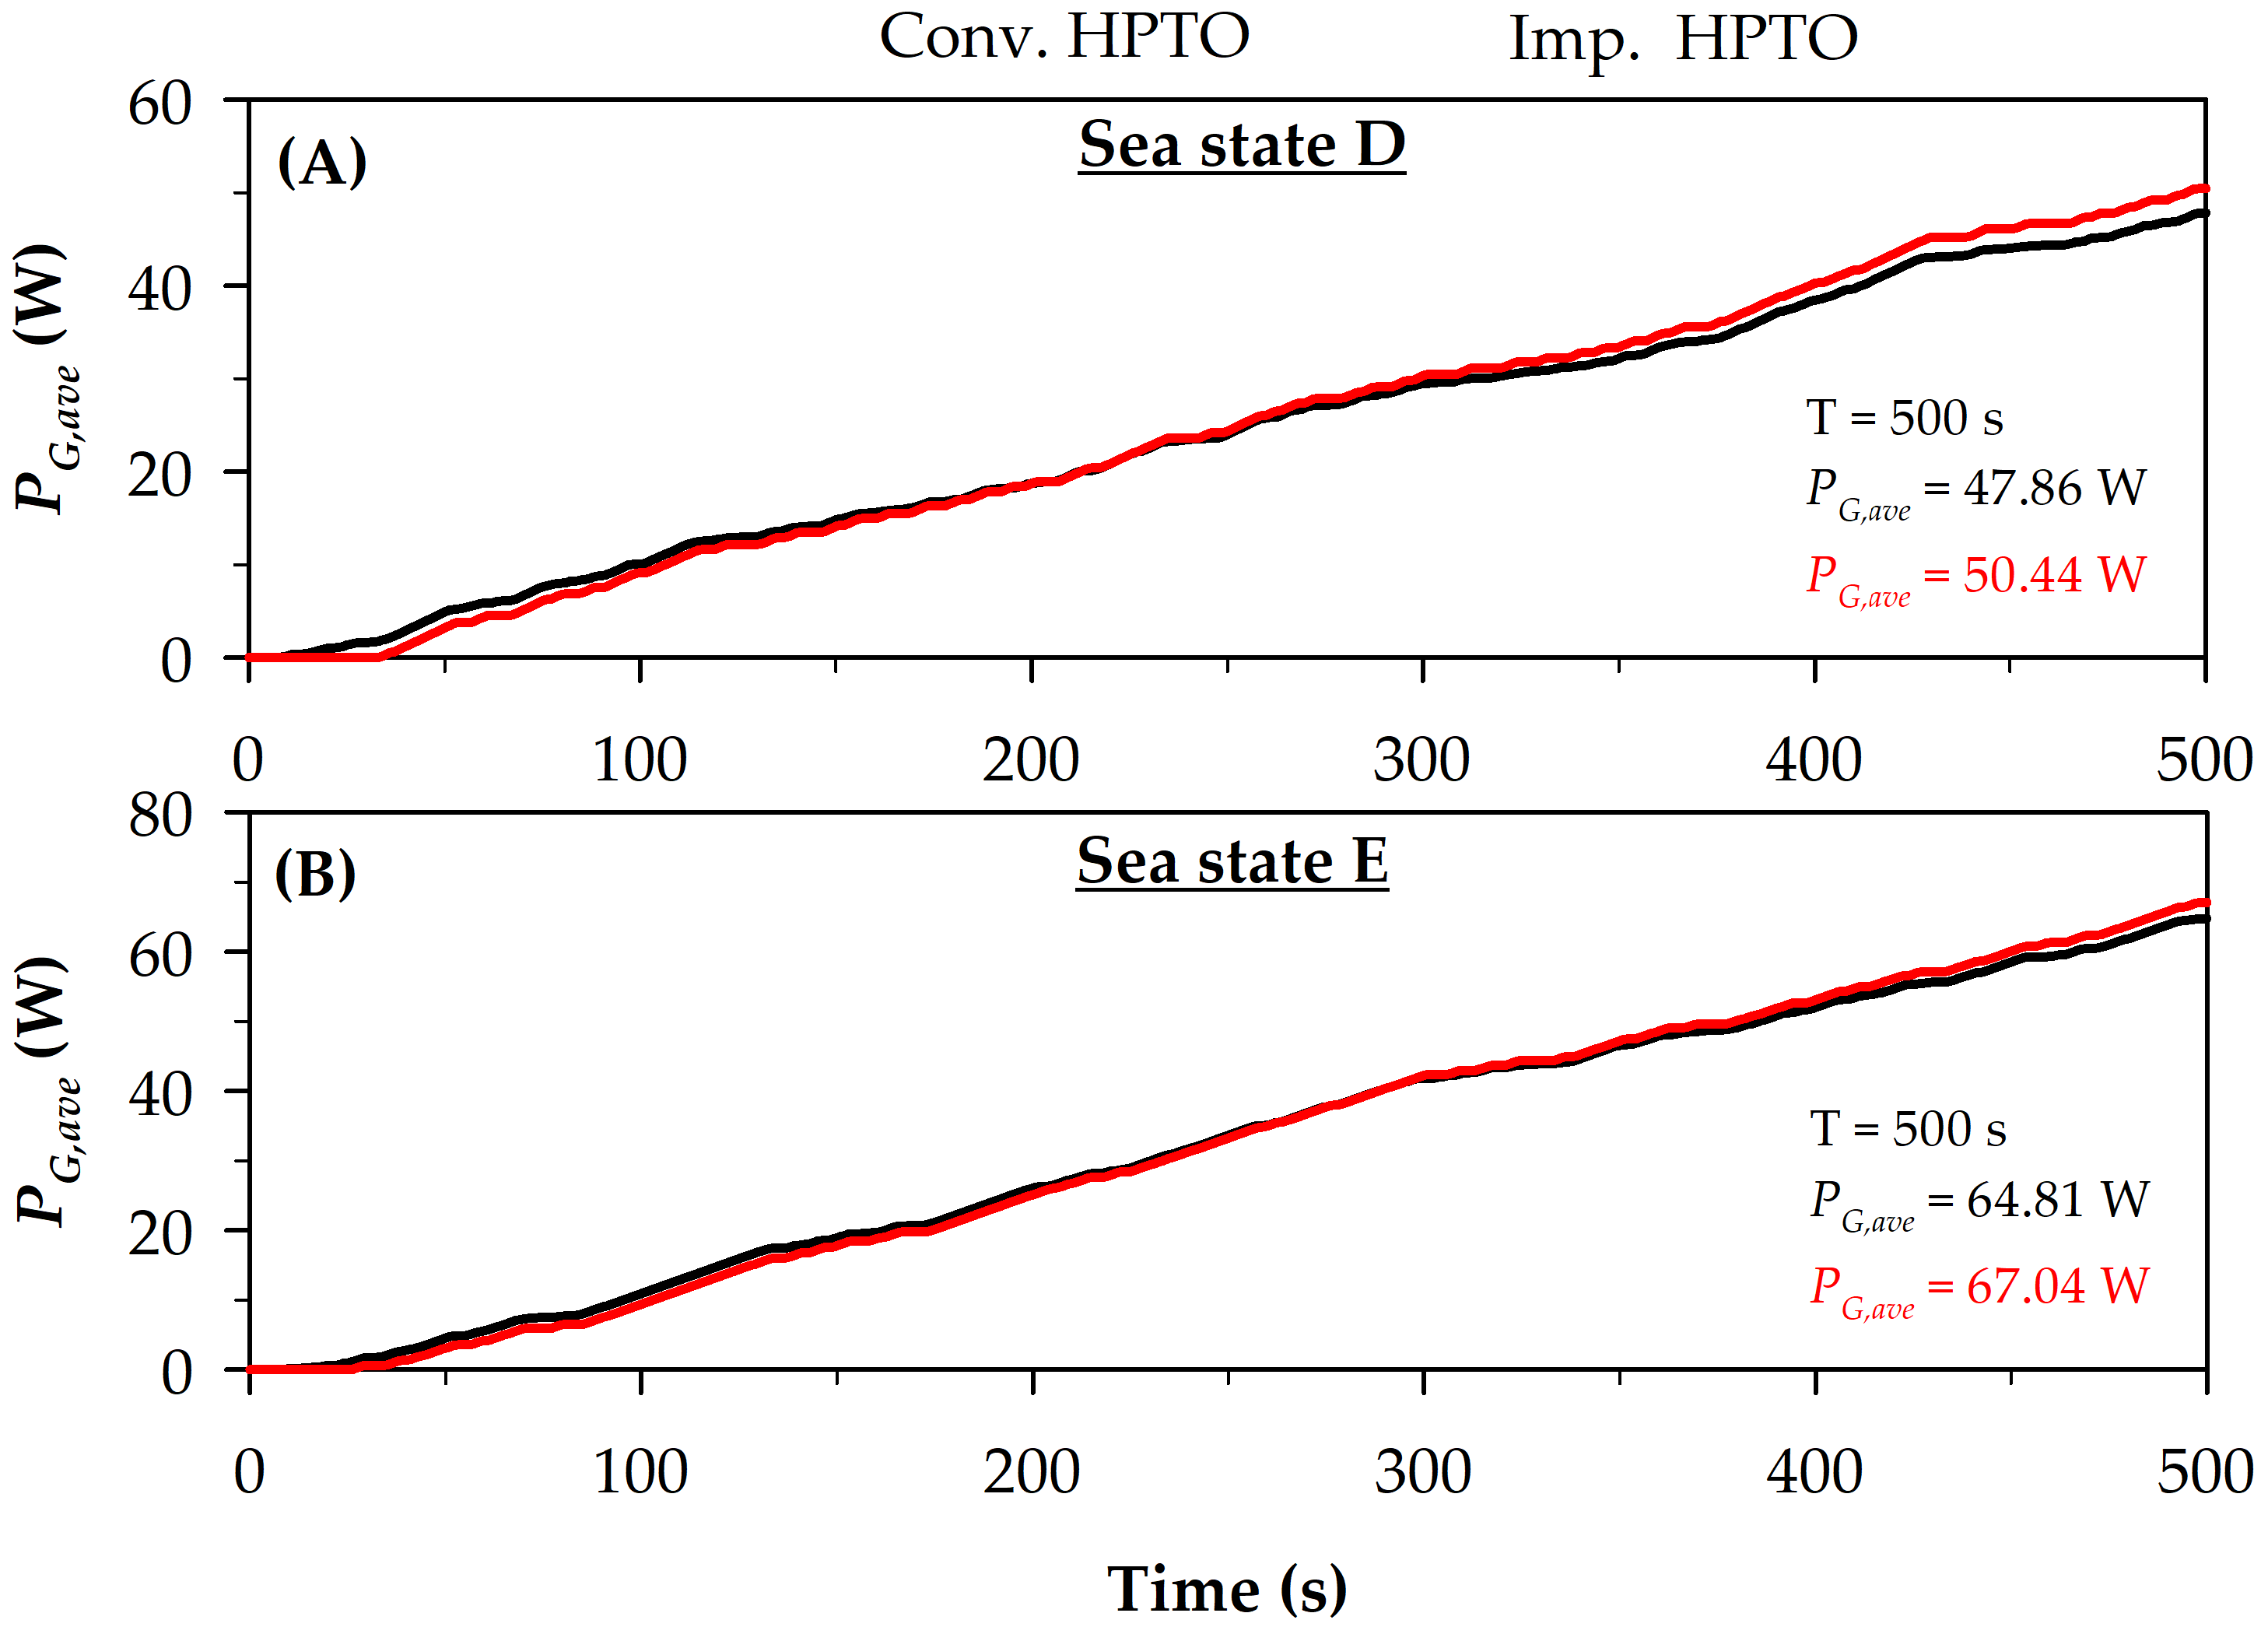
4.3. Evaluation of an Improved HPTO Unit in Different Significant Wave Height and Peak Wave Period Inputs (Sea State B, C, D, and E)

The simulations of conventional and improved HPTO units were repeated using four different sea states to ensure the robustness of the improved HPTO unit at the different significant wave heights and periods. A similar power quality analysis used in Section 4.2 was carried out on the generated electrical power from both HPTO units in different significant wave heights and wave periods. Figure 17 and Figure 18 present the P G , c o n v . and P G , i m p . profiles for different significant wave height and wave period cases, respectively. By comparing Figure 12 to Figure 17A and Figure 18A, the P G , c o n v . and P G , i m p . in the lower significant wave height and period (sea states B and D) cases fluctuated more than in the nominal sea state. The P G , c o n v . in the sea states B and D mostly fluctuated below the rated capacity, as indicated in Figure 17A and Figure 18A. The conventional HPTO unit could not generate reliable electricity during the lower significant wave height and wave period; however, the fluctuation problem in the electrical power generation can be reduced by using the improved HPTO unit. Figure 17A and Figure 18A show that the improved HPTO unit could generate more reliable electricity than the conventional HPTO unit. From the figure, the improved HPTO unit generates less fluctuated electrical power after 30 s (sea state B) and 32 s (sea state D) of WECs operation, respectively.
Meanwhile, for higher significant significant wave height and wave peak period cases (sea states C and E), Figure 17B and Figure 18B show that the P G , c o n v . and P G , i m p . fluctuated less than P G , c o n v . and P G , i m p . in the nominal sea state case, particularly from improved HPTO unit. The improved HPTO unit generates better-quality electrical power in the sea states C and E after 18 s (sea state C) and 25 s (sea state E) of WECs operation. The generator off-time of the improved HPTO unit was reduced, particularly in sea state E. Moreover, P G , c o n v . fluctuated more than the P G , i m p . . The P G , c o n v . was frequently fluctuated below and above the rated capacity, which is potentially up to 120 W, as indicated in Figure 17B and Figure 18B.
Figure 19 and Figure 20 illustrate the P D occurrences of conventional and improved HPTO units for different significant wave height and wave peak period cases. Overall, the comparison of the P D occurrences in Figure 19 and Figure 20 show that the P D occurrences of the improved HPTO unit case in sea states B to E were lower than the conventional HPTO unit case. The figures show that the P D occurrences of the conventional HPTO unit were found between -20 W and 100 W in all sea states. For improved HPTO unit, the P D occurrences mainly were significantly found at 0 W, 10 W, 90 W, and 100 W for all sea states. Figure 19A,B indicate that the improved HPTO unit generates electrical power at the rated capacity in sea states B and C during 34.3% and 78.6% of WECs operation. The conventional HPTO unit generates electrical power at the rated capacity in sea states B and C only during 21.4% and 32.1% of WECs operation. Meanwhile, the improved HPTO unit generates electrical power at the rated capacity for sea states D and E during 37.3% and 53.7% of WECs operation, as indicated in Figure 20A,B. For the conventional HPTO unit, the generated electrical power at the rated capacity in sea states B and C only during 25.4% and 36.7% of WECs operation, respectively.
In overall, the generation module off-time of the improved HPTO unit was significantly higher than the generation module off-time of the conventional HPTO unit, particularly in sea state B, D, and E, as depicted in Figure 19 and Figure 20. The longer off-time of generation module did not affect the overall power generated from the improved HPTO unit. Figure 21 and Figure 22 present the comparison of M A A P D and L R α for conventional and improved HPTO unit models for the significant wave height and wave peak period cases. The figures depict that the M A A P D i m p . was lower than the M A A P D c o n v . in all sea states. For example, in sea state B, the final M A A P D and L R α of the improved HPTO unit were equal to 55.77 W and 0.107, respectively, whereas the final M A A P D and L R α of the conventional HPTO unit were equal to 57.52 W and 0.114, respectively. In sea state C, the M A A P D and L R α of the improved HPTO unit were significantly lower than the M A A P D and L R α of the conventional HPTO unit. This is due to the shorter generation module off-time, as depicted in Figure 19B. In sea state C, the final M A A P D and L R α of improved HPTO unit were equal to 9.8 W and 0.012, respectively, whereas the final M A A P D and L R α of conventional HPTO unit were equal to 20.11 W and 0.036, respectively, as depicted in Figure 21.
Further analysis of the generated power from the improved HPTO unit in different sea states based on the overall average power was performed to ensure the average of P G , i m p . is not significantly lower than the average of P G , c o n v . . Figure 23 and Figure 24 compare the average of P G , c o n v . and P G , i m p . for the different significant wave height and wave period cases. The overall results in Figure 23 and Figure 24 indicate that the average of the P G , i m p . was higher than the average of the P G , c o n v . in all sea states after 500 s of WECs operation. For example, during the lower significant wave height case (sea state B), the average of P G , i m p . reached up to 44.36 W, while the average of the P G , c o n v . only reached up to 42.86 W, as illustrated in Figure 23A. In the higher significant wave height case (sea state C), the average of P G , i m p . reached up to 90.48 W, while the average of the P G , c o n v . only reached up to 87.29 W, as indicated in Figure 23B. During lower and higher wave peak period sea states, the average of the P G , i m p . reached up to 50.44 W and 67.04 W, as indicated in Figure 24. The average of the P G , c o n v . was only equal to 47.86 W and 64.81 W, as shown in Figure 24, respectively. In summary, Figure 23 and Figure 24 verified that the improved HPTO unit could generate a better quality and amount of electrical power compared to the conventional HPTO unit.

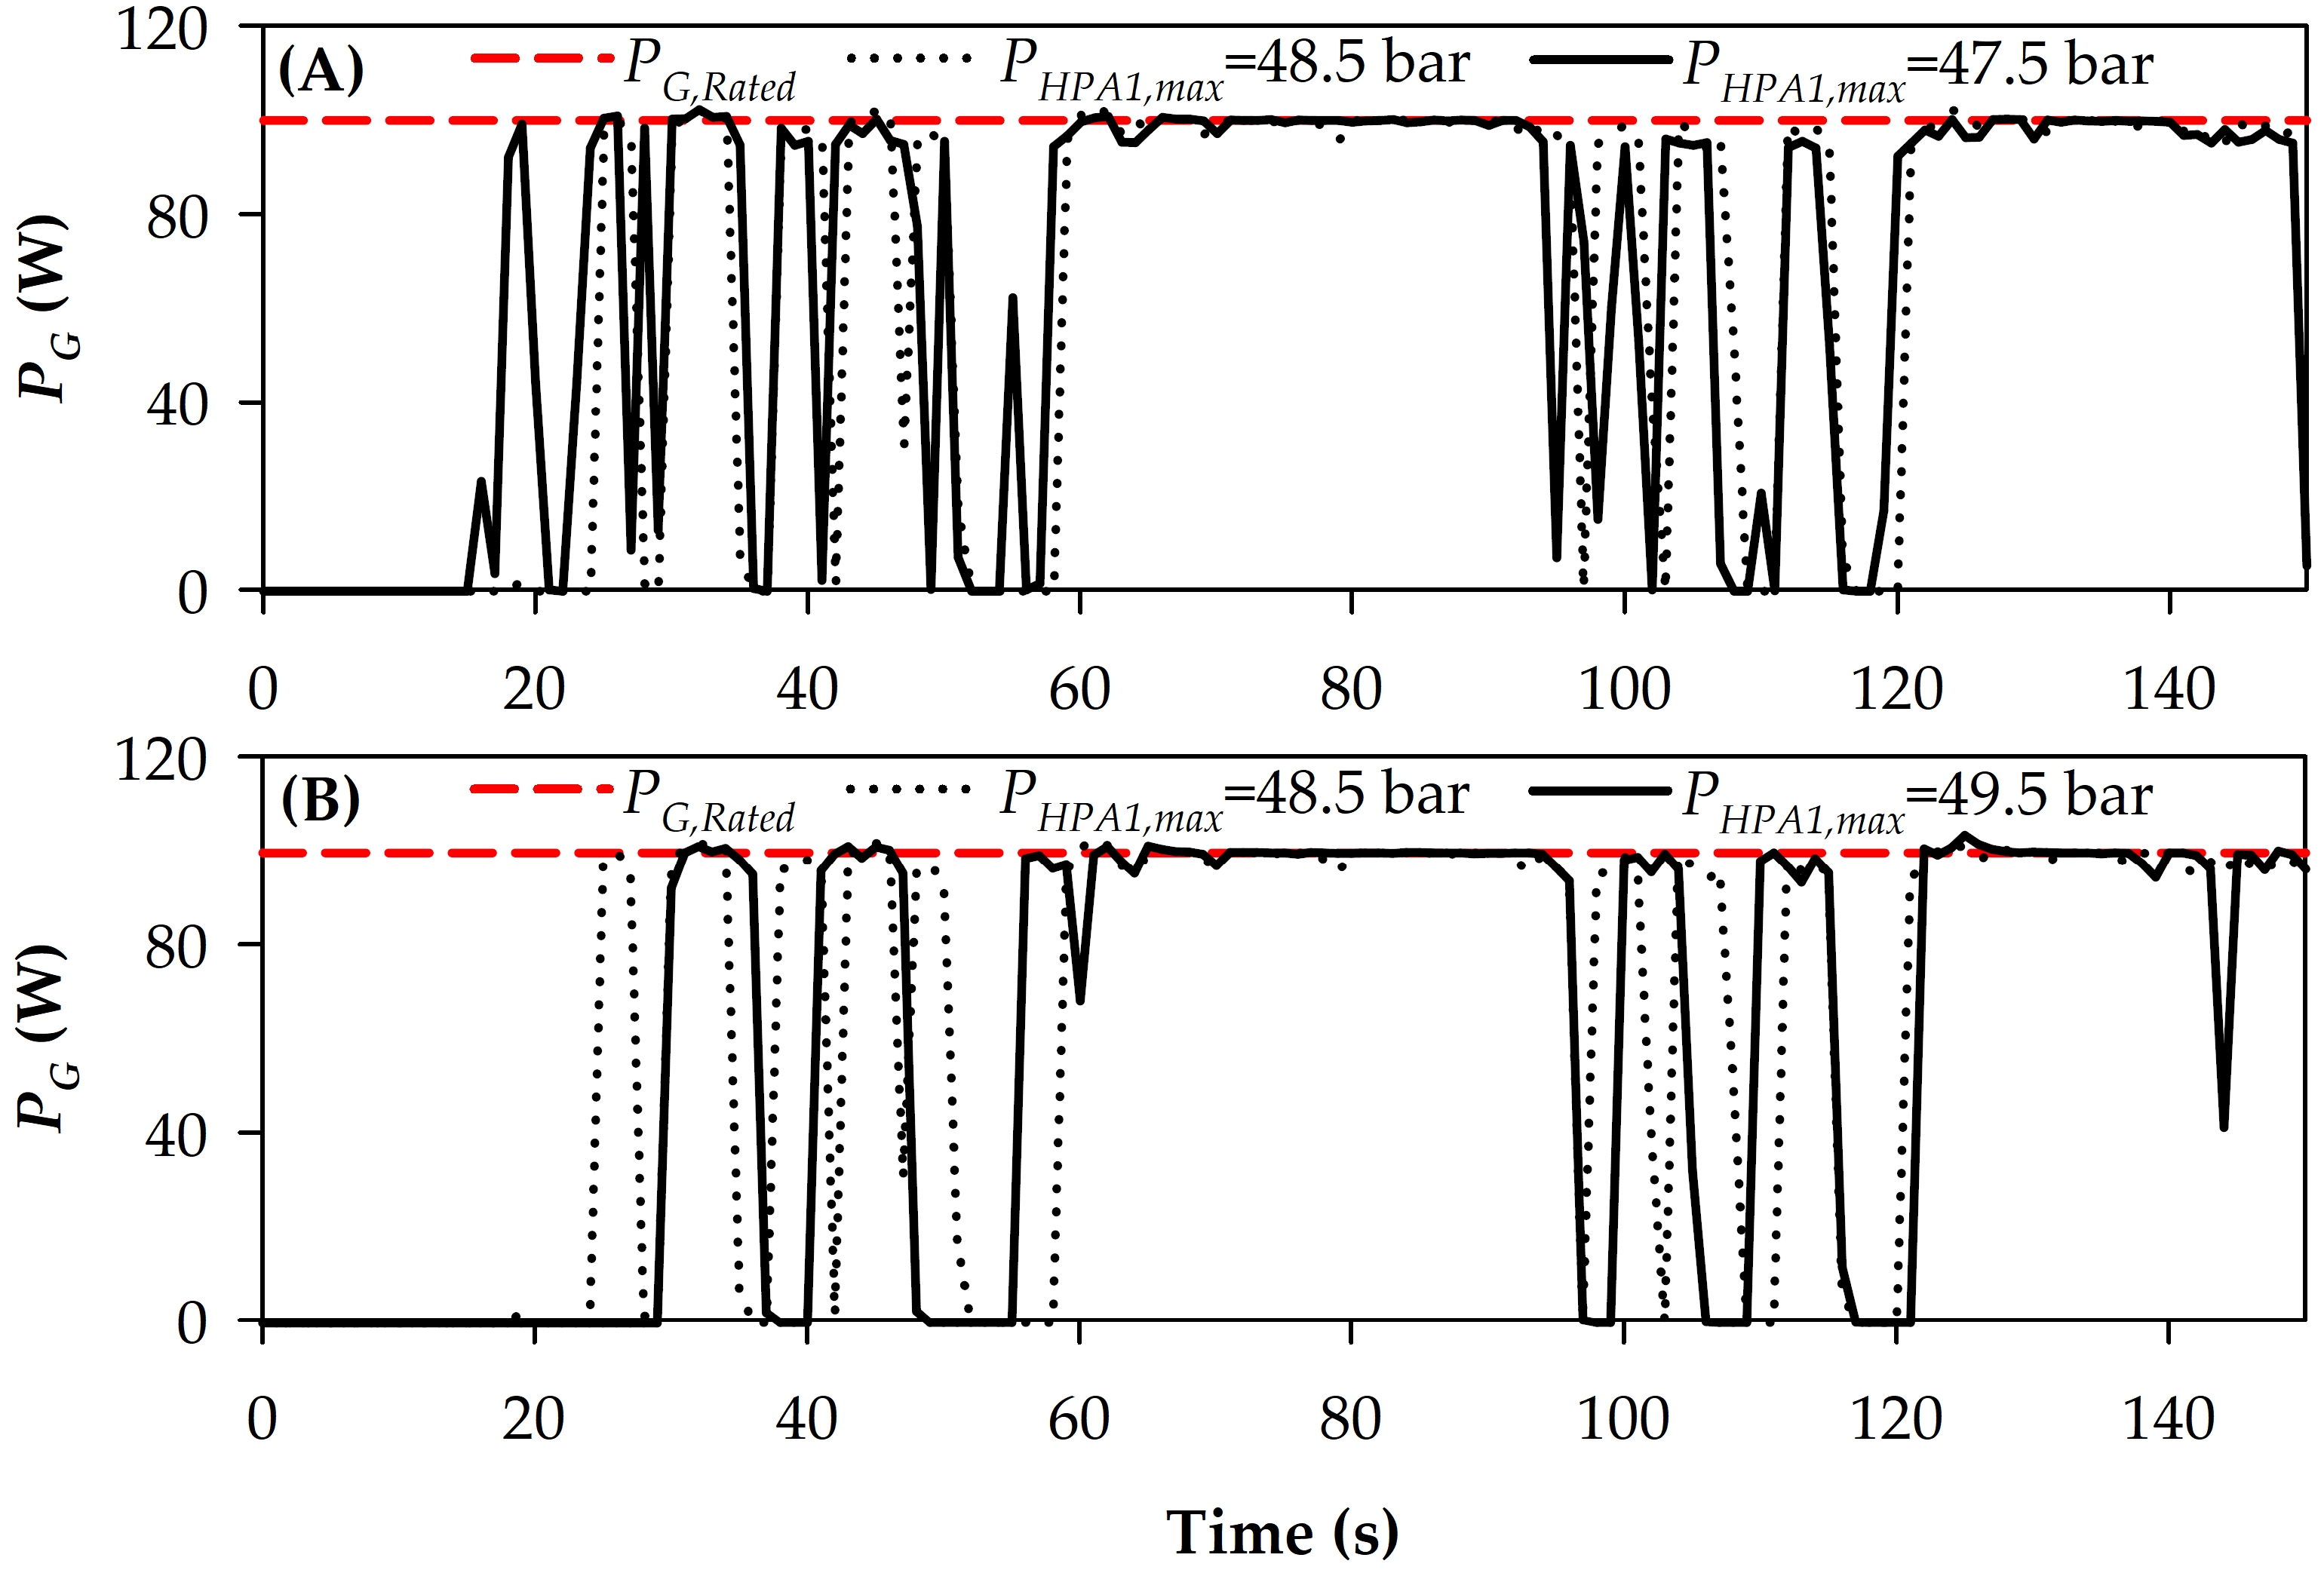
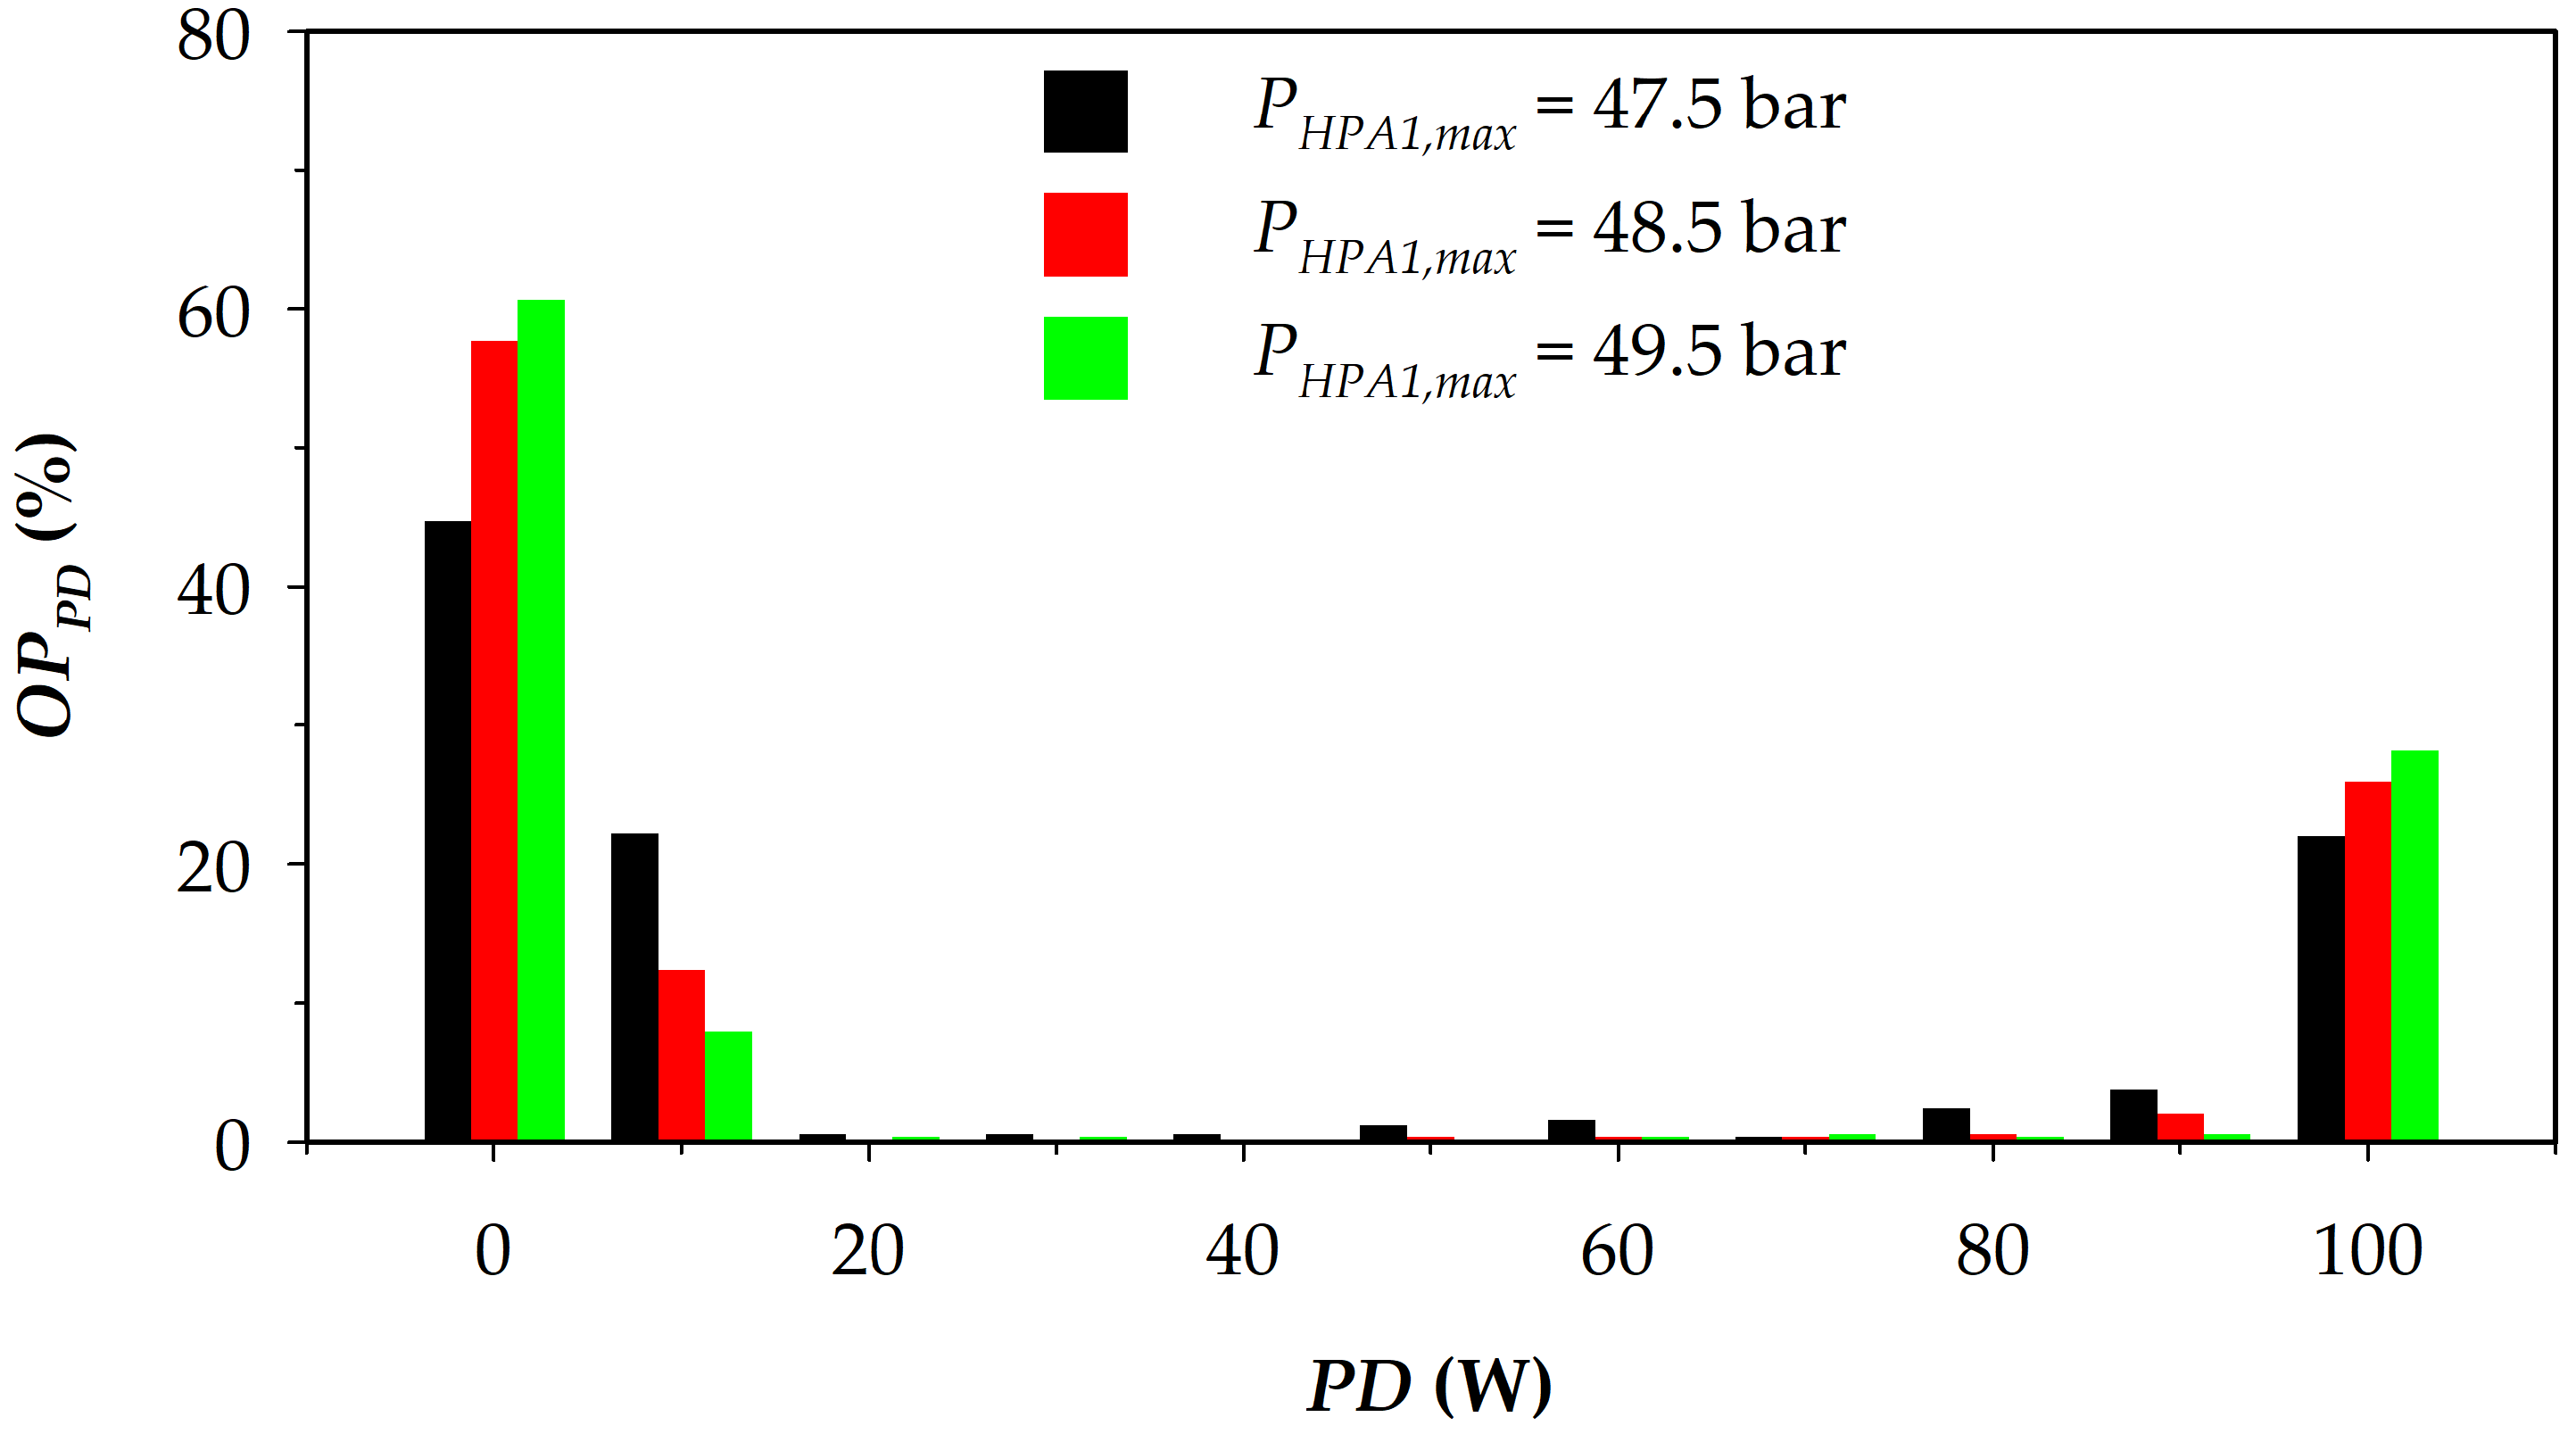
4.4. Effect of HPA1 Pressure Constraint on the Improved HPTO Unit Output

Further simulations of the improved HPTO unit with the different HPA1 pressure constraint were conducted. These simulations were intended to investigate the effect of the upper-pressure constraint of HPA1 ( P H P A 1 , m a x ) on the generated electrical power from the improved HPTO unit. Technically, P H P A 1 , m a x is one of the parameters influencing the accumulation period and the accumulated energy in HPA1. The lower and higher value of P H P A 1 , m a x affects the accumulation period and the accumulated energy in the HPA1. At the lower P H P A 1 , m a x setting, the accumulation period is short, and the accumulated energy is low. Conversely, the accumulation period is long and the accumulated energy is high at the higher P H P A 1 , m a x setting. Subsequently, the accumulation period and accumulated energy in HPA1 influence the hydraulic motor speed as well as the electrical power generated from the generator. In short, the P H P A 1 , m a x setting influences the generated electrical power from the HPTO unit. Figure 25A,B present the example of P G , i m p . profiles for the lower (47.5 bar) and higher (49.5 bar) P H P A 1 , m a x cases. The comparison of results in Figure 25A indicates that, at the lower P H P A 1 , m a x setting, the P G , i m p . can be generated earlier (within 18 s) than the optimal P H P A 1 , m a x setting (within 25 s). On the contrary, P G , i m p . was slightly delayed (within 30 s) than the optimal case using the higher P H P A 1 , m a x setting, as indicated in Figure 25B.
Figure 25 illustrates the effect of the P H P A 1 , m a x setting on the P D occurrences in the generated electrical power from the improved HPTO unit. Overall, the P D occurrences in the generated electrical power were reduced by increasing the P H P A 1 , m a x setting. As indicated in Figure 25, P G , i m p . more fluctuated during the lower P H P A 1 , m a x setting while less fluctuated during the higher P H P A 1 , m a x setting. Figure 26 compares the P D occurrences of P G , i m p . for three different P H P A 1 , m a x settings (47.5 bar, 48.5 bar, and 49.5 bar). The P H P A 1 , m a x setting effects on the P D occurrences of P G , i m p . can be clearly observed from the figure. The improved HPTO unit with the higher P H P A 1 , m a x setting could generate more stable electrical power ( P D = 0 W). As indicated in Figure 26, the improved HPTO unit with a higher P H P A 1 , m a x setting could generate electrical power at the rated capacity during 60.7% of WECs operation. The generated electrical power from improved HPTO unit with lower P H P A 1 , m a x setting only up to 44.7% of WECs operation. The figure also depicts that the generated electrical power with 10% power fluctuation ( P D = 10 W) also was lower during the higher P H P A 1 , m a x setting, which only up to 8% of WECs operation. A more stable electrical power from the improved HPTO unit with a higher P H P A 1 , m a x setting was due to the higher fluid energy accumulated in the HPA1. Furthermore, the higher P H P A 1 , m a x setting also increased the off-time of the generation module in the improved HPTO unit ( P D = 100 W). As indicated in Figure 26, the off-time of the generation module was longer, up to 28.1% of WECs operation. A longer off-time of the generation module was due to the larger pressure constraint during the higher P H P A 1 , m a x setting. A larger pressure constraint required a more extended energy accumulation period of HPA1. Figure 27 depicts the average of P G , i m p . and L R α corresponds to different P H P A 1 , m a x . The dotted-red line indicates the optimal P H P A 1 , m a x setting, which corresponds to the average of P G , i m p . and L R α . From the figure, the lower and the higher P H P A 1 , m a x setting significantly influences the average of P G , i m p . and L R α . The increasing and reducing of the P H P A 1 , m a x setting significantly increased the overall L R α of the improved HPTO unit. As shown in Figure 27, the L R α was increased from 0.05601 (optimal) to 0.05915 and 0.05855. An increase in L R α has reduced the average of P G , i m p . , as presented in Figure 27. The figure shows that the average of P G , i m p . was reduced up to 69 W and 67.4 W when the P H P A 1 , m a x setting was set to 47.5 bar and 51.5 bar, respectively. The detailed findings of the P H P A 1 , m a x effects on the P G , i m p . are summarized in Table 4.

5. Conclusions

This study proposed an improved HPTO unit model for the WECs to improve the quality of the generated electrical power. A novel FEC module was introduced to mitigate the fluctuation issues in the generated electrical power from the HPTO unit. A comprehensive simulation analysis was carried out using MATLAB/Simulink software. In the first part, the improved HPTO unit model was simulated using five irregular wave inputs to evaluate its performance in irregular circumstances. In the second part, the improved HPTO unit model was simulated using the different HPA1 pressure constraints in order to investigate the effects of the pressure constraints on the generated electrical power from the improved HPTO unit. From the simulation investigations, the following conclusions can be drawn:
  • The genetic algorithm was introduced to obtain the optimal parameters of the control strategy for the improved HPTo unit. The optimization process of the control strategy parameters was carried out for 7 h 30 min.
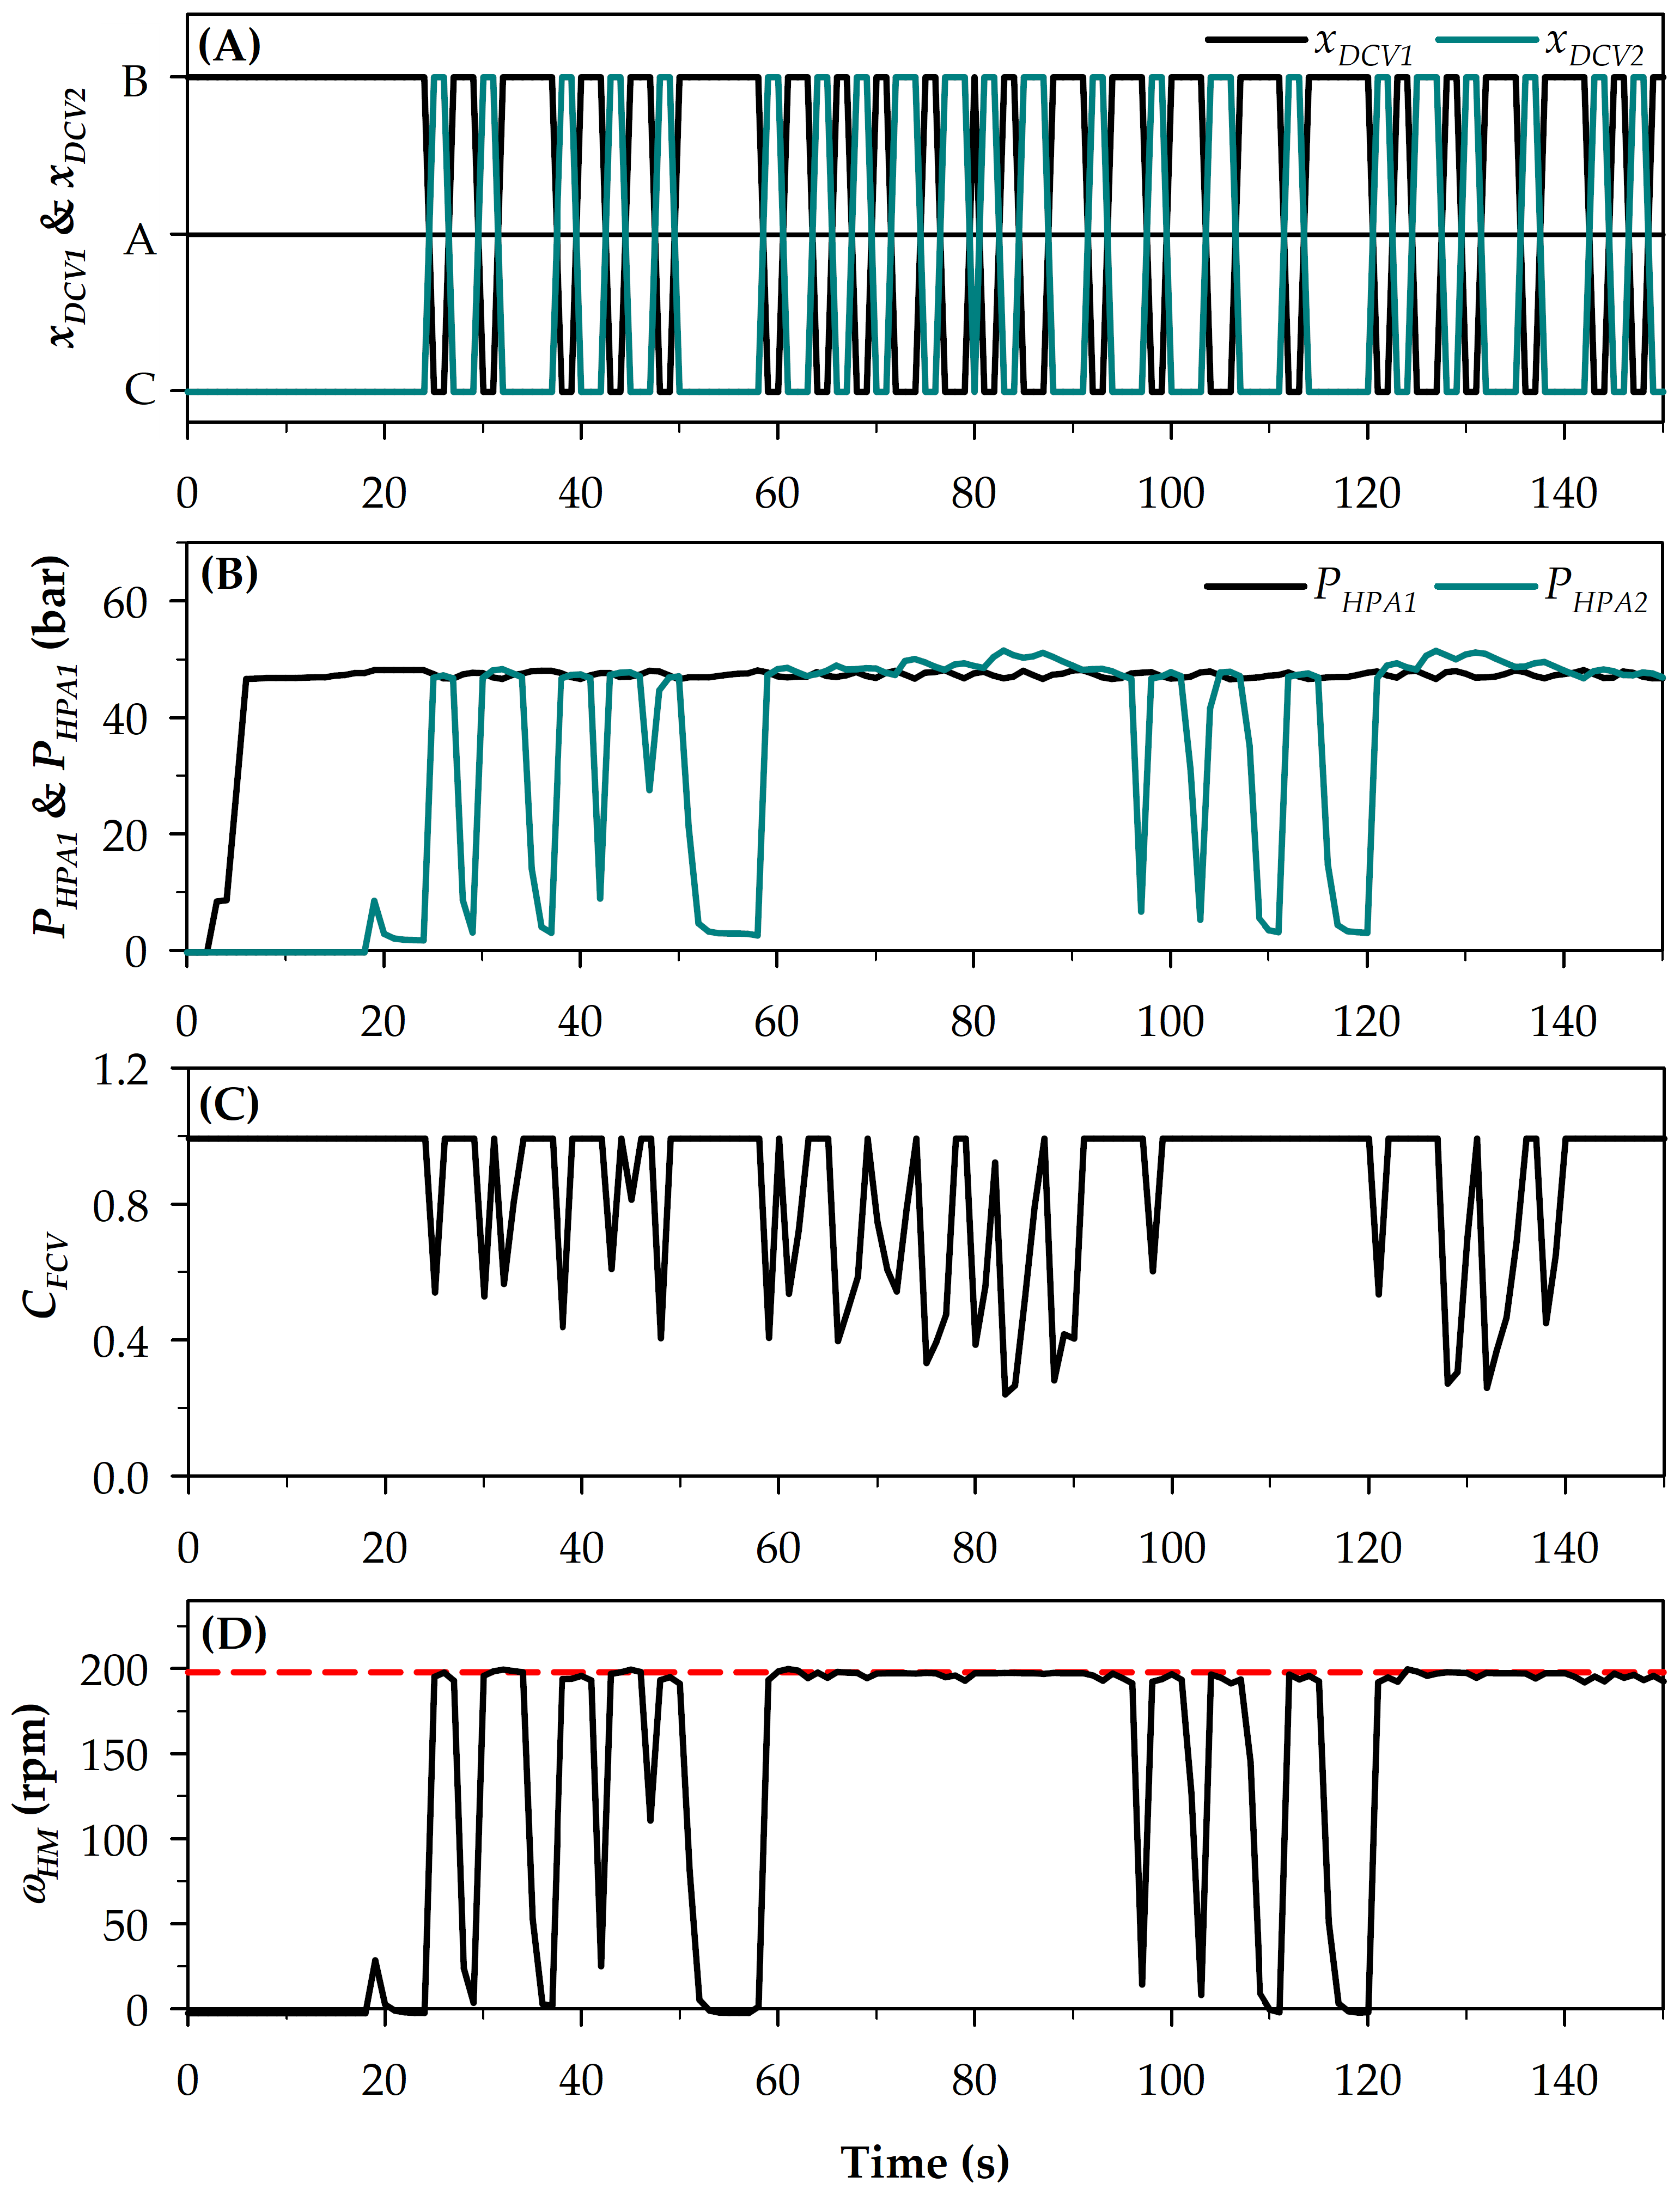
  • By employing the improved HPTO unit, the unnecessary fluctuations in the generated electrical power from the WECs were significantly reduced. The integration between the dual HPA module and FEC module in the improved HPTO unit transformed the high-fluctuation electrical power to a more stable electrical power. The improved HPTO unit could generate electricity at the rated capacity during 57.6% of WECs operation during nominal sea state.
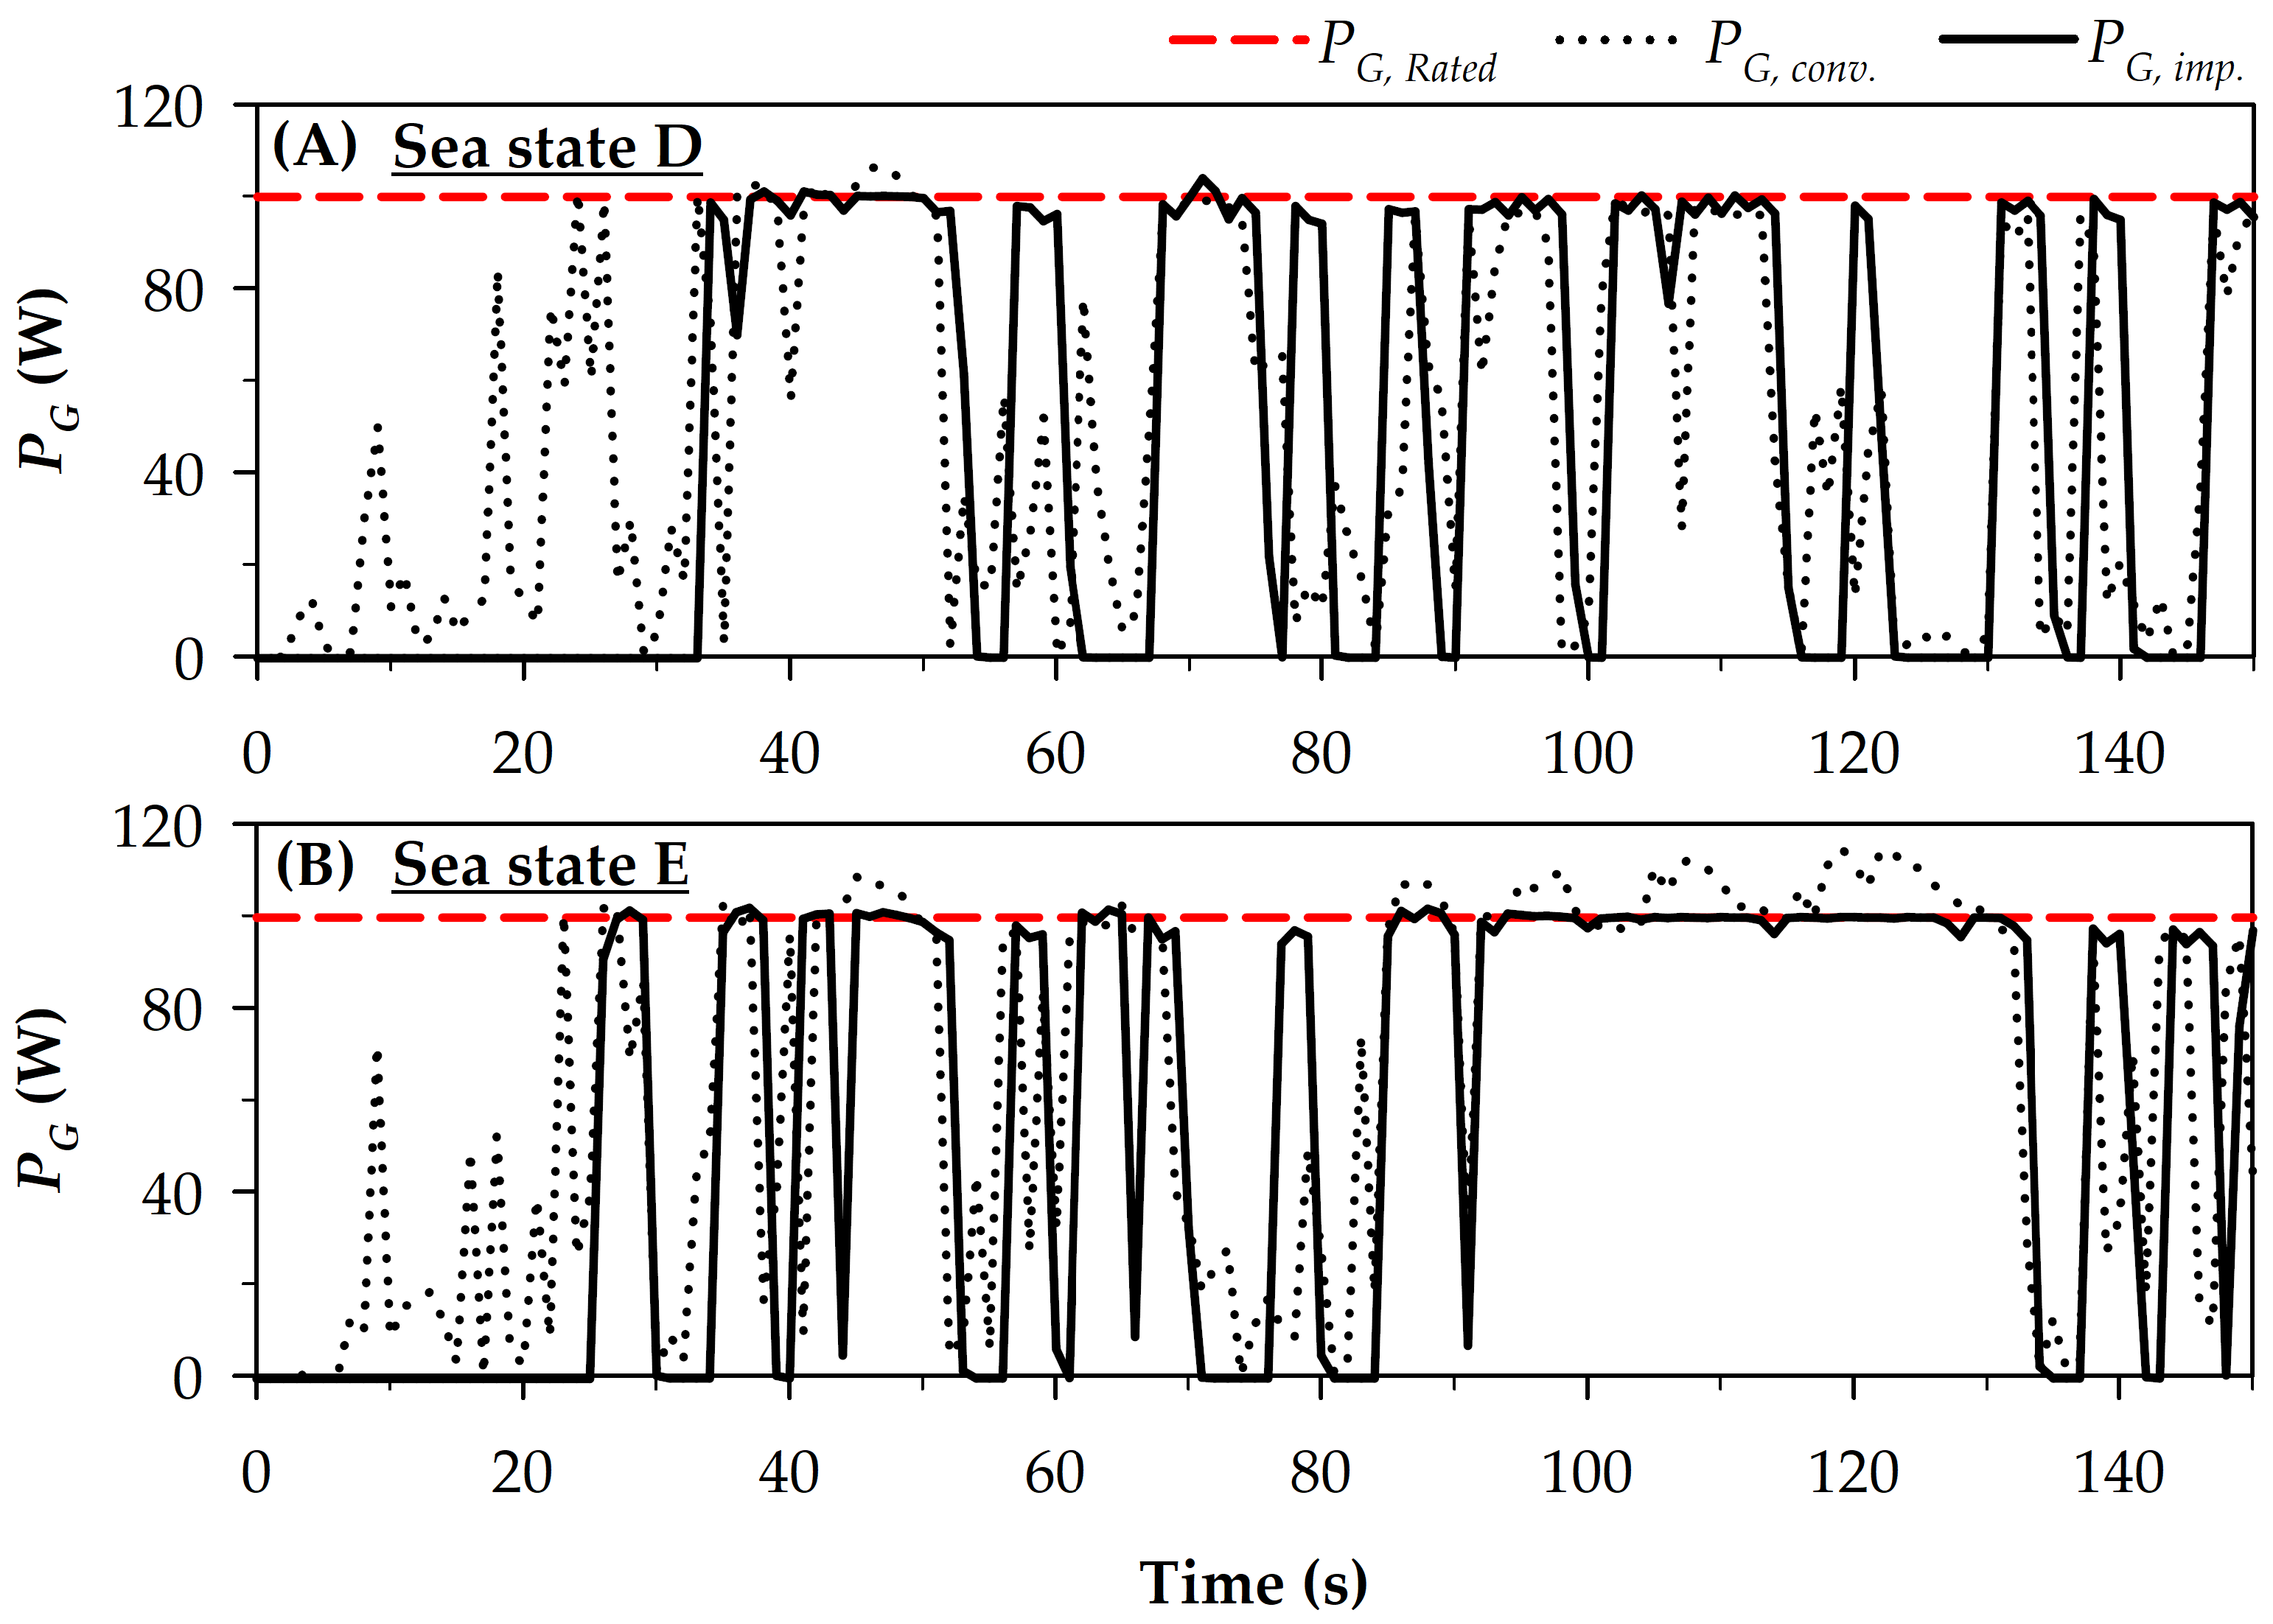
  • The performances of the improved HPTO unit at the different sea states were also higher than the conventional HPTO unit performance. At the lower (sea state B) and higher (sea state C) wave height sea states, the improved HPTO unit could generate electricity at the rated capacity during 34.3% and 78.6% of WECs operation. At the lower (sea state D) and higher (sea state E) wave period sea states, the improved HPTO unit could generate the electricity at the rated capacity during 37.3% and 53.7% of WECs operation, respectively.
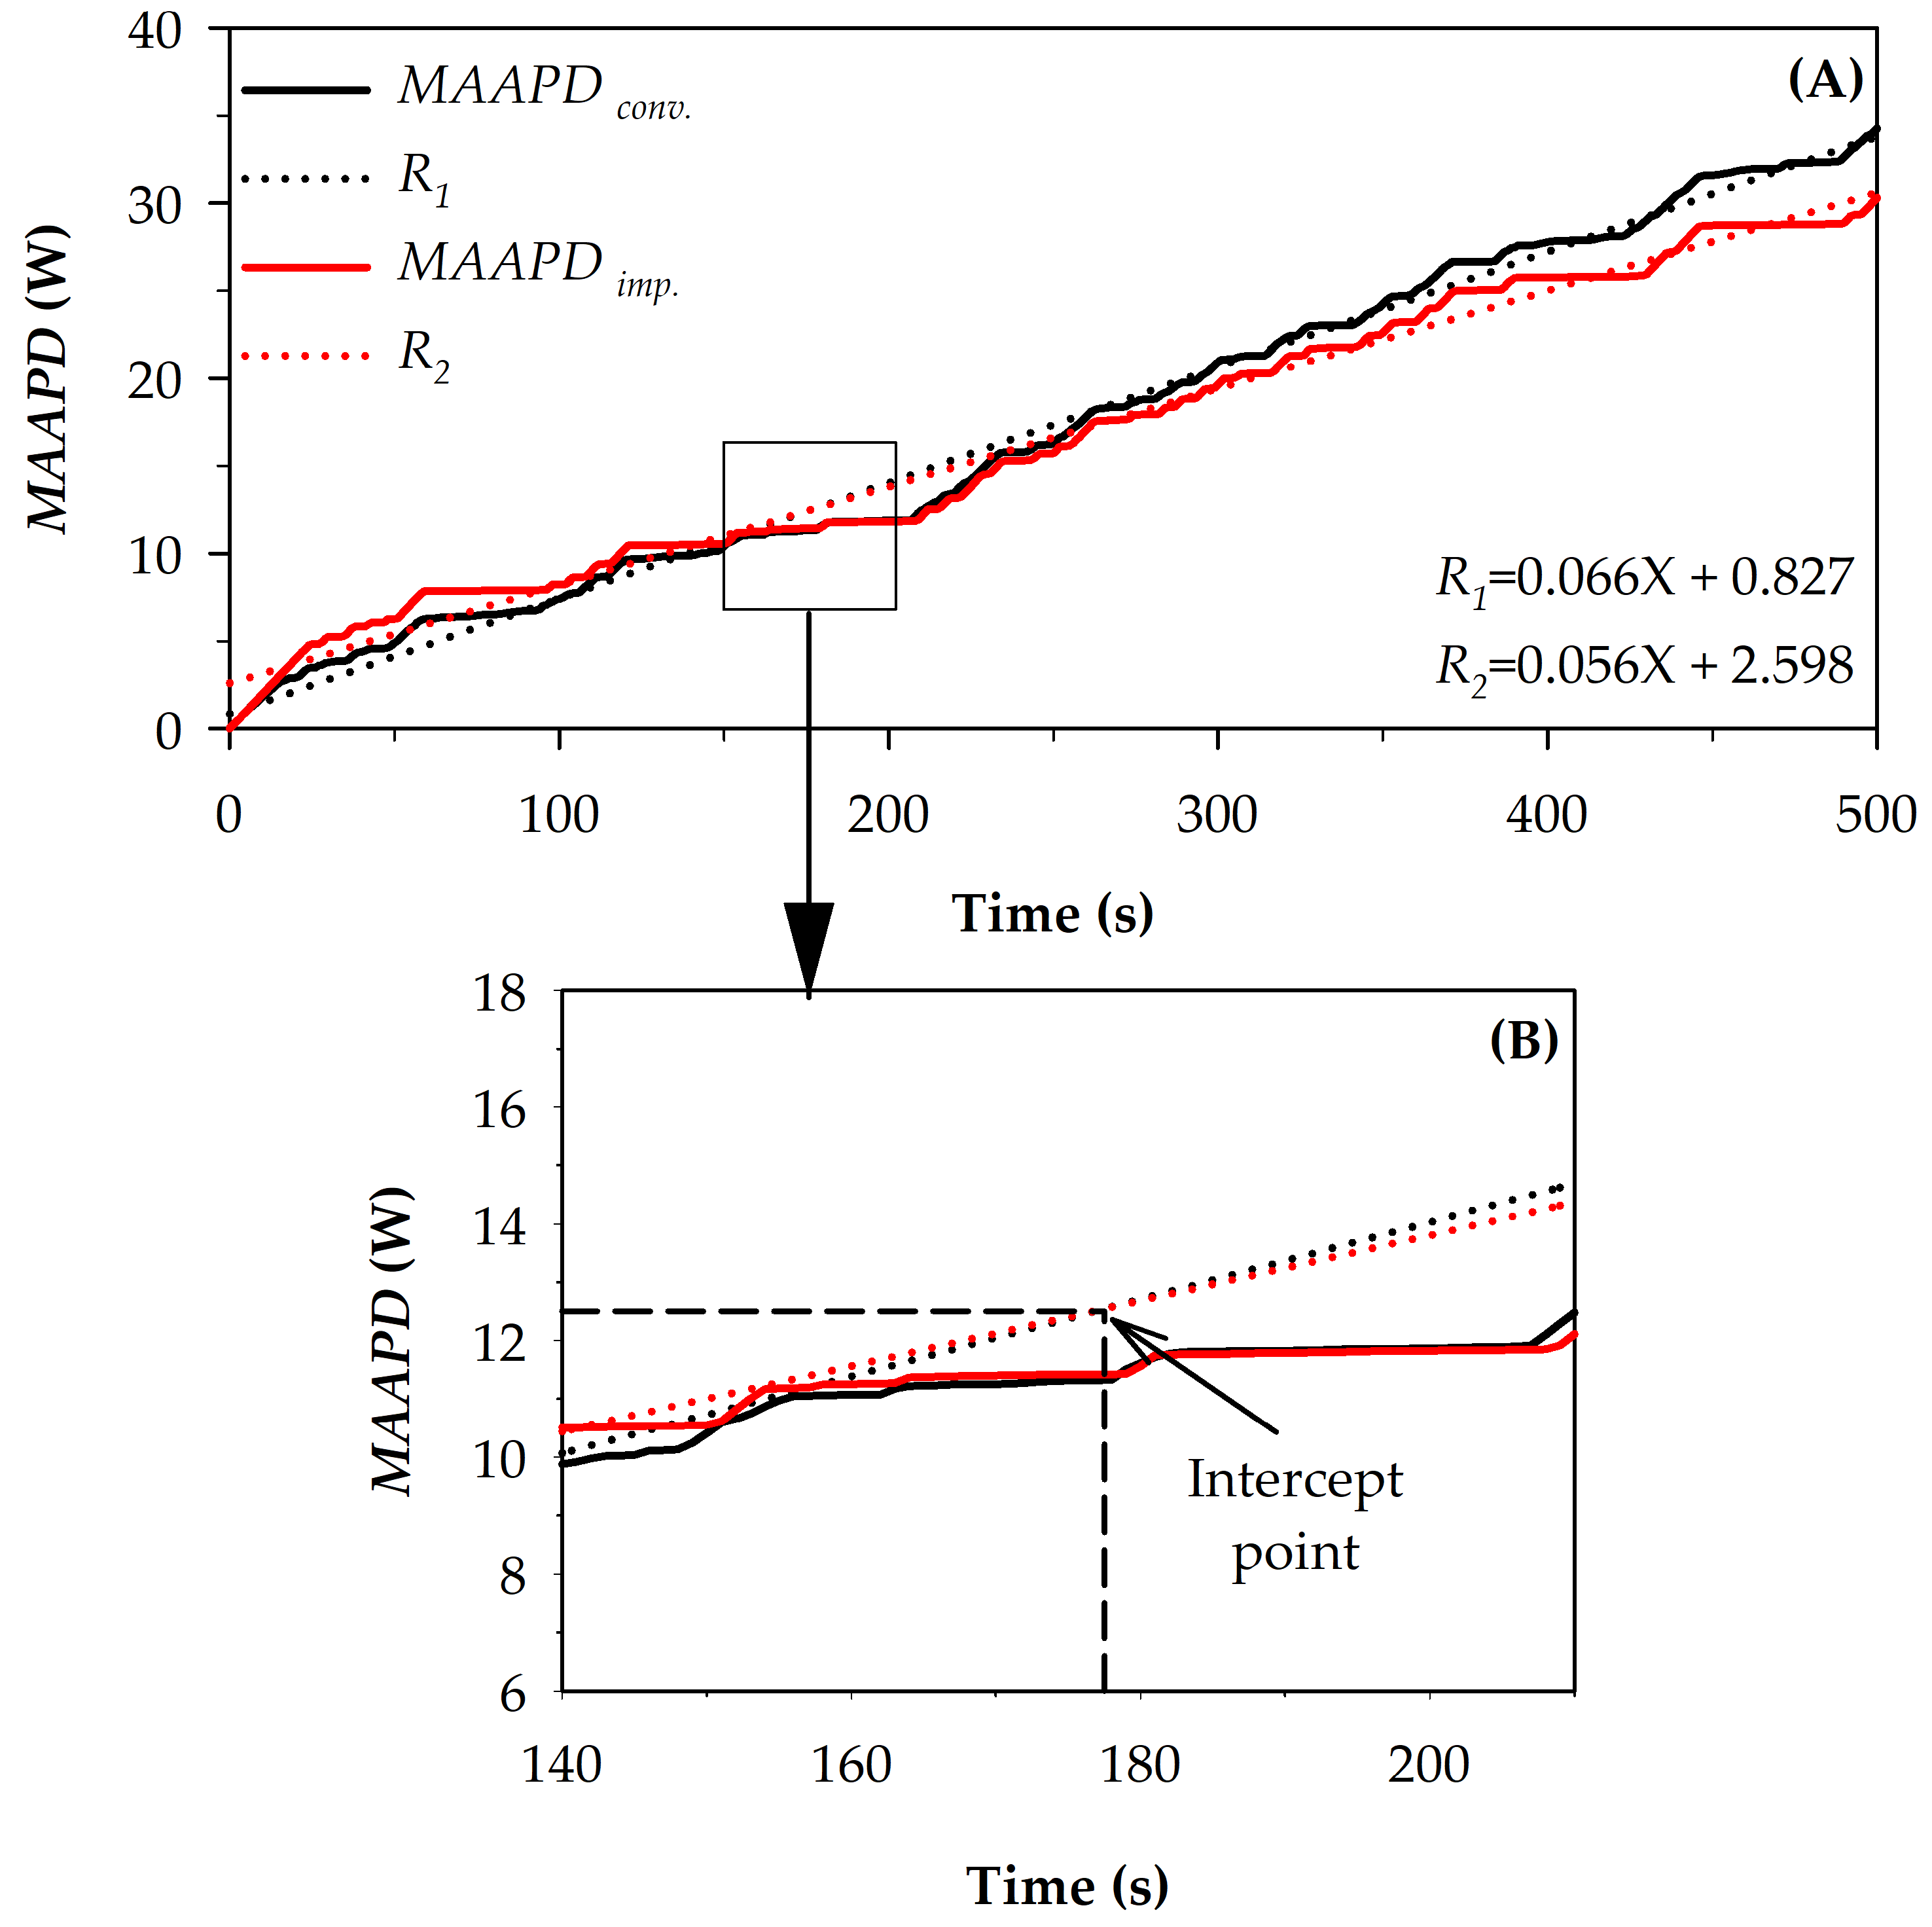
  • Overall, the lower and the higher P H P A 1 , m a x setting significantly influences the average of P G , i m p . and the power fluctuation occurrences. The average of P G , i m p . was reduced up to 69 W and 67.4 W when the P H P A 1 , m a x setting was set to 47.5 bar and 51.5 bar, respectively.
The presented improved HPTO unit model may help designers, engineers, and researchers to reduce the fluctuation problems in WECs applications. The introduced optimization method for the control strategy parameters can be applied to solve the other optimization problem in order to increase the performance WECs. The experiment validation of the improved HPTO unit is compulsory to ensure its effectiveness in real application; therefore, further study on the experiment validation of the improved HPTO unit should be explored. Finally, the implementation of the proposed control strategy in different types of HPTO unit is suggested to be conducted in future.

Author Contributions

M.A.J., conceptualization, methodology, software, data curation, analysis, writing—original draft; M.Z.I., writing—review and editing and supervision, project administration, funding acquisition; M.Z.D., conceptualization, methodology, writing—review and editing, supervision; Z.M.Y., software, data curation, analysis, writing—original draft; A.A. data curation, analysis, writing—review and editing. All authors have read and agreed to the published version of the manuscript.

Funding

This project was funded by the Ministry of Higher Education (MOHE) under the Fundamental Research Grant Scheme (FRGS/1/2019/TK07/UMT/01/1).

Institutional Review Board Statement

Not applicable.

Informed Consent Statement

Not applicable.

Data Availability Statement

Data available on request due to restrictions of privacy.

Acknowledgments

The authors would like to thank the Ministry of Higher Education (MOHE) and Universiti Malaysia Terengganu (UMT) for financial support for this research.

Conflicts of Interest

The authors declare no conflict of interest.

Abbreviations

The following abbreviations are used in this manuscript:
CSControl System
CVCheck Valve
DCVDirectional Control Valve
FCVFlow Control Valve
FECFluid Energy Control
GAGenetic Algorithm
HAHydraulic Actuator
HMHydraulic Motor
HPAHigh Pressure Accumulator
HPTOHydraulic Power Take-Off
LPALow Pressure Accumulator
LVQNNLearning Vector Quantitative Neural Network
NLPQLNon-Linear Programming by Quadratic Lagrangian
PTOPower Take-Off
RVRelief Valve
WAWave Absorber
WABWave-Activated-Body
WECsWave Energy Conversion System

References

  1. Melikoglu, M. Current status and future of ocean energy sources: A global review. Ocean Eng. 2018, 148, 563–573. [Google Scholar] [CrossRef]
  2. Rusu, E.; Onea, F. A review of the technologies for wave energy extraction. Clean Energy 2018, 2, 10–19. [Google Scholar] [CrossRef] [Green Version]
  3. Titah-Benbouzid, H.; Benbouzid, M. An up-to-date technologies review and evaluation of wave energy converters. Int. Rev. Electr. Eng. 2015, 10, 52–61. [Google Scholar] [CrossRef]
  4. Farrok, O.; Ahmed, K.; Tahlil, A.D.; Farah, M.M.; Kiran, M.R.; Islam, M.R. Electrical power generation from the oceanic wave for sustainable advancement in renewable energy technologies. Sustainability 2020, 12, 2178. [Google Scholar] [CrossRef] [Green Version]
  5. Ilyas, A.; Kashif, S.A.; Saqib, M.A.; Asad, M.M. Wave electrical energy systems: Implementation, challenges and environmental issues. Renew. Sustain. Energy Rev. 2014, 40, 260–268. [Google Scholar] [CrossRef]
  6. Yusop, Z.M.; Ibrahim, M.Z.; Jusoh, M.A.; Albani, A.; Rahman, S.J.A. Wave-Activated Body Energy Converter Technologies: A Review. J. Adv. Res. Fluid Mech. Therm. Sci. 2020, 76, 76–104. [Google Scholar] [CrossRef]
  7. Wang, L.; Kolios, A.; Cui, L.; Sheng, Q. Flexible multibody dynamics modelling of point-absorber wave energy converters. Renew. Energy 2018, 127, 790–801. [Google Scholar] [CrossRef]
  8. Ozkop, E.; Altas, I.H. Control, power and electrical components in wave energy conversion systems: A review of the technologies. Renew. Sustain. Energy Rev. 2017, 67, 106–115. [Google Scholar] [CrossRef]
  9. He, X.; Xiao, G.; Hu, B.; Tan, L.; Tang, H.; He, S.; He, Z. The applications of energy regeneration and conversion technologies based on hydraulic transmission systems: A review. Energy Convers. Manag. 2020, 205, 112413. [Google Scholar] [CrossRef]
  10. Jusoh, M.A.; Ibrahim, M.Z.; Daud, M.Z.; Albani, A.; Yusop, Z.M. Hydraulic power take-off concepts for wave energy conversion system: A review. Energies 2019, 12, 4510. [Google Scholar] [CrossRef] [Green Version]
  11. Wang, L.; Isberg, J.; Tedeschi, E. Review of control strategies for wave energy conversion systems and their validation: The wave-to-wire approach. Renew. Sustain. Energy Rev. 2018, 81, 366–379. [Google Scholar] [CrossRef]
  12. Penalba, M.; Ringwood, J.V.; Penalba, M.; Ringwood, J.V. A Review of Wave-to-Wire Models for Wave Energy Converters. Energies 2016, 9, 506. [Google Scholar] [CrossRef] [Green Version]
  13. Zhang, D.; Li, W.; Lin, Y.; Bao, J. An overview of hydraulic systems in wave energy application in China. Renew. Sustain. Energy Rev. 2012, 16, 4522–4526. [Google Scholar] [CrossRef]
  14. Lin, Y.; Bao, J.; Liu, H.; Li, W.; Tu, L.; Zhang, D. Review of hydraulic transmission technologies for wave power generation. Renew. Sustain. Energy Rev. 2015, 50, 194–203. [Google Scholar] [CrossRef]
  15. Kurniawan, A.; Pedersen, E.; Moan, T. Bond graph modelling of a wave energy conversion system with hydraulic power take-off. Renew. Energy 2012, 38, 234–244. [Google Scholar] [CrossRef]
  16. Tri, N.M.; Truong, D.Q.; Thinh, D.H.; Binh, P.C.; Dung, D.T.; Lee, S.; Park, H.G.; Ahn, K.K. A novel control method to maximize the energy-harvesting capability of an adjustable slope angle wave energy converter. Renew. Energy 2016, 97, 518–531. [Google Scholar] [CrossRef]
  17. Ding, B.; Cazzolato, B.S.; Arjomandi, M.; Hardy, P.; Mills, B. Sea-state based maximum power point tracking damping control of a fully submerged oscillating buoy. Ocean Eng. 2016, 126, 299–312. [Google Scholar] [CrossRef]
  18. Pedersen, H.C.; Hansen, R.H.; Hansen, A.H.; Andersen, T.O.; Bech, M.M. Design of full scale wave simulator for testing Power Take Off systems for wave energy converters. Int. J. Mar. Energy 2016, 13, 130–156. [Google Scholar] [CrossRef]
  19. Hansen, A.H.; Asmussen, M.F.; Bech, M.M. Model predictive control of a wave energy converter with discrete fluid power power take-off system. Energies 2018, 11, 635. [Google Scholar] [CrossRef] [Green Version]
  20. Hansen, R.H.; Kramer, M.M.; Vidal, E.; Hansen, R.H.; Kramer, M.M.; Vidal, E. Discrete displacement hydraulic power take-off system for the wavestar wave energy converter. Energies 2013, 6, 4001–4044. [Google Scholar] [CrossRef]
  21. Gaspar, J.F.; Calvário, M.; Kamarlouei, M.; Guedes Soares, C. Power take-off concept for wave energy converters based on oil-hydraulic transformer units. Renew. Energy 2016, 86, 1232–1246. [Google Scholar] [CrossRef]
  22. Jusoh, M.A.; Ibrahim, M.Z.; Daud, M.Z.; Yusop, Z.M.; Albani, A. An Estimation of Hydraulic Power Take-off Unit Parameters for Wave Energy Converter Device Using Non-Evolutionary NLPQL and Evolutionary GA Approaches. Energies 2020, 14, 79. [Google Scholar] [CrossRef]
  23. Gaspar, J.F.; Calvário, M.; Kamarlouei, M.; Soares, C.G. Design tradeoffs of an oil-hydraulic power take-off for wave energy converters. Renew. Energy 2018, 129, 245–259. [Google Scholar] [CrossRef]
  24. Othman, F.; Sadeghian, M.S.; Ebrahimi, F.; Heydari, M. A Study on Sedimentation in Sefidroud Dam by Using Depth Evaluation and Comparing the Results with USBR and FAO Methods. In Proceedings of the International Proceedings of Chemical, Biological and Environmental Engineering, Kuala Lumpur, Malaysia, 8–9 Jun 2013; Volume 51, p. 6. [CrossRef]
  25. Gaspar, J.F.; Kamarlouei, M.; Sinha, A.; Xu, H.; Calvário, M.; Faÿ, F.X.; Robles, E.; Soares, C.G. Speed control of oil-hydraulic power take-off system for oscillating body type wave energy converters. Renew. Energy 2016, 97, 769–783. [Google Scholar] [CrossRef]
  26. Liu, Z.; Qu, N.; Han, Z.; Zhang, J.; Zhang, S.; Li, M.; Shi, H. Study on energy conversion and storage system for a prototype buoys-array wave energy converter. Energy Sustain. Dev. 2016, 34, 100–110. [Google Scholar] [CrossRef]
  27. Do, H.T.; Dang, T.D.; Ahn, K.K. A multi-point-absorber wave-energy converter for the stabilization of output power. Ocean Eng. 2018, 161, 337–349. [Google Scholar] [CrossRef]
  28. Jusoh, M.A.; Yusop, Z.M.; Albani, A.; Daud, M.Z.; Ibrahim, M.Z. Investigations of hydraulic power take-off unit parameters effects on the performance of the wab-wecs in the different irregular sea states. J. Mar. Sci. Eng. 2021, 9, 897. [Google Scholar] [CrossRef]
  29. Liu, C.; Yang, Q.; Bao, G. Influence of hydraulic power take-off unit parameters on power capture ability of a two-raft-type wave energy converter. Ocean Eng. 2018, 150, 69–80. [Google Scholar] [CrossRef]
  30. Gao, H.; Xiao, J. Effects of power take-off parameters and harvester shape on wave energy extraction and output of a hydraulic conversion system. Appl. Energy 2021, 299, 117278. [Google Scholar] [CrossRef]
  31. Jusoh, M.A.; Ibrahim, M.Z.; Daud, M.Z.; Yusop, Z.M.; Albani, A.; Rahman, S.J.; Mohad, S. Parameters estimation of hydraulic power take-off system for wave energy conversion system using genetic algorithm. In Proceedings of the IOP Conference Series: Earth and Environmental Science, Bangkok, Thailand, 11–14 December 2019; Institute of Physics Publishing: Bristol, UK, 2020; Volume 463, p. 12129. [Google Scholar] [CrossRef]
  32. Cargo, C.J.; Plummer, A.R.; Hillis, A.J.; Schlotter, M. Determination of optimal parameters for a hydraulic power take-off unit of a wave energy converter in regular waves. Proc. Inst. Mech. Eng. Part J. Power Energy 2012, 226, 98–111. [Google Scholar] [CrossRef]
  33. Cargo, C.J.; Hillis, A.J.; Plummer, A.R. Optimisation and control of a hydraulic power take-off unit for a wave energy converter in irregular waves. Proc. Inst. Mech. Eng. Part J. Power Energy 2014, 228, 462–479. [Google Scholar] [CrossRef] [Green Version]
  34. Cargo, C.J.; Hillis, A.J.; Plummer, A.R. Strategies for active tuning of Wave Energy Converter hydraulic power take-off mechanisms. Renew. Energy 2016, 94, 32–47. [Google Scholar] [CrossRef] [Green Version]
  35. Sun, P.; Li, Q.; He, H.; Chen, H.; Zhang, J.; Li, H.; Liu, D. Design and optimization investigation on hydraulic transmission and energy storage system for a floating-array-buoys wave energy converter. Energy Convers. Manag. 2021, 235, 113998. [Google Scholar] [CrossRef]
  36. Wang, D.; Lu, K. Design optimization of hydraulic energy storage and conversion system for wave energy converters. Prot. Control Mod. Power Syst. 2018, 3, 7. [Google Scholar] [CrossRef]
  37. Chen, Q.; Yue, X.; Geng, D.; Yan, D.; Jiang, W. Integrated characteristic curves of the constant-pressure hydraulic power take-off in wave energy conversion. Int. J. Electr. Power Energy Syst. 2020, 117, 105730. [Google Scholar] [CrossRef]
  38. Calvário, M.; Gaspar, J.F.; Kamarlouei, M.; Hallak, T.S.; Guedes Soares, C. Oil-hydraulic power take-off concept for an oscillating wave surge converter. Renew. Energy 2020, 159, 1297–1309. [Google Scholar] [CrossRef]
  39. Jusoh, M.A.; Daud, M.Z. Control strategy of a grid-connected photovoltaic with battery energy storage system for hourly power dispatch. Int. J. Power Electron. Drive Syst. 2017, 8, 1830–1840. [Google Scholar] [CrossRef]
  40. Jusoh, M.A.; Daud, M.Z. Particle swarm optimisation-based optimal photovoltaic system of hourly output power dispatch using Lithium-ion batteries. J. Mech. Eng. Sci. 2017, 11, 2780–2793. [Google Scholar] [CrossRef]
  41. Fan, Y.; Mu, A.; Ma, T. Design and control of a point absorber wave energy converter with an open loop hydraulic transmission. Energy Convers. Manag. 2016, 121, 13–21. [Google Scholar] [CrossRef]
  42. Wang, K.; Sheng, S.; Zhang, Y.; Ye, Y.; Jiang, J.; Lin, H.; Huang, Z.; Wang, Z.; You, Y. Principle and control strategy of pulse width modulation rectifier for hydraulic power generation system. Renew. Energy 2019, 135, 1200–1206. [Google Scholar] [CrossRef]
  43. Ricci, P.; Lopez, J.; Santos, M.; Ruiz-Minguela, P.; Villate, J.L.; Salcedo, F.; Falcão, A.; Falcão, A.F. Control strategies for a wave energy converter connected to a hydraulic power take-off. IET Renew. Power Gener. 2011, 5, 234. [Google Scholar] [CrossRef]
  44. Jianan, X.; Tao, X. MPPT Control of Hydraulic Power Take-Off for Wave Energy Converter on Artificial Breakwater. J. Mar. Sci. Eng. 2019, 8, 304. [Google Scholar] [CrossRef]
  45. Zou, S.; Abdelkhalik, O. Control of Wave Energy Converters with Discrete Displacement Hydraulic Power Take-Off Units. J. Mar. Sci. Eng. 2018, 6, 31. [Google Scholar] [CrossRef] [Green Version]
  46. Song, R.; Dai, Y.M.; Qian, X. Intermittent wave energy generation system with hydraulic energy storage and pressure control for stable power output. J. Mar. Sci. Technol. 2018, 23, 802–813. [Google Scholar] [CrossRef] [Green Version]
  47. Gaspar, J.F.; Kamarlouei, M.; Sinha, A.; Xu, H.; Calvário, M.; Faÿ, F.X.; Robles, E.; Guedes Soares, C. Analysis of electrical drive speed control limitations of a power take-off system for wave energy converters. Renew. Energy 2017, 113, 335–346. [Google Scholar] [CrossRef]
  48. Truong, D.Q.; Ahn, K.K. Development of a novel point absorber in heave for wave energy conversion. Renew. Energy 2014, 65, 183–191. [Google Scholar] [CrossRef]
  49. Shadman, M.; Estefen, S.F.; Rodriguez, C.A.; Nogueira, I.C. A geometrical optimization method applied to a heaving point absorber wave energy converter. Renew. Energy 2018, 115, 533–546. [Google Scholar] [CrossRef]
  50. Coiro, D.P.; Troise, G.; Calise, G.; Bizzarrini, N. Wave energy conversion through a point pivoted absorber: Numerical and experimental tests on a scaled model. Renew. Energy 2016, 87, 317–325. [Google Scholar] [CrossRef]
  51. Chen, Z.; Zhou, B.; Zhang, L.; Sun, L.; Zhang, X. Performance evaluation of a dual resonance wave-energy convertor in irregular waves. Appl. Ocean Res. 2018, 77, 78–88. [Google Scholar] [CrossRef]
  52. Mathworks. Hydraulics (Isothermal) Library—MATLAB & Simulink. Available online: https://www.mathworks.com/help/physmod/hydro/hydraulics-modeling.html (accessed on 2 December 2021).
Figure 1. Schematic diagram of the considered WECs. (A) A complete system diagram, and (B) the enlarged diagram of the interconnection between the WA device and the HPTO unit.
Jmse 10 01160 g001
Figure 2. Schematic diagram of HPTO unit concepts. (A) Conventional HPTO unit from [22] and (B) an improved HPTO unit proposed in the present study.
Jmse 10 01160 g002
Figure 3. A proposed control strategy of FEC module.
Jmse 10 01160 g003
Figure 4. A closed-loop PID controller for flow control valve.
Jmse 10 01160 g004
Figure 5. Wave spectra for different sea states.
Jmse 10 01160 g005
Figure 6. Examples of five different irregular wave profiles for 50 s time period.
Jmse 10 01160 g006
Figure 7. Hydrodynamic parameters of wave absorber device from preliminary simulation in ANSYS/AQWA. (A) Excitation force coefficient; (B) Added mass coefficient; (C) Radiation damping coefficient; (D) Impulse response function.
Jmse 10 01160 g007
Figure 8. A developed WECs simulation model in MATLAB/Simulink. (A) WA device submodel; (B) Conventional HPTO unit submodel; (C) Improved HPTO unit submodel.
Jmse 10 01160 g008
Figure 9. Illustration of simulation set-up for optimization of control strategy using genetic algorithm in MATLAB software.
Jmse 10 01160 g009
Figure 10. Procedure of parameters optimization using genetic algorithm.
Jmse 10 01160 g010
Figure 11. Chronological variation of the best value obtained in each generation for (A) objective function, (B) PID controller, and (C) P H P A 1 , m a x parameters.
Jmse 10 01160 g011
Figure 12. Comparison of P G generated from conventional and improved HPTO unit outputs in the sea state A.
Jmse 10 01160 g012
Figure 13. A comparison of O P P D for conventional and improved HPTO unit models in sea state A.
Jmse 10 01160 g013
Figure 14. A comparison of M A A P D for conventional and improved HPTO unit models in sea state A, (A) M A A P D profile for 500 s and (B) enlarged image focused on the intercept point between R 1 and R 2 .
Jmse 10 01160 g014
Figure 15. A comparison of P G , a v e for conventional and improved HPTO unit models in sea state A.
Jmse 10 01160 g015
Figure 16. The behavior profiles of selected components in the improved HPTO unit. (A) The active position of DCV1 and DCV2. (B) The oil pressure in HPA1 and HPA2. (C) The flow coefficient of FCV. (D) Hydraulic motor speed.
Jmse 10 01160 g016
Figure 17. Comparison of the P G , c o n v . and P G , i m p . profiles for the different significant wave height cases.
Jmse 10 01160 g017
Figure 18. Comparison of the P G , c o n v . and P G , i m p . profiles for the different wave peak period cases.
Jmse 10 01160 g018
Figure 19. The P D occurrences of conventional and improved HPTO units’ outputs for the significant wave height cases.
Jmse 10 01160 g019
Figure 20. The P D occurrences of conventional and improved HPTO units’ outputs for the significant wave period cases.
Jmse 10 01160 g020
Figure 21. A comparison of M A A P D for conventional and improved HPTO unit models for the different significant wave height cases.
Jmse 10 01160 g021
Figure 22. A comparison of M A A P D for conventional and improved HPTO unit models for the different wave peak period cases.
Jmse 10 01160 g022
Figure 23. The average P G , c o n v . and P G , i m p . for the different significant wave height cases.
Jmse 10 01160 g023
Figure 24. The average P G , c o n v . and P G , i m p . for the different significant wave period cases.
Jmse 10 01160 g024
Figure 25. The profiles of the generated electrical power from the improved HPTO unit for different P H P A 1 , m a x cases. (A) P H P A 1 , m a x = 47.5 bar; (B) P H P A 1 , m a x = 49.5 bar.
Jmse 10 01160 g025
Figure 26. The P D occurrences of the generated electrical power from the improved HPTO unit for different P H P A 1 , m a x cases.
Jmse 10 01160 g026
Figure 27. The average of P G , i m p . and L R α corresponds to different P H P A 1 , m a x .
Jmse 10 01160 g027
Table 1. The characteristics of five different irregular wave profiles.
Sea State H s T p Remarks
A0.84.5Nominal H s & T p
B0.64.5Lower H s
C1.0 Larger H s
D0.82.5Lower T p
E 6.5Larger T p
Table 2. HPTO models parameters.
DescriptionsValueUnit
Actuation module
Piston diameter0.035m
Rod diameter0.022m
Stroke length0.3m
Initial displacement of piston0.15m
Rectification module
Flow discharge coefficient0.75-
Maximum cross-sectional area0.003m2
Fluid energy storage module
HPA1 & HPA2 pre-charge pressure47bar
LPA pre-charge pressure3.2bar
HPA1 & HPA2 volume capacity2.8L
LPA volume capacity4L
Adiabatic index1.4-
Generation module
Rated power of generator100W
Rated speed of generator200rpm
Rated torque of generator6Nm
Damping coefficient of generator0.024Nm/rpm
Efficiency of the generator0.95-
Volumetric displacement of hydraulic motor8cc/rev
Volumetric efficiency of hydraulic motor0.95-
Mechanical efficiency of hydraulic motor0.95-
Fluid energy control module *
Flow discharge coefficient of DCV1, DCV2 & FCV0.7-
Leakage area of DCV1, DCV2 & FCV1 × 10 12 m2
Maximum opening area of DCV1 & DCV2 & FCV0.5 × 10 4 m2
* Applicable for an improved HPTO unit only.
Table 3. Parameters setting of parameters optimization using genetic algorithm.
DescriptionsValue
Genetic algorithm setting
Population size100
Reproduction ratio (%)80
Maximum number of generations20
Mutation probability (%)10
Mutation amplitude0.2
Seed1
Final accuracy0.01
Parameters constraintsMinMax
k p 0.011
k i 0.011
k d 0.011
P H P A 1 , m a x 4752
Table 4. The detailed findings of the P H P A 1 , m a x effects on the the P G , i m p .
DescriptionsUnitP HPA 1 , max
47.548.048.549.049.550.050.551.051.5
OP PD
100 W%21.9624.7525.9526.9528.1428.1429.5430.5429.94
90 W3.792.592.001.400.601.200.801.001.00
80 W2.401.000.600.400.400.401.000.600.40
70 W0.400.800.400.400.600.200.400.000.00
60 W1.600.600.400.400.400.000.200.000.40
50 W1.200.200.400.400.200.800.000.200.00
40 W0.600.000.000.200.200.200.000.200.20
30 W0.600.200.200.000.400.200.200.000.20
20 W0.600.200.000.400.400.200.400.200.20
10 W22.1618.3612.3810.387.988.186.996.397.98
0 W44.7151.3057.6859.0860.6860.4860.4860.8859.68
−10 W0.000.000.000.000.000.000.000.000.00
−20 W0.000.000.000.000.000.000.000.000.00
MAAPD
Final valueW30.998630.275130.320730.489831.123931.645232.218632.498032.7173
Slope coefficient-0.059150.056720.056010.056130.056370.057100.057510.057920.05855
y-axis intercept pointW1.740412.248362.597522.854153.291333.600714.304704.559474.80109
P G , ave
Final valueW69.035569.762869.771969.677669.028668.517967.949667.649567.4428
Publisher’s Note: MDPI stays neutral with regard to jurisdictional claims in published maps and institutional affiliations.

