Abstract
East-Asia winter cooling and the associated atmospheric and oceanic influences were investigated based on the wintertime daily temperature and circulation fields during 1950–2020. Both the case study on the 2020/2021 cold surge and the large-sample clustering in the recent 71 winters extracted similar circulation signatures for East-Asia cooling, which are featured by the blocking-related anticyclonic circulation in North Eurasia, large-scale mid-to-high-latitude wave trains, decrease in the sea surface temperature (SST) in tropical Pacific, and the sea-ice cover (SIC) reduction in the Barents and Kara Seas (BKS). From the joint clustering of Eurasian circulation and temperature, two circulation modes that have a cooling effect on East Asia account for 41% of winter days. One of the two modes is characterized by the cyclonic circulation over Northeast Asia coupled with a southward-extending negative-phase Arctic Oscillation (AO−), whose cooling effect is mainly concentrated in central Siberia. The other cooling mode, featuring an anticyclonic circulation over the Urals and AO+ in middle-to-high latitudes, has a relatively stronger cooling effect on lower latitudes, including Mongolia and North China. In general, the occurrences of the mode with warming/cooling effect on East Asia show an overall downward/upward trend. The two cooling modes are significantly influenced by the La Niña-type SST anomaly and reduced SIC in BKS through large-scale wave trains, of which the tropical oceanic forcing mainly acts as a climatic background. Furthermore, the polar forcing is more tightly bound to internal atmospheric variability. Therefore, the tropical SST tends to exert impact over a seasonal scale, but the SIC influence is more significant below the intraseasonal scale; moreover, the synergy between the tropical and polar oceanic forcing can increase the East-Asia cooling days by 3–4% and cold extremes by 5%, mainly through enhancing the AO-related circulation mode.
1. Introduction
Cold extremes have been attracting increasing attention under global warming [1]. In the 2020/2021 winter, exceptionally cold weather swept through North China and caused record low temperatures over the past half-century in several northern cities in China [2]; this cold event is directly dominated by internal atmospheric variability with possible connections with oceanic forcing from the tropics and Arctic, implicating the complexity of the mechanisms contributing to East-Asia cold extremes [3]. Oceanic forcing, such as sea surface temperature (SST) and sea–ice cover (SIC), is one of the primary sources of the seasonal and sub-seasonal predictability of climate [4,5]. Due to the high uncertainties in internal atmospheric variability, understanding how oceanic forcing could influence East-Asia winter temperatures is of great significance.
The El Niño and Southern Oscillation (ENSO) is the most important large-scale air-sea coupled mode in the climate system [6,7]. The SST anomalies of the tropical Pacific can influence global climate by inducing poleward propagating large-scale Rossby waves [8,9]. For East Asia, the temperature variation is strongly modulated by ENSO through the tropical, mid-latitude, and polar pathways. ENSO can induce winter monsoon anomalies through the tropical pathway by coupling with the tropical intraseasonal oscillation [10]. The linkage between the tropics and polar areas is also highly relevant to East-Asia winter cooling. In particular, the eastern-type La Niña event can induce anomalous warming and sea-ice reduction in the Barents–Kara Seas [11], which strongly impacts East-Asia cold extremes; this is the well-known surface temperature pattern of the warm Arctic and cold Eurasia (WACE) [12]. Through the midlatitude pathway, extreme ENSO events can also influence the phase transition of the North Atlantic Oscillation (NAO)/Arctic Oscillation (AO) and further induce cold extremes in the downstream area in middle-to-high latitudes [13]; however, the linkage between regional climate variation and ENSO has become increasingly unstable because of the change in ENSO diversity due to global warming [14].
As mentioned above, the accelerated Arctic warming could also influence the temperature variability in East Asia via large-scale wave trains [15]. In fact, the middle-to-high latitudes of Eurasia have experienced increasing cold extremes in winter, coinciding with the amplified warming in the Arctic since the 1990s [16,17]. The weather extremes superimpose on the long-term surface temperature trend characterized by the divergent WACE pattern [18,19]. Multiple factors contribute to the WACE, including greenhouse-gas-forced warming, sea-ice loss, and atmospheric and oceanic internal variability; however, the model results show dramatic disparities for the WACE. Compared to observations, multi-model ensemble projects find weaker linkages between the Arctic Amplification (AA) and Eurasian winter extremes [20], suggesting that Eurasian cold extremes may not be a forced response to AA. The internal atmospheric variability (e.g., the jet stream and blocking anticyclone) and SST variability, with interannual to interdecadal time scales, can obfuscate the Arctic-midlatitude connections. The complexity of the physical mechanisms leads to uncertainty and intermittency in the connection between the Arctic and mid-latitude extreme weather [21].
Because of the complexity of the causal relationship between the cold extremes in East Asia and oceanic forcing, it is hard to quantitatively isolate the independent impact of any single factor. Therefore, rather than clarifying how different modes cooperatively influence East-Asia cooling, this study attempts to explain the probability of cold extremes impacted by the polar and tropical oceanic forcing via extracting the dominant modes of surface cooling in East Asia in recent decades. To do this, a brief introduction to the data and methods used are presented in Section 2. In Section 3, the joint clustering analyses are performed based on the daily temperature and circulation fields to extract the circulation modes causing East-Asia temperature variation during 1950–2020. With the clustering result, polar and tropical oceanic forcing probabilities are further estimated independently and jointly. Finally, we conclude this work in the last section with a discussion on other possible issues.
2. Data and Methods
This work applies atmospheric and oceanic data from ERA5 reanalysis in 1° × 1° horizontal resolution. ERA5 is the fifth generation of the ECMWF atmospheric reanalysis of the global climate covering the period from 1950 to present. In this study, the daily 2 m temperature (T2m), geopotential height at 500 hPa (Z500), SST, and SIC from 1 December 1950 to 28 February 2021 are created based on the hourly surface and pressure-level variables. The 1950–2020 daily calendar mean is removed from each daily field to remove the seasonal cycle. Because most annual variability has been removed, the resultant daily anomalies have intraseasonal, interannual, and longer time-scale variability. Atmospheric circulation variations mainly concentrate on the intraseasonal scale [22], but oceanic forcing is generally on much longer time scales and can be approximately represented by the seasonal mean. Therefore, the wintertime (through December, next January to next February, DJF) daily and DJF-mean anomalies are used to analyze the atmospheric and oceanic variability. In addition, two indices are constructed to respectively represent the state of ENSO and SIC in BKS (SICBKS), i.e., the Oceanic Niño Index (ONI) defined by the mean SST (5° N–5° S, 170° W–1205° W) and SICBKS defined by the mean SIC in the Barents–Kara Seas.
Cluster analysis was employed to extract the main circulation and temperature modes leading to East-Asia cold extremes in winter. The self-organizing map (SOM) is an effective clustering method to extract and classify the information from input data based on an unsupervised neural network [23,24]. Compared to the traditional linear reduction method, the advantage of SOM is that it can map the nonlinear high-dimensional structure in data onto a two-dimensional linear space without losing the topological relationships between the input data [25,26]. In this study, the SOM software package (http://www.cis.hut.fi/projects/somtoolbox/download/, accessed on 29 October 2020) was applied to the daily anomalous fields of T2m and Z500 in winter in East Asia defined by (25° N–90° S, 40° E–20° W) during 1950–2020; this two-variable joint clustering is designed to extract the main temperature and circulation modes, such as in the previous application of SOM to meteorological and climatological variables [27,28].
In total, there were 6408 (days) × 2 (variables) daily fields imported into the SOM toolbox for the 71 winters (1950–2020) studied in this work. The daily temperature and circulation fields were projected onto the 2 × 2, 3 × 2, 3 × 3, and 4 × 3 maps in the SOM training procedure, respectively. The different map sizes (groups) capture the highly similar modes during the East-Asia cold extremes in 2020/2021 winter. For simplicity, this study used a 2 × 2 map, i.e., 4-group clustering, to extract East Asia’s primary temperature and circulation patterns in winter. Based on the SOM groups (hereafter referred to as SOM1-4), the event frequency of each group and the associated probability of temperature variability were analyzed by combining the oceanic indices. In this study, we mainly focus on the SOM clusters (SOMs) with a cooling effect over East Asia on a daily time scale. Therefore, the temperature patterns of the days classified into different SOMs are used to fit the population probability density functions with respect to the East-Asia temperature anomaly. In order to extract the relationships between oceanic forcing and East-Asia cooling, we also examine the time series of ONI and SICBKS in terms of each cooling SOM group on a daily time scale. Through extracting the days with a negative phase of ONI and negative SICBKS, we can obtain the daily patterns of East-Asia temperature anomalies for each SOM group under the background of the La Niña event and SIC reduction in BKS. With these subsets of daily temperature anomalies, the conditional probability distributions are constructed with respect to negative ONI and SICBKS for different SOMs. By comparing the above conditional distributions with the population distribution based on the all-day patterns for each SOM, the cooling probability due to La Niña and reduced SICBKS can be estimated solely and jointly, which could reflect the independent and synergic impacts of SST and SIC on East-Asia cooling in winter, respectively.
3. Results
3.1. Cold Surge in 2020/2021 Winter in China
From mid-December 2020 to mid-January 2021, there were three cold spells in China (Figure 1a), in which the lowest mean temperature in East Asia reached about −6 °C. Concerning the mean climate state, the anomalous surface temperature reached −20 °C in Northwest and North China on 7 January 2021 (Figure 1g). From the atmospheric circulation during the cold spells (Figure 1b–d), the strong temperature drop could be attributable to a persistent blocking high dominating most mid-to-high-latitude areas of Eurasia. The cumulative cooling caused by blocking associated with the stratospheric process was regarded as one of the leading causes of this cold surge [29]. The slowly eastward-moving blocking high over North Europe and the Ural Mountains extends its ridge far into the Arctic, which induces strong meridional flow and intensified cold advection from the Arctic into East Asia; moreover, the blocking-related anticyclonic anomaly is embedded in the Eurasian wave train (Figure 1e–g), suggesting that East-Asia cooling is also relevant to upstream atmospheric and oceanic forcing [30].
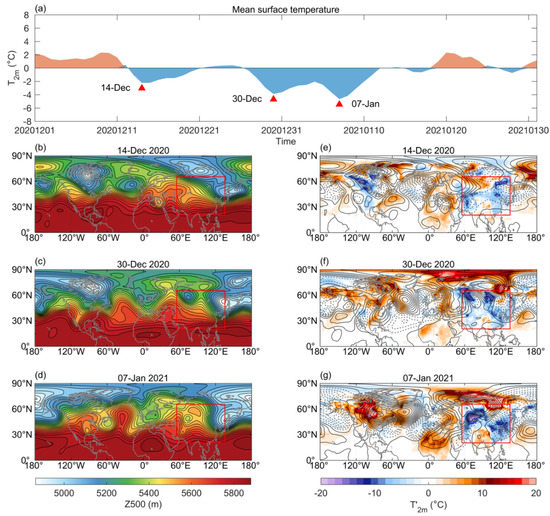
Figure 1.
Cold surge in 2020/2021 winter: (a) time series of spatial-mean T2m of East Asia from 1 December 2020 to 31 January 2021. (b–d) Z500 fields on the three days marked in (a); (e–g) Z500 (contours) and T2m (shaded) anomalies on the three days marked in (a). The contour interval for (b–g) is 40 m. The area of East Asia is defined by a red rectangle in (b–g).
The cold surge in Figure 1a also shows possible linkages with polar and tropical oceanic forcing. During the last two cold spells (Figure 1f,g), the strong cooling in East Asia was accompanied by significant warming over the BKS, forming the WACE pattern [12]. On 30 December 2020 (Figure 1f), the anticyclonic circulation over North Eurasia coupled with the anomalously low wintertime SIC in the Bering Sea, Baffin Bay, BKS. In addition, anomalous SSTs showed a typical central La Niña pattern in the tropical Pacific Ocean (Figure 2a), which is also reported to contribute to this cold surge [3].
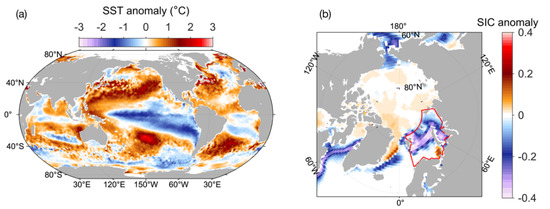
Figure 2.
The seasonal means of the anomalous SST and SIC in 2020/2021 winter: (a) SST; (b) SIC. The irregular red-line box in (b) marks the BKS.
3.2. Circulation Modes of the East-Asia Temperature in Winter
Figure 3 presents the results of SOM clustering for the daily anomalous T2m and Z500 in DJF from 1950 to 2020. From the time series of the best-match units (BMUS) of SOM (Figure 3a), the cold surge from late December 2020 to early January 2021 was mainly caused by SOM3 and SOM4. Both of these two SOMs show strong warming over BKS except that SOM3 (Figure 3d) has more widespread in the Arctic than SOM4 (Figure 3e); this is consistent with the SIC reduction during the 2020/2021 winter, as shown in Figure 2b. Figure 3a also shows that the cold days in early January of 2021 are classified into the SOM4 group. In addition to the warming BKS shown in SOM4 (Figure 3e), a band of anticyclonic Z500 anomalies is also found over the tropical Pacific (Figure 3e). Recalling the background SST pattern in the 2020/2021 winter (Figure 2a), the La Niña-type SST anomalies are tightly related to the downdraft anomalies in the tropical Pacific, just corresponding to the band of positive circulation anomalies shown in SOM4 (Figure 3e). The consistent features shown in a typical case study and clustering results strongly suggest the importance of the tropical and polar oceanic forcing for the formations of the cold extremes in East Asia.
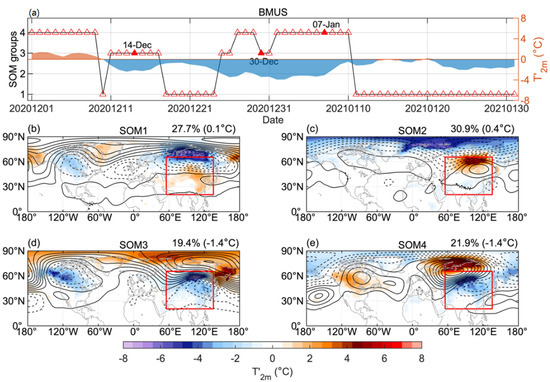
Figure 3.
The 2 × 2 SOM groups exacted by the joint clustering analysis on the daily Z500 and T2m anomalous fields in East Asia (25° N–90° S, 40° E–20° W) in boreal winter (DJF) from 1950/1951 to 2020/2021. (a) The transition between different groups was revealed by the best-match units (BMUS) series of SOM clustering and the anomalous East-Asia temperature during the time period of the cold surge in the 2020/2021 winter. (b–e) Composites of the anomalous daily Z500 (contours) and T2m (shaded), where the contour interval of Z500 is 15 m with the shaded for the T2m anomaly passing 95% two-tail t-test. At the top-right corner of each plot, the percentage and temperature value in the bracket are, respectively, the ratio and East-Asia temperature change of each SOM group.
From Figure 3b–e, the two East-Asia cooling modes (SOM3 and SOM4) accounted for 41.3% of winter days. The circulation pattern of SOM3 (Figure 3d) corresponded to a negative-phase AO pattern with a strong anticyclonic anomaly dominating north Eurasia; this circulation pattern tends to form widespread warming in the Arctic, particularly over BKS, west of the anticyclonic anomaly (Figure 3d). The SOM3 pattern can transform into SOM4 in relation to the AO negative to positive phase transition (Figure 3d,e). The AO+ leads to southward displacement of the north-Eurasia anticyclonic anomaly southward, leading to cold air flow along the east edge of the anticyclonic circulation and arriving at the midlatitudes of East Asia (Figure 3e). Compared with SOM3 (Figure 3d), SOM4 could form more intensified cooling in North China. As shown in Figure 4e, the SOM4 circulation pattern is characterized by positive-phase NAO over the North Atlantic coupled with an anticyclonic anomaly over downstream Eurasia; this is an optimal weather pattern for sea-ice melt in the BKS via enhanced poleward moisture transport to the Arctic [31].
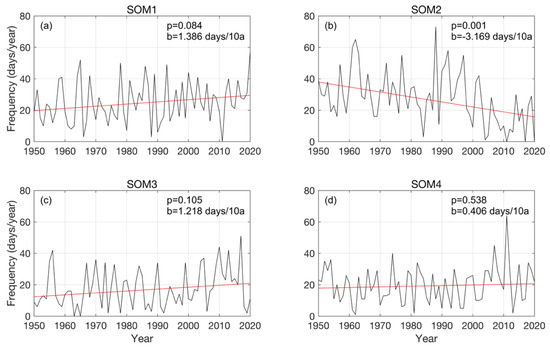
Figure 4.
The occurrences of the four SOM groups in winters from 1950/1951 to 2020/2021. The frequency (in days/year) is counted yearly for SOM1 (a), SOM2 (b), SOM3 (c) and SOM4 (d). In each plot, the black line is the days classified to the corresponding SOM group. The red straight line is the linear trend of occurrence frequency with the p-value of the significance test b-value of the linear trend shown in the top-right corner of each panel.
The occurrence of each SOM mode is shown in Figure 4, in which the two warming modes (SOM1 and SOM2; Figure 4a,b) show divergent long-term trends. The SOM1 upward trend has a speed of 1.4 days/10a, and a downward trend of −3.2 days/10a, as shown in Figure 4a,b. In total, the winter warming days in East Asia decrease at a speed of 1.8 days every decade during 1950–2020. In contrast, both cooling modes (SOM3 and SOM4, Figure 4c,d) show slight upward trends, increasing about 1.6 days/10a. From Figure 3 and Figure 4, we find two negative-phase AO-related modes (SOM1 and SOM3) showing upward trends, but the positive-phase AO-related ones (SOM2 and SOM4) show a significant downward trend (SOM2, Figure 4b) or a slight upward trend (SOM4, Figure 4d).
We also implemented clustering analysis based on the intraseasonal-scale temperature and circulation data (not shown). The resultant intraseasonal circulation patterns of SOM groups were highly similar to the anomalous circulation patterns shown in Figure 3b–d, suggesting the leading role of internal atmospheric variability in temperature variation [22]. Considering the impact of oceanic forcing, the background circulation with a characteristic scale longer than intraseasonal variability was further extracted. Figure 5 shows the composites of the winter-mean circulation and temperature patterns concerning the four SOMs in Figure 3. Prominent zonal wave trains can be found in mid-to-high latitudes in all four SOM modes (Figure 5a–c). The two warming modes for East Asia (SOM1 and SOM2) have similar background circulation patterns (Figure 5a,b) upstream of Eurasia, with a negative-phase Pacific/North American (PNA)-like pattern and a tilted negative-phase NAO-like pattern. For the background circulation of SOM1 and SOM2, the difference between SOM1 and SOM2 mainly exists in Eurasia and the polar area (Figure 5a,b). SOM1 shows alternating positive and negative circulation anomalies in midlatitudes coupled with a negative-phase AO pattern over the Arctic; however, there is no significant wave-train structure over midlatitude Eurasia accompanied by a positive-phase AO in the polar area for SOM2 (Figure 5b). Similarly, the two cooling modes (SOM3 and SOM4) have similar background circulation patterns consisting of a PNA-like structure, negative-phase NAO, and Eurasian wave trains (Figure 5c,d). Compared with SOM 4 (Figure 5c,d), the background circulation of SOM3 has relatively stronger upstream wave-train components linking East Pacific and North Atlantic, but a weaker anticyclonic anomaly over North Eurasia and BKS; it is thus a reasonable inference that SOM3 is more relevant to SST variability in tropical Pacific and SOM4 is more closely tied to sea-ice variation in BKS.
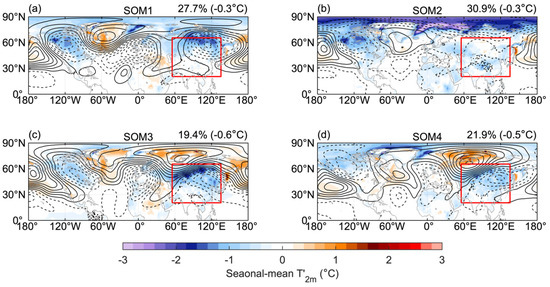
Figure 5.
Composites of the background circulation and temperature anomalies for the four SOM groups: (a) SOM1, (b) SOM2, (c) SOM3, (d) SOM4. The contour in each plot is winter-mean anomalous Z500 with a contour interval of 4 m. The shaded area is the winter-mean anomalous T2m over 95% confidence level.
3.3. Impact of Oceanic Forcing on East-Asia Cold Extremes
Given the SOM, Figure 3a, Figure 6 and Figure 7 present winter-mean SST and SIC composites. The winter-mean fields generally represent the background condition for the intraseasonal variations in Figure 3b–e. In Figure 6, the winter-mean SST of the four SOMs shows significant signals in the main ocean basins. For the two warming modes (SOM1 and SOM2; Figure 6a,b), significant signals were mainly distributed in mid-latitude oceans, such as the mid-latitude North Pacific and North Atlantic. In comparison, the two cooling modes (SOM3 and SOM4, Figure 6c,d) had relatively more signatures of the La Niña-type SST pattern, i.e., a widespread cooling in the tropical Pacific; this feature is particularly striking in the SST pattern related to SOM3 (Figure 6c), which is mainly characterized by the strong cooling in the eastern tropical Pacific. In addition to the negative SST anomaly in the tropical Pacific, a strong positive SST anomaly was also found in the northwest Pacific for SOM3 and SOM4, which forms the Pacific Decadal Oscillation (PDO)-like SST pattern, suggesting a possible decadal modulation from PDO. The SST composites on an intraseasonal time scale were also analyzed for the four SOMs (Figure 8). Comparing Figure 6 and Figure 8, the intraseasonal SST variability shows much weaker signals in both mid-latitudes and tropics. Thus, the PNA-like wave train (Figure 5) seems a possible pathway linking the La Niña-type SST anomaly over an interannual time scale (Figure 6) and East Asia intraseasonal cooling (Figure 3).
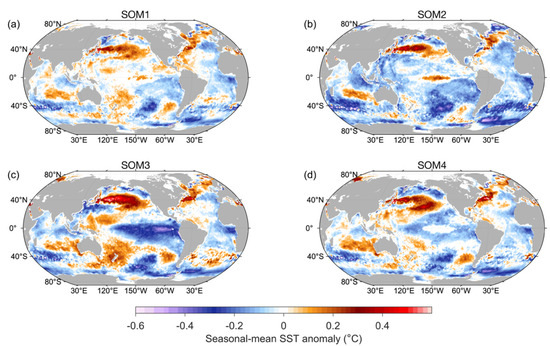
Figure 6.
The same as Figure 5 except for the composites of the winter-mean SST anomalies. The shaded area passes the p = 0.05 significance test. The four plots are SST anomalies related to SOM1 (a), SOM2 (b), SOM3 (c), and SOM4 (d).
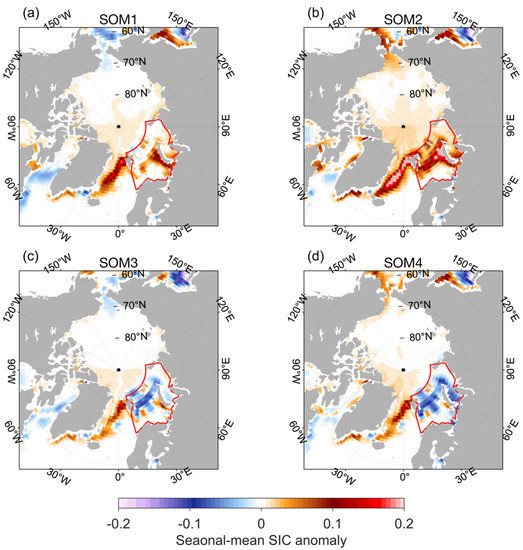
Figure 7.
The same as Figure 5 except for the composites of the winter-mean SIC anomalies. The shaded area passes the p = 0.05 significance test. The four plots are SIC anomalies related to SOM1 (a), SOM2 (b), SOM3 (c), and SOM4 (d).
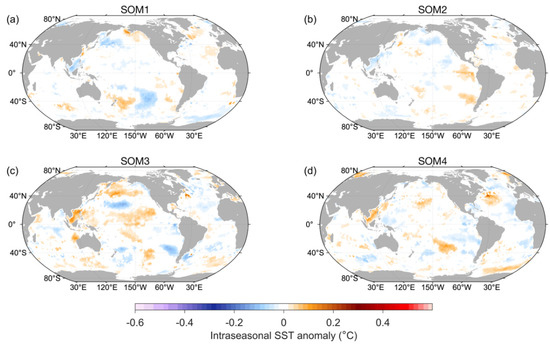
Figure 8.
The same as Figure 6 except for the composites of the intraseasonal SST anomalies. The four plots are intraseasonal SST anomalies related to SOM1 (a), SOM2 (b), SOM3 (c), and SOM4 (d).
For the Arctic SIC, it is a different case. Figure 7 and Figure 9 show that the seasonal mean (Figure 7) and intraseasonal SIC (Figure 9) have significant signals in the Bering Sea, Baffin Bay, Greenland Sea, and BKS; however, the seasonal-mean signal is relatively stronger. To a considerable extent, the intraseasonal SIC variation can be attributed to the persistent atmospheric circulation variability, such as the blocking high [32,33]. Therefore, the SIC variation is mainly a result of circulation rather than a cause at the intraseasonal time scale [30]; however, on longer time scales, the background SIC can influence the dynamical environment [34] and further modulate the circulation variation at an intraseasonal scale. Combining the corresponding background circulations shown in (Figure 5c,d), the seasonal-mean warming over BKS is conducive to forming an anticyclonic circulation over mid-to-high-latitude Eurasia, favouring the development of blocking and cold outbreaks at shorter time scales.
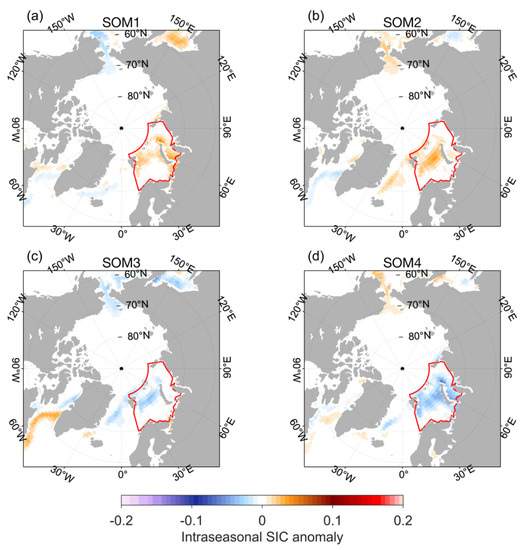
Figure 9.
The same as Figure 7 except for the composites of the intraseasonal SIC anomalies. The four plots are intraseasonal SIC anomalies related to SOM1 (a), SOM2 (b), SOM3 (c), and SOM4 (d).
To further explore the independent and synergic impact of the tropical and Arctic oceans, the distributions of the probability density of the East-Asia daily temperature anomalies in the 1950–2020 winters are fitted in Figure 10. In this study, the cold and warm extremes are defined by 10% and 90% quantiles of daily temperature anomalies, respectively. The SOM1 and SOM2 modes generally have a higher cumulative probability on the warming side than the cooling side. From Figure 10a,b, the warming probability is 53% and 61% for SOM1 and SOM2, respectively. Accordingly, the probability of cold/warm extremes is 5/13% for SOM1 and 3/17% for SOM2. Thus, warm extremes have about doubled (SOM1) or even quintupled (SOM2) probabilities than cold extremes.
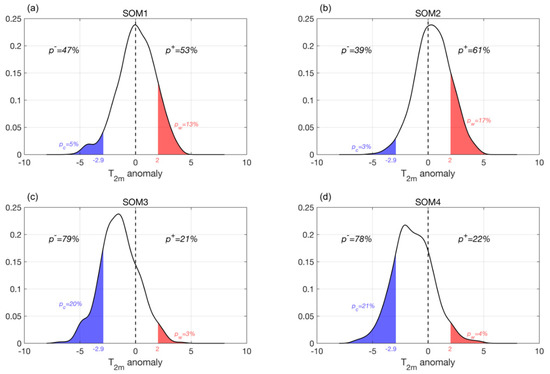
Figure 10.
The probability density distribution is fitted by the daily T2m anomalies of SOM1 (a), SOM2 (b), SOM3 (c), SOM4 (d). In each plot, the percentages p− and p+ are the occurrence probabilities of cooling and warming days for each SOM group, respectively. The shaded areas are the probabilities of cold (blue) and warm (red) extremes, defined by 10% and 90% quantiles of the daily T2m anomalies, respectively.
Nearly opposite distributions can be found in the probability density of the two cooling modes (SOM3 and SOM4). From Figure 10c,d, approximately 80% of days of SOM3 and SOM4 have cooling effects in East Asia. The distributions of SOM3 and SOM4 are characterized by the left-skewed peaks (cooling), which leads to about one-in-five days of SOM3 and SOM4 reaching extreme coldness; this probability of cold extreme is about quintuple of the probability (3–4%) of extreme warming. Regarding the cold surge in the 2020/2021 winter, the mean temperature anomaly of East Asia reached −3.94 °C, with a probability of about 4% according to Figure 3, i.e., a once-in-twenty-five-year cold event.
In order to investigate the influence of oceanic forcing on cold extremes, the independent and joint probability of the East-Asia temperature were analyzed for ONI and SICBKS. From Figure 11a,b, the negative wintertime-mean ONI, i.e., cold tropical Pacific, only slightly influences East-Asia cooling with a 1% probability increase of cold extremes for SOM3 and almost no significant impact on cold extremes for SOM4. The influence of SIC varies on different time scales. The low intraseasonal SICBKS tends to slightly increase cold extremes by 1% for SOM3 (Figure 11c) but reduce cold extremes by 2% (Figure 2) for SOM4 (Figure 11d). Considering SOM3 is highly relevant to AO− (Figure 3d), the sea-ice reduction in BKS seems to increase East-Asia cold extremes on an intraseasonal time scale via coupling sea–ice melting and atmospheric intraseasonal variability [30].
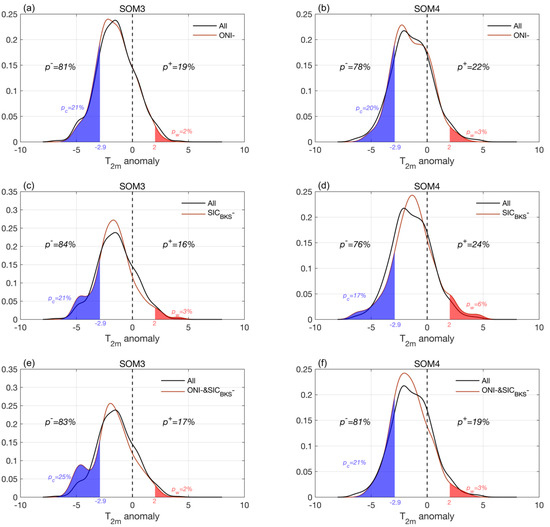
Figure 11.
The probability density distributions of the two cooling SOM modes for negative ONI and SICBKS: (a,c,e) SOM3; (b,d,f) SOM4. Black line is the probability density distribution based on all days of the corresponding SOM group, as in the distribution in Figure 10. The red line is the distribution for negative ONI (a,b), negative SICBKS (c,d), and co-occurrences of negative ONI and negative SICBKS (e,f). The percentages and shaded areas have the same meanings as in Figure 10.
Although the probability distribution of the East-Asia temperature seems not to change much when solely considering the tropical-Pacific SST variation or sea-ice variation in the Arctic, the synergistic effect of the two oceanic forcings deserves further investigating. Simultaneously with the La Niña-type SST anomalies and reduced SICBKS, the joint probability distributions of SOM3 and SOM4 (Figure 11e,f) show 83% and 81% of wintertime days having cooling in East Asia, which is a 4% and 3% greater probability than the overall probability in Figure 10c,d. Figure 3 and Figure 11e show that the probability of cold extremes increases by 5% in the presence of La Niña and low-SICBKS events. Combining Figure 3d and Figure 5c, we can infer that the tropical SST-related wave train could simultaneously enhance the downstream anticyclonic circulation over North Eurasia coupled with a sea-ice reduction in BKS on an intraseasonal time scale [19,35,36,37,38,39].
4. Conclusions and Discussion
With the accelerating warming, cold extremes have become more frequent in East Asia [40]. A record cold surge with a probability no higher than 4% occurred in East Asia in the 2020/2021 winter. Focusing on this cold event, we explored the characteristics of the relevant atmospheric circulation and oceanic forcing at different time scales. We found that this cold extreme is directly caused by a persistent blocking over North Eurasia with possible connections to the warming and sea-ice cover (SIC) reduction in the Barents-Kara Seas (BKS) in the Arctic and cooling in the sea surface temperature (SST) in tropical Pacific (i.e., La Niña event); it thus seems to be a compound event jointly impacted by internal atmospheric variability and tropical and polar oceanic forcing.
The main characteristics of the 2020/2021 cold surge were also investigated by extending the analysis to the boreal wintertime days during 1950–2020. The weather patterns responsible for the East-Asia warming and cooling were extracted by self-organizing map (SOM) clustering. In general, an anticyclonic circulation anomaly located in mid-to-high latitudes north or northeast of East Asia is essential for the East-Asia cooling in winter no matter whether the Arctic Oscillation (AO) is a positive or negative phase. Two types of circulation modes mainly lead to the East-Asia cooling, including one featured by an AO− with the southward-extending anticyclonic circulation over the polar area, and the other composed of an AO+ and a strong anticyclonic circulation over the Urals. The former circulation mode explains 19% of cooling days, and the latter, 22%, in which the latter has a stronger cooling effect on the midlatitude area of East Asia, including North China. In addition, the SOM clustering also shows that the frequencies of the circulation modes that have a warming effect on East Asia have an overall downward trend of occurrence during 1950–2020. In contrast, the opposite trends were found in the circulation modes with a cooling effect. The above long-term variations of East-Asia circulation and temperature could partly shed light on the increasing cold extremes in recent decades.
Similar to the 2020/2021 cold surge, East-Asia cooling in the winter had connections with the La Niña SST pattern in the tropical Pacific and SIC melting in the BKS. East-Asia cooling seems to be a combination of influences from tropical and polar oceanic forcing, i.e., La Niña and SIC decrease in BKS, which is a part of the pattern named the warm Arctic cold Eurasia (WACE); this is further verified by the probability analysis with respect to the SOM groups. Although a slightly increased probability of cooling days was found with respect to La Niña or SICBKS reduction, an enhanced probability of 3–4% was found to be relevant to the synergy between the SST decrease in the tropical Pacific and SIC decrease in the BKS; this synergic effect can also increase the probability of cold extremes by 5% in AO−; it should also be noted that the tropical oceanic forcing mainly exerts its impact on the time scales longer than the seasonal scale, but SICBKS takes effect on an intraseasonal time scale. We also examined the influence of the winter-mean SICBKS on East-Asia cooling. The negative effect on cold extremes was found for the two East Asia cooling modes (not shown). Evidently, SIC forcing is more tightly coupled to internal atmospheric variability, which leads to the unstable linkage of temperature change between the Arctic and mid-latitude continent.
As mentioned above, the results show substantial uncertainties in the linkages between SST/SIC and East-Asia cooling; this study estimates the probability of tropical and polar oceanic forcing together or solely. As mentioned in Figure 6 and Figure 7, the Indian and mid-latitude oceans and the SIC in the Arctic marginal seas, except for BKS, have significant signals in SST or SIC. The forcing from these regions is inextricably interwoven and increases the uncertainties of East-Asia cooling. In particular, the inter-basin SST-SST and SST-SIC have been explored deeply by many studies [41,42]; this work inspires more in-depth research issues, such as: how does the oceanic forcing in different areas cooperatively influence regional climate variability via modulating atmospheric large-scale circulation anomalies? For East Asia, it is essential to clarify the oceanic processes that strongly affect the NAO and Eurasian wave trains.
Author Contributions
Conceptualization, L.Z. and L.M.; data curation, X.T. and Z.G.; formal analysis, L.Z.; funding acquisition, X.T., L.Z., and L.M.; investigation, X.T. and L.Z.; methodology, X.T. and L.Z.; project administration, L.Z. and L.M.; resources, L.M. and Z.G.; software, L.Z. and Z.G.; supervision, L.Z.; validation, X.T. and Z.G.; visualization, X.T. and Z.G.; writing—original draft, X.T. and L.Z.; writing—review and editing, L.Z. and L.M. All authors have read and agreed to the published version of the manuscript.
Funding
The Shenzhen Fundamental Research Program (Grant No. JCYJ20200109110220482) and the National Natural Science Foundation of China (NSFC) under grant 41975099.
Institutional Review Board Statement
Not applicable.
Informed Consent Statement
Not applicable.
Data Availability Statement
Publicly available datasets were analyzed in this study. The ERA5 global reanalysis data can be found here: https://cds.climate.copernicus.eu/#!/home.
Acknowledgments
This work was jointly supported by Ministry of Natural Resources, Ministry of Emergency Management, Shenzhen University and Chinese Academy of Sciences. With many thanks to the two anonymous reviewers, for their valuable comments and suggestions.
Conflicts of Interest
The authors declare no conflict of interest.
References
- Johnson, N.C.; Xie, S.-P.; Kosaka, Y.; Li, X. Increasing Occurrence of Cold and Warm Extremes during the Recent Global Warming Slowdown. Nat. Commun. 2018, 9, 1724. [Google Scholar] [CrossRef] [PubMed]
- Wang, C.; Yao, Y.; Wang, H.; Sun, X.; Zheng, J. The 2020 Summer Floods and 2020/21 Winter Extreme Cold Surges in China and the 2020 Typhoon Season in the Western North Pacific; Springer: Berlin/Heidelberg, Germany, 2021; ISBN 1861-9533. [Google Scholar]
- Zheng, F.; Yuan, Y.; Ding, Y.; Li, K.; Fang, X.; Zhao, Y.; Sun, Y.; Zhu, J.; Ke, Z.; Wang, J.; et al. The 2020/21 Extremely Cold Winter in China Influenced by the Synergistic Effect of La Niña and Warm Arctic. Adv. Atmos. Sci. 2021, 39, 546–552. [Google Scholar] [CrossRef]
- Quan, X.W.; Webster, P.J.; Moore, A.M.; Chang, H.R. Seasonality in SST-Forced Atmospheric Short-Term Climate Predictability. J. Clim. 2004, 17, 3090–3108. [Google Scholar] [CrossRef]
- Kug, J.-S.; Jeong, J.-H.; Jang, Y.-S.; Kim, B.-M.; Folland, C.K.; Min, S.-K.; Son, S.-W. Two Distinct Influences of Arctic Warming on Cold Winters over North America and East Asia. Nat. Geosci. 2015, 8, 759–762. [Google Scholar] [CrossRef]
- Wallace, J.M.; Gutzler, D.S. Teleconnections in the Geopotential Height Field during the Northern Hemisphere Winter. Mon. Weather Rev. 1981, 109, 784–812. [Google Scholar] [CrossRef]
- Ashok, K.; Behera, S.K.; Rao, S.A.; Weng, H.; Yamagata, T. El Niño Modoki and Its Possible Teleconnection. J. Geophys. Res. Ocean. 2007, 112, C11007. [Google Scholar] [CrossRef]
- Chiang, J.C.; Kushnir, Y.; Giannini, A. Deconstructing Atlantic Intertropical Convergence Zone Variability: Influence of the Local Cross-equatorial Sea Surface Temperature Gradient and Remote Forcing from the Eastern Equatorial Pacific. J. Geophys. Res. Atmos. 2002, 107, ACL3-1–ACL3-19. [Google Scholar] [CrossRef]
- Straus, D.M.; Shukla, J. Does ENSO Force the PNA? J. Clim. 2002, 15, 2340–2358. [Google Scholar] [CrossRef]
- Hong, C.-C.; Li, T. The Extreme Cold Anomaly over Southeast Asia in February 2008: Roles of ISO and ENSO. J. Clim. 2009, 22, 3786–3801. [Google Scholar] [CrossRef]
- Li, Z.; Zhang, W.; Stuecker, M.F.; Xu, H.; Jin, F.-F.; Liu, C. Different Effects of Two ENSO Types on Arctic Surface Temperature in Boreal Winter. J. Clim. 2019, 32, 4943–4961. [Google Scholar] [CrossRef]
- Francis, J.A.; Vavrus, S.J. Evidence Linking Arctic Amplification to Extreme Weather in Mid-latitudes. Geophys. Res. Lett. 2012, 39, L06801. [Google Scholar] [CrossRef]
- Geng, X.; Zhang, W.; Stuecker, M.F.; Jin, F.-F. Strong Sub-Seasonal Wintertime Cooling over East Asia and Northern Europe Associated with Super El Niño Events. Sci. Rep. 2017, 7, 3770. [Google Scholar] [CrossRef] [PubMed]
- Hu, C.; Yang, S.; Wu, Q.; Li, Z.; Chen, J.; Deng, K.; Zhang, T.; Zhang, C. Shifting El Niño Inhibits Summer Arctic Warming and Arctic Sea-Ice Melting over the Canada Basin. Nat. Commun. 2016, 7, 11721. [Google Scholar] [CrossRef] [PubMed]
- Screen, J.A.; Simmonds, I. Exploring Links between Arctic Amplification and Mid-Latitude Weather. Geophys. Res. Lett. 2013, 40, 959–964. [Google Scholar] [CrossRef]
- Vihma, T. Effects of Arctic Sea Ice Decline on Weather and Climate: A Review. Surv. Geophys. 2014, 35, 1175–1214. [Google Scholar] [CrossRef]
- Overland, J.; Francis, J.A.; Hall, R.; Hanna, E.; Kim, S.-J.; Vihma, T. The Melting Arctic and Midlatitude Weather Patterns: Are They Connected? J. Clim. 2015, 28, 7917–7932. [Google Scholar] [CrossRef]
- Cohen, J.; Screen, J.A.; Furtado, J.C.; Barlow, M.; Whittleston, D.; Coumou, D.; Francis, J.; Dethloff, K.; Entekhabi, D.; Overland, J.; et al. Recent Arctic Amplification and Extreme Mid-Latitude Weather. Nat. Geosci. 2014, 7, 627–637. [Google Scholar] [CrossRef]
- Cohen, J.; Zhang, X.; Francis, J.; Jung, T.; Kwok, R.; Overland, J.; Ballinger, T.J.; Bhatt, U.S.; Chen, H.W.; Coumou, D.; et al. Divergent Consensuses on Arctic Amplification Influence on Midlatitude Severe Winter Weather. Nat. Clim. Chang. 2020, 10, 20–29. [Google Scholar] [CrossRef]
- McCusker, K.E.; Fyfe, J.C.; Sigmond, M. Twenty-Five Winters of Unexpected Eurasian Cooling Unlikely Due to Arctic Sea-Ice Loss. Nat. Geosci. 2016, 9, 838–842. [Google Scholar] [CrossRef]
- Overland, J.E. A Difficult Arctic Science Issue: Midlatitude Weather Linkages. Polar Sci. 2016, 10, 210–216. [Google Scholar] [CrossRef]
- Hoskins, B.J.; James, I.N.; White, G.H. The Shape, Propagation and Mean-Flow Interaction of Large-Scale Weather Systems. J. Atmos. Sci. 1983, 40, 1595–1612. [Google Scholar] [CrossRef]
- Kohonen, T. Self-Organized Formation of Topologically Correct Feature Maps. Biol. Cybern. 1982, 43, 59–69. [Google Scholar] [CrossRef]
- Kohonen, T.; Somervuo, P. Self-Organizing Maps of Symbol Strings. Neurocomputing 1998, 21, 19–30. [Google Scholar] [CrossRef]
- Cavazos, T.; Comrie, A.C.; Liverman, D.M. Intraseasonal Variability Associated with Wet Monsoons in Southeast Arizona. J. Clim. 2002, 15, 2477–2490. [Google Scholar] [CrossRef]
- Liu, Y.; Weisberg, R.H.; Mooers, C.N.K. Performance Evaluation of the Self-Organizing Map for Feature Extraction. J. Geophys. Res. Ocean. 2006, 111, C05018. [Google Scholar] [CrossRef]
- Risien, C.M.; Reason, C.J.C.; Shillington, F.A.; Chelton, D.B. Variability in Satellite Winds over the Benguela Upwelling System during 1999–2000. J. Geophys. Res. Ocean. 2004, 109, 43985301. [Google Scholar] [CrossRef]
- Zhong, L.; Hua, L.; Ma, Z.; Yao, Y. A Quantitative Study of Moisture Transport Variation on the Interdecadal Variation of the Summer Precipitation in South China from 1979 to 2015. Clim. Dyn. 2019, 53, 4743–4761. [Google Scholar] [CrossRef]
- Yao, Y.; Zhang, W.; Luo, D.; Zhong, L.; Pei, L. Seasonal Cumulative Effect of Ural Blocking Episodes on the Frequent Cold Events in China during the Early Winter of 2020/21. Adv. Atmos. Sci. 2022, 39, 609–624. [Google Scholar] [CrossRef]
- Zhong, L.; Hua, L.; Luo, D. Local and External Moisture Sources for the Arctic Warming over the Barents–Kara Seas. J. Clim. 2018, 31, 1963–1982. [Google Scholar] [CrossRef]
- Luo, B.; Luo, D.; Wu, L.; Zhong, L.; Simmonds, I. Atmospheric circulation patterns which promote winter Arctic sea ice decline. Environ. Res. Lett. 2017, 12, 054017. [Google Scholar] [CrossRef]
- Woods, C.; Caballero, R.; Svensson, G. Large-Scale Circulation Associated with Moisture Intrusions into the Arctic during Winter. Geophys. Res. Lett. 2013, 40, 4717–4721. [Google Scholar] [CrossRef]
- Woods, C.; Caballero, R. The Role of Moist Intrusions in Winter Arctic Warming and Sea Ice Decline. J. Clim. 2016, 29, 4473–4485. [Google Scholar] [CrossRef]
- Screen, J.A.; Deser, C.; Smith, D.M.; Zhang, X.; Blackport, R.; Kushner, P.J.; Oudar, T.; McCusker, K.E.; Sun, L. Consistency and Discrepancy in the Atmospheric Response to Arctic Sea-Ice Loss across Climate Models. Nat. Geosci. 2018, 11, 155–163. [Google Scholar] [CrossRef]
- Graf, H.F.; Zanchettin, D. Central Pacific El Niño, the “subtropical Bridge,” and Eurasian Climate. J. Geophys. Res. 2012, 117, D01102. [Google Scholar] [CrossRef]
- Zhang, W.; Wang, L.; Xiang, B.; Qi, L.; He, J. Impacts of Two Types of La Niña on the NAO during Boreal winter. Clim. Dyn. 2015, 44, 1351–1366. [Google Scholar] [CrossRef]
- García-Serrano, J.; Cassou, C.; Douville, H.; Giannini, A.; Doblas-Reyes, F.J. Revisiting the ENSO Teleconnection to the Tropical North Atlantic. J. Clim. 2017, 30, 6945–6957. [Google Scholar] [CrossRef]
- Mori, M.; Watanabe, M.; Shiogama, H.; Inoue, J.; Kimoto, M. Robust Arctic Sea-Ice Influence on the Frequent Eurasian Cold winters in Past Decades. Nat. Geosci. 2014, 7, 869–873. [Google Scholar] [CrossRef]
- Matsumura, S.; Kosaka, Y. Arctic–Eurasian climate linkage induced by tropical ocean variability. Nat. Commun. 2019, 10, 3441. [Google Scholar] [CrossRef]
- Shepherd, T.G. Effects of a Warming Arctic. Science 2016, 353, 989–990. [Google Scholar] [CrossRef]
- Magnusdottir, G.; Deser, C.; Saravanan, R. The Effects of North Atlantic SST and Sea Ice Anomalies on the Winter Circulation in CCM3. Part I: Main Features and Storm Track Characteristics of the Response. J. Clim. 2004, 17, 857–876. [Google Scholar] [CrossRef]
- Jia, F.; Cai, W.; Wu, L.; Gan, B.; Wang, G.; Kucharski, F.; Chang, P.; Keenlyside, N. Weakening Atlantic Niño–Pacific Connection under Greenhouse Warming. Sci. Adv. 2019, 5, eaax4111. [Google Scholar] [CrossRef] [PubMed]
Publisher’s Note: MDPI stays neutral with regard to jurisdictional claims in published maps and institutional affiliations. |
© 2022 by the authors. Licensee MDPI, Basel, Switzerland. This article is an open access article distributed under the terms and conditions of the Creative Commons Attribution (CC BY) license (https://creativecommons.org/licenses/by/4.0/).