Abstract
Entrapped air in the chambers of a T-girder bridge generates a considerably large vertical force which is harmful to the safety of the bridge superstructure. The contribution of the entrapped air is not considered when calculating flood force in the related specifications, and also it has not been taken into account by researchers. Two-dimensional, scaled-down models at a 1:40 scale are selected as the research object. Analytical and numerical methods are employed to investigate the contribution of entrapped air in T-girder chambers to flood forces. Results show that the entrapped air in the rear chambers could escape easier than that in the front chambers and the compressibility of entrapped air has a small influence on drag force and vertical force (generated by dynamic pressure) coefficients, but it reduces the buoyancy of the T-girder. Considering the entrapped air compressibility and entrapped air escape, the calculation method of the buoyancy of entrapped air is proposed to improve the precision of the existing flood force calculation method.
1. Introduction
China, with its vast territory and complex natural geography and climate conditions, is one of the countries with the most frequent flood disasters in the world, and about two-thirds of its land area is subjected to different types of flood disasters with different degrees of damage.
Liu et al. (2017) [1] concluded through incomplete statistics that from 2007 to 2015, a total of 102 bridges collapsed in China, and 44 of them were caused by floods, accounting for 43.1% of the total. Xiong et al. (2021) [2] analyzed the raw data [3] of 92 bridge collapses in the United States and concluded that the proportion of bridge water damage is up to 52.17%. Furthermore, they also found that 54.17% of bridge water damage is caused by flood action on the superstructure.
In recent years, a lot of T-girder bridges have been built in China, many of which are always threatened by floods as extreme weather disasters are becoming more and more frequent. In this article, the simply supported T-girder bridge, whose diaphragms share the same height with its girder web and is widely used in China, will be selected as the research object.
The flood force calculation methods have been regulated by codes in different countries, such as Eurocode 1991-1-6 [4], which specifies the calculation method of horizontal flood force on a bridge pier and bridge deck by using the constant drag force coefficient k, which is related to the shape of the structure. The Chinese code General Specifications for Design of Highway Bridges and Culverts (JTG D60-2015) [5] specifies the calculation method of the designed flood level based on the designed flood frequency and suggests improving the bridge deck elevation to avoid direct impact on the bridge deck of a flood. Furthermore, the Chinese code specifies the calculation method of flood force on a bridge pier, which is similar to that in Eurocode 1991-1-6. The US Federal Highway Administration code Hydraulic Design of Safe Bridges [6] specifies the calculation methods of drag, lift and overturn moment coefficients for bridge decks with various shapes, and the coefficients vary with the relative submergence of the bridge deck. The Japan Society of Civil Engineers code Standard Specifications for Concrete Structures (2007) [7] specifies the horizontal flood force calculation method similar to that used in Eurocode 1991-1-6. The Australian Bridge Design Standards AS 5100 [8] specifies a lift coefficient dependent on the relative submergence and a drag coefficient dependent on both the relative submergence and the proximity ratio. As we have noticed, all the codes mentioned above do not take the entrapped air into account.
Ordinarily, the diaphragms are cast in situ to connect the neighboring girders to form the superstructures, whose girders can bear the loads more coordinately, as shown in Figure 1. Then, many chambers, composed of the neighboring girder walls, neighboring diaphragm walls and the bottom wall of the deck, are formed. When the water level rises gradually, the air will be entrapped in the chambers. Furthermore, the entrapped air would bring an extremely large risk of superstructure failure.
Figure 1.
Diaphragms in T-girder bridges (imaged by Wanli Yang in 2021).
Yang et al. (2022) [9] studied the failure mechanism of the Jinsha River Bridge at Zhubalong town destroyed by the flood discharge of the Baige landslide dam upstream. The detailed cross-section information of the bridge superstructure is shown in Figure 2. Results show the entrapped air in chambers of the T-girder bridge contributes 18% of the upward vertical force, which decreases the horizontal resistance and increases the overturning moment of the superstructure obviously. The entrapped air between the top surface of the bridge deck, and the downstream and upstream walls of the solid reinforced concrete guardrail contributes 51% of the upward vertical force. It is concluded that the entrapped air is the critical factor in superstructure failure.
Figure 2.
Cross section of the middle span of Jinsha River Bridge at Zhubalong town (unit: cm).
Figure 3 shows the damage to the Jinsha River bridge in Zhubalong town. It is reported that the submerged depth of the Jinsha River bridge deck was approximately 12 m [10] when the bridge was hit by a flood, implying that the entrapped air in chambers should be compressed under such a large submergence depth. It is estimated that the volume of the entrapped air could be compressed to approximately 2/3 of the original volume, i.e., the contribution of the entrapped air to the buoyancy (part of the upward vertical force) should be smaller than that before being compressed. Note that the height of the diaphragm of the Jinsha River bridge is approximately 1/4 of the girder height (as shown in Figure 2). As for the T-girder with diaphragms almost sharing the same height as the girder (as shown in Figure 1), the adverse effect caused by the entrapped air is expected to be more destructive, and the influence of the compressibility of entrapped air on upward vertical force is believed to be more important. Up to now, no studies have investigated the influence of the compressibility of entrapped air on flood forces. Moreover, the contributions of entrapped air to the drag force, lift force and overturning moment have been investigated only for tsunami waves but not for currents (e.g., in [11]), to the best of our knowledge.
Figure 3.
Damage to Jinsha River bridge in Zhubalong town.
The influence of entrapped air on the wave forces on bridge decks or on other marine structures has drawn extensive attention all over the world. McPherson (2010) [12] found that when the bridge deck is impacted by waves, the entrapped air in the chamber will escape gradually and the water cannot occupy the chamber completely, and the buoyancy of the entrapped air is as large as the bridge deck gravity. Cuomo et al. (2009) [13] found that the openings on the bridge deck could reduce both upward vertical force and downward suction force on the bridge deck to some degree, but will increase the suction force on the bottom of the girder. When the size of the openings becomes larger, a wave will impact the roof of the chamber and will make the bridge deck suffer a larger impact force. Bozorgnia et al. (2010) [14] studied the influence of entrapped air on wave loads; their results show that the entrapped air can intensively increase the vertical wave load on the bridge deck, and the openings on the bridge deck can dissipate wave energy and reduce vertical wave load. If the entrapped air is not considered in the bridge design code, the upward vertical wave load will be underestimated, endangering the safety of the bridge. Seiffert et al. (2015) [15] found that the openings on the bridge deck can slow down waves and change the wave’s shape, and the vertical wave force without any openings is six times as large as that with openings. Furthermore, if the compressibility of the entrapped air is considered, the peak value of the vertical force caused by the solitary wave will decrease. In addition, Bricker et al. (2012, 2014) [16,17] also conducted studies on the influence of entrapped air on the wave force acting on the bridge deck. Salem et al. (2014) [18] pointed out that the entrapped air in the chambers will increase the vertical tsunami force on the bridge deck, and the volume of the entrapped air is proportional to the incoming velocity of the tsunami bore. Istrati et al. (2019, 2017) [11,19] also found that the entrapped air in the chambers increases the vertical tsunami force on the bridge deck, and makes the time history curve of the vertical force smoother due to the buffering effect caused by the entrapped air. Furthermore, they studied the estimation method of vertical force increment caused by entrapped air; their results show that even if the chambers are completed occupied by entrapped air, the buoyancy (static pressure) of the entrapped air is still smaller than the vertical force increment, implying that the vertical force increment is partially contributed to by dynamic pressure when the entrapped air is impacted by a wave. Azadbakht (2013) [20] used a 3D slice model with a 3% venting area subjected to periodic waves and found that 56% of the vertical tsunami force on a bridge deck is contributed by entrapped air, and the increase of vertical force increases the possibilities of lateral displacement and overturning of the bridge deck, even if the bridge deck suffers from a smaller horizontal tsunami force. Istrati et al. (2016) [21] documented experimentally that for a 0.85% deck venting area (with circular holes of 2.5 inches diameter) subjected to unbroken solitary waves and tsunami bores, the reduction of the uplift was between 7% and 55%, with the largest value corresponding to the smallest wave heights.
In this paper, we study the force caused by a riverine flood on the superstructure of the bridge, which is different from the force caused by waves, as (1) there are diaphragms in our research object, and (2) compared with waves, in a flood the water level rises gently, meaning entrapped air could escape from the bottom of the chamber along the transverse direction.
Generally, the flood force on a bridge deck caused by a flood is not as intensive as wave force, but the influence of entrapped air on flood force cannot be ignored. The flow field difference between the current and wave is remarkable; therefore, the study of entrapped air effect on flood force cannot be substituted by studies of the entrapped air effect on wave force. In this study, the influence of the compressibility of entrapped air on flood force will be studied numerically. The entrapped air will be considered incompressible and compressible, respectively, to discuss the flood force difference caused by air compressibility. Based on this, a modification to the flood force calculation method is suggested.
2. Numerical Model and Validation
2.1. Basic Equations
The software ANSYS FLUENT was chosen to solve the Reynolds-averaged Navier–Stokes (RANS) equations, in which the mass conservation equation and momentum equation are, respectively, as follows:
where is the time-averaged velocity, in which the indices and represent the directions of the coordinates (note that this index-based notation implies the sum over a repeated index in terms involving multiple indices). The time-averaged velocity can be defined as , where the flow velocity can be decomposed to , is the velocity fluctuation, is the time-average pressure, is the density of water, and is the dynamic viscosity. The computational domain consists of water and air, and the volume of fluid (VOF) method is employed to track the free surface between two fluids. Different turbulence models have a non-negligible effect on the accuracy of numerical calculation results; therefore, choosing a suitable turbulence model is of great significance to improve the accuracy of numerical calculation. Among the multiple built-in turbulence models in ANSYS FLUENT, the most widely used one is the turbulence model, which can be divided into a realizable turbulence model and RNG turbulence model. For example, Lau et al., (2011) [22], Motley et al., (2016) [23] and Yang et al. (2018, 2020) [24,25,26] all used the turbulence model in their studies. Patil et al., (2009) [27], Wu et al., (2017) [28] and Wen et al. (2018) [29] compared the numerical calculation results of different turbulence models, and the results show that the calculation accuracy of the RNG turbulence model is better in the numerical simulation.
The Reynolds stress, turbulence kinetic energy , and its rate of dissipation in the RNG turbulence model are calculated from the following equations:
In which, , , the constants , , are set as the default values in ANSYS FLUENT 18.0, i.e., , , . The scalable wall function is chosen to treat the boundary layer because it can avoid the deterioration of the standard wall function under grid refinement when is very small. Here, , where is the distance from the wall to the center of the innermost cell and is the wall shear stress.
2.2. Physical Experiment for Validation
The physical experiments conducted in the deep water long-span bridge lab at Southwest Jiaotong University by our team were employed to validate the numerical model. The wave-current flume we used was 60 m long, 2.0 m wide and 1.8 m in depth. The prototype of the beam used to validate the numerical method was a T-girder with 11.2 m width and 20 m length. Froude’s similarity law with length scale ratio λ = 1:40 was adapted to generate the scaled-down model; the surface of the scaled-down model was decomposed into a series of panels, which are numbered and shown in Figure 4.
Figure 4.
Cross section of the scaled-down T-girder model, and numbering of the panels, “C” means horizontal panel and “B” means vertical panel (unit: cm).
The physical experimental model was made of plexiglass, and two end diaphragms were installed to form the chambers under the bridge deck, as shown in Figure 5. The six-component load cell from ATI named Gamma IP68 was used to measure the flood force, as shown in Figure 6. The measuring range of forces , and were 130 N, 130 N and 400 N, respectively, and the corresponding measuring resolutions were 1/40 N, 1/40 N and 1/20 N, respectively. The sampling frequency of the force balance was set at 50 Hz.
Figure 5.
Physical experimental model of the T-girder.
Figure 6.
Photo of installation of the physical experimental model.
The installation of the physical experimental model is shown in Figure 6. The model was divided into three parts, i.e., one test model in the middle and two boundary simulation models at the sides. The three models were totally the same except for the length. The test model was 80.0 cm in length, and the two boundary simulation models were 72.0 cm and 48.0 cm in length, respectively. The gaps between models and the gaps between the boundary simulation models and the side walls of the flume were smaller than 5 mm. The top panel of the test model was connected with an iron plate in “” shape, which was connected to the load cell, as shown in Figure 6. The digital wave altimeter and water current meter were installed upstream of the model to monitor the water depth and incoming velocity, respectively.
2.3. Numerical Model
Bozorgnia et al. [14] found that the 3D models were more accurate in predicting the wave forces on bridges because they could capture the movement of the trapped air in the third dimension (along the span length). Moreover, Xiang et al. [30] used a 3D slice model with an adequate flume width in order to simulate the movement of the air along the span length until it escaped from the sides and matched the forces and pressures applied on a bridge deck with cross-frames impacted by unbroken waves.
However, the T-girder widely used in China has many diaphragms along the longitudinal direction, as shown in Figure 1 and Figure 3. The diaphragms are always set along the longitudinal direction every several meters, i.e., the chamber is a box-like closed room just without the floor, and there are many chambers under the bridge deck. In addition, there are two end-diaphragms at the end of the beam. Therefore, the entrapped air cannot flow along the longitudinal direction and escape from the ends of the beam. Wu (2017) [28] compared the calculation precision of tsunami bore forces on this kind of bridge deck calculated by a three-dimensional model and two-dimensional model, and the results show that the flow field difference and the tsunami bore force difference between the three-dimensional model and two-dimensional model are negligible, but the calculation efficiency of the two-dimensional model is significantly higher than that of the three-dimensional model.
Therefore, a two-dimensional T-girder model was built, as shown in Figure 7. The numerical flume is 8.4 m in length and 0.963 m in height. The flume top was set as “symmetry”, and the upstream and downstream walls of the flume were set as “pressure-inlet” and “pressure-outlet”, respectively. The bottom of the flume, as well as the surface of the bridge deck, was set as the “wall”. The bridge deck model was placed 2.8 m (10 times of the bridge deck width ) downstream of the upstream wall of the flume, i.e., 5.6 m (20 times of the bridge deck width ) upstream of the downstream wall of the flume. The densities of water and air were set as and , respectively. The kinematic viscosities of water and air were set as , respectively. The gravitational acceleration was set as .
Figure 7.
Sketch of the numerical model. Note that and are bridge deck width and height, respectively (unit: m).
Structural grids are generated for the computation domains. The area around the bridge deck was set as the core zone and the left area was set as the non-core zone. In the core zone, Y+ was set as 30 and the structural grids with a thickness of 0.001 m were generated at the innermost point, and the grids became thicker with a change ratio of 1.02 when transiting to the non-core zone area, as shown in Figure 7. The interface technique was used to connect the core zone and non-core zone. In the non-core zone, the grid thickness adjacent to the core zone boundary was 0.005 m and gradually changed to 0.01 m at the upstream and downstream walls of the flume.
2.4. Verification of Numerical Model
The case with a submergence ratio of 1.5 and incoming velocity of 0.5 m/s was selected as comparing case. Meanwhile, in order to verify the grid independence, three schemes of grid size were tested: Coarse, Middle and Fine grids. The values, grid thickness on the boundary in the core zone , maximum grid size in the non-core zone, grid number , the time cost of computation , drag coefficient and vertical force coefficient of each case are listed in Table 1. The thickness of the innermost grid was 1 mm for the three schemes, and the incoming velocity was 0.5 m/s; therefore, the time-step was estimated as 0.002 s for the three schemes.
Table 1.
Influence of grid generation scheme on calculation accuracy and calculation efficiency.
It can be observed that the drag coefficient and vertical force coefficient of the Coarse grid case, Middle grid case and Fine grid case agree well with those of the physical experimental case. It indicates that the numerical model, including the grid generation scheme, parameter setting, etc., can be employed to predict the flood force on the bridge deck. Considering the calculation efficiency, the Middle grid scheme is adopted in this study.
2.5. Definition of Flood Force Coefficients
The flood force on the bridge deck can be decomposed into drag force and vertical force . can be expressed as:
in which, , and are, respectively, the buoyancy of the bridge deck, the buoyancy of the entrapped air and the vertical force caused by dynamic pressure, as shown in Figure 4. The drag force coefficient and vertical force coefficient are, respectively, defined as:
in which, is water density, is incoming velocity, is the length of the bridge deck and in this study. is bridge deck height, is bridge deck width, is the distance between bridge girder bottom to flume bottom and is water depth. is submergence ratio defined as , in which is submergence depth of the bridge deck. When , it indicates the water level just touches the girder bottom; when , it indicates the water level reaches the bridge deck top; when , it means the bridge deck is submerged completely.
3. Buoyancy of Entrapped Air without Considering Air Escape
During the inundation process of the bridge deck, the entrapped air is assumed not to escape from the chambers, and the air volume and air pressure in each chamber are assumed to be the same. The air entrapped in first chamber is chosen to be the study object in this section.
Status 1: At the moment when chambers just are closed by the free surface of the water, i.e., , as shown in Figure 8a, the pressure in the chamber is assumed to be equal to the atmospheric pressure, i.e., , and the volume of the entrapped air is . Note that is the chamber width, is the chamber height and the chamber length is 1 m, so will be omitted from the formula mentioned below.
Figure 8.
Two statuses of inundation of bridge deck. (a) Status 1: Chambers are just closed by the free surface of the water, (b) Status 2: The water level is higher than the chamber roof.
Status 2: At the moment when the bridge deck is inundated by water, the entrapped air in the chamber is compressed, the pressure in the chamber can be expressed as , and the volume of the entrapped air is , as shown in Figure 8b, in which is the compressed height, i.e., the rising height of the water level in the chamber when the water level outside the chambers rises. Fundamentally, the compression process of entrapped air is an adiabatic compression of ideal gas during the rising of water level. Namely,
in which and are pressure and volume of an ideal gas, is the mass of ideal gas, is molar mass, is the molar gas constant and is the temperature of an ideal gas. Taking the above two statuses into Equation (9), we have the equation: = . Now setting , the compressed height can be worked out
Furthermore, the compression rate can be expressed as
Provided that the dimensions of the bridge deck and the submergence status are already known, Equation (10) will transmit into a function with respect to a single parameter, i.e., the submergence ratio . Note that for the standard atmospheric pressure, . In other words, once the submergence ratio is known, the buoyancy caused by entrapped air in the first chamber with a volume can be calculated by
Note that the effective volume of the entrapped air should be different before and after the water level reaches the height of the roof of the chambers. The height of the entrapped air which can generate buoyancy is named as the initial effective height , and the submergence ratio when the water level reaches the height of the chamber roof is named as critical submergence ratio (specifically, for the T-girder in this study is ). When
and when
in which and are the width and height of the chamber, respectively, as shown in Figure 8. Therefore, Equation (12) can be written as:
Furthermore, the buoyancy generated by the entrapped air in all the chambers of the T-girder without considering air escape can be expressed as
in which is the number of chambers, and specifically for the T-girder studied in this paper, .
4. Buoyancy of Entrapped Air Considering Air Escape
In Section 3, the entrapped air is assumed to not escape from the chambers during the inundation process of the bridge superstructure. However, the entrapped air does escape from the chambers; how much-entrapped air remains deserves further study. The compressibility of entrapped air is expected to have an influence on drag force and vertical force , which also requires a profound investigation.
4.1. Case Introduction
Ordinarily, the flood force coefficients are obtained by physical experiments, in which scaled-down models are used. Therefore, the numerical simulation model in this study is also obtained by scaling down the prototype (a kind of T-girder bridge widely used in real practice) using a 1:40 length scale. It is worth noting that the entrapped air in the physical experiment is the same as that in real practice, i.e., the compressibility of air is not scaled down accordingly when the submergence depth is scaled down by a certain scale ratio, which results in the entrapped air in the physical experiments potentially being treated as approximately incompressible. For example, for a real bridge, assuming the chamber height , submergence ratio , and bridge deck height , the submerged depth is 10 m. According to Equations (10) and (11), the compressed height of the entrapped air can be estimated as and the compression rate is . However, for its 1:40 scaled-down model, the chamber height , the submergence ratio remains unchanged as , the bridge deck height , we see that the submerged depth is only 0.25 m, the compressed height is , and compression rate , which is approximately 1/20 of the real bridge.
In order to investigate the influence of compressibility of entrapped air on flood force coefficients, a pair of numerical models are built for each case with fixed submergence ratio and incoming velocity, one considering air compressibility and the other does not consider compressibility. For example, for the case with a submergence ratio of 2.232 (), the prototypes with air compressible and incompressible are shown in Figure 9a,c, respectively. Furthermore, their 1:40 scaled-down models are shown in Figure 9b,d, respectively. Considering entrapped air escapes during the inundation process, the volumes of entrapped air left in scaled-down pair, i.e., the models in Figure 9b,d, will be compared and the flood force coefficient difference between the two scaled-down models will be discussed.
Figure 9.
Sketch of numerical model pair: compressibility of entrapped air is considered or not (unit: m). (a) Prototype of T-girder with entrapped air compressible, (b) Scaled-down model of T-girder with entrapped air compressible, (c) Prototype of T-girder with entrapped air incompressible, (d) Scaled-down model of T-girder with entrapped air incompressible.
The submergence ratios in this study are set as 0.223, 0.446, 0.786 (, 1.339, 2.232, 3.125, 4.018, 4.911, 5.804 and 6.696, whose submerged depths are 0.0125 m, 0.025 m, 0.044 m, 0.075 m, 0.125 m, 0.175 m, 0.225 m, 0.275 m, 0.325 m and 0.375 m, respectively. Furthermore, for each submergence ratio, the incoming velocity are set as respectively.
4.2. Modification to Buoyancy of Entrapped Air
When air compressibility is considered, the entrapped air in the chambers will be compressed at the initial status (in numerical simulation) according to Equation (11), and the entrapped air will escape from the chambers before the calculation reaches stable status. Note that the stable status in the numerical simulation represents the moment when the bridge deck suffers a constant incoming velocity and the flow field around reaches stability. Taking the case with = 1.339, = 0.7 m/s and the case with , for example, the entrapped air between the two statuses is compared in Figure 10a,b respectively.
Figure 10.
Comparison of entrapped air between the initial status and stable status when the air compressibility is considered, red represents air and blue represents water. (a) Phase contour ( = 1.339, = 0.7 m/s), (b) Phase contour ( = 3.125, = 0.4 m/s).
It can be observed that in different cases, the air escape volume and air escape position are changed with the submergence ratio and incoming velocity. In comparison, it is found that the entrapped air in the third and fourth chambers could escape easier than that in the first and second chambers, because a large vortex generates below the first chamber, as shown in Figure 11, and the shedding vortex disturbs the water below the rear chambers, making some water rush into them and take away some entrapped air, as shown in Figure 12.
Figure 11.
Vorticity contour of the case with = 1.34, = 0.7 m/s at = 1.89 s (unit: s−1).
Figure 12.
Phase contour of the case with = 1.34, = 0.7 m/s at = 1.89 s, red is air and blue is water.
Although the effective height of the entrapped air is different between the four chambers, we make a simplification here that the volume of the entrapped air escaped from each chamber is the same, i.e., the effective height of entrapped air for each chamber now is replaced by the averaged effective height of entrapped air over the all chambers. Then, the buoyancy of the entrapped air can be calculated as
where is the number of chambers, and is the average effective height of entrapped air. Figure 13 shows how changes with submergence ratio and incoming velocity . Besides, the relationship between the initial effective height of the entrapped air (without considering entrapped air escape) and submergence ratio is shown in Figure 13.
Figure 13.
changing with submergence ratio and incoming velocity .
It can be observed from Figure 13 that (1) each is under the line of , which means when calculating the buoyancy of the T-girder, it is necessary to consider the escape of the entrapped air, i.e., Equation (18) needs an improvement to take the entrapped air escape into account; (2) when , the lines of and almost coincide with each other regardless of incoming velocity; (3) when and , the lines of and have the same change trend with and show a slight difference, with the increase of incoming velocity, i.e., and , the difference between and is larger when and the difference decreases when and eventually coincides. It indicates that the escape of the entrapped air plays an important role in the reduction of the entrapped air volume as incoming velocity becomes larger, but the reduction effect tends to be a constant value.
However, when the bridge in real practice is inundated gradually by floods, it would experience un-inundated, partially inundated and fully inundated phases, i.e., it would experience different submergence ratios. These three phases were previously observed by Istrati and Hasanpour (2022) [31] for the case of a dam break-induced transient extreme flow. In each phase, some air would escape from the chambers, which indicates that will become smaller with the increase of , at least the of the larger case should not become greater than the of the smaller case.
It is challenging to take the water level rising process, the trapped air compressibility and the trapped air escaping process into account simultaneously in the numerical simulation. Therefore, the water level rising process was discretized into a series of cases with fixed submerged depths. Such a simplification may cause a slight overestimation of the entrapped air, and eventually make the bridge design slightly conservative.
Now the entrapped air escape effect is not involved in Equation (18) and an escape effect modification coefficient , defined as the ratio of averaged effective height of entrapped air to initial effective height of entrapped air (), is added to improve Equation (18). How changes with submergence ratio and incoming velocity is shown in Figure 14.
Figure 14.
Relationship between , and .
In Figure 14, for the cases with a large submergence ratio, i.e., , it is obvious that the of these cases is in the range between 0.9 and 1, which means the effect of air escaping is smaller regardless of incoming velocity . On the contrary, becomes scattered with the decrease in submergence ratio . The averaged value of () at the submergence ratio was selected as a base point (,), and the curve fitting technique was employed to obtain the relationship between , and . The fitting curves (basically straight lines) through the base point for different incoming velocities are drawn in Figure 14. These fitting straight lines can be expressed in a uniform format as:
in which is the slope of a fitting straight line determined by incoming velocity . The relationship between and is drawn in Figure 15. Again, the curve fitting technique is employed to obtain the relationship between and ,
Figure 15.
Relationship between slope and incoming velocity note that is the incoming velocity in real practice.
Generally, the buoyancy of entrapped air considering the air escaping can be expressed as,
where , and
For example, for the prototype of the scaled-down model in Figure 4, the buoyancy of entrapped air on a unit length T-girder changing with submergence ratio and incoming velocity can be drawn in Figure 16.
Figure 16.
Buoyancy of entrapped air on a unit length T-girder changing with submergence ratio and incoming velocity . The T-girder here is the prototype of the scaled-down model in Figure 4.
5. Influence of Compressibility of Entrapped Air on Flood Force Coefficient
Just as stated in Section 4.1, for each case, a pair of scaled-down models, one considering air compressibility and the other without considering air compressibility, are computed. The flood force difference between the two scaled-down models will be investigated elaborately here.
5.1. Influence on Drag Force
Generally, the difference between drag force caused by entrapped air compressibility is not very obvious. As a representative, the drag force’s time histories of the pair with = 5.8 and = 0.5 m/s are shown in Figure 17. It demonstrates that when considering the compressibility of the entrapped air, the time-averaged drag force is relatively smaller than that of the model without considering the air compressibility. Further investigation indicates that the averaged drag force difference is mainly contributed to by the vertical surface plates B1, B2, B11 and B12, which are shown in Figure 4 and their drag force time histories are ignored intentionally for brevity. Furthermore, it can be observed that the time history curve becomes smoother when considering air compressibility. When considering air compressibility, a smaller amount of entrapped air in the chambers provides a stronger buffering effect.
Figure 17.
Comparison of drag force time history in the pair with = 5.8 and = 0.5 m/s.
It can be observed in Figure 18a that the larger the incoming velocity, the larger the drag force difference, and the larger the submergence ratio, the larger the drag force difference. Furthermore, the drag force coefficient comparison shows similar rules, as shown in Figure 18b. It can be concluded that the drag force difference caused by entrapped air compressibility is not remarkable, and there is no strong necessity to modify the calculation method of the drag force coefficient. From a practical point of view, the entrapped air compressibility has few influences on drag force, and the present drag force coefficient can be used as before by designers when designing a bridge.
Figure 18.
Drag force comparison (a) and drag force coefficient comparison (b) between the cases considering air compressibility or not.
It is worth noting that the cases of submergence ratio ) with incoming velocity and have the highest drag coefficient in Figure 18b; this is because under the situation of critical submergence ratio and large incoming velocity , the water runup in front of the girder is much higher, increasing the impacting area on the upstream surface of the girder, as compared in Figure 19. Note that when calculating the drag coefficient by Equation (7), the value of () is calculated based on the initial status, which results in a smaller impacting area and larger drag force coefficient.
Figure 19.
Water runup upstream of the T-girder in stable status for the case with and when considering the air compressibility, red represents air and blue represents water. (a) Initial status, (b) Stable status.
Then, envelope curves of vary with and when considering entrapped air compressibility is obtained by the curve fitting technique, as shown in Figure 20. Furthermore, the upper fitting curve and the lower fitting curve of the envelope curves can be expressed by Equations (24) and (25), respectively. Then, the drag force changing scope can be estimated by taking Equations (24) and (25) into Equation (7).
Figure 20.
Envelope curves of the drag force coefficient changing with and when considering air compressibility.
The upper fitting curve:
The lower fitting curve equation:
5.2. Influence on Vertical Force
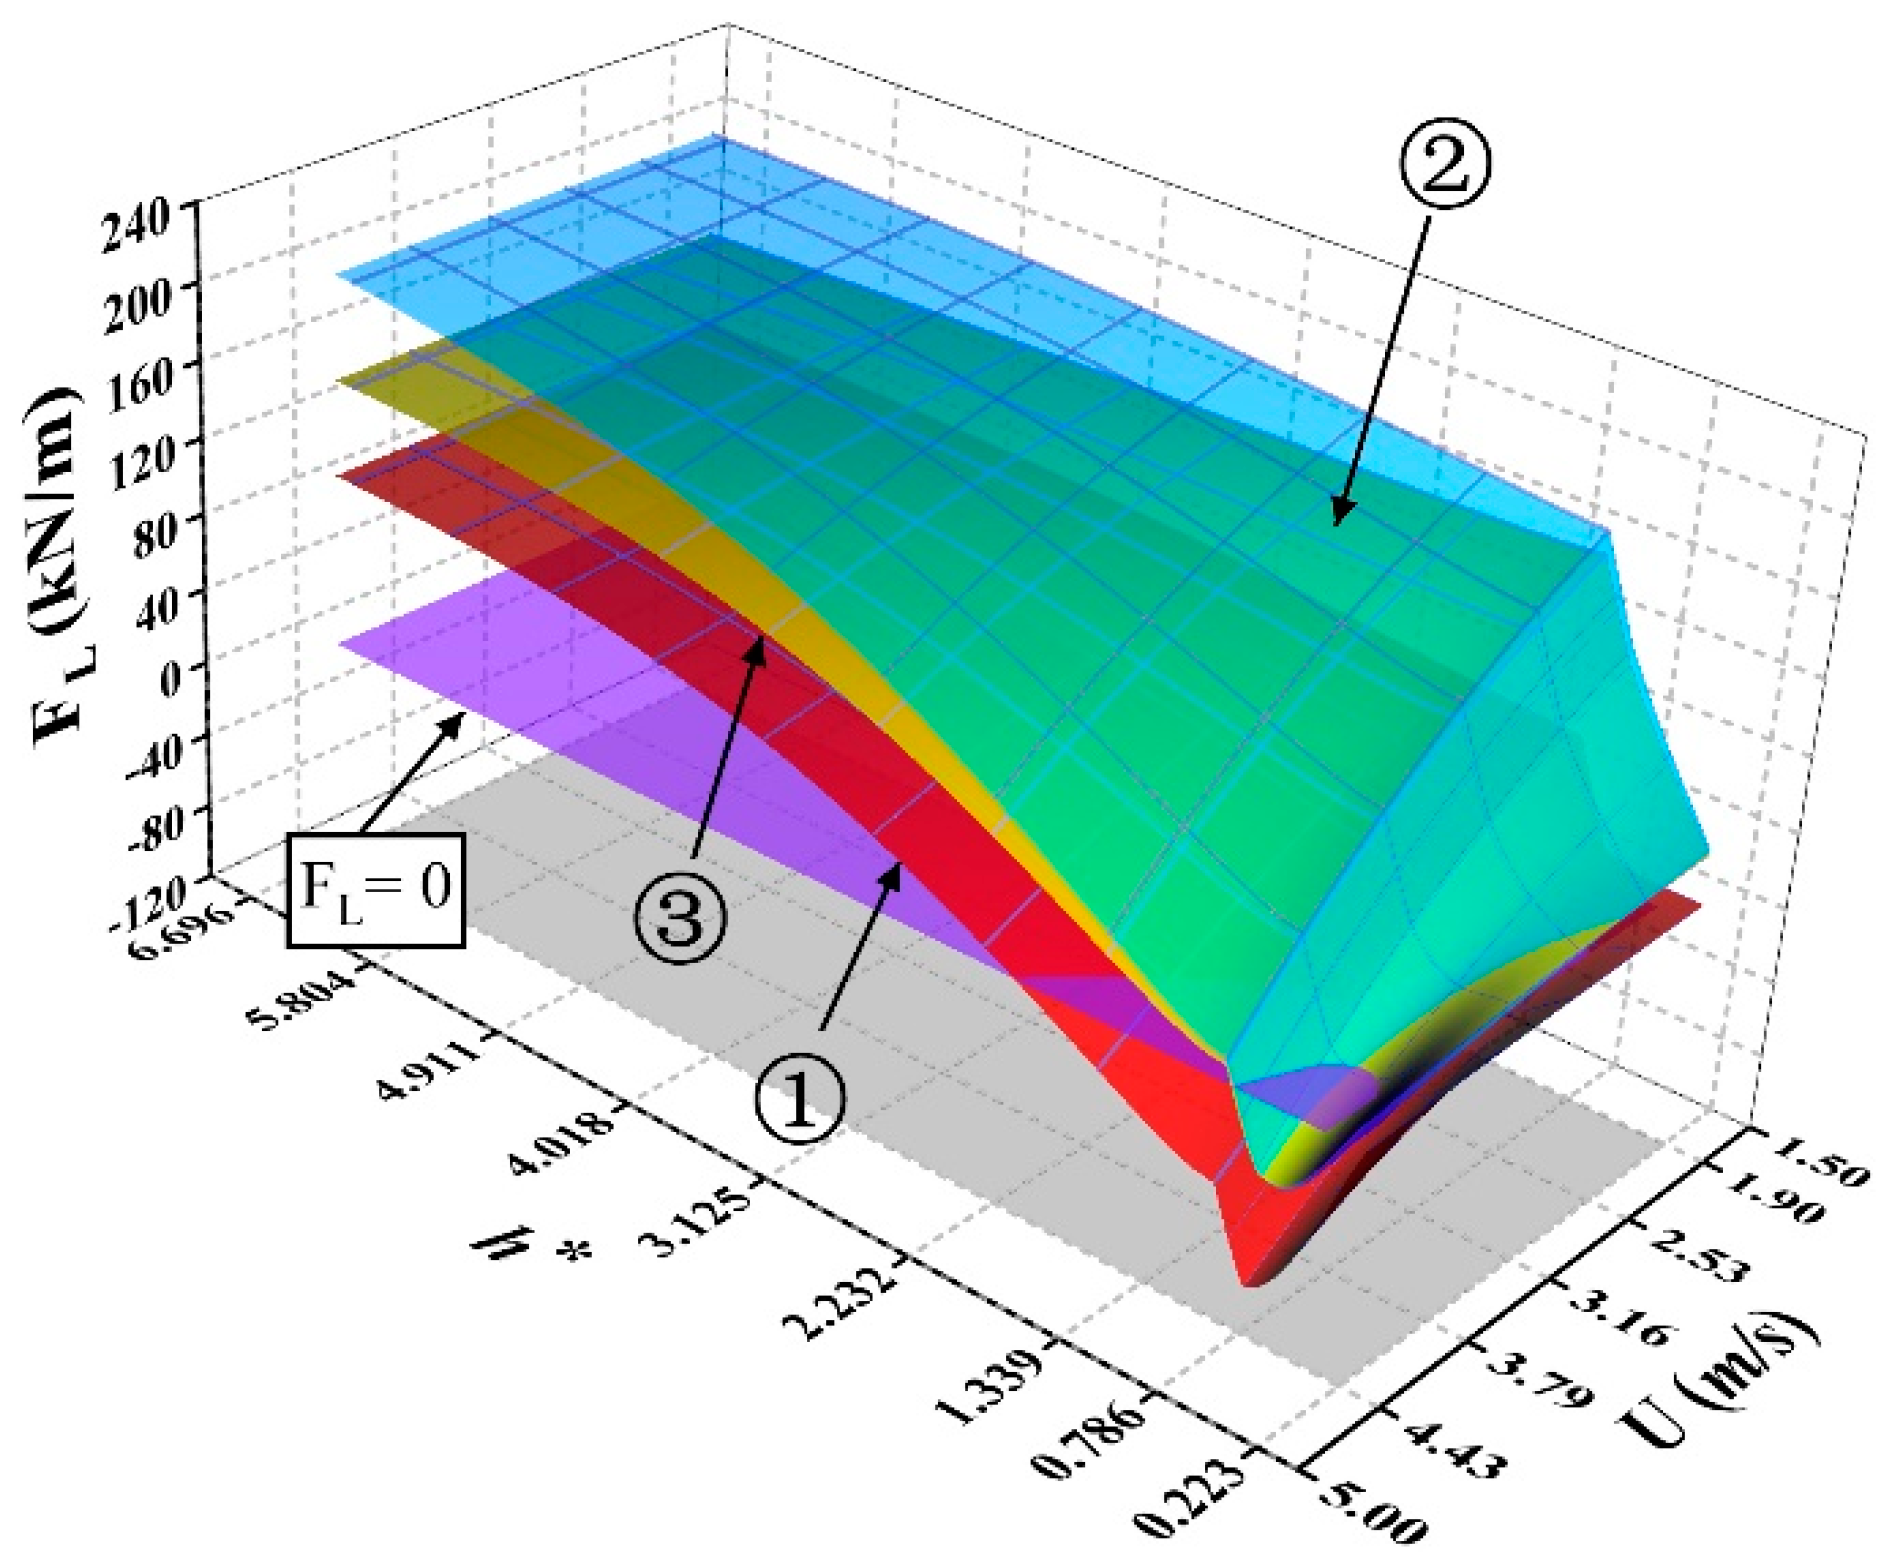
The vertical force calculated in numerical simulation is the total vertical force , as defined in Equation (1). In order to investigate the influence of vertical force generated by dynamic pressure, the buoyancy of the bridge deck and buoyancy of entrapped air should be eliminated from . Then, as a representative, the time histories of vertical force and on the scaled-down models in the pair (compressible and incompressible) with = 5.8 and = 0.5 m/s is shown in Figure 21. When considering air compressibility, the time-averaged value of is relatively smaller (negative) and the amplitude is also smaller.
Figure 21.
Comparison of the time history of the vertical force component and total vertical force on the models in the pair of the case with = 5.8 and = 0.5 m/s.
Figure 22a shows the comparison of vertical forces and Figure 22b shows the comparison of the vertical force coefficient () between the scaled-down models considering air compressibility or not. Generally, the difference between the forces considering air compressibility or not is quite small. Therefore, there is also no intensity necessity to modify the calculation method of the coefficient of vertical force . In other words, the entrapped air compressibility has few influences on vertical forces , the present vertical force coefficient can be used as before by designers when designing a bridge.
Figure 22.
Vertical force comparison (a) and coefficient comparison (b) when considering air compressibility or not.
Similarly, the envelope curves of changing with and , i.e., the upper fitting curve and the lower fitting curve, as well as the averaged fitting curve, are obtained by the curve fitting technique and shown in Figure 23. Their expressions are Equations (26)–(28) respectively.
Figure 23.
The graph of upper, lower and averaged fitting curve of lift force coefficient caused by dynamic pressure .
The upper fitting curve equation is,
and the lower fitting curve equation is,
the averaged fitting curve equation is,
According to the bridge design requirement, one of Equations (26)–(28) can be taken into the following equation to obtain a more accurate estimation of the vertical force caused by dynamic pressure:
Taking Equations (22) and (29) into Equation (6), a more precise vertical force calculation method, which considers the contribution of entrapped air, can be obtained as:
In which, can be calculated by Equation (23) and can be calculated by Equations (13) and (15), respectively.
In order to show the differences among the vertical forces in (1) situation 1—without considering entrapped air, (2) situation 2—considering the escape but not considering the compressibility of entrapped air, and (3) situation 3—considering both the escape and compressibility of entrapped air, the prototype of the scaled-down model in Figure 4 was selected as a representative for comparative calculation.
For the vertical force calculation in situation 3, Equation (30) was employed, in which, is calculated by Equations (13) and (15), is calculated by Equation (22), and is calculated by the averaged fitting curve equation, i.e., Equation (28). For the vertical force calculation in situation 1, Equation (30) is also employed but the second term is not involved and in the third term is also determined by the averaged fitting curve equation, i.e., Equation (28).
For the vertical force calculation in situation 2, Equation (30) is also employed, but the initial effective height of entrapped air is calculated as
and the escape effect modification coefficient is calculated by,
and the is calculated by,
The vertical forces in situations 1, 2 and 3 are compared graphically in Figure 24.
Figure 24.
Comparison of the vertical force when: (1) without considering the entrapped air (① red surface); (2) considering the escape but not considering the compressibility of the entrapped air (② blue surface), (3) considering the compressibility and escape of the entrapped air (③ yellow surface).
It can be observed from Figure 24 that:
- (1)
- Generally, the red surface is at the bottom, the blue surface is at the top and the yellow surface is in the middle. Namely, compared with situation 3 where the escape and compressibility of the entrapped air are considered, ignoring the entrapped air would underestimate the vertical force, and considering the air escape but not considering the air compressibility would overestimate the vertical force. In a word, considering the escape and compressibility of the entrapped air can improve the vertical force calculation precision.
- (2)
- The gap between the blue and yellow surfaces increases with , because the compressed height increases with . Especially when the T-girder is partially inundated, i.e., , the blue surface gets much closed to the yellow surface, indicating that air compressibility has little influence on the vertical force.
- (3)
- No matter in which situation, when is smaller and incoming velocity is larger, the vertical force is smaller and even negative. Because when is smaller, the buoyancy generated by entrapped air is smaller, and flow velocity below the girder is large and the vortex would generate under the girder, suction force may generate on the girder bottom.
6. Discussions
This study is only a preliminary investigation of the influence of entrapped air on a T-girder when the bridge is inundated by a flood. The assumptions and simplifications made in our study impose some limitations on the applications of our proposed calculation equations. They may be not applicable to the following cases: (1) bridges with diaphragms of reduced height (diaphragm height smaller than girder height); (2) bridges with air vents in the deck or the diaphragms; (3) skewed bridges, since the complex deck geometry can generate a three-dimensional movement inside the chambers and out-of-plane forces (as shown in [22] and [32]) that will most likely affect the trapped air; (4) straight bridges impacted by oblique flows [33], which also generates significant three-dimensional effects similar to skewed bridges; and (5) straight bridges with trapped debris at one end of the span, since the debris alters the non-uniform flow and pressures across the span length as shown in [34].
Furthermore, the assumptions and simplifications made in this study point out the direction of exploration for further studies.
- (1)
- The numerical model used in this study is all at a 1:40 geometric scale, which may impose some scale effects on the results. Scale effects require a specific investigation in the next step.
- (2)
- The residual entrapped air in every chamber is different, and the entrapped air in the rear chambers could escape easier than that in the front chambers. How the un-uniform distribution of entrapped air in different chambers affects the overturn moment requires further study.
- (3)
- The water level rising process was discretized into a series of static stable statuses, which may overestimate the volume of the entrapped air. Therefore, the entrapped air escape in the dynamic process of water levels rising should be intensively studied in the future.
Physical experiments should also be conducted to validate the calculation method proposed in this study.
7. Conclusions
Entrapped air plays an important role in keeping T-girder bridges safe when the bridges suffer flood inundation. The specifications related to flood force calculation do not take the forces generated by entrapped air into consideration. Furthermore, few studies have focused on the contribution of entrapped air to flood forces. The two-dimensional, scaled-down models at a 1:40 scale were selected as research objects. Analytical and numerical methods were employed to investigate the influence of the compressibility and escape of entrapped air on flood force on the T-girder. The main conclusions are summarized as:
- (1)
- The compressibility of entrapped air has slight influences on drag force and vertical force caused by dynamic pressure.
- (2)
- Considering escape and compressibility of entrapped air, the drag force coefficient can be calculated by Equations (24) or (25), and the vertical force coefficient can be calculated by Equations (26), (27) or (28).
- (3)
- Considering escape and compressibility of entrapped air, the vertical force on T-girder can be calculated by Equation (30), which provides a way to quantitatively calculate the contribution of the entrapped air to the vertical force and makes the bridge’s anti-flood design more reasonable.
Author Contributions
Conceptualization, W.Y.; methodology, W.Y. and W.Z.; modeling and computing, J.Q.; investigation, J.Q. and W.Z.; data analysis, W.Y., J.Q. and Y.Y.; validation, Y.Y.; writing—original draft preparation, Y.D.; writing—review and editing, Y.D.; funding secure and supervision, Y.Z. All authors have read and agreed to the published version of the manuscript.
Funding
This research was funded by [the National Key Research and Development Program of China] grant number [no. 2021YFC3100700], and funded by [the Fundamental Research Funds for the Central Universities] grant number [no. 2682022ZTPY019], and funded by [Science and Technology Planning Project of Sichuan Province] grant number [No 2021JDTD0012]. It is also funded by [Scientific Research Service of Lingang Yangtze River Bridge on Zigong Yibin Line of New South Sichuan Intercity Railway] grant number [No. SRIG2019FW0001].
Institutional Review Board Statement
The study did not involve humans or animals.
Informed Consent Statement
The study did not involve humans.
Data Availability Statement
The study did not report any data.
Conflicts of Interest
The authors declare no conflict of interest.
Nomenclature
| Velocity component in the direction | |
| Time-average velocity component in the direction | |
| Velocity fluctuation in the direction | |
| Density | |
| Acceleration of gravity | |
| Time-average pressure | |
| Eddy dynamic viscosity | |
| Eddy Kinematic viscosity | |
| Kronecker delta | |
| Turbulence kinetic energy | |
| Rate of dissipation of turbulent kinetic energy per unit mass | |
| Rate of production of turbulent kinetic energy | |
| Prandl number | |
| Empirical constant | |
| Width of bridge deck | |
| Height of bridge deck | |
| Width of chamber | |
| Height of chamber | |
| Length of the bridge deck and in this study | |
| Incoming velocity | |
| Total vertical force imposed by current on the deck of the bridge | |
| Drag force imposed by current on the deck of the bridge | |
| Buoyancy of bridge deck | |
| Buoyancy of entrapped air | |
| Vertical force caused by dynamic pressure | |
| Drag force coefficient | |
| Vertical force coefficient | |
| Distance between bridge girder bottom to flume bottom | |
| Water depth | |
| Submergence ratio of T-girder | |
| Critical submergence ratio | |
| Pressure of ideal gas | |
| Volume of ideal gas | |
| Mass of ideal gas | |
| Molar mass | |
| Molar gas constant | |
| Temperature of ideal gas | |
| Compressed height of entrapped air | |
| Initial effective height of entrapped air | |
| Averaged effective height of entrapped air | |
| Effective volume of the entrapped air | |
| The number of chambers | |
| Escape effect modification coefficient | |
| Slope of fitting line for |
References
- Liu, K.; Liu, J.; Yu, W. Statistical Analysis of Bridge Collapse Caused by Floods from 2007 to 2015. Urban Roads Bridges Flood Control 2017, 1, 90–92. [Google Scholar] [CrossRef]
- Xiong, W.; Cai, C.; Zhang, R. Review of Hydraulic Bridge Failures. China J. Highw. Transp. 2021, 34, 10–28. [Google Scholar] [CrossRef]
- Cook, W.; Barr, P.J.; Halling, M.W. Bridge failure rate. J. Perform. Constr. Facil. 2015, 29, 04014080. [Google Scholar] [CrossRef]
- EU. EN 1991-1-6: Eurocode 1: Actions on Structures—Part 1–6: General Actions—Actions during Execution; Authority: The European Union per Regulation 305/2011, Directive 98/34/EC, Directive 2004/18/EC; EU: Brussels, Belgium, 2005. [Google Scholar]
- CCCC Highway Consultants Co., Ltd. General Specifications for Design of Highway Bridges and Culverts; China Communications Press Co., Ltd.: Beijing, China, 2015. [Google Scholar]
- Zevenbergen, L.; Arneson, L.; Hunt, J.; Miller, A.C. Hydraulic Design of Safe Bridges; Federal Highway Administration: Philadelphia, PA, USA, 2012.
- JSCE. Standard Specifications for Concrete Structures-2007, Design; Japanese Society of Civil Engineering: Tokyo, Japan, 2007. [Google Scholar]
- Australian Bridge Design Code; Standards Australia International Ltd.: Sydney, Australia, 2004.
- Yang, W.; Qin, J.; Hou, H.; Wu, W.; Zhou, L. Study on failure mechanism of flood damage to Jinsha River bridge at Zhubalong. J. Southwest Jiaotong Univ. 2022, 57, 120–128. [Google Scholar] [CrossRef]
- The Flood Peak of Baige Barrier Lake in Jinsha River is 12 Meters above the Bridge Deck. Sichuan Has Achieved “Zero Casualties”. Available online: https://www.sohu.com/a/275586924_99960442 (accessed on 31 July 2022).
- Istrati, D.; Buckle, I. Role of trapped air on the tsunami-induced transient loads and response of coastal bridges. Geosciences 2019, 9, 191. [Google Scholar] [CrossRef] [Green Version]
- McPherson, R.L. Hurricane Induced Wave and Surge Forces on Bridge Decks. Master’s Thesis, Texas A & M University, College Station, TX, USA, 2010. Available online: https://hdl.handle.net/1969.1/ETD-TAMU-2008-08-48 (accessed on 31 July 2022).
- Cuomo, G.; Shimosako, K.-I.; Takahashi, S. Wave-in-deck loads on coastal bridges and the role of air. Coast. Eng. 2009, 56, 793–809. [Google Scholar] [CrossRef]
- Bozorgnia, M.; Lee, J.-J.; Raichlen, F. Wave structure interaction: Role of entrapped air on wave impact and uplift forces. Coast. Eng. Proc. 2010, 1, 57–59. [Google Scholar] [CrossRef]
- Seiffert, B.R.; Ertekin, R.C.; Robertson, I.N. Wave loads on a coastal bridge deck and the role of entrapped air. Appl. Ocean Res. 2015, 53, 91–106. [Google Scholar] [CrossRef]
- Bricker, J.D.; Kawashima, K.; Nakayama, A. CFD analysis of bridge deck failure due to tsunami. In Proceedings of the International Symposium on Engineering Lessons Learned from the 2011 Great East Japan Earthquake, Tokyo, Japan, 1–4 March 2012; pp. 1–4. Available online: https://www.jaee.gr.jp/event/seminar2012/eqsympo/pdf/papers/193.pdf (accessed on 31 July 2022).
- Bricker, J.D.; Nakayama, A. Contribution of trapped air, deck superelevation, and nearby structures to bridge deck failure during a tsunami. J. Hydraul. Eng. 2014, 140, 05014002. [Google Scholar] [CrossRef]
- Salem, H.; Mohssen, S.; Kosa, K.; Hosoda, A. Collapse analysis of Utatsu Ohashi Bridge damaged by Tohuku Tsunami using applied element method. J. Adv. Concr. Technol. 2014, 12, 388–402. [Google Scholar] [CrossRef] [Green Version]
- Istrati, D.; Buckle, I.G.; Lomonaco, P.; Yim, S.; Itani, A. Tsunami induced forces in bridges: Large-scale experiments and the role of air-entrapment. Coast. Eng. Proc. 2017, 35, 30. [Google Scholar] [CrossRef] [Green Version]
- Azadbakht, M. Tsunami and Hurricane Wave Loads on Bridge Superstructures. 2013. Available online: https://ir.library.oregonstate.edu/concern/graduate_thesis_or_dissertations/pg15bh86v (accessed on 31 July 2022).
- Istrati, D.; Buckle, I.; Lomonaco, P.; Yim, S.; Itani, A. Large-scale experiments of tsunami impact forces on bridges: The role of fluid-structure interaction and air-venting. In Proceedings of the 26th International Ocean and Polar Engineering Conference, Rhodes, Greece, 26 June 2016; Available online: https://onepetro.org/ISOPEIOPEC/proceedings-abstract/ISOPE16/All-ISOPE16/ISOPE-I-16-456/16865 (accessed on 31 July 2022).
- Lau, T.L.; Ohmachi, T.; Inoue, S.; Lukkunaprasit, P. Experimental and Numerical Modeling of Tsunami Force on Bridge Decks; InTech Rijeka: Rijeka, Croatia, 2011. [Google Scholar] [CrossRef] [Green Version]
- Motley, M.R.; Wong, H.K.; Qin, X.; Winter, A.O.; Eberhard, M.O. Tsunami-induced forces on skewed bridges. J. Waterw. Port Coast. Ocean. Eng. 2016, 142, 04015025. [Google Scholar] [CrossRef]
- Yang, W.; Wen, Z.; Li, F.; Li, Q. Study on tsunami force mitigation of the rear house protected by the front house. Ocean Eng. 2018, 159, 268–279. [Google Scholar] [CrossRef]
- Yang, W.; Zhu, Q.; Lai, W.; Li, F. Study on anti-tsunami optimization design of bridge pier: A new type bridge pier. Ocean Eng. 2020, 213, 107701. [Google Scholar] [CrossRef]
- Yang, W.; Lai, W.; Zhu, Q.; Zhang, C.; Li, F. Study on generation mechanism of vertical force peak values on T-girder attacked by tsunami bore. Ocean Eng. 2020, 196, 106782. [Google Scholar] [CrossRef]
- Patil, S.; Kostic, M.; Majumdar, P. Computational fluid dynamics simulation of open-channel flows over bridge-decks under various flooding conditions. In Proceedings of the 6th WSEAS International Conference on FLUID MECHANICS (FLUIDS’09), Ningbo, China, 10 January 2009; pp. 114–120. Available online: https://citeseerx.ist.psu.edu/viewdoc/download?doi=10.1.1.531.4940&rep=rep1&type=pdf (accessed on 31 July 2022).
- Wu, L. Study on the Tsunami Forces of the Superstructure of the Medium and Small Span Bridges. Southwest Jiaotong University. 2017. Available online: https://kns.cnki.net/kcms/detail/detail.aspx?dbcode=CMFD&dbname=CMFD201702&filename=1017142262.nh&uniplatform=NZKPT&v=suMANFcKpgin2zl5fZoeTPIuMOIFEG8CMbKL4uy5S741s7XLFZrz0jQMni8ma4rg (accessed on 31 July 2022).
- Wen, Z. Study on the Tsunami Forces and Damage Characteristics of the Low Rise Masonry Buildings. Southwest Jiaotong University. 2018. Available online: https://kns.cnki.net/kcms/detail/detail.aspx?dbcode=CMFD&dbname=CMFD201802&filename=1018825379.nh&uniplatform=NZKPT&v=yTkJu6SEctulhb7lNg_RDR67FvPFqXPPtFBsyBIPIHucuMtfAfQZy8ys-iZoUV6u (accessed on 31 July 2022).
- Xiang, T.; Istrati, D. Assessment of extreme wave impact on coastal decks with different geometries via the arbitrary lagrangian-eulerian method. J. Mar. Sci. Eng. 2021, 9, 1342. [Google Scholar] [CrossRef]
- Istrati, D.; Hasanpour, A. Numerical Investigation of Dam Break-Induced Extreme Flooding of Bridge Superstructures. In Proceedings of the 3rd International Conference on Natural Hazards & Infrastructure, 2021–2022, Athens, Greece, 5–7 July 2022; Available online: https://www.researchgate.net/publication/362108279_Numerical_Investigation_of_Dam_Break-Induced_Extreme_Flooding_of_Bridge_Superstructures (accessed on 1 August 2022).
- Istrati, D.; Buckle, I.G. Tsunami Loads on Straight and Skewed Bridges–Part 1: Experimental Investigation and Design Recommendations (No. FHWA-OR-RD-21-12). Oregon. Dept. of Transportation. Research Section. 2021. Available online: https://rosap.ntl.bts.gov/view/dot/55988 (accessed on 31 July 2022).
- Istrati, D.; Buckle, I.G. Tsunami Loads on Straight and Skewed Bridges–Part 2: Numerical Investigation and Design Recommendations (No. FHWA-OR-RD-21-13). Oregon. Dept. of Transportation. Research Section. 2021. Available online: https://rosap.ntl.bts.gov/view/dot/55947 (accessed on 31 July 2022).
- Istrati, D.; Hasanpour, A.; Buckle, I. Numerical investigation of tsunami-borne debris damming loads on a coastal bridge. In Proceedings of the 17 World Conference on Earthquake Engineering, Sendai, Japan, 13–18 September 2020; Available online: https://www.researchgate.net/publication/342027873_Numerical_Investigation_of_Tsunami-Borne_Debris_Damming_Loads_on_a_Coastal_Bridge (accessed on 31 July 2022).
Publisher’s Note: MDPI stays neutral with regard to jurisdictional claims in published maps and institutional affiliations. |
© 2022 by the authors. Licensee MDPI, Basel, Switzerland. This article is an open access article distributed under the terms and conditions of the Creative Commons Attribution (CC BY) license (https://creativecommons.org/licenses/by/4.0/).