Article

Numerical Experiments of Temperature Mixing and Post-Storm Re-Stratification over the Louisiana Shelf during Hurricane Katrina (2005)

by
Mohammad Nabi Allahdadi
1,*,
Chunyan Li
2 and
Nazanin Chaichitehrani
1
1
Department of Marine, Earth, and Atmospheric Sciences, North Carolina State University, Raleigh, NC 27695, USA
2
Department of Oceanography and Coastal Sciences, Louisiana State University, Baton Rouge, LA 70803, USA
*
Author to whom correspondence should be addressed.
J. Mar. Sci. Eng. 2022, 10(8), 1082; https://doi.org/10.3390/jmse10081082
Submission received: 29 June 2022 / Revised: 29 July 2022 / Accepted: 1 August 2022 / Published: 7 August 2022
(This article belongs to the Special Issue Latest Advances in Physical Oceanography)

Abstract

:
Studying mixing and re-stratification during and after hurricanes have important implications for the simulation of circulation and bio-geochemical processes in oceanic and shelf waters. Numerical experiments using FVCOM on an unstructured computational mesh were implemented to study the direct effect of hurricane winds on the mixing and temperature redistribution of the stratified Louisiana shelf during Hurricane Katrina (2005), as well as the post-storm re-stratification timescale. The model was forced by Katrina’s wind stress obtained from a combination of H-Wind database and NCEP model. The climatological profiles of temperature and salinity for August (the month in which Katrina occurred) from the world ocean atlas (WOA, 2013) were used as the pre-storm conditions over the shelf. Model results for sea surface temperature (SST) and mixed layer depth (MLD) were validated versus SST data from an optimally interpolated satellite product, and the MLD was calculated from the heat budget equation of the mixed layer. Model results were used to examine the temporal and spatial responses of SST and MLD over the shelf to Katrina. Results showed that intense mixing occurred within 1–1.1 RMW (RMW is the radius of maximum wind for Katrina), with turbulent mixing as the dominant mixing force for regions far from the eye, although upwelling was an important contributor to modulating SST and MLD. During the peak of Katrina and for the shelf regions severely affected by the hurricane wind, three distinct temperature zones were formed across the water column: an upper mixed layer, a transition zone, and a lower upwelling zone. Shelf re-stratification started from 3 h to more than two weeks after the landfall, depending on the distance from the track. The mixing during Hurricane Katrina affected the seasonal summertime hypoxic zone over the Louisiana shelf and likely contributed to the water column re-oxygenation.

1. Introduction

Tropical storms, including hurricanes, can cause ocean surface cooling, turbulent mixing, and inertial motions, as addressed in many studies in the last few decades. Field and satellite observations, as well as numerical models, have been extensively used to study the oceanic response and the mixing induced by tropical storms (e.g., [1,2,3,4,5,6,7,8]). Heat loss to the storm, entrainment by turbulent mixing, and advection all contribute to the mixed layer heat budget [4]. Entrainment by turbulent mixing is the primary mechanism of the deepening of the mixed layer [3,4]. Within the radius of the maximum wind (RMW), the surface divergence caused by the cyclonic wind and the Ekman effect enhance upwelling and reduce the mixed layer depth (MLD). For most tropical cyclones, rightward bias causes the maximum MLD deepening and surface cooling to occur just beyond the radius of maximum wind on the right side of the track [3,9]. However, at any given time, the MLD decreases as the radial distance increases from 1 RMW, where surface convergence produces downwelling [10].
In coastal and inner-shelf waters, even though the responses have some similarity to those in the deep water, bottom topography and coastal boundary can further modulate the SST and MLD responses [11]. Near-inertial oscillations in the post-storm stage are mostly present in water depths larger than 70 m [11]. Over the shelf regions with water depth ~50 m or less, oscillations are significantly damped as a result of bottom friction [12]. Temperature and salinity variations in shallow water during hurricanes have been less studied, and yet they are important variables characterizing stratification. Several studies examined SST variations, and other shelf responses to hurricanes (e.g., [13,14,15]). Spekhart [14] (https://libres.uncg.edu/ir/uncw/f/speckhartb2004-1.pdf, accessed on 28 June 2022) used field measurements of wind, current, temperature, and salinity to study the response of Onslow Bay, NC, to three consecutive hurricanes, namely Dennis, Floyd, and Irene, within a two-month period in the fall of 1999. Analysis showed that strong inertial oscillations associated with the hurricanes in deep waters were significantly damped in shallow water. The strong shear induced by Hurricane Dennis, lasting an extended amount of time, caused the sea surface temperature to drop by about 3 degrees, producing a completely mixed water column. Consequently, the water appeared as barotropic during the time while Dennis was translating along the coast, even at water deeper than 70 m. Modeling studies of mixing induced by hurricanes over shallow and estuarine waters are scant [12,16]. Li et al. [16] applied a high-resolution ocean model ROMS coupled with the atmospheric model MM5 to simulate the temporal and spatial response of temperature and salinity in the Chesapeake Bay to Hurricane Isabel, which made its landfall southeast of the Bay in September 2003. Results showed that the pre-storm strong salinity stratification was completely destroyed, due to the hurricane-induced current shear and vertical turbulence. Hence, a complete mixing was dominant along the axis of the Bay, even at water depths as large as 25 m. The simulated temperature and salinity across the water column showed that the fully mixed state lasted for several hours after the peak of the hurricane. The stratification started to rebound several hours after the hurricane (reaching a significant stratification after one day), due to a large density gradient within the estuary.
The understanding of the detailed behavior of the temperature and salinity response of the shelf/estuarine waters to a hurricane still needs a significant amount of effort, especially the mixing pattern and the re-stratification timescale after the hurricane. Understanding water column mixing and post-storm stratification over the oceanic and shelf waters has several important implications in studying and simulating the circulation and dynamics of biogeochemical parameters. From a circulation viewpoint, a mixed water column can inhibit the wind or tide energy with the mixed layer amplifying surface currents that also affect the circulation pattern at other depths across the water column, while a pre-mixed water column can cause a very different circulation pattern, compared to a pre-stratified one [17,18]. Mixing the water column can substantially contribute to the transport of biogeochemical substances from the water surface to the euphoric zone and vice versa [19]. One significant impact is redistributing the dissolved oxygen across the water column. This could cause re-oxygenation of depth waters in the regions with a low concentration of dissolved oxygen. This re-aeration is especially important for the Louisiana shelf in the northern Gulf of Mexico, which inhibits the world’s second-largest seasonal hypoxic zone [20,21]. Observations showed that passing a hurricane in the hypoxic times during the summertime can significantly re-oxygenate the hypoxic shelf waters in a span of days to weeks [20]. Mixing deep, cold, nutrient-rich waters with warmer surface waters as a result of both turbulent mixing and upwelling can substantially enhance biological activities across the water column, including phytoplankton blooms that are essential components of biogeochemical processes in the ocean that affect the oceanic food web [19,22]. Compared to a region with a mixed water column, a stratified shelf/oceanic region with high heat content can significantly enhance the hurricanes and upgrade their intensity, since the upper ocean actively interacts with hurricanes and provides the heat energy for the formation and intensifies them [2,3].
Among all the physical aspects of mixing induced by a hurricane, the direct contribution of hurricane wind and entrainment by turbulence in the process are of particular interest. Therefore, the 3D dynamics of the response within an appropriate timescale need to be fully investigated. The present study attempts to provide such a high-resolution model by simulating the response of the stratified Louisiana shelf to Hurricane Katrina. The major focus of this modeling study is understanding the direct role of entrainment by turbulent mixing on SST cooling and deepening of the mixed layer. High spatial and temporal resolution results for water temperature across the water column and over the modeling area are used to examine shelf response to the turbulent mixing entrainment caused by Katrina. The examined results include maps of SST and bottom temperature at different times during and after Katrina, the timeseries of water temperature across the depth at different locations, shelf-wide water temperature, and cross-shelf water temperature at different transects. These outputs were used to deduce the patterns of shelf mixing and re-stratification during and after passing the hurricane. To our knowledge, this study provides new results and enhances the understanding of mechanisms of shelf mixing and re-stratification during and after a hurricane. Although a fully baroclinic model, including both heat and salt equations, has been used, the focus of this study is to study the response of water temperature to the hurricane, and the model verification has only been done using the temperature data. Hence, only the results for temperature response at the surface and across the water column are presented.

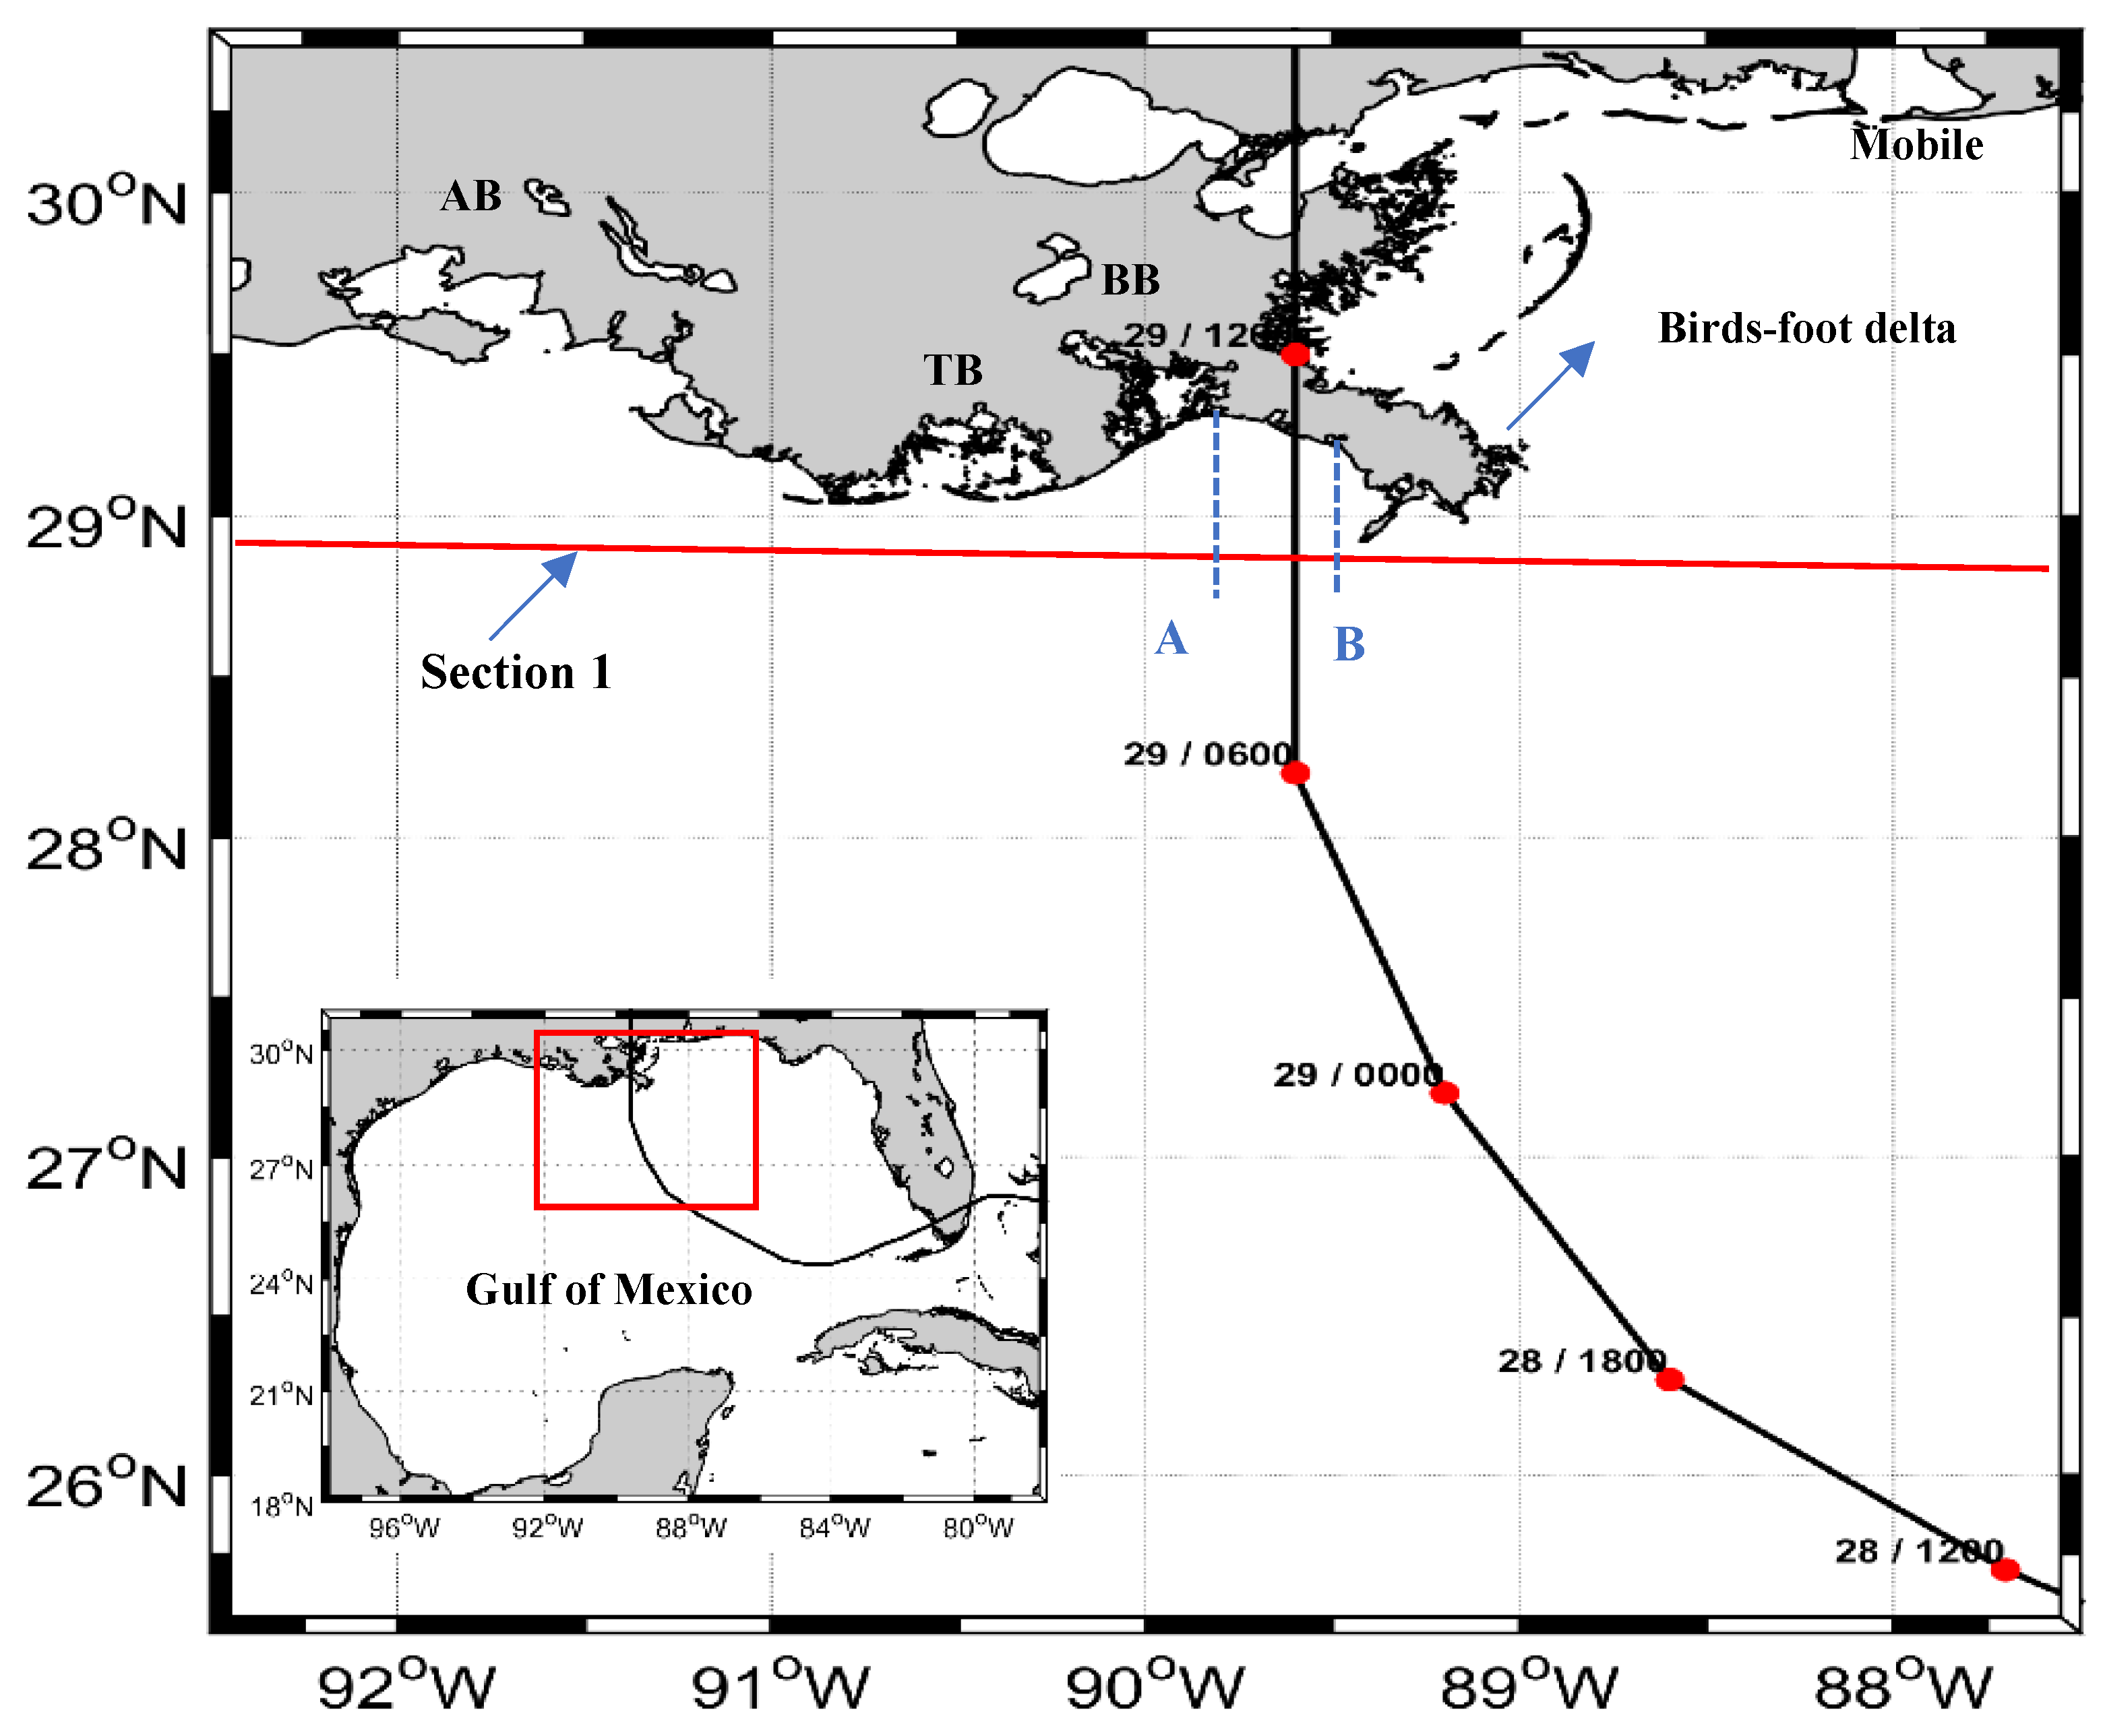
2. Study Area/Hurricane Katrina

The study area of this paper is the Louisiana continental shelf in the northern Gulf of Mexico (Figure 1). The response of this relatively shallow shelf to hurricanes can be affected by bathymetry and coastal geometry. Weak wind stress and low energy waves in the summer (Mid-June to Mid-September), along with intense solar insulation, produce a stratified layer over the shelf during this season [23,24]. This stratified layer that can significantly contribute to the bottom water hypoxia [25] may be broken down by the occasional passes of tropical storms/hurricanes formed and passing over the shelf, mostly from August to October [26]. Hurricane Katrina was one of the most disastrous hurricanes in U.S. history with respect to its damages and impacted both the east and west of the Mississippi birds foot delta. Hurricanes Andrew (1992), Ivan (2004), Gustave (2009), and Ike (2009) are other examples of devastating hurricanes that caused substantial damage and fatalities in the northern Gulf of Mexico and Louisiana shelf. Starting as a tropical depression over the Bahamas on 23 August 2005 [27], Katrina reached a category 5 Hurricane on 28 August after passing over the warm waters associated with the Loop Current [28]. The hurricane degraded to some extent as it approached the Louisiana shelf. In the early morning (UTC) on 29 August, as a category 3 hurricane, it made its first landfall between the Grand Isle, LA, and the Mississippi River mouth. Figure 1 shows the track of Hurricane Katrina as it traveled in the northern Gulf of Mexico.

3. Material and Methods

3.1. Numerical Model

In the present study, simulations of current and salt/heat transport were done using FVCOM, which is a prognostic, unstructured-grid, finite-volume, free-surface, three-dimensional (3D) primitive equation (Navier–Stokes equations along with a nonlinear equation of state, which couples temperature and salinity to the fluid velocity) ocean model [29]. The main equations solved by the model include the momentum balance, continuity, energy conservation (for solving temperature), and mass conservation (for solving salinity). The formulation assumes a hydrostatic pressure balance in the water column. The momentum equation used the Boussinesq approximation to deal with the density variations. This is a reasonable assumption for most oceanic, coastal, and estuarine waters. To close the system of equations for horizontal momentum, thermal and salt diffusion terms, vertical eddy viscosity coefficient, and thermal vertical eddy diffusion coefficient should be provided or calculated. Horizontal diffusive terms are obtained based on the Smagorinsky turbulent closure scheme for horizontal mixing. The vertical eddy viscosity and diffusivity parameters are estimated using the Mellor–Yamada level 2.5 turbulence closures. The closure includes two differential equations that solve q and l (0.5 q 2   is the turbulent kinetic energy, and l is the turbulent macro scale) that are used for the calculation of vertical eddy viscosity and diffusivity. The closure differential equation is similar to the basic Navier–Stokes equations and includes local, adjective, and diffusive terms, as well as source terms (please see [29] for more details on the equations). The equations for K m   (vertical eddy viscosity for momentum) and K h (vertical eddy diffusivity for temperature and salinity) are:
K m = l q S m ,     K h = l q S h
Parameter S m and S h are functions of q, l, and the gradient Richardson number at each depth.
Due to the existence of internal waves before the beginning of simulation, a background eddy viscosity ( K b ) is added to K m . In this paper K b was used as one of the tuning parameters. The other parameter is the constant for calculating turbulent energy dissipation ( B 1 ). The following relationship controls the rate of kinetic energy dissipation in Mellor–Yamada closure:
ε = q 3 / ( B 1 l )
Here, ε is the rate of kinetic energy dissipation and B 1   is a coefficient with a value between 4 and 25.

3.2. Model Setup

The response to Katrina over the Louisiana shelf was simulated using a modeling area with a circular open boundary. The area extends from Mobile, Alabama, to the Sabine Bank, Texas, and comprises the inner Louisiana shelf, its shallow regions, and deep outer-shelf waters (Figure 2a). FVCOM uses a finite volume numerical scheme for solving the governing equations. Hence, an unstructured computational mesh based on triangular elements, which was refined over the shelf, is used (Figure 2b). The mesh and the associated bathymetry were generated in SMS software. The depth data from National Geophysical Data Center (NGDC, https://www.ngdc.noaa.gov, accessed on 1 December 2021) were imported to SMS and were interpolated to the mesh grid points to make the final model bathymetry. Mesh resolution varies from 10 km along the offshore boundary to about 500 m over the inner shelf. In the vertical direction, 25 sigma layers with higher resolutions at the surface and bottom are considered.
Katrina’s wind field was generated by combining the H-WIND database (https://www.rms.com/event-response/hwind, accessed on 28 June 2022) and NCEP reanalysis (https://psl.noaa.gov/data/gridded/data.ncep.html, accessed on 28 June 2022) wind fields. This approach resulted in a high-resolution wind field (spatial resolution of 6 km) that benefits from the high quality and high resolution of H-WIND for the hurricane region and a reliable background wind field for remote regions from the eye of the hurricane provided by NCEP. Compared with observed wind speeds at several National Data Buoy Center (NDBC) and Wave-Current-Surge Information System (WAVCIS) stations, including 42040, BURL1, CSI6, and CSI-5, all located on the western or eastern Louisiana shelf, correlation coefficients (R2) as high as 0.92 and root mean square errors (RMSE) as low as 1.0 m/s were obtained [24,30]. Examples of the resulting wind field for 29 August 2005 before and during the first Katrina’s landfall are shown in Figure 3.
Since the main objective of the present work is to examine the shelf response and mixing characteristics induced by Hurricane Katrina’s wind without any other external forces, no out-shelf boundary condition (and no tide) was prescribed along the open boundary. In order to avoid instabilities caused by the reflected waves from the boundary, the explicit Orlanski radiation (ORE) was used as the boundary condition, along with the appropriate numbers of sponge layers. Further details about the model setup and verification versus field data can be found in Allahdadi and Li [24]. The heat exchange between the hurricane and the water surface was not included because the major contribution to mixed layer deepening is turbulent entrainment [4,10]. Furthermore, studying the direct effect of wind on the SST and MLD over the shelf was the primary goal of this study. The pre-storm oceanic heat and salt content are prescribed by initial vertical temperature and salinity profiles. Selecting appropriate distributions for these profiles is crucial for a high-accuracy simulation of the response of the water column to the hurricane since it defines the gradients across the thermocline that affects the deepening rate of the mixed layer [10]. However, data over the Louisiana inner and outer shelves are scarce just before Katrina. Hence, the climatological profiles of temperature and salinity from the World Ocean Atlas (WOA) database for August (the month in which Katrina occurred) were selected as the initial condition (http://www.nodc.noaa.gov/access/allproducts.html, accessed on 1 December 2021). Temperature profiles of WOA for eight points over the Louisiana shelf have been shown in Figure 4. The profiles show average conditions in August for each station that can be altered by intense mixing forces caused by severe storms, such as hurricanes. The mixed water column will be restored to its non-disturbed condition after the mixing force was removed, likely due to the pressure gradient balance. Climatological profiles have successfully been used to study upper ocean response to tropical storms (e.g., [6,31]). Since the objective is to study the destruction and resumption of stratification because of hurricane-induced mixing, this approach is reasonable because hurricane’s alteration to the vertical hydrography is significantly greater than the relatively small variations of normal conditions from the climatological mean.

3.3. Model Verification

Although the aim of the present study is not to provide a fully realistic hurricane-induced mixing by including all forces, it would be helpful to validate model results with some observations to make sure that the model correctly simulates wind-induced mixing. This can be a reasonable approach since, based on several studies, up to 90% of the mixed-layer heat budget corresponds to the entrainment caused by vertical mixing (in this case by hurricane winds). Water temperature/salinity profiles are controlled by the vertical turbulent mixing, which is resolved using the Mellor–Yamada level 2.5 turbulent closure. Two associated parameters, including the background vertical eddy viscosity ( K b ) and energy dissipation coefficient (B1), can be used to tune the vertical turbulent flux in the model. The model’s simulated SST and MLD need to be verified, since they will be used for further analysis. Regarding the scarcity of temperature field data, especially temperature vertical profiles during Hurricane Katrina, satellite data of SST can be used for model verification. Satellite sensors, such as MODIS, provide a relatively high spatial resolution (1 km) images of SST with daily time resolution. However, the extensive cloud coverage during Katrina’s impact on the Louisiana shelf contaminated satellite measurements of SST from MODIS and AVHRR, as the measurements are based on infrared and near-infrared wavelength bands. These wavelengths are absorbed by atmospheric water vapor. Since water vapor is transparent to microwave band, SST derived from microwave band can be used for hurricane period. The microwave optimally interpolated (MW-OI) SST is reliable for model evaluation [6,31]. Data are accessible from the remote sensing systems (www.remss.com, accessed on 28 June 2022). A more recent product combines the measurement by microwave band and the infrared measurement to provide high-resolution (9 km) SST maps for both inner-shelf and outer-shelf regions. SST data from MW-OI are available daily at about 12:00 UTC. It should be noted that the cloudiness itself has an important influence on the origin of tropical storms [32,33], but in this case, it contaminates the measurement of sea surface temperature through traditional infrared/near-infrared channels.
Several sets of background vertical eddy viscosity ( K b ) and energy dissipation coefficient (B1) were considered to obtain the best match with SST data. Values for K b were between 0.000001 and 0.01, while B1 values ranged from 4 to 25. A comparison of simulated SST with that from MW-OI data for several days before and after Katrina’s landfall showed that the case with K b = 0.00001 and B1 = 8 resulted in the best match. Figure 5 shows an example of the comparison between MW-OI-derived temperatures and the model simulation results for the best match case for 30 August 2005 at 12:00 UTC, several hours after the landfall, as it is seen. Model and satellite measurements show smaller SST on the right side of the track and higher values on the left. The minimum SST from both data and model is 25–25.5 °C. In both figures, the effect of shelf-break on separating high and low SST regions in the inner and outer-shelf is clear (the yellow color corresponding to SST of 28°C). The higher simulated SSTs in the coastal and the remote regions on the left side of the track could be due to using the climatological temperature/salinity profiles instead of the real pre-storm profiles, which were, unfortunately, unavailable due to lack of observations. Since the simulated SSTs are consistent with satellite data, mainly in the vicinity of the track, we are using them to analyze and further investigate the shelf temperature response to Katrina.
With a lack of field measurements over the Louisiana shelf during Hurricane Katrina, the MLD values were calculated using the MW-OI-derived SST data based on an approach suggested by Pan and Sun [31]. They assumed that the turbulence entrainment at the base of the mixed layer accounts for most of the mixed layer heat budget and the effect of advection and surface heat flux is minor [1,4,5]. A relationship for estimating MLD is thus used [31]:
T = 1 D D 0 T 0 ( z ) d z
in which T is the current mixed layer temperature, which is the same as the satellite-derived SST at the time of interest (e.g., a time after the hurricane passed), D is mixed layer depth, and T0 (z) is the pre-storm temperature at depth z. Equation (3) was used for finding the mixed layer depth (MLD or D) by using the temperature profiles presented in Section 3.2 as T0 (z). With this approach, the MLD is roughly inversely proportional to the logarithm of SST (Figure 6). This relationship was applied to the MW-OI-derived SST data, producing the MLD maps for different days during Hurricane Katrina. Figure 7 show an example of the calculated MLD over the shelf in comparison to the simulated MLD using the best match parameters for 30 August 2005 at 12:00 UTC. As expected, the maximum MLD values are along the hurricane’s track, with a bias on the right-hand side, and as seen, there is a good agreement between the model and calculations in representing the maximum mixing zone. Both show a maximum mixing depth of 70–80 m on the right side of the track. However, it should be noted that the MLD values within the upwelling area (about 1 RMW from the hurricane’s track) should be used with caution [31]. The discrepancies between MLDs from the model and calculations using Equation (3) can partly be attributed to the differences between the climatological temperature profiles (used as the initial condition) with the actual profile. It also should be noted that this approach for calculating the MLD from SST data only works for regions affected by the intense hurricane winds over which the hurricane wind is the main mixing force [6]. Therefore, the mixing depths in the remote areas by the hurricane track are not applicable, nor of interest here.

4. Model Results

The numerical model experiments were done using the turbulence parameters obtained in 3.3. The model runs included about ten pre-storm days and ten days after the hurricane landed (a total of 20 days). This section discusses the distributions of temperature affected by the hurricane.

4.1. Sea Surface and Bottom Temperature from the Simulations

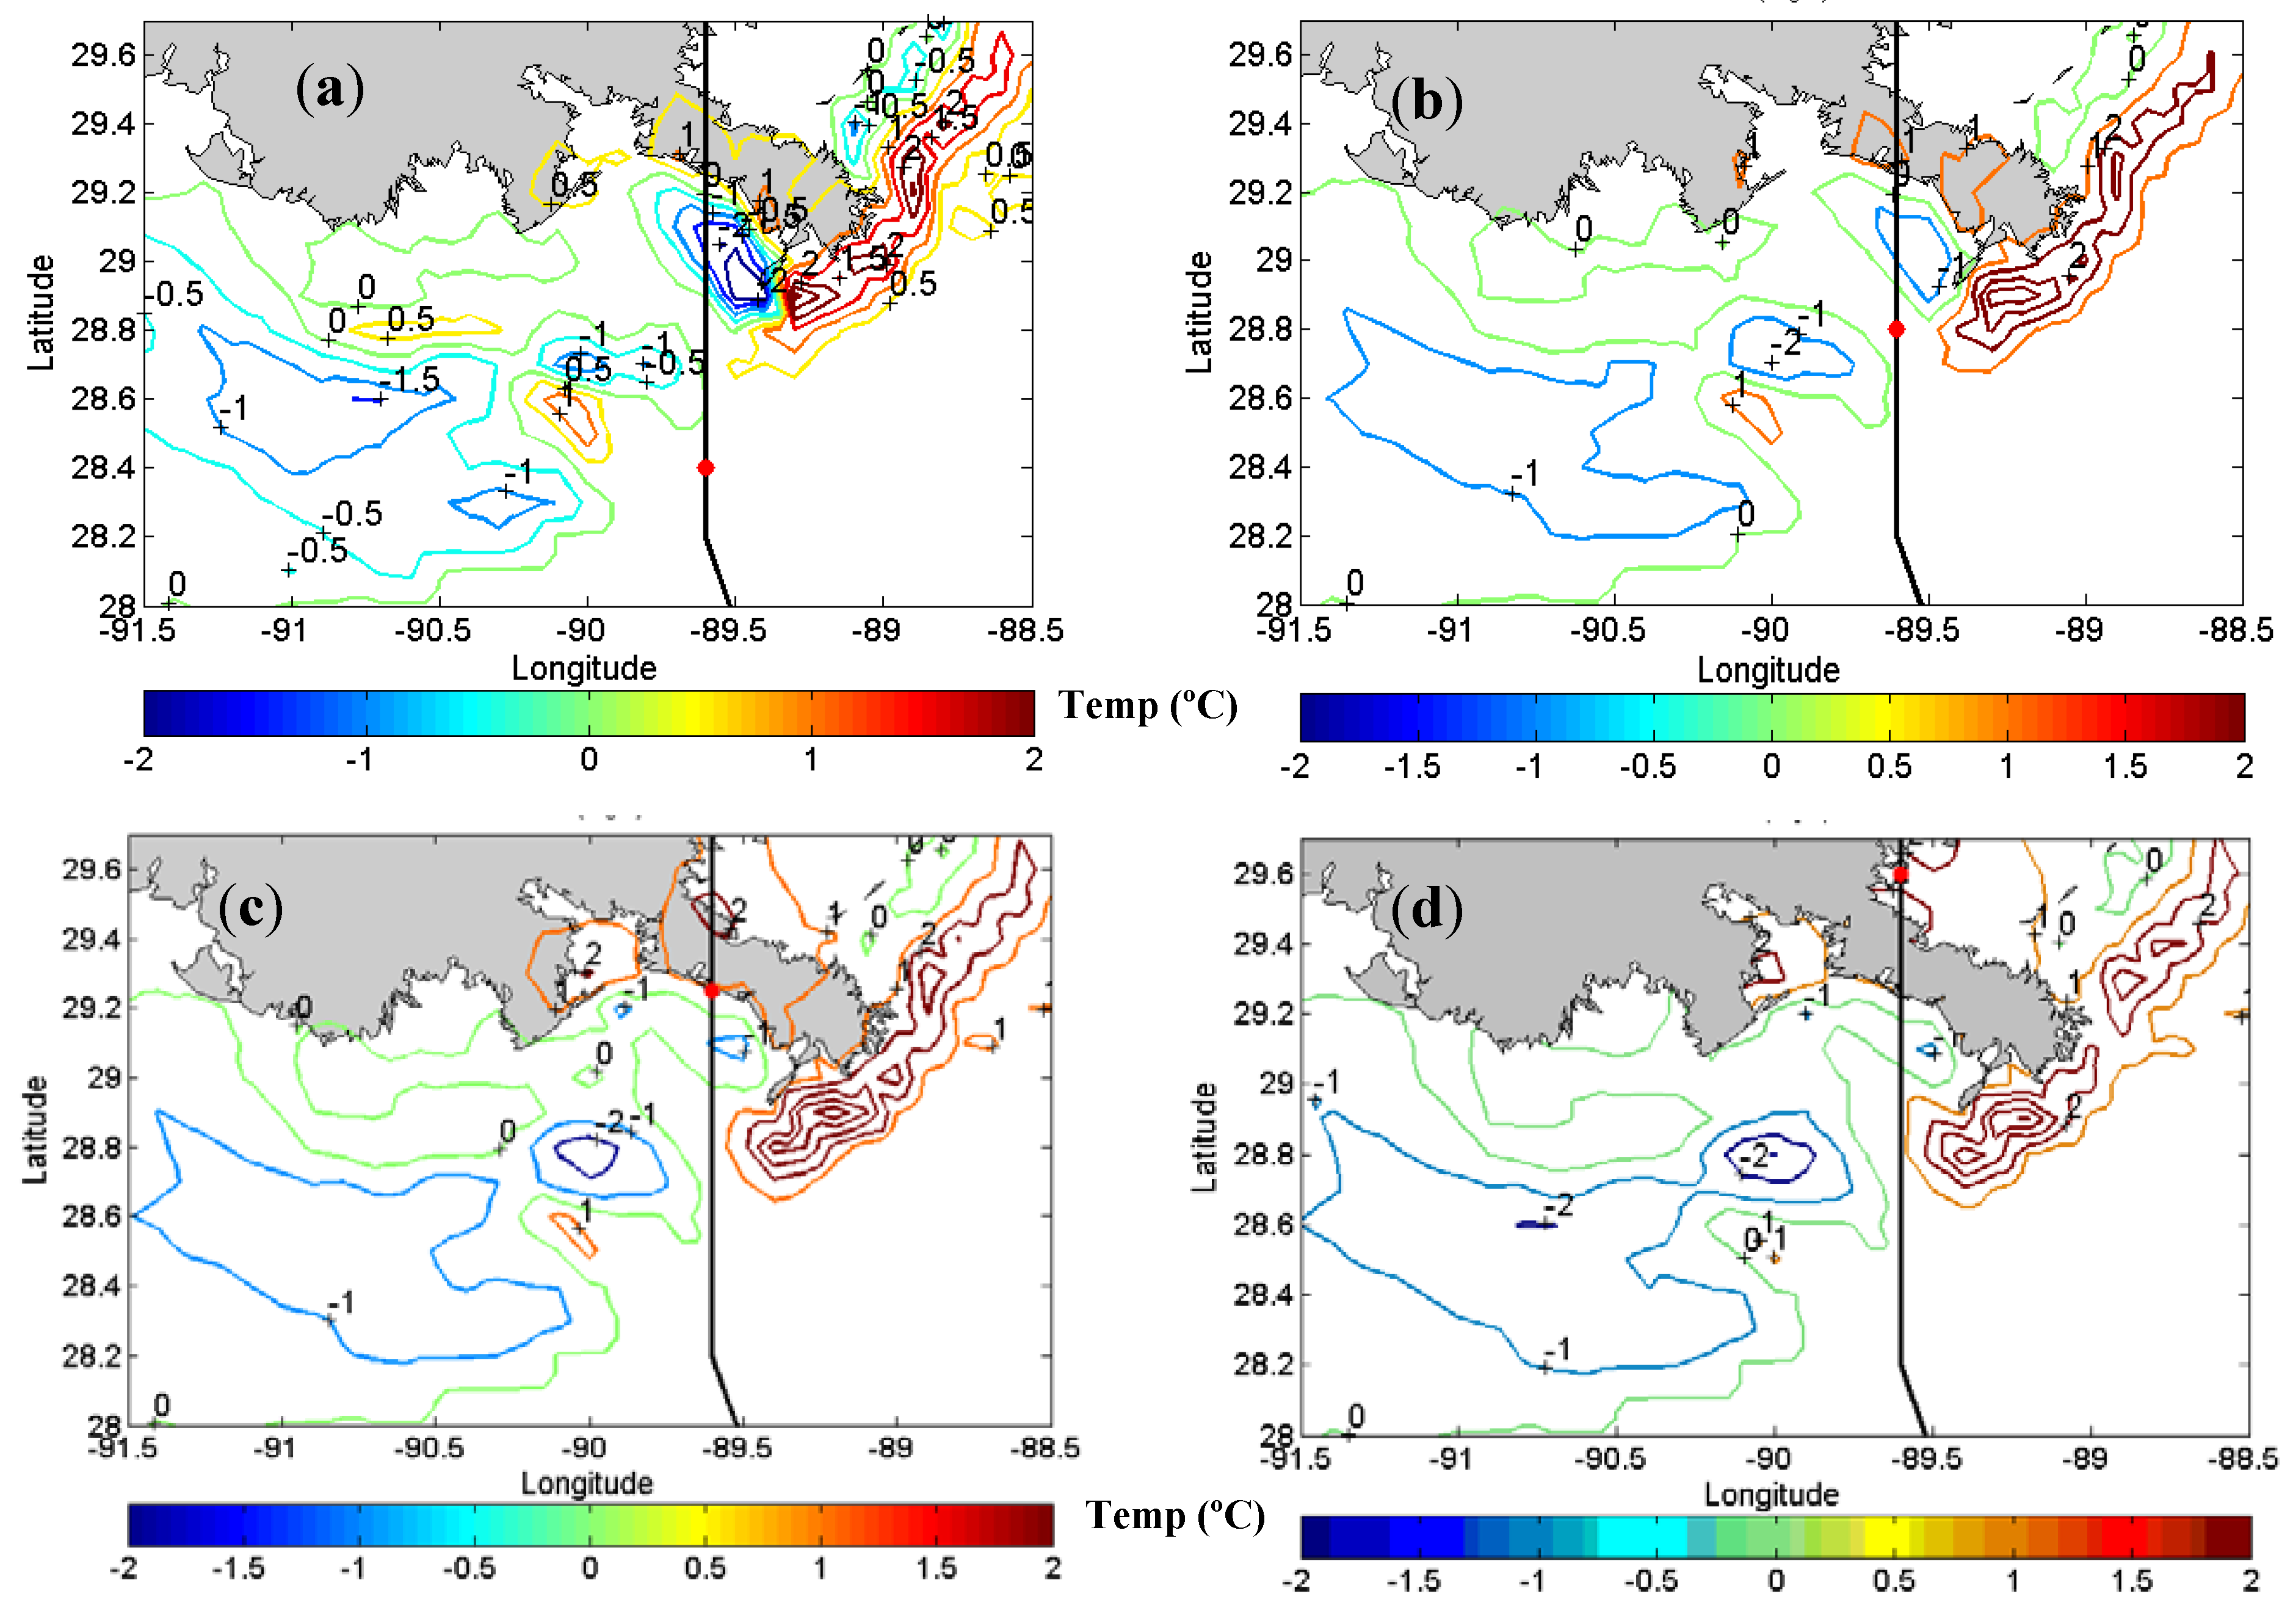
Figure 8 shows the calculated cooling induced by Hurricane Katrina over the inner and outer shelves at different times based on simulation results. The time origin for these in Figure 8 and also Figure 9 is the landfall time over the birds foot delta (landfall time is zero). Hence, all times before the landfall are negative and times after the landfall are positive. About 4 h before landfall over the birds foot delta (hour −4), the eye was located almost 80 km southwest of the birds foot delta (Figure 8a); the category four hurricane produced substantial amounts of cooling over the outer shelf. Surface cooling as large as 6 °C occurred along the track, with significantly larger cooling areas on the right side of the track. At the edge of the shelf break off the Barataria Bay and the Terrebonne Bay, the cooling was 3 °C and 2 °C, respectively. The surface cooling decreased landward and stopped at the mouth of the Terrebonne and the Atchafalaya Bay. Two hours later, when the eye was 25 km southwest of the Southwest Pass (Figure 8b), the maximum surface cooling was 1 °C. The distribution of surface cooling over the inner-shelf was similar. At landfall, the inner-shelf area on both sides of the track experienced surface cooling of 2–2.5 °C, while at the mouth of Barataria Bay and off the Terrebonne Bay, there was about a 1 °C warming (Figure 8c). The near-bottom water cooling along the lowest sigma level is shown in Figure 9. Over the inner shelf, the lowest sigma level represents the bottom water, while over the deep waters, the associated depths were generally larger than 100 m. At hour −4, the bottom water at the edge of shelf-break off the Barataria Bay had a warming of about 0.5–1 °C. There was bottom warming for the shelf-break area off the Terrebonne Bay of 1–1.5 °C. The bottom warming over this area was likely due to less surface mixing and a lower rate of warm surface water entrainment down the water column. Over the inner-shelf on the left of the track, the bottom water temperature was almost unchanged, while on the right side of the track, the decrease in bottom water temperate was 1 to 2 °C, apparently due to the hurricane-induced upwelling. Two hours later, when the eye was almost over the shelf break at the west of the birds foot delta, there was a warming over the shelf break off the Barataria Bay of about 1–2 °C. The bottom temperature over the inner shelf on the left side of the track was still unchanged. At landfall, for the next two hours, the birds foot delta area experienced the maximum warming of 1 °C over the shelf off the Terrebonne and Atchafalaya Bays, most likely due to the downwelling caused by the northwesterly/westerly hurricane winds over these areas.

4.2. Time Series of Water Temperature

To further evaluate the evolution of the hurricane-induced temperature mixing across the water column over the Louisiana shelf, the time series of vertical water temperature variations are examined at several points on both sides of the hurricane’s track (Figure 10).
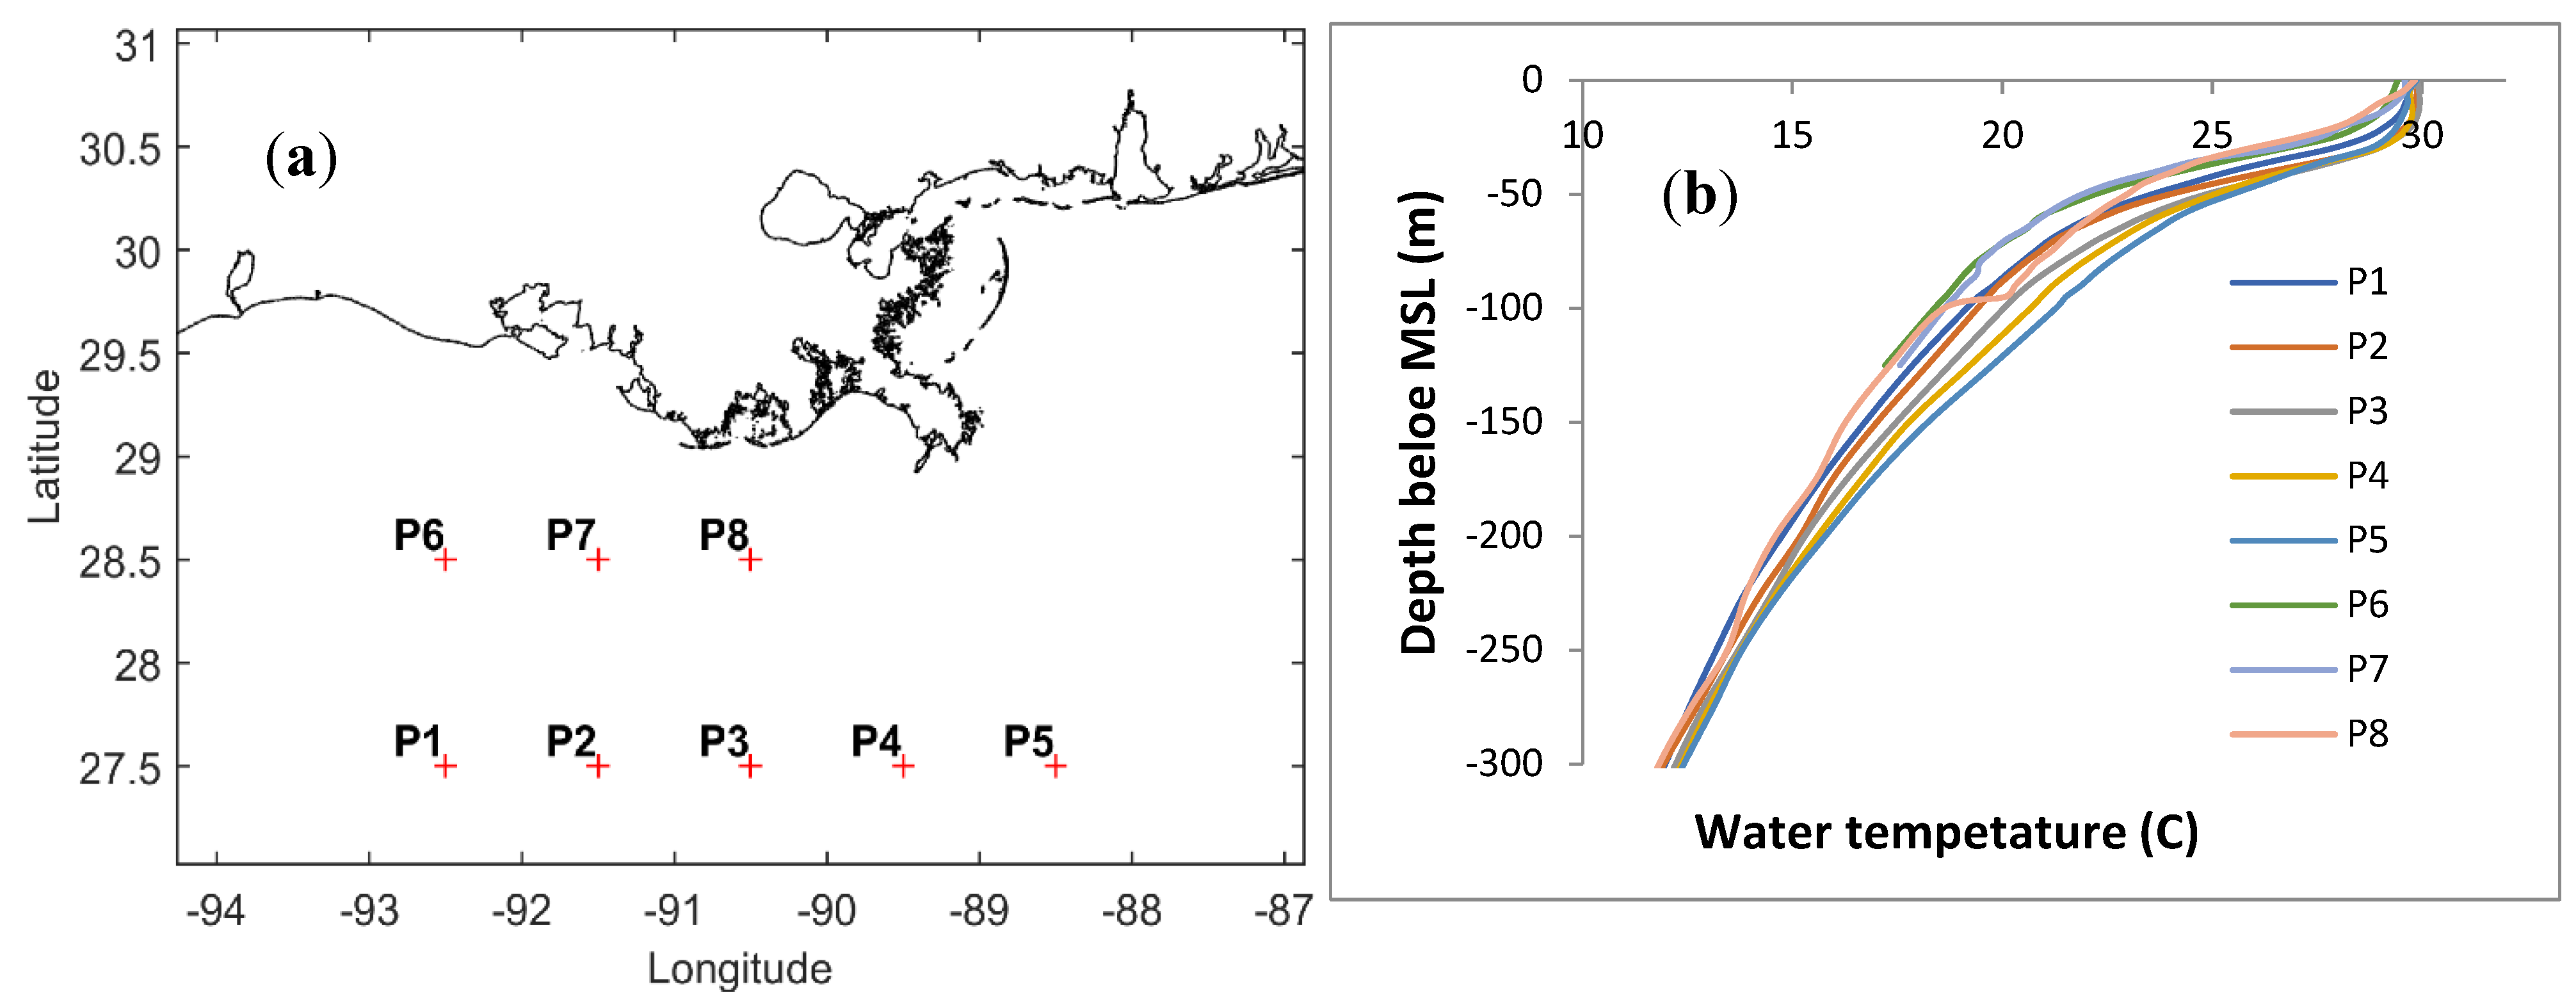
For each point, the temperature variations were investigated for 50 h before and 50 h after the time that the hurricane’s eye was right at the west of the Southwest Pass (hereafter called CP time). Hence, positive time is after the eye passed this location, while negative time is before the eye was at these locations. The timeseries’ are examined in all locations, but for the sake of brevity, only the details at P3, P4, P5, and P5 that are on the left and the right side of Katrina’s track (almost within 1 RMW) are presented (Figure 11) For each station, the upper panel timeseries show SST, while the colored contours show the vertical variations of water temperature with time). Stations P1 and P2 are far from 1 RMW, and the effect of hurricane wind on their SST and MLD are not as significant as others. Station P7 is located on the hurricane track, and its SST and MLD are affected mainly by upwelling and with less contribution by the wind-induced turbulent mixing.
Station P3 is located off the Terrebonne Bay at a water depth of 33 m about 40 km west of the hurricane’s track (left side). At hour −3, the SST dropped to about 28.6 °C, with about 2.4 °C surface cooling. This minimum was followed by a peak of 30.2°C, caused by the advection of warm water. In 10 h, turbulent mixing decreased the SST to 29.4 °C, but after the hurricane’s landfall, the SST began the relaxation phase and increased to a stable value of 29.8 °C at hour 50. The initial stratification was affected by the hurricane winds starting several hours before the CP time. An ephemeral mixed layer with a depth of 15 m and a temperature of 30.2 °C at CP time was present. During the next several hours, the MLD and temperature decreased to 12 m and 29.4 °C, respectively; and 5 m and 29.8 °C, respectively, during the relaxation phase (the post-storm time). The lower level water temperature (below ~20 m) was affected by upwelling. The coastal upwelling over the Louisiana shelf on the left side of Katrina’s eye was produced by the westerly to southwesterly hurricane winds (Figure 3). These winds were at about the landfall and beyond. Station P4 (left side of the track), with a water depth of ~30 m, was closer to the mouth of Barataria Bay and was located northeast of P3. The distance from the hurricane’s track was 25 km (note that for Katrina, the radius of maximum wind was 30–35 km over the Louisiana shelf). Hence, a more significant effect of turbulence mixing was expected at this station. SST at this location decreased almost linearly from 30.5 °C at hour −10 to 27.8 °C at hour 5. The SST rebound started after the landfall and increased to 29.6 °C at hour 50. At about hour −10, the shear entrainment mixed the surface warm water with bottom cold water down to 25 m. This significant mixing event produced a mixed layer depth of about 20 m and a temperature of about 28 °C at hour 3. The mixed layer stayed almost the same for several hours until the relaxation phase started at hour 10 when the water column started to warm again. During this period, the MLD decreased from 20 m at hour 5 to a stable value of 5 m at hour 50. The upwelling was less intense than other stations west of the track because of the closer proximity of P4 to the coastline.
The effect of Hurricane Katrina on vertical mixing on the right side of the track was investigated by examining the time series of SST and vertical temperature structures at stations P5 and P6. It is found that the shelf response on the right side is highly affected by the geometry of the birds foot delta with the rightward bias caused by the asymmetric wind of a moving hurricane. Station P5 was located northwest of the South Pass, where the water depth was about 11 m, and the distance from the hurricane’s track was about 10 km. The simulated SST at this location shows that the SST decreased from about 30.5 °C at hour −10 to 28.8 °C at hour 0, indicating 2 °C of surface cooling from the initial SST of 30.8 °C. After the hurricane passed the station, SST began to increase and reached 29.3 °C in 24 h. Afterward, the SST continued increasing at a slower rate and reached 29.5 °C at hour 50. The hurricane’s effect on the stratification at this station started at about hour −22. A change from the initial stratification started to be visible at this time. After about 24 h (at hour 2), the water column was fully mixed to about 29 °C. This was about 1 C lower than the initial water temperature at the bottom. It indicates the effect of cold water upwelling and advection from the deeper shelf areas in the south. This station remained fully mixed for the next 50 h, and the temperature increased to about 29.4 °C. Since station P5 is located within 1 RMW, its temperature was highly affected by the hurricane-induced upwelling. Station P6 was also on the right side of Katrina’s track. It was located south of the South Pass at 30 m water and was about 10 km from the track. Katrina caused 2.5 °C surface cooling at this station. The main part of the cooling started from hour −20, when the SST was about 30.5 °C. The SST decreased to about 28.5 °C at hour 10 and remained the same for the next 40 h before it started a gentle increase. The initial stratification at this station was disturbed primarily by the upwelling at about hour −10. This caused an increase of 2.5 °C in water temperature at about 25 m. Due to the station’s proximity to the outer shelf and deep waters, the recovery of water column temperature after the hurricane’s landfall was relatively slow, as illustrated by the vertical structure at hour 50.
To better understand the mixing and stratification timescale, a longer time series (15 days) of SST and vertical temperature structure are examined for P4 and P6 (not shown). At P4, SST and stratification became stable at hour 50 and exhibited consistent patterns for temperature and the MLD values over time. At this time, the SST was 1.2 °C lower than the pre-storm SST. The post-landfall temperature response at station P6 was similar to P4. However, as mentioned before, it took a longer time (longer than 50 h after the landfall) for both SST and stratification to reach a stable condition (almost constant water temperature and MLD over time). The SST on the 9th day after the landfall was still 1.5 °C lower than the initial value. Longer model results showed that this stable condition continued for at least two weeks after the landfall.

4.3. Shelf-Wide and Cross-Shelf Distribution of Temperature across the Water Column

We also examined the vertical structures of water temperature across two north–south (cross-shelf) and east–west (along-shelf) cross-sections. Figure 1 shows the locations of east–west section 1 and north–south cross-sections A and B.
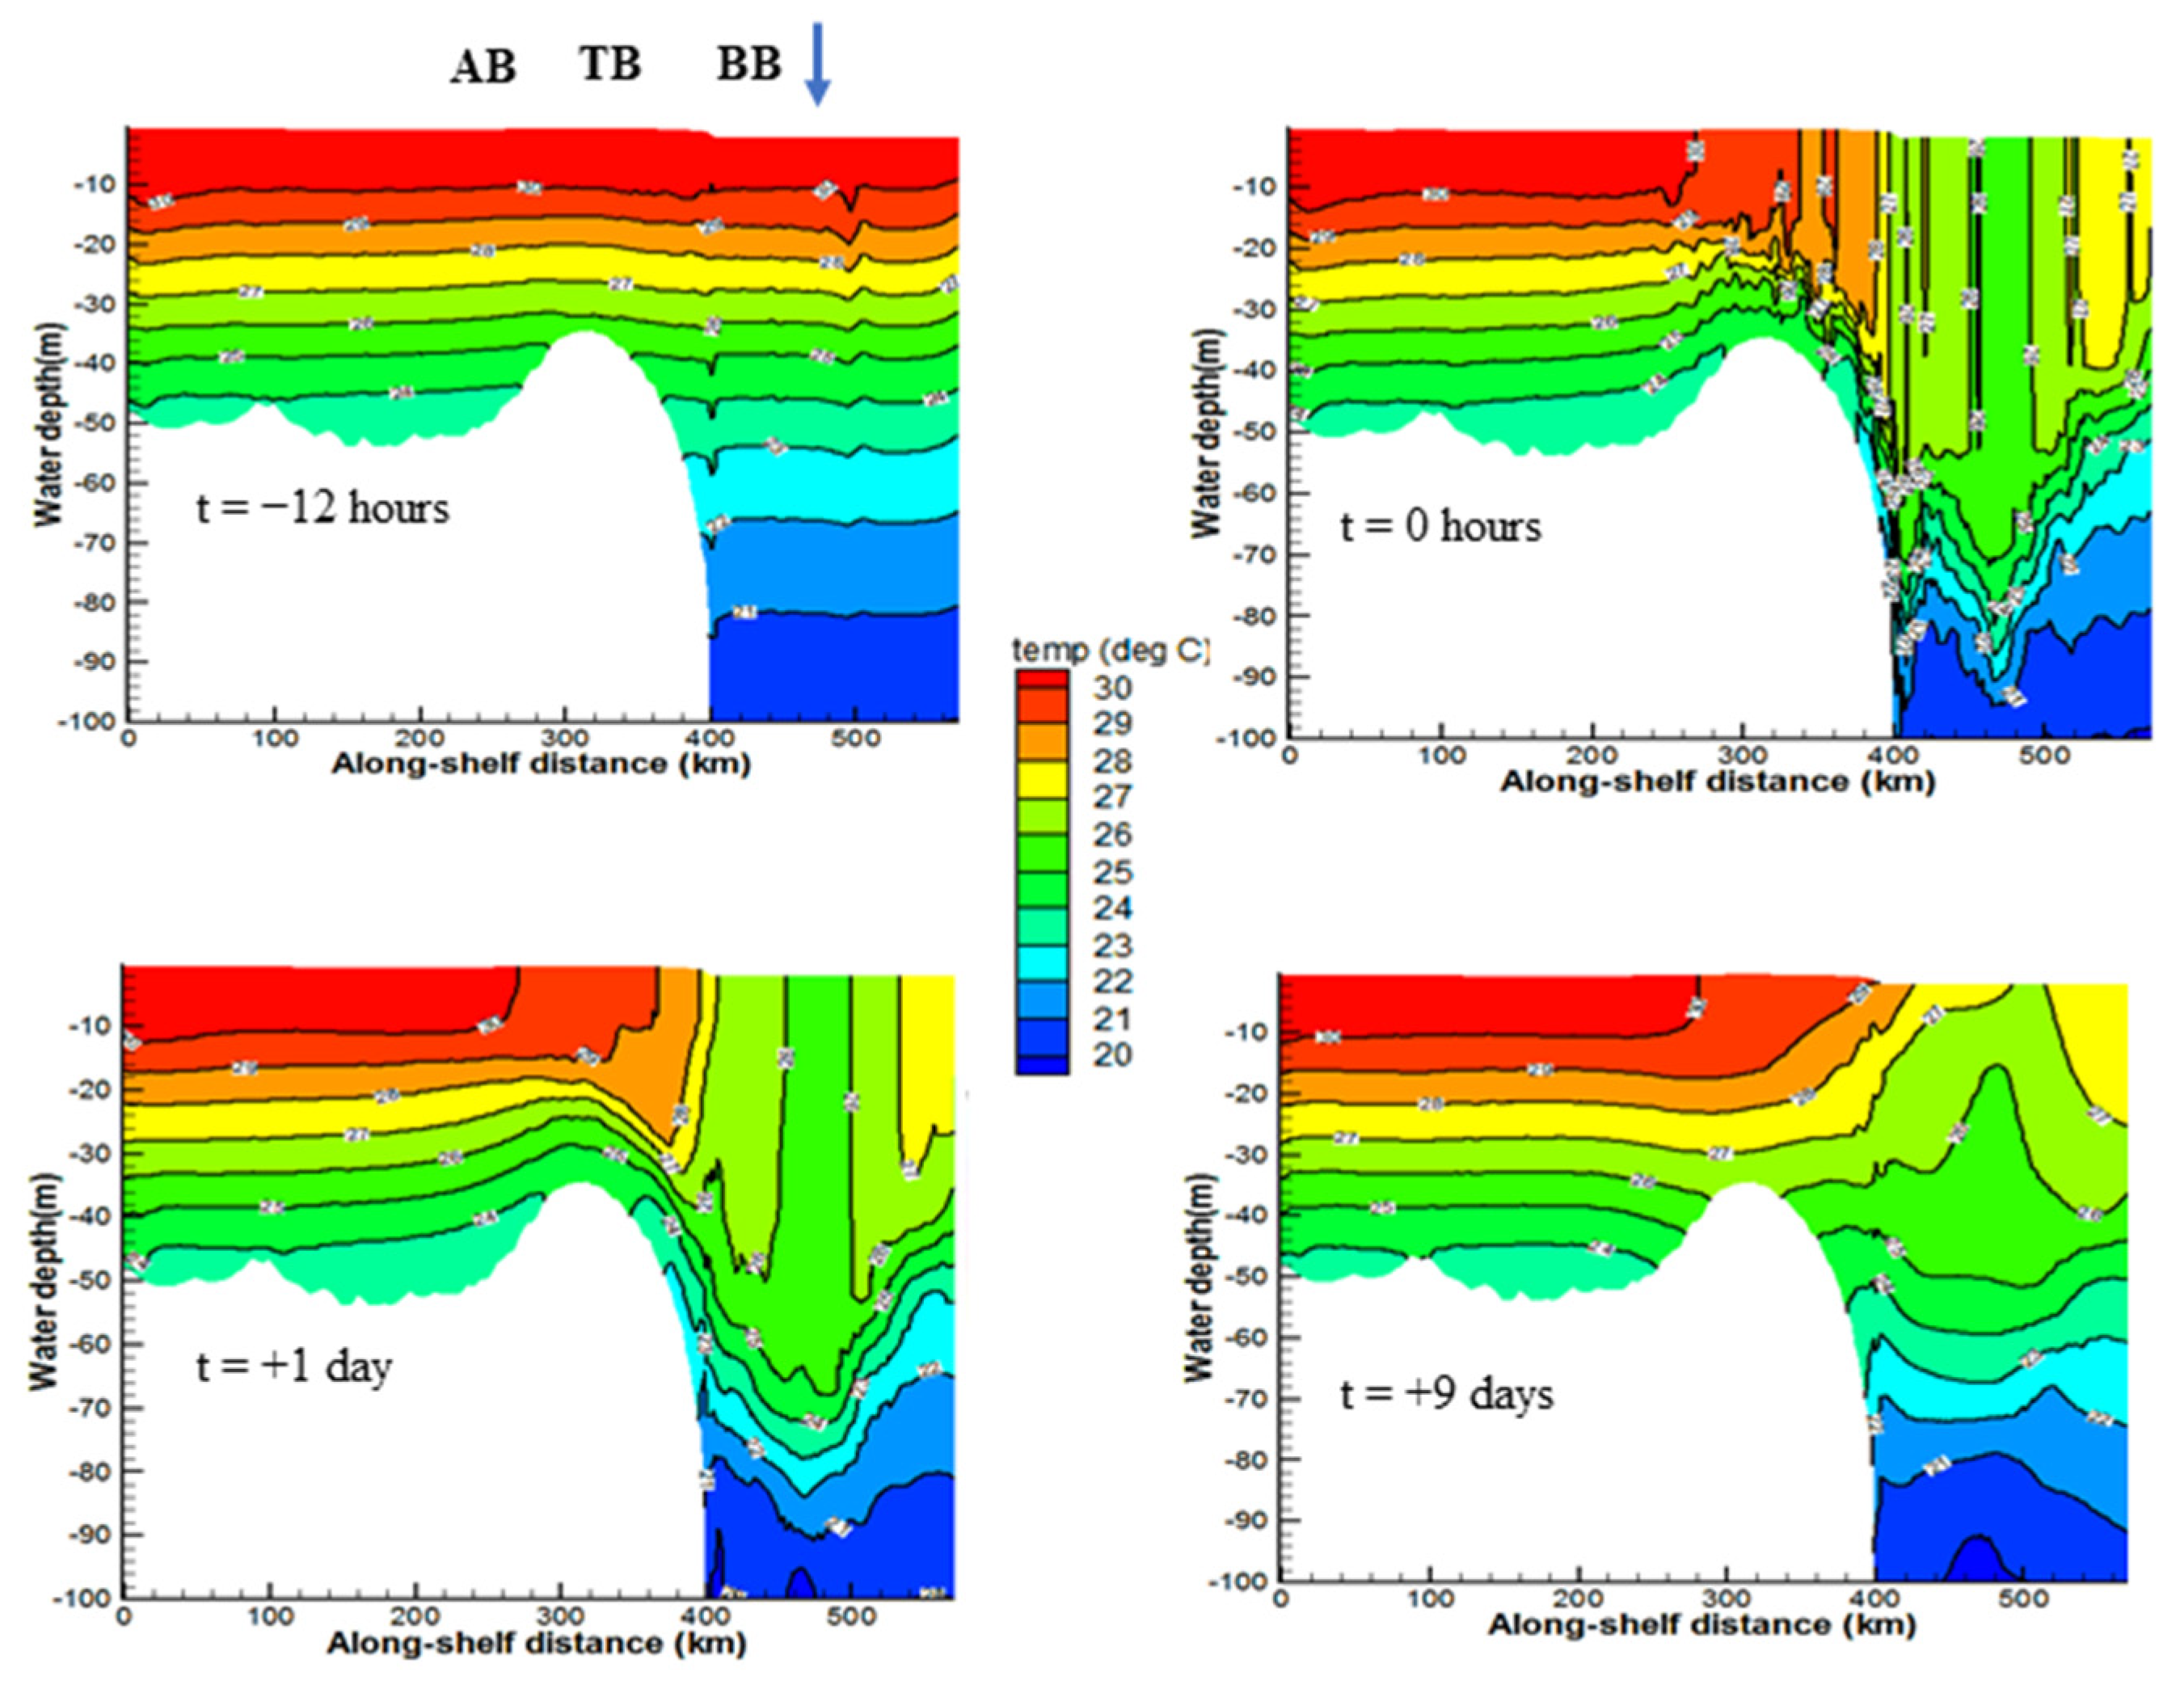
The east–west section 1 crossed the latitude of 28.8, which is roughly corresponding to the shelf break. The eye passed over this section at 6:00 (UTC) on 29 August 2005. For this section, temperature variations were examined with respect to the time that the eye crossed the section (Figure 12). At hour −12, the initial stratification was almost intact, while at hour zero, intense mixing was produced under the eye and on the right of the track. The maximum MLD was ~65 m with a water temperature of 25 °C and was observed at about 40 km from the eye, which was about 1 RMW. Under the eye, the MLD was about 50 m as a result of smaller turbulence mixing and the hurricane-induced upwelling. The amplitude of oscillations produced at the base of the mixed layer and the right side of the track was about 10 m. These oscillations dissipated when they hit bottom and produced a complex pattern of temperature variations across the lower water column off the Barataria and the Terrebonne Bays (Figure 11, hour 0). The MLD and mixed layer temperature, produced due to the turbulence mixing, was about 35 m and 28 °C, respectively, off the Barataria Bay. These values changed almost linearly to about 20 m and 30 °C, respectively, off the Terrebonne Bay. No significant mixing was produced west of this area along section 1. The main feature of the temperature structure across this section at hour 3 was the formation of distinct mixing zones with different temperatures as functions of the distance from where the eye crossed the section. A zone of maximum mixing similar to time zero was present at 40–80 km on the right side of the eye. Another zone of substantial mixing with smaller MLD (about 50 m) was under the eye’s location and a third one on the right side of the maximum MLD. The mixing region over the shelf west of the track can also be divided into different zones, with decreasing MLD westward. These temperatures and patterns lasted until at least hour 6. Eighteen hours later (+1 day), the stratification in the shelf water west of Barataria Bay and off Terrebonne and Barataria Bays almost started to recover. The pattern stayed the same for mixed zones on the right of the track with slightly reduced MLD. A completely stratified water column off the Barataria Bay was the most distinct feature of temperature distribution at the beginning of day nine after the eye crossed the section.
Similar to the east–west section, the temperature response along the north–south transects is presented for six different times, i.e., hours −12, 0, 3, 6, 24 (+1 day), and +196 (or 9 days). Several transects over the Louisiana shelf were examined to reveal the mixing and re-stratification during and after Katrina. The mixing and re-stratification patterns for all sections were similar, and the differences were mostly regarding the intensity of mixing that varied depending on the distance from Katrina’s track. Here, the simulation results across two cross-sections, one on the left side of track (A) and one on the right side (B), which are described in detail. Temperature variations along these two transects and across the water column are shown in Figure 13 and Figure 14.
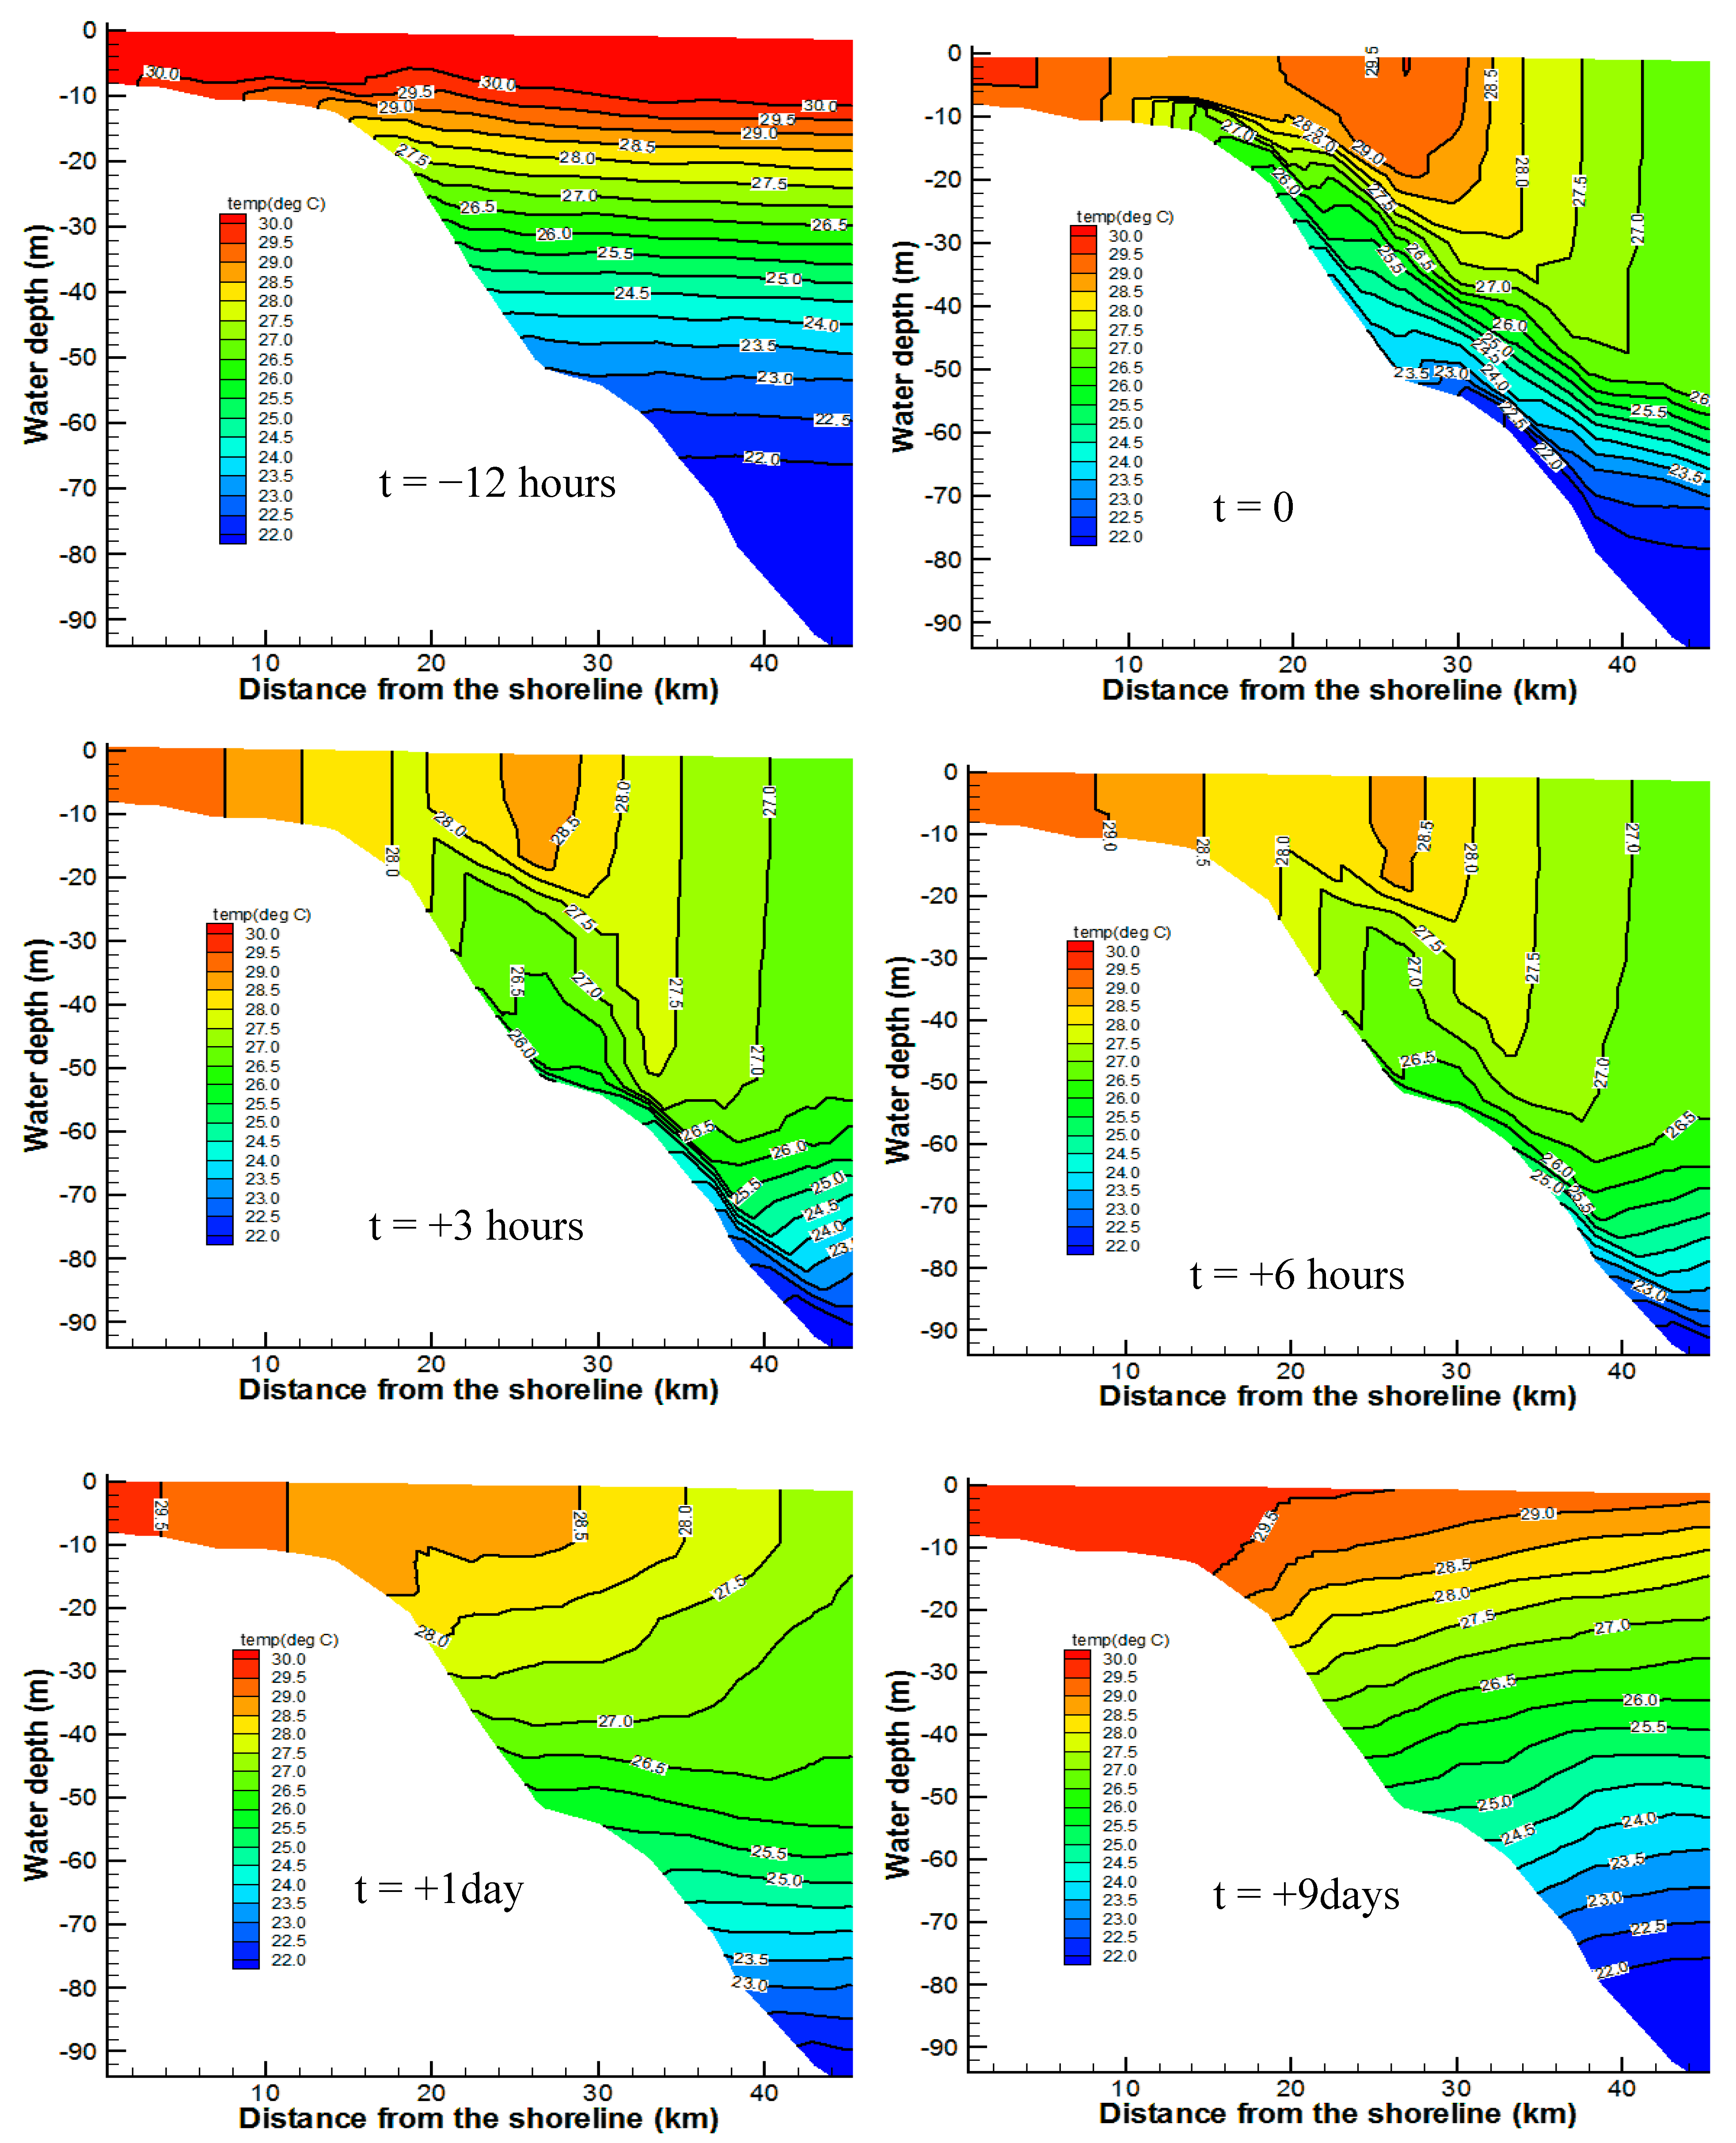
Transect A was selected at the distance of 20 km on the left of the hurricane’s track, in front of Barataria Bay. The initial stratification was broken at time zero when the maximum MLD was about 45 m at the offshore edge of the transect (
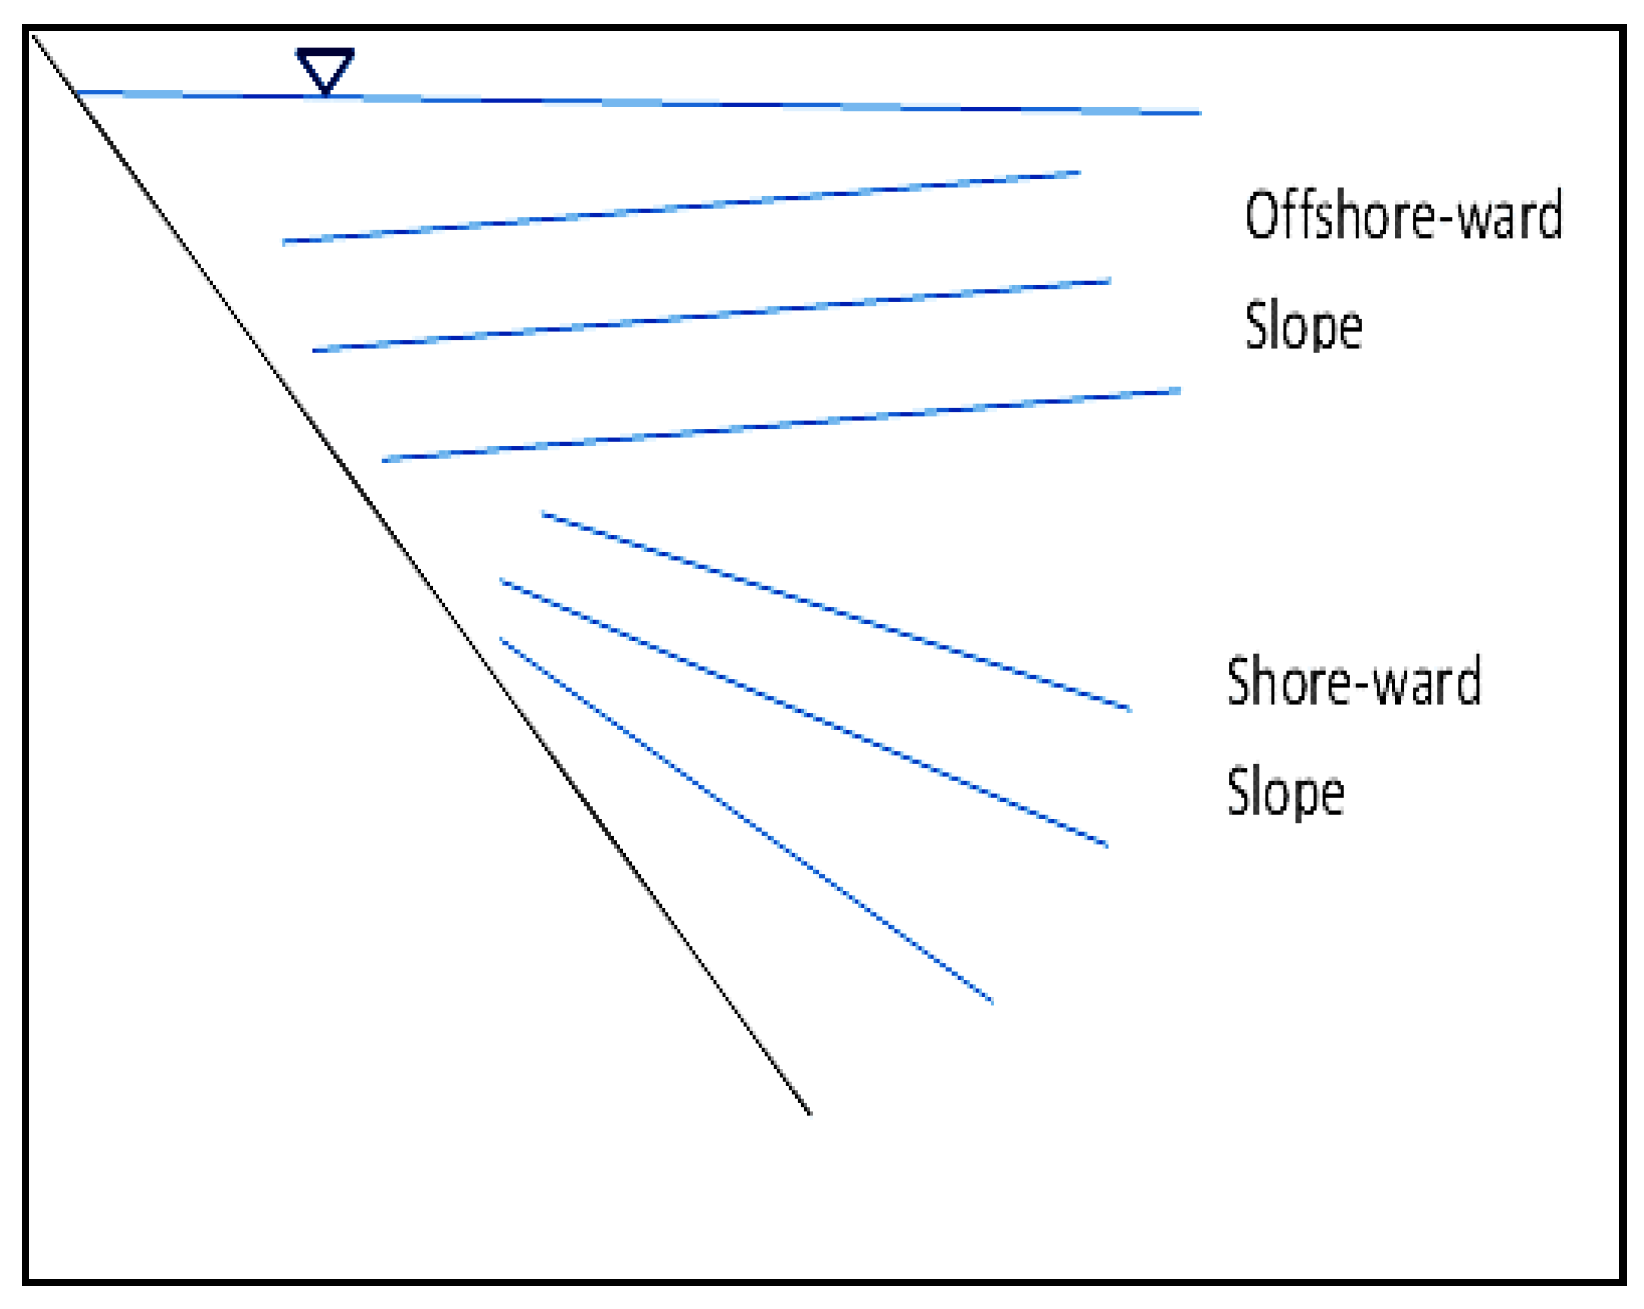
Figure 13). This substantial mixing was due to the intense hurricane wind within the 1 RMW. The MLD decreased linearly to about 10 m at 15 m water depth, while the mixed layer temperature decreased from 27.5 °C at the offshore edge to about 29.5 °C at a depth of 15 m. At depths greater than 50 m, the upwelling was pronounced. There was an intense temperature gradient between the surface mixed layer and the bottom upwelled water. As the eye reached the latitude of the upper transect (at hour +3), the mixed layer temperature along the transect was already uniform. At hour +6, the maximum MLD decreased to about 35 m, and the upwelled water started to decrease the MLD at the mid-shelf. At +1 day, the surface water was still mixed with an MLD of about 10 m. At depths greater than 25 m, the upwelling started to recede, but the isotherms were still inclined shoreward. Isotherms between 15 m and 30 m showed shoreward and offshore-ward slopes, respectively. It suggests the combined effect of baroclinic and barotropic features on water column temperature.
Transect B was on the west of the Southwest Pass and 10 km of the right side of the track. At this location, a remarkable effect of the hurricane wind on stratification was seen. At time zero (Figure 14), the MLD reached its maximum value of 55 m at the offshore end of the transect, where the total water depth was 90 m. Strong upwelling was produced under the mixed layer, transporting cold water to the coastal areas up to a depth of 10 m. At hour +3, turbulence mixing dominated the upwelling, and most parts of the transect were mixed. The MLD at this time varied from 60 m at the offshore end to 10 m at the onshore end of the transect. Due to intense vertical shear induced by the hurricane, the water column for a water depth smaller than 25 m was fully mixed. The mixed layer temperature varied between 26 °C and 29 °C. The fast deepening of the mixed layer interrupted the upwelling at a depth of 55 m. The pattern at hour +6 was similar to that at hour +3. Mixing was still dominant in the upper 12 m at the end of day +1 when stratification in waters deeper than 50 m was re-developed.

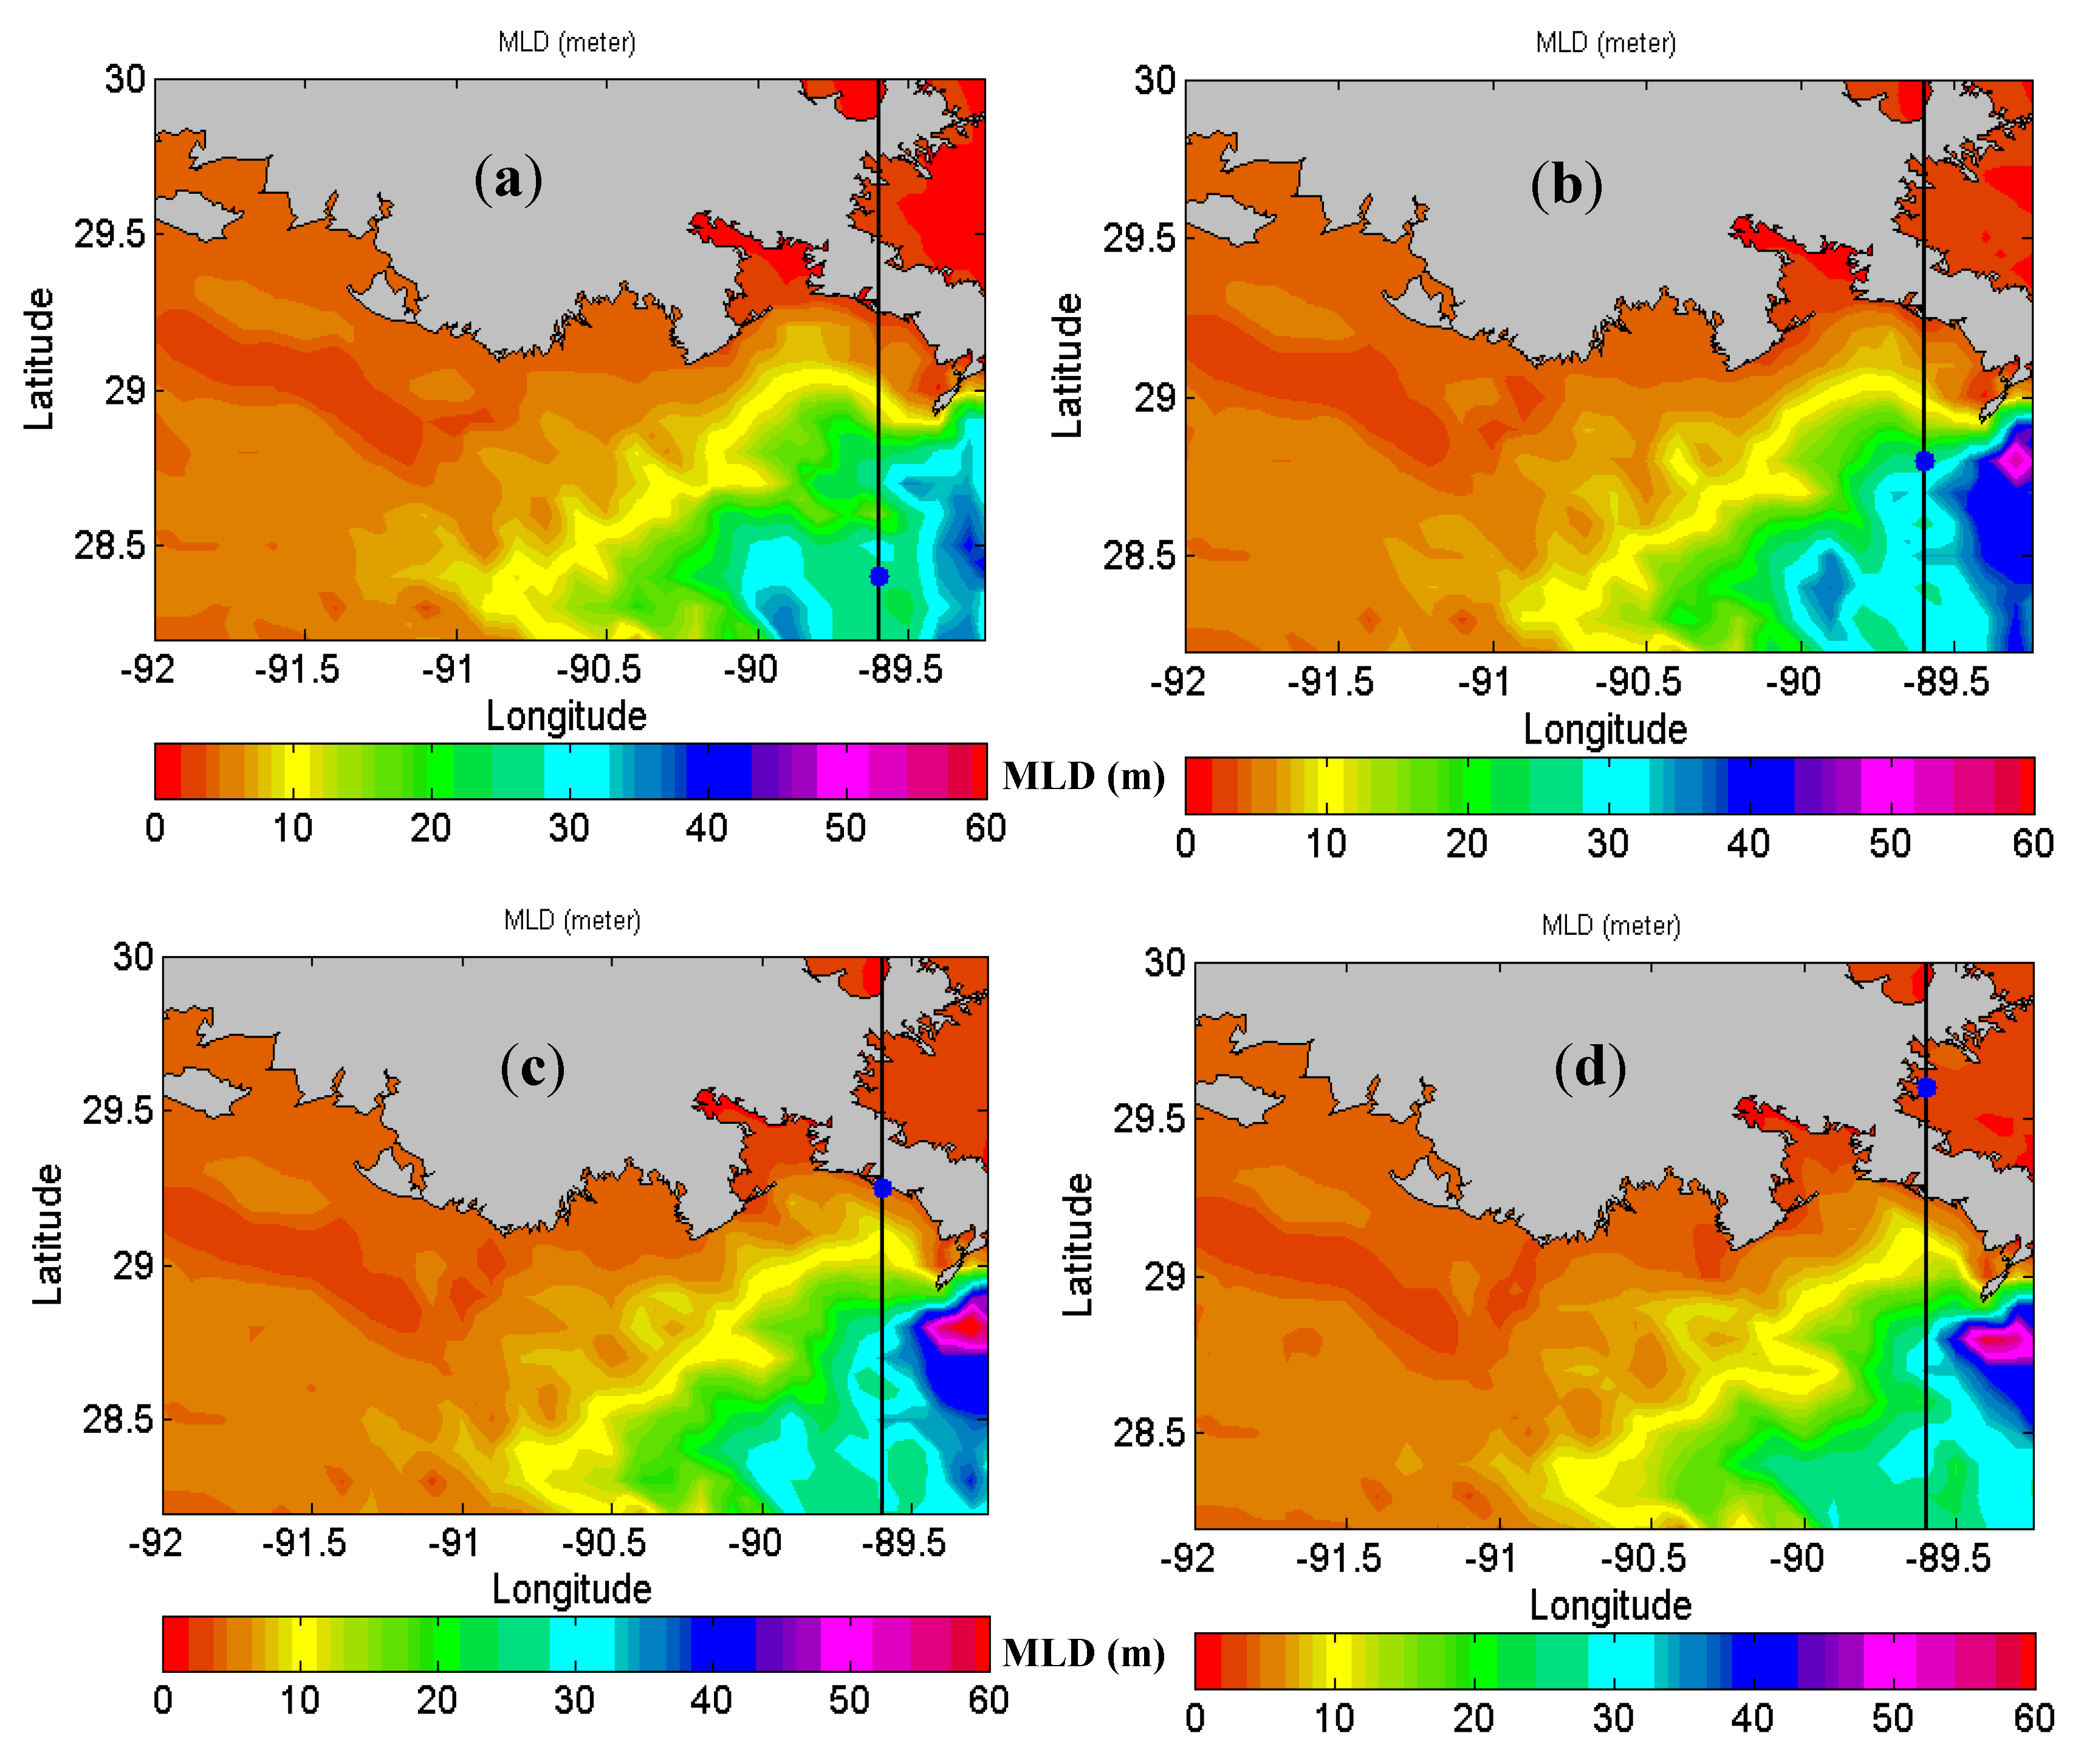
4.4. Mixed Layer Depth

Variations of the MLD over the inner and outer Louisiana shelves were calculated using the model results. A criterion for determining the mixed layer was applied following Montegut et al. [34]. Based on this criterion, if the temperature difference was less than 0.2 °C, the water column was assumed to be mixed. The MLD maps are presented at four different times, at hours −4, −2, 0, and 2, where time 0 is the landfall time (Figure 15). At hour −4, the maximum MLD over the deep water on the right side of the track was about 40 m. An extensive area with an MLD of about 20–25 m was observed on the left side of the track. The effect of the hurricane on the deepening of the mixed layer was pronounced off the Barataria Bay midway between the shelf break and the Bay’s mouth. The deepening extended to the west, off the Terrebonne Bay near the shelf-break, where the MLD was about 10 m. Over the rest of the inner-shelf, the MLD was about 5 m. At the time of landfall, more areas over the inner shelf east of the Atchafalaya Bay were affected by the MLD deepening. The deepening also occurred in front of Barataria Bay and west of the birds foot delta.

5. Discussion

5.1. Mixing Mechanism over the Louisiana Shelf

Simulation results for water temperature response across the east–west sections and north–south transects indicated that during Hurricane Katrina, water column properties were affected by both turbulence mixing and upwelling/downwelling depending on the relative locations with respect to the eye and shelf bathymetry and geometry. Turbulence mixing is the dominant force across the water column at locations within 1 to 1.5 RMW from the eye [35], while at the interior area with a radius less than 1 RMW, upwelling depresses the mixed layer induced by turbulence mixing [7]. The interaction between turbulence mixing and upwelling determines the temperature and mixing properties over the Louisiana shelf. Both mechanisms are significant for most locations, especially those located east of Terrebonne Bay. A simple conceptual diagram of water column mixing induced by Katrina over the inner-shelf is shown in Figure 16a. A mixed layer was produced by turbulence mixing for the upper half of the water column, while the lower part of the water column was affected by upwelling. A transition zone of oscillatory temperature existed between these two zones. These oscillations caused mixed layer deepening when turbulence mixing was strong, upwelling was suppressed, and large mixed layer depths resulted. However, in the absence of strong turbulence mixing, the oscillations dissipated with the progression of upwelling.
In order to determine the dominant mixing mechanism over the Louisiana shelf during Hurricane Katrina, the gradient Richardson number and buoyancy frequency (Equation (1)) are examined for the mid-water depths at different locations on the shelf (e.g., Figure 16b,c for station P4). Although substantial declines (up to 75%) in the buoyancy frequency off the Atchafalaya and Terrebonne Bays (stations P1 and P2) occurred several hours before the landfall, the resulted gradient Richardson number was about 2, which was larger than 0.25 for a fully mixed water column [23]. It suggests that turbulence mixing at these two locations was not enough to mix the upper water column. The abrupt increase in buoyancy frequency for these stations indicated that the cooling by upwelling increased the density gradient over the uplifted thermocline. A very small gradient Richardson number at stations P3 and P4 for several hours before and after the CP time showed the mixed water column at these two locations at least from the surface to mid-depth. The maximum effect of turbulence mixing was identified at station P5 on the right side of the track and west of the delta, where both the Richardson number and buoyancy frequency approached zero almost at the CP time, and the water column stayed mixed at least for the next two days. This area was confined between the eye and the birds foot delta; hence, very intense surface current (up to 3.5 m/s) produced a strong vertical shear which fully mixed the water column and dominated the cooling effect of advected water from the shelf break to this area.

5.2. Shelf Re-Stratification Mechanism

After the turbulence mixing at the water surface is subsided (several hours after the eye pass over a specific location or after landfall), the re-stratification processes come into action and decrease the mixed layer depth until a stable stratification is reached. Over the deep waters, two main re-stratification forces are solar heat flux and baroclinic instability [36,37,38]. Solar insulation primarily affects the stratification over the upper part of the mixed layer up to a depth of 25 m [36,38]. Baroclinic instability is related to the horizontal gradient of buoyancy, which is in turn affected by turbulence mixing. Furthermore, lateral gradients of water density itself could cause re-stratification due to gravitational circulation [36].
The investigation of temperature variations across east–west sections and north–south transects showed that post-storm temperature recovery and shelf re-stratification start several hours after the hurricane’s landfall with a substantial re-stratification after 1 day. Vertical temperature profiles across the transects, especially those located east of the Atchafalaya Bay, were affected by two different forces. The upper part of the water column was mixed by the hurricane-induced surface turbulence and vertical shear, while the pressure gradient caused upwelling across the lower part of the water column. By the combination of these two forces, a baroclinic response across the water column was produced. Offshore-ward currents were generated within the surface mixed layer on the right side of the track, and a compensative shore-ward current was dominated within the lower water column [24]. This compensative bottom current has also been reported by Chaichitehrani et al. [39] during severe cold front events. On the right side of the track, current directions across both upper and lower parts were reversed. After the hurricane, the force was removed, currents started a geostrophic balance phase that caused south-eastward current over the inner-shelf. Similar pot-storm surface currents and their associated deep water reverse circulations were reported by Keen and Glen [35] for Hurricane Andrew (1992). The pressure gradient produced as a result of vertical and horizontal water density variations triggered the re-stratification. At the next stage of re-stratification, the offshore-ward advection associated with the geostrophic currents re-distributed isotherms and sloped them in an offshore-ward direction. Current vectors rotated clockwise under the geostrophic balance and directed southward about 3 days after the landfall. This current lasted for several days and made more contributions to the advection of surface water offshore-ward and reshaping the isotherm toward a re-stratified shelf. The general pattern of re-stratifying isotherms across the water column over the Louisiana shelf after Katrina’s landfall is presented in Figure 17. Although a well-developed shelf-wide stratification was achieved 10 days after landfall, isotherms were still inclined offshore-ward, and SST was about 1 °C smaller than the initial value. Simulations for longer times after the landfall showed that even after 20 days, isotherms were still tilted. This suggests that solar insolation may play an essential role in re-stratifying the shelf, as examined by Allahdadi and Li [40] for the Louisiana shelf. They showed that the summertime solar insolation significantly stratifies the shelf and increases SST up to 1 °C after almost two weeks.

5.3. Mixed Layer Deepening and Seasonal Hypoxia

Water column mixing can significantly contribute to the bottom water’s re-oxygenation. Hence, the mixing produced by Katrina over the Louisiana shelf can affect the seasonal hypoxic zone formed during the summertime. Figure 18 shows maps of the simulated mixed layer induced by Katrina overlaid by the border of the seasonal hypoxic zone over the Louisiana shelf. This border defines the maximum area covered by annual midsummer cruises by the Louisiana Universities Marine Consortium (LUMCON). Figure 18a represents the map of averaged mixed layer over the shelf during the time that Katrina was translating over the shelf. The hurricane-induced mixing affected the hypoxic zone from Terrebonne Bay to the west of the birds foot delta. The MLD off the Barataria Bay inside the hypoxic zone was 10–20 m, while it was about 10 m off the Terrebonne Bay. Even off the Atchafalaya Bay, about 250 km away from the hurricane’s track, the induced mixed layer depth was about 5 m. This mixing can cause mid to bottom water re-oxygenation for several hours.
Nevertheless, the mixing caused by Katrina was an ephemeral phenomenon. About 12 h after the landfall over the birds foot delta, the mixing over the hypoxic zone was highly dissipated, and the average MLD over this area was 5 m. Over the area in the vicinity of the track on both east and west sides, the mixing was still significant. The mixed layer almost disappeared after about 10 days. It indicates that the effect of the mixing induced by Hurricane Katrina on the hypoxic zone was mostly local and was limited to regions within 1–2 RMW. The fact that the eye is present over the shelf for several hours (in the case of Katrina, 3 h) suggests that the mixing lasted just several hours, which could not sustain the bottom water re-oxygenation for more than 1–2 days.

6. Summary and Suggestions

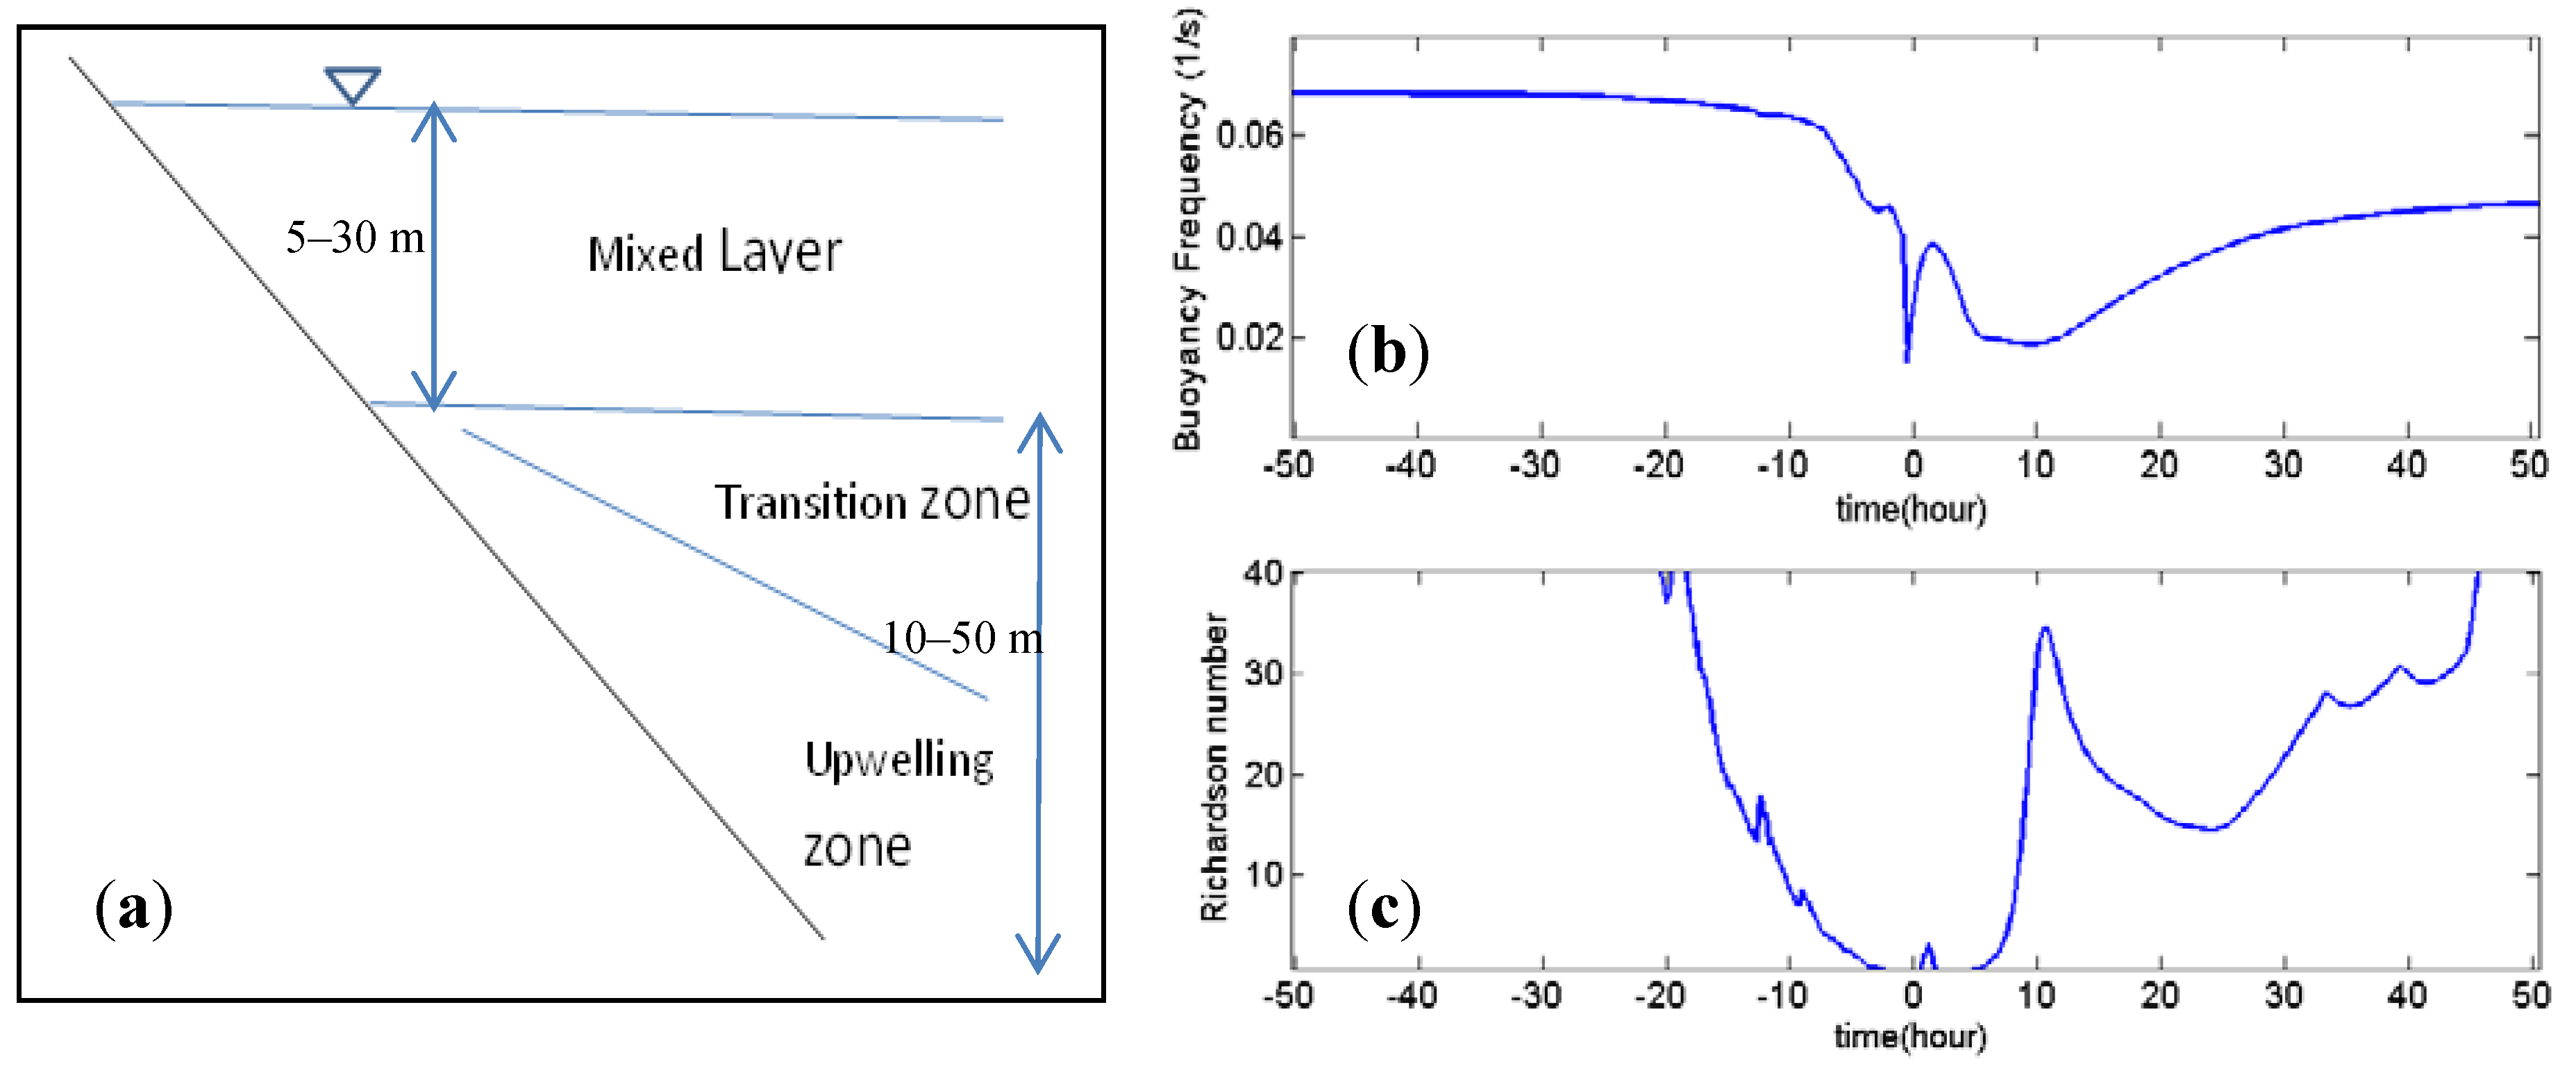
In this paper, the simulation of water column mixing and re-stratification over the Louisiana shelf during and after the passage of Hurricane Katrina was simulated using FVCOM, and the results were discussed by examining shelf-wide timeseries, maps, and transects of temperature and mixing depth. The initial temperature and salinity profiles were based on the climatological data for August from the WOA database. The climatological temperature profiles were modified using available SST data from AVHRR and measured temperatures at two different depths at a station located off the Terrebonne Bay. Satellite SST data from MW-OI products were used to evaluate the model SST and tuning two parameters used for calculating vertical eddy diffusivity. The MW-OI data were also used to estimate MLD based on an analytical approach and were successfully utilized to evaluate the simulated MLDs. The results were used to examine the temporal and spatial characteristics of mixing and re-stratification over the inner shelf. Since Katrina translated the inner shelf just west of the birds-foot delta, the mixing in most of the area between the shelf waters off the Barataria Bay and the birds foot delta was affected. The MLDs over this area were 10–30 m, while in the area west of Barataria Bay, the MLDs were 10 m or less. The hurricane-induced upwelling significantly affected the bottom temperature over the shelf from several hours before the hurricane reached the shelf to several days after. For the shelf areas on the east of Terrebonne Bay, the typical response of the water column was represented by a simple model, including a mixed upper water column, an upwelling-dominated lower water column, and a transition zone in the middle containing dissipating oscillations at the base of the mixed layer. The intense currents (up to 3 m/s) and vertical shears fully mixed the water column west of the birds foot delta and on the east side of the hurricane track. The main post-storm re-stratification mechanisms over the inner shelf were vertical density gradients, lateral density gradients, and offshore pressure gradients produced by upwelling across the shelf. Since the simulations did not include solar insulation, the upper water column stratification and the SST did not return to their respective initial conditions even 10 days after the landfall.
The comparison of the resulted MLDs during and after Katrina with the maximum probable hypoxic zone over the shelf showed that the mixing over the hypoxic zone west of the Terrebonne Bay could re-oxygenate the mid and bottom waters for several hours during Katrina. However, since the mixing was ephemeral and damped quickly after the landfall, the re-oxygenation appeared to be limited in time.
Compared to deep waters, the interaction of the atmospheric boundary layer and water column with the coastal geometry and the bottom boundary layer produces a more complicated response to a moving hurricane. The cooling induced by Katrina at the surface over the deep water followed the general pattern described before for the deep water. However, the surface cooling rate decreased toward the shelf break. At the shelf break, the cooling intensity substantially decreased; hence, even at the hour that the eye was hovering over the inner shelf, surface cooling was only significant in the vicinity of the track and over the other parts of the inner shelf, especially west of the Barataria Bay, the surface cooling was less than 1 °C. It suggests that the oscillations within the water column that contributed to deepening the mixed layer were dissipated when the mixed layer reached the bottom of the shelf break. Furthermore, the cross-shelf slope intensified the upwelling signal over the inner shelf, which can prevent mixed layer deepening. The birds foot delta highly affected currents and temperature response of the shelf waters confined between the delta and the hurricane’s track. Very strong currents and vertical shear were identified over this area. This produced a fully mixed water column and very small Richardson numbers during the time that Katrina was translating the inner shelf.
The results for the mixing pattern over the Louisiana shelf can be used for studying the effect of storms on the extent of the seasonal hypoxic zone over this region and quantifying the water column re-oxygenation either by using semi-empirical relationships or by incorporating the model setup from this study to a full biogeochemical model. This would be a topic for future relevant studies, regarding the efforts made during the last two decades to study the seasonal hypoxia in the northern Gulf of Mexico and predict its extension and intensity. The model setup with primary evaluation for the turbulent mixing parameters can also be used for studying phytoplankton bloom and other biogeochemical processes, as stated by McGee and He [19].
Examining the effect of turbulent mixing parameters on temperature/salinity mixing is another aspect of this study that can enhance the knowledge about the parameterization of vertical turbulent closure and selecting the optimum parameters for simulating heat and salt transport. Although background eddy viscosity K b and the constant B1 for energy dissipation calculation are usually used as defaults in simulation, they could be site-specific or depend on the intensity of the forcing in the model.

Author Contributions

Model setup and running, plotting results, preparing discussions, manuscript Writing, M.N.A.; conceptualization, manuscript editing, C.L.; investigation, plotting, manuscript writing and editing, N.C. All authors have read and agreed to the published version of the manuscript.

Funding

This research was partially funded by National Oceanic and Atmospheric Administration (NOAA) through the Gulf Coastal Ocean Observing System (GCOOS) through NOAA-NOS-IOOS-2016-2004378.

Institutional Review Board Statement

Not Applicable.

Informed Consent Statement

Satellite and climatological are addressed in the manuscript.

Data Availability Statement

The simulation results presented in this paper can be regenerated using FVCOM, and the setup is clearly described in the manuscript. Satellite data used for model evaluation can be accessed through the link provided in the manuscript.

Conflicts of Interest

The authors declare no conflict of interest.

References

  1. Zedler, S.E.; Dickey, T.D.; Doney, S.C.; Price, J.F.; Yu, X.; Mellor, G.L. Analyses and simulations of the upper ocean’s response to Hurricane Felix at the Bermuda Testbed Mooring site: 13–23 August 1995. J. Geophys. Res. Ocean. 2002, 107, 25-1–25-29. [Google Scholar] [CrossRef] [Green Version]
  2. Black, P.G.; D’asaro, E.A.; Drennan, W.M.; French, J.R.; Niiler, P.P.; Sanford, T.B.; Terrill, E.J.; Walsh, E.J.; Zhang, J.A. Air-sea exchange in hurricanes—Synthesis of observations from the coupled boundary layer air-sea transfer experiment. Bull. Am. Meteorol. Soc. 2007, 88, 357–374. [Google Scholar] [CrossRef] [Green Version]
  3. Bender, M.A.; Ginis, I.; Kurihara, Y. Numerical Simulations of Tropical Cyclone-Ocean Interaction with a High-Resolution Coupled Model. J. Geophys. Res. Atmos. 1993, 98, 23245–23263. [Google Scholar] [CrossRef]
  4. Price, J.F. Upper Ocean Response to a Hurricane. J. Phys. Oceanogr. 1981, 11, 153–175. [Google Scholar] [CrossRef] [Green Version]
  5. Jacob, S.D.; Shay, L.K.; Mariano, A.J.; Black, P.G. The 3D oceanic mixed layer response to Hurricane Gilbert. J. Phys. Oceanogr. 2000, 30, 1407–1429. [Google Scholar] [CrossRef]
  6. Koohestani, K.; Allahdadi, M.N.; Chaichitehrani, N. Oceanic Response to Tropical Cyclone Gonu (2007) in the Gulf of Oman and the Northern Arabian Sea: Estimating Depth of the Mixed Layer Using Satellite SST and Climatological Data. J. Mar. Sci. Eng. 2021, 9, 1244. [Google Scholar] [CrossRef]
  7. Li, S.; Chen, C. Air-sea interaction processes during hurricane Sandy: Coupled WRF-FVCOM model simulations. Progress in Oceanography 206, 102855. Prog. Oceanogr. 2022, 206, 102855. [Google Scholar] [CrossRef]
  8. Jyothi, L.; Joseph, S.; Suneetha, P.; Huber, M.; Joseph, L.A. Distinct Oceanic Responses at Rapidly Intensified and Weakened Regimes of Tropical Cyclone Ockhi (2017). J. Geophys. Res. Oceans 2022, 127, e2021JC018212. [Google Scholar] [CrossRef]
  9. Das, Y.; Mohanty, U.C.; Jain, I. Numerical simulation on Bay of Bengal’s response to cyclones using the Princeton ocean model. Braz. J. Oceanogr. 2017, 65, 128–145. [Google Scholar] [CrossRef] [Green Version]
  10. Elsberry, R.L.; Fraim, T.S.; Trapnell, R.N. Mixed Layer Model of Oceanic Thermal Response to Hurricanes. J. Geophys. Res. Ocean. Atmos. 1976, 81, 1153–1162. [Google Scholar] [CrossRef]
  11. Mayer, D.A.; Mofjeld, H.O.; Leaman, K.D. Near-Inertial Internal Waves Observed on the Outer Shelf in the Middle Atlantic Bight in the Wake of Hurricane Belle. J. Phys. Oceanogr. 1981, 11, 87–106. [Google Scholar] [CrossRef] [Green Version]
  12. Xie, L.; Pietrafesa, L.J.; Bohm, E.; Zhang, C.; Li, X. Evidence and mechanism of Hurricane Fran induced cooling in the Charleston trough. Geophys. Res. Lett. 1998, 25, 769–772. [Google Scholar] [CrossRef]
  13. Bingham, F.M. Physical response of the coastal ocean to Hurricane Isabel near landfall. Ocean. Sci. 2007, 3, 159–171. [Google Scholar] [CrossRef] [Green Version]
  14. Speckhart, B.L. Observational Analysis of Shallow Water Response to Passing Hurricanes in Onslow Bay, NC in 1999. Master’s Thesis, University of North Carolina Wilmington, Wilmington, NC, USA, 2004; pp. 1–61. [Google Scholar]
  15. Hu, C.M.; Muller-Karger, F.E. Response of sea surface properties to Hurricane Dennis in the eastern Gulf of Mexico. Geophys. Res. Lett. 2007, 34, 1–5. [Google Scholar] [CrossRef]
  16. Li, M.; Zhong, L.J.; Boicourt, W.C.; Zhang, S.L.; Zhang, D.L. Hurricane-induced destratification and restratification in a partially-mixed estuary. J. Mar. Res. 2007, 65, 169–192. [Google Scholar] [CrossRef] [Green Version]
  17. Schwab, D.J.; Beletsky, D. Relative effects of wind stress curl, topography, and stratification on large-scale circulation in Lake Michigan. J. Geophys. Res. Ocean. 2003, 108, 26-1–26-10. [Google Scholar] [CrossRef] [Green Version]
  18. Visser, A.; Souza, A.; Hessner, K.; Simpson, J. The effect of stratification on tidal current profiles in a region of fresh-water influence. Oceanol. Acta 1994, 17, 369–381. [Google Scholar]
  19. McGee, L.; He, R. Mesoscale and submesoscale mechanisms behind asymmetric cooling and phytoplankton blooms induced by hurricanes: A comparison between an open ocean case and a continental shelf sea case. Ocean Dyn. 2018, 68, 1443–1456. [Google Scholar] [CrossRef] [Green Version]
  20. Rabalais, N.N.; Turner, R.E.; Sen Gupta, B.K.; Boesch, D.F.; Chapman, P.; Murrell, M.C. Characterization and longterm trends of hypoxia in the northern Gulf of Mexico Does the science support the Action Plan? Estuar. Coasts 2007, 30, 753–772. [Google Scholar] [CrossRef]
  21. Rabalais, N.N.; Turner, R.E.; Wiseman, W.J. Gulf of Mexico hypoxa, aka “The dead zone”. Annu. Rev. Ecol. Syst. 2002, 33, 235–263. [Google Scholar] [CrossRef]
  22. Wang, D.; Zhao, H. Estimation of Phytoplankton Responses to Hurricane Gonu over the Arabian Sea Based on Ocean Color Data. Sensors 2008, 8, 4878–4893. [Google Scholar] [CrossRef] [PubMed] [Green Version]
  23. Allahdadi, M.N.; Jose, F.; Patin, C. Seasonal Hydrodynamics along the Louisiana Coast: Implications for Hypoxia Spreading. J. Coast. Res. 2013, 29, 1092–1100. [Google Scholar] [CrossRef]
  24. Allahdadi, M.N.; Li, C. Numerical Simulation of Louisiana Shelf Circulation under Hurricane Katrina. J. Coast. Res. 2018, 34, 67–80. [Google Scholar] [CrossRef]
  25. Tehrani, N.C.; D’Sa, E.J.; Osburn, C.L.; Bianchi, T.S.; Schaeffer, B.A. Chromophoric Dissolved Organic Matter and Dissolved Organic Carbon from Sea-Viewing Wide Field-of-View Sensor (SeaWiFS), Moderate Resolution Imaging Spectroradiometer (MODIS) and MERIS Sensors: Case Study for the Northern Gulf of Mexico. Remote Sens. 2013, 5, 1439–1464. [Google Scholar] [CrossRef] [Green Version]
  26. Allahdadi, M.N.; He, R.; Ahn, S.; Chartrand, C.; Neary, V.S. Development and calibration of a high-resolution model for the Gulf of Mexico, Puerto Rico, and the U.S. Virgin Islands: Implication for wave energy resource characterization. Ocean. Eng. 2021, 235, 109304. [Google Scholar] [CrossRef]
  27. Knabb, R.D.; Rhome, J.R.; Brown, D.P. Tropical cyclone report: Hurricane Katrina, National Hurricane Center, NOAA. 2005. Available online: http://www.nhc.noaa.gov/pdf (accessed on 1 July 2022).
  28. Chen, Q.; Wang, L.X.; Zhao, H.H. Hydrodynamic Investigation of Coastal Bridge Collapse during Hurricane Katrina. J. Hydraul. Eng. Asce 2009, 135, 175–186. [Google Scholar] [CrossRef]
  29. Chen, C.S.; Beardsley, R.C.; Cowles, G. An Unstructured Grid, Finite-Volume Coastal Ocean Model, FVCOM User Manual; University of Massachusetts, Dartmouth: New Bedford, MA, USA, 2006. [Google Scholar]
  30. Allahdadi, M.N.; Li, C. Effect of stratification on current hydrodynamics over Louisiana shelf during Hurricane Katrina. Water Sci. Eng. 2017, 10, 154–165. [Google Scholar] [CrossRef]
  31. Pan, J.; Sun, Y. Estimate of Ocean Mixed Layer Deepening after a Typhoon Passage over the South China Sea by Using Satellite Data. J. Phys. Oceanogr. 2012, 43, 498–506. [Google Scholar] [CrossRef]
  32. Valjarević, A.; Morar, C.; Živković, J.; Niemets, L.; Kićović, D.; Golijanin, J.; Gocić, M.; Bursać, N.M.; Stričević, L.; Žiberna, I.; et al. Long Term Monitoring and Connection between Topography and Cloud Cover Distribution in Serbia. Atmosphere 2021, 12, 964. [Google Scholar] [CrossRef]
  33. Sun, D.; Kafatos, M.; Cervone, G.; Boybeyi, Z.; Yang, R. Satellite microwave detected SST anomalies and hurricane intensification. Nat. Hazards 2007, 43, 273–284. [Google Scholar] [CrossRef]
  34. Montegut, C.D.; Madec, G.; Fischer, A.S.; Lazar, A.; Iudicone, D. Mixed layer depth over the global ocean: An examination of profile data and a profile-based climatology. J. Geophys. Res. Oceans 2004, 109, 4–20. [Google Scholar]
  35. Keen, T.R.; Glenn, S.M. Shallow water currents during hurricane Andrew. J. Geophys. Res. Ocean. 1999, 104, 23443–23458. [Google Scholar] [CrossRef]
  36. Hosegood, P.J.; Gregg, M.C.; Alford, M.H. Restratification of the Surface Mixed Layer with Submesoscale Lateral Density Gradients: Diagnosing the Importance of the Horizontal Dimension. J. Phys. Oceanogr. 2008, 38, 2438–2460. [Google Scholar] [CrossRef]
  37. Mei, W.; Pasquero, C. Restratification of the Upper Ocean after the Passage of a Tropical Cyclone: A Numerical Study. J. Phys. Oceanogr. 2012, 42, 1377–1401. [Google Scholar] [CrossRef]
  38. Haney, S.; Bachman, S.; Cooper, B.; Kupper, S.; McCaffrey, K.; Van Roekel, L.; Stevenson, S.; Fox-Kemper, B.; Ferrari, R. Hurricane wake restratification rates of one-, two- and three-dimensional processes. J. Mar. Res. 2012, 70, 824–850. [Google Scholar] [CrossRef]
  39. Chaichitehrani, N.; Li, C.; Xu, K.; Allahdadi, M.N.; Hestir, E.L.; Keim, B.D. A numerical study of sediment dynamics over Sandy Point dredge pit, west flank of the Mississippi River, during a cold front event. Cont. Shelf Res. 2019, 183, 38–50. [Google Scholar] [CrossRef]
  40. Allahdadi, M.N.; Li, C. Numerical Experiment of Stratification Induced by Diurnal Solar Heating Over the Louisiana Shelf. In Modeling Coastal Hypoxia: Numerical Simulations of Patterns, Controls and Effects of Dissolved Oxygen Dynamics; Justic, D., Rose, K.A., Hetland, R.D., Fennel, K., Eds.; Springer International Publishing: Cham, Switzerland, 2017; pp. 1–22. [Google Scholar] [CrossRef]
Figure 1. Geographical extents of the Louisiana shelf in the Gulf of Mexico and track of Hurricane Katrina at different dates and times. The horizontal red line and dashed vertical blue lines, respectively, show the location and extent of Section 1 and transect A and B used for representing simulated shelf temperature across the water column, AB: Atchafalaya Bay, TB: Terrebonne Bay, and BB: Barataria Bay.
Jmse 10 01082 g001
Figure 2. (a) Modeling area and bathymetry, (b) computational mesh.
Jmse 10 01082 g002
Figure 3. Generated Katrina’s wind field over the Louisiana shelf on 29 August 2005 at 6:00 and 9:00 UTC.
Jmse 10 01082 g003
Figure 4. (a) Locations of extracted temperature and salinity profiles from the WOA database over the Louisiana shelf, (b) the corresponding temperature profiles for points P1–P8.
Jmse 10 01082 g004
Figure 5. Comparison of simulated SST under the best match simulation scenario and the observed SST from MW-OI product for 30 August 2005 at 12:00 UTC. The solid black line shows the track of Katrina.
Jmse 10 01082 g005
Figure 6. Relationship between MLD and SST following the approach presented by Pan and Sun [31].
Jmse 10 01082 g006
Figure 7. (Left) Calculated MLD based on Equation (3) and MW-OI SST data on 30 August 2005 at 12:00 UTC, and (right) the simulated MLD for the same time and date.
Jmse 10 01082 g007
Figure 8. Simulated sea surface temperature cooling at (a) −4 h, (b) −2 h, (c) 0 h, and (d) +2 h, the solid line shows Katrina’s track, and red dots indicate the locations of its eye. AB: Atchafalaya Bay, TB: Terrebonne Bay, and BB: Barataria Bay.
Jmse 10 01082 g008
Figure 9. Simulated bottom temperature cooling at (a) −4 h, (b) −2 h, (c) 0 h, and (d) +2 h.
Jmse 10 01082 g009
Figure 10. Locations of points over the Louisiana shelf selected for studying temperature time series.
Jmse 10 01082 g010
Figure 11. Time variations of simulated SST and vertical temperature at P3–P6, for 50 h before and 50 h after the time that Katrina passed the closest proximity of this point; upper panel for each station is SST, and the lower panel for each station is the temperature across the water column for the same period (horizontal axes in all panels shows relative time).
Jmse 10 01082 g011
Figure 12. Variations of simulated water temperature across section 1 for different times: (a) −12 h, (b) 0 h, (c) +3 h. The arrow on the upper left panel shows the location of Katrina’s eye over the cross-section. AB: Atchafalaya Bay, TB: Terrebonne Bay, and BB: Barataria Bay.
Jmse 10 01082 g012
Figure 13. Distribution of simulated temperature across transect A for different times.
Jmse 10 01082 g013
Figure 14. Distribution of simulated temperature across transect B for different times.
Jmse 10 01082 g014
Figure 15. Variations of simulated MLD over the Louisiana shelf at different times: (a) −4 h, (b) −2 h, (c) 0 h, (d) +2 h.
Jmse 10 01082 g015
Figure 16. (a) A schematic of water column mixing over the Louisiana shelf during Katrina, (b) time series of Buoyancy frequency, and (c) Richardson number (lower panel) at station P4.
Jmse 10 01082 g016
Figure 17. Typical distribution of isotherms across the water column during the re-stratification phase.
Jmse 10 01082 g017
Figure 18. Maps of simulated mixed layer depth over the Louisiana shelf overlaid by the border of the hypoxic zone (the solid thick line: (a) the averaged mixed layer 2 h before and after the landfall over the birds foot delta, (b) at time +12 h, (c) at time +1day, (d) at time +10 days.
Jmse 10 01082 g018
Publisher’s Note: MDPI stays neutral with regard to jurisdictional claims in published maps and institutional affiliations.

