
Simulation of the Nearshore Sediment Transport Pattern and Beach Morphodynamics in the Semi-Enclosed Bay of Myrtos, Cephalonia Island, Ionian Sea

 ,
,  ,
,  ,
,  and
and
Abstract
1. Introduction
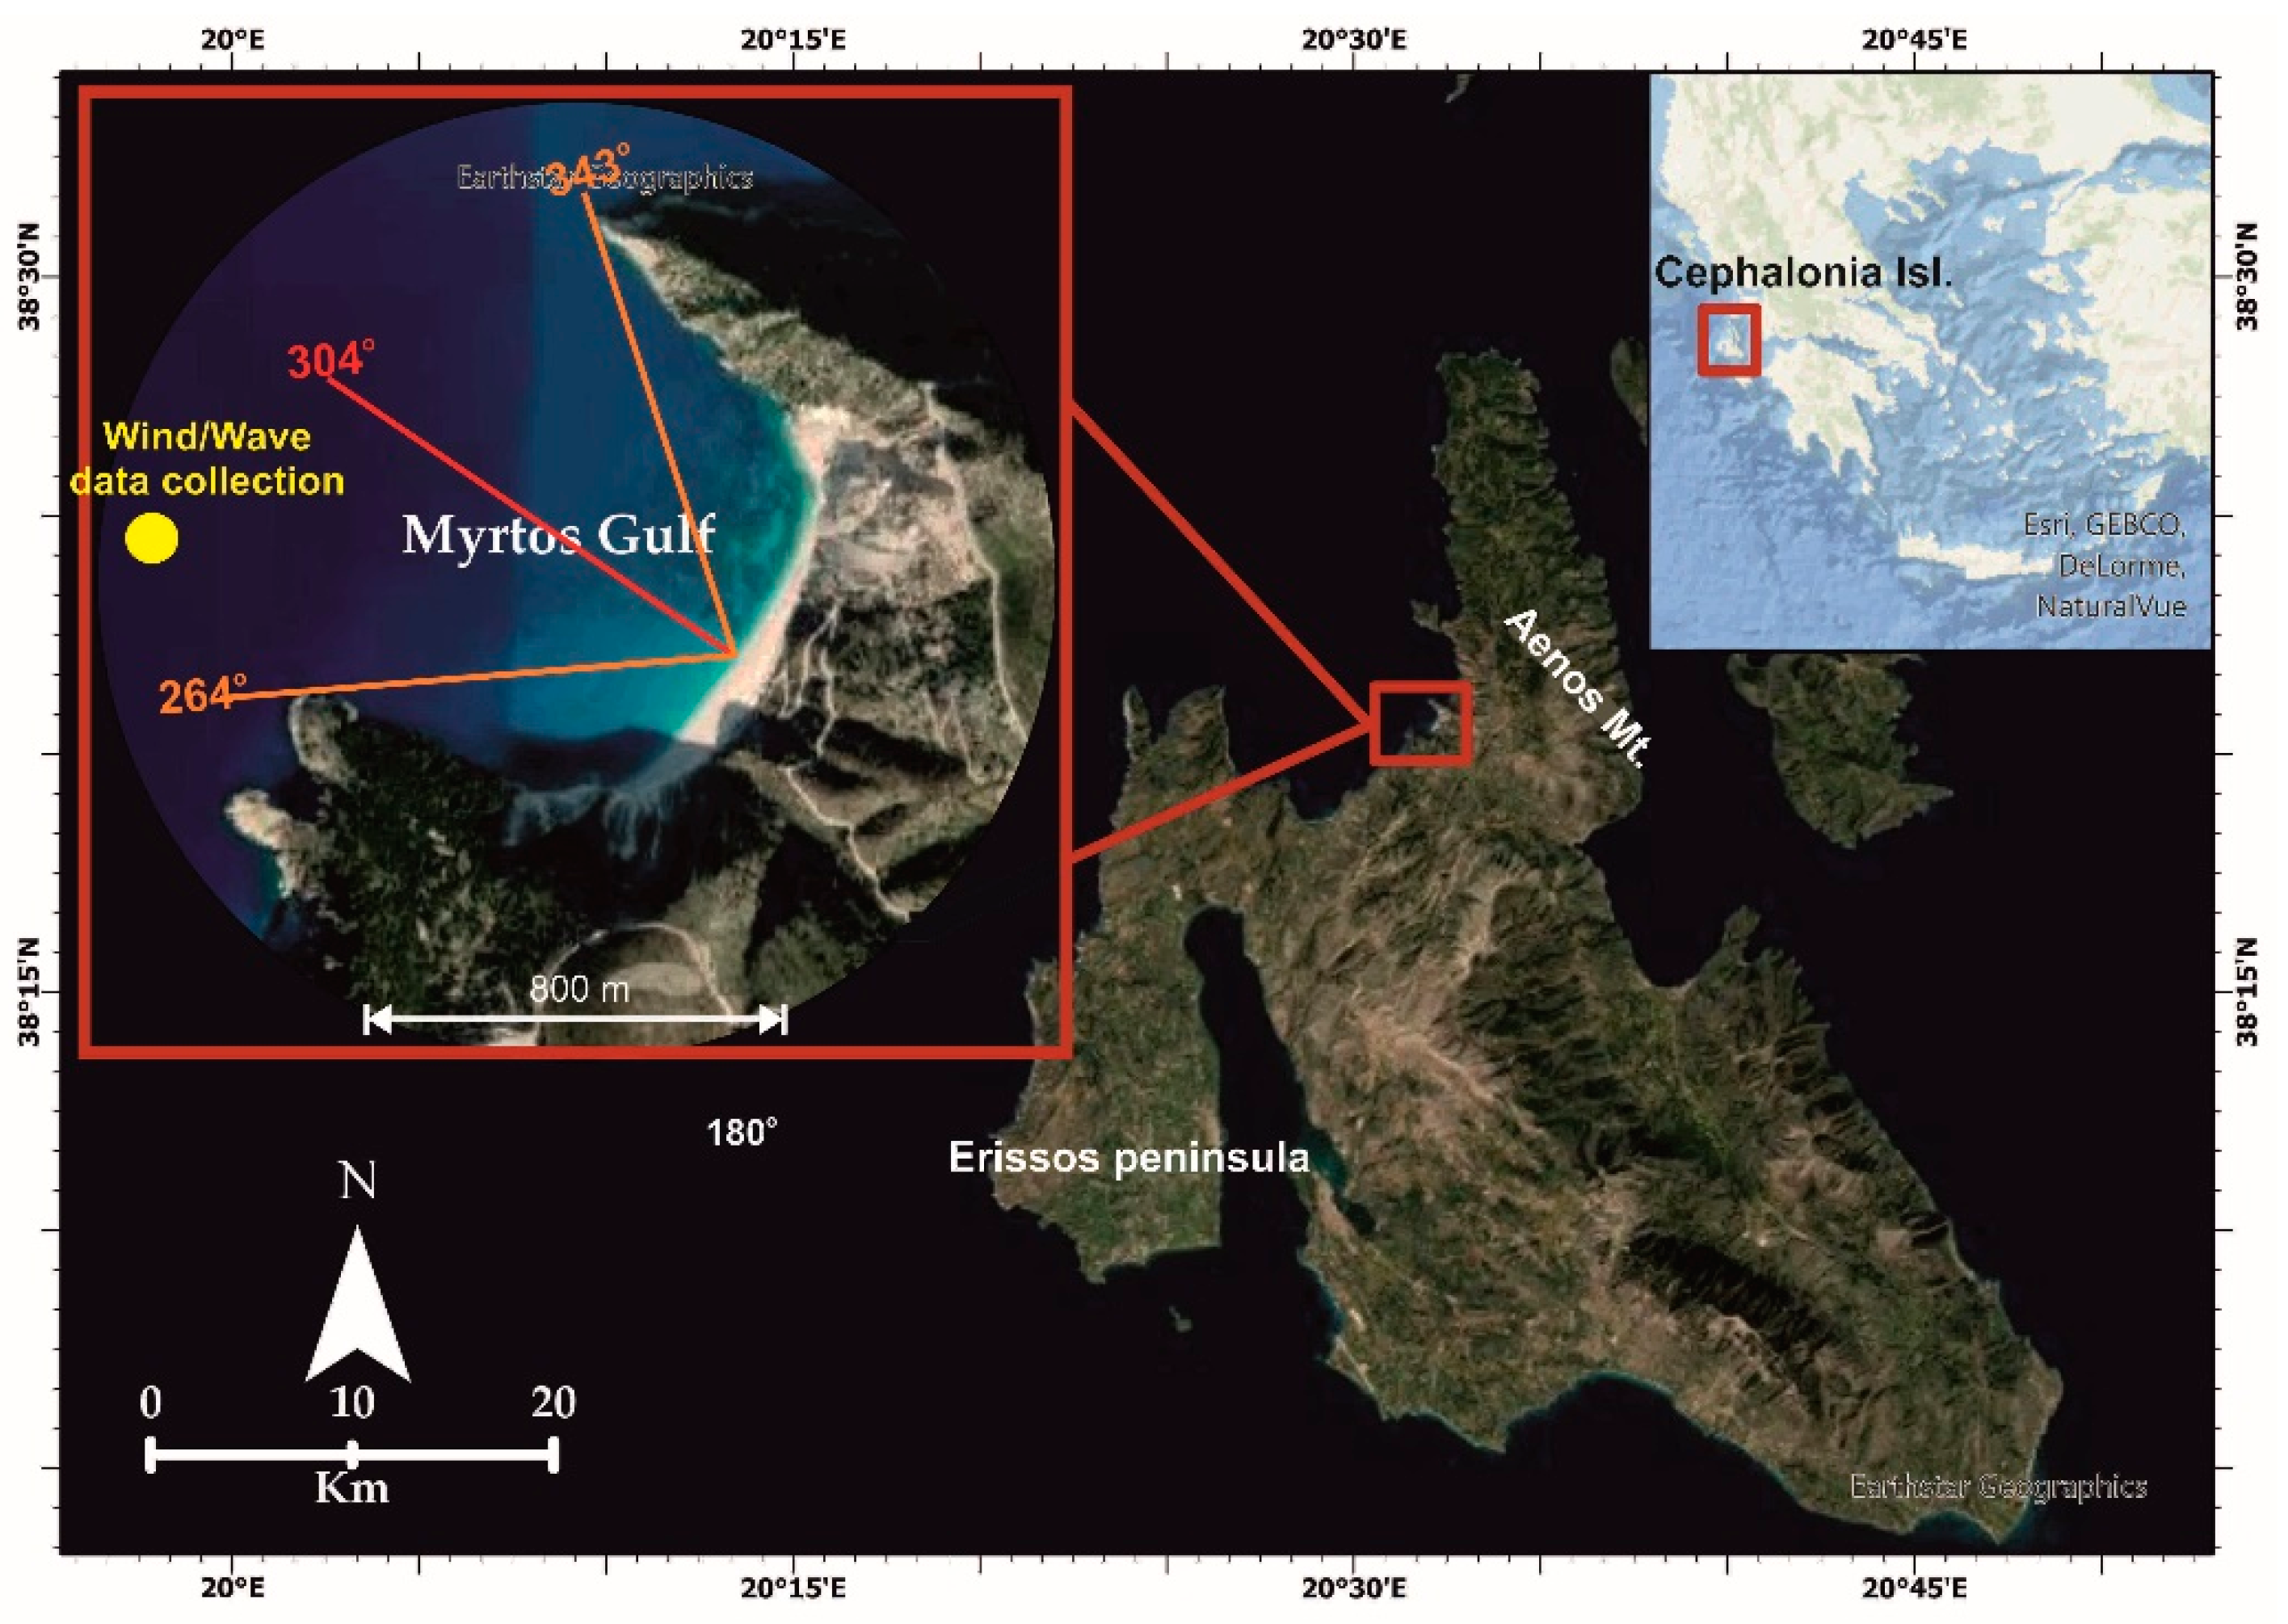
2. Geological and Geomorphological Setting
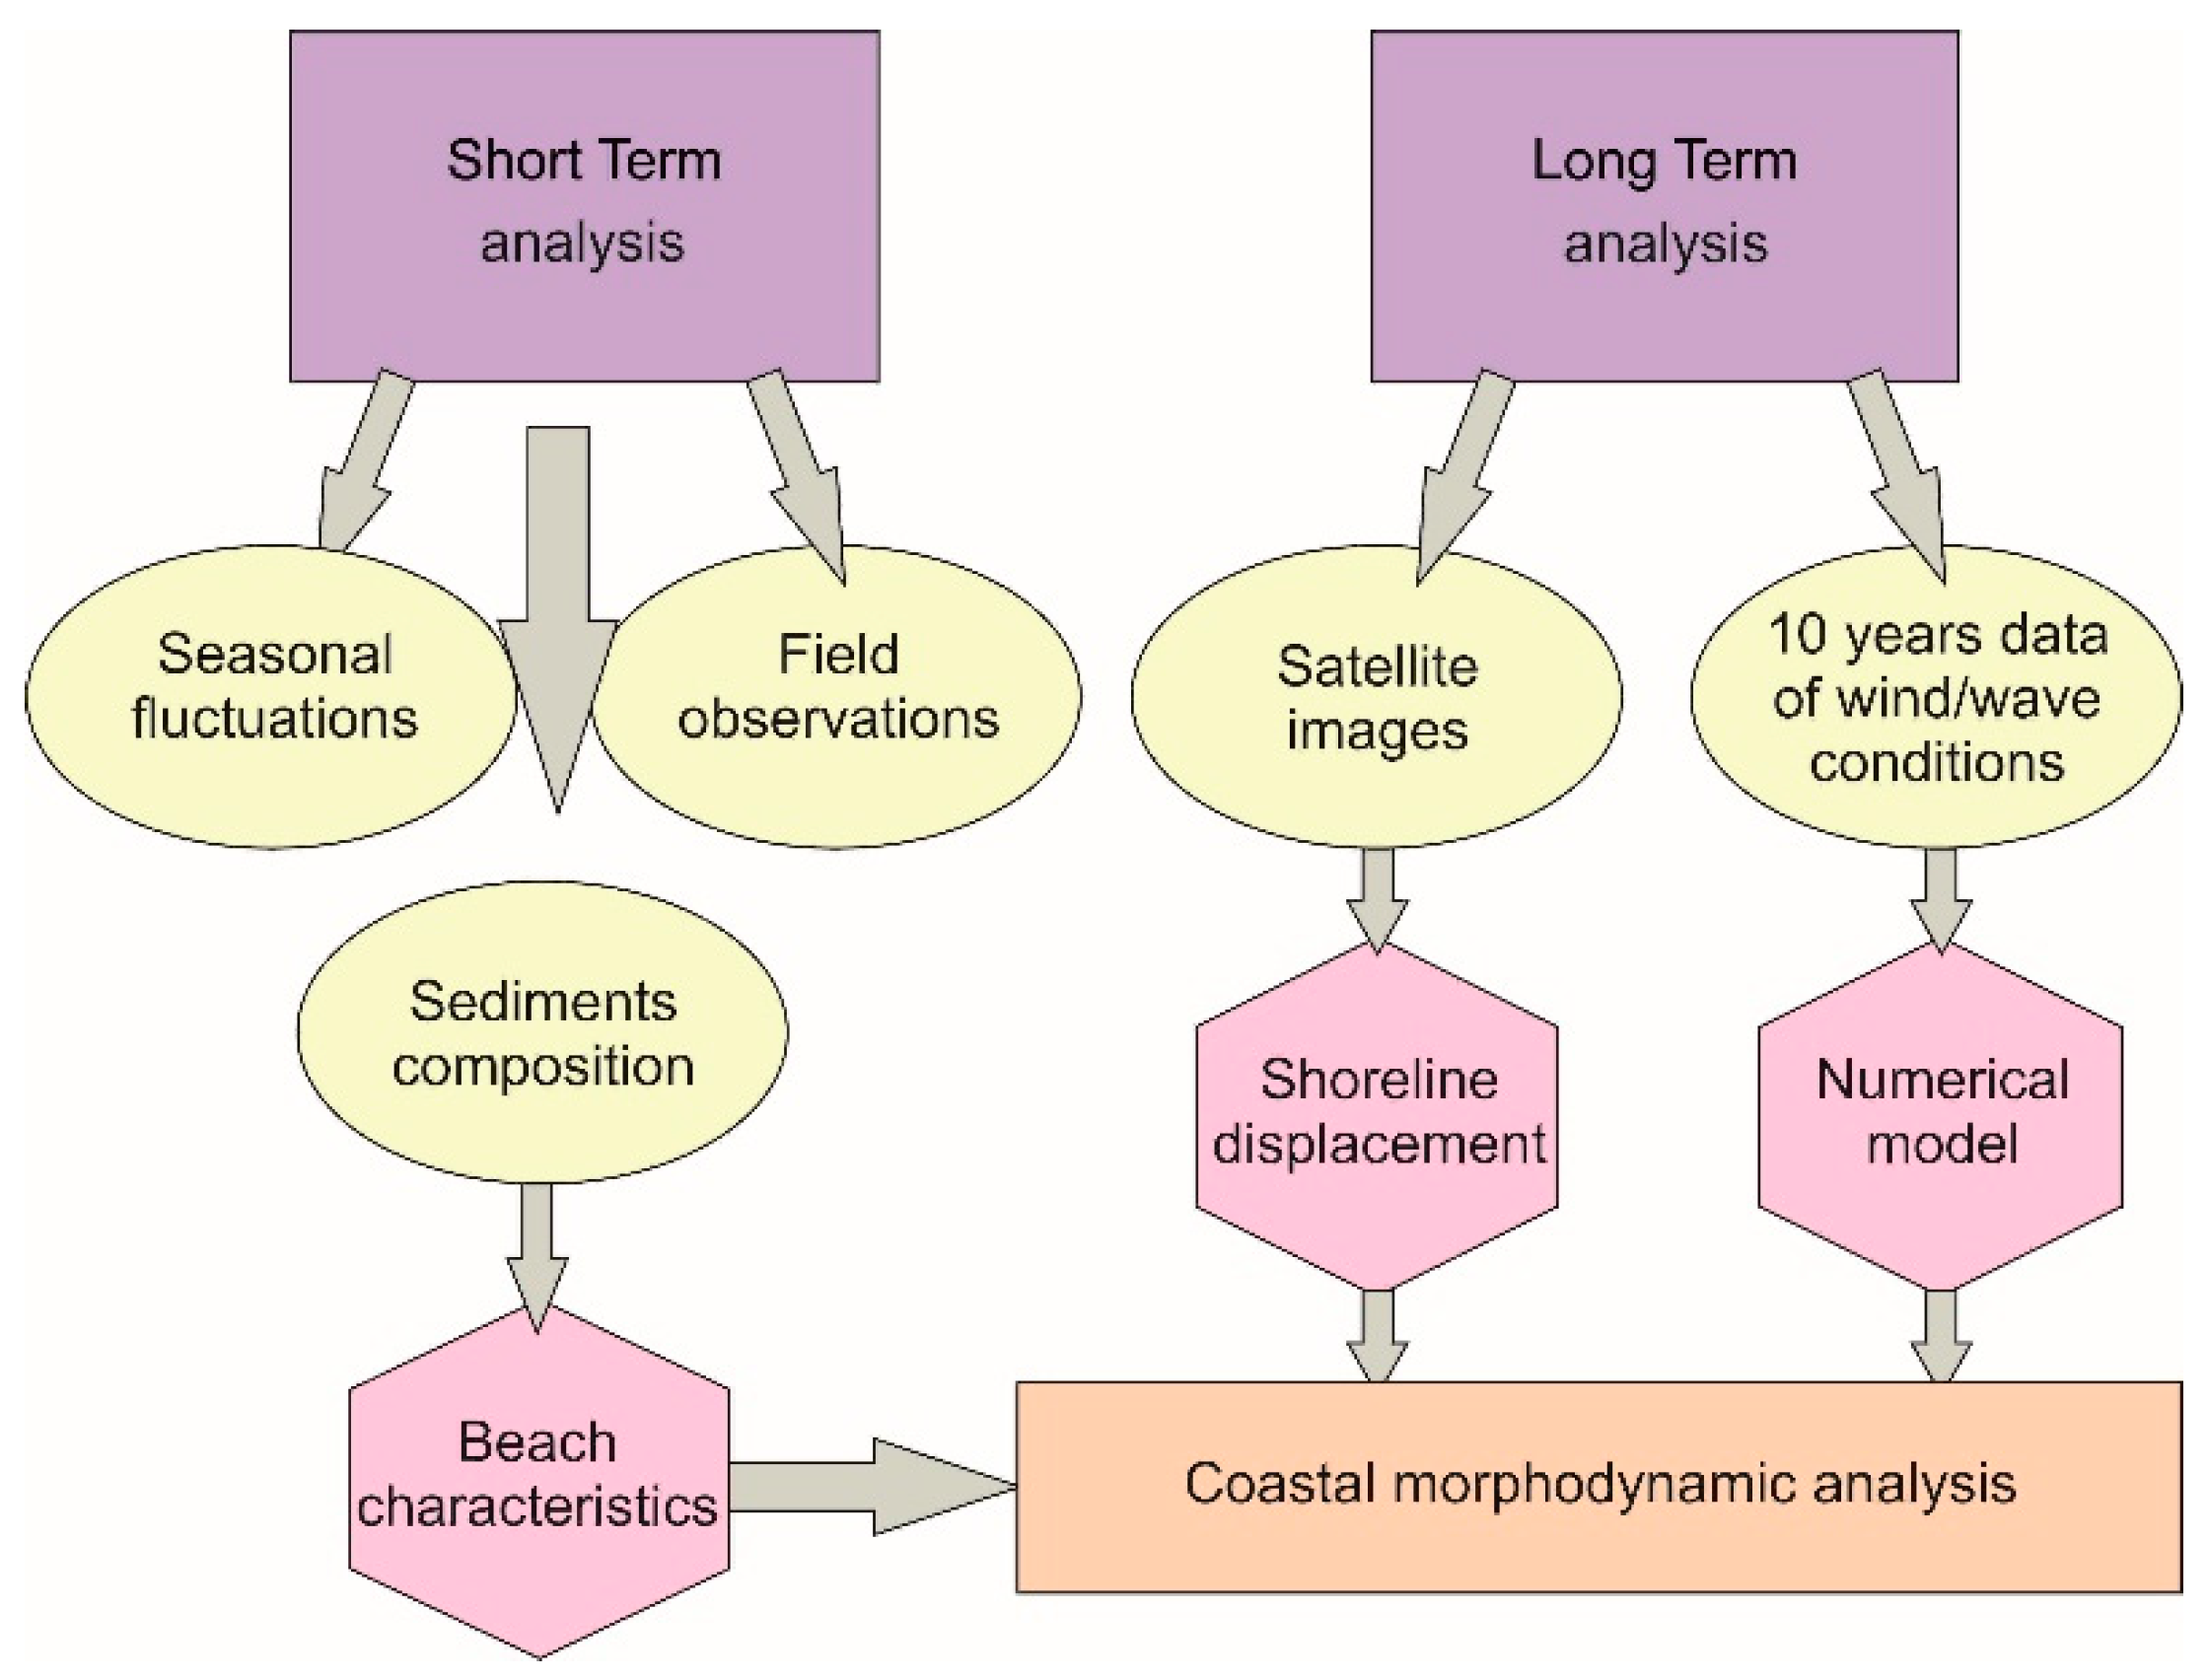
3. Materials and Methods
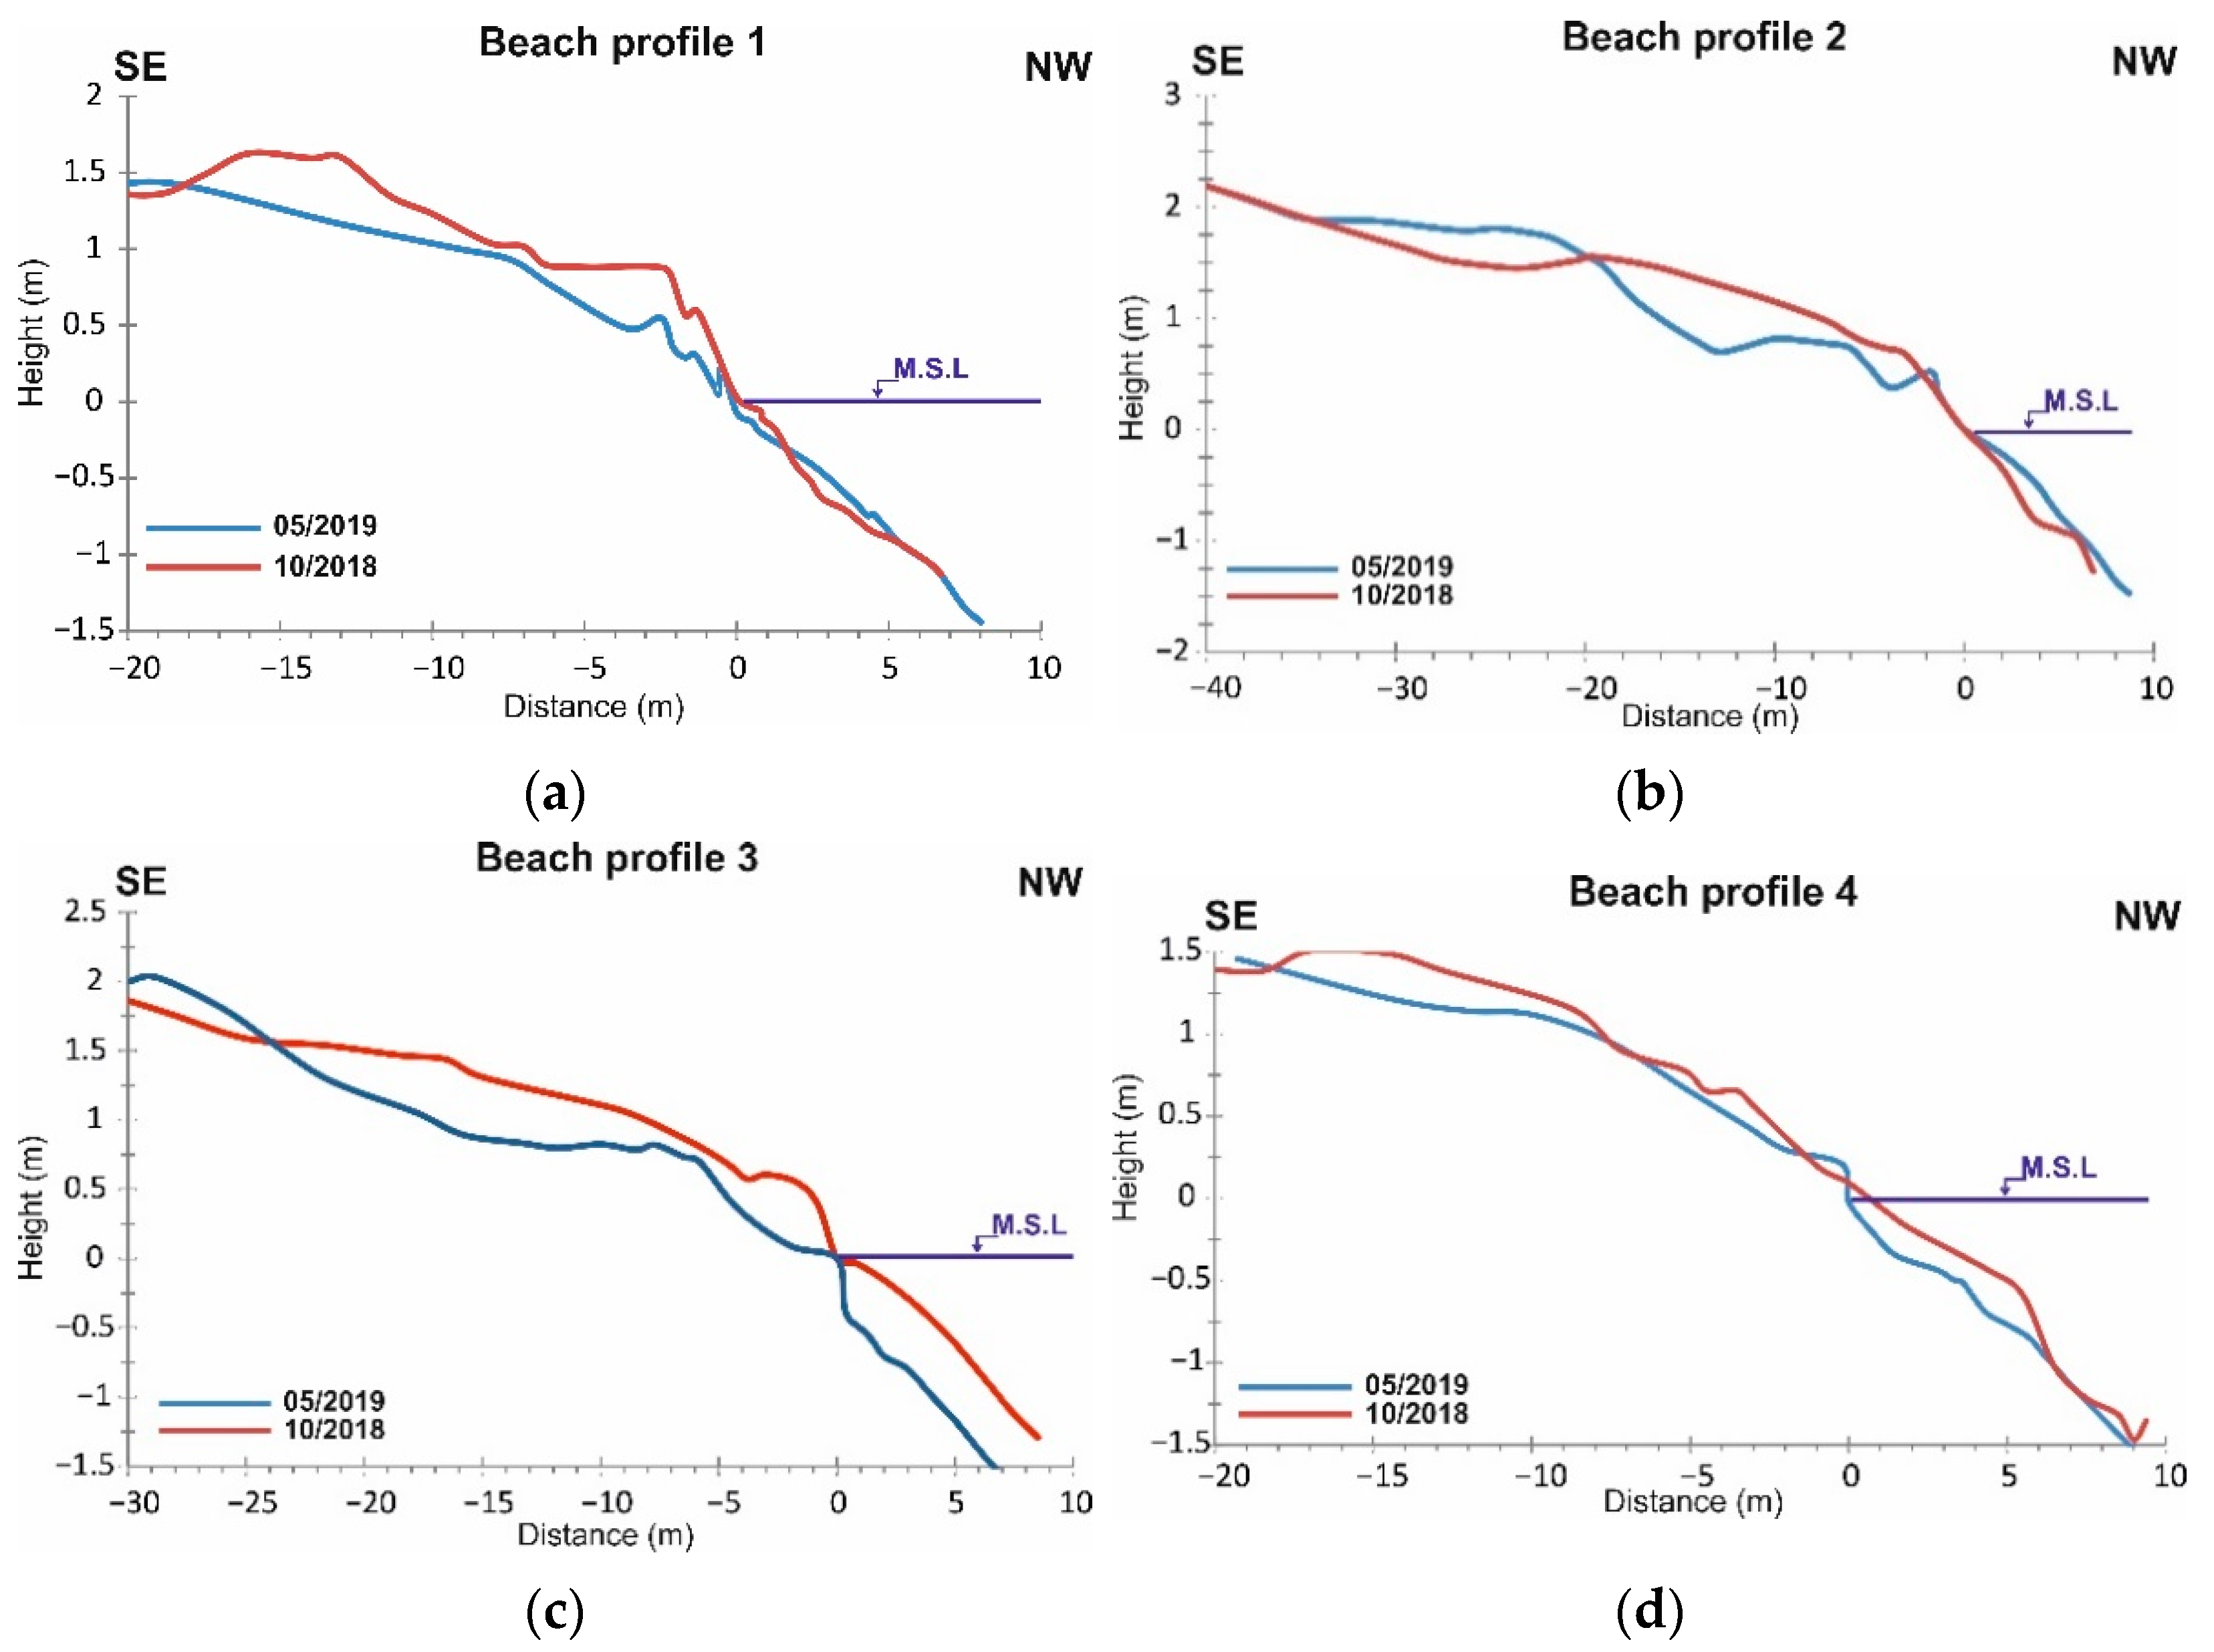
3.1. Short-Term Analysis and Measurements
3.2. Medium-to-Long-Term Analysis
3.2.1. Digital Shoreline Analysis System (DSAS)
3.2.2. Wind and Wave Data
3.2.3. Modeling
4. Results
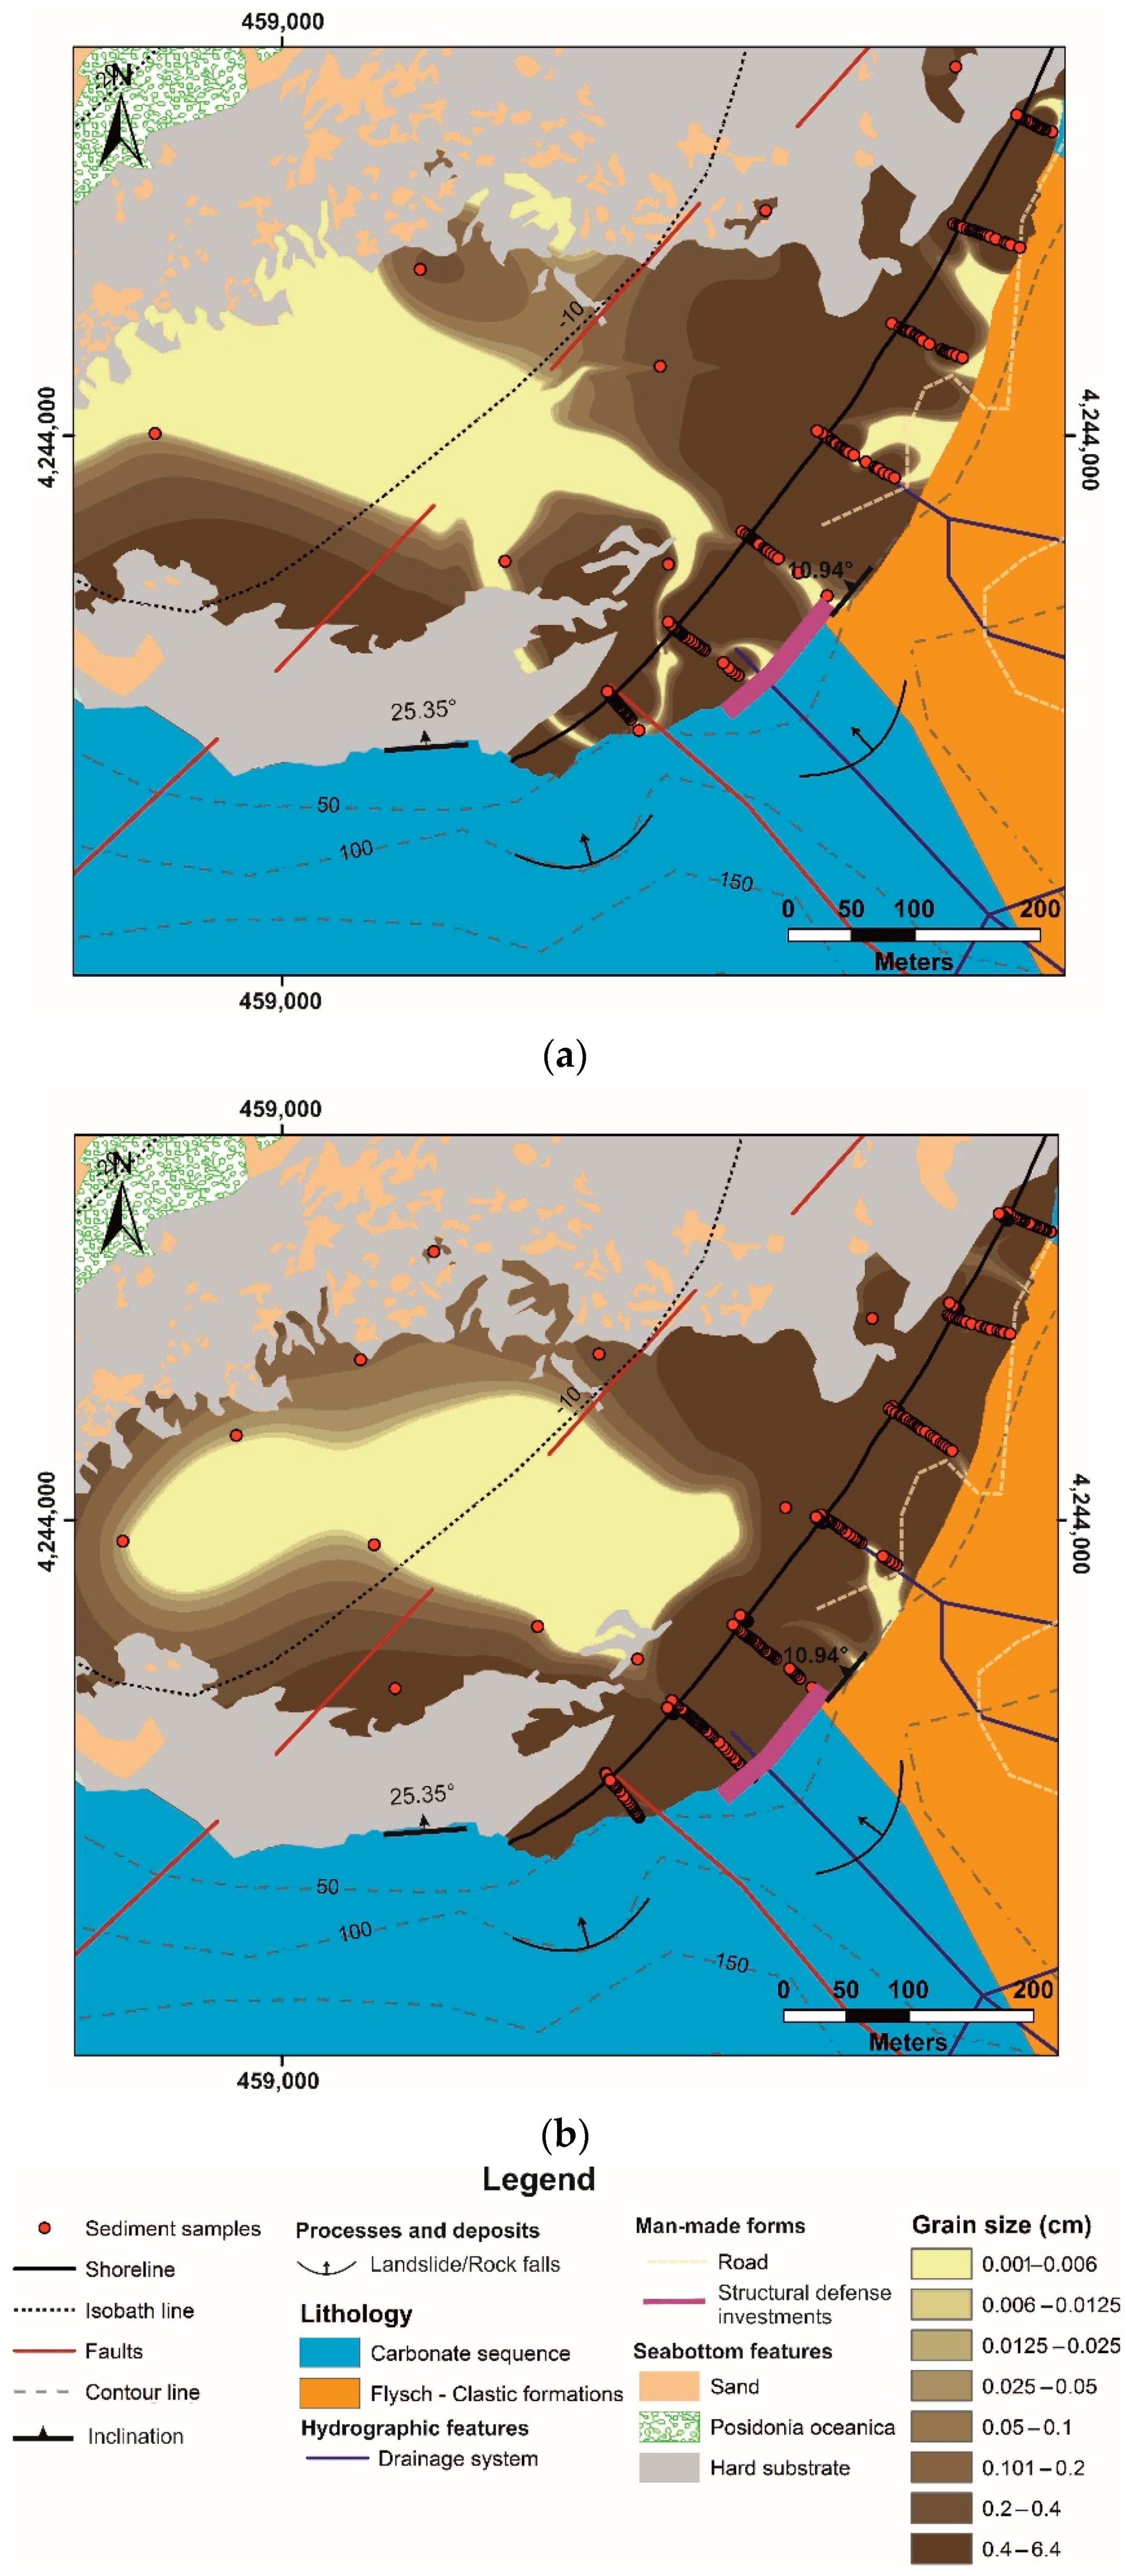
4.1. Morphological and Nearshore Characteristics and Grain Size Analysis
4.2. Digital Shoreline Analysis (DSAS)
4.3. Model Examination
5. Discussion
6. Conclusions
Supplementary Materials
Author Contributions
Funding
Acknowledgments
Conflicts of Interest
References
- Short, A.D.; Masselink, G. Embayed and structurally controlled beaches. In Handbook of Beach and Shoreface Morphodynamics; Short, A.D., Ed.; John Wiley and Sons Ltd.: Chichester, UK, 1999; pp. 230–249. [Google Scholar]
- Bowman, D.; Guillén, J.; López, L.; Pellegrino, V. Planview Geometry and morphological characteristics of pocket beaches on the Catalan coast (Spain). Geomorphology 2009, 108, 191–199. [Google Scholar] [CrossRef]
- Dehouck, A.; Dupuis, H.; Sénéchal, N. Pocket beach hydrodynamics: The example of four macrotidal beaches, Brittany, France. Mar. Geol. 2009, 266, 1–17. [Google Scholar] [CrossRef]
- Vousdoukas, M.I.; Velegrakis, A.F.; Dimou, K.; Zervakis, V.; Conley, D.C. Wave run-up observations in microtidal, sediment-starved pocket beaches of the Eastern Mediterranean. J. Mar. Syst. 2009, 78, S37–S47. [Google Scholar] [CrossRef]
- Storlazzi, C.D.; Field, M.E. Sediment distribution and transport along a rocky, embayed coast: Monterey Peninsula and Carmel Bay, California. Mar. Geol. 2000, 170, 289–316. [Google Scholar] [CrossRef]
- Short, A.D. Handbook of Beach and Shoreface Morphodynamics; John Wiley & Sons: New York, NY, USA, 1999; ISBN 0-471-96570-7. [Google Scholar]
- Klein, A.H.F.; Ferreira, Ó.; Dias, J.M.A.; Tessler, M.G.; Silveira, L.F.; Benedet, L.; de Menezes, J.T.; de Abreu, J.G.N. Morphodynamics of structurally controlled headland-bay beaches in southeastern Brazil: A review. Coast. Eng. 2010, 57, 98–111. [Google Scholar] [CrossRef]
- Hsu, J.R.C.; Yu, M.J.; Lee, F.C.; Benedet, L. Static bay beach concept for scientists and engineers: A review. Coast. Eng. 2010, 57, 76–91. [Google Scholar] [CrossRef]
- Daly, C.J.; Bryan, K.R.; Gonzalez, M.R.; Klein, A.H.F.; Winter, C. Effect of selection and sequencing of representative wave conditions on process-based predictions of equilibrium embayed beach morphology. Ocean Dyn. 2014, 64, 863–877. [Google Scholar] [CrossRef]
- Oliveira, S.; Moura, D.; Horta, J.; Nascimento, A.; Gomes, A.; Veiga-Pires, C. The morphosedimentary behaviour of a headland–beach system: Quantifying sediment transport using fluorescent tracers. Mar. Geol. 2017, 388, 62–73. [Google Scholar] [CrossRef]
- Short, A.D.; Trembanis, A.C.; Turner, I.L. Beach oscillation, rotation and the Southern Oscillation, Narrabeen Beach, Australia. In Proceedings of the Coastal Engineering 2000—27th International Conference on Coastal Engineering, Sydney, Australia, 16–21 July 2000; pp. 2439–2452. [Google Scholar] [CrossRef]
- Castelle, B.; Coco, G. The morphodynamics of rip channels on embayed beaches. Cont. Shelf Res. 2012, 43, 10–23. [Google Scholar] [CrossRef]
- Goda, Y. Reanalysis of regular and random breaking wave statistics. Coast. Eng. 2010, 52, 71–106. [Google Scholar] [CrossRef]
- Balouin, Y.; Belon, R. Evolution of Corsican pocket beaches. In Proceedings of the 13th International Coastal Symposium, Durban, South Africa, 13 April 2014; Green, A.N., Cooper, J.A.G., Eds.; pp. 96–101. [Google Scholar]
- Brunel, C.; Sabatier, F. Potential influence of sea-level rise in controlling shoreline position on the French Mediterranean Coast. Geomorphology 2009, 107, 47–57. [Google Scholar] [CrossRef]
- Horta, J.; Oliveira, S.; Moura, D.; Ferreira, Ó. Nearshore hydrodynamics at pocket beaches with contrasting wave exposure in southern Portugal. Estuar. Coast. Shelf Sci. 2018, 204, 40–55. [Google Scholar] [CrossRef]
- Norcross, Z.M.; Fletcher, C.H.; Merrifield, M. Annual and interannual changes on a reef-fringed pocket beach: Kailua Bay, Hawaii. Mar. Geol. 2002, 190, 553–580. [Google Scholar] [CrossRef]
- Sallenger, A.H.; Krabill, W.; Brock, J.; Swift, R.; Manizade, S.; Stockdon, H. Sea-cliff erosion as a function of beach changes and extreme wave runup during the 1997-1998 El Niño. Mar. Geol. 2002, 187, 279–297. [Google Scholar] [CrossRef]
- Anthony, E.J.; Gardel, A.; Dolique, F.; Guiral, D. Short-term changes in the plan shape of a sandy beach in response to sheltering by a nearshore mud bank, Cayenne, French Guiana. Earth Surf. Process. Landf. 2002, 27, 857–866. [Google Scholar] [CrossRef]
- Dalrymple, R.A.; MacMahan, J.H.; Reniers, A.J.H.M.; Nelko, V. Rip currents. Annu. Rev. Fluid Mech. 2011, 43, 551–581. [Google Scholar] [CrossRef]
- Van Dongeren, A.; Lowe, R.; Pomeroy, A.; Trang, D.M.; Roelvink, D.; Symonds, G.; Ranasinghe, R. Numerical modeling of low-frequency wave dynamics over a fringing coral reef. Coast. Eng. 2013, 73, 178–190. [Google Scholar] [CrossRef]
- Billi, P.; Fazzini, M. Global change and river flow in Italy. GPC 2017, 155, 234–246. [Google Scholar] [CrossRef]
- Hsu, J.R.-C.; Benedet, L.; Klein, A.H.F.; Raabe, A.L.A.; Tsai, C.P.; Hsu, T.W. Appreciation of static bay beach concept for coastal management and protection. J. Coast. Res. 2008, 24, 198–215. [Google Scholar] [CrossRef]
- Dean, R.G. Equilibrium beach profiles: Characteristics and applications. J. Coast. Res. 1991, 7, 53–84. [Google Scholar]
- Karunarathna, H.; Horrillo-Caraballo, J.M.; Reeve, D.E. Prediction of cross-shore beach profile evolution using a diffusion type model. Cont. Shelf Res. 2012, 48, 157–166. [Google Scholar] [CrossRef]
- Anfuso, G.; Pranzini, E.; Vitale, G. An integrated approach to coastal erosion problems in northern Tuscany (Italy): Littoral morphological evolution and cell distribution. Geomorphology 2011, 129, 204–214. [Google Scholar] [CrossRef]
- Papanikolaou, D. Geology of Greece, 1st ed.; Pataki: Athens, Greece, 2015; ISBN 978-960-16-6343-2. [Google Scholar]
- Lekkas, E.; Mavroulis, S. Fault zones ruptured during the early 2014 Cephalonia Island (Ionian Sea, Western Greece) earthquakes (January 26 and February 3, Mw 6.0) based on the associated co-seismic surface ruptures. J. Seismol. 2016, 20, 63–78. [Google Scholar] [CrossRef]
- Lekkas, E.L.; Mavroulis, S.D. Earthquake environmental effects and ESI 2007 seismic intensities of the early 2014 Cephalonia (Ionian Sea, western Greece) earthquakes (January 26 and February 3, Mw 6.0). Nat. Hazards 2015, 78, 1517–1544. [Google Scholar] [CrossRef]
- Saroglou, H. Rockfall susceptibility in Greece and study of coseismic events. In Proceedings of the 15th Symposium on Engineering Geology & Geotechnics, Belgrade, Serbia, 22–23 September 2016; pp. 19–35. [Google Scholar]
- Soukisian, T.; Hatzinaki, M.; Korres, G.; Papadopoulos, A.; Kallos, G.; Anadranistakis, E. Wind and Wave Atlas of the Hellenic Seas, 1st ed.; Hellenic Centre for Marine Research: Athens, Greece, 2007; ISBN 987 960 86651 9-4. [Google Scholar]
- Haiden, T.; Janousek, M.; Bauer, P.; Bidlot, J.-R.; Dahoui, M.; Ferranti, L.; Prates, F.; Richardson, D.; Vitart, F. Evaluation of ECMWF Forecasts, including 2014-2015 Upgrades; ECMWF: Reading, UK, 2015; 7p. [Google Scholar]
- Deltares Product User Guide for Sea Level and Ocean Wave Products-Time Series and Indicators C3S_422_Lot2_Deltares-European Services; ECMWF: Reading, UK, 2019.
- Sifnioti, D.; Soukissian, T.; Poulos, S.; Nastos, P.; Hatzaki, M. Evaluation of in-situ wind speed and wave height measurements against reanalysis data for the Greek Seas. Mediterr. Mar. Sci. 2017, 18, 486–503. [Google Scholar] [CrossRef][Green Version]
- Folk, R.L.; Ward, W.C. Brazos River bar [Texas]; a study in the significance of grain size parameters. J. Sediment. Res. 1957, 27, 3–26. [Google Scholar] [CrossRef]
- Blott, S.J.; Pye, K. GRADISTAT: A grain size distribution and statistics package for the analysis of unconsolidated sediments. Earth Surf. Processes Landf. 2001, 26, 1237–1248. [Google Scholar] [CrossRef]
- Thieler, E.R.; Himmelstoss, E.A.; Zichichi, J.L.; Ergul, A. The Digital Shoreline Analysis System (DSAS) Version 4.0—An ArcGIS Extension for Calculating Shoreline Change; U.S. Geological Survey: Reston, VA, USA, 2009. [Google Scholar]
- Anfuso, G.; Bowman, D.; Danese, C.; Pranzini, E. Transect based analysis versus area based analysis to quantify shoreline displacement: Spatial resolution issues. Environ. Monit. Assess. 2016, 188, 568. [Google Scholar] [CrossRef]
- Sedrati, M.; Anthony, E.J. A brief overview of plan-shape disequilibrium in embayed beaches: Tangier bay (Morocco). J. Mediterr. Geogr. 2007, 108, 125–130. [Google Scholar] [CrossRef]
- Balas, L.; Inan, A. A Numerical Model of Wave Propagation on Mild Slopes. J. Coast. Res. 2002, 36, 16–21. [Google Scholar] [CrossRef]
- Petropoulos, A.; Evelpidou, N.; Kapsimalis, V.; Anagnostou, C.; Karkani, A. Sediment transport patterns and beach morphodynamics in the semi-enclosed bay of Platis Gialos, Sifnos Island, Aegean Sea. Z. Geomorphol. 2021; in press. [Google Scholar] [CrossRef]
- MIKE powered by DHI. MIKE 21 Wave Modelling, MIKE 21 Spectral Waves FM; DHI: Horsholm, Denmark, 2017. [Google Scholar]
- Bulhoes, E.; Fernandez, G.B. Analysis of shallow water wave propagation and coastal response in embayed beaches. Case study in Cape Buzios, Rio de Janeiro, Brazil. J. Coast. Res. 2011, SI64, 2022–2026. [Google Scholar]
- Jose, F.; Kobashi, D.; Stone, G.W. Spectral wave transformation over an elongated sand shoal off south-central Louisiana, USA. J. Coast. Res. 2007, SI50, 757–761. [Google Scholar]
- Hallermeier, R.J. A profile zonation for seasonal sand beaches from wave climate. Coast. Eng. 1980, 4, 253–277. [Google Scholar] [CrossRef]
- Zou, Q.; Xie, D. Tide-surge and wave interaction in the Gulf of Maine during an extratropical storm. Ocean. Dyn. 2016, 66, 1715–1732. [Google Scholar] [CrossRef]
- Valkaniotis, S.; Ganas, A.; Papathanassiou, G.; Papanikolaou, M. Field observations of geological effects triggered by the January–February 2014 Cephalonia (Ionian Sea, Greece) earthquakes. Tectonophysics 2014, 630, 150–157. [Google Scholar] [CrossRef]
- Papathanassiou, G.; Valkaniotis, S.; Ganas, A. Evaluation of the macroseismic intensities triggered by the January/February 2014 Cephalonia, (Greece) earthquakes based on ESI-07 scale and their comparison to 1867 historical event. Quat. Int. 2017, 451, 234–247. [Google Scholar] [CrossRef]
- Saroglou, H.; Asteriou, P.; Tsiambaos, G.; Zekkos, D.; Clark, M.K.; Manousakis, J. Investigation of Two Co-Seismic Rockfalls During the 2015 Lefkada and 2014 Cephalonia Earthquakes in Greece. In Proceedings of the 3rd North American Symposium on Landslides, Roanoke, VA, USA, 4–8 June 2017; pp. 521–528. [Google Scholar]
- Theodoulidis, N.; Karakostas, C.; Lekidis, V.; Makra, K.; Margaris, B.; Morfidis, K.; Papaioannou, C.; Rovithis, E.; Salonikios, T.; Savvaidis, A. The Cephalonia, Greece, January 26 (M6.1) and February 3, 2014 (M6.0) earthquakes: Near-fault ground motion and effects on soil and structures. Bull. Earthq. Eng. 2016, 14, 1–38. [Google Scholar] [CrossRef]
- Coastal Engineering Research Center (CERC). Shore Protection Manual; US Army Corps of Engineers, Ed.; Scientific Research Publishing: Washington, DC, USA, 1984; Volume I-I. [Google Scholar]
- Borah, D.K.; Balloffet, A. Beach Evolution Caused by Littoral Drift Barrier. J. Waterw. Port Coast. Ocean. Eng. 1985, 111, 645–660. [Google Scholar] [CrossRef]
- IEC TS 62600-101; Marine Energy—Wave, Tidal and Other Water Current Converters—Part 101: Wave Energy Resource Assessment and Characterization. 1st ed. International Electrotechnical Commission (IEC): Geneva, Switzerland, 2015; ISBN 978-2-8322-2724-4.
- Tucker, M.J.; Malcolm, J.; Pitt, E.G. Waves in Ocean Engineering, 1st ed.; Tucker, M.J., Malcolm, J., Pitt, E.G., Eds.; Elsevier Science & Technology: Oxford, UK, 2001; ISBN 9780080435664. [Google Scholar]
- Kapsimalis, V.; Gad, F.K. Research, Study of the Coastal Zone and the Marine Area of the Gulf of Chania. Coastal Engineering Investigation of the Coastal Zones of Kolimbari-Tavronitis & Platania-Kato Stalou. In Study of Erosion and Protection of the Coasts of the Gulf of Chania; H.C.M.R.: Athens, Greek, 2016. [Google Scholar]
- Gad, F.K.; Chatzinaki, M.; Vandarakis, D.; Kyriakidou, C.; Kapsimalis, V. Assessment of wave storm-induced flood vulnerability in rhodes island, greece. Water 2020, 12, 2978. [Google Scholar] [CrossRef]
- Cooper, N.J.; Barber, P.C.; Bray, M.J.; Carter, D.J. Shoreline management plans: A national review and engineering perspective. In Proceedings of the Institution of Civil Engineers—Water and Maritime Engineering; Thomas Telford Ltd.: London, UK, 2002; Volume 154, pp. 221–228. [Google Scholar] [CrossRef]
- Carter, R.W.G. Coastal Environments: An Introduction to the Physical, Ecological and Cultural Systems of Coastlines; Academic Press Inc.: Cambridge, MA, USA, 1988; ISBN 0121618552. [Google Scholar]
- Taylor, J.A.; Murdock, A.P.; Pontee, N.I. A macroscale analysis of coastal steepening around the coast of England and Wales. Geogr. J. 2004, 170, 179–188. [Google Scholar] [CrossRef]
- Dornbusch, U.; Williams, R.B.G.; Moses, C.A.; Robinson, D.A. Foreshore narrowing along the coast of southeast England, UK—A reevaluation. J. Coast. Res. 2008, 24, 14–24. [Google Scholar] [CrossRef]
- Orford, J.; Anthony, E. 10.9 Coastal Gravel Systems. In Treatise on Geomorphology; Elsevier: Amsterdam, The Netherlands, 2013; pp. 245–266. [Google Scholar]
- Simeone, S.; Palombo, L.; De Falco, G. Morphodynamics of a nontidal embayed beach: The case study of is arutas (Western Mediterranean). J. Coast. Res. 2013, 29, 63–71. [Google Scholar] [CrossRef]
- Alexandrakis, G.; Ghionis, G.; Poulos, S. The Effect of Beach Rock Formation on the Morphological Evolution of a Beach. The Case Study of an Eastern Mediterranean Beach: Ammoudara, Greece. J. Coast. Res. 2013, 69, 47–59. [Google Scholar] [CrossRef]
- Bascom, W.N. The relationship between sand size and beach-face slope. Trans. Am. Geophys. Union 1951, 32, 866. [Google Scholar] [CrossRef]
- Wright, L.D.; Short, A.D. Morphodynamic variability of surf zones and beaches: A synthesis. Mar. Geol. 1984, 56, 93–118. [Google Scholar] [CrossRef]
- Ranasinghe, R.; McLoughlin, R.; Short, A.; Symonds, G. The Southern Oscillation Index, wave climate, and beach rotation. Mar. Geol. 2004, 204, 273–287. [Google Scholar] [CrossRef]
- Thomas, T.; Phillips, M.R.; Williams, A.T.; Jenkins, R.E. Medium time-scale behaviour of adjacent embayed beaches: Influence of low energy external forcing. Appl. Geogr. 2012, 32, 265–280. [Google Scholar] [CrossRef]
- Short, A.D.; Trembanis, A.C. Decadal scale patterns in beach oscillation and rotation Narrabeen beach, Australia—Time series, PCA and wavelet analysis. J. Coast. Res. 2004, 20, 523–532. [Google Scholar] [CrossRef]
- Kuang, C.; Han, X.; Zhang, J.; Zou, Q.; Dong, B. Morphodynamic Evolution of a Nourished Beach with Artificial Sandbars: Field Observations and Numerical Modeling. J. Mar. Sci. Eng. 2021, 9, 245. [Google Scholar] [CrossRef]
- Davidson-Arnott, R. 10.6 Nearshore Bars. In Treatise on Geomorphology; Shroder, J., Sherman, D.J., Eds.; Academic Press: San Diego, CA, USA, 2013; Volume 10, pp. 130–148. ISBN 9780080885223. [Google Scholar]
- Oppenheimer, M.; Glavovic, B.C.; Hinkel, J.; van de Wal, R.; Magnan, A.K.; Abd-EIgawad, A.; Cai, R.; Cifuentes-Jara, M.; DeConto, R.M.; Ghosh, T.; et al. Sea Level Rise and Implications for Low-Lying Islands, Coasts and Communities; Pörtner, H.-O., Roberts, D.C., Masson-Delmotte, V., Zhai, P., Tignor, M., Poloczanska, E., Mintenbeck, K., Alegría, A., Nicolai, M., Okem, A., et al., Eds.; Cambridge University Press: Cambridge, UK; New York, NY, USA; Geneva, Switzerland, 2019; pp. 321–446. [Google Scholar] [CrossRef]
- Evelpidou, N.; Petropoulos, A.; Karkani, A.; Saitis, G. Evidence of Coastal Changes in the West Coast of Naxos Island, Cyclades, Greece. J. Mar. Sci. Eng. 2021, 9, 1427. [Google Scholar] [CrossRef]
- Karkani, A.; Evelpidou, N.; Giaime, M.; Marriner, N.; Morhange, C.; Spada, G. Late Holocene sea-level evolution of Paros Island (Cyclades, Greece). Quat. Int. 2019, 500, 139–146. [Google Scholar] [CrossRef]
- Defeo, O.; McLachlan, A.; Schoeman, D.S.; Schlacher, T.A.; Dugan, J.; Jones, A.; Lastra, M.; Scapini, F. Threats to sandy beach ecosystems: A review. Estuar. Coast. Shelf Sci. 2009, 81, 1–12. [Google Scholar] [CrossRef]
- Smith, K. We are seven billion. Nat. Clim. Change 2011, 1, 331–335. [Google Scholar] [CrossRef]
- Brown, S.; Nicholls, R.J.; Goodwin, P.; Haigh, I.D.; Lincke, D.; Vafeidis, A.T.; Hinkel, J.; Brown, S.; Nicholls, R.J.; Goodwin, P.; et al. Quantifying Land and People Exposed to Sea-Level Rise with No Mitigation and 1.5 °C and 2.0 °C Rise in Global Temperatures to Year 2300. EaFut 2018, 6, 583–600. [Google Scholar] [CrossRef]
- Orford, J.D.; Pethick, J. Challenging assumptions of future coastal habitat development around the UK. Earth Surf. Processes Landf. 2006, 31, 1625–1642. [Google Scholar] [CrossRef]
- WHO. COP24 Special Report: Health and Climate Change; World Health Organization: Geneva, Switzerland, 2018. [Google Scholar]
- IPCC. Global Warming of 1.5 °C The Context Of Strengthening The Global Response To The Threat Of Climate Change, Sustainable Development, and Efforts to Eradicate Poverty; IPCC: Geneva, Switzerland, 2018. [Google Scholar]
- Norwegian Red Cross (NRC). Overlapping Vulnerabilities: The Impacts of Climate Change on Humanitarian Needs; Norwegian Red Cross: Oslo, Norway, 2019. [Google Scholar]
- Chapin, F.S.; Carpenter, S.R.; Kofinas, G.P.; Folke, C.; Abel, N.; Clark, W.C.; Olsson, P.; Smith, D.M.S.; Walker, B.; Young, O.R.; et al. Ecosystem stewardship: Sustainability strategies for a rapidly changing planet. Trends Ecol. Evol. 2010, 25, 241–249. [Google Scholar] [CrossRef]
- Cantasano, N.; Pellicone, G.; Ietto, F. The Coastal Sustainability Standard method: A case study in Calabria (Southern Italy). Ocean. Coast. Manag. 2020, 183, 104962. [Google Scholar] [CrossRef]
- Del-Rosal-Salido, J.; Folgueras, P.; Bermúdez, M.; Ortega-Sánchez, M.; Losada, M. Flood management challenges in transitional environments: Assessing the effects of sea-level rise on compound flooding in the 21st century. Coast. Eng. 2021, 167, 103872. [Google Scholar] [CrossRef]


| Parameters | Values |
|---|---|
| Sediment Grading (√(d_84 ÷ d_16)) | 1.1–2 |
| Mean Grain Size (Mz) | 0.07–1.9 mm |
| Manning Number | 10–32 m1/3/s |
| Bed Thickness | 0.05–2 m |
| Scenario | H Sign. (m) | T(s) | MWD (Deg N) | Duration (Days) |
|---|---|---|---|---|
| 1 | 2.25 | 8.25 | 300 | 7 |
| 2 | 0.75 | 5.25 | 315 | 203 |
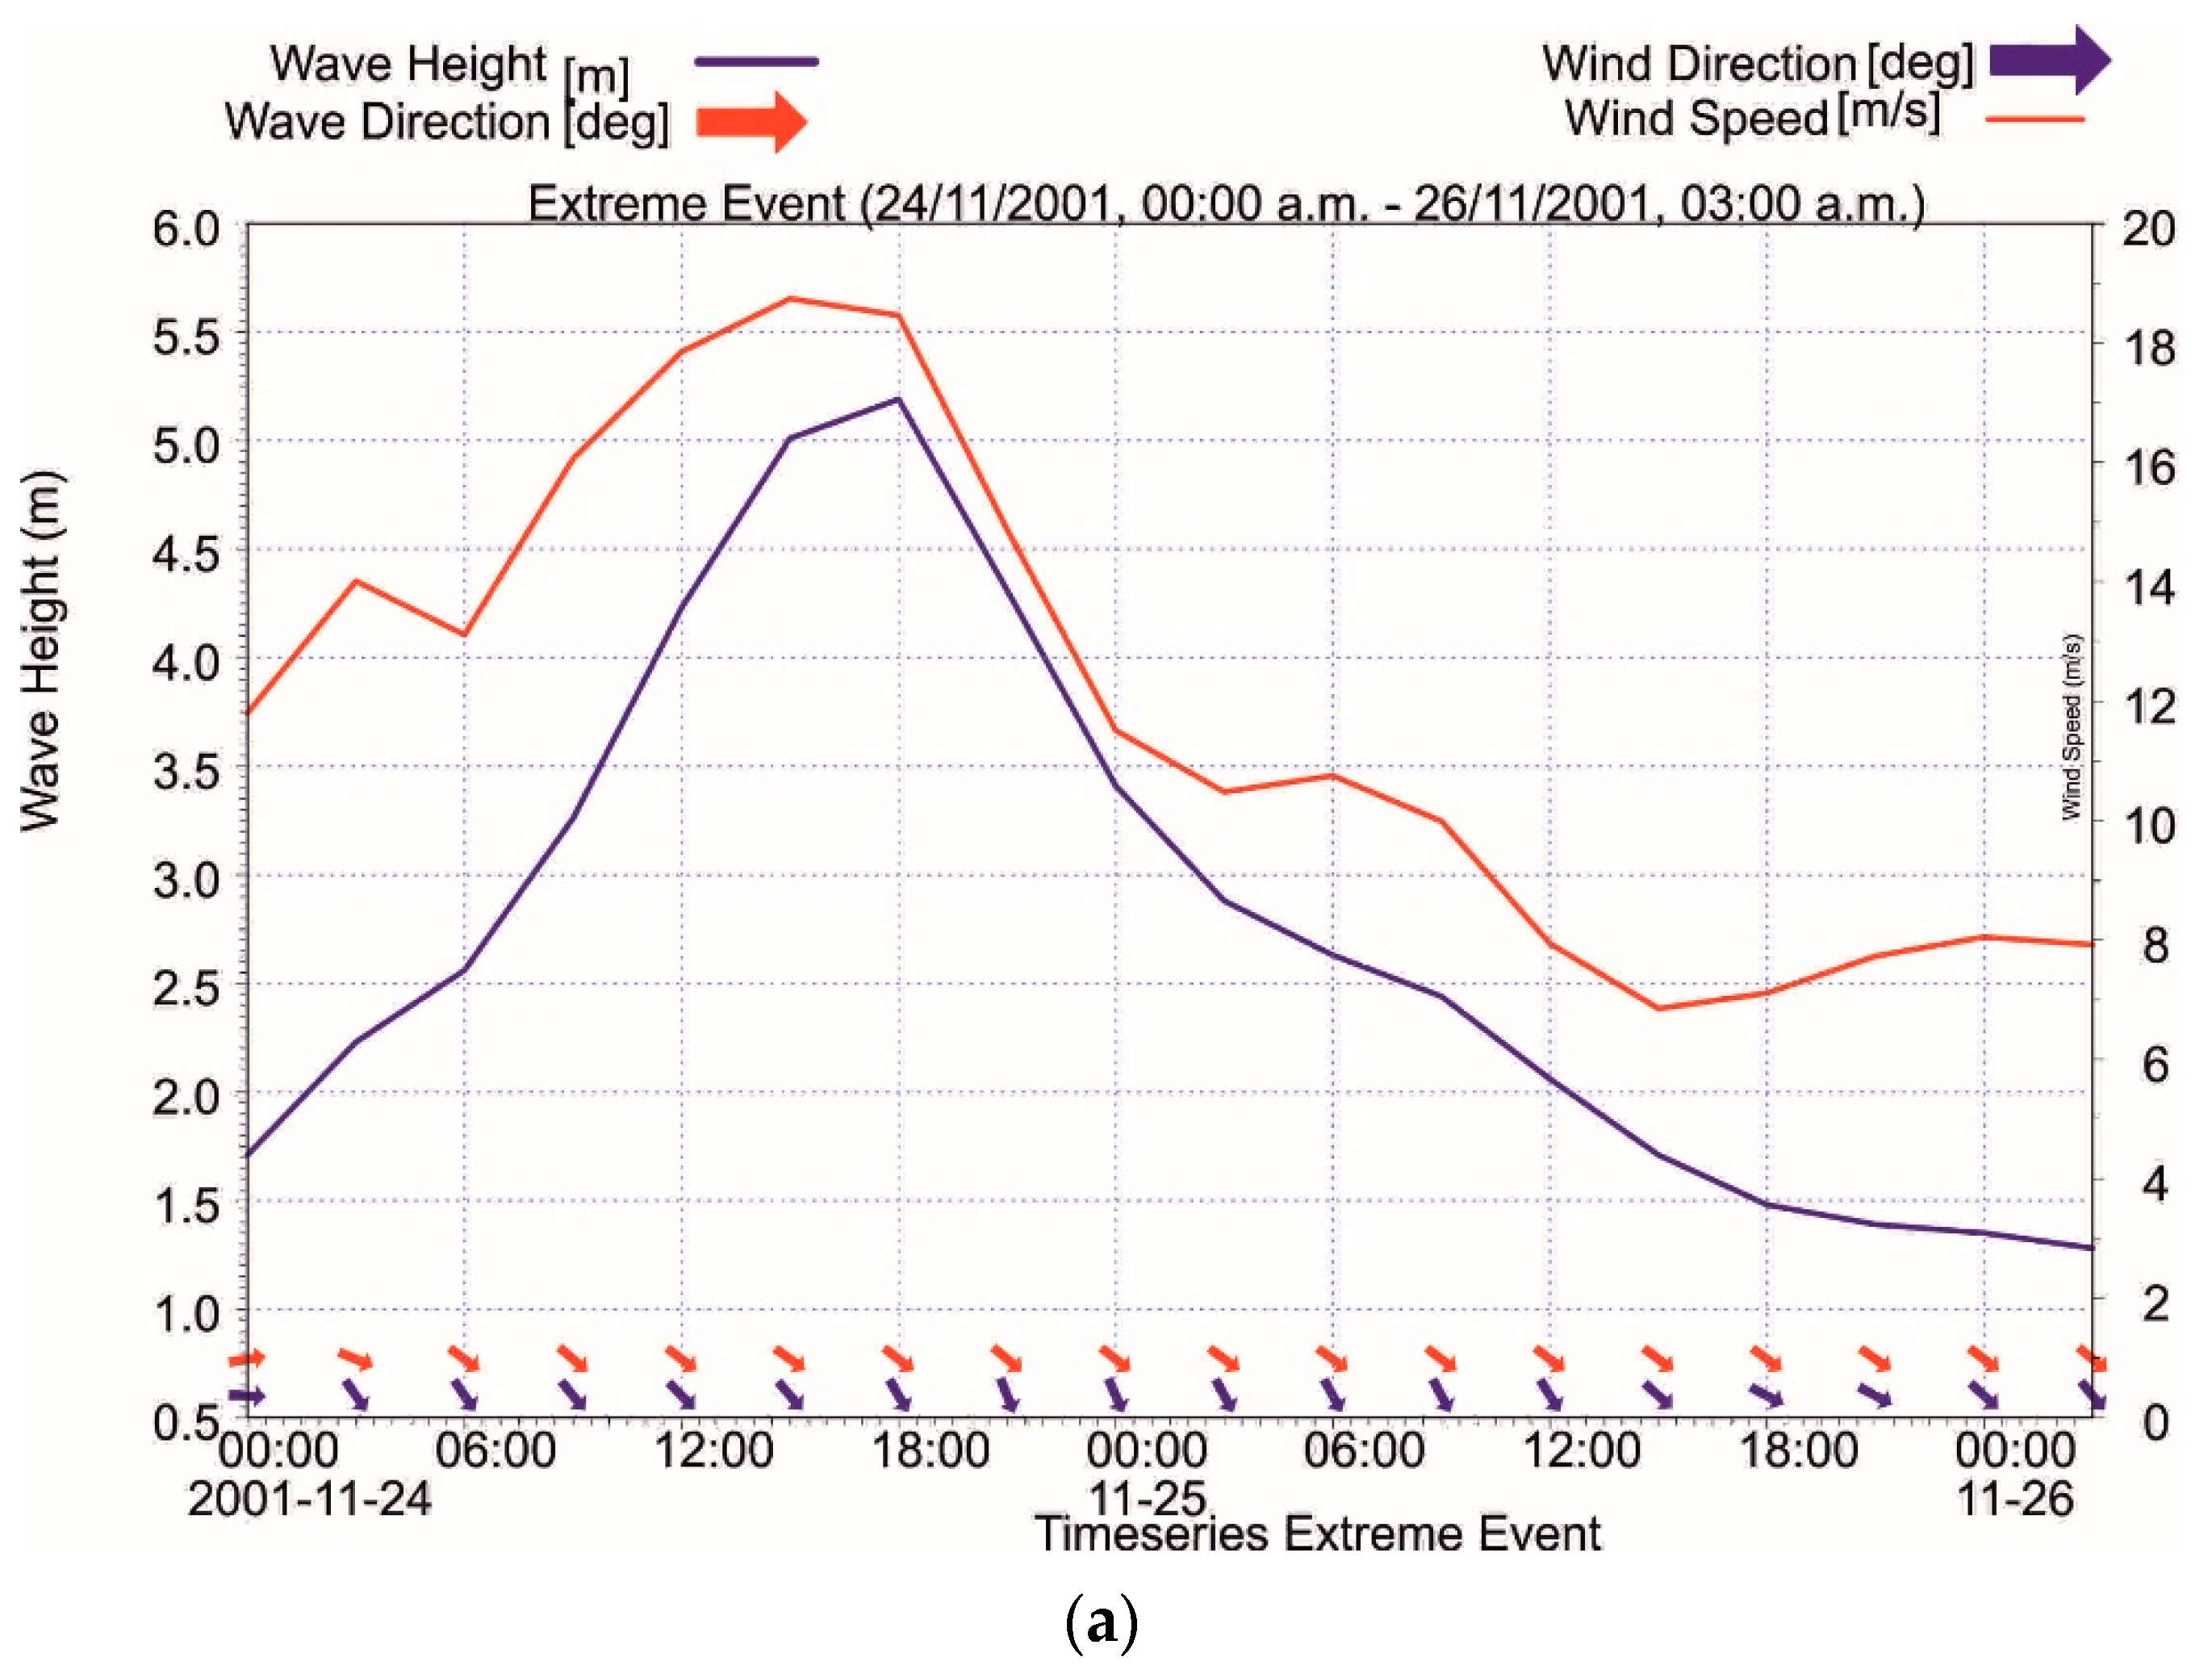
| Scenario | Hmean (m) | Hmax (m) | Tmax (s) | MWD (Deg N) | Duration (Days) | Start Date—Time |
|---|---|---|---|---|---|---|
| Extreme Event | 2.7 | 5.19 | 10.26 | 304 | 2.2 | 24/11/2001—00:00 |
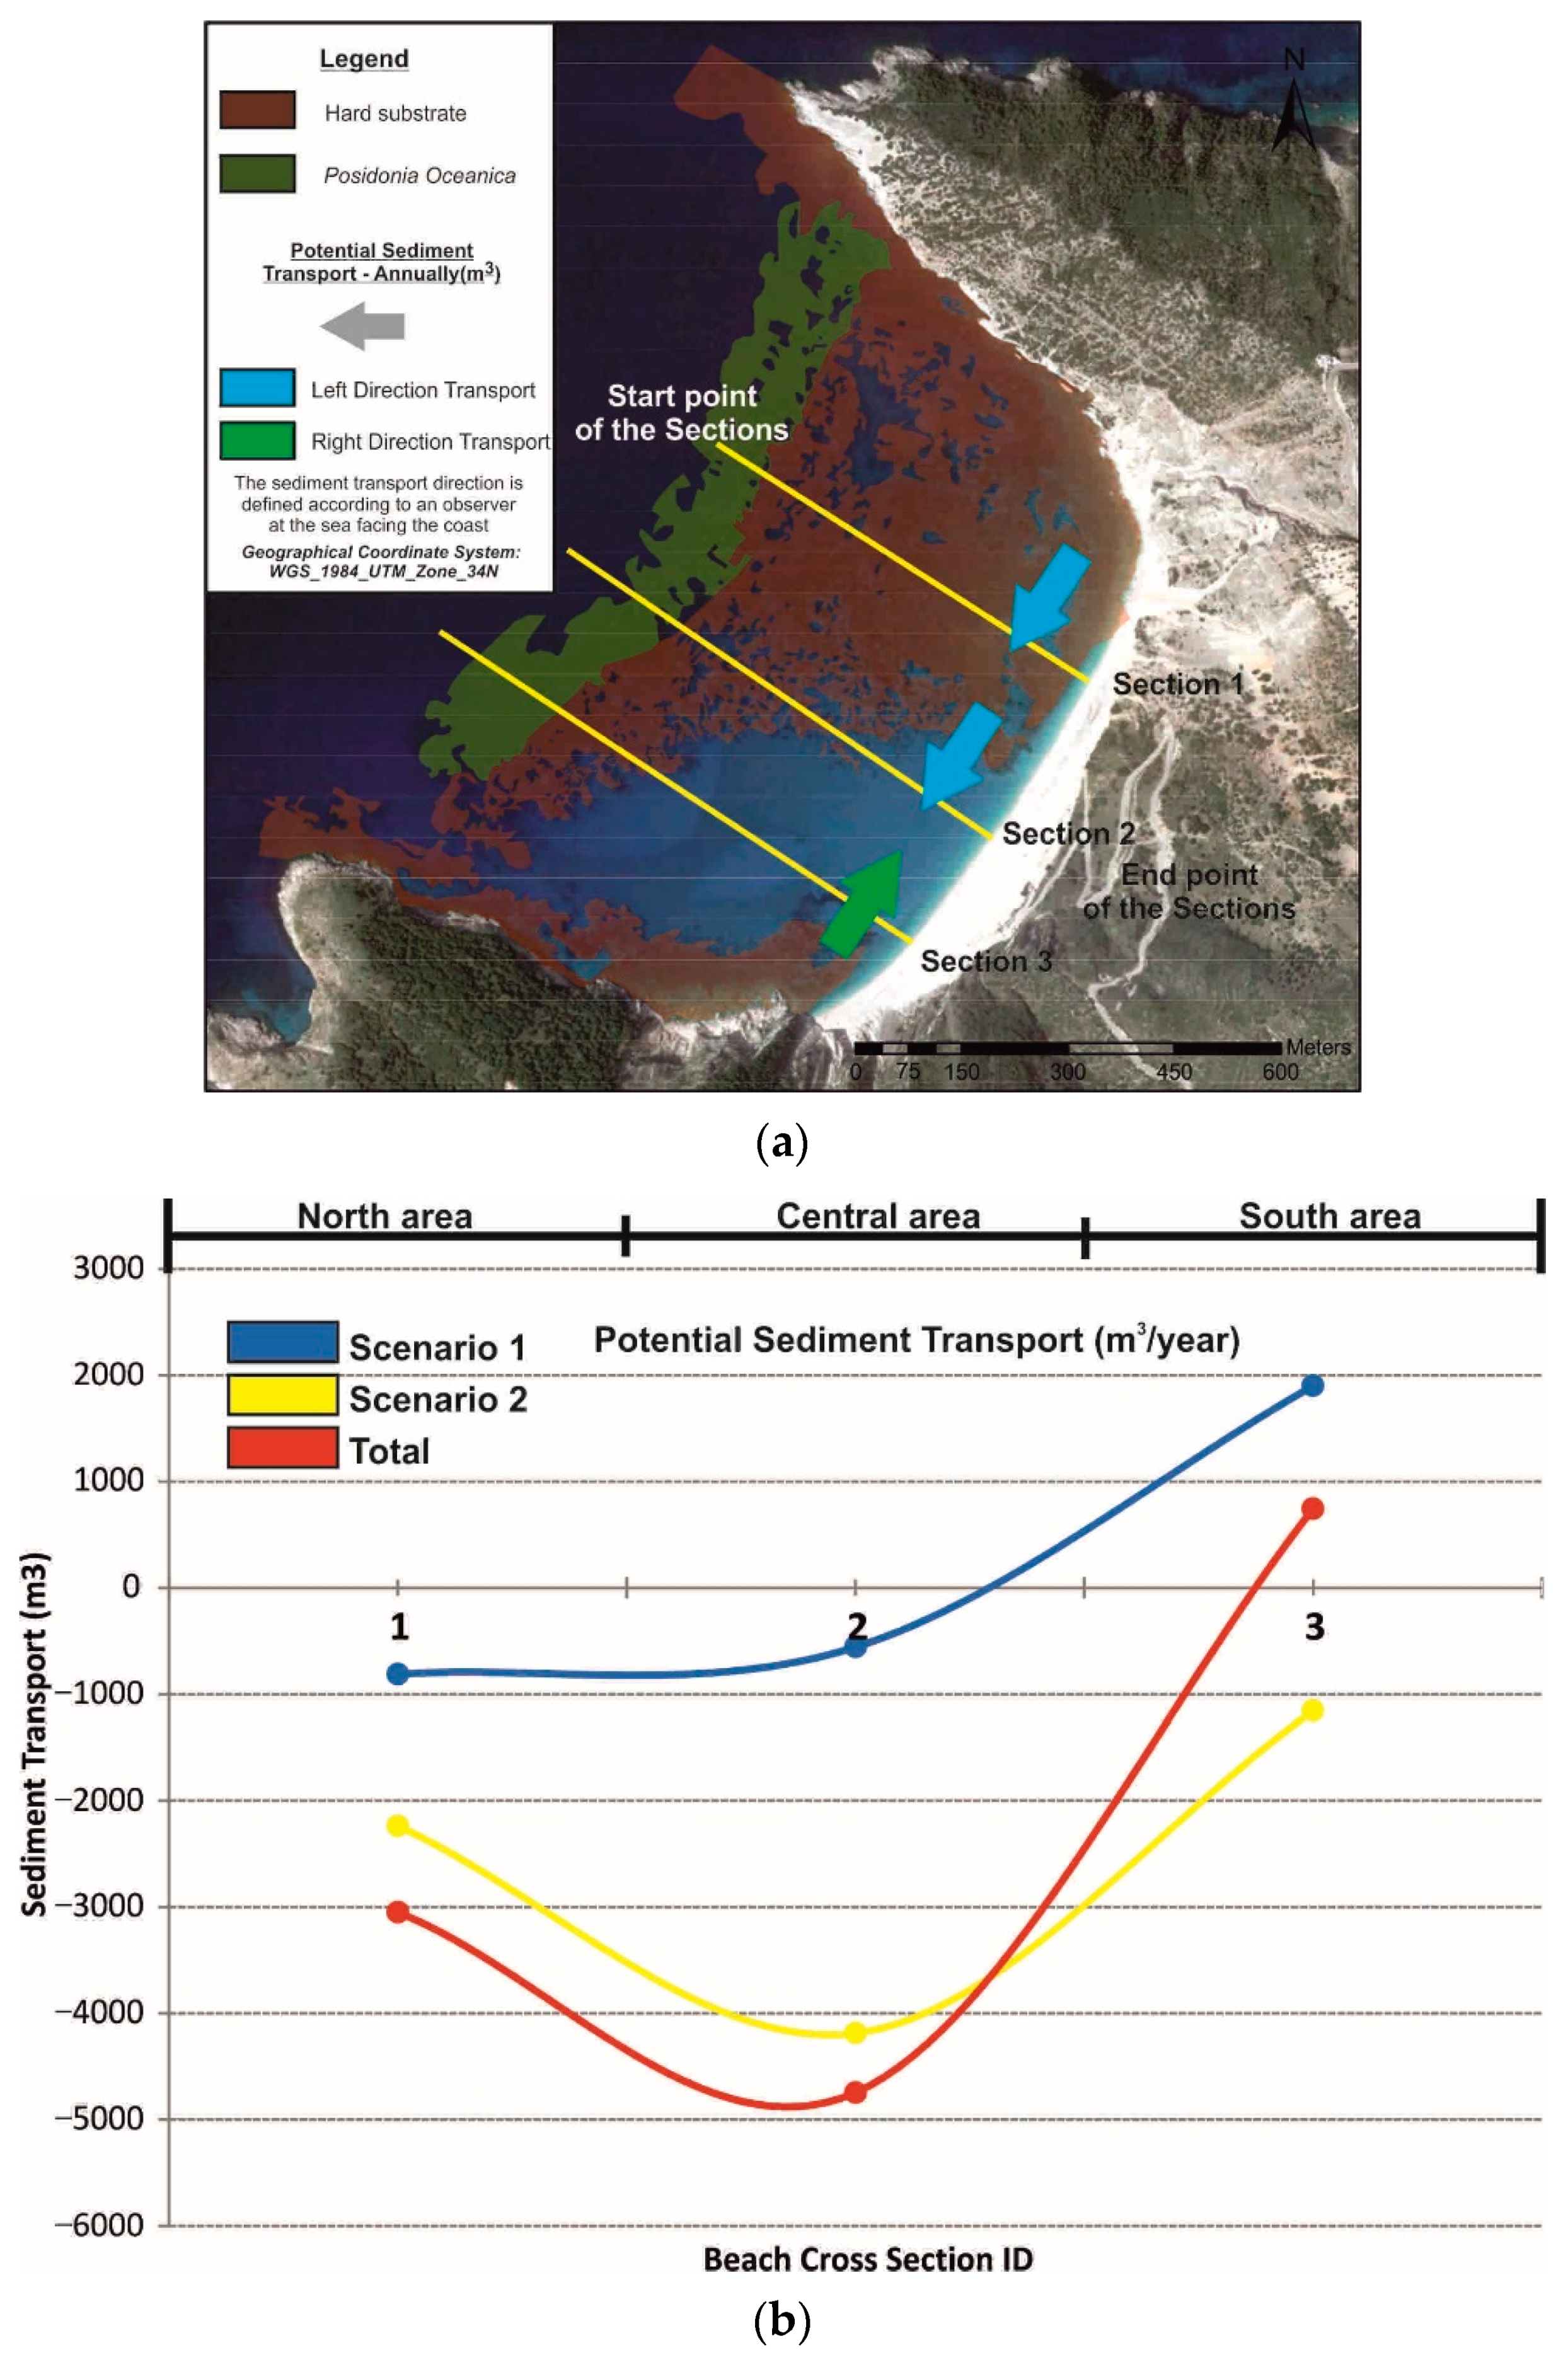
| Scenario 1 | Scenario 2 | Extreme Event | |
|---|---|---|---|
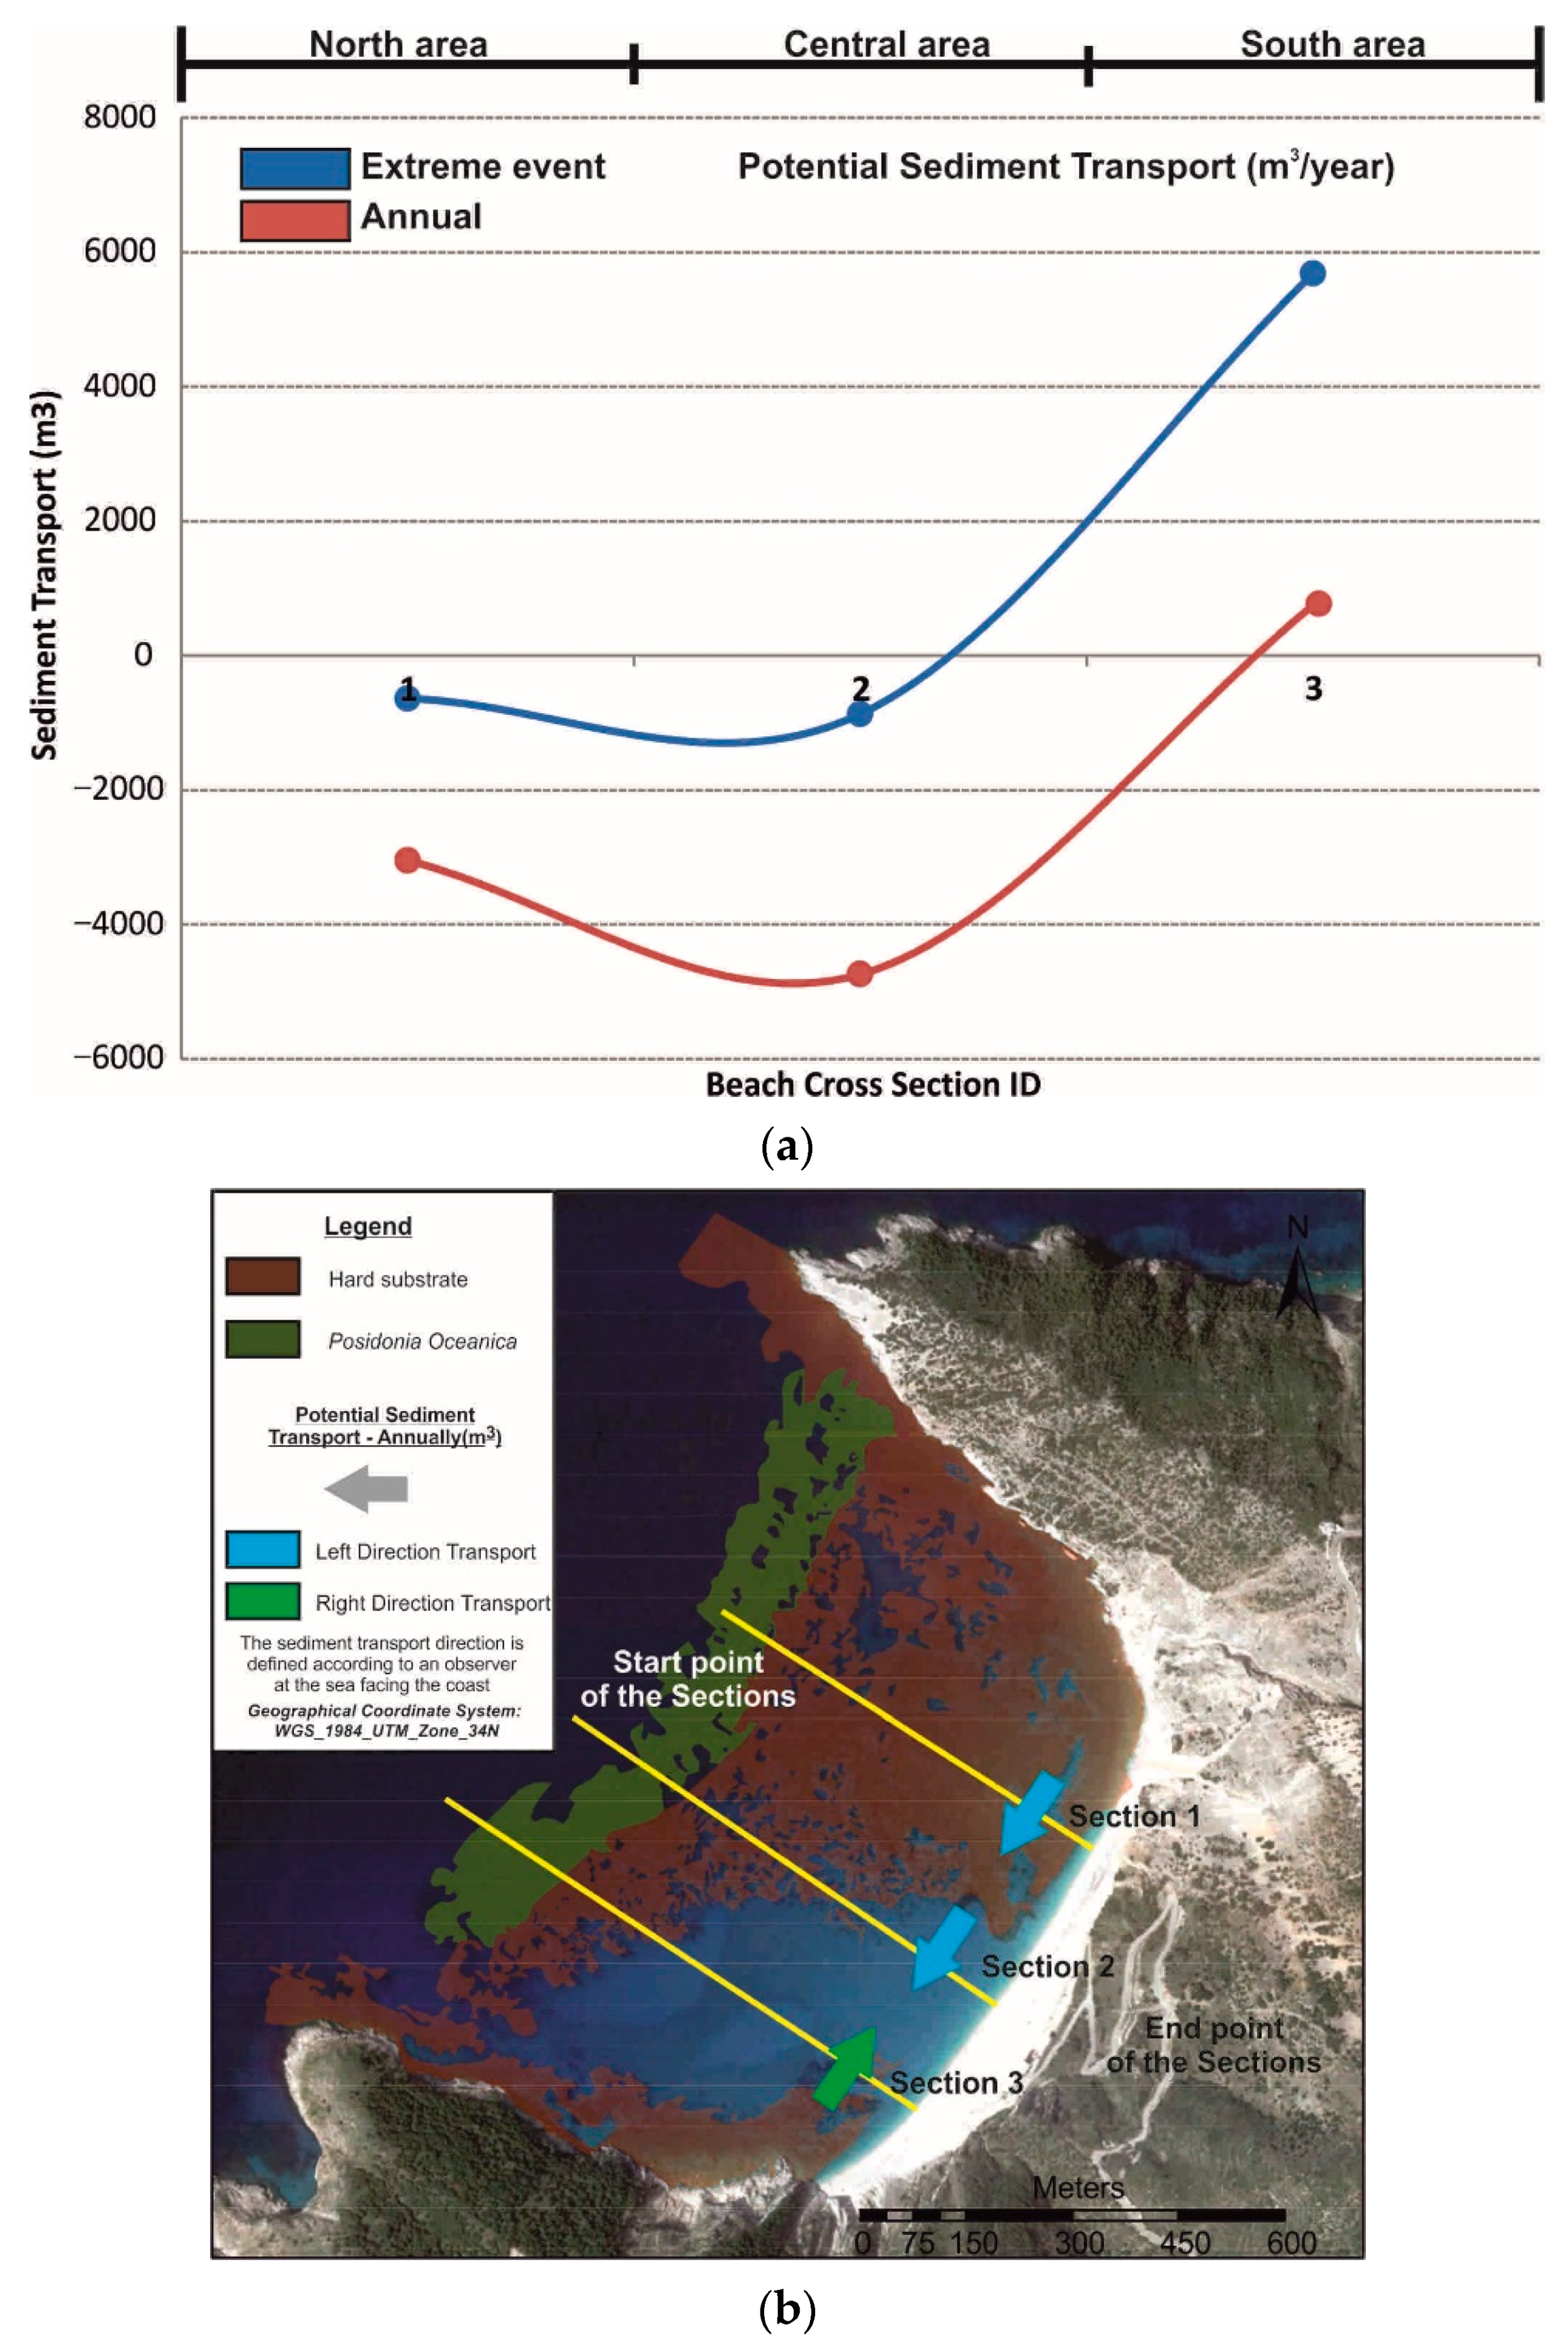
| Section 1 | −811.848 | −2235.61 | −638.776 |
| Section 2 | −558.566 | −4184.97 | −872.509 |
| Section 3 | 1900.41 | −1155.65 | 5680.17 |
Publisher’s Note: MDPI stays neutral with regard to jurisdictional claims in published maps and institutional affiliations. |
© 2022 by the authors. Licensee MDPI, Basel, Switzerland. This article is an open access article distributed under the terms and conditions of the Creative Commons Attribution (CC BY) license (https://creativecommons.org/licenses/by/4.0/).
Share and Cite
Petropoulos, A.; Kapsimalis, V.; Evelpidou, N.; Karkani, A.; Giannikopoulou, K. Simulation of the Nearshore Sediment Transport Pattern and Beach Morphodynamics in the Semi-Enclosed Bay of Myrtos, Cephalonia Island, Ionian Sea. J. Mar. Sci. Eng. 2022, 10, 1015. https://doi.org/10.3390/jmse10081015
Petropoulos A, Kapsimalis V, Evelpidou N, Karkani A, Giannikopoulou K. Simulation of the Nearshore Sediment Transport Pattern and Beach Morphodynamics in the Semi-Enclosed Bay of Myrtos, Cephalonia Island, Ionian Sea. Journal of Marine Science and Engineering. 2022; 10(8):1015. https://doi.org/10.3390/jmse10081015
Chicago/Turabian StylePetropoulos, Alexandros, Vasilios Kapsimalis, Niki Evelpidou, Anna Karkani, and Katerina Giannikopoulou. 2022. "Simulation of the Nearshore Sediment Transport Pattern and Beach Morphodynamics in the Semi-Enclosed Bay of Myrtos, Cephalonia Island, Ionian Sea" Journal of Marine Science and Engineering 10, no. 8: 1015. https://doi.org/10.3390/jmse10081015
APA StylePetropoulos, A., Kapsimalis, V., Evelpidou, N., Karkani, A., & Giannikopoulou, K. (2022). Simulation of the Nearshore Sediment Transport Pattern and Beach Morphodynamics in the Semi-Enclosed Bay of Myrtos, Cephalonia Island, Ionian Sea. Journal of Marine Science and Engineering, 10(8), 1015. https://doi.org/10.3390/jmse10081015