Article

ddRAD Sequencing-Based Scanning of Genetic Variants in Sargassum fusiforme

1
College of Life and Environmental Science, Wenzhou University, Wenzhou 325035, China
2
Dongtou Fisheries Science and Technology Research Institute, Wenzhou 325700, China
3
Zhejiang Provincial Key Laboratory for Water Environment and Marine Biological Resources Protection, Wenzhou University, Wenzhou 325035, China
*
Authors to whom correspondence should be addressed.
J. Mar. Sci. Eng. 2022, 10(7), 958; https://doi.org/10.3390/jmse10070958
Submission received: 27 May 2022 / Revised: 7 July 2022 / Accepted: 8 July 2022 / Published: 12 July 2022
(This article belongs to the Special Issue Algal Cultivation and Breeding)

Abstract

:
Sargassum fusiforme is a commercially important brown seaweed that has experienced significant population reduction both from heavy exploitation and degradation of the environment. Cultivated breed strains are also in a state of population mixing. These population stressors make it necessary to investigate the population genetics to discover best practices to conserve and breed this seaweed. In this study, the genetic diversity and population structure of S. fusiforme were investigated by the genome-wide SNP data acquired from double digest restriction site-associated DNA sequencing (ddRAD-seq). We found a low genetic diversity and a slight population differentiation within and between wild and cultivated populations, and the effective population size of S. fusiforme had experienced a continuous decline. Tajima’s D analysis showed the population contraction in wild populations may be related to copper pollution which showed a consistent trend with the increase of the sea surface temperature. The potential selection signatures may change the timing or level of gene expression, and further experiments are needed to investigate the effect of the mutation on relevant pathways. These results suggest an urgent need to manage and conserve S. fusiforme resources and biodiversity considering the accelerating change of the environment.

1. Introduction

Sargassum fusiforme is an important edible brown seaweed that is grown in the lower intertidal zone along the Northwest Pacific (NW-Pacific) coast [1]. This seaweed has a reputation as the “longevity vegetable”, as it contains a series of functional bioactive compounds (such as polysaccharides), which are correlated with antioxidants, anti-aging, memory improvement and immune regulation [2,3,4]. S. fusiforme is also used as an essential herb in traditional Chinese medicine to disperse phlegm [5]. However, heavy commercial exploitation of S. fusiforme has led to a significant reduction in population size. For example, the annual production of S. fusiforme in Rongcheng, China, declined from 558.99 to 7.74 tons between 1982–2006 [6]. Apart from commercial harvest, the degradation of the environment, including the change of sea surface temperature, pollution, and harmful algae, has also had a significant impact on populations [7,8]. To increase production, the breeding technology developed by Shengyao Li’s group in the 1990s has been deployed in mass farming of S. fusiforme in China. Dongtou, the main breeding site, is the location where the S. fusiforme is in a state of population mixing. It is necessary to investigate the genetic diversity and population structure of S. fusiforme, which may provide insights into the best practices to employ to efficiently conserve and increase the production of this commercially important seaweed species.
Next-generation sequencing (NGS) technology enables the discovery of molecular polymorphisms and the characterization of genetic diversity in non-model organisms [9]. Double digest restriction site-associated DNA sequencing (ddRAD-seq), a powerful NGS-based technique, allows the delivering of high-resolution population genomic data for non-model organisms by creating a reduced representation library through two rounds of enzymatic digestion and ligation of adaptors to the genomic DNA of interest [10]. By reducing the portion of the sequenced genome analyzed, this method produces a large number of SNP markers, which can be effectively applied to infer the genetic diversity and genetic differentiation within and between populations [11]. Deep inside the genetic diversity and population structure, the natural selection history and inbreeding information that is common in cultured populations can be characterized. The application of ddRAD-seq has been successful in many aquaculture species, including Ectocarpus [12] and Undaria pinnatifida [13].
In an earlier study from our group, the phylogeographic structure was investigated within populations of the cultivated S. fusiforme strains in Dongtou by a combination of air-bladder phenotype and simplified genome [14]. Using the ddRAD-seq data, we measured a large-scale assessment of genetic variation to investigate the population structure and demographic history between cultivated and wild S. fusiforme and identify the selection signal for these populations.

2. Materials and Methods

2.1. Sample Collection and Double-Digest RAD Sequencing

A total of 29 S. fusiforme individuals, including 8 wilds and 21 cultivars, were collected from the coastal Northwest Pacific (Figure 1a and Table 1). gDNA was extracted from picked vesicles and a ddRAD library, was prepared according to Peterson’s protocol with slight modifications by Genepioneer Biotechnologies Co. Ltd. (Nanjing, China). The DNA extraction and library preparation methods can be found in our previous paper [14]. Briefly, gDNA was first digested with EcoRI and NlaIII, followed by adaptors being ligated, and then fragment size selection was performed following the standard protocol from Illumina TruSeq DNA Library Kits (Used by Genepioneer Biotechnologies Co. Ltd., Nanjing, China) to target 300–500 bp fragments.

2.2. Read Mapping and SNP Calling

Quality filtering and SNP calling were conducted using the Stacks software, version 2.55 [15]. The ddRAD-seq reads were filtered using process_radtags (parameters as follows: --clean --quality --rescue --renz_1 ecoRI --renz_2 nlaIII) to remove Illumina adapters and to eliminate low-quality regions. The clean data were then mapped to the S. fusiforme reference genome assembly using bowtie 2 [16]. SNP calling was carried out using ref_map.pl pipeline of Stacks program with PCR duplicates removed [15]. The populations program (parameters as follows: --min-populations 2 --min-samples-per-pop 0.75 --min-maf 0.05 --max-obs-het 0.7 --write-single-snp) was used to filter and output the SNPs. The flag “write_single_snp” was used to restrict the dataset to contain only one SNP per locus to minimize the effects of linkage disequilibrium. The variant call format (VCF) file generated from the Stacks program was utilized for SNP annotations using SnpEff tool (version 5.0e) [17].

2.3. Genetic Diversity and Population Structure Analysis

The nucleotide diversity (θπ) and Wright’s F statistic (Fst) were also estimated using Stacks software [15]. Population structure analysis was investigated by STRUCTURE v.2.3.2 [18]. Individuals were assigned to the K clusters assumption ranging from 2 to 6 under an admixture model with correlated allele frequencies by running 10,000 burn-in Markov Chain Monte Carlo methods and 20,000 subsequent repetitions. The output was summarized and subjected to CLUMPAK server for visualization [19], with bar plots reorganized by the build-in Distruct program [20].

2.4. Demographic Inference

Population demography was inferred by stairway plot 2.1.1 [21], which can infer historical changes using a flexible multi-epoch demographic model in effective population size. The script easySFS.py (https://github.com/isaacovercast/easySFS, accessed on 16 February 2022) was used to build the folded site frequency spectrum (SFS) for each population from the VCF file. One cultivar was excluded from the SFS due to missing data. The random break point for cultivars and wilds was set respectively as follows: 9, 19, 28, 38, and 3, 7, 10, 14. Other common parameter settings for cultivars and wilds were as follows: 67% of sites for training and 1 year per generation. The total number of observed nucleic sites was set as 50,000,000 based on the output of Stacks software. Since there is no precise nuclear mutation rate reported for Sargassum, we inferred the population demography with two different mutation rates. One mutation rate was set as 1.3 × 10⁻⁹, a value estimated by calculating the average divergence rate of Sargassum Cox3 gene [22]. An alternative mutation rate was set as 5.2 × 10⁻⁹ by considering the mitochondrial mutation rate that can be 4 times that of the nucleus in macroalgae [23]. Each estimation was generated using 200 bootstrapped folded SFS.

2.5. Genome-Wide Detection of Selection Signatures

To assess for signatures of demographic expansion or contraction, the VCF file generated from the Stacks program was subjected to VCFtools 0.1.16 [24] for Tajima’s D values were calculated in 10-kb non-overlapping windows for both cultivated and wild-type populations [25]. Windows belonging to the top or bottom 1% of the whole Tajima’s D values were considered as potential regions under selection. The candidate genes in the selected regions were found using the annotation file supplied with the S. fusiforme assembly by using BEDTools intersect function [26]. The GO annotation was performed using the Blast2GO program [27]. Gene set enrichment analysis for GO terms was performed by TopGO using the classic Fisher algorithm with Benjamini-Hochberg correction [28]. The most recent go-basic ontology file from the Gene Ontology Consortium was chosen [29].

3. Results

3.1. Processed Sequence Data

After quality filtering by process_radtags, a total of 291,914,117 reads were obtained from the initial 292,405,034 raw reads, with an average of 10,082,932 reads per sample. Mapping of these filtered reads to the reference genome assembly resulted in an average mapping rate of 78%. In total, we identified 125,401 ddRAD loci which were composed of 61,980,894 sites, with an average length of about 416 bp per loci. Finally, 20,044 SNPs with a minor allele frequency (MAF) above 0.05 across all samples were found in more than 75% of individuals for each population and were retained for subsequent analysis. Based on the output of snpEff, only 3.14% of SNPs were located in exonic regions. For SNPs in non-coding regions, majority of them (47.98%) were intergenic SNPs, while 17.28%, 15.74%, and 15.60% of SNPs were located in 1 kb upstream, 1 kb downstream and intronic regions, respectively.

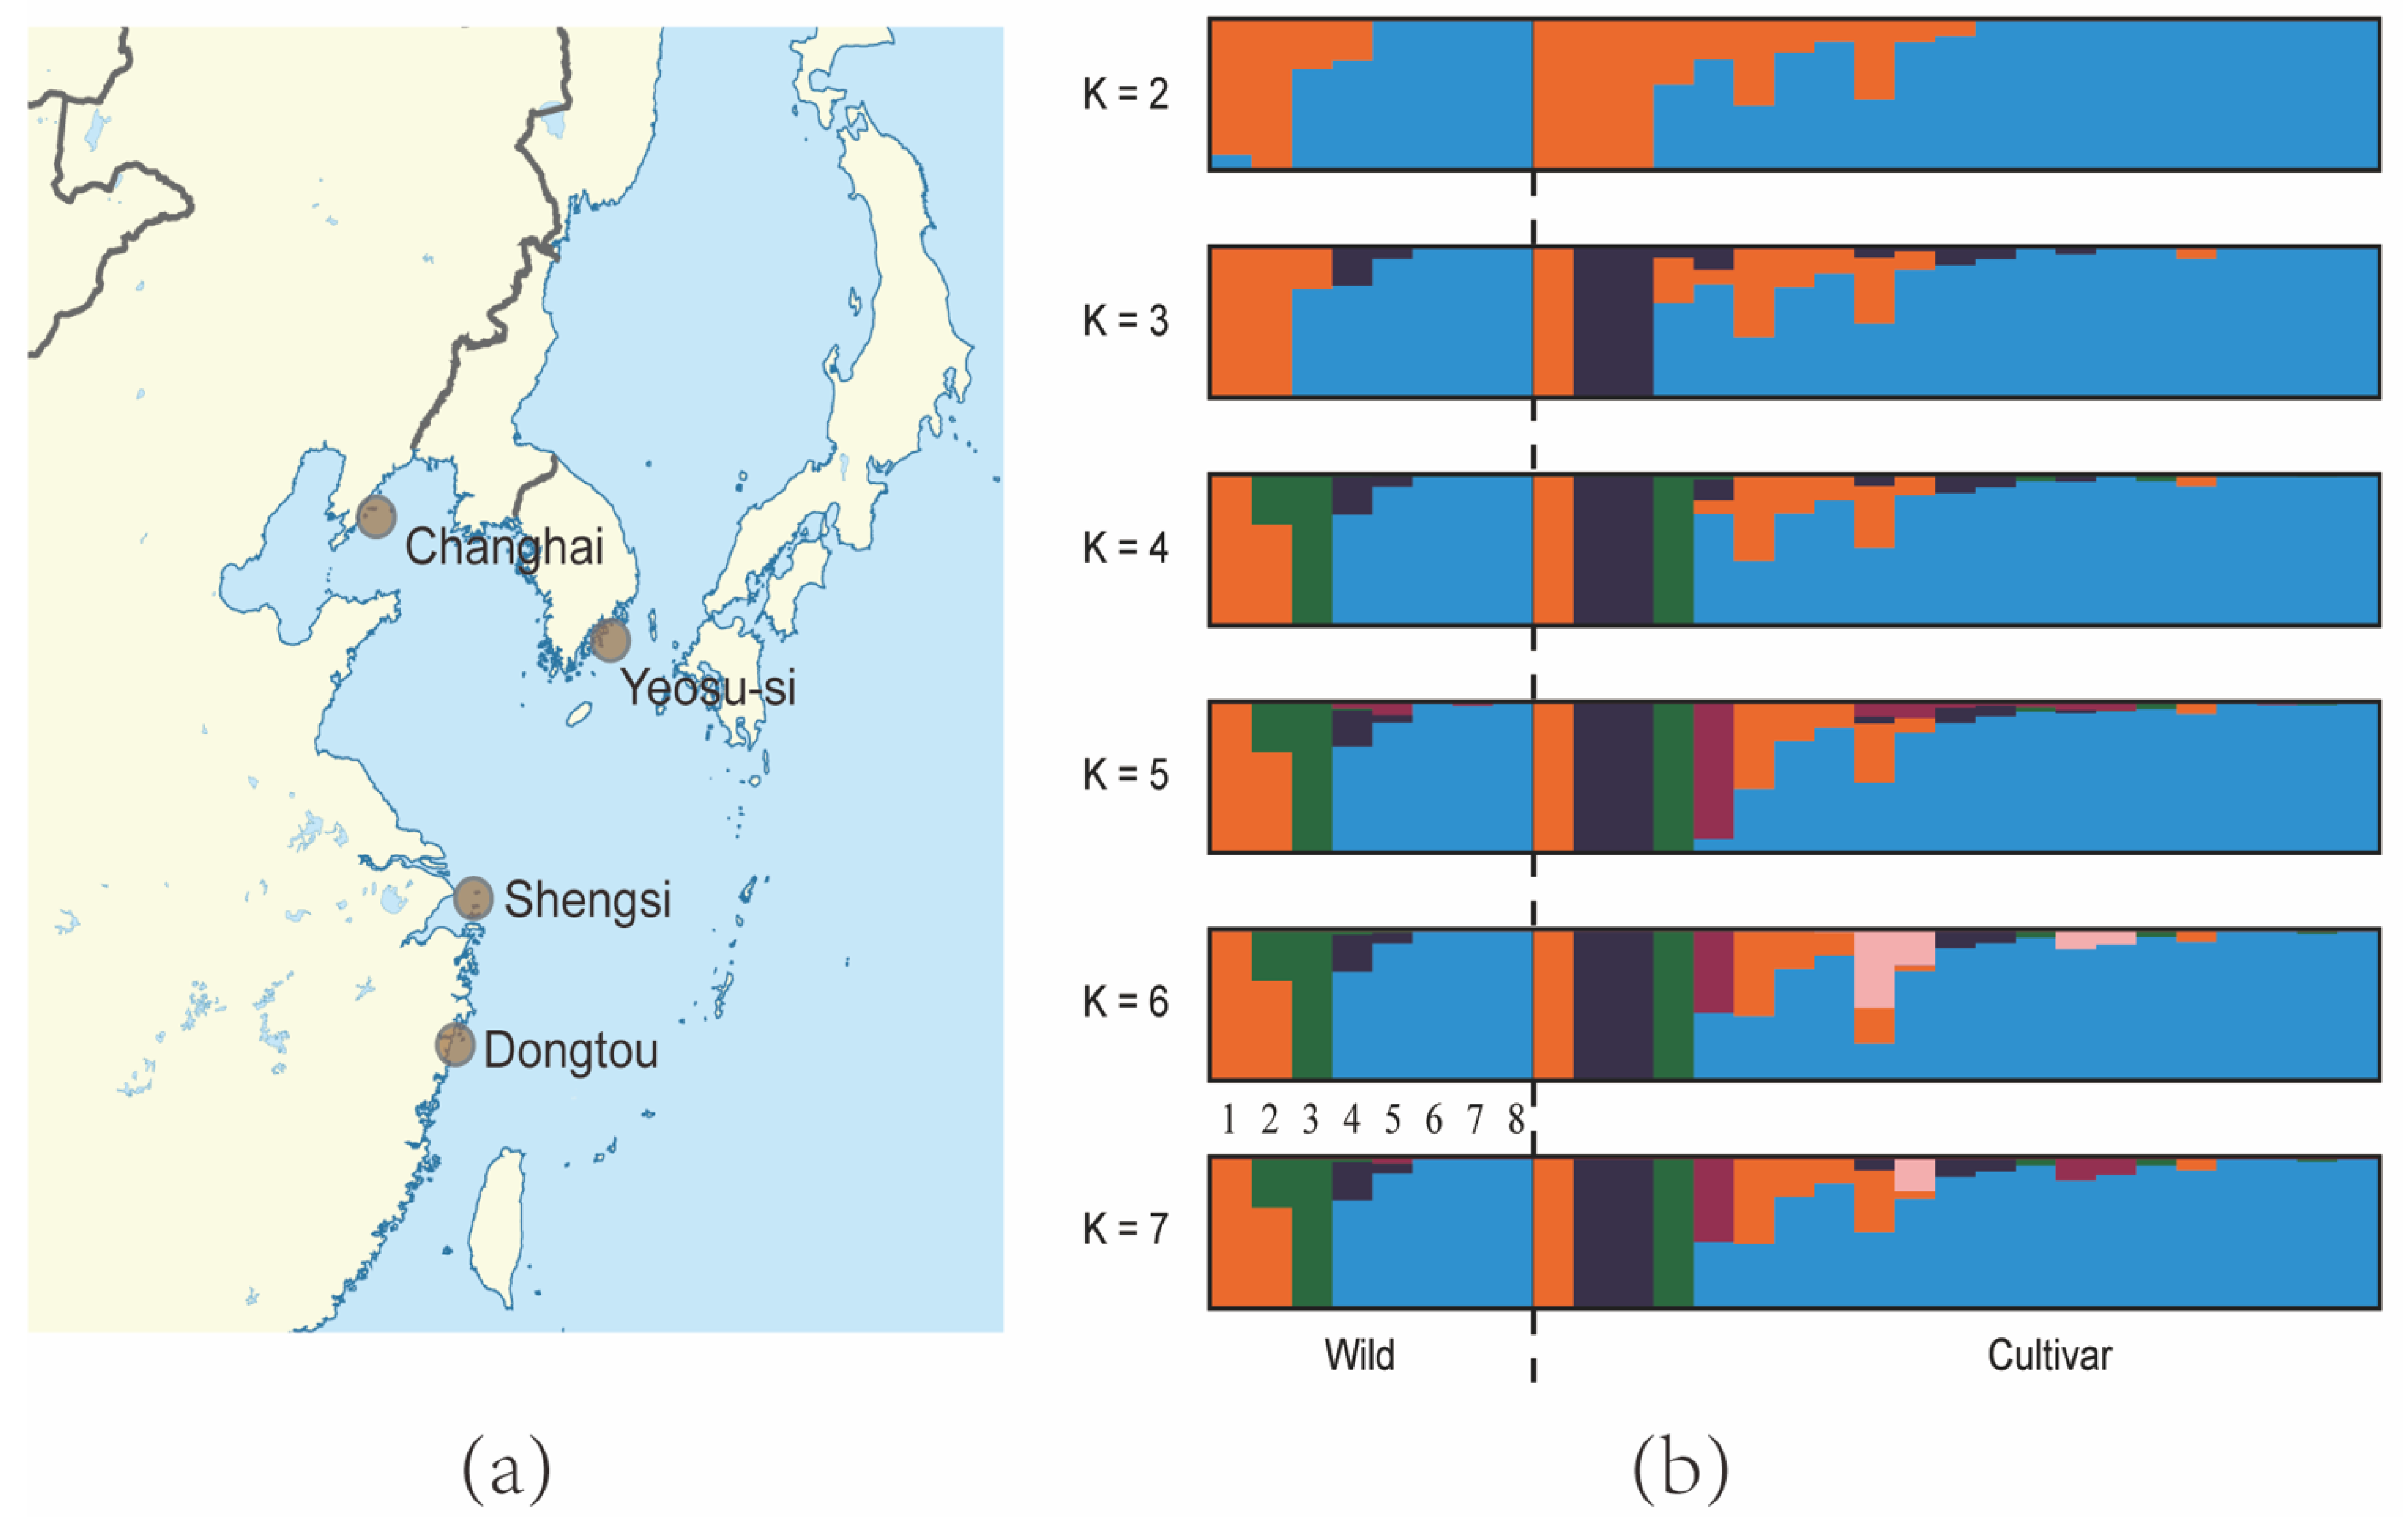
3.2. Genetic Diversity and Population Structure

The genetic parameters (θπ) for all positions were low (0.0002 in both Cultivars and wilds), indicating weak genetic diversity. The mean pairwise Fst value between wild and cultivated populations was 0.0385, suggesting a slight population differentiation. The wild and cultivated populations could not be classified as two clusters in the STRUCTURE analysis (Figure 1b). Nearly all patterns found in wild populations were also found in cultivated populations for each K. This appearance of patterns across all populations indicates that the cultivated populations are mixed with wild populations. For K > 3, the wilds can be clearly classified as three clusters consistent with their location sites, indicating the wild populations from different locations retained their own features.

3.3. Demographic History

The θπ indicated low genetic diversity between Cultivated and Wild populations, so we carried out a demographic analysis to infer the historical population changes that resulted in the current state. For wild populations, similar trends were detected in both mutation rates (1.3 × 10⁻⁹ and 5.2 × 10⁻⁹) from the stairway plot, in which the effective population size (Ne) of S. fusiforme appears to have experienced a continuous decline from the 3 kya to the present, although the observed Ne was different for each (Figure 2a,b). In addition, the analysis of the cultivar showed a similar pattern in the timing and magnitude of Ne decrease (Figure 2c,d).

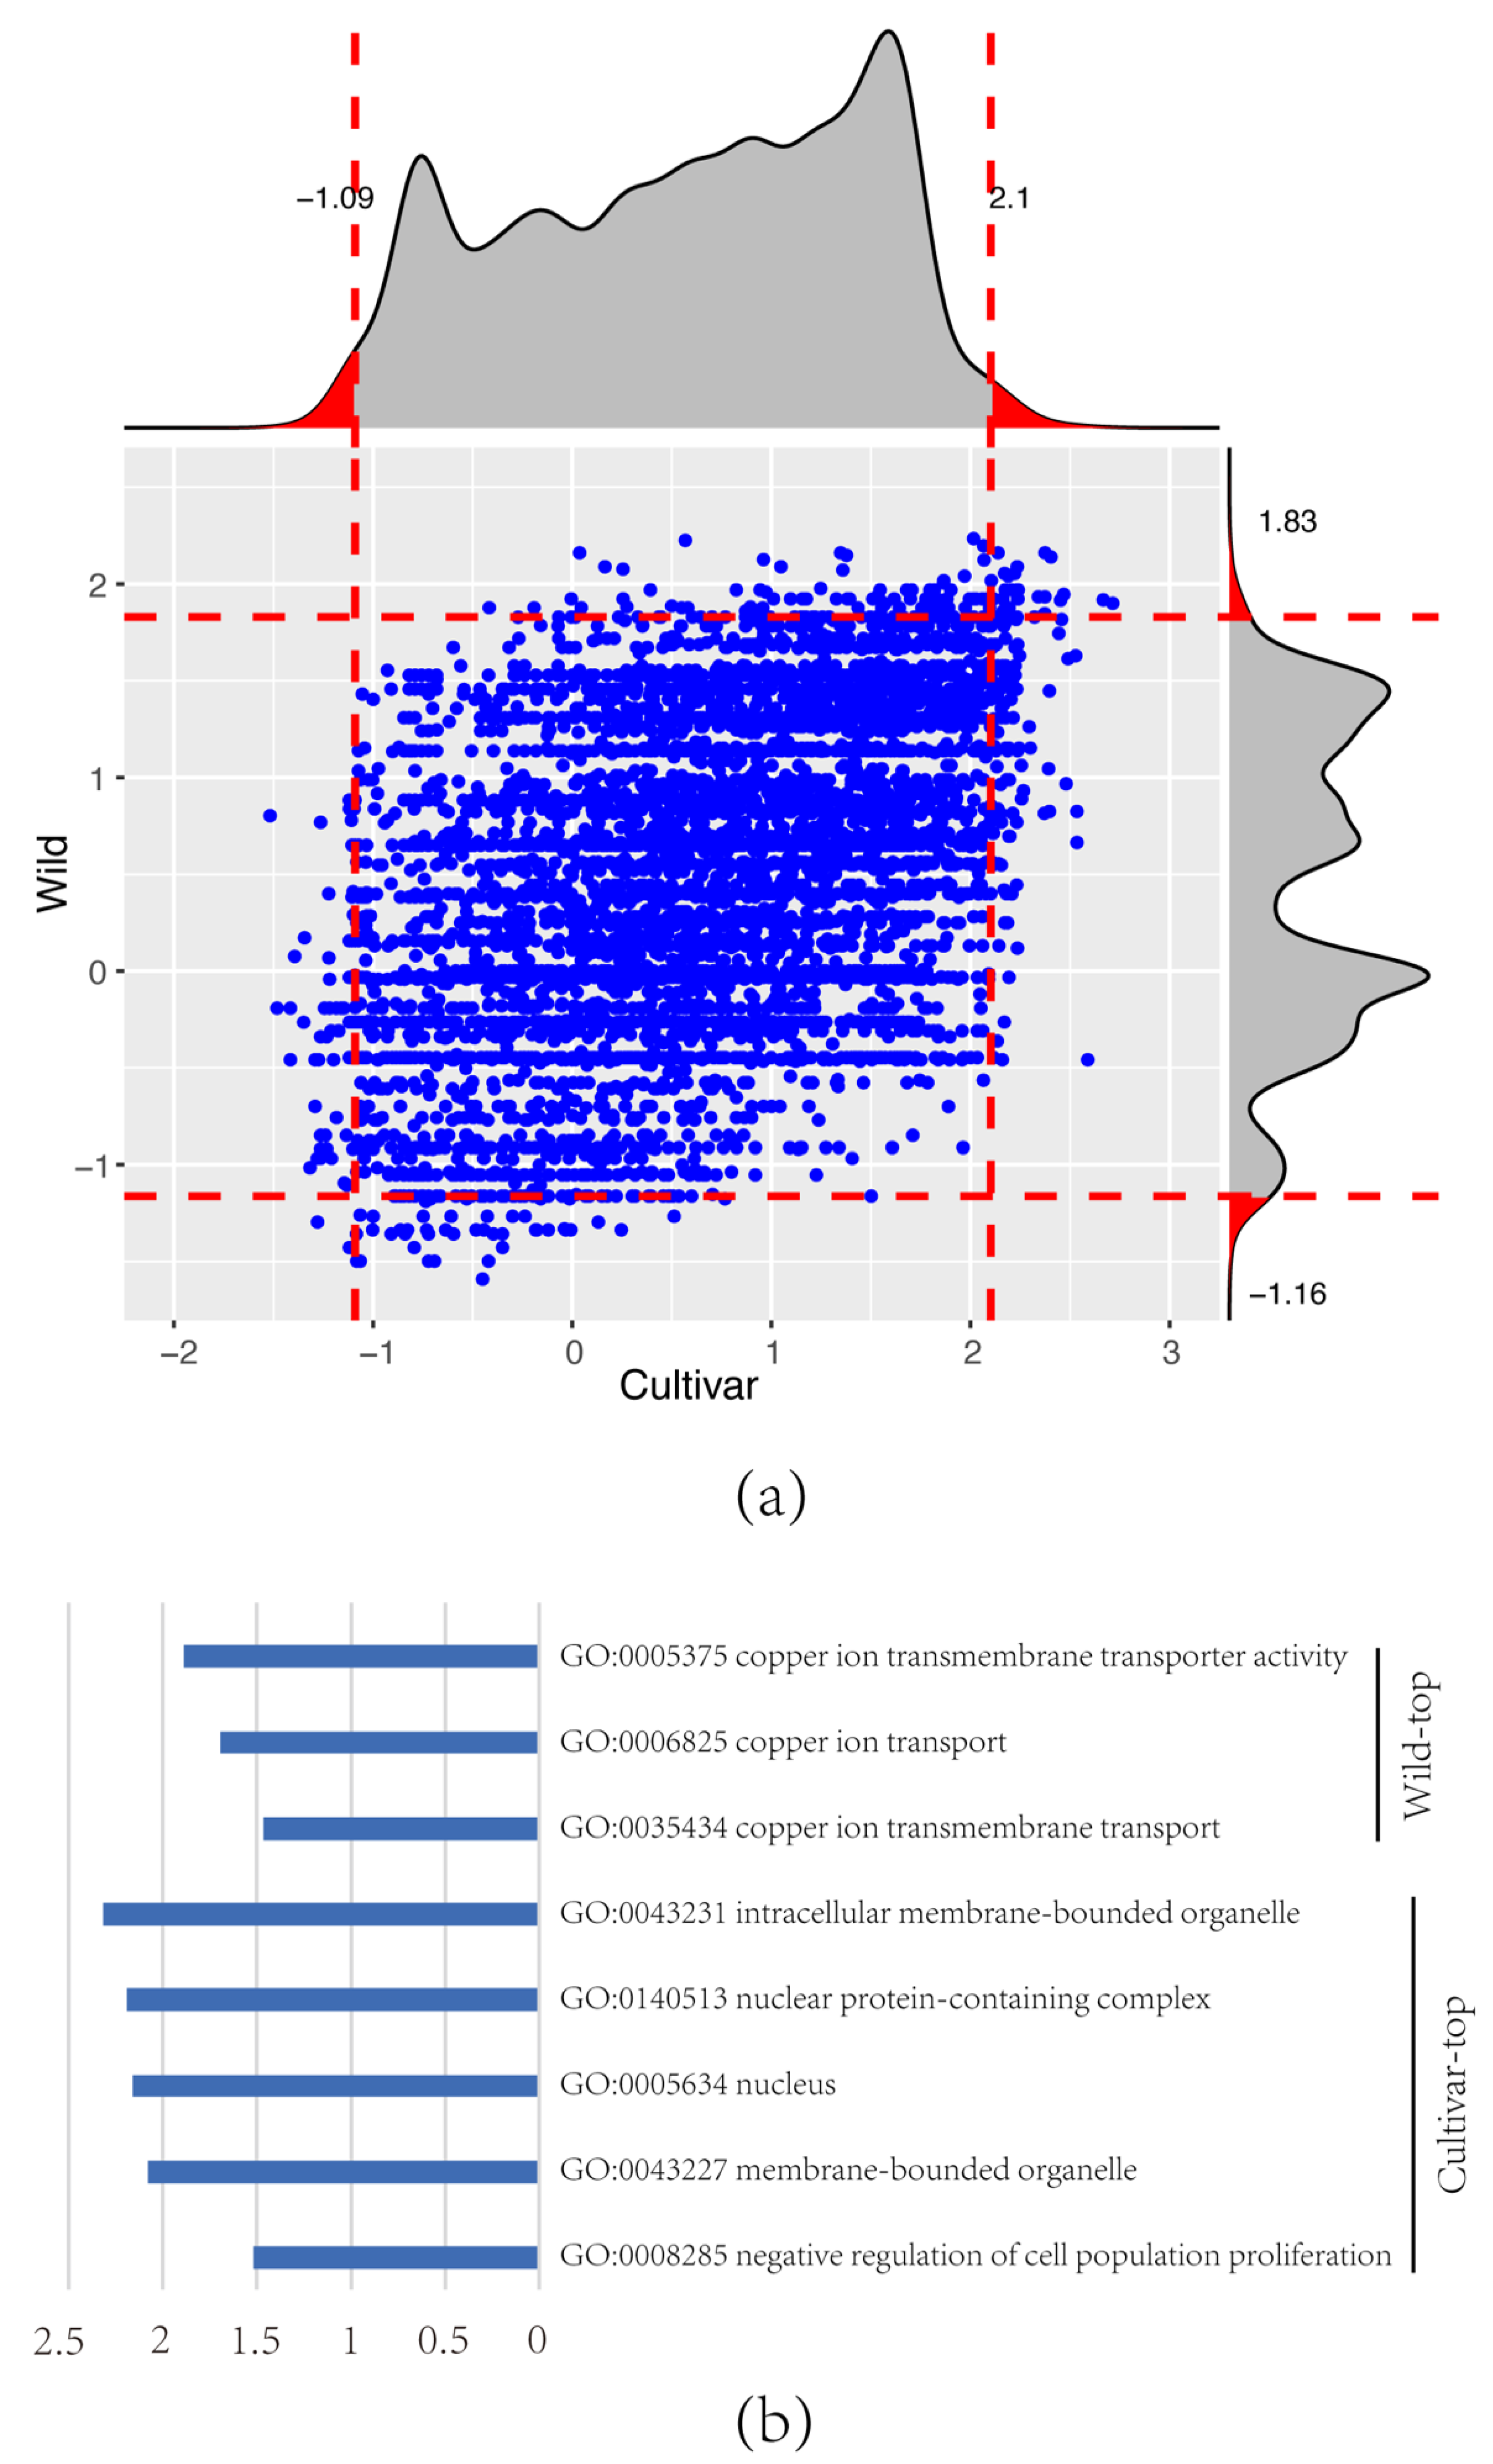
3.4. Signature Selection

Tajima’s D values were calculated by VCFtools in 10-kb non-overlapping windows for both cultivar and wild S. fusiforme populations (Figure 3a). Windows with Tajima’s D score for the top or bottom 1% of all windows were identified as candidate selective regions. Protein-coding genes in these selective regions were identified by BEDTools. Then, four selective gene groups (cultivar-top, cultivar-bottom, wild-top, wild-bottom) were generated, which contained 792, 667, 677, and 526 genes, respectively. To detect the biological meanings for the genes located in these selective regions, GO enrichment analysis was performed by TopGO with Benjamini-Hochberg correction (Figure 3b). Three GO items were enriched in the wild-top and were related to the molecular function of copper ion transport. Five GO items were enriched in the cultivar-top, of which four items are cell composition-related terms and one was related to negative regulation of cell population proliferation. There were no enriched GO items found in either cultivar-bottom or wild-bottom.

4. Discussion

The number of individuals used in this project meets the minimum sample size for studying genetic differentiation and genetic diversity based on the empirical analysis [30]. The low genetic diversity and slight population differentiation within and between wild and cultivated populations detected in our study agree with the previous finding [7]. During reproduction in S. fusiforme, the male and female gametes are released into the surrounding water, where a zygote is formed and attached to the substrate (e.g., reef) for growth. Marine algae with limited dispersal abilities are expected to have low genetic diversity, especially in areas where habitat fragmentation is present due to human behavior and environmental pollution [31]. In the STRUCTURE analysis, although wild populations from different locations present their own patterns, the difference between cultivars and wilds was not significant, and the patterns found in wilds can also be found in cultivars (Figure 1b). In the past years, the natural resource of S. fusiforme in the coastal area of the Northwest Pacific has been collected and used as seedlings for farming and cultivation in Dongtou [32,33]. The crossbreeding resulted in cultivars comprising the genetic information of wilds from different locations. Interestingly, individuals with the Yeosu-si pattern occupy the largest part of cultivars, not Shengsi which is geographically closest to Dongtou. Maybe some features from the Yeosu-si strains have more commercial value and are being preserved with genetic breeding, but this would need to be validated with more data.
It is difficult to illustrate the demographic history and represent the actual census population size, especially for a low sample size, which may be not over samples [34]. According to our stairway plot, the Ne from our samples is quite small, supporting the presence of low diversity, which is consistent with a previous study that found the populations from the coastal areas of China and Korea to be quite similar [7]. This method was accurate for inferring recent population size changes compared to others, such as PSMC, MSMC and SMC++, although contemporary population sizes were underestimated [35]. If the true mutation rate was slower (or faster), the Ne should be different from what was assumed. Although the exact Ne is difficult to obtain, we did find the Ne of S. fusiforme to continuously decline in two different populations, and the pattern of demographic reduction from two different mutation rates was consistent. This is consistent with the extremely positive Tajima’s D detected in the Cultivar and Wild populations (Figure 3a), which shows that these populations have experienced a sudden population contraction.
Besides the over-exploitation and inbreeding, the anthropogenic activities related to the change in the environment may be another important reason for this contraction. For example, the marine pollution is the main factor for the loss of genetic diversity in cultured and wild populations of mussels from Greece [36]. During 1960–2006, the sea surface temperature (SST) around the Nanji Island underwent an annual rise of 0.5 °C, resulting in five species of cold-temperate seaweed populations being reduced [37]. The rise of SST was responsible for increasing the toxicity of metal for aquatic organisms [38]. Copper pollution affecting meiospore development has been found in kelp, another important brown seaweed [39]. Due to enriched copper ion transport GO terms found in the wild-top, we suppose that copper pollution should be an important factor for the decrease of the wild population with the increase of SST. For cultivar, the formation of zygotes usually takes place in an artificial pool, and the SST should have less of an effect on meiospore development, whereas the selection of economic-related traits may affect the population size even more so. Because most of the SNPs detected in this study are located in non-coding regions, which may change the timing or level of gene expression, further experiments are needed to investigate the effect of the mutation on relevant pathways.
Genetic diversity plays an important role in the ability of a population to adapt to fluctuating environmental conditions. Without adequate diversity in genetic material for breeding, populations are at risk of declining drastically if an extreme environmental event occurs [40]. The decreased seaweed diversity found in this study suggests that there is an urgent need to manage and conserve S. fusiforme resources and biodiversity, especially in light of the accelerating change recorded in the environment.

Author Contributions

Conceptualization, M.W. and S.W.; methodology, L.L. and S.W.; formal analysis, F.W. and S.W.; investigation, M.W.; data curation, L.L. and S.W.; writing, L.L. and S.W.; supervision, M.W. All authors have read and agreed to the published version of the manuscript.

Funding

This research was supported by the Special Project on Blue Granary Science and Technology Innovation under the National Key R&D Program (2018YFD0901501), the National Natural Science Foundation of China (41876197), the Special Science and Technology Innovation Project for Seeds and Seedlings of Wenzhou City (N20160016), and the Key Fishing and Agricultural Science and Technology Project in Dongtou District, Wenzhou (N2018Y03A).

Institutional Review Board Statement

Not applicable.

Informed Consent Statement

Not applicable.

Data Availability Statement

Raw sequence reads presented in this study were deposited into the National Genomics Data Center BioProject database with the accession number PRJCA008683.

Conflicts of Interest

The authors declare no conflict of interest.

References

  1. Ma, Z.; Wu, M.; Lin, L.; Thring, R.W.; Yu, H.; Zhang, X.; Zhao, M. Allelopathic interactions between the macroalga Hizikia fusiformis (Harvey) and the harmful blooms-forming dinoflagellate Karenia mikimotoi. Harmful Algae 2017, 65, 19–26. [Google Scholar] [CrossRef] [PubMed]
  2. Bogie, J.; Hoeks, C.; Schepers, M.; Tiane, A.; Cuypers, A.; Leijten, F.; Chintapakorn, Y.; Suttiyut, T.; Pornpakakul, S.; Struik, D.; et al. Dietary Sargassum fusiforme improves memory and reduces amyloid plaque load in an Alzheimer’s disease mouse model. Sci. Rep. 2019, 9, 4908. [Google Scholar] [CrossRef] [PubMed] [Green Version]
  3. Chen, P.; He, D.; Zhang, Y.; Yang, S.; Chen, L.; Wang, S.; Zou, H.; Liao, Z.; Zhang, X.; Wu, M. Sargassum fusiforme polysaccharides activate antioxidant defense by promoting Nrf2-dependent cytoprotection and ameliorate stress insult during aging. Food Funct. 2016, 7, 4576–4588. [Google Scholar] [CrossRef] [PubMed]
  4. Zhang, R.; Zhang, X.; Tang, Y.; Mao, J. Composition, isolation, purification and biological activities of Sargassum fusiforme polysaccharides: A review. Carbohydr. Polym. 2020, 228, 115381. [Google Scholar] [CrossRef]
  5. Li, X.; Wang, W. Chinese Materia Medica: Combinations and Applications; Donica Publishing: Potters Bar, UK, 2002. [Google Scholar]
  6. Zhang, Q.; Liu, G. The development and utilization on Sargassum fusiforme resources of Rongcheng coastal waters. Mar. Sci. 2009, 33, 45–48. [Google Scholar]
  7. Hu, Z.; Li, J.; Sun, Z.; Gao, X.; Yao, J.; Choi, H.; Endo, H.; Duan, D. Hidden diversity and phylogeographic history provide conservation insights for the edible seaweed Sargassum fusiforme in the Northwest Pacific. Evol. Appl. 2017, 10, 366–378. [Google Scholar] [CrossRef]
  8. Lin, L.; Chen, B.; Wang, S.; Li, J.; Ma, Z. Comparative transcriptome and cross-section analyses provide insights into the mechanisms underlying Sargassum fusiforme responses to the harmful algal bloom-forming dinoflagellate Karenia mikimotoi. Aquat. Bot. 2021, 172, 103383. [Google Scholar] [CrossRef]
  9. Unamba, C.I.N.; Nag, A.; Sharma, R.K. Next Generation Sequencing Technologies: The Doorway to the Unexplored Genomics of Non-Model Plants. Front. Plant Sci. 2015, 6, 1074. [Google Scholar] [CrossRef] [Green Version]
  10. Peterson, B.K.; Weber, J.N.; Kay, E.H.; Fisher, H.S.; Hoekstra, H.E. Double Digest RADseq: An Inexpensive Method for De Novo SNP Discovery and Genotyping in Model and Non-Model Species. PLoS ONE 2012, 7, e37135. [Google Scholar] [CrossRef] [Green Version]
  11. Esposito, S.; Cardi, T.; Campanelli, G.; Sestili, S.; Díez, M.J.; Soler, S.; Prohens, J.; Tripodi, P. ddRAD sequencing-based genotyping for population structure analysis in cultivated tomato provides new insights into the genomic diversity of Mediterranean ‘da serbo’ type long shelf-life germplasm. Hortic. Res. 2020, 7, 134. [Google Scholar] [CrossRef]
  12. Avia, K.; Coelho, S.M.; Montecinos, G.J.; Cormier, A.; Lerck, F.; Mauger, S.; Faugeron, S.; Valero, M.; Cock, J.M.; Boudry, P. High-density genetic map and identification of QTLs for responses to temperature and salinity stresses in the model brown alga Ectocarpus. Sci. Rep. 2017, 7, 43241. [Google Scholar] [CrossRef] [PubMed] [Green Version]
  13. Guzinski, J.; Ballenghien, M.; Daguin-Thiébaut, C.; Lévêque, L.; Viard, F. Population genomics of the introduced and cultivated Pacific kelp Undaria pinnatifida: Marinas—Not farms—Drive regional connectivity and establishment in natural rocky reefs. Evol. Appl. 2018, 11, 1582–1597. [Google Scholar] [CrossRef] [PubMed]
  14. Lin, L.-D.; Wu, M.-J. The diversity of cultivated Sargassum fusiforme strains in Dongtou, Zhejiang province by the combination of air-bladder phenotype and simplified genome. Oceanol. Limnol. Sin. 2021, 52, 1224–1235. [Google Scholar] [CrossRef]
  15. Rochette, N.C.; Rivera-Colón, A.G.; Catchen, J.M. Stacks 2: Analytical methods for paired-end sequencing improve RADseq-based population genomics. Mol. Ecol. 2019, 28, 4737–4754. [Google Scholar] [CrossRef] [PubMed]
  16. Wang, S.; Lin, L.; Shi, Y.; Qian, W.; Li, N.; Yan, X.; Zou, H.; Wu, M. First Draft Genome Assembly of the Seaweed Sargassum fusiforme. Front. Genet. 2020, 11, 590065. [Google Scholar] [CrossRef] [PubMed]
  17. Cingolani, P.; Platts, A.; Wang, L.L.; Coon, M.; Nguyen, T.; Wang, L.; Land, S.J.; Lu, X.; Ruden, D.M. A program for annotating and predicting the effects of single nucleotide polymorphisms, SnpEff. Fly 2012, 6, 80–92. [Google Scholar] [CrossRef] [Green Version]
  18. Pritchard, J.K.; Stephens, M.; Donnelly, P. Inference of population structure using multilocus genotype data. Genetics 2000, 155, 945–959. [Google Scholar] [CrossRef]
  19. Kopelman, N.M.; Mayzel, J.; Jakobsson, M.; Rosenberg, N.A.; Mayrose, I. Clumpak: A program for identifying clustering modes and packaging population structure inferences across K. Mol. Ecol. Resour. 2015, 15, 1179–1191. [Google Scholar] [CrossRef] [Green Version]
  20. Rosenberg, N.A. distruct: A program for the graphical display of population structure. Mol. Ecol. Notes 2004, 4, 137–138. [Google Scholar] [CrossRef]
  21. Liu, X.; Fu, Y.-X. Stairway Plot 2: Demographic history inference with folded SNP frequency spectra. Genome Biol. 2020, 21, 280. [Google Scholar] [CrossRef]
  22. Chan, S.W.; Cheang, C.C.; Chirapart, A.; Gerung, G.; Tharith, C.; Ang, P. Homogeneous Population of the Brown Alga Sargassum polycystum in Southeast Asia: Possible Role of Recent Expansion and Asexual Propagation. PLoS ONE 2013, 8, e77662. [Google Scholar] [CrossRef] [PubMed] [Green Version]
  23. Smith, D.R.; Arrigo, K.R.; Alderkamp, A.-C.; Allen, A.E. Massive difference in synonymous substitution rates among mitochondrial, plastid, and nuclear genes of Phaeocystis algae. Mol. Phylogenet. Evol. 2014, 71, 36–40. [Google Scholar] [CrossRef] [PubMed]
  24. Danecek, P.; Auton, A.; Abecasis, G.; Albers, C.A.; Banks, E.; DePristo, M.A.; Handsaker, R.E.; Lunter, G.; Marth, G.T.; Sherry, S.T.; et al. The variant call format and VCFtools. Bioinformatics 2011, 27, 2156–2158. [Google Scholar] [CrossRef] [PubMed]
  25. Tajima, F. Statistical method for testing the neutral mutation hypothesis by DNA polymorphism. Genetics 1989, 123, 585–595. [Google Scholar] [CrossRef] [PubMed]
  26. Quinlan, A.R.; Hall, I.M. BEDTools: A flexible suite of utilities for comparing genomic features. Bioinformatics 2010, 26, 841–842. [Google Scholar] [CrossRef] [Green Version]
  27. Conesa, A.; Götz, S. Blast2GO: A comprehensive suite for functional analysis in plant genomics. Int. J. Plant Genom. 2008, 2008, 619832. [Google Scholar] [CrossRef]
  28. Alexa, A.; Rahnenfuhrer, J. TopGo: Enrichment Analysis for Gene Ontology; Bioconductor Version; Release (3.15). 2022. Available online: https://bioconductor.org/packages/release/bioc/html/topGO.html (accessed on 5 May 2022).
  29. The Gene Ontology Consortium; Carbon, S.; Douglass, E.; Good, B.M.; Unni, D.R.; Harris, N.L.; Mungall, C.J.; Basu, S.; Chisholm, R.L.; Dodson, R.J.; et al. The Gene Ontology resource: Enriching a GOld mine. Nucleic Acids Res. 2021, 49, D325–D334. [Google Scholar] [CrossRef]
  30. Nazareno, A.G.; Bemmels, J.B.; Dick, C.W.; Lohmann, L.G. Minimum sample sizes for population genomics: An empirical study from an Amazonian plant species. Mol. Ecol. Resour. 2017, 17, 1136–1147. [Google Scholar] [CrossRef]
  31. Graf, L.; Shin, Y.; Yang, J.H.; Choi, J.W.; Hwang, I.K.; Nelson, W.; Bhattacharya, D.; Viard, F.; Yoon, H.S. A genome-wide investigation of the effect of farming and human-mediated introduction on the ubiquitous seaweed Undaria pinnatifida. Nat. Ecol. Evol. 2021, 5, 360–368. [Google Scholar] [CrossRef]
  32. Yao, J.; Shuai, L.; Li, S.; Xu, C.; Wang, X. Genetic analysis of selected Sargassum fusiforme (Harvey) Setchell (Sargassaceae, Phaeophyta) strains with RAPD and ISSR markers. J. Oceanol. Limnol. 2019, 37, 783–789. [Google Scholar] [CrossRef]
  33. Li, S.; Xu, C.; Li, J.; Yao, J.; Liu, J.; Duan, D. Selection, artificial breeding and cultivation of Hizikia “Lu Feng No. 1”. Prog. Fish. Sci. 2010, 31, 88–94. [Google Scholar]
  34. Marandel, F.; Charrier, G.; Lamy, J.; Le Cam, S.; Lorance, P.; Trenkel, V.M. Estimating effective population size using RADseq: Effects of SNP selection and sample size. Ecol. Evol. 2020, 10, 1929–1937. [Google Scholar] [CrossRef] [PubMed]
  35. Patton, A.H.; Margres, M.J.; Stahlke, A.R.; Hendricks, S.; Lewallen, K.; Hamede, R.K.; Ruiz-Aravena, M.; Ryder, O.; McCallum, H.I.; Jones, M.E.; et al. Contemporary Demographic Reconstruction Methods Are Robust to Genome Assembly Quality: A Case Study in Tasmanian Devils. Mol. Biol. Evol. 2019, 36, 2906–2921. [Google Scholar] [CrossRef] [PubMed] [Green Version]
  36. Giantsis, I.A.; Kravva, N.; Apostolidis, A.P. Genetic characterization and evaluation of anthropogenic impacts on genetic patterns in cultured and wild populations of mussels (Mytilus galloprovincialis) from Greece. Genet. Mol. Res. 2012, 11, 3814–3823. [Google Scholar] [CrossRef] [PubMed]
  37. Sun, J.Z.; Ning, X.R.; Le, F.F.; Chen, W.D.; Zhuang, D.G. Long term changes of biodiversity of benthic macroalgae in the intertidal zone of the Nanji Islands. Acta Ecol. Sin. 2010, 30, 106–112. [Google Scholar] [CrossRef]
  38. Nin, C.J.; Rodgher, S. Effect of a temperature rise on metal toxicity for the aquatic biota: A systematic review. Braz. J. Environ. Sci. Online 2021, 56, 710–720. [Google Scholar] [CrossRef]
  39. Leal, P.P.; Hurd, C.L.; Sander, S.G.; Armstrong, E.; Fernández, P.A.; Suhrhoff, T.J.; Roleda, M.Y. Copper pollution exacerbates the effects of ocean acidification and warming on kelp microscopic early life stages. Sci. Rep. 2018, 8, 14763. [Google Scholar] [CrossRef]
  40. Markert, J.A.; Champlin, D.M.; Gutjahr-Gobell, R.; Grear, J.S.; Kuhn, A.; McGreevy, T.J.; Roth, A.; Bagley, M.J.; Nacci, D.E. Population genetic diversity and fitness in multiple environments. BMC Evol. Biol. 2010, 10, 205. [Google Scholar] [CrossRef] [Green Version]
Figure 1. The population information of cultivated and wild S. fusiforme. (a) Geographical distribution of the collected S. fusiforme. The brown dots show the location of each sample site. Detailed information is listed in Table 1. (b) The STRUCTURE analysis for 29 cultivated and wild S. fusiforme. The abscissa represents each individual sample, and the ordinate represents the number of ancestors from 2 to 7. The number shown for wild is corresponding to the sample below: 1, Shengsi; 2–3, Changhai; 4–8, Yeosu-si.
Jmse 10 00958 g001
Figure 2. Demographic inference by stairway plot. The x-axis is the time in thousands of years or generations from the present to the past. The y-axis is the Ne in thousand individuals. The red line indicates the median estimate of effective population size, and the dark and light grey lines indicate 75% and 95% confidence intervals, respectively. (a) Wild populations with mutation rates as 1.3 × 10⁻⁹. (b) Wild populations with mutation rates as 5.2 × 10⁻⁹. (c) Cultivars with mutation rates as 1.3 × 10⁻⁹. (d) Cultivars with mutation rates as 5.2 × 10⁻⁹.
Jmse 10 00958 g002
Figure 3. The signature selection in wild and cultivated populations. (a) The distribution of the Tajima’s D values. The left and right vertical dashed lines indicate the bottom and top 1% of all values in the cultivars, respectively. The lower and upper horizontal dashed lines indicate the bottom and top 1% of all values in the wilds, respectively. (b) The GO enrichment analysis of genes located in the cultivar-top or wild-top.
Jmse 10 00958 g003
Table 1. Sample information of collected S. fusiforme for ddRAD-seq.
Location NameTypeSample Size
Dongtou, Zhejiang, ChinaCultivar21
Shengsi, Zhejiang, ChinaWild1
Changhai, Liaoning, ChinaWild2
Yeosu-si, Jeollanam-do, South KoreaWild5
Publisher’s Note: MDPI stays neutral with regard to jurisdictional claims in published maps and institutional affiliations.

