Article

Short-Term Morphological Responses of Adjacent Intertidal Flats to the Construction of Tidal Gates in an Estuarine Tributary

1
Zhejiang Institute of Hydraulics and Estuary, Hangzhou 310012, China
2
School of Surveying and Municipal Engineering, Zhejiang University of Water Resources and Electric Power, Hangzhou 310018, China
*
Author to whom correspondence should be addressed.
J. Mar. Sci. Eng. 2022, 10(7), 882; https://doi.org/10.3390/jmse10070882
Submission received: 23 April 2022 / Revised: 20 June 2022 / Accepted: 23 June 2022 / Published: 27 June 2022
(This article belongs to the Section Coastal Engineering)

Abstract

:
Tidal gates cause adverse effects on the ecological environment through the downstream acceleration of sediment deposition. This deposition process and its quantitative analysis have become a hot topic in marine science. A large-scale physical model experiment of morphological responses to the construction of a tidal gate in an estuarine tributary was performed in this study. The sediment distribution characteristics, morphologic patterns, and further analysis of the adjacent intertidal flats were investigated, triggered by the construction of tidal gates at the mouth of the Nanxi River in Zhejiang, China. The results indicated that the flood and ebb tide velocities change dramatically after the construction of the tributary tidal gates. Large amounts of sediment from the mouth of the estuary could not be entirely carried away from the flood phase to the ebb phase, resulting in downstream deposition in the vicinity of the gates. The ebb tide caused erosion of the tidal flats’ surface in the silted intertidal zone that gradually developed into a tidal channel network. The tidal channel bifurcated in the middle–upper part of the intertidal flats through continuous headward erosion, thus promoting the landward expansions of channels. Applying a set of logistic growth models to the mean sinuosity, Hausdorff dimension, and junction number data indicated that the tidal channel development progressively tended toward a state of morphodynamic equilibrium.

1. Introduction

Tidal gates have been used around the world for several centuries to defend settlements against the tide and saltwater intrusion, to drain floods, and to store freshwater at the mouths of rivers or tributary streams influenced by the tides [1]. By the end of 2012, China had built 5813 tidal gates in its coastal regions, including 340 large-scale gates (maximum flow through the tidal gate of >1000 m3/s) that account for 6% of the total number of tidal gates, of which more than 70% were built after the year 2000. As a water control structure, tidal gates prevent inflows from seasonal tides and storm-surging events, while allowing the downstream movement of freshwater freely under normal conditions [2,3]. However, the construction of tidal gates causes adverse physical, chemical, and biological effects that change the connectivity between the estuary and the flood plain [4].
Numerous studies, mainly from the United States, Australia, New Zealand, and Canada, have found that tidal gates can alter upstream habitats, water quality, and biomes compared to tidal streams without gates [5]. Tidal gates can change the water quality by limiting tidal exchange and increasing nutrient concentrations, reducing the dissolved oxygen concentrations upstream [6,7]. In most cases, tidal gates are either fully opened or fully closed; this affects fish connectivity and blocks fish migration [8,9,10], which may reduce species diversity and abundance [11,12].
With raised water levels, estuarine tidal gates/barrages usually cause sediment deposition in upstream channels [13]. The subsequent interactions between the sedimentary environment and hydrodynamic forces promote the geomorphological evolution of the tidal basin [14,15]. Upstream of the last barrage on the Rhine River in Iffezheim, the sediment deposition rate is nearly 0.15 million m3/y, leading to severe problems in terms of flood control [16]. Moreover, the construction of a large-scale tide gate/barrage has led to the downstream acceleration of the sedimentation area by transforming the estuarine circulation and, thus, the sedimentation process [17,18]. After constructing a barrage in the upper reaches of the Keum river estuary in Korea, the sediment deposition rate in the estuary increased from 3.5 million to 6.7 million m3/y [19]. The Vilaine estuary, on the Atlantic coast of France, is another excellent example of the influence of human activities on natural evolution. Since the dam was built in 1970, the fall of the tidal prism and the increase in sediment deposition rates have led to a decrease in the tidal current, which played a decisive role in expanding the downstream tidal flats [20]. In the downstream areas of many tidal gates in China, increased sedimentation rates caused by tidal waves have been observed with closed gates [21].
Intertidal flats are located between the areas of high and low tides and are inundated periodically, due to the flood and ebb currents [22]. The construction of tidal gates alters the dynamic environment of water and sediment and dramatically impacts the adjacent tidal flats. This sedimentation enhancement changes the properties of the tidal wave in the vicinity of the gate after being reflected back from the tidal gate. The transformations of tidal waves result in increased flood velocity, due to the shortening of flood tide duration, and decreased ebb velocity due to prolonging the ebb tide duration. This asymmetry in tidal currents influences the sediment budget through an asymmetry of fluctuating tidal current speed and rest flow duration [23]. These modifications can alter flow pathways and control the trend of geomorphic evolution, to a certain extent [24]. Previous studies have demonstrated that when a tidal gate is built at the mouth of an estuarine tributary, the downstream sediment deposition mainly depends on the position of the trunk channel. Pan et al. [25] reported the downstream sediment deposition rate of a tidal gate at the mouth of the Caoe River in the Qiantang River estuary, using fluvial process analyses, movable-bed physical modeling, and field sedimentation experiments. Zhu et al. [21] used Delft3D (Deltares, Delft, The Netherlands) to quantify the effects of a sluice gate on morphological evolution in the Xinyanggang estuary, China.
Previously published studies have presented the effect of tidal gates on the upstream and downstream channels where they are located [5,6,7]. However, little information is available in the literature on the quantitative description of the geomorphological evolution of the adjacent intertidal zone, when triggered by tidal gate construction in an estuarine tributary. The objective of the present study was, therefore, to investigate the sediment distribution characteristics and morphologic patterns of an intertidal flat downstream of a tributary tidal gate, through a large-scale physical model experiment in the Ou River (OR) estuary in Zhejiang Province, China. Following this introduction, the study site and experimental model are described in Section 2. The results and associated discussions are presented in Section 3 and Section 4, respectively, and our concluding remarks are provided in Section 5.

2. Materials and Methods

2.1. Study Site

The OR is the second-largest river in the Zhejiang province of China (Figure 1a), with a total length of 388 km and a basin area of 17,859 km2. The OR is a mountain river with a tidal reach of 78 km (Figure 1b). The average annual discharge and runoff of the OR are 443 m3/s and 14 billion m3, respectively. The Nanxi River (NR) is the largest left-bank tributary of the lower OR, with a length of 142 km and a basin area of 2436 km2. The proposed NR tidal gate (NRTG) is located at the mouth of the tributary (Figure 1c). The average annual discharge and runoff in the section where the gates are located are 85 m3/s and 2.68 billion m3, respectively.
The tidal characteristics of the OR estuary are not only controlled by the astronomical tide factors of the outer sea but are also affected by variations in the upstream runoff. The average and maximum tidal ranges of the estuary section are more than 4 and 7 m, respectively. In this region of China, rainy season-induced floods occur mainly in May and June, while typhoon-induced floods mostly occur in August and September. The rainstorms and floods caused by typhoons often coincide with the astronomical spring tide, which causes the tide level of the OR estuary to rise sharply. The highest recorded water level was 5.55 m (National Vertical Datum 1985, similarly hereinafter) near the NRTG. Moreover, the tidal prism of the NR estuarine section accounts for almost 11% of the downstream OR section, when the upstream runoff is equal to the average annual discharge.
At the project’s location near the NR mouth, the depth-averaged vertical suspended sediment concentration (SSC) can reach 3.6–4.3 kg/m3 in a flood tide and 0.7–1.5 kg/m3 in an ebb tide. The riverbed comprises medium and fine sediments with a diameter of 0.125–0.250 mm, whereas the suspended medium and fine silts have a diameter of 0.006–0.030 mm.

2.2. Model Scope

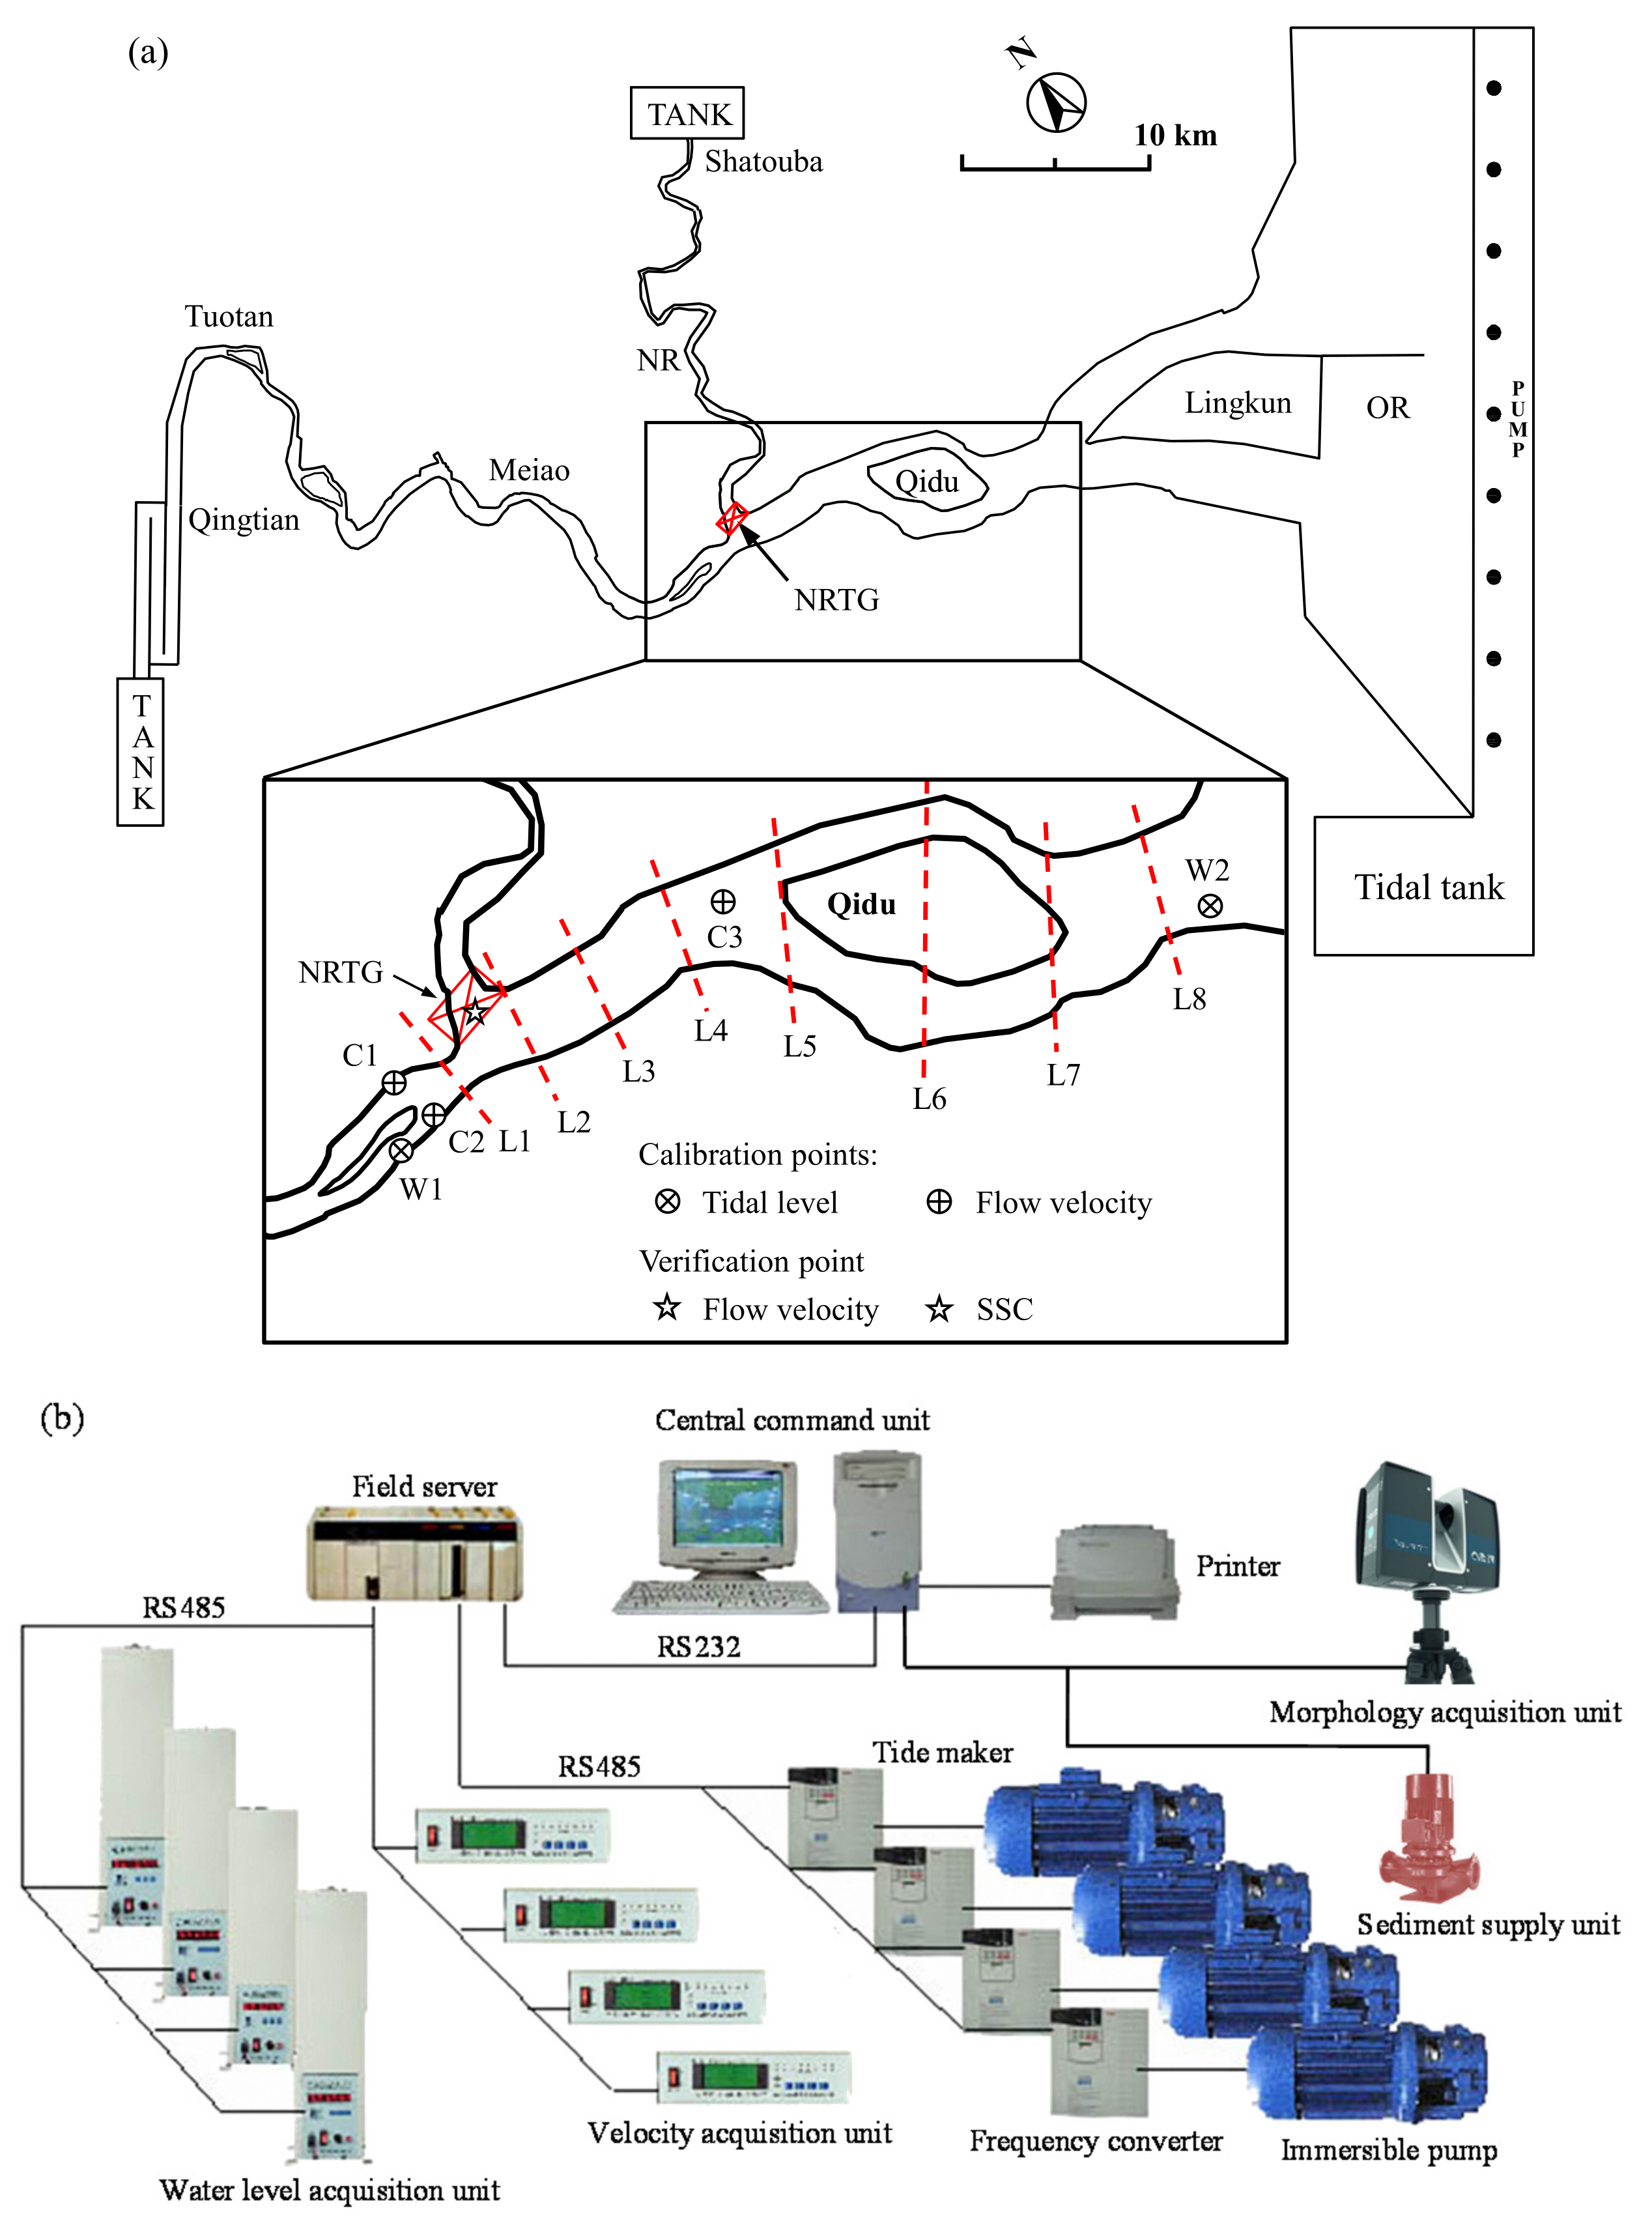
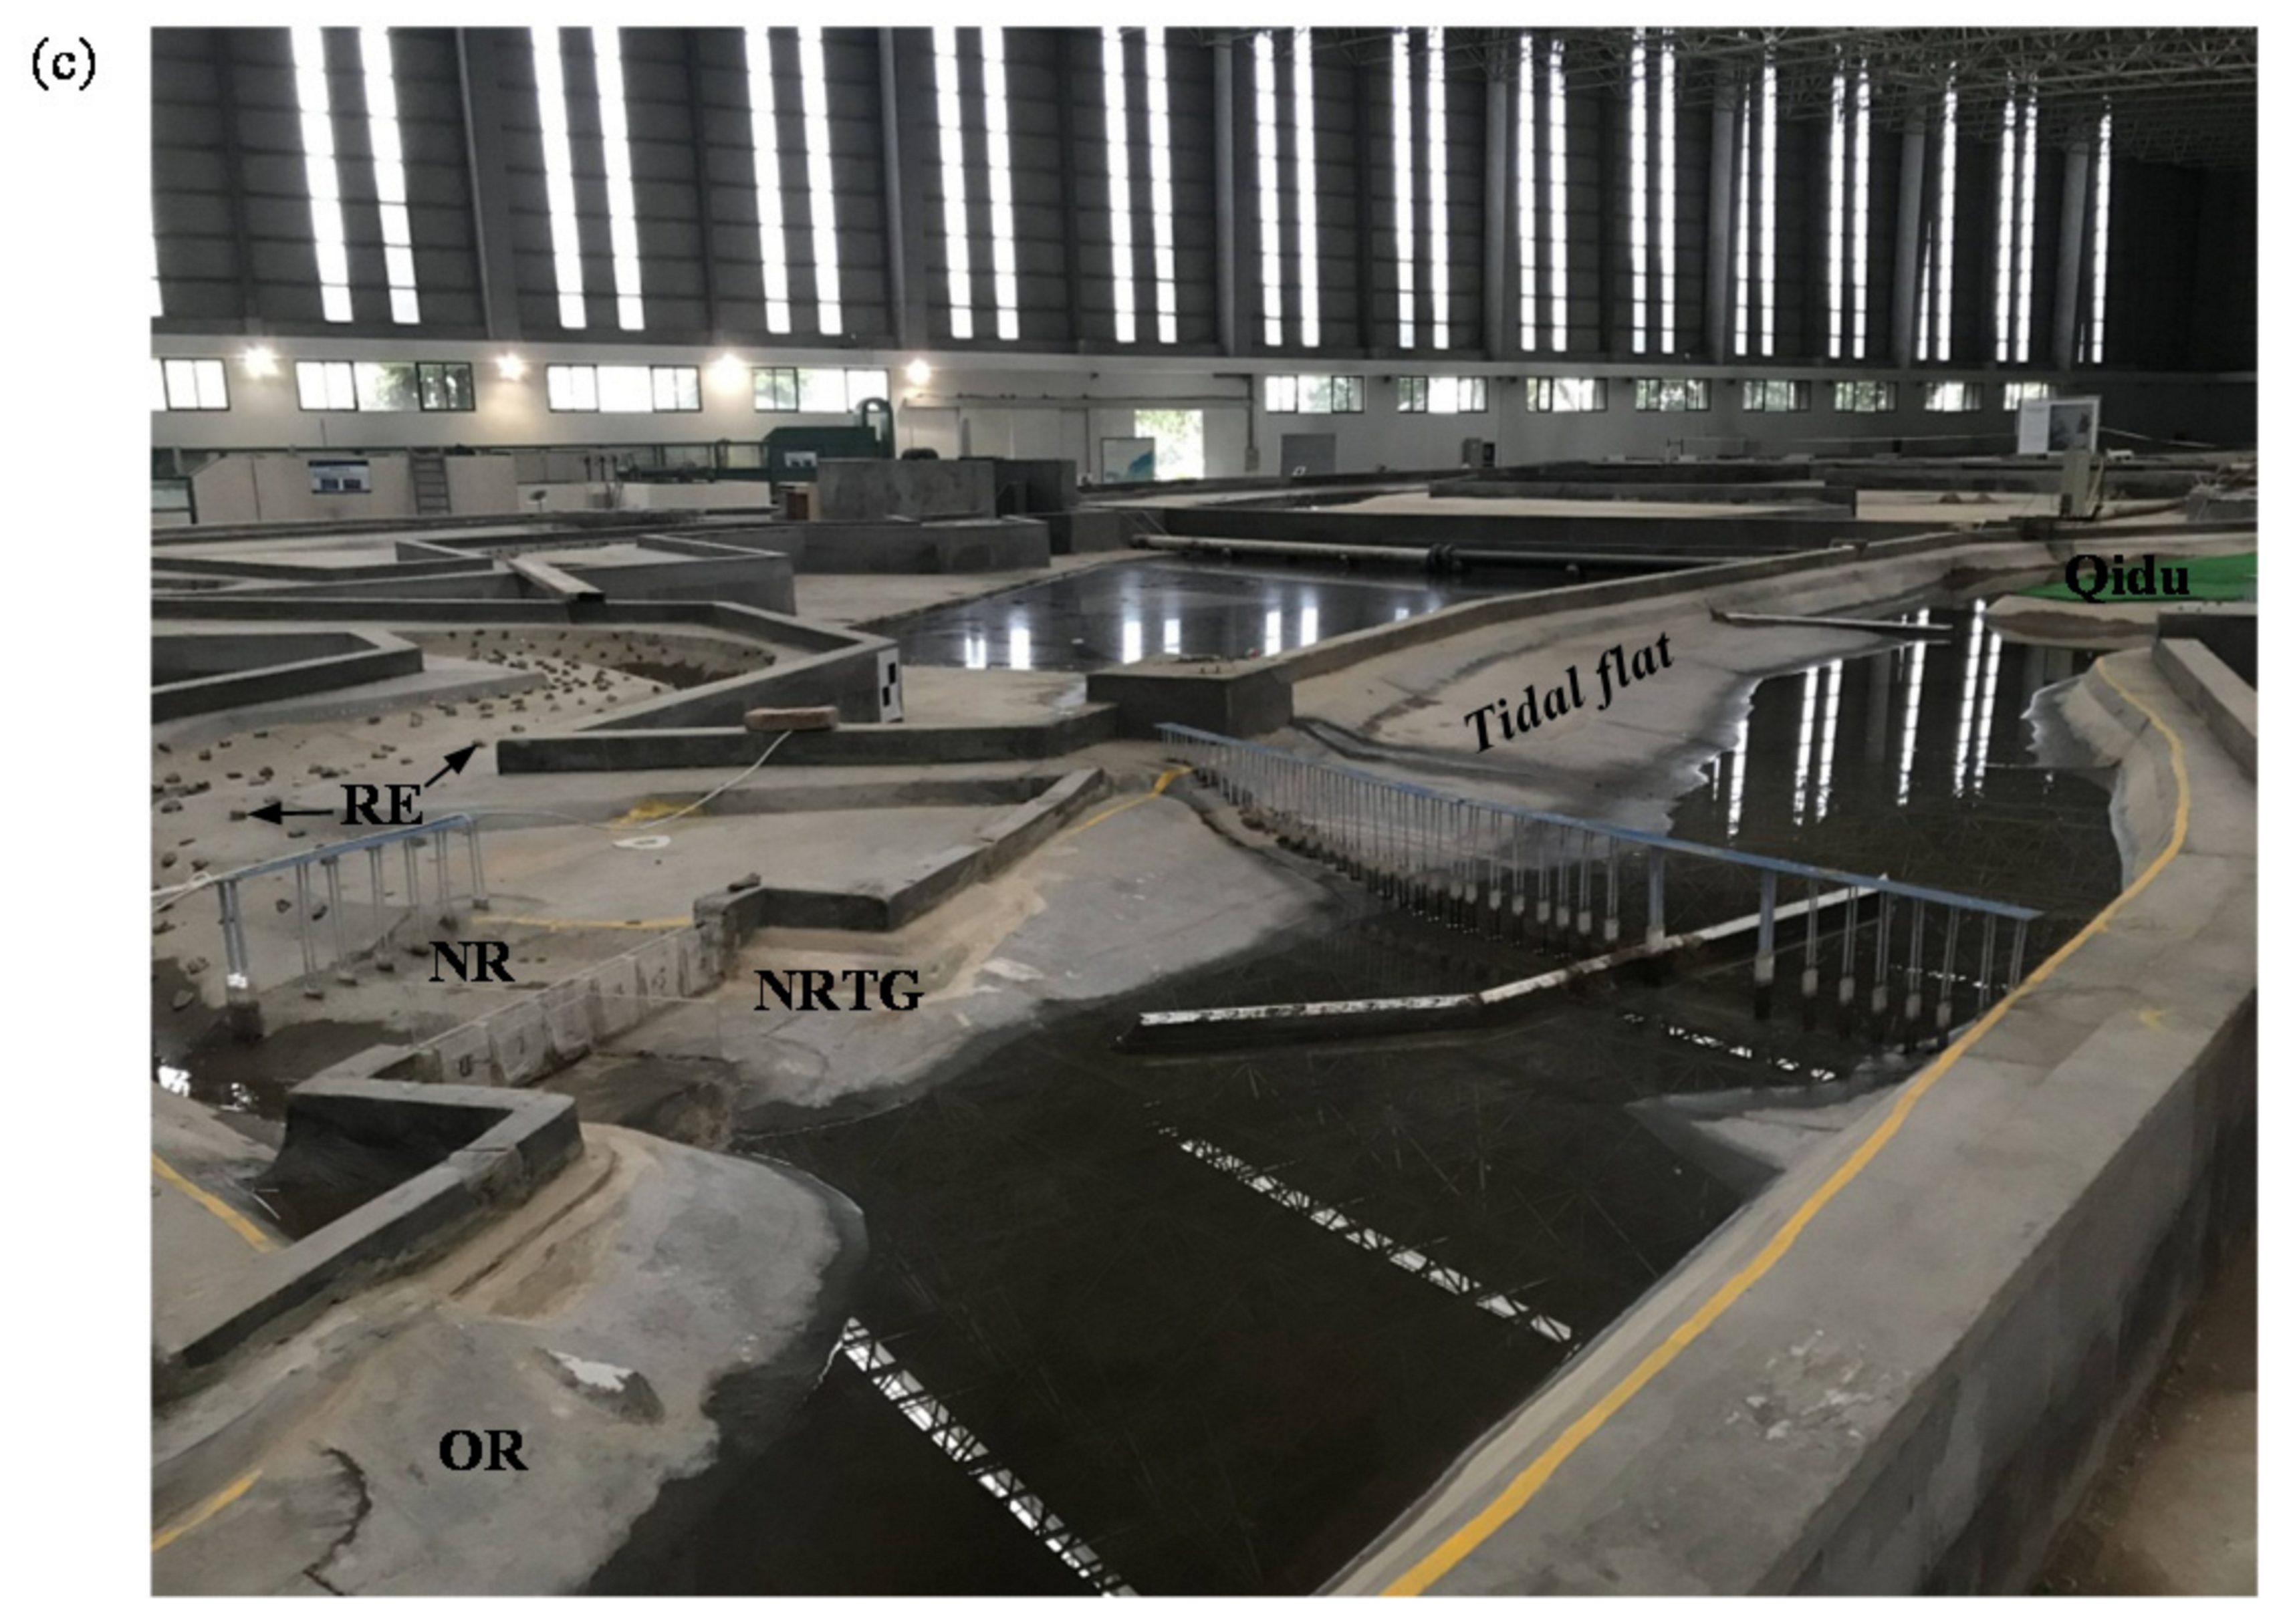
In the model, Qingtian and Shaotouba were selected as the upstream boundaries of the OR and the NR, respectively; the downstream boundary was the mouth of the OR estuary, as shown in Figure 2a. Different discharges controlled the upstream boundaries of the OR and the NR, and the downstream boundary was controlled by variable water levels, which reproduced the tides in the OR estuary. The physical model is located in the Zhejiang Institute of Hydraulics and Estuaries, China. The water tank and banks were built using bricks. The main river channels and floodplain reproductions were paved with gravel and leveled using mortar, according to the field topography.

2.3. Model Scales

The primary fluid flow in an estuarine mapping problem can be described using unsteady two-dimensional shallow-water equations, given in differential form as:
h t + ( h u ) x + ( h v ) y = 0 ,
u t + u u x + v u y + g z x = g u u 2 + v 2 C 2 R ,
v t + u v x + v v y + g z y = g v u 2 + v 2 C 2 R ,
where x and y are the longitudinal and transversal coordinates, respectively; u and v are depth-averaged current velocities in the x- and y-directions, respectively; h is the total water depth, t is time, g is gravitational acceleration, z is the water level, R is the hydraulic radius, and C is the Chezy coefficient. Manning experimentally determined that the Chezy coefficient varied in terms of the sixth root of the hydraulic radius, and in metric units [26]:
C = R 1 / 6 n ,
where n is the Manning roughness coefficient.
The scale model relationship can be deduced using the similarity transformation from Equations (1)–(4). Let us define the scale of the quantity X as [27]:
λ X = X P X M ,
where the subscripts P and M refer to the prototype and model, respectively. For Equations (1)–(4) to apply equally to both prototype and model, each term must be the same in both the prototype and model. Let the vertical scale be λH, then the horizontal coordinates x and y are at the same scale λL, as follows:
λ x = λ y = λ L ,   and λ z = λ H .
Dividing each term of the left side of Equation (2), as written, for the prototype by each term, as written, for the model gives dimensionless ratios that result in the following scaling law:
λ u λ t 1 = λ u λ u λ L = λ v λ u λ L = λ H λ L = 1 δ ,
which yields:
λ u = λ v = λ H 1 / 2 ,   λ t 1 = λ L / λ u = δ λ H 1 / 2 ,
where λu and λv are the velocity scales in the x- and y-directions, respectively; λt1 is the kinematic time scale, and δ is the distortion rate. By combining Equation (8), additional scales may now be derived from the right side of Equation (2):
λ H λ L = λ u λ u λ C 2 λ R ,
where λC and λR are the Chezy coefficient and hydraulic radius scale, respectively. The estuarine area is usually broad and shallow, and the wall resistance can be ignored, yields
λ R = λ H ,   λ n = λ H 2 / 3 / λ L 1 / 2 = δ - 1 / 2 λ H 1 / 6 ,   λ Q = λ L λ H 3 / 2 = δ λ H 5 / 2 ,
where λn and λQ are Manning roughness coefficient and flow discharge scale, respectively.
Further insight into the suspended sediment kinematics may be derived. The continuity equation of the suspended load can be expressed as:
A S t + Q S x + α ω B ( S S ) = 0 ,
where A is the flow area, S is SSC, B is the water surface width, α is the adjustment coefficient for a cross-section, ω is the settling velocity of sediment particles, and S is the averaged sediment-carrying capacity.
Writing Equation (11) for the prototype and dividing it by the same equation for the model yields:
λ L λ H λ S λ t 1 = λ L λ H 3 / 2 λ S λ L = λ α λ ω λ L λ S = λ α λ ω λ L λ S .
Usually, λα = 1 yields:
λ ω = λ H 3 / 2 / λ L = δ - 1 λ H 1 / 2 = δ - 1 λ u , λ S = λ S .
According to Dou et al. [28], the averaged sediment-carrying capacity can be expressed as:
S = α 0 γ γ s γ s γ V 3 C 2 g h ω ,
where α0 is a dimensionless coefficient to be determined by experimental or in situ data, γ is the specific weight of seawater, γs is the specific weight of sediment particles, and V is the streamwise velocity. Equation (14) has been validated by data sets obtained from laboratory experiments and studies of large rivers and estuaries, such as the Yellow River and the Yangtze River, and α0 is estimated to be 0.023 [28].
Let λα0 = 1, λV = λu = λv, and λγ = 1; the following scale may now be derived from Equation (14):
λ S = λ S = λ γ S λ γ S - γ = λ ρ S λ ρ S - ρ ,
where ρ and ρs are the density of seawater and sediment particles, respectively. The continuity equation of the suspended load reflects the change in suspended sediment transport from unsteady flow, but it does not reflect the incipient motion of sediment particles at the bottom. Therefore, to make the suspended sediment movement similar, it is necessary to satisfy the similarity of sediment incipient motion, viz.:
λ V = λ V = λ u = λ v ,
where V is the incipient velocity.
The bed deformation in the study area depends principally on the movement of the suspended load and river-bed deformation for the suspended load, as:
Q S x + ρ B z t 2 = 0 ,
where ρ’ is the dry density of sediment particles, and t2 is the morphological time, and yields:
λ t 2 = λ ρ λ S λ L λ H 1 / 2 = λ ρ λ S λ t 1 ,
where λρ is the dry density scale and λt2 is the morphological time scale.

2.4. Choice of the Model Sediments

Choosing a model sediment necessitates specifying its median diameter d50 and density ρs. Using natural sediment as the model sediment in a suspended sediment model is difficult because the model sediment must satisfy the criteria of similar sedimentation and incipient motion. The choice of model sediment is also governed by practical questions, such as the level of investment and the test site. Generally, it is necessary to select lighter materials for the prototype sand. After using a light model sediment, the morphological time scale λ t 2 is always greater than the kinematic scale λ t 1 . Therefore, in one model tidal cycle, we obtain the morphological evolution corresponding to θ prototype tidal cycles, resulting in:
θ = λ t 2 λ t 1 = λ ρ λ S > 1 .
The magnitude of natural tides is different every day. If the model is reproduced according to natural tides, there will be many tides that are difficult to duplicate. Two continuous spring tides were used as the tide pattern of the suspended sediment model test in this experiment, so the correction coefficient of the tide pattern should be added to the morphological time scale λ t 2 :
λ t 2 = K t 2 λ ρ λ S λ t 1 ,
where K t 2 is the correction coefficient of the tide pattern.
The available test site was 75 m long and 50 m wide. The total simulated prototype water area was approximately 540 km2. Due to the limited choice of laboratory, the horizontal and vertical scales of the model were 800 and 100, respectively, with a distortion rate of 8. According to the field-measured sediment data, the median particle size d50 was 0.0067–0.0087 mm, the settling velocity was 0.023–0.025 cm/s at 20 °C, and the incipient velocity was 1.12–1.81 m/s at a water depth of 2–10 m. According to the similarity of settling velocity, the settling and incipient velocity of the model sediment were required to be 0.018–0.02 and 11.2–18.1 cm/s, respectively.
In the first phase, antiseptic wood powder with a mean particle size of 0.05 mm, a specific weight of 1.15 g/cm3, a settling velocity of 0.018 cm/s, an incipient velocity of 14 cm/s, and a dry density of 0.45 g/cm3 was used as the model sediment. The SSC and morphological time scale were empirically determined by relating the time intervals, in the prototype and the model, that corresponded to an actual morphological evolution in the past [29]. Calculated and selected scale values of the experimental model are shown in Table 1. According to several validation test results, the model sediment concentration, along with the amplitude and distribution of topography erosion and deposition, were in good agreement with the actual situation at λS = 0.38 and λ t 2 = 547.5 .

2.5. Control System and Measurement Technique

The model adopted the advanced multi-pump frequency control and multi-gate closed-loop water level control system to generate a tide. The integral separation proportional–integral–derivative algorithm was used to control the frequency converter, according to the required boundary tidal process line, and provide tidal flow to the model through multiple pumps, forming a closed-loop water-level control system. Figure 2b presents a scheme of the control system and the automatic measurement devices. The system can administer the work coordination, parameter processing, working conditions display, printing record, and man-machine dialog. The entire data acquisition device and tide-maker must be programmed to suit the current research needs.
The central system computer can control the time and duration of sediment supply to reach a fully synchronous operation of the tide-generating system. The traditional single-point measurement technology cannot effectively measure the elevation of large-scale beach surfaces. A large number of cloud data points can be obtained merely by using a three-dimensional laser-scanning system to measure the surface of the target area. The morphology of the intertidal flats was measured with a high-resolution (1 mm) laser scanner (FARO Focus S 150, Faro Technologies Inc., Lake Mary, FL, USA). The process of changes in tidal flat elevation can be analyzed conveniently using such a device after data-processing with the appropriate software. Velocity measurements were conducted using an acoustic Doppler velocimeter SonTek 16 MHz Micro ADV (SonTek Inc., San Diego, CA, USA), with a resolution of 0.01 cm/s. Automatic tracking displacement meters with a resolution of 0.02 mm were used for water-level measurement.

3. Results

3.1. Model Calibration and Verification

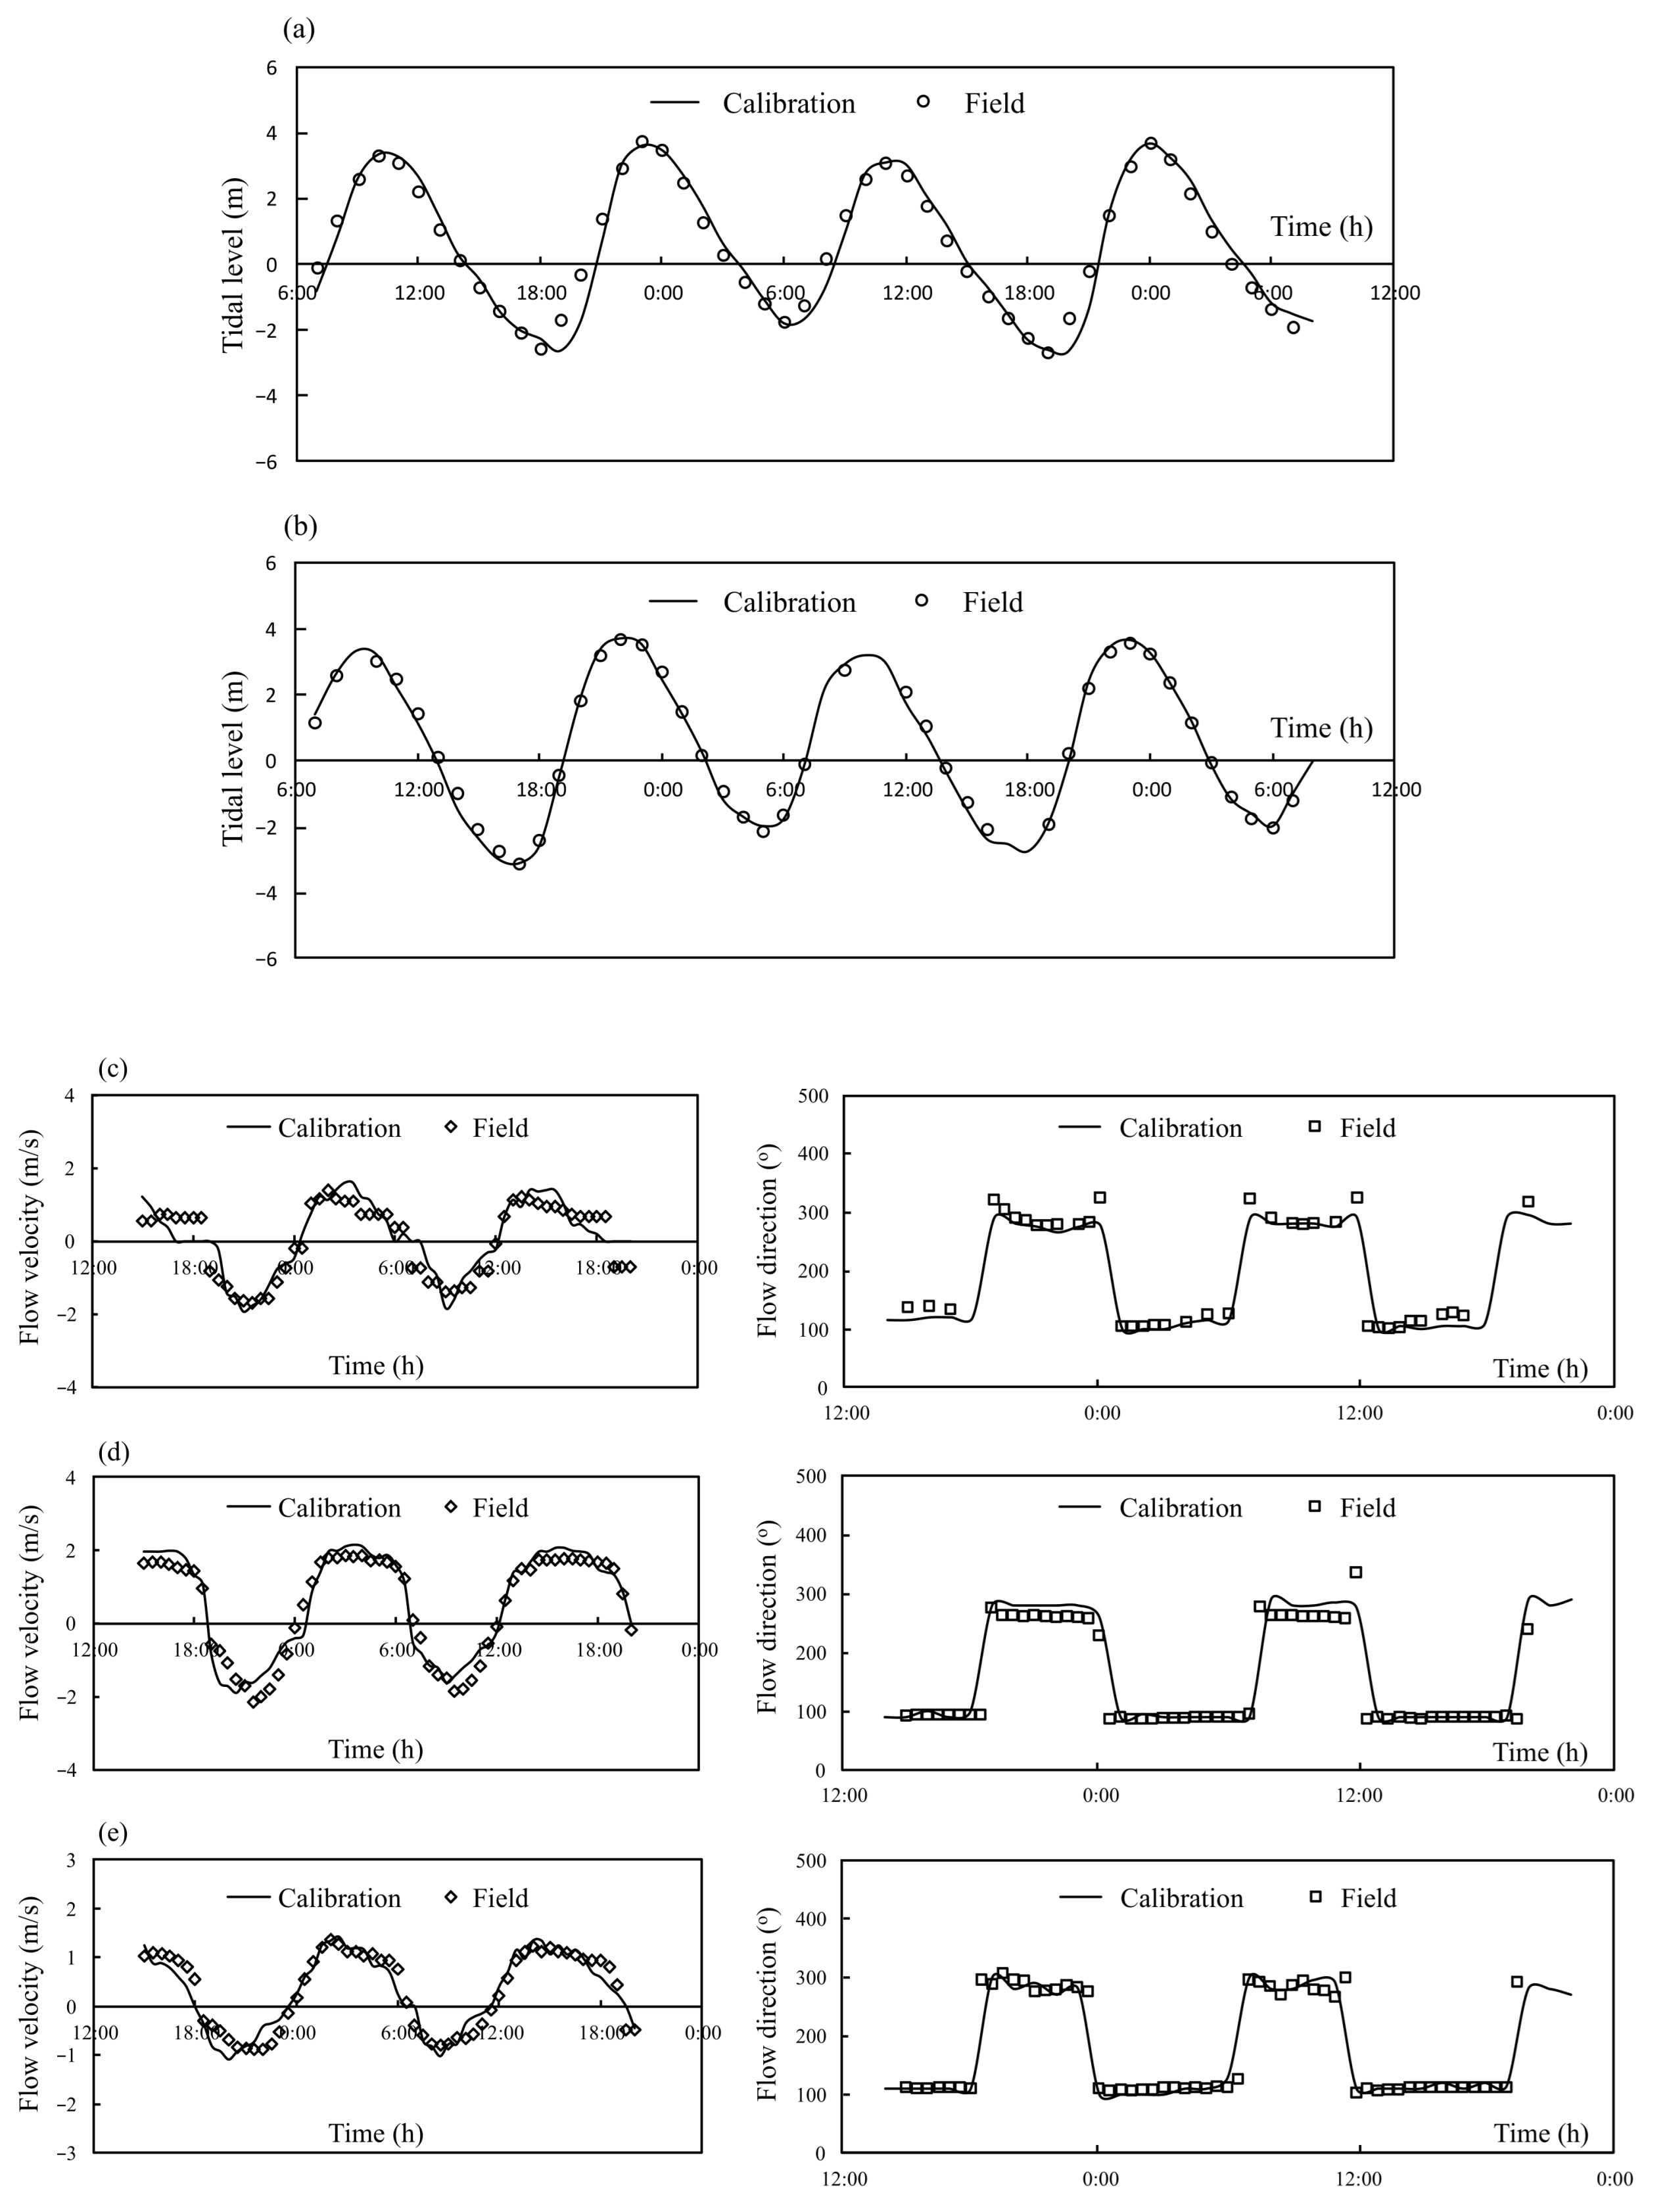
The model should be calibrated before it is verified. The purpose of the calibration tests is to reproduce the tidal levels and flow patterns in the model, as in the prototype. To achieve the hydrodynamic calibration of the model, the only effective method is to change the bottom roughness of the model [29]. A set of time-series measurements in 2013 were used to calibrate and verify the tide levels and flow currents. The calibration points are shown in Figure 2a. By adjusting the spatial density of the roughness element (RE in Figure 2c), the tidal level and flow velocity regimes of the model can agree with those of the prototype. Figure 3a,b compare the time series of tidal levels calibrated experimentally and observed in the field. Overall, the results were consistent with the changes in tide level, and the root mean square error (RMSE) values for W1 and W2 (in Figure 2a) were 0.31 and 0.14 m, respectively. The correlation between the simulated and observed data was acceptable at the two sites. The correlation coefficients of points W1 and W2 were 0.989 and 0.998, respectively. Therefore, the proposed model can be used to reproduce the changes in tide level during spring–neap tide cycles.
Figure 3c–e portray the calibration results of flow velocity and direction, which show the consistency of the modeled peak velocity and phase values with the observed data. In terms of velocity, RMSEs were 0.35, 0.29, and 0.23 m/s at the three sites, with correlation coefficients of 0.916, 0.979, and 0.958, respectively. For flow direction, the RMSEs were 18, 33, and 27° at the three sites, with correlation coefficients of 0.963, 0.945, and 0.929, respectively. Overall, the modeled velocity and flow direction agreed remarkably well with the observations.
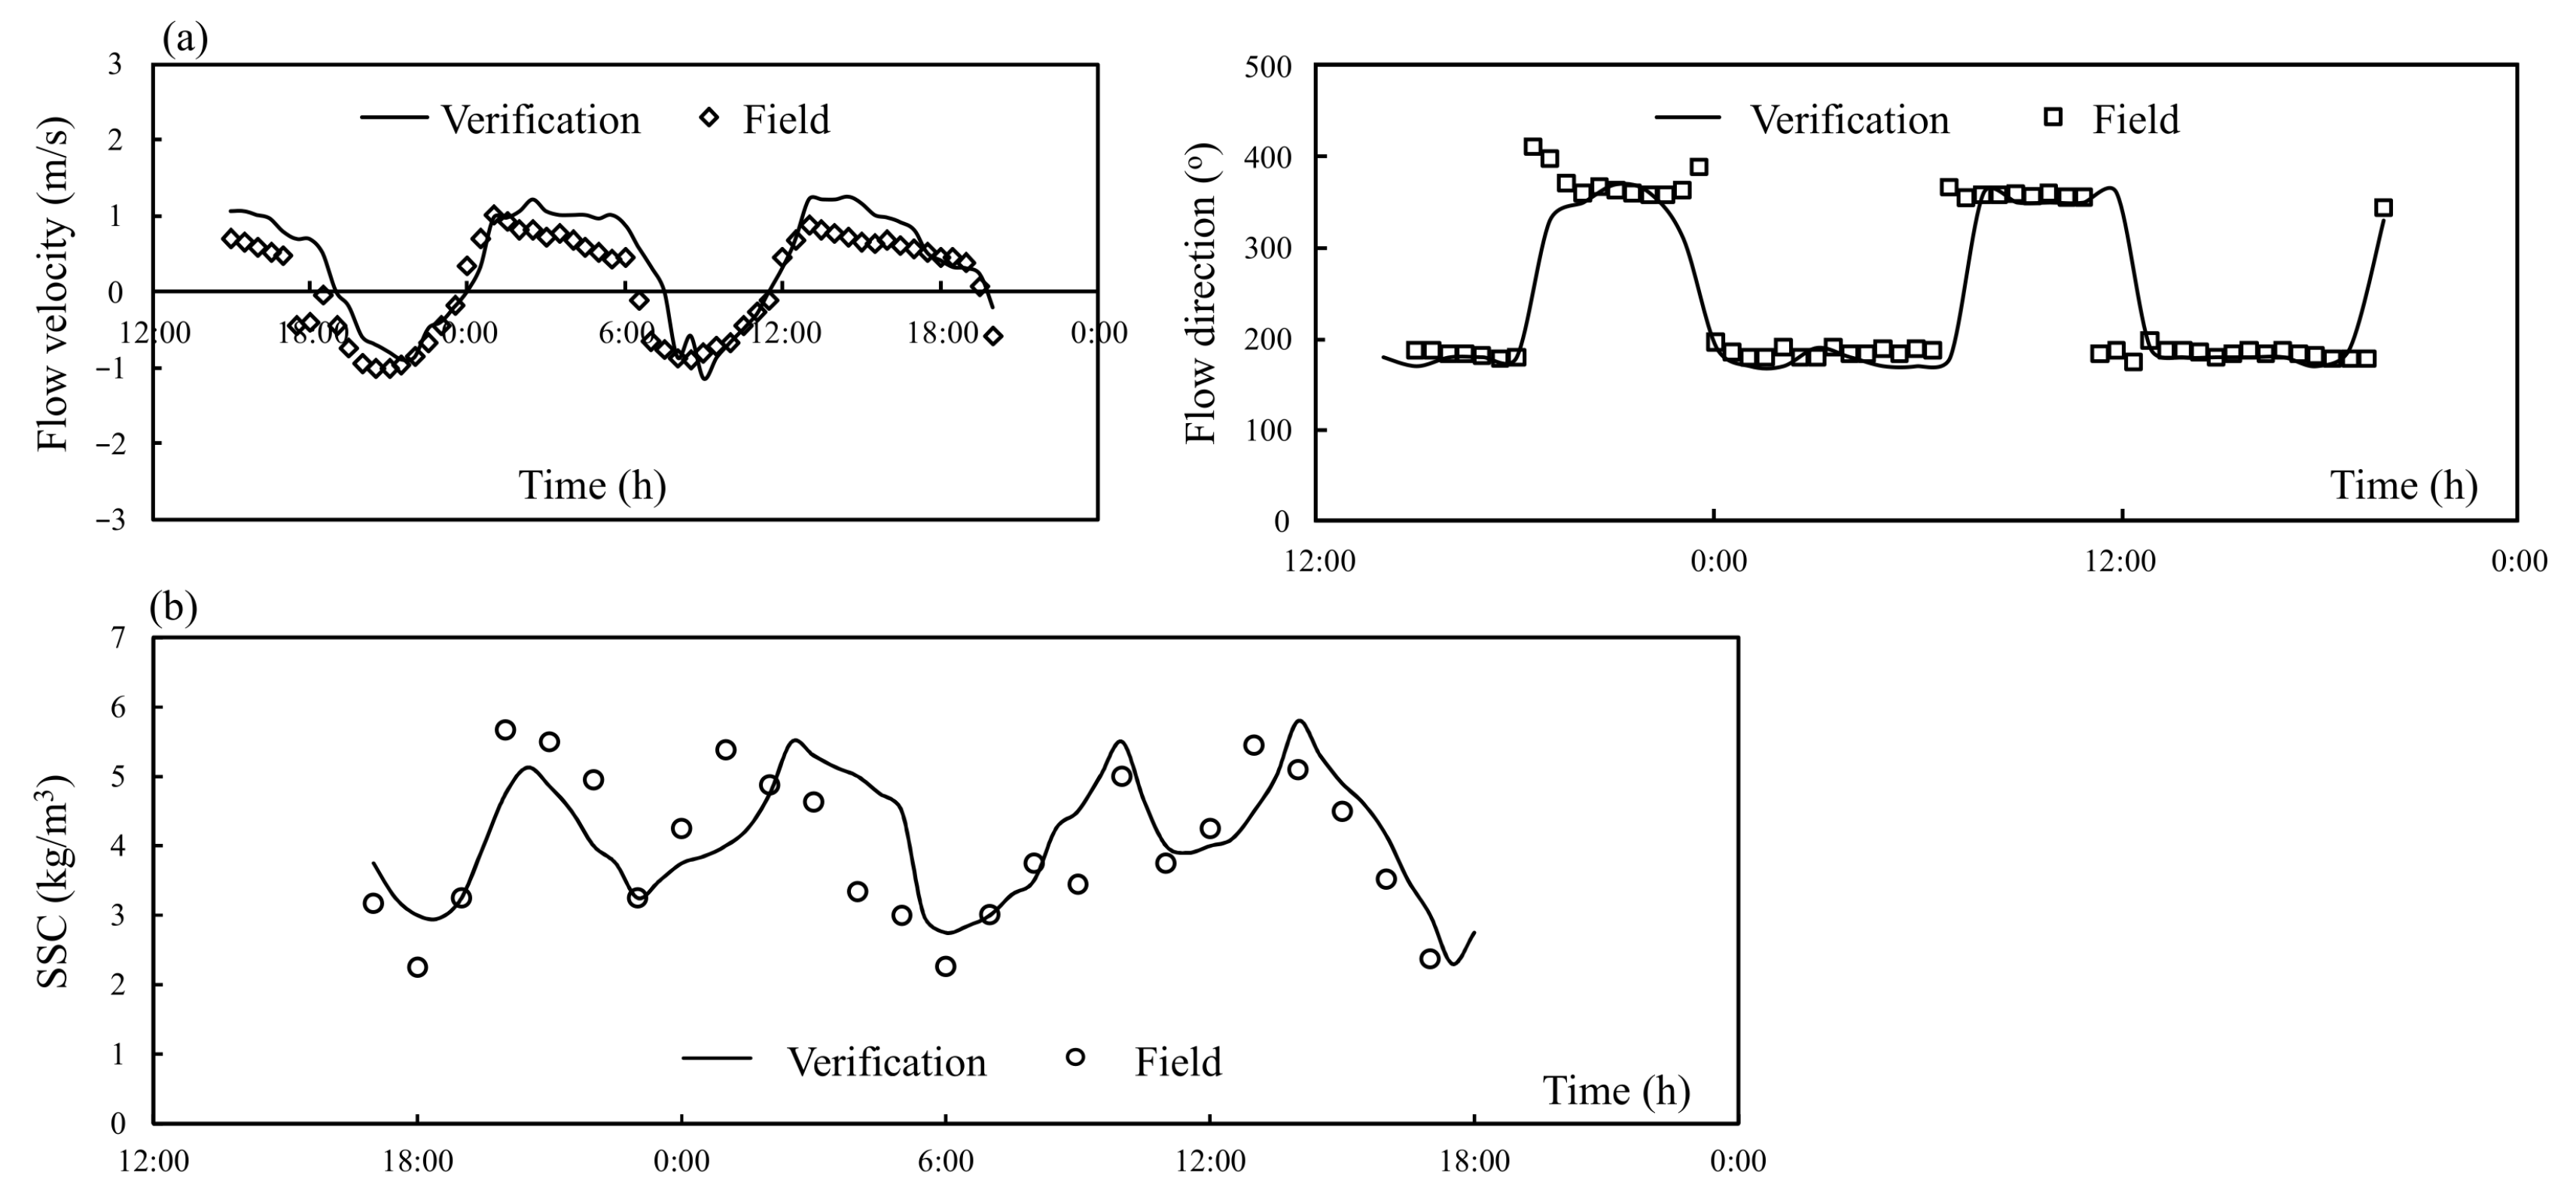
The verification characteristic points were selected at the proposed tidal gate position (NRTG in Figure 2a) for flow velocity and SSC. Comparisons between the modeled and measured flow velocity, direction, and SSC during the spring tide are depicted in Figure 4. Figure 4a shows that the molded results of flow velocity and direction agreed with the observed data in situ, with RMSEs of 0.28 m/s and 52°. The model and prototype correlation coefficients were 0.927 and 0.834, respectively. SSC was controlled at the boundary and was calibrated based on the mean value of the half-tide period [30]. Figure 4b shows that the SSC at the NRTG position was consistent with the field observation results.
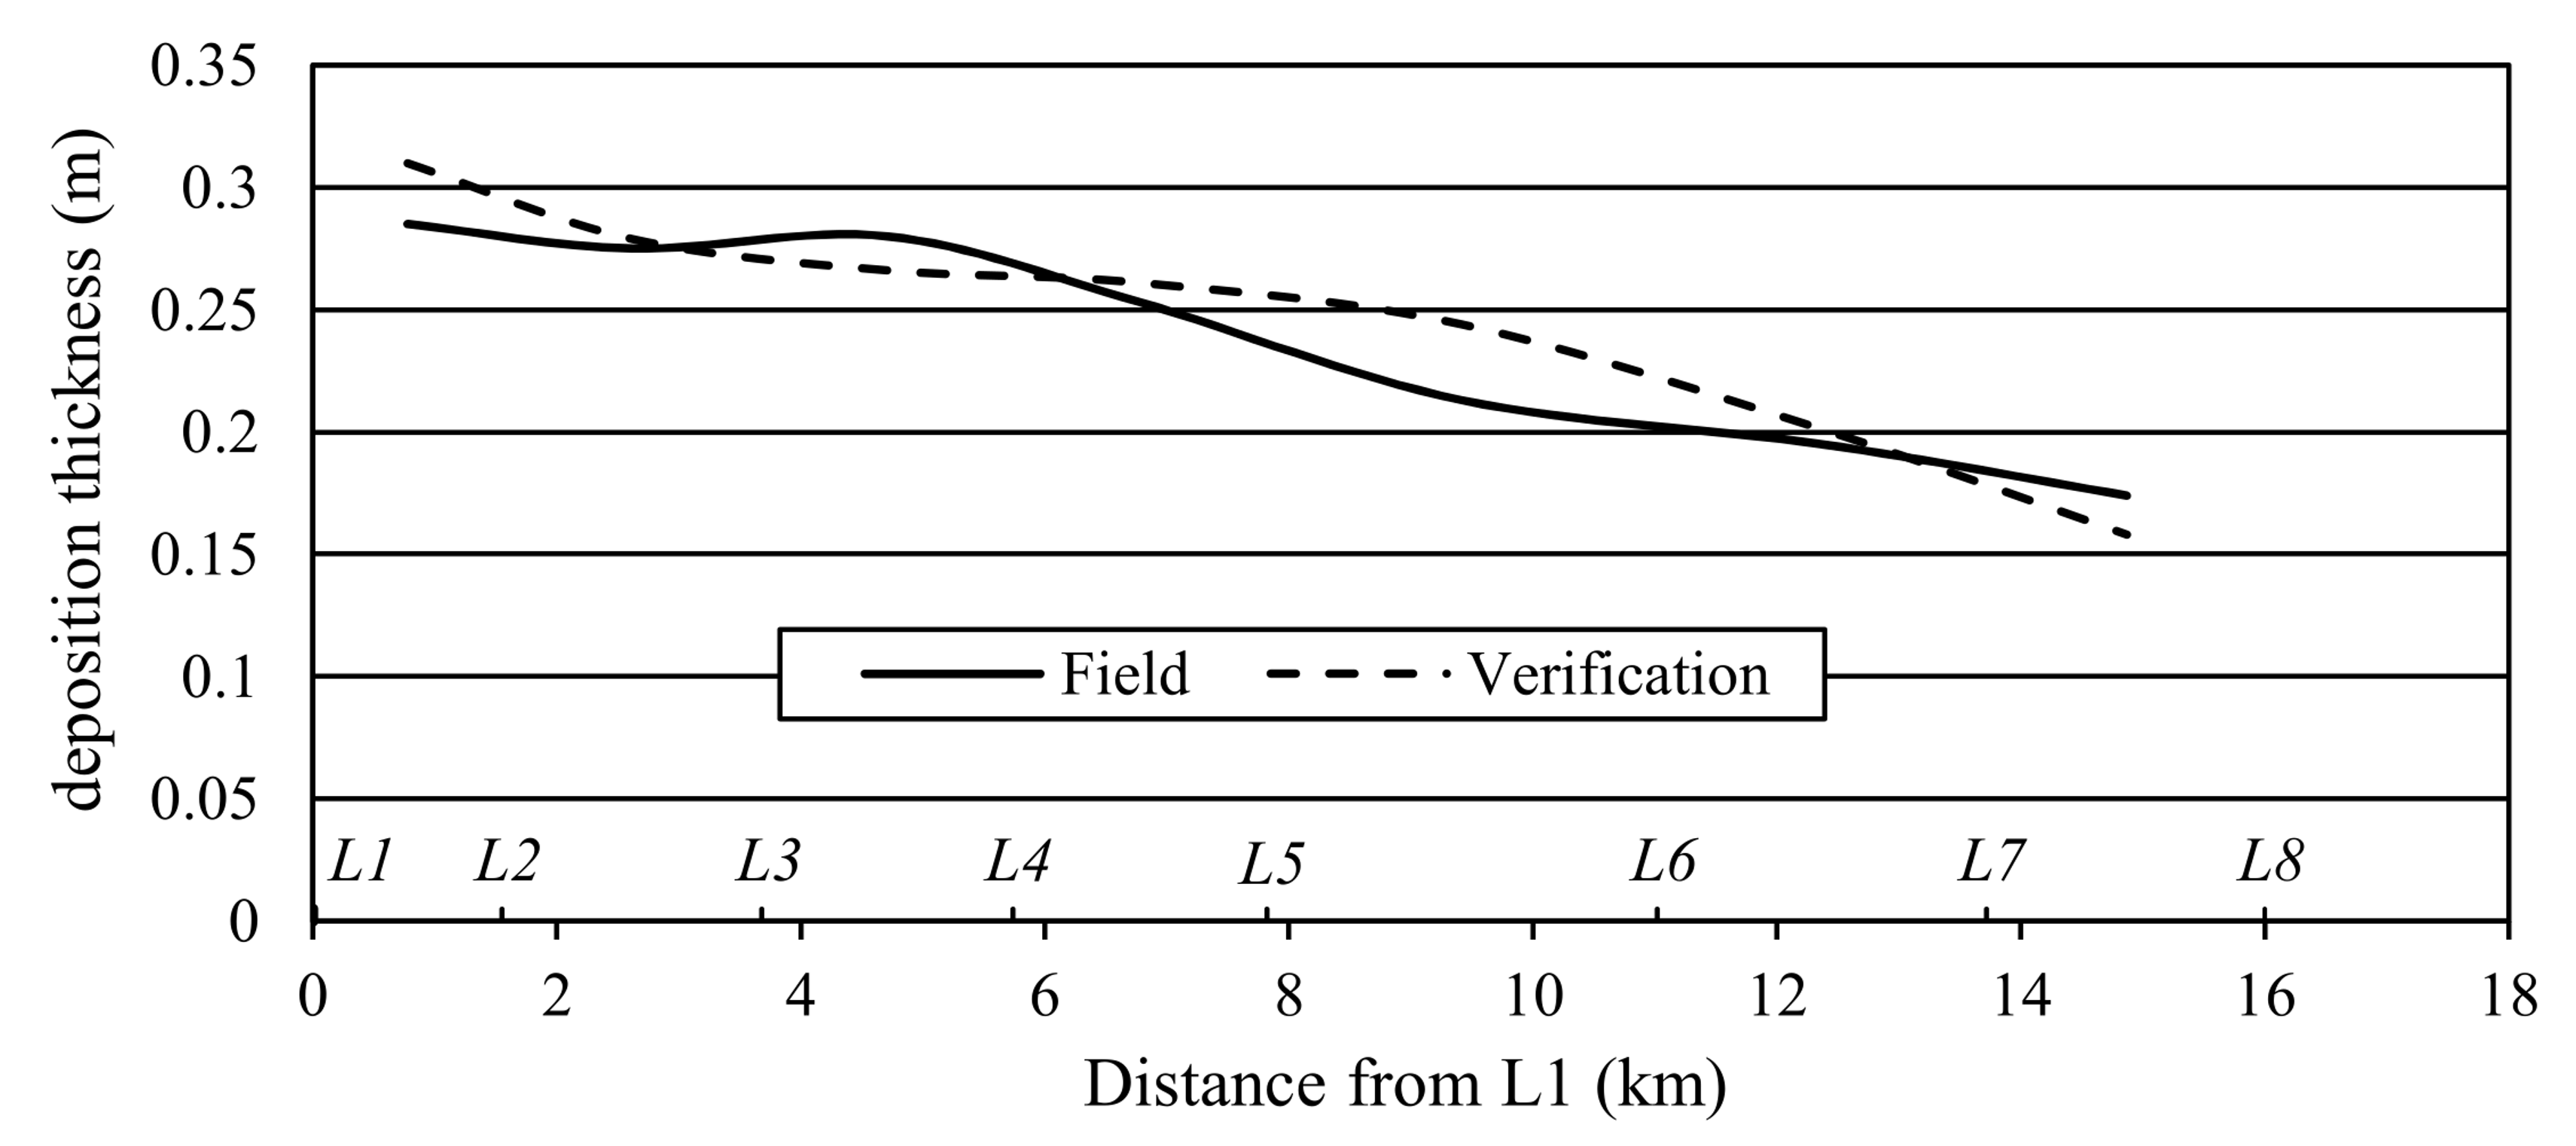
The test verified the riverbed siltation before and after two measurements in June and October 2013. The verification test used the siltation volume in a typical section, along with the segmented reach, to determine whether the model riverbed siltation is similar to the prototype. In addition, eight typical sections, L1–L8, were selected, as shown in Figure 2a. The verification results of the siltation volume in the river reach are shown in Table 2. From June to October 2013, the modeled volume of deposition from sections L1 to L8 was 7.938 million m3 and the deviation was 5%, compared with the measured total volume of 8.332 million m3.
As shown in Figure 5, the observed maximum deposition thickness occurs between sections L1 and L2 and decreases gradually from section L2 to L8. The modeled deposition thickness ranged from 0.158 m to 0.311 m, with an average deviation of 6.5% compared with the measured data in situ. The results show that the modeled sediment deposition agreed with the measured. The successful calibration and verification discussed above indicate that the physical model established here can be used for the simulation to test the influence of tidal gate construction on the hydrodynamics and sedimentation of the adjacent area.

3.2. Effect of the NRTG on the Surrounding Hydrodynamics

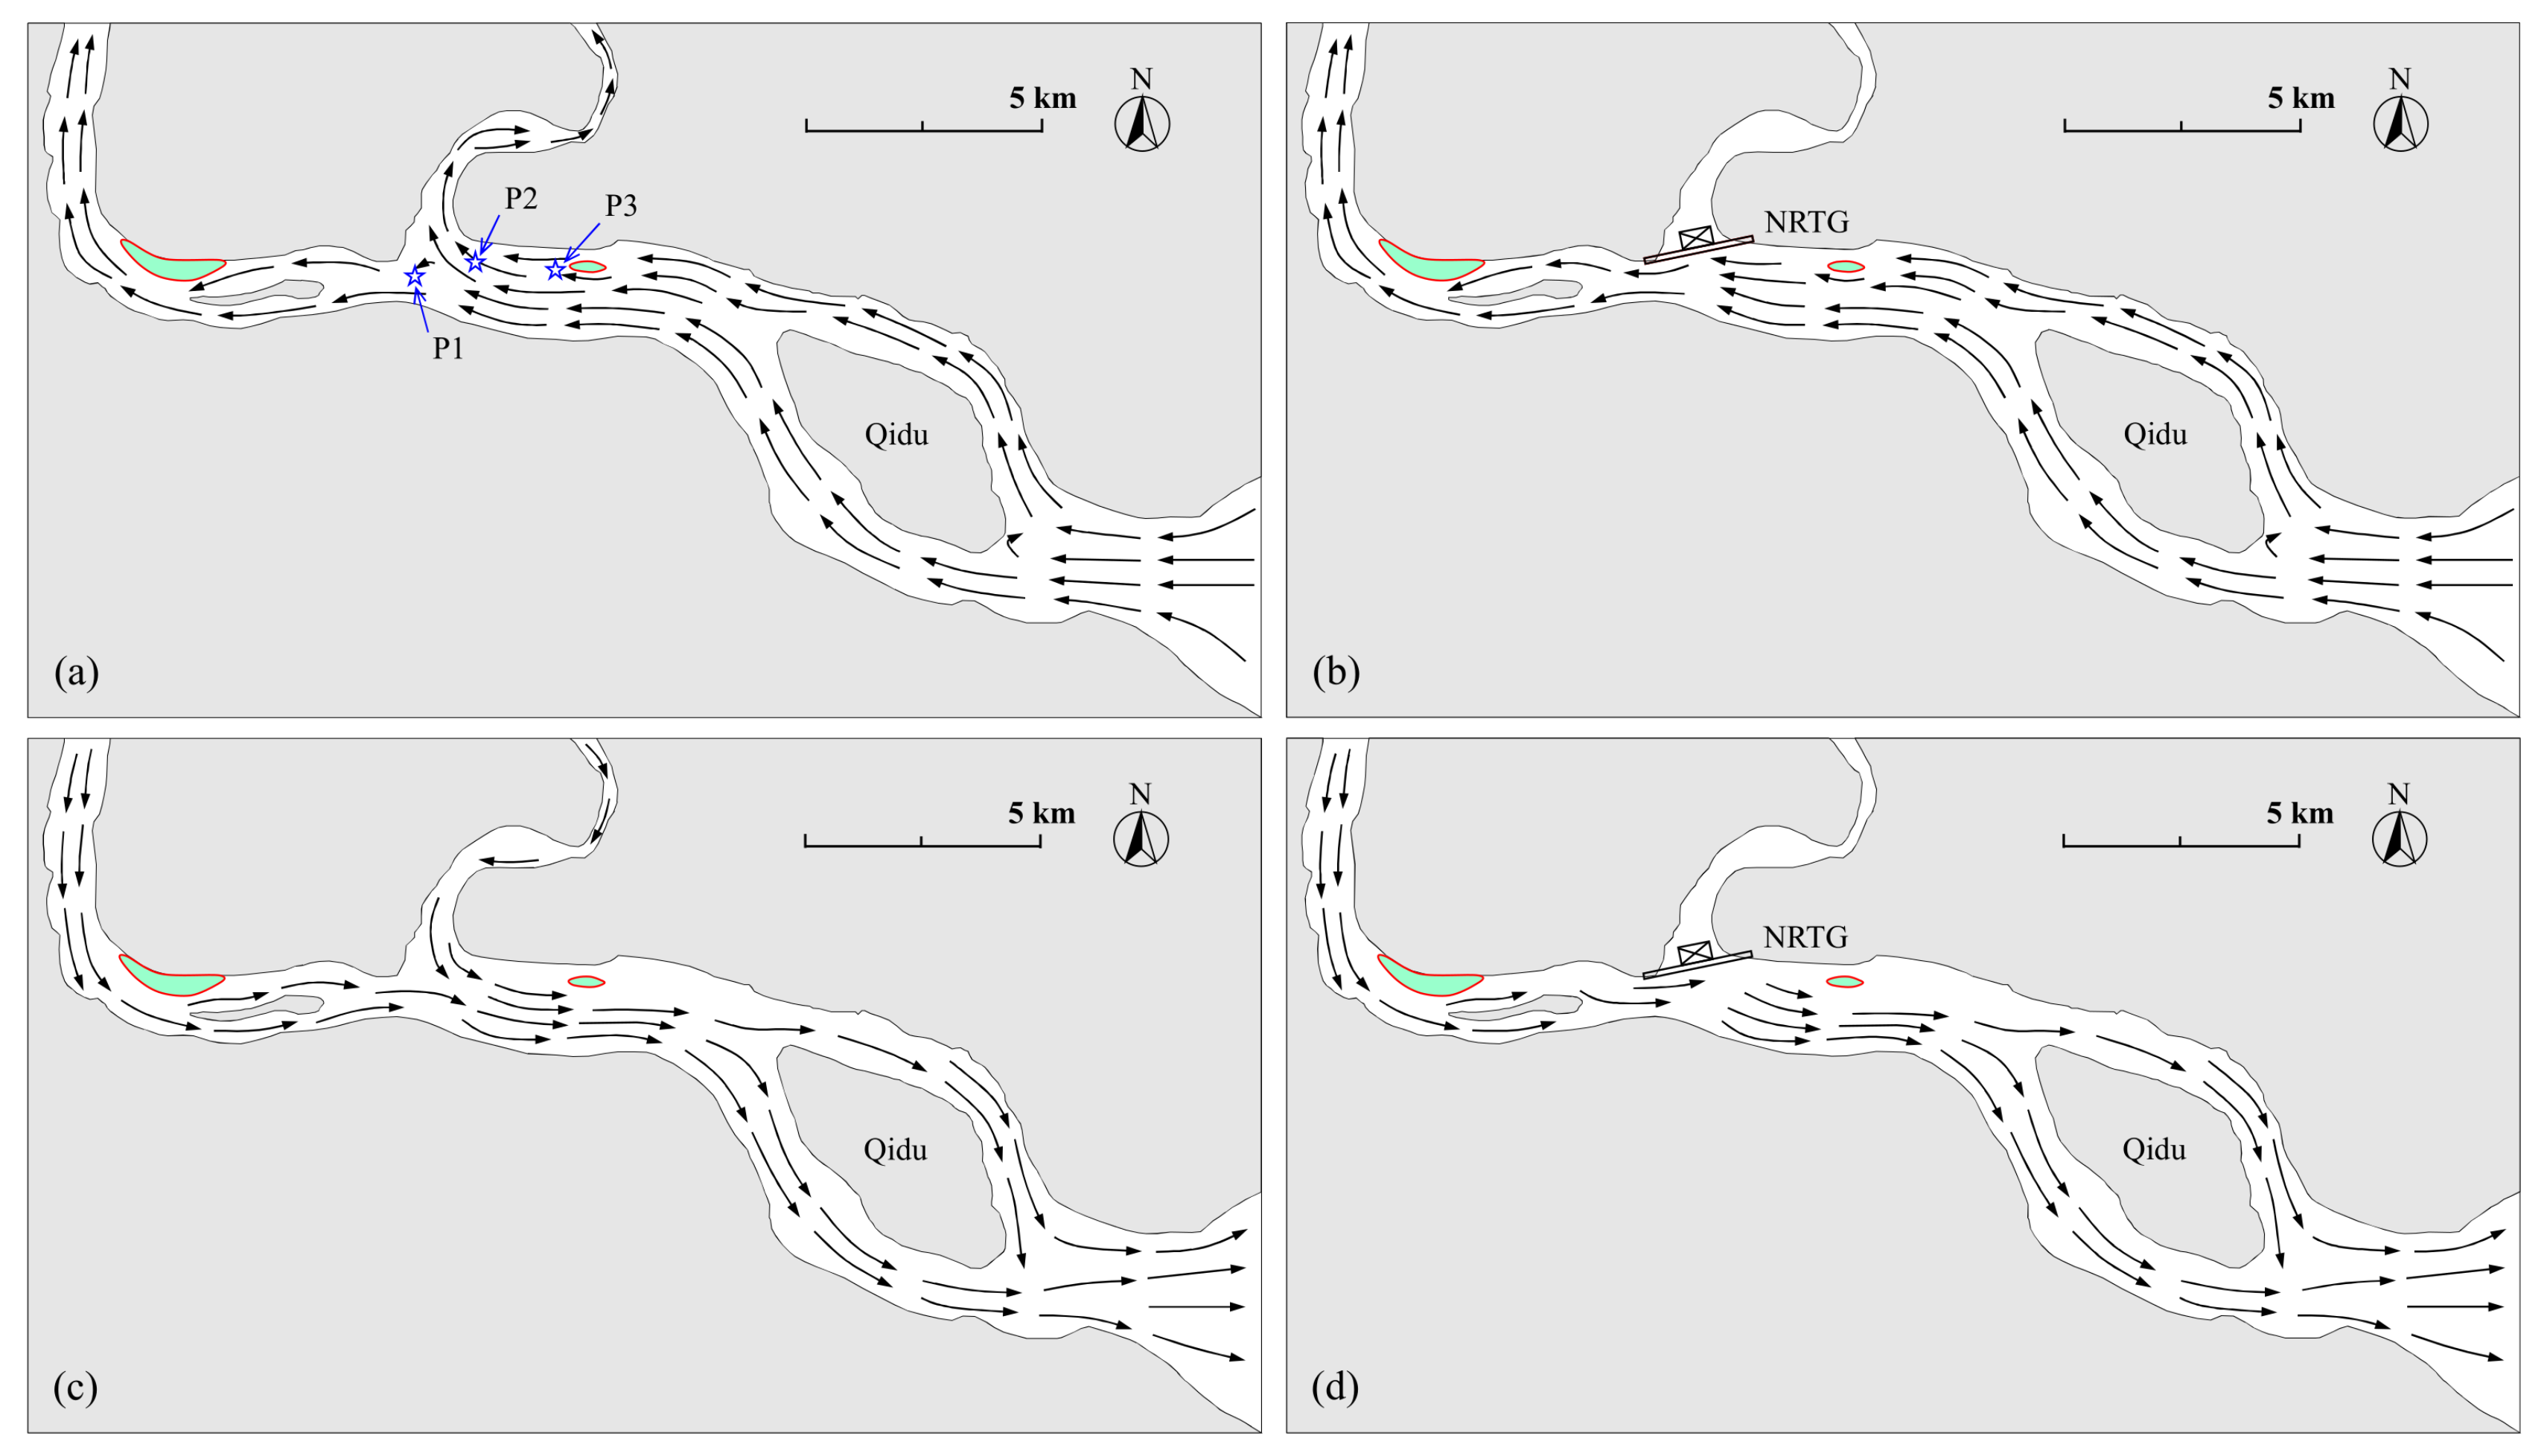
The effect of the NRTG on the surrounding hydrodynamics was considered when the gate was fully closed. The selected flows of the control section upstream of the OR and the NR were the average annual discharge; the discharges of Qingtian and Shatouba (in Figure 2a) were 443 m3/s and 73.6 m3/s, respectively. The selected lower estuary boundary condition was the water-level process of an ordinary spring tide. The flow stream lines can describe the general current patterns of the model zone. To characterize the flow stream lines, a large number of floats made of finely shredded white paper, with an equivalent diameter of 1 to 2 cm, were sparsely distributed over the observed area. The trajectories of the floats can be extracted from the photographic sequences to reflect the stream line distribution. As shown in Figure 6, after the project was implemented, the flood tide affected by the NRTG that initially entered the NR flowed past the gate site and then turned to the upstream of the OR; during this phase of the ebb tide, the main stream was closer to the south bank of the OR.
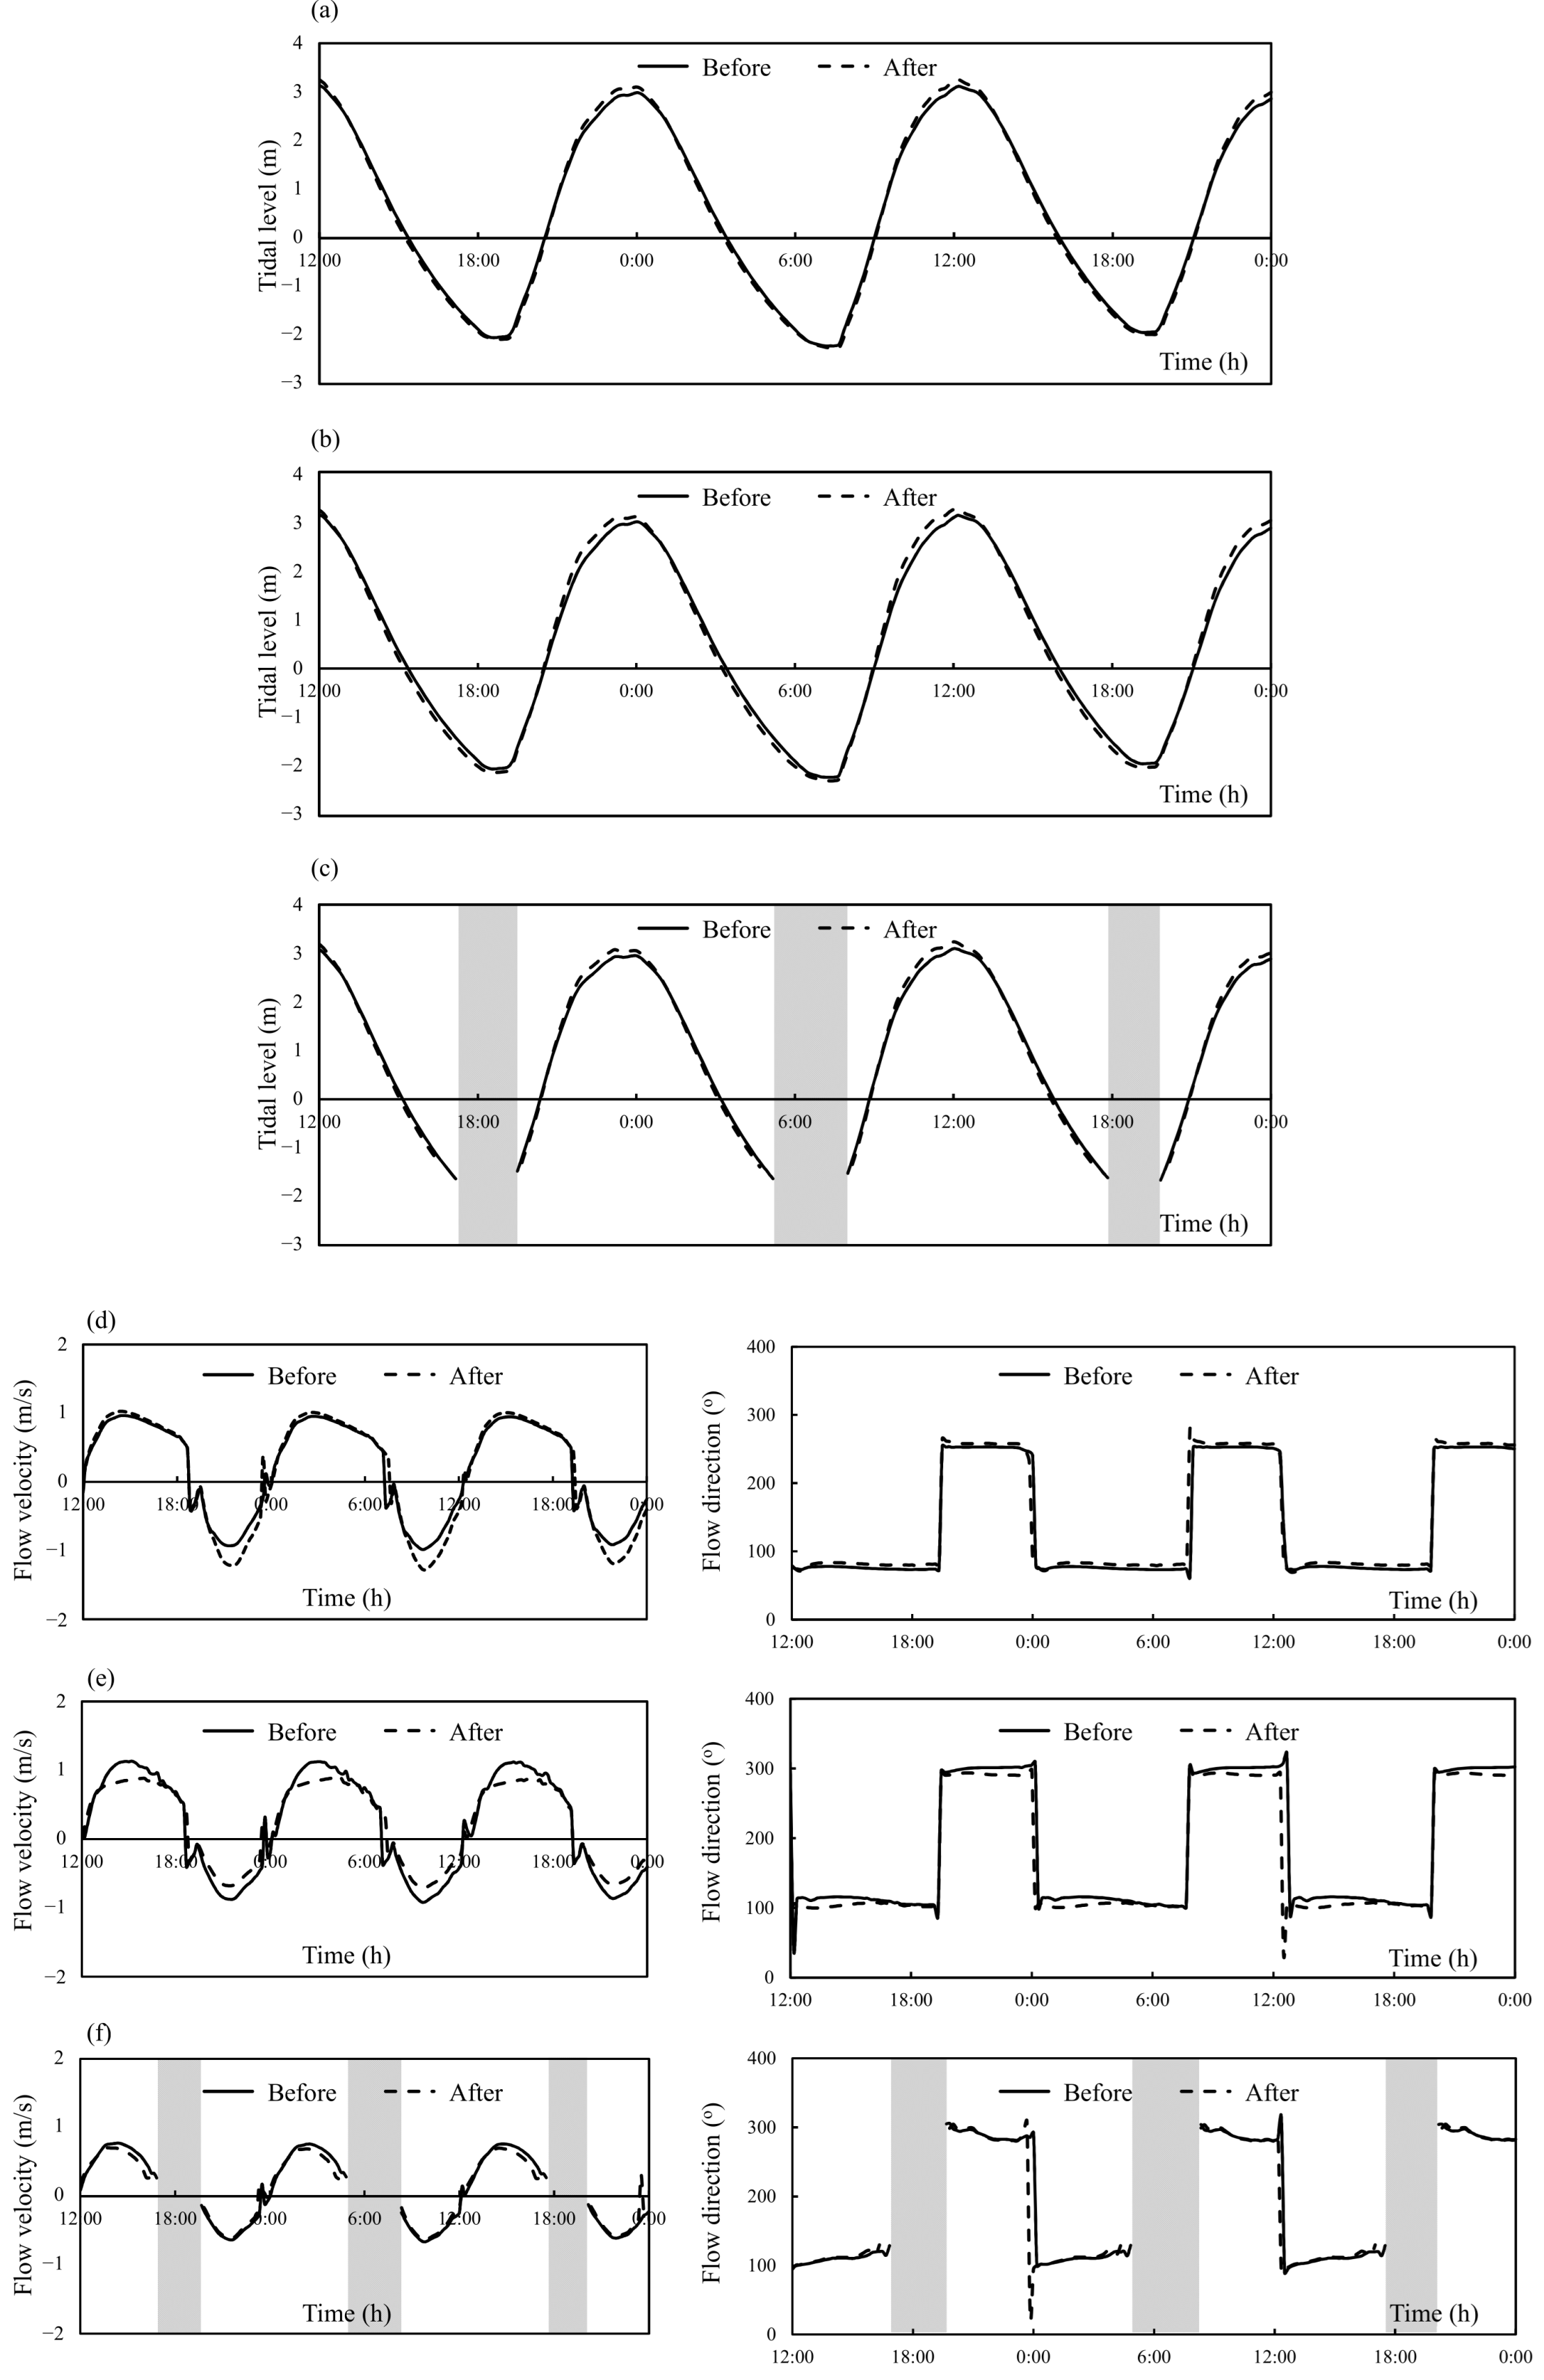
Comparison of tidal levels, flow velocities, and directions at three observation points (P1, P2, and P3) before and after the construction of the NRTG during the spring tide are presented in Figure 7. Caused by the local backwater around the NRTG, the high-tide level of each observation point rose by 11–14 cm; the tidal range increased by 13–17 cm. The low-tide level decreased slightly. At P1, which was located on the upstream side of the gate site, the maximum flood and ebb tide velocities increased by 30% and 6%, respectively. At P2, which was at the downstream side of the gate site, the decrements of the maximum flood and ebb tide velocity were 22%, in equal amplitude. At point P3 of the intertidal zone, the maximum flood and ebb-tidal velocities decreased by 4% and 8%, respectively.

3.3. Morphological Change of Intertidal Flats

Morphological changes in the intertidal flats result from the interaction between the tide and tidal flat surfaces. At the initial phase of the flood tide, the water level rose rapidly, and the rising tide quickly passed through the middle and low tidal flats. The elevation above the middle tidal flat was higher, the friction effect was enhanced, and the energy loss of the tidal current was increased. In the final phase of the flood tide, the rising speed of the water level was greatly slowed down, and the fine-grained suspended sediments that were carried by the flood tide flow fell and were deposited in the upper part of the tidal flat. At the initial phase of the ebb tide, with the decline in water level, the velocity began to rise again. However, with the gradual emergence of the exposed tidal flat, the newly deposited material could not be entirely carried away by the ebb tide. The water in the middle and lower part of the tidal flat still returned to the trunk stream in the form of a floodplain flow, and the partial sediment at the middle tidal flat moved downward with the tide. In the final phase of the ebb tide, with the decline in water level, the friction effect of the tidal flat on water flow became more and more significant, and a large amount of sediment fell and was deposited on the middle and low tidal flats.
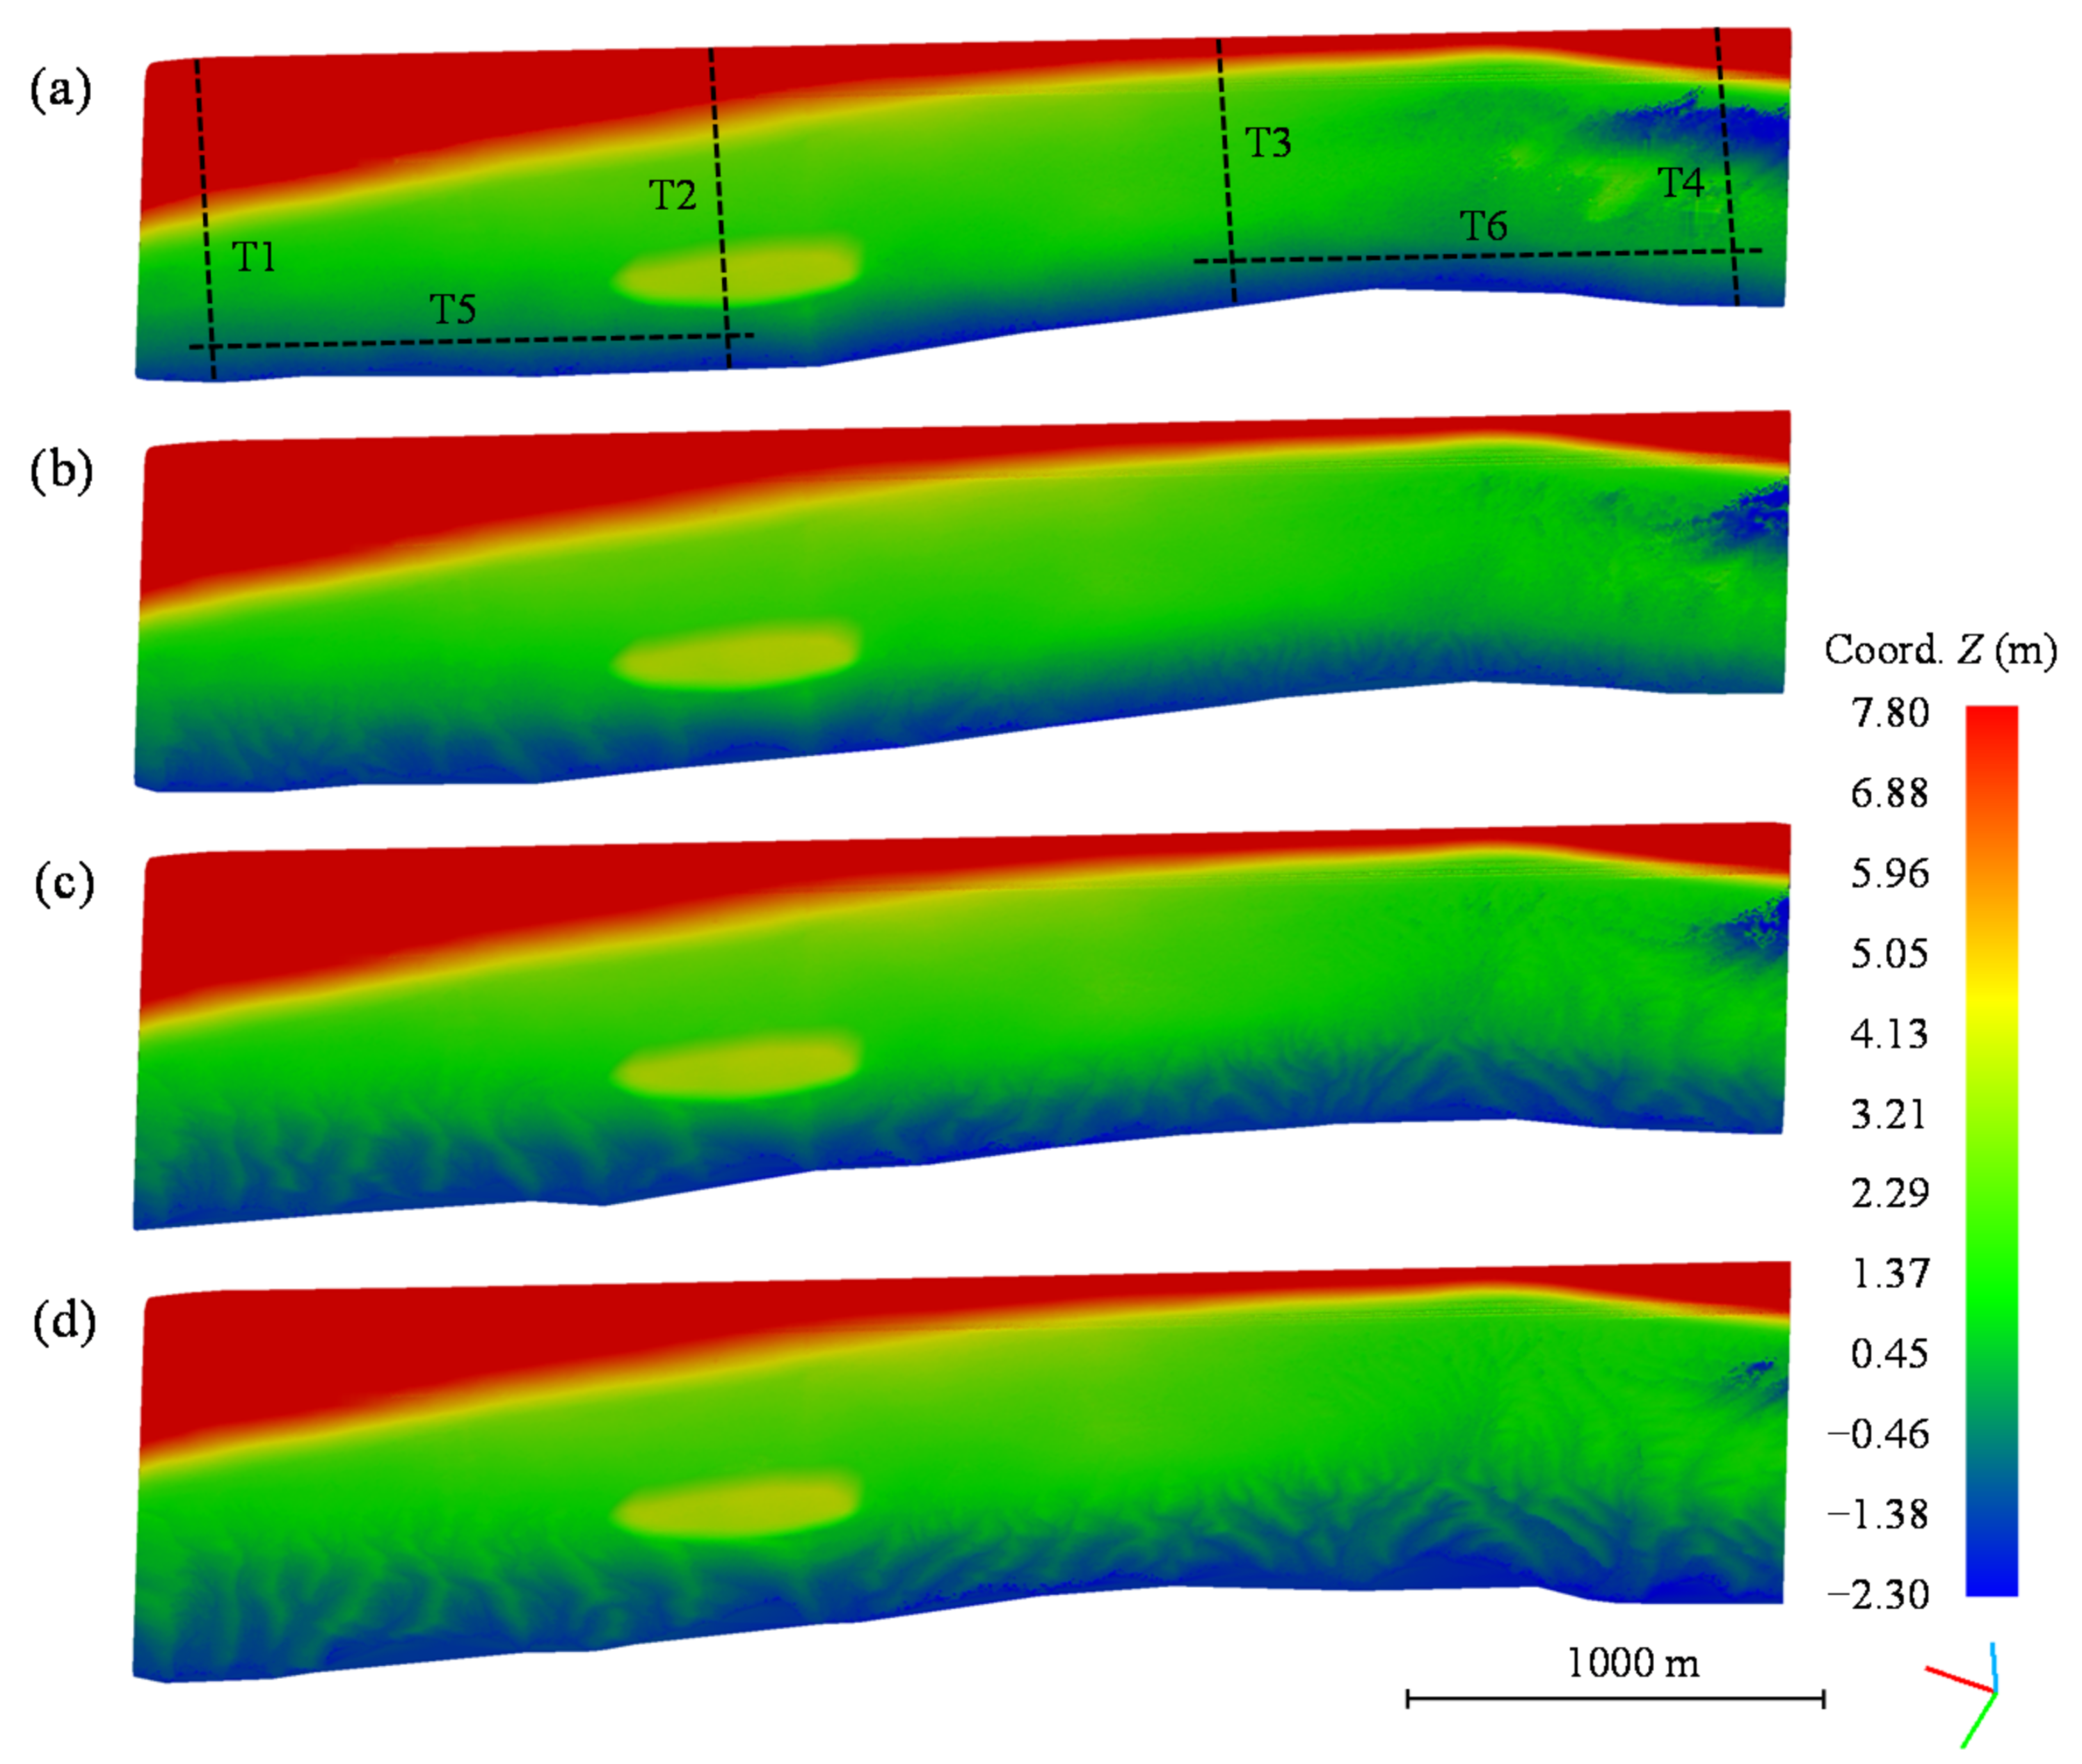
The morphological evolution of intertidal flats over 18 months under verified flow conditions is shown in Figure 8. A small change in the surface of the tidal flat was observed in the first few tidal circles of the experiment. The sediment carried by the rising tide will gradually form a fine gully texture in the intertidal regions, owing to the action of the ebb tide (Figure 8b). The flux concentration enhanced the erosion effect by the current in the final phase of the ebb tide, leading to the development of the tidal flats and the evolution of the tidal channels (Figure 8c). The tidal channel could be extended to the low-tide level; the general flow direction of the tidal channel was perpendicular to the shoreline and was consistent with the direction of the tidal flat surface inclination. The shallow and narrow tidal channels bifurcated continuously and eventually developed into a broad and deep dendritic tidal channel (Figure 8d). These channels progressively elongated through headward erosion to form a tidal channel network.
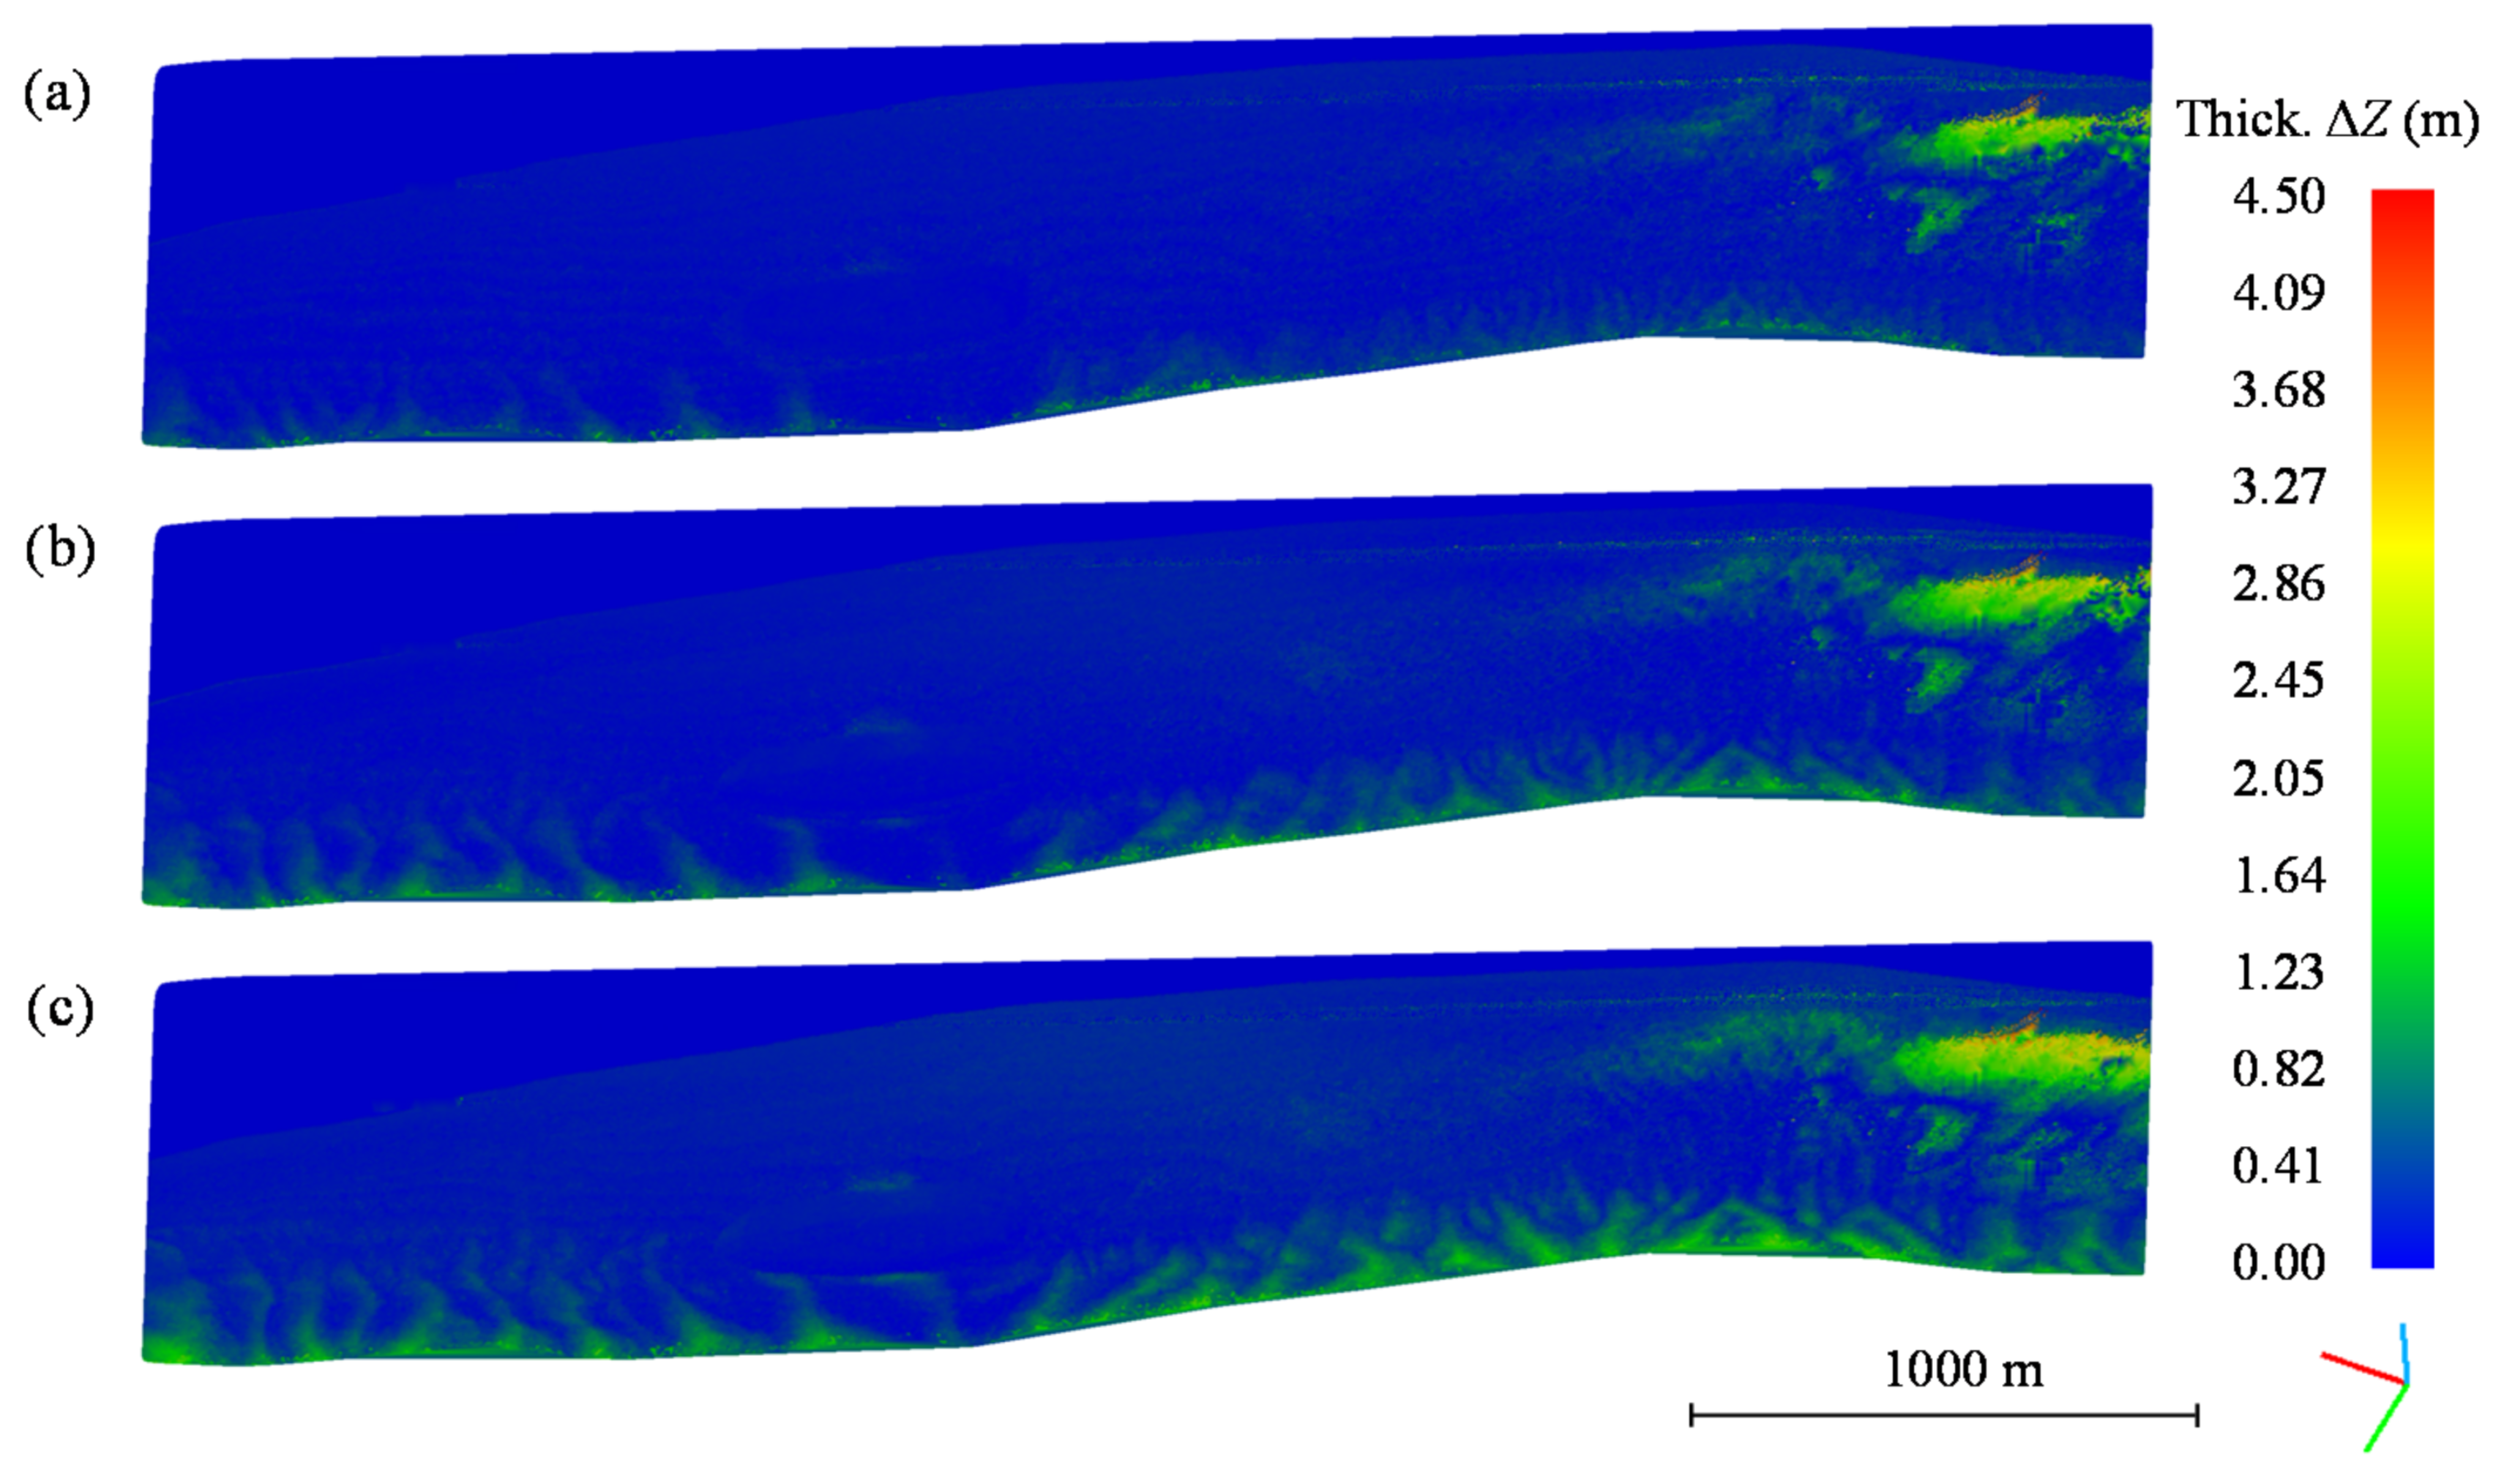
The distributions of sediment deposition thickness on the tidal flat surface at a certain instant were obtained by differentiating the corresponding Z-coordinates on the grid points of the digital elevation model between that instant and the initial time; the results are shown in Figure 9. The extended part of the tidal flat—the area beyond that presented at the initial time point—is not shown in Figure 9. After six months, the average sediment deposition thickness on the tidal flat surface was 0.18 m. As expected, sediment deposition increased with time and was recorded at 0.23 m and 0.32 m after 12 and 18 months, respectively. The sediment deposition was mainly distributed in the low-lying areas near the shore and in the low part of the tidal flat. Consequently, the area ratios considering a deposition thickness of 0.2–0.6 m after 6, 12, and 18 months were 22, 30, and 49%, respectively. Furthermore, the area ratio with a deposition thickness greater than 1.4 m was less than 2%, with a maximum thickness of 4.50 m at 18 months.

3.4. Evolution of the Tidal Channel Network

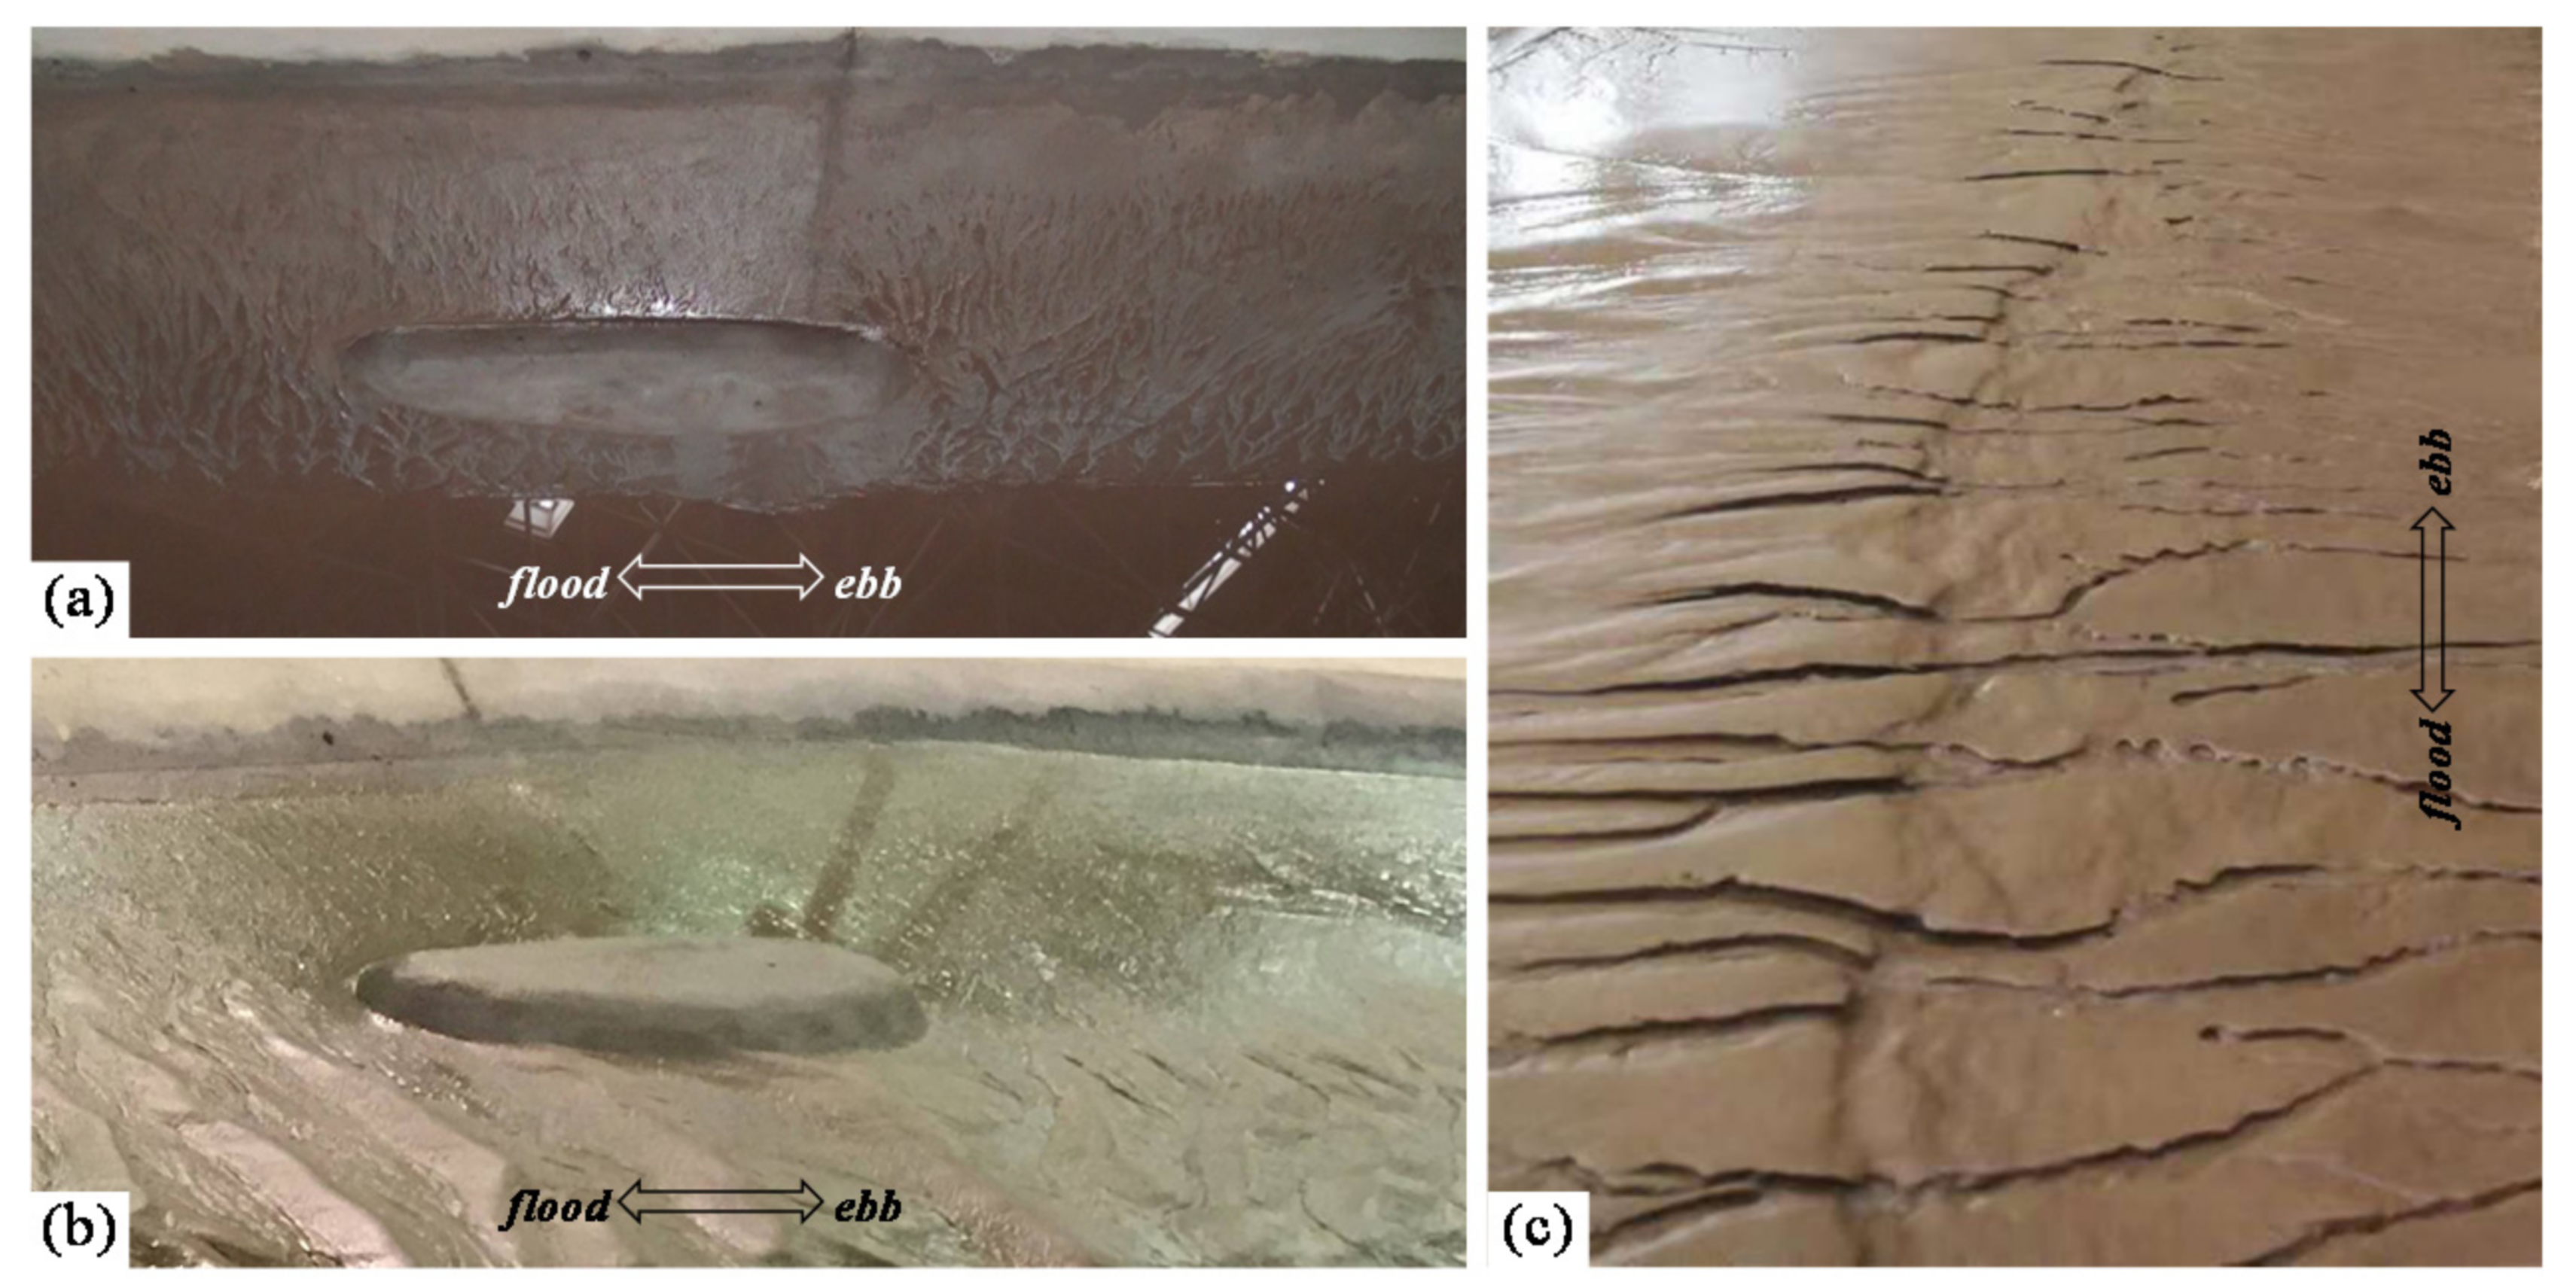
In the final phase of the ebb tide, shortly after the beginning of the experiment, due to the uneven tidal flat surface, the initial thin layer of water on it flowed to the low-lying areas and converged into a linear flow, gradually etching the embryonic form of the tidal channels. As shown in Figure 10a, after 20 tidal cycles, corresponding to the prototype, a large number of tidal rills appeared on the tidal flats’ surface in the exposure stage. With the intensification of the scouring of the returned channel flow at ebb tide, it gradually developed and evolved into a tidal channel, extending to the low tide line, and the flow direction was roughly perpendicular to the shoreline. Due to the abundant sediment sources, rapid siltation, and the widening of the tidal flats, the original tidal channel showed difficulties in completing the functional requirements of draining the retained water of the tidal flats. The tidal channel adapted to the siltation of the tidal flat through its own regulation, including widening and deepening the original tidal channel to improve the drainage efficiency (Figure 10b), developing new tidal channels to increase the drainage density, expanding the confluence area to form dendritic bifurcations, and eventually shaping the tidal channel network (Figure 10c).
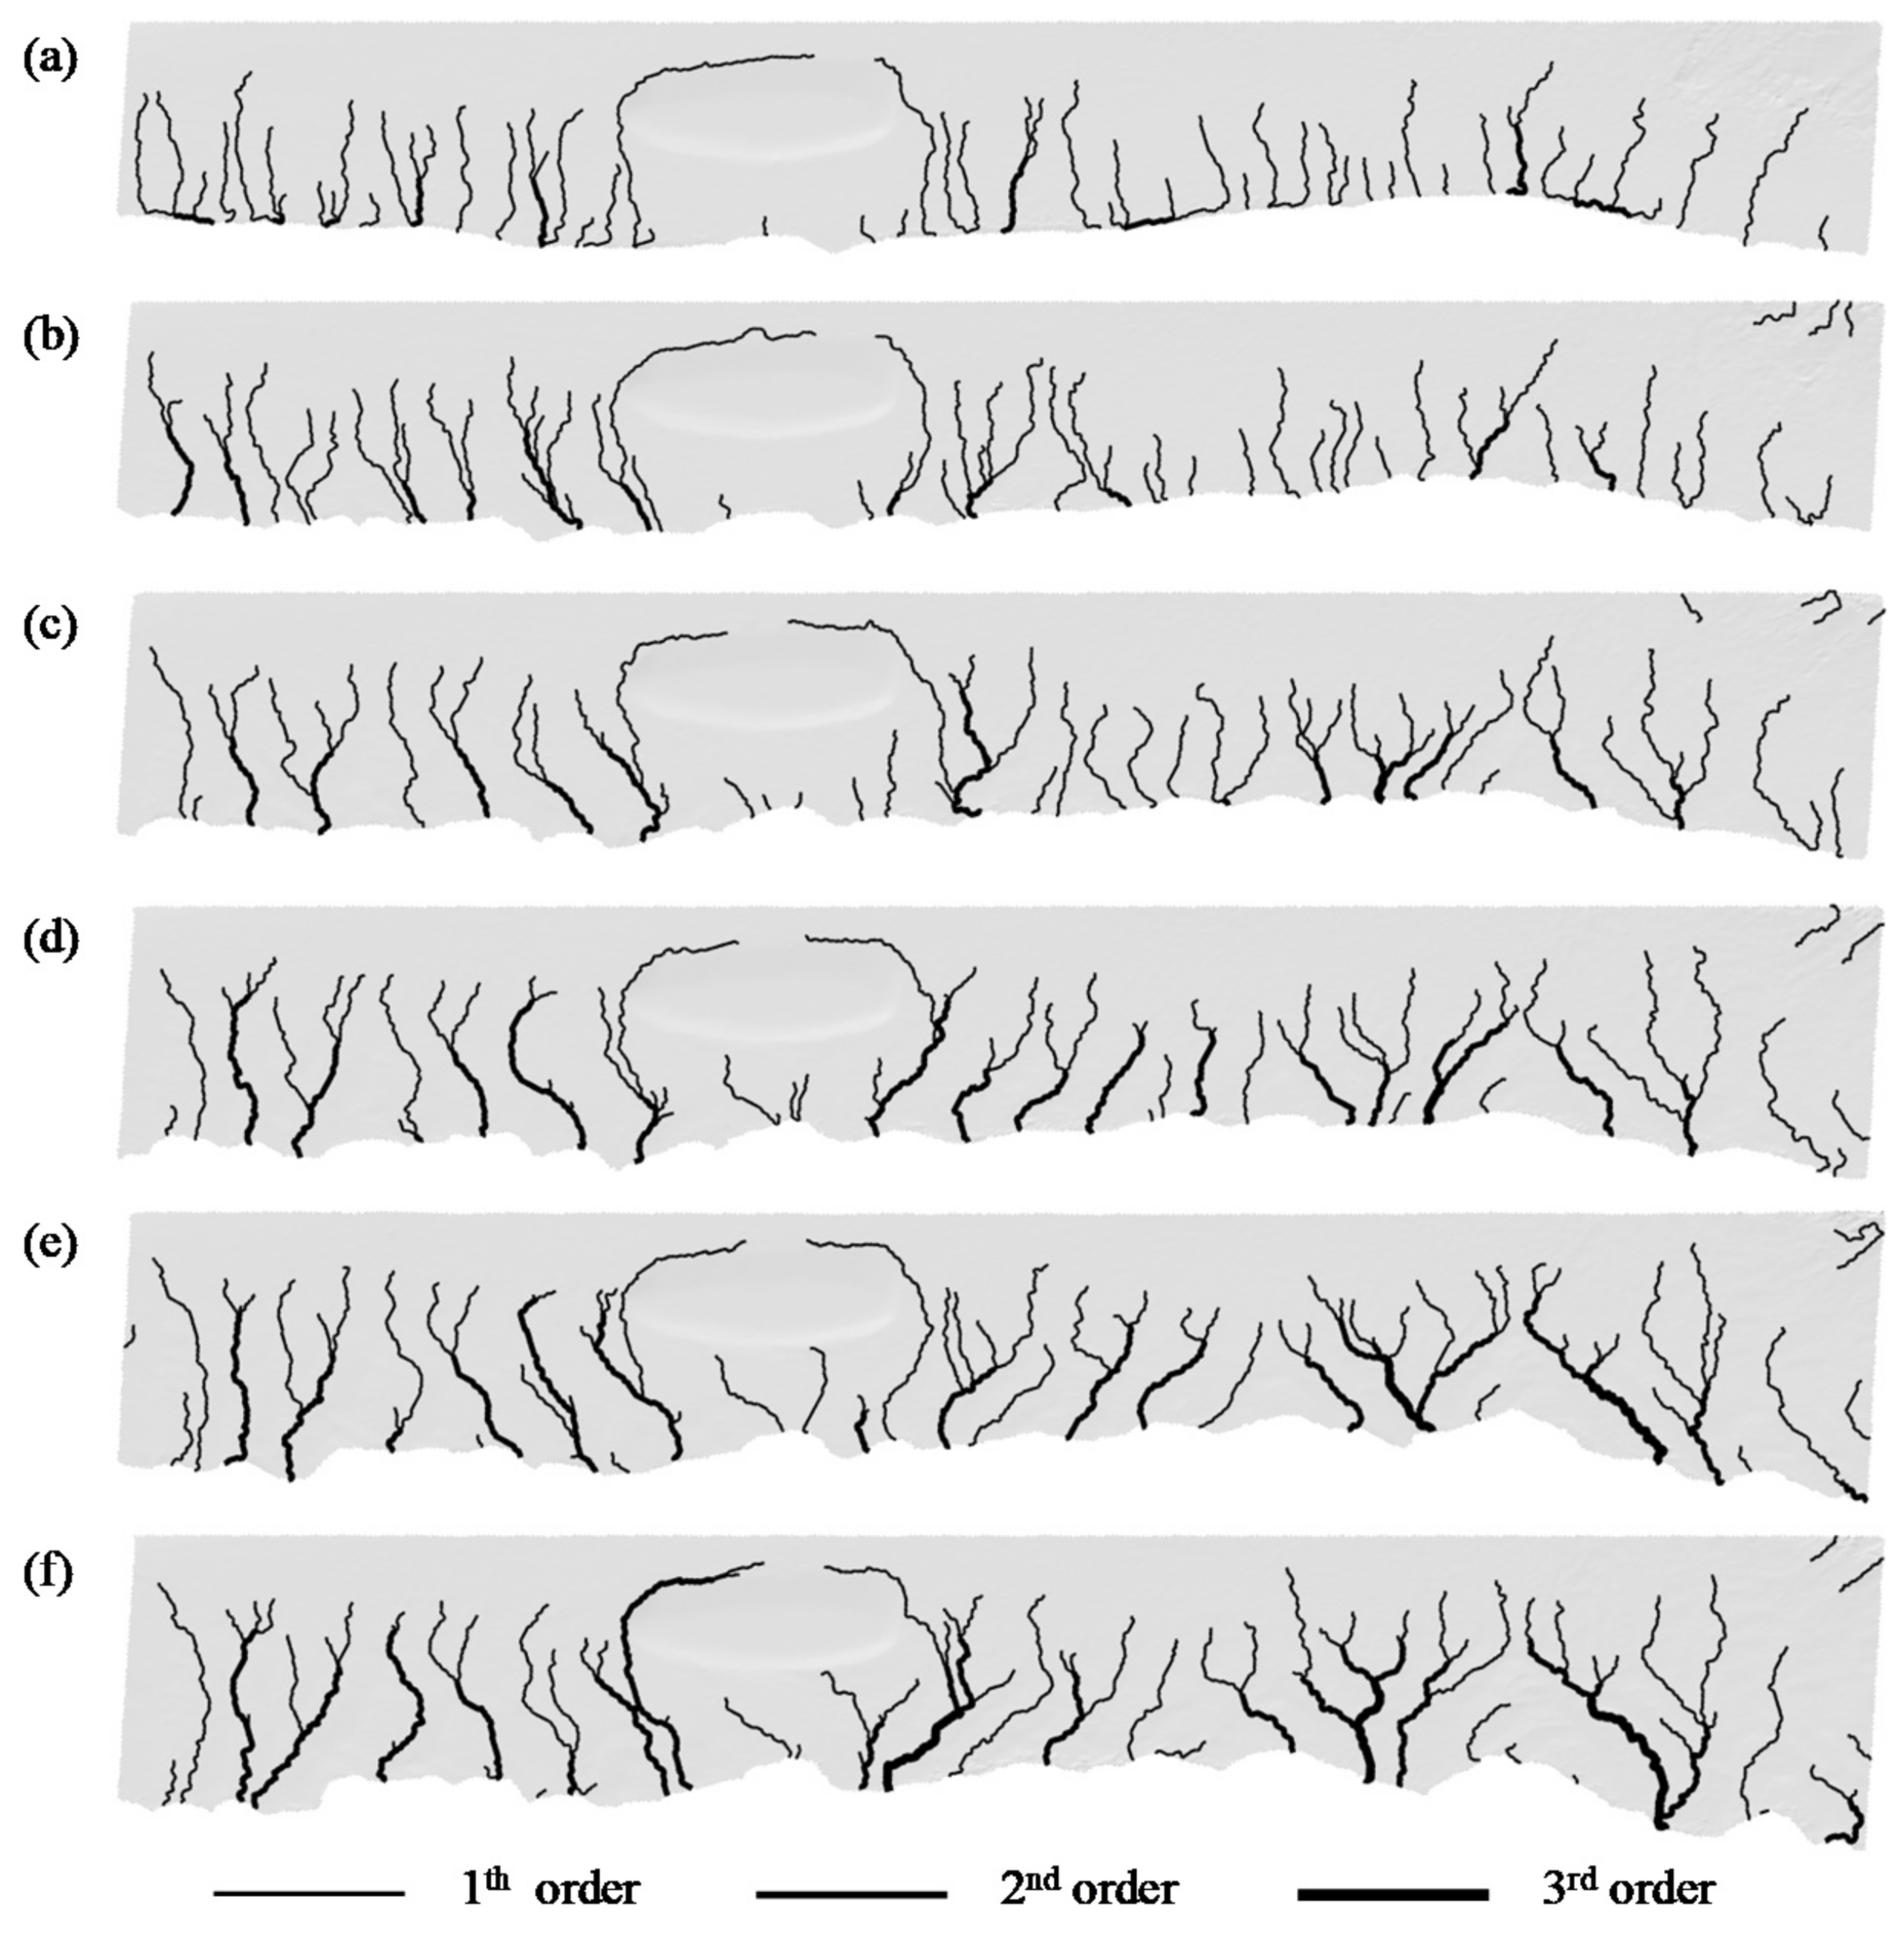
TopoToolbox was used to process the topographic data obtained using the three-dimensional laser scanning system, which provides MATLAB functions to support the analysis of terrain and flow paths in a digital elevation model [31]. TopoToolbox implements the most common multiple flow-direction algorithms, such as Freeman [32] and the Dinf algorithm of Tarboton [33], which make the model more realistic regarding the flow of water and sedimentation across landscapes. The tidal channel network formations after 3, 6, 9, 12, 15, and 18 months are shown in Figure 11.
As shown in Figure 11a, at the initial stages of formation and development, the tidal channels were relatively straight and had few bifurcations. With the tidal flat’s silting up, the tidal channel was downcutting and extending, and there was a channel meandering development process (Figure 11b). The small tide channel continued to coalesce and deepen, and gradually formed a broad and deep main tidal channel that sequentially widened at the lower part of the intertidal zone and presented a trumpet-shaped gully mouth (Figure 11c). The main tidal channel gradually extended and expanded, showing dendritic bifurcation, and developed in multiple directions (Figure 11d). Under the joint action of lateral erosion and headward erosion, the primary and branch channels of the tidal channel gradually elongated (Figure 11e). With the repeated advance and retreat of the tide, there was a lateral swing migration in the tidal channel, and the whole network gradually extended to the subtidal zone. (Figure 11f).

4. Discussion

4.1. Variation of Tidal Flat Elevations

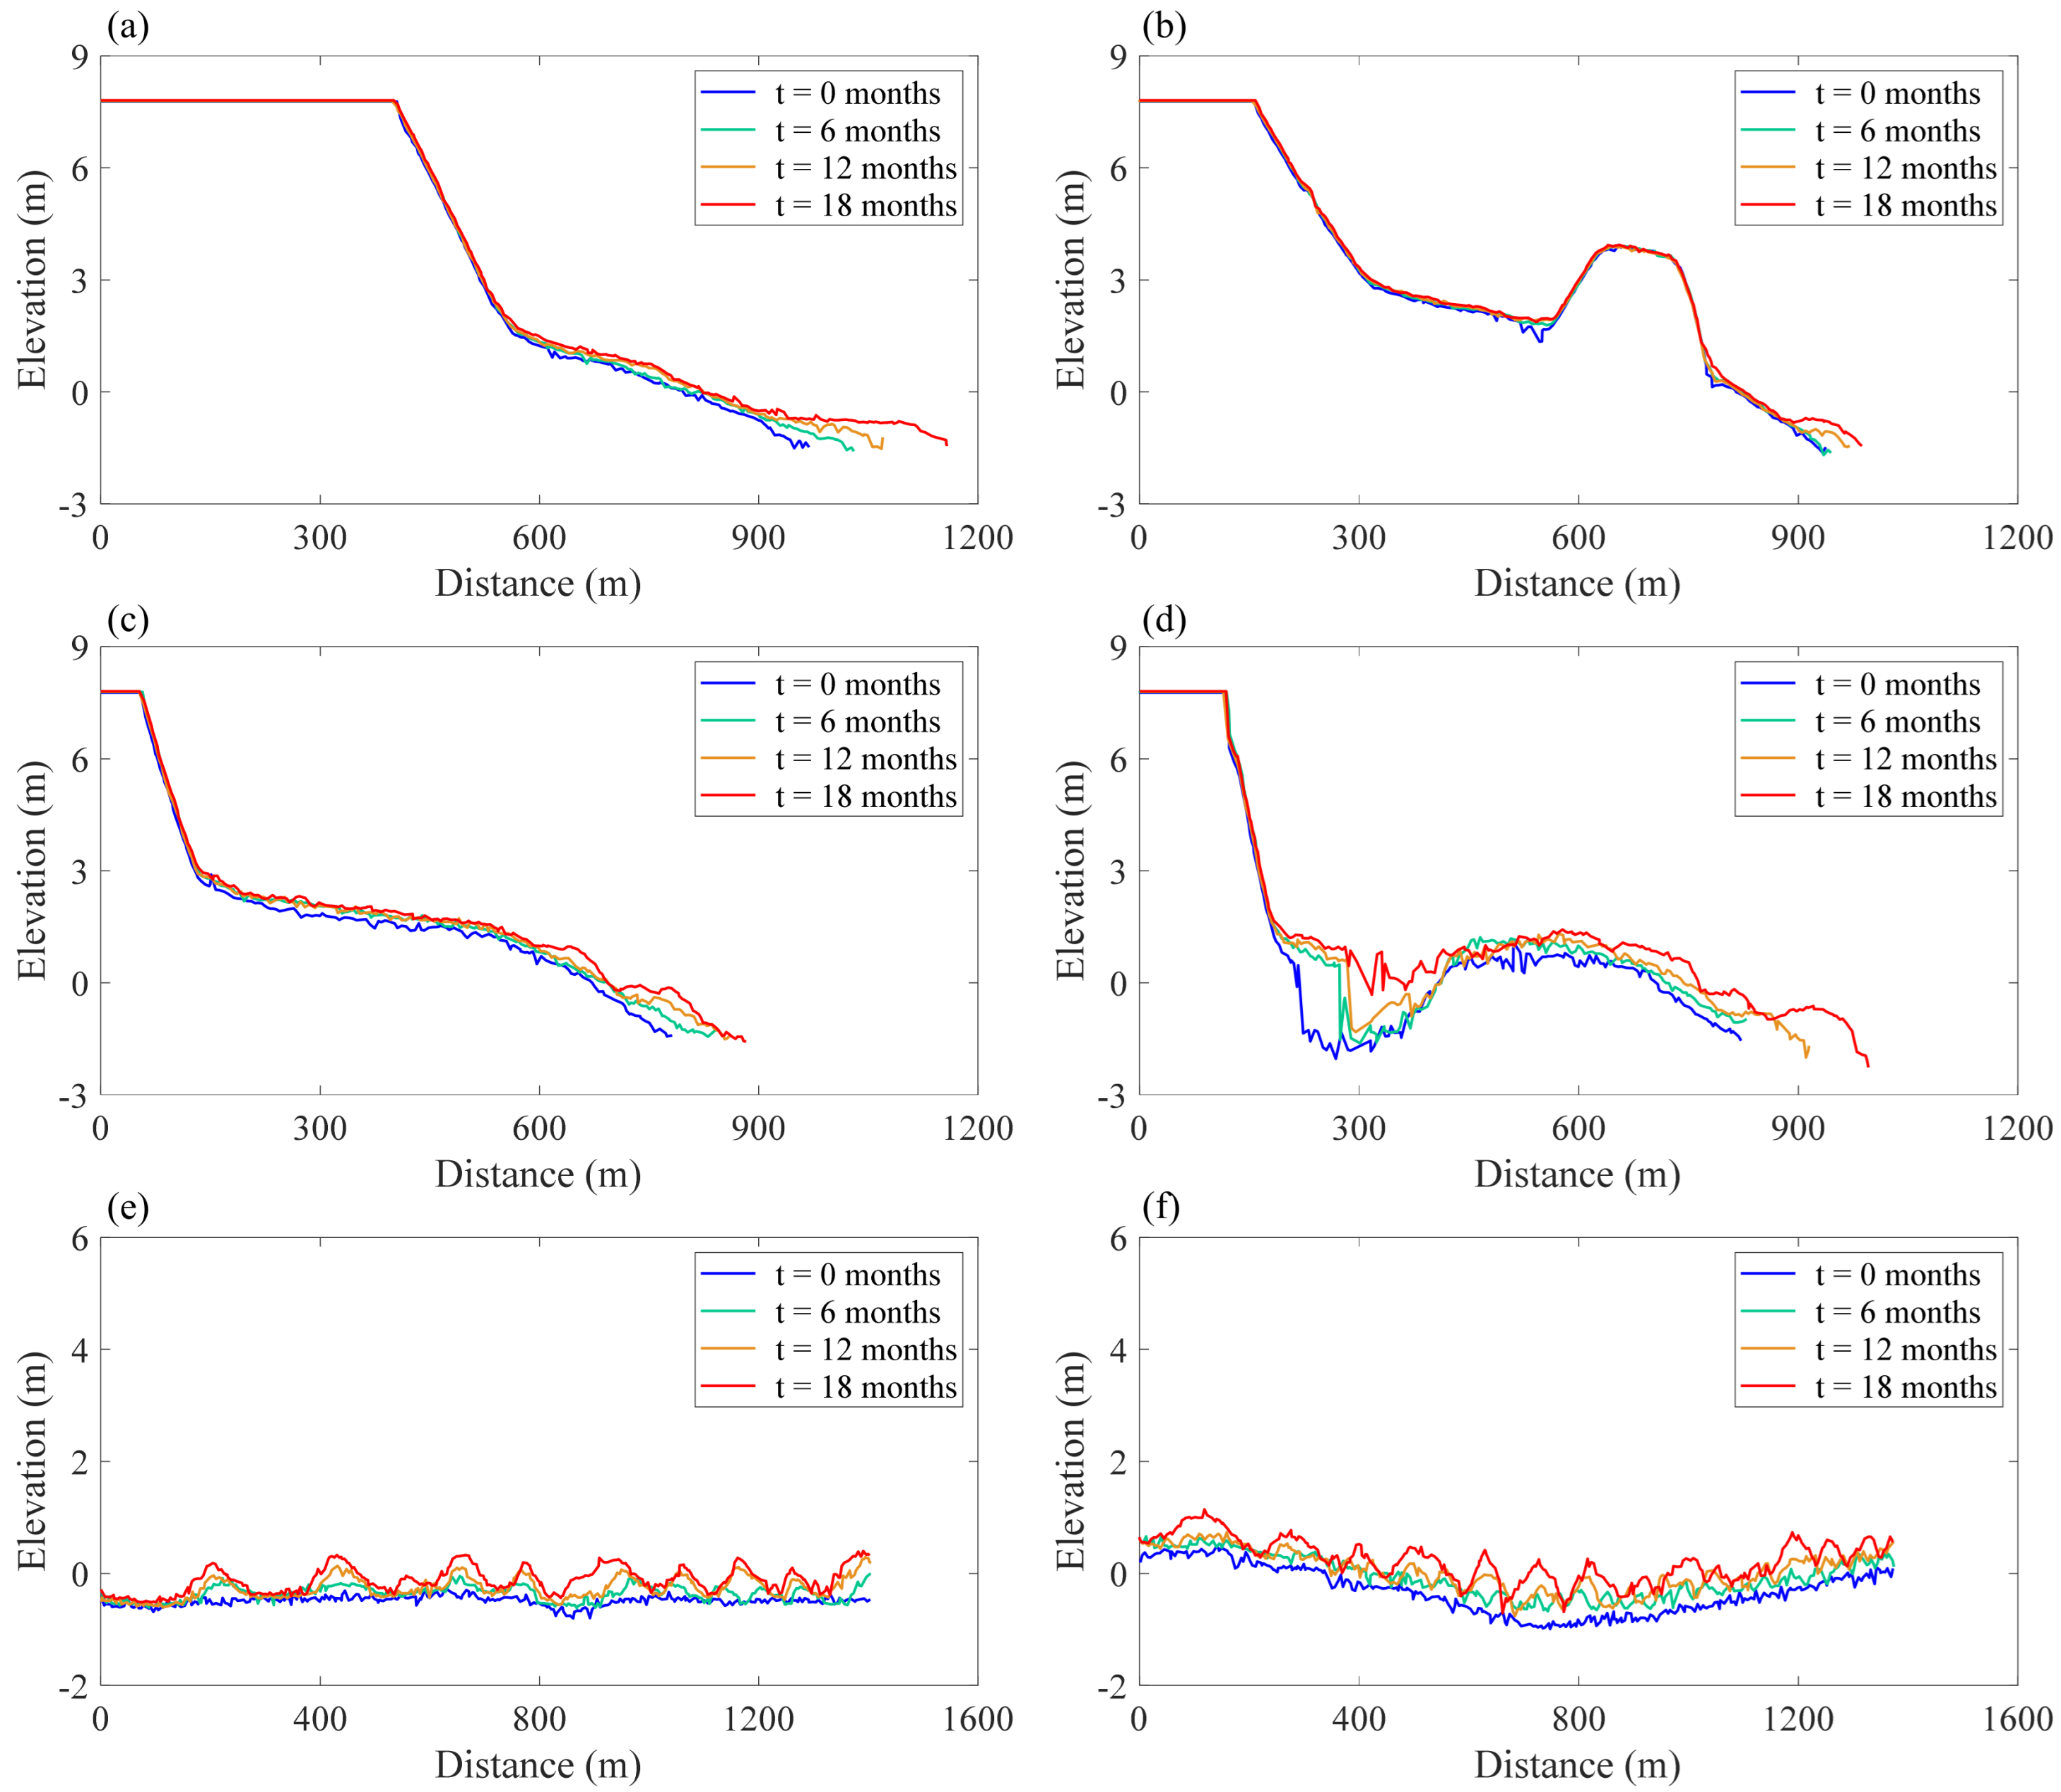
The surface of the adjacent tidal flat gradually silted up after the tributary gates were constructed, and the tidal flat extended toward the mainstream of the estuary over time. The elevations that were extracted in cross-sections (see Figure 8a for locations T1–T6) demonstrated the geomorphic evolution on cross-profile; the results are shown in Figure 12. The elevation progressively increased across the bank, taken from T1, T2, T3, and T4 with waterward extension rates of 10.5, 2.7, 5.6, and 9.7 m/month, respectively. In the low tidal flats, the elevations across transects T5 and T6 fluctuated dramatically, resulting in average sediment deposition rates of 1.9 and 2.7 cm/month, respectively. The sediment deposition rate of the tidal flat on the waterside was the largest, showing 4.6, 3.9, 7.1, and 5.1 cm/month at the T1, T2, T3, and T4 sections, respectively. The development and evolution of the tidal channel network at low tidal flats were reflected by the increase in fluctuations of the bed surfaces at transects T5 and T6 over time. The detailed variations of the tidal flat elevation confirm that tidal channel initiation was an underwater process occurring over the intertidal area [34].

4.2. Change of Drainage Capacity of the Tidal Channel Network

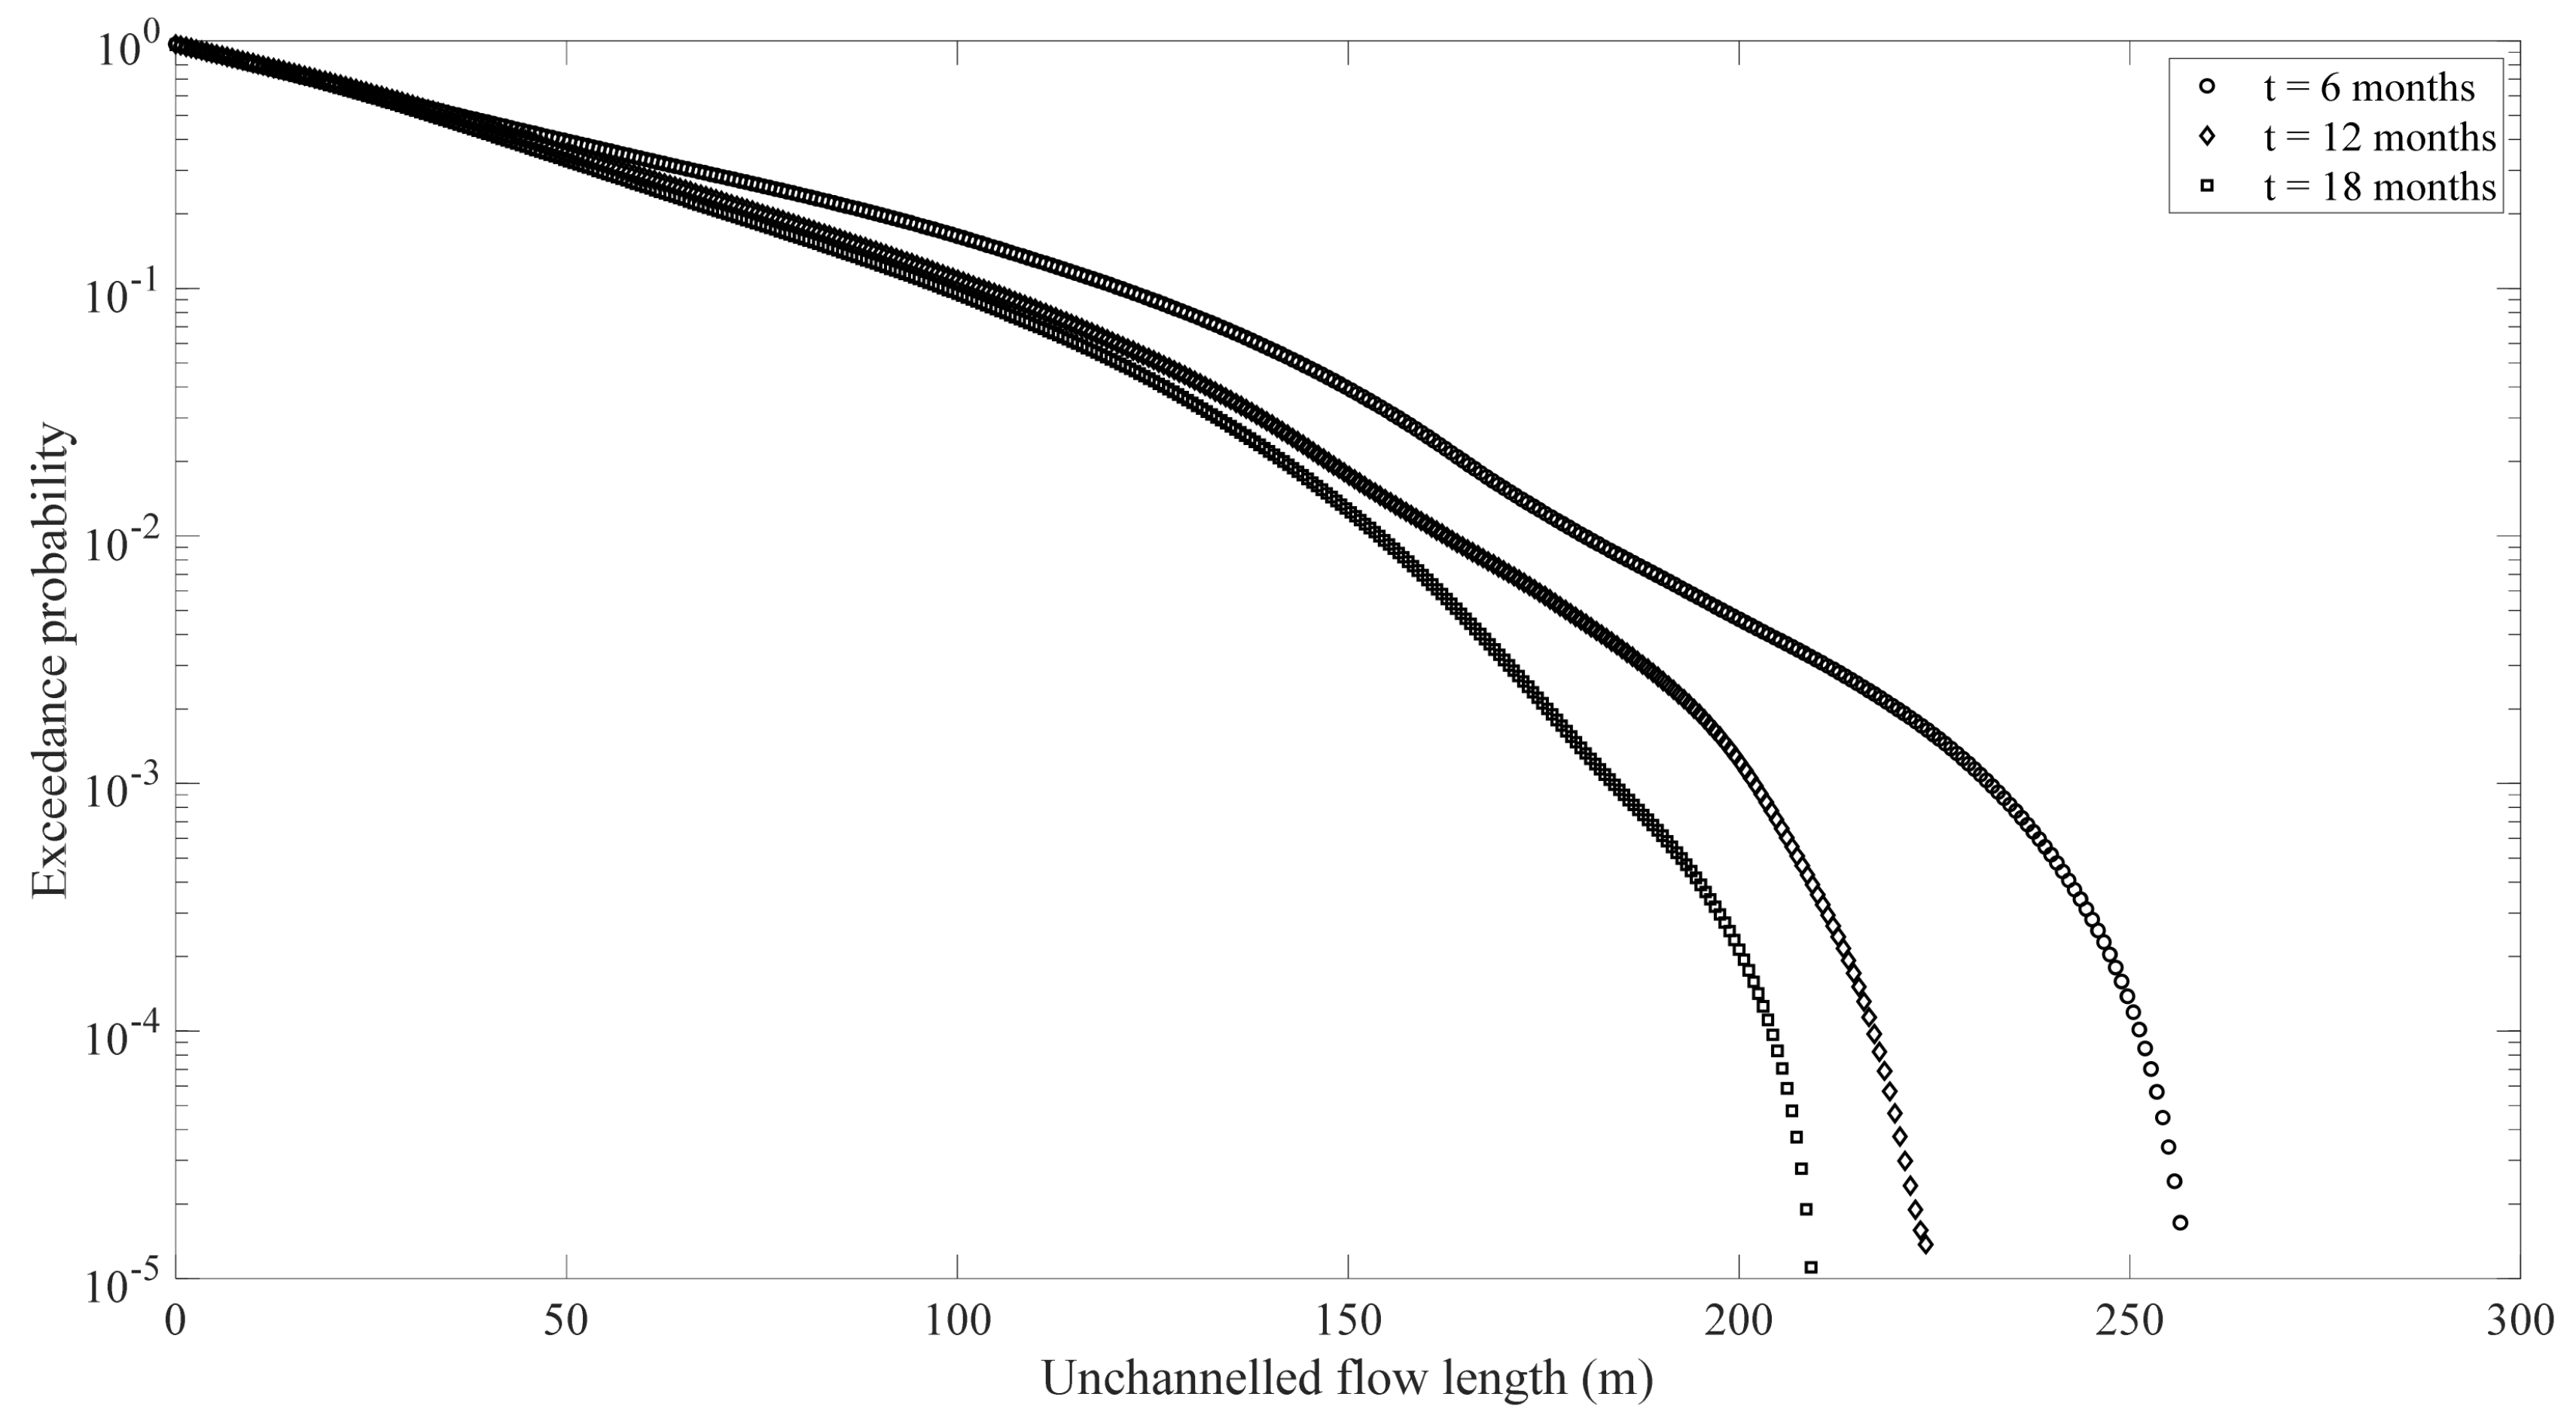
The change in drainage capacity of the tidal channel network during the model period can be objectively quantified by examining the unchanneled flow length (UFL), which is defined as the minimum flow path length to the nearest channel from any point on the flat [35,36]. The mean UFL is the mean value of the UFL at each point on the entire tidal flat. The shorter the mean UFL, the easier the unchanneled flow into the tidal channel, and the greater the drainage capacity of the tidal channel network. Figure 13 charts the exceedance probability distributions of UFLs after 6, 12, and 18 months, which are observed to decay exponentially, with an approximately linear trend in the semi-logarithmic plot, and are generally coincident with previous studies into the observed networks developed in various laboratory experiments [37,38,39]. The slope of the distribution curve aggrandized with time; the probability distributions after 12 and 18 months were approximate; the basic structure of the tidal network had been formed after 12 months, and only some branching adjustments had taken place afterward (also see Figure 11d,f). This observation of slope development moving progressively toward a near-equilibrium state is in agreement with the phenomena presented by Zhou et al. [39]. Therefore, these characteristic features of the natural tidal channel network are successfully reproduced in the experimental model.

4.3. Distribution Changes of the Tidal Channel Network

The tidal channel network was graded according to the Horton–Strahler criterion [40,41]. In this criterion, unbranched fingertip channels are classified as order 1; the second order is formed by the confluence of two or more first-order channels; the third order is formed by the confluence of two or more second-order channels, and the rest may be deduced via an analogy. The order of the tidal channel reflects the evolution of the morphological characteristics of the tidal channel network (Figure 11). The higher the order of the tidal channel, the greater the watershed area and tidal prism. The variations in the number and total length of tidal channels at all orders versus time are shown in Figure 14. During the initiation and subsequent development of the tidal channel network, the number of tidal channels at all orders showed an increasing trend, but the proportion of the first-order channels continued to decline (Figure 14a). The cumulative length of the tidal channels increased gradually, but with ever-growing numbers of high-order tidal channels, the cumulative length of first-order tidal channels underwent a fluctuating decline (Figure 14b).
The mean sinuosity, junction number, and Hausdorff dimension can be used to describe the meandering, bifurcation, and complexity of the tidal channel network, respectively. Sinuosity is commonly defined as the ratio of the channel length to the axis length of the meandering zone [42]. A junction is a place where two or more tidal channels meet [43]. The Hausdorff dimension is the fractal dimension calculated by the box-counting method [44]. The channel network evolution is characterized by relatively fast initiation and slower adjustment toward a near-steady state. This type of evolution can use a logistic growth model to examine the ultimate trends. The basic form is as follows:
y = p 1 + k e m t ,
where p, k, and m are the fitting parameters and p is the saturation value, which tended to approach a state of dynamic equilibrium.
The variations of the tidal channel network’s mean sinuosity, junction number, and Hausdorff dimension are shown in Figure 15. These indexes increased during the development of the channel network over 18 months and were well fitted by the logistic growth model. The logistic growth model in Equation (21) has a term for saturation value that is referred to as the carrying capacity. This carrying capacity is the largest size to which the statistical indexes grow, at which point the statistical indexes will stabilize and the growth rate will terminate. The fitting results show that the development of the tidal channel tends to be stable, with a mean sinuosity of 1.24, a junction number of 63, and a Hausdorff dimension of 1.66.

5. Conclusions

The effects of tributary tidal gates on the morphology of the adjacent intertidal flats in an estuary were investigated through a large-scale physical model with horizontal and vertical scales of 800 and 100, respectively. The tidal flat topography was measured using a high-precision laser scanner. The geometric features of the tidal channel network initiation and its subsequent development were explored with TopoToolbox for the digital elevation model analysis. The results indicated that erosion by currents during the final phase of the ebb tide led to the development of tidal flats and the evolution of a tidal channel. The progressive headward erosion consequently expanded the main channel further. The tidal channel bifurcated in the middle–upper part of the tidal flat and eventually evolved into a curved dendritic pattern. Measurements of the tidal flat elevation revealed that the maximum waterward extension rate and sediment deposition rate at the observed transects were 10.5 m/month and 7.1 cm/month, respectively. The mean UFL, progressing toward a near-equilibrium state during the simulation period, was in agreement with the characteristic features of the tidal channel network in nature. It demonstrated that the logistic growth models could describe variations in mean sinuosity, junction number, and Hausdorff dimensions of the tidal flats.
The results of this study uniquely and substantially contribute to the state of knowledge regarding the morphodynamic responses of tidal flats to anthropogenic activities. This knowledge can be applied directly to evaluate the effect of tributary tidal gates on the adjacent intertidal flats, ultimately reducing the adverse impact of similar projects in estuaries. Further research will consider the initiation and development mechanisms of tidal channels in the physical models and compare the results with field observations.

Author Contributions

Conceptualization, writing—original draft preparation and funding acquisition, Y.L. and D.P.; methodology, software, validation, and formal analysis, Y.L. and D.P.; writing—review and editing, D.P. and C.P. All authors have read and agreed to the published version of the manuscript.

Funding

This research was funded by the National Natural Science Foundation of China, grant numbers 41876095, 41906183, and 42176214; the Zhejiang Provincial Natural Science Foundation of China, grant numbers LZJWZ22E090002 and LZJWY22E090006; the Key Program of the President of the Zhejiang Institute of Hydraulics and Estuaries, grant number ZIHE21Z001.

Institutional Review Board Statement

Not applicable.

Informed Consent Statement

Not applicable.

Data Availability Statement

Not applicable.

Conflicts of Interest

The authors declare no conflict of interest.

References

  1. Giannico, G.R.; Souder, J.A. The Effects of Tide Gates on Estuarine Habitats and Migratory Fish; ORESU-G-04-002, Sea Grant Oregon; Oregon State University: Corvallis, OR, USA, 2004. [Google Scholar]
  2. Walsh, S.; Miskewitz, R. Impact of sea level rise on tide gate function. J. Environ. Sci. Health 2013, 48, 453–463. [Google Scholar] [CrossRef] [PubMed]
  3. Souder, J.A.; Tomaro, L.M.; Giannico, G.R.; Behan, J.R. Ecological Effects of Tide Gate Upgrade or Removal: A Literature Review and Knowledge Synthesis; Report to Oregon Watershed Enhancement Board; Institute for Natural Resources, Oregon State University: Corvallis, OR, USA, 2018. [Google Scholar]
  4. Pearlstine, L.G.; Kitchens, W.M.; Latham, P.J.; Bartleson, R.D. Tide gate influences on a tidal marsh. Water Resour. Bull. 1993, 29, 1009–1019. [Google Scholar] [CrossRef]
  5. Giannico, G.A.; Souder, J.A. Tide Gates in the Pacific Northwest: Operation, Types and Environmental Effects; ORESU-T-05-001, Sea Grant Oregon; Oregon State University: Corvallis, OR, USA, 2005. [Google Scholar]
  6. Gordon, J.; Arbeider, M.; Scott, D.; Wilson, S.M.; Moore, J.W. When the tides don’t turn: Floodgates and hypoxic zones in the Lower Fraser River, British Columbia, Canada. Estuaries Coast. 2015, 38, 2337–2344. [Google Scholar] [CrossRef]
  7. Zhao, J.; Yuan, Y.; Luo, X. Impact of tide gate operation on sediment and water quality of Yongding New River. In Estuaries and Coastal Zones in Times of Global Change; Nguyen, K., Guillou, S., Gourbesville, P., Thiébot, J., Eds.; Springer: Singapore, 2020. [Google Scholar]
  8. Kroon, F.J.; Ansell, D.H. A comparison of species assemblages between drainage systems with and without floodgates: Implications for coastal floodplain management. Can. J. Fish. Aquat. Sci. 2006, 63, 2400–2417. [Google Scholar] [CrossRef]
  9. Wright, G.V.; Wright, R.M.; Bendall, B.; Kemp, P.S. Impact of tide gates on the upstream movement of adult brown trout, Salmo trutta. Ecol. Eng. 2016, 91, 495–505. [Google Scholar] [CrossRef]
  10. Seifert, R.E.; Moore, J.W. Floodgate operations and fish communities in tidal creeks of the Lower Fraser River (British Columbia, Canada). Estuaries Coast. 2018, 41, 1206–1221. [Google Scholar] [CrossRef] [Green Version]
  11. Boys, C.A.; Pease, B. Opening the floodgates to the recovery of nektonic assemblages in a temperate coastal wetland. Mar. Freshw. Res. 2017, 68, 1023–1035. [Google Scholar] [CrossRef] [Green Version]
  12. Beatty, S.J.; Tweedley, J.R.; Cottingham, A.; Ryan, T.; Williams, J.; Lynch, K.; Morgan, D.L. Entrapment of an estuarine fish associated with a coastal surge barrier can increase the risk of mass mortalities. Ecol. Eng. 2018, 122, 229–240. [Google Scholar] [CrossRef]
  13. Ji, U.; Julien, P.Y.; Park, S.K. Sediment flushing at the Nakdong River estuary barrage. J. Hydraul. Eng. 2011, 137, 1522–1535. [Google Scholar] [CrossRef]
  14. Nguyen, V.T.; Vu, M.T.; Zhang, C. Numerical investigation of hydrodynamics and cohesive sediment transport in Cua Lo and Cua Hoi estuaries, Vietnam. J. Mar. Sci. Eng. 2021, 9, 1258. [Google Scholar] [CrossRef]
  15. Kuang, C.; Cong, X.; Dong, Z.; Zou, Q.; Zhan, H.; Zhao, W. Impact of anthropogenic activities and sea level rise on a lagoon system: Model and field observations. J. Mar. Sci. Eng. 2021, 9, 1393. [Google Scholar] [CrossRef]
  16. Schmidt, T.; Brudy-Zippelius, T.; Kopmann, R.; Imiela, M. Investigations to reduce sedimentation upstream of a barrage on the river Rhine. WIT Trans. Ecol. Environ. 2005, 80, 145–154. [Google Scholar]
  17. Van Proosdij, D.; Milligan, T.; Bugden, G.; Butler, K. A tale of two macro tidal estuaries: Differential morpho-dynamic response of the intertidal zone to causeway construction. J. Coast. Res. SI 2009, 56, 772–776. [Google Scholar]
  18. Figueroa, S.M.; Lee, G.-H.; Shin, H.-J. Effects of an estuarine dam on sediment flux mechanisms in a shallow, macrotidal estuary. Estuar. Coast. Shelf Sci. 2020, 238, 106718. [Google Scholar] [CrossRef]
  19. Kim, T.I.; Choi, B.H.; Lee, S.W. Hydrodynamics and sedimentation induced by large-scale coastal developments in the Keum River Estuary, Korea. Estuar. Coast. Shelf Sci. 2006, 68, 515–528. [Google Scholar] [CrossRef]
  20. Traini, C.; Proust, J.-N.; Menier, D.; Mathew, M.J. Distinguishing natural evolution and human impact on estuarine morpho-sedimentary development: A case study from the Vilaine Estuary, France. Estuar. Coast. Shelf Sci. 2015, 16, 143–155. [Google Scholar] [CrossRef] [Green Version]
  21. Zhu, Q.; Wang, Y.P.; Gao, S.; Zhang, J.; Li, M.; Yang, Y.; Gao, J. Modeling morphological change in anthropo-genically controlled estuaries. Anthropocene 2017, 17, 70–83. [Google Scholar] [CrossRef]
  22. Gao, S. Geomorphology and sedimentology of tidal flats. In Coastal Wetlands: An Integrated Ecosystem Approach; Perillo, G.M.E., Wolanski, E., Cahoon, D.R., Hop-kinson, C.S., Eds.; Elsevier: Amsterdam, The Netherlands, 2019. [Google Scholar]
  23. Dronkers, J. Tidal asymmetry and estuarine morphology. Neth. J. Sea Res. 1986, 20, 117–131. [Google Scholar] [CrossRef]
  24. Krafft, D.R.; Styles, R.; Brown, M.E. Feedback between basin morphology and sediment transport at tidal inlets: Implications for channel shoaling. J. Mar. Sci. Eng. 2022, 10, 442. [Google Scholar] [CrossRef]
  25. Pan, C.-H.; Lu, X.-X.; Han, H.-Q.; Wang, M.; Zeng, J.; Yu, Q.-W.; Chen, F.-Y. Siltation features in area downstream of the tributary barrage in tidal estuary. Ocean Eng. 2006, 24, 38–44. [Google Scholar]
  26. Limerinos, J.T. Determination of the Manning Coefficient from Measured Bed Roughness in Natural Channels; USG Survey Water-Supply Paper, 1898-B; United States Government Printing Office: Washington, DC, USA, 1970. [Google Scholar]
  27. Kamphuis, J.W. Physical modeling of coastal processes. In Advance in Coastal and Ocean Engineering; Liu, P.L., Ed.; World Scientific: Singapore, 1996. [Google Scholar]
  28. Dou, G.; Dong, F.; Dou, X. The sediment transport capacity of tidal currents and waves. Chin. Sci. Bull. 1995, 40, 1096–1101. [Google Scholar]
  29. Oliveira, I.B.M. Tidal models. In Recent Advances in Hydraulic Physical Modelling; Martins, R., Ed.; Kluwer Academic Publishers: Dordrecht, The Netherlands, 1989; pp. 257–302. [Google Scholar]
  30. Xiong, S.; Tao, G.; Lu, X.; Hu, X.; Chen, W. Hydraulic model of siltation of northern channel in Hangzhou bay. J. Hydraul. Eng. 1999, 125, 416–421. [Google Scholar] [CrossRef]
  31. Schwanghart, W.; Scherler, D. TopoToolbox 2–MATLAB-based software for topographic analysis and modeling in Earth surface sciences. Earth Surf. Dyn. 2014, 2, 1–7. [Google Scholar] [CrossRef] [Green Version]
  32. Freeman, T.G. Calculating catchment area with divergent flow based on a regular grid. Comput. Geosci. 1991, 17, 413–422. [Google Scholar] [CrossRef]
  33. Tarboton, D.G. A new method for the determination of flow directions and upslope areas in grid digital elevation models. Water Resour. Res. 1997, 33, 309–319. [Google Scholar] [CrossRef] [Green Version]
  34. Perillo, G.M.E. Geomorphology of tidal courses and depressions. In Coastal Wetlands: An Integrated Ecosystem Approach; Perillo, G.M.E., Wolanski, E., Cahoon, D.R., Hopkinson, C.S., Eds.; Elsevier: Amsterdam, The Netherlands, 2019. [Google Scholar]
  35. Marani, M.; Belluco, E.; D’Alpaos, A.; Defina, A.; Lanzoni, S.; Rinaldo, A. On the drainage density of tidal net-works. Water Resour. Res. 2003, 39, 1040. [Google Scholar] [CrossRef]
  36. Stefanon, L.; Carniello, L.; D’Alpaos, A.; Rinaldo, A. Signatures of sea level changes on tidal geomorphology: Experiments on network incision and retreat. Geophys. Res. Lett. 2012, 39, 85–91. [Google Scholar] [CrossRef] [Green Version]
  37. Stefanon, L.; Carniello, L.; D’Alpaos, A.; Lanzoni, S. Experimental analysis of tidal network growth and development. Cont. Shelf Res. 2010, 30, 950–962. [Google Scholar] [CrossRef] [Green Version]
  38. Vlaswinkel, B.M.; Cantelli, A. Geometric characteristics and evolution of a tidal channel network in experimental setting. Earth Surf. Process Landf. 2010, 36, 739–752. [Google Scholar] [CrossRef]
  39. Zhou, Z.; Stefanon, L.; Olabarrieta, M.; D’Alpaos, A.; Carniello, L.; Coco, G. Analysis of the drainage density of experimental and modelled tidal networks. Earth Surf. Dyn. 2014, 2, 105–116. [Google Scholar] [CrossRef] [Green Version]
  40. Horton, R.E. Erosional development of streams and their drainage basins: Hydrophysical approach to quantitative morphology. Geol. Soc. Am. Bull. 1945, 56, 275–370. [Google Scholar] [CrossRef] [Green Version]
  41. Strahler, A.N. Hypsometric (area-altitude) analysis of erosional topography. Geol. Soc. Am. Bull. 1952, 63, 1117–1142. [Google Scholar] [CrossRef]
  42. Hughes, Z.J. Tidal Channels on Tidal Flats and Marshes. In Principles of Tidal Sedimentology; Davis, R.A., Dalrymple, R.W., Eds.; Springer: Dordrecht, The Netherlands, 2012. [Google Scholar]
  43. Kennedy, B.A. On Playfair’s law of accordant junctions. Earth Surf. Process Landf. 1984, 9, 153–173. [Google Scholar] [CrossRef]
  44. Falconer, K.J. Fractal Geometry: Mathematical Foundations and Applications; John Wiley & Sons: Hoboken, NJ, USA, 2003. [Google Scholar]
Figure 1. Study area: (a) Zhejiang Province in China, (b) the Ou River (OR) estuary, and (c) the Nanxi River tidal gate (NRTG) on the mouth of the Nanxi River (NR). A dashed box in Figure 1c marks the observed intertidal flat in the model test.
Jmse 10 00882 g001
Figure 2. Model layouts: (a) a sketch map of the experimental model, (b) the scheme of the tidal maker and data acquisition system, and (c) the model site. RE: Roughness element.
Jmse 10 00882 g002aJmse 10 00882 g002b
Figure 3. Model calibration: tidal level (a) W1 and (b) W2; flow velocity and direction (c) C1, (d) C2, and (e) C3. The locations of the calibration points are shown in Figure 2a.
Jmse 10 00882 g003
Figure 4. Model verification: (a) flow velocity and direction, and (b) SSC. The verification points were selected at the proposed tidal-gate position (NRTG in Figure 2a).
Jmse 10 00882 g004
Figure 5. Verification of sediment deposition thickness.
Jmse 10 00882 g005
Figure 6. Model characterization of the flow stream lines via photographic sequence: peak floods (a) without and (b) with NRTG, and peak ebb (c) without and (d) with NRTG. The red line encloses the intertidal zone with plants. Blue stars mark the positions of observation points (P1, P2, and P3).
Jmse 10 00882 g006
Figure 7. Comparison of the tidal levels at (a) P1, (b) P2, and (c) P3, and the flow velocities and directions at (d) P1, (e) P2, and (f) P3 before and after the construction of the NRTG, during the spring tide. The shading represents the exposure period of the intertidal flats.
Jmse 10 00882 g007
Figure 8. Morphology of the intertidal flats at the time points of (a) 0, (b) 6, (c) 12, and (d) 18 months. The positions of the cross-profile transects (T1, T2, T3, T4, T5, and T6), as mentioned later, are marked by dashed lines in Figure 8a. Time = 0 months corresponds to the start of the experiment. The dashed box in Figure 1c marks the observed intertidal flat in the model test.
Jmse 10 00882 g008
Figure 9. Distributions of deposition thickness after (a) 6, (b) 12, and (c) 18 months.
Jmse 10 00882 g009
Figure 10. The typical morphological patterns used in the experiment. (a) A tidal rill structure after 20 tidal cycles, (b) the channel network structure at the end of the experiment, and (c) the local morphology of the tidal channel network.
Jmse 10 00882 g010
Figure 11. Tidal channel network formations after (a) 3, (b) 6, (c) 9, (d) 12, (e) 15, and (f) 18 months.
Jmse 10 00882 g011
Figure 12. Elevation changes across (a) T1, (b) T2, (c) T3, (d) T4, (e) T5, and (f) T6. Positions of the cross-profile transects T1, T2, T3, T4, T5, and T6 are marked by dashed lines in Figure 4a.
Jmse 10 00882 g012
Figure 13. Exceedance probability distributions of the unchanneled flow lengths after 6, 12, and 18 months.
Jmse 10 00882 g013
Figure 14. Variations of the tidal channel (a) number and (b) length, for all orders.
Jmse 10 00882 g014
Figure 15. Variation of the tidal channel (a) mean sinuosity, (b) junction number, and (c) Hausdorff dimension.
Jmse 10 00882 g015
Table 1. Calculated and selected scale values of the experimental model.
ScalesEquationsCalculated ValuesSelected Values
Horizontal lengthλL800800
Vertical heightλH100100
Flow velocityλu = λv = λH1/21010
Flow dischargeλQ = λL × λH3/2800,000800,000
Current time λ t 1 = λL × λu−18080
Roughness coefficientλn = λH2/3 × λL−1/20.760.75
Settling velocityλω = λH3/2 × λL−11.251.35
Incipient velocityλV = λu1010
SSCλS = λρs/λ(ρsρ)0.220.38
Morphological time λ t 2 = λ t 1 × K t 2 × λρ/λS655547.5
Table 2. Verification statistics of the riverbed siltation volume.
Segment 1Field (Million m3)Verification (Million m3)Relative Difference (%) 2
L1–L31.4691.70215.9
L3–L52.4682.176−11.8
L5–L72.8763.43019.3
L7–L81.1251.024−9.0
Total7.9388.3325.0
1 The segment locations were marked by dashed lines in Figure 2a. 2 Relative difference = (value Verification − value Field)/value Field.
Publisher’s Note: MDPI stays neutral with regard to jurisdictional claims in published maps and institutional affiliations.