Article

Relationship of the Warming of Red Sea Surface Water over 140 Years with External Heat Elements

1
Key Laboratory of Marine Science and Numerical Modeling, First Institute of Oceanography, Ministry of Natural Resources, Qingdao 266061, China
2
Laboratory for Regional Oceanography and Numerical Modeling, Pilot National Laboratory for Marine Science and Technology (Qingdao), Qingdao 266237, China
3
School of Marine Sciences, Sun Yat-sen University, Zhuhai 519082, China
*
Author to whom correspondence should be addressed.
J. Mar. Sci. Eng. 2022, 10(7), 846; https://doi.org/10.3390/jmse10070846
Submission received: 20 April 2022 / Revised: 11 June 2022 / Accepted: 14 June 2022 / Published: 22 June 2022
(This article belongs to the Special Issue Frontiers in Physical Oceanography)

Abstract

:
Using historic data, variations in the sea surface temperature (SST), sea surface air temperature, and air–sea heat flux of the Red Sea and its adjacent seas over 140 years (1876–2019) as well as correlations of these variations were statistically analyzed. The results show that the SST of the Red Sea increased at a mean rate of 0.043 °C/decade in these years with an accelerated rate in recent decades, and the SST anomalies of the sea had significant positive correlations and high synchronisms with those of adjacent seas as well as air temperature anomalies. In this period, the Red Sea lost more heat to the air via evaporation due to water warming and gained more heat from the Gulf of Aden. The analysis revealed that the temperature rise in the Red Sea surface water was directly caused by the horizontal heat input from the upper warming water of the Gulf of Aden under the circumstance of global ocean warming, rather than by the rise in local air temperature. However, in recent decades, the accelerated rise in air temperature over the sea has decreased the sensible heat flux, which might contribute to the Red Sea warming.

1. Introduction

Global warming and its impacts on marine environments and ecology are a current hot research topic. The surface air temperature of the earth has increased ~0.6 °C on average in the past 100 years [1], resulting in a rise in the worldwide ocean temperature, and the sea surface temperature (SST) across much of the tropics has increased by 0.4–1 °C since the mid-1970s [2]. The increase in ocean temperature caused changes in ecosystems [3]. For instance, Silverman et al. [4] proposed that the warming of the global ocean has slowed coral growth and eventually led to dissolution of coral reefs. It is generally believed that the emissions of greenhouse gas have surged since the internal combustion engine era, which induced global warming, thus leading to ocean warming [2,5]. Since previous studies mostly focused on changes on the global scale, the ocean temperature variation and its impact on local seas still need more research.
Studying the relationship between the long-term variation in the Red Sea temperature and climate change is representative. The Red Sea is a semi-enclosed and narrow inland sea located in a high-temperature zone with strong solar radiation, and is also one of the seas with the highest temperature in the world. Documenting the teleconnections between the Red Sea and other oceans by the coral record, Felis et al. [6] evidenced that the global change influenced the sea. Using satellite-derived data, Raitsos et al. [7] reported that the SST of the Red Sea increased significantly in the past, and, in particular, it had an abrupt increase after 1994, and that the annual SST mean increased by 0.7 °C during 1994–2007 compared to 1985–1993. Cantin et al. [2] proposed the average summer SST during 1998–2008 was 1.46 °C higher than that during 1950–1997 in the central Red Sea, resulting in a decrease of 30% in the coral growth rate, and predicted that should the warming trend continue, the coral could cease growing altogether by 2070.
The rise in the Red Sea SST might be directly caused by an increase in the heat input from the atmosphere or adjacent seas. By analyzing the correlation between the air and water temperature changes, Raitsos et al. [7] found that the change in air temperature above the Red Sea occurred one month earlier than the rise in SST and suggested that the increasing air temperature resulted in the warming of the Red Sea. However, studies [8,9,10] showed that the total annual heat flux over the Red Sea was negative, meaning that it lost heat to the atmosphere as a whole system [11]. If the heat loss did not decrease, the water warming might not have been caused by the rise in air temperature. So far, there have been few studies on long-term variations in the air–sea heat flux for the Red Sea, and no substantial evidence supports that the warming of the sea was directly caused by the local atmospheric warming.
Based on observations at the Bab-el-Mandab Strait, Murray and Johns [12] estimated that annual upper inflow and lower outflow transports were 0.40 Sv and 0.37 Sv (1 Sv = 106 m3/s), respectively. Because of the variations in monsoon and thermal forcing, water exchange between two seas in different months varies significantly. Sofianos et al. [9] and Matt and Johns [13] concluded that the water exchange rate in winter is two times that of the annual average. Bower et al. [14,15] observed that the water exchanges of different layers varied significantly in different seasons. In summer, the upper and bottom water flowed out of the Red Sea and the middle-layer water flowed into the sea, whereas the upper water flowed into the sea and the bottom water flowed out in winter. Smeed [16] and Xie et al. [17] verified such seasonal variations and the three-layer structure in summer. According to the study by Jean-Baptiste et al. [18], the overall exchange is an inflow of warm water through the upper layer and an outflow of cold water from the Red Sea through the bottom layer. Moreover, studies, e.g., [11,14,15,19,20,21], revealed that warm water flows into and cool water flows out of the Red Sea at the Bab-el-Mandab Strait. Tragou et al. [22], Siddall et al. [23], Sofianos et al. [9], and Abualanajia et al. [10] estimated the annual mean net heat transported to the Red Sea from the Gulf of Aden to be 8 ± 2, 11 ± 10, 11 ± 5, and 17 W/m2, respectively. However, the long-term trend of the horizontal heat flux has not been reported, and so the previous studies did not indicate if the warming of the Red Sea was related to the heat flux through the water exchange. Nevertheless, this relationship was confirmed in the Mediterranean Sea, a nearby semi-enclosed sea, where the long-term SST variability is associated with horizontal heat advection variations and increasing warming of the Atlantic inflow [24].
In short, the external heat exchange process causing the warming of the Red Sea surface water (RSSW) needs further study. In this study, to confirm or rule out that atmospheric warming is the direct reason for the warming of RSSW, long-term variations in SSTs of the Red Sea and its adjacent seas, surface air temperatures, and the surface heat-flux were analyzed using open datasets from observations, remote sensing products, and reanalysis. The correlations between the Red Sea SST and these external thermal elements were explored. To find out whether the horizontal heat flux caused the warming of RSSW, we analyzed the long-term variation in heat flux between the Red Sea and Gulf of Aden. Finally, the thermal causes for the warming of RSSW are synthetically discussed.

2. Materials and Method

Figure 1 shows the locations of the Red Sea and its adjacent seas. The Arabian Sea, located in the northwest Indian Ocean, is connected to the Gulf of Aden, which is connected to the Red Sea through the Bab-el-Mandab Strait. The average depth in the Red Sea is 558 m, and the maximum depth of the trench along the axis is 2922 m. The topography data are from the General Bathymetric Chart of the Oceans (GEBCO_2014) with a resolution of 30 arc-second interval grid (https://www.gebco.net/data_and_products/gridded_bathymetry_data, accessed on 11 June 2022).
To analyze historical SSTs, we utilized the widely used HadISST1 (Hadley Centre Sea-ice and Sea-surface Temperature Dataset Version 1, https://www.metoffice.gov.uk/hadobs/hadisst/data/download.html, accessed on 11 June 2022). HadISST1 is a global monthly dataset with a 1° grid, which was reconstructed based on in situ data from ships and buoys taken from Met Office of Marine Data Bank (MDB) and bias-adjusted inversion data from the AVHRR (Advanced Very High Resolution Radiometer) using RSOI (Reduced Space Optimal Interpolation) and variance-correction hybrid technology [25]. It provides data from 1870 to the present with proven reliability and plays an important role in ocean and climate research [25,26]. The dataset has been utilized previously for the Red Sea, e.g., in [27]. The dataset samples 40 points in the Red Sea, and the resolution is enough to reconstruct SST time series. To examine the data availability in earlier years, the number of raw SST measurement stations within the Red Sea was plotted as a function of monthly time (Figure 2) from January 1870 to December 2019 using ICOADS (International Comprehensive Ocean-Atmosphere Data Set, https://icoads.noaa.gov, accessed on 11 June 2022) and was used when there were no MDB data to enhance data coverage [25]. The measurement number was quite low prior to 1876 and significantly increased from then on with the opening of the Suez Canal. In 1876, the number increased from 48 to 158 with an average of 95, which is enough to produce robust regional time series. In the period of 1940–1943, although observations were sparse or absent in some months, the average station number was 78, and the reconstructed dataset could not distort long time series of the average SST. Therefore, 1876 was chosen as the starting date for the analysis using HadISST1.
NOAA-CIRES-DOE Twentieth Century Reanalysis V3 (20CRv3) monthly dataset (ftp://ftp.cdc.noaa.gov/Datasets/20thC_ReanV3/Monthlies, accessed on 11 June 2022) was used to analyze long-term trends of air temperature and air–sea heat flux. 20CRv3 is available for the years 1836–2015, covering 1° × 1° global grids and showing similar trends to the ERA-20C (ECMWF Atmospheric Reanalysis of the 20th Century) dataset, which only spans from 1900 to 2010 [28]. Given the high quality and long temporal coverage, 20CRv3 data were adopted from January 1876 to December 2015, involving air temperature at 2 m, downward/upward longwave/shortwave radiation fluxes, and latent/sensible heat fluxes at the surface.
The SST variations during 1876–2019 were analyzed, including annual and monthly mean values and their anomalies (derived by removing their averages during the period) for the Red Sea, Gulf of Aden, Arabian Sea, and the Northern Hemisphere. The correlation coefficients of SST anomalies between the Red Sea and adjacent seas, as well as time lag relations, were examined using the Pearson correlation, auto-correlation, and cross-correlation analyses. The correlations between anomalies of SST and those of air temperature and the air–sea heat flux were also analyzed using the same methods.
The abrupt change in annual mean SST was analyzed using the MK (Mann–Kendall) test [29]. In MK statistics, α = 0.05 is the significance level, UF is the MK statistics of anomaly time series, and UB is that of time-reversed anomaly series. If UF > 0, it represents an increasing trend, and vice versa. When UF exceeds two critical lines of u0.05 = ± 1.96, it represents a significant upward or downward trend. If the intersection point of UF and UB is between the lines, it corresponds to the starting time for the abrupt change.

3. Results

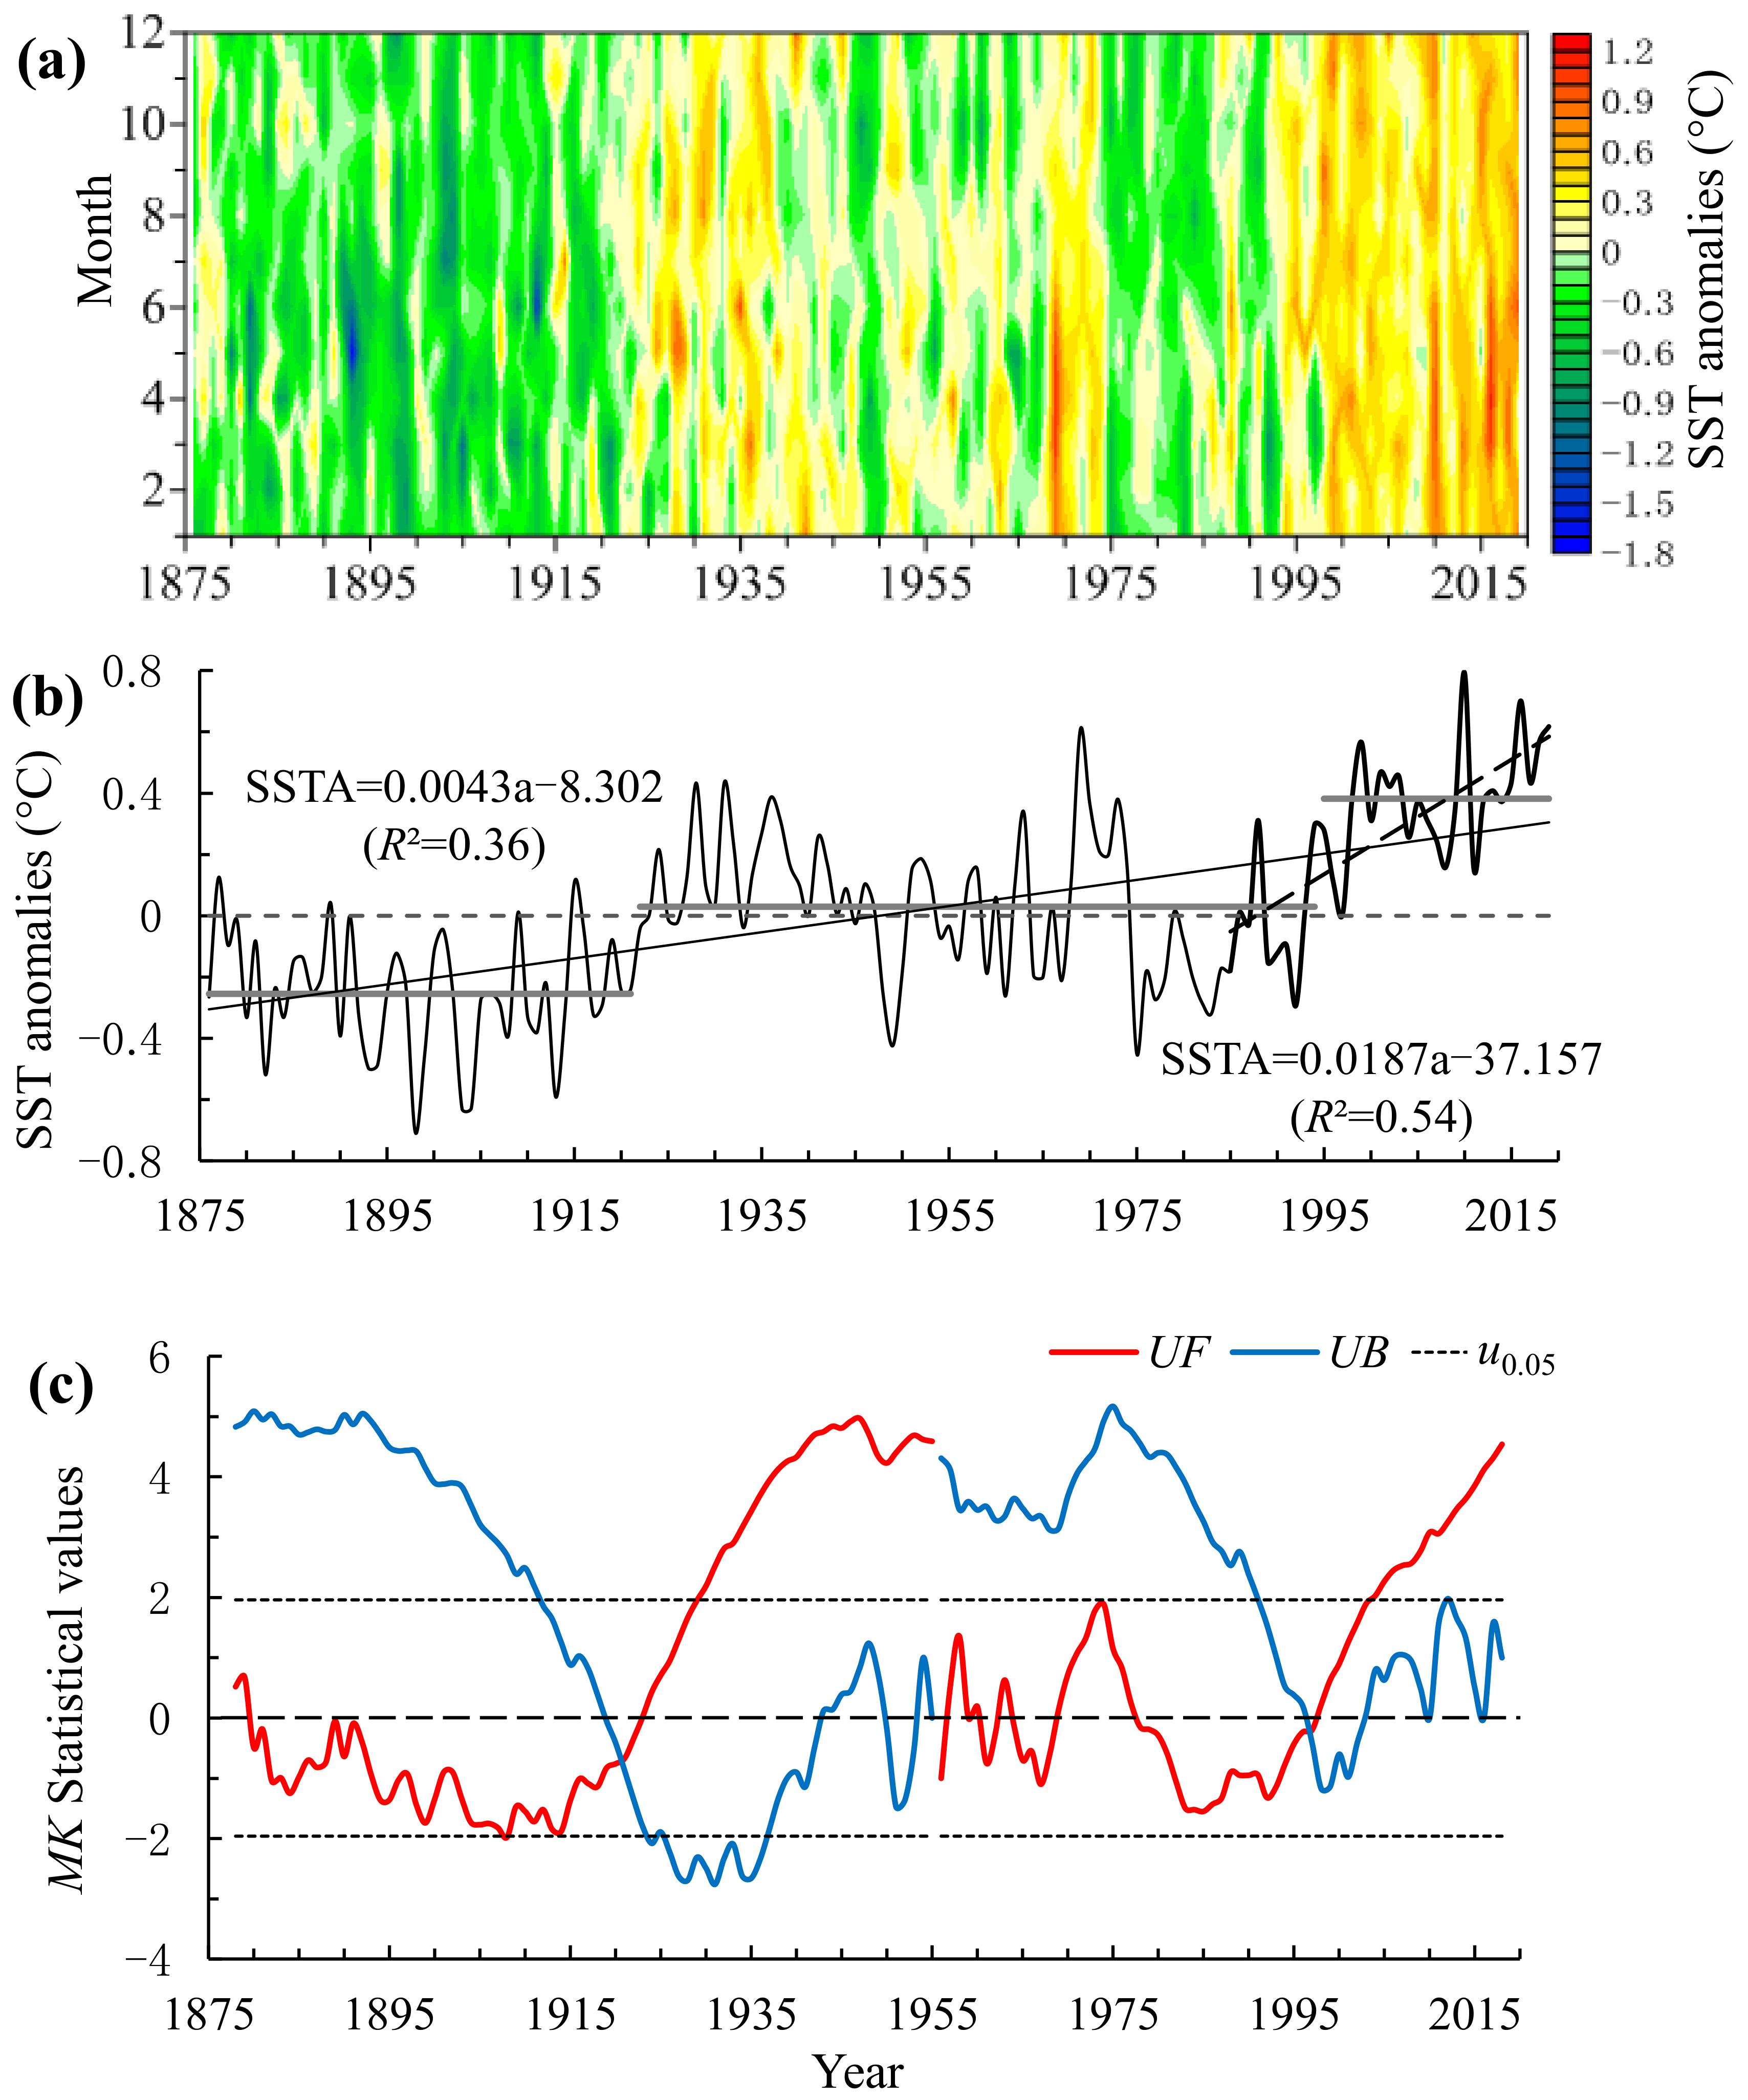
3.1. The Long-Term Variation in the Red Sea SST

Figure 3a,b present the variations in monthly and annual SST anomalies in the Red Sea during 1876–2019. It is evident that the long-time trend is a rising temperature (also indicated by Figure 4). Figure 3a shows that the warming trends are apparent in all 12 months, implying that the long-time change was not driven by seasonality. This agrees with the results of Raitsos et al. [7] using the AVHRR Pathfinder data from 1985 to 2007. By linear regression (Figure 3b), the average rising rate of the annual SST (listed in Table 1) was estimated as 0.0043 °C/year (i.e., 0.043 °C/decade, the 95% confidence interval was 0.033–0.052 °C/decade, and the correlation coefficient R = 0.6). Over 144 years, the temperature of the Red Sea increased by 0.62 °C (95% confidence interval 0.48–0.75 °C, R = 0.6). In recent decades, the rise has been accelerating. During 1985–2019, the decadal increase was 0.187 °C (95% confidence interval 0.126–0.248 °C, R = 0.74).
Figure 3a,b indicate that the significant warming of the Red Sea began in approximately 1922 and 1995 (time points for abrupt changes are also given in Figure 3c), so we divided the whole study time into three periods: 1876–1921, 1922–1994, and 1995–2019. Figure 3b shows that the average temperature anomalies in the three periods were −0.25, 0.03, and 0.38 °C, respectively. The average of the third period increased by 0.63 °C compared with that of the first period.
Considering that the temperature did not surge in the few years around 1955 (the middle of the second period aforementioned), and that the temperature of 1955 was close to the average temperature in the period, we selected this year as the cut-off point in time and conducted MK analysis for the phases before and after it, respectively. Figure 3c presents the MK statistic of the annual SST anomalies. For the greater part of 144 years, although there appeared certain periods (nearly half of the period) of temperature decreasing in both phases (UF < 0); in general, the Red Sea showed a warming trend (UF > 0), because UF reached larger positive values (peaking at 4.97, above the critical line for significant increasing over a long time) than negative (minimum at −1.98, hardly below the critical line for significant decreasing).
The distribution of auto-correlations of Red Sea SST anomalies (the time difference ≤ 50 years, the significance level p < 0.01) is shown in Figure 5a. If the time difference was zero, the auto-correlation coefficient was 1. It decreased gradually with the increasing in the lag. Beyond a lag of ~23 years, the coefficient oscillated around 0 with increasing lag. This further proves that the temperature rise of the Red Sea was periodic and there was a certain cooling period. This pattern was reported by the previous study.

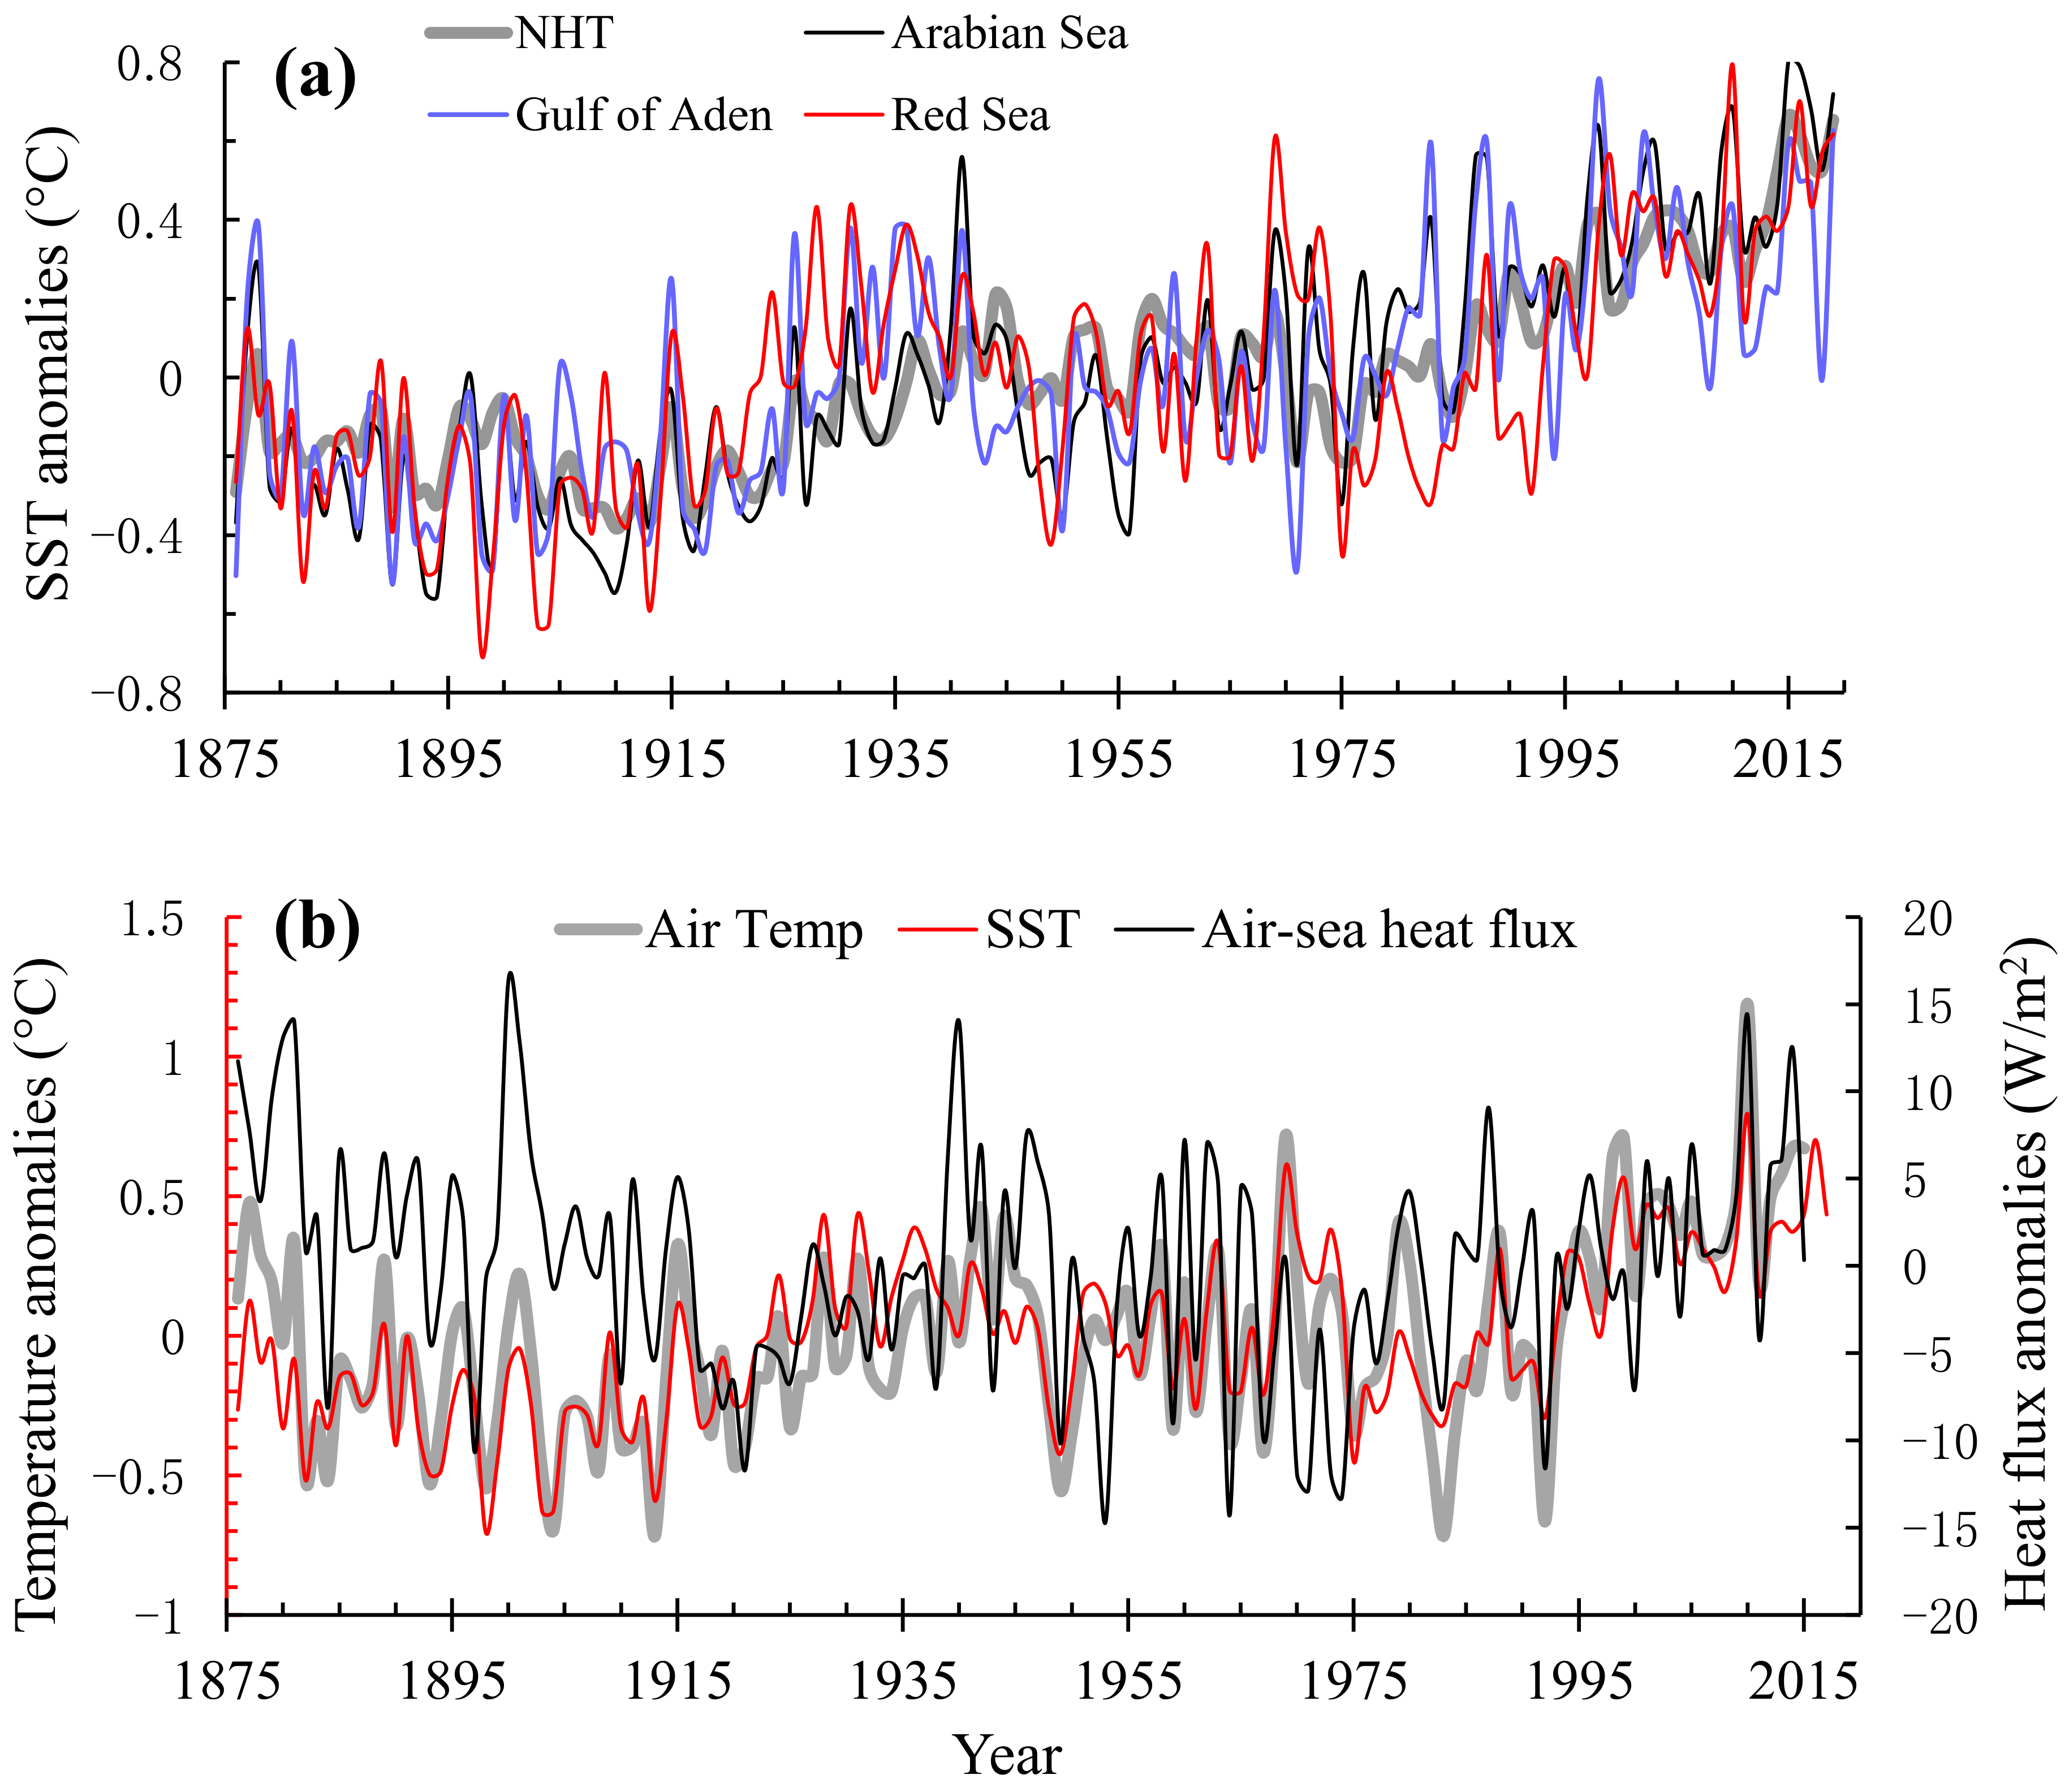
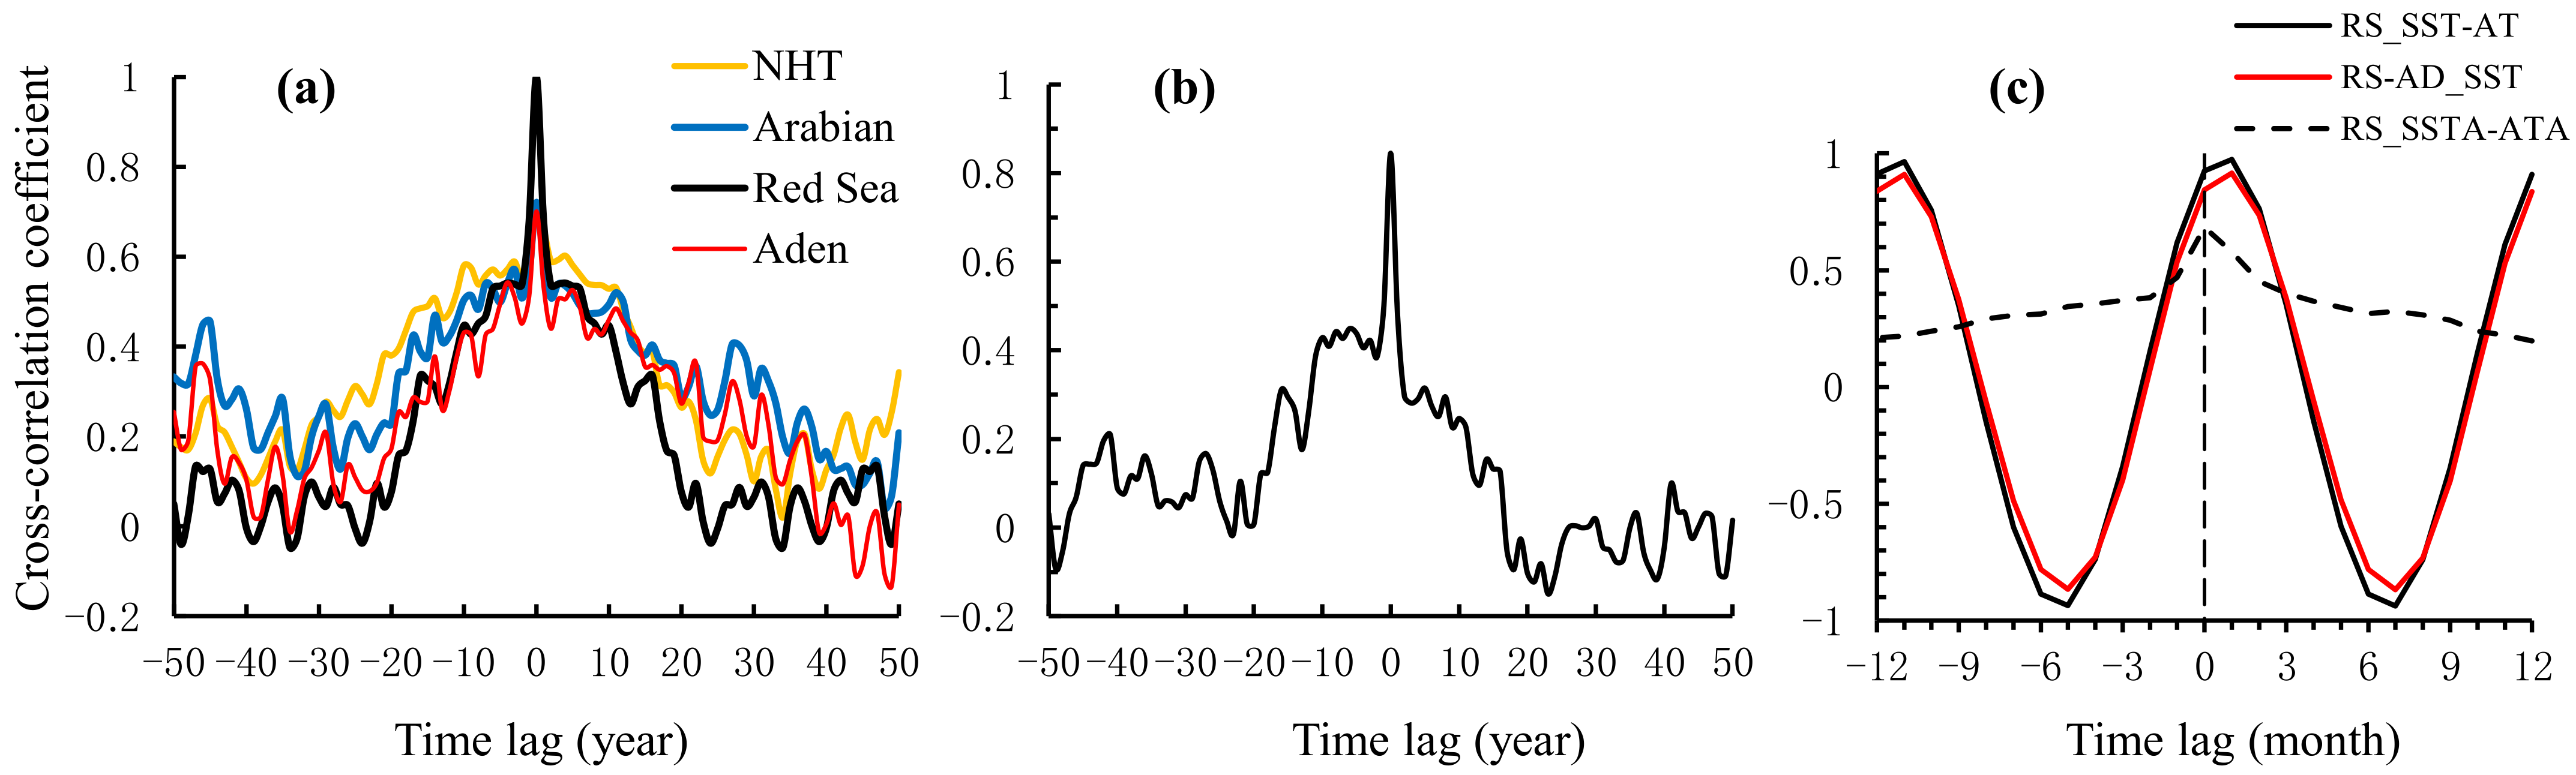
3.2. Correlations of SST Variations in the Red Sea and Adjacent Seas

In general, the adjacent seas and the Northern Hemisphere exhibited a similar trend of SST to the Red Sea, increasing in the long run but decreasing during certain periods (demonstrated by Figure 4a). The decadal SST rise was 0.046 °C (0.038–0.055 °C for the 95% confidence interval, R = 0.66), 0.06 °C (0.052–0.068 °C for the 95% interval, R = 0.78), and 0.045 °C (0.04–0.051 °C for the 95% interval, R=0.8) for the Gulf of Aden, the Arabian Sea, and the Northern Hemisphere, respectively (listed in Table 1). Over 144 years, SST increased by 0.67, 0.86, and 0.65 °C, respectively. The Arabian Sea had the largest increase, and the rise rate in the Red Sea (0.043 °C/decade) was close to those in the Gulf of Aden and the Northern Hemisphere.
Pearson correlation coefficients of annual SST anomalies between the Red Sea and the Gulf of Aden, the Arabian Sea, and the Northern Hemisphere were 0.72, 0.7, and 0.71 (p < 0.01), respectively (listed in Table 1). The correlation of the Gulf of Aden with the Arabian Sea and the Northern Hemisphere was 0.85 and 0.77, respectively, and that of the Arabian Sea with the Northern Hemisphere was 0.89. SST anomalies of the Northern Hemisphere had the highest correlation with the Arabian Sea, which is an open sea, whereas the Red Sea had the highest with the connected Gulf of Aden.
Figure 5a shows the distributions of cross-correlations between annual SST anomalies of the Red Sea and those of adjacent seas (the time lag among ±50 years). In these statistics, a positive lag means that a time series of Red Sea SST lagged behind those of other seas. When the lag was zero, the coefficients were the largest (equal to Pearson correlations). This means that there was no time lag in annual SST changes between the Red Sea and the other seas in the long run. Hence, the SST rise in the Red Sea was not a local phenomenon, and it happened synchronously with the global ocean in the long run. The Red Sea SST rise was due to global ocean warming.

3.3. Relations of the Red Sea Warming with the Surface Heat Elements

Figure 4b indicates that the variation trends of air temperature over the Red Sea and adjacent seas were basically the same as those of SST. According to the statistical results, the increase rate of air temperature at 2 m over the Red Sea was 0.037 °C/decade (95% confidence interval 0.024–0.049 °C/decade, R = 0.44) during 1876–2015, which is lower than the SST increase rate (listed in Table 1). After 1985, air temperature increased by 0.26 °C/decade (95% confidence interval 0.15–0.37 °C/decade, R = 0.68), showing an accelerated rise trend similar to SST. Over these 140 years, air temperature increased by 0.061 °C/decade (95% confidence interval 0.051–0.072 °C/decade, R = 0.71), 0.061 °C/decade (95% confidence interval 0.052–0.07 °C/decade, R = 0.76), and 0.063 °C/decade (95% confidence interval 0.055–0.071 °C/decade, R = 0.8) for the Gulf of Aden, the Arabian Sea, and the Northern Hemisphere, respectively (listed in Table 1).
The correlation coefficient between annual SST anomalies and air temperature anomalies of the Red Sea was 0.84 (p < 0.01), which is a strong positive correlation (listed in Table 1). Their variations had a high similarity and synchronism (Figure 4b).
To determine if there is a dominant relationship between SST and air temperature of the Red Sea, we conducted cross-correlation analysis on their annual and monthly series individually. In Figure 5b, the maximum cross-correlation coefficient of annual anomalies was 0.84 when the time difference was 0. This further proves that annual variations in air temperature and SST were synchronized in the long run. In a monthly difference curve (RS_SSTA-ATA, Figure 5c), the maximum coefficient was 0.68 (p < 0.01) when the time difference was 0; thus, air temperature and SST monthly anomalies had the greatest cross-correlation in the same month. This suggests that the monthly variations in air temperature and SST anomalies were synchronized in general, and there was no significant time lag. Therefore, from the perspective of long-term warming, the rise in air temperature did not occur earlier than that of SST. Raitsos et al. [7] reported that air temperature shifted 1 month earlier than SST, and accordingly proposed that air temperature influenced water temperature in the Red Sea. However, their analysis (for the period of 1985–2007) was based on temperatures rather than anomalies, and is not enough to prove that the air temperature rise induced the Red Sea warming from the perspective of long-term change, even though seasonal variations in air temperature usually happen earlier than those of water temperature. Our analysis (RS_SST-AT, Figure 5c) for air and water temperatures (not anomalies) also indicated this phenomenon. The cross-correlation coefficient was 0.975 (p < 0.01) when the lag was 1 month for SST, larger than that (0.924, p < 0.01) of the zero lag. In addition, the cross-correlation for SSTs of the Red Sea and Gulf of Aden was also the strongest when the lag was 1 month for the Red Sea (RS_AD-SST, Figure 5c).
Next, we analyzed the relationship between the Red Sea SST variations and air–sea heat fluxes. The results show that the net flux over the sea tended to decrease over the 140 years. The average annual change rate was linear-fitted to be −0.0191 W/m2 (95% confidence interval −0.0449–0.0067 W/m2; −0.191 W/m2/decade, Table 1), with a larger decrease (−0.0776 W/m2, 95% confidence interval −0.1139–−0.0413 W/m2) during 1876–1985 and a positive rate after 1985 (shown later). The trend of SST increasing with the decrease in the heat flux (Figure 4b) indicates that the Red Sea warming was not due to absorbing more heat from the air. In the Mediterranean Sea, a previous study [24] also indicated a negative correlation between SST and net air–sea heat flux variations. According to the rate, the total net heat flux decreased by 2.67 W/m2 over the 140 years studied. Meanwhile, the solar radiation increased by 3.25 W/m2, the loss of heat through long-wave radiation increased by 0.36 W/m2, and the sensible heat flux decreased by 0.15 W/m2, but the latent heat flux via evaporation increased by 5.71 W/m2. Therefore, the decrease in net air–sea heat flux was mostly due to the transfer of more heat to the air through evaporation. This phenomenon and mechanism was evidenced in the Equatorial Indian Ocean [30] and the Mediterranean Sea [24]. According to the calculation method for the air–sea flux [31], the latent heat flux is:
Q l h = ρ L e C e U ( q s q a )
where ρ, Le, Ce, U, qs, and qa are the air density, evaporation latent heat, exchange coefficient, wind speed, sea surface saturation specific humidity, and sea surface air specific humidity, respectively. Among parameters, qs is a function that increases with SST. Therefore, the SST rise contributes to the increase in the latent heat flux, thus reducing the net air–sea heat flux.
In addition, during 1985–2015, the average annual net air–sea heat flux increased by 0.193 W/m2 (95% confidence interval −0.0145–0.4004 W/m2; 1.93 W/m2/decade, Table 1), a significantly larger value than that found for the 140 years analyzed (−0.019 W/m2). Before 1985, the sensible heat flux increased because SST increased more rapidly than air temperature, referring to the formula for the sensible heat flux [32]:
Q s h = ρ C a C s U ( T s T a )
where Ca, Cs, Ts, and Ta are the specific heat of air, exchange coefficient of sensible heat, sea surface temperature, and air temperature, respectively. In recent decades, air temperature has increased more rapidly (Figure 4b), resulting in a significant decrease in the sensible heat flux, hence the increase in the net flux. Therefore, the decrease in heat loss of water might have contributed to the SST rise in the Red Sea in recent decades.
In short, statistical analysis showed that the Red Sea SST rise had positive correlations with air temperature, and global SST rises were due to global warming. However, our results do not indicate that the warming of the Red Sea was caused by the rise in local air temperature in the 140 years studied. In recent decades, accelerated warming of air might have contributed to the SST rise.

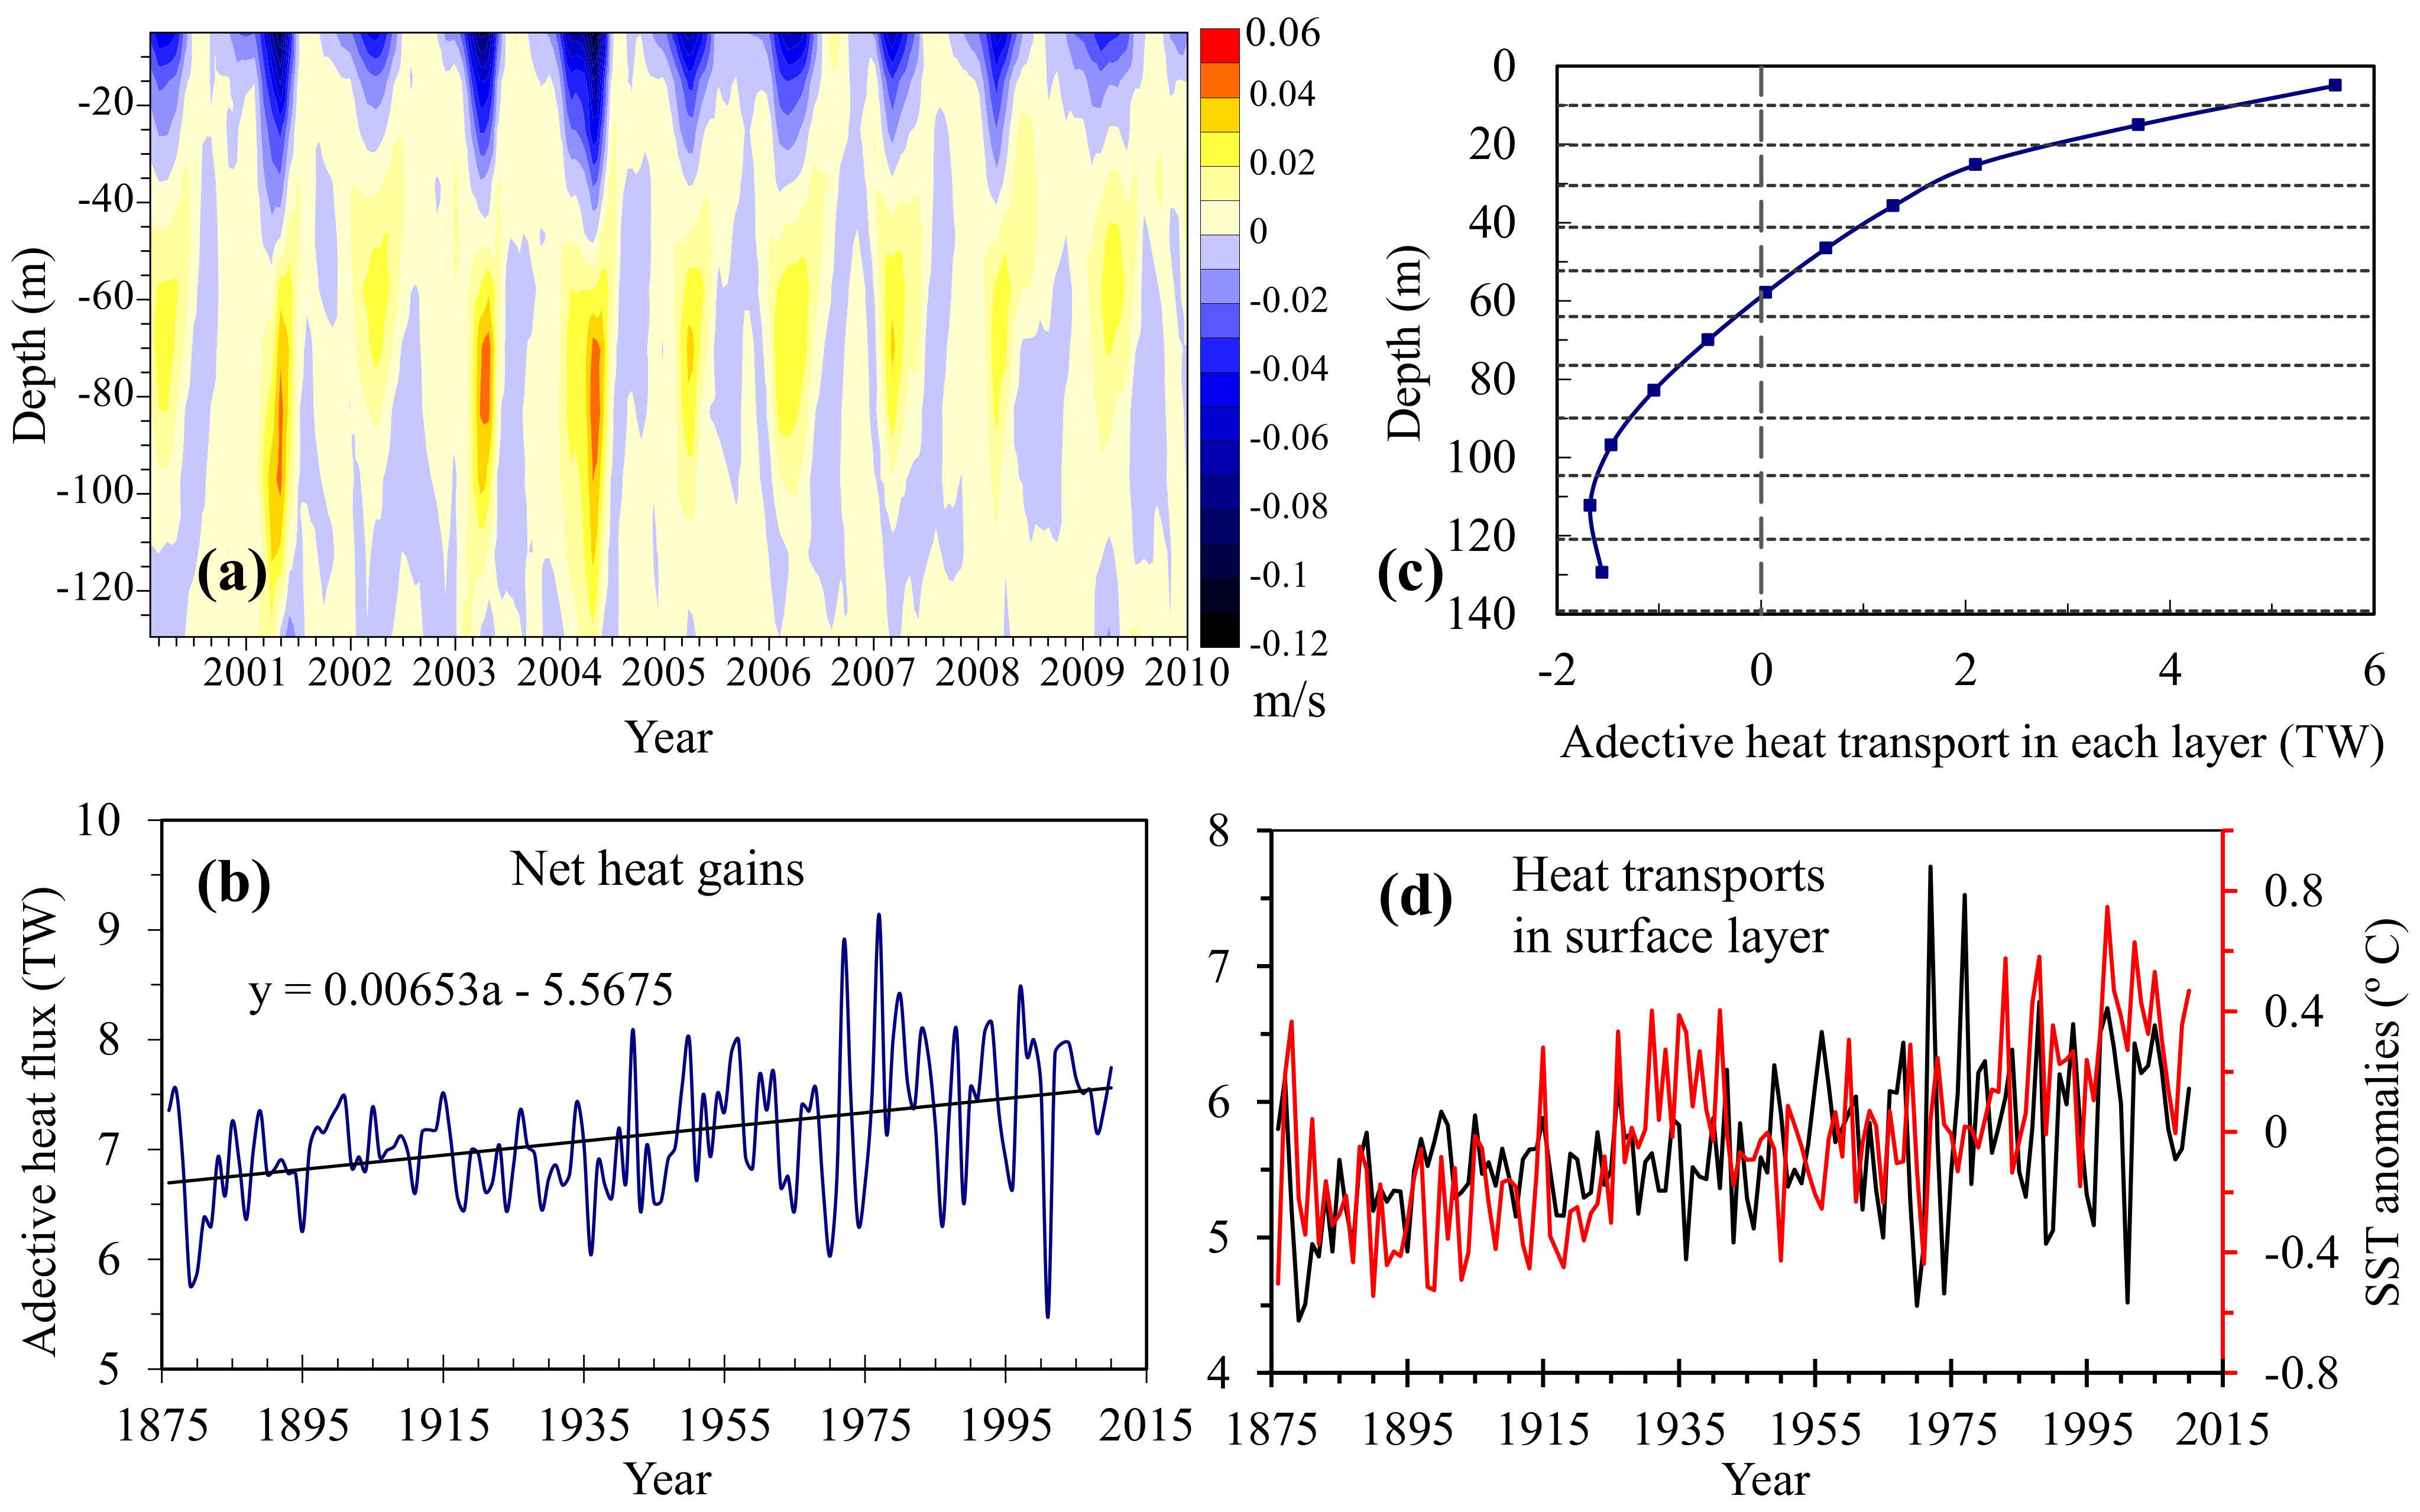
3.4. The Relationship of the Red Sea Warming with Horizontal Heat Flux

In light of the flow pattern (warm water flows into the Red Sea in the upper layer at the Bab-el-Mandab Strait [18]) and the SST rise in the Gulf of Aden over 144 years, the heat transported to the Red Sea likely increased, which is a likely cause that contributed to the warming of RSSW.
In order to verify the suggestion, we calculated the annual heat input during 1876–2010 using the SODA (Simple Ocean Data Assimilation Version 2.2.4, http://apdrc.soest.hawaii.edu/datadoc/soda_pop.php, accessed on 11 June 2022) including temperature and velocities of each layer at the Bab-el-Mandab Strait. SODA is an extensively used long-term assimilation dataset for the global ocean with 0.5° × 0.5° resolution (mapped monthly from the POP results at 0.25° × 0.4°) and 40 vertical levels with 10 m spacing near the sea surface. The total horizontal heat transported to the Red Sea can be estimated by [33,34]:
Q a d = i = 1 n ρ C P T i Δ D i W i V i
where ρ , C P , T i , Δ D i , W i , and V i stand for density, specific heat of sea water, water temperature, depth thickness, section width, and inflow/outflow velocity at the i layer of n layers at the strait.
Figure 6a presents the vertical profile for monthly average zonal velocities (the negative means inflow) at the Bab-el-Mandab Strait during 2001–2010, displaying the aforementioned pattern [14,15,16,18]. Figure 6b presents the variation in estimated annual net heat transport to the Red Sea during 1876–2010. The net flux was always positive with an average of 7.13 × 10¹² W over the years. Distributed over an area of 4.38 × 10⁵ km2, the gain for the Red Sea was ~16.3 W/m2. Correspondingly, the heat loss for the Gulf of Aden (2.2 × 10⁵ km2) was ~32.4 W/m2, which is close to an observed value of 35 W/m2 [10]. Figure 6c demonstrates the vertical distribution of the average annual heat transported to the Red Sea at each layer of the strait during the period. The heat was transported into the Red Sea through the upper water and out of the sea through the deeper water, tallying with the aforementioned pattern in the Introduction [18]. To further verify the rationality of using SODA, we contrasted the variation trends of the annual heat transports in the surface layer (upper 10 m in depths) from the Gulf of Aden and SST anomalies of the gulf (Figure 6d). During the period, the average rise rates of the former and the latter were 0.056 TW and 0.045 °C per decade, respectively. On the whole, they increased synchronously and their Pearson correlation coefficient was 0.42 (p < 0.01), showing a moderate positive correlation. Given that the two series were obtained from different datasets, this correlation reflects the long-term variations in heat transport between the two seas objectively. Therefore, the above results demonstrate the rationality of using the SODA to analyze the long-term variations in the heat flux and estimate the heat gain.
Figure 6b shows that the annual net heat transport to the Red Sea had an increasing trend during 1876–2010, with an average rise of ~6.53 × 10⁹ W/year (95% confidence interval 4.19 × 10⁹–8.88 × 10⁹ W/year, R = 0.43). At this rate, the heat input increased by 9.15 × 10¹¹ W or 12.8% during the140 years studied (1876–2015). If evenly distributed across the whole Red Sea, the gross gain over these 140 years would have increased by ~2.1 W/m2 (95% confidence interval 1.34–2.83 W/m2) (i.e., decadal 0.15 W/m2, Table 1). Therefore, it gained more and more horizontal heat from the external sea, indicating that the Red Sea SST rise was mainly caused by the horizontal heat inflow in the long term (similar to Mediterranean Sea [24]) via the Arabian Sea and Gulf of Aden against the background of global ocean warming.

4. Discussion

Our results suggest that the increases in the heat loss at the surface and the heat gain from the adjacent sea for the Red Sea were 2.67 and 2.1 W/m2, respectively, in the 140 years analyzed. The loss was approximately balanced by the external gain.
In addition, the Red Sea is characterized by the presence of 25 brine pools, which are large bodies of bottom water of the sea [35]. In the pools, volcanic intrusions generate upwelling of hot brine constantly, evidently resulting in high-temperature deep water in the sea [36]. In the largest brine pool, Atlantis II, the temperature significantly increased over 44 years [37], suggesting that the heat input from the seafloor has been increasing. Nevertheless, the long-term variation in the bottom heat input has not yet been reported. No study indicated that the brines affect the temperature of upper-layer water, and that the Red Sea SST rise is related to the geothermal heating.
Based on the historical dataset (1973–2006), Alraddadi [38] revealed a trend of decreasing monthly anomalies of the net air–sea heat flux, trends of increasing evaporation and SST, and cooling and freshening trends of the Red Sea Deep Water (RSDW). The increase in the evaporation (buoyancy loss [11]) leads to convection that reaches the bottom of the Gulf of Suez and the northern Red Sea [39]. The deep convectional cold-water flows southward [39], resulting in the cooling of RSDW [38,40].
As determined by comprehensive analysis of our results and aforementioned previous studies, the cause for the warming of RSSW is summarized as follows and represented with a schematic (Figure 7, referring to previous circulation pattern [38]). The upper fresh warm water from the Gulf of Aden flows into the Red Sea due to the wind and thermohaline forcing. The overall wind direction is in fact northward annually at the strait [41]. Against the background of global warming, RSSW became warmer with the long-term increase in the temperature of external water. This strengthened the evaporation and made RSSW lose more heat to the air. When moving northward, the water is cooled and becomes more saline and denser, then sinks, and finally partially flows out of the sea over the strait sill [38,42,43]. Together with the sinking water of the Gulf of Suez and Gulf of Aqaba due to evaporation and convection [44,45], RSDW’s past trend of cooling might play a role in balancing the difference between RSSW warming and external net heat flux.

5. Conclusions

Using the historic data, long-term variations in SSTs of the Red Sea and its adjacent seas, surface air temperatures, air–sea heat flux, and horizontal heat flux were statistically analyzed. The findings are summarized as follows.
The SST of the Red Sea increased at an average rate of 0.043 × 10 °C/decade over the 144 years studied (1875–2019), and the increase rate has been 0.187 °C/decade since 1985. The abrupt warming of the Red Sea began in approximately 1922 and 1995. The long-term variations in SSTs in the sea have significant positive correlations and synchronicities with those in adjacent seas and the global ocean. The warming of the Red Sea is due to the global ocean warming.
The increase rate of air temperature at 2 m over the Red Sea was 0.0037 °C/year during the 140 years studied, and has accelerated in recent decades. The correlation between annual SST anomalies and air temperature anomalies was highly positive. In the long term, their variations were synchronous. In general, the monthly variations in air temperature anomalies and SST anomalies were also synchronous. From the perspective of long-term warming, the increase in air temperature did not occur earlier than the SST rise. The rise in air temperature over the Red Sea was not a direct external cause of water warming. During the 140 years studied, the net air–sea heat flux tended to decrease, indicating that the warming led to the loss of more heat to the air via evaporation. Nevertheless, since 1985, the accelerated rise in air temperature has decreased the sensible heat flux, which might contribute to the Red Sea warming.
The Red Sea obtained more and more heat with an annual average of ~7.1 × 10¹² W from the Gulf of Aden. At a rough estimate, the gain of the Red Sea increased by ~2.1 W/m2 in the 140 years analyzed. Due to the wind and thermohaline forcing, the upper warmer water flows into the sea from the Gulf of Aden. Against the background of global warming, the water warming of adjacent seas caused the long-term Red Sea SST rise.

Author Contributions

Conceptualization, X.L.; methodology, X.L.; software, X.L.; data curation, X.L. and F.Y.; validation, X.L.; visualization, X.L.; formal analysis, X.L.; resources, X.L.; writing—original draft preparation, X.L.; writing—review and editing, X.L. and F.Y. All authors have read and agreed to the published version of the manuscript.

Funding

The work was supported by the National Natural Science Foundation of China (Grant No. 41276036).

Institutional Review Board Statement

Not applicable.

Informed Consent Statement

Not applicable.

Data Availability Statement

Data sharing not applicable.

Conflicts of Interest

The authors declare no conflict of interest.

References

  1. Nandkeolyar, N.; Raman, M.; Kiran, G.S. Comparative analysis of sea surface temperature pattern in the eastern and western gulfs of Arabian Sea and the Red Sea in recent past using satellite data. Int. J. Oceanogr. 2013, 6, 1337–1349. [Google Scholar] [CrossRef]
  2. Cantin, N.E.; Cohen, A.L.; Karnauskas, K.B.; Tarrant, A.M.; Mccorkle, D.C. Ocean warming slows coral growth in the central Red Sea. Science 2010, 329, 322–325. [Google Scholar] [CrossRef] [PubMed] [Green Version]
  3. Alley, R.B.; Marotzke, J.; Nordhaus, W.D.; Overpeck, J.T.; Peteet, D.M.; Pielke, R.A., Jr.; Pierrehumbert, R.T.; Rhines, P.; Stocker, T.; Talley, L.D. Abrupt climate change. Science 2003, 299, 2005–2010. [Google Scholar] [CrossRef] [PubMed] [Green Version]
  4. Silverman, J.; Lazar, B.; Cao, L.; Caldeira, K.; Erez, J. Coral reefs may start dissolving when atmospheric CO2 doubles. Geophys. Res. Lett. 2009, 36, L05606. [Google Scholar] [CrossRef] [Green Version]
  5. Richardson, A.J.; Schoeman, D.S. Climate impact on plankton ecosystems in the Northeast Atlantic. Science 2004, 305, 1609–1612. [Google Scholar] [CrossRef]
  6. Felis, T.; Pätzold, J.; Loya, Y.; Fine, M.; Nawar, A.H.; Wefer, G. A coral oxygen isotope record from the northern Red Sea documenting NAO, ENSO, and North Pacific teleconnections on Middle East climate variability since the year 1750. Paleoceanography 2000, 15, 679–694. [Google Scholar] [CrossRef]
  7. Raitsos, D.E.; Hoteit, I.; Prihartato, P.K.; Chonis, T.; Triantafyllou, G.; Abualnaja, Y. Abrupt warming of the Red Sea. Geophys. Res. Lett. 2011, 38, L14601. [Google Scholar] [CrossRef] [Green Version]
  8. Abdelrahman, S.M.; Ahmad, F. Red Sea surface heat fluxes and advective heat transport through Bab el Mandab. JKAU Mar. Sci. 1995, 6, 3–13. [Google Scholar] [CrossRef]
  9. Sofianos, S.S.; Jones, W.E.; Murray, S.P. Heat and freshwater budgets in the Red Sea from direct observations at Bab el Mandeb. Deep Sea Res. Part II Topical Stud. Oceanogr. 2002, 49, 1323–1340. [Google Scholar] [CrossRef]
  10. Abualanajia, Y.O.; Ahmad, F.; Al-mtairi, N.A. Balance of surface, advective and up-welling heat fluxes in the Gulf of Aden. Indian J. Mar. Sci. 2011, 40, 42–47. [Google Scholar]
  11. Zhai, P.; Bower, A.S.; Smethie, W.M.; Pratt, L.J. Formation and spreading of Red Sea Outflow Water in the Red Sea. J. Geophys. Res. Oceans 2015, 120, 6542–6563. [Google Scholar] [CrossRef]
  12. Murray, S.P.; Johns, W. Direct observations of seasonal exchange through the Bab el Mandab Strait. Geophys. Res. Lett. 1997, 24, 2557–2560. [Google Scholar] [CrossRef]
  13. Matt, S.; Johns, W.E. Transport and entrainment in the Red Sea outflow plume. J. Phys. Oceanogr. 2007, 37, 819–836. [Google Scholar] [CrossRef] [Green Version]
  14. Bower, A.S.; Hunt, H.D.; Price, J.F. Character and dynamics of the Red Sea and Persian Gulf outflows. J. Geophys. Res. Oceans 2000, 105, 6387–6414. [Google Scholar] [CrossRef]
  15. Bower, A.S.; Jones, W.E.; Fratantoni, D.M.; Peters, H. Equilibration and circulation of Red Sea outflow water in the western Gulf of Aden. J. Phys. Oceanogr. 2005, 35, 1963–1985. [Google Scholar] [CrossRef] [Green Version]
  16. Smeed, D.A. Exchange through the Bab el Mandab. Deep Sea Res. Part II Top. Stud. Oceanogr. 2004, 51, 455–474. [Google Scholar]
  17. Xie, J.; Krokos, G.; Sofianos, S.; Hoteit, I. Interannual variability of the exchange flow through the strait of Bab-al-Mandeb. J. Geophys. Res. Oceans 2019, 124, 1988–2009. [Google Scholar] [CrossRef] [Green Version]
  18. Jean-Baptiste, P.; Fourre, E.; Metzl, N.; Ternon, J.F.; Poisson, A. Red Sea deep water circulation and ventilation rate deduced from the 3He and 14C tracer fields. J. Mar. Syst. 2004, 48, 37–50. [Google Scholar] [CrossRef]
  19. Sofianos, S.; Johns, W.E. The summer circulation in the Gulf of Suez and its influence in the Red Sea thermohaline circulation. J. Physi. Oceanogr. 2016, 47, 2047–2053. [Google Scholar] [CrossRef]
  20. Bower, A.S.; Fratantoni, D.M. Gulf of Aden eddies and their impact on Red Sea Water. Geophys. Res. Lett. 2002, 29, 2025. [Google Scholar] [CrossRef] [Green Version]
  21. Yao, F.; Hoteit, H.; Pratt, L.J.; Bower, A.S.; Köhl, A.; Gopalakrishnan, G.; Rivas, G.G. Seasonal overturning circulation in the Red Sea: 2. Winter circulation. J. Geophys. Res. Oceans 2014, 119, 2238–2262. [Google Scholar] [CrossRef] [Green Version]
  22. Tragou, E.; Garrett, C.; Outerbridge, R. The heat and freshwater budgets of the Red Sea. J. Phys. Oceanogr. 1999, 29, 2504–2522. [Google Scholar] [CrossRef]
  23. Siddal, M.; Smeed, D.A.; Matthiesen, S.; Rohling, E.J. Modelling the seasonal cycle of the exchange flow in Bab El Mandab (Red Sea). Deep Sea Res. Part I Oceanogr. Res. Pap. 2002, 49, 1551–1569. [Google Scholar] [CrossRef]
  24. Skliris, N.; Sofianos, S.; Gkanasos, A.; Mantziafou, A.; Vervatis, V.; Axaopoulos, P.; Lascaratos, A. Decadal scale variability of sea surface temperature in the Mediterranean Sea in relation to atmospheric variability. Ocean Dynam. 2012, 62, 13–30. [Google Scholar] [CrossRef]
  25. Rayner, N.A.; Parker, D.E.; Horton, E.B.; Folland, C.K.; Alexander, L.V.; Rowell, D.P.; Kent, E.C.; Kaplan, A. Global analyses of sea surface temperature, sea ice, and night marine air temperature since the late nineteenth century. J. Geophys. Res. 2003, 108, 4407. [Google Scholar] [CrossRef]
  26. Wang, Y.; Liu, P.; Li, T. Climatologic comparison of HadISST1 and TMI sea surface temperature datasets. Sci China Earth Sci. 2011, 54, 1238–1247. [Google Scholar] [CrossRef]
  27. Belkin, I.M. Rapid warming of large marine ecosystems. Prog. Oceanogr. 2009, 81, 207–213. [Google Scholar] [CrossRef]
  28. Slivinski, L.C.; Compo, G.P.; Whitaker, J.S.; Sardeshmukh, P.D.; Giese, B.S.; McColl, C.; Allan, R.; Yin, X.; Vose, R.; Titchner, H.; et al. Towards a more reliable historical reanalysis: Improvements for version 3 of the Twentieth Century Reanalysis system. Q. J. Roy. Meteor. Soc. 2019, 145, 2876–2908. [Google Scholar] [CrossRef] [Green Version]
  29. Gocic, M.; Trajkovic, S. Analysis of changes in meteorological variables using Mann-Kendall and Sen’s slope estimator statistical tests in Serbia. Global Planet. Change 2013, 100, 172–182. [Google Scholar] [CrossRef]
  30. Alory, G.; Meyers, G. Warming of the upper Equatorial Indian Ocean and changes in the heat budget (1960–99). J. Climate 2009, 22, 93–113. [Google Scholar] [CrossRef] [Green Version]
  31. Fairall, C.W.; Bradley, E.F.; Hare, J.E.; Grachev, A.A.; Edson, J.B. Bulk parameterization of air-sea fluxes: Updates and verification for the COARE algorithm. J. Climate 2003, 16, 571–591. [Google Scholar] [CrossRef]
  32. Fairall, C.W.; Bradley, E.F.; Rogers, D.P.; Edson, J.B.; Young, G.S. Bulk parameterization of air-sea fluxes for Tropical Ocean-Global Atmosphere Coupled-Ocean Atmosphere Response Experiment. J. Geophys. Res. 1996, 101, 3747–3764. [Google Scholar] [CrossRef]
  33. Orvik, K.A.; Skagseth, Ø. Heat flux variations in the eastern Norwegian Atlantic Current toward the Arctic from moored instruments, 1995–2005. Geophys. Res. Lett. 2015, 32, L14610. [Google Scholar] [CrossRef] [Green Version]
  34. Madonna, E.; Sando, A.B. Understanding differences in North Atlantic poleward ocean heat transport and its variability in global climate models. Geophys. Res. Lett. 2022, 49, e2021GL096683. [Google Scholar] [CrossRef]
  35. Mohamed, Y.M.; Ghazy, M.A.; Sayed, A.; Ouf, A.; EI-Dorry, H.; Siam, R. Isolation and characterization of a heavy metal-resistant, thermophilic esterase from a Red Sea Brine Pool. Sci. Rep. 2013, 3, 3358. [Google Scholar] [CrossRef] [PubMed] [Green Version]
  36. Hovland, M.; Rueslåtten, H.; Kutznetsova, T. Numerical modeling of supercritical out-salting in the Atlantis II Deep (Red Sea) hydrothermal system. Open Geology J. 2007, 1, 1–6. [Google Scholar] [CrossRef]
  37. Swift, S.A.; Bower, A.S.; Schmitt, R.W. Vertical, horizontal, and temporal changes in temperature in the Atlantis II and Discovery hot brine pools, Red Sea. Deep Sea Res. Part I Oceanogr. Res. Pap. 2012, 64, 118–128. [Google Scholar]
  38. Alraddadi, T.M. Temporal Changes in the Red Sea Circulation and Associated Water Masses. Ph.D. Thesis, University of Southampton, Southampton, UK, January 2013. [Google Scholar]
  39. Felis, T.; Mudelsee, M. Pacing of Red Sea deep water renewal during the last centuries. Geophys. Res. Lett. 2019, 46, 4413–4420. [Google Scholar] [CrossRef] [Green Version]
  40. Woelk, S.; Quadfasel, D. Renewal of deep-water in the Red Sea during 1982–1987. J. Geophys. Res. 1996, 101, 18155–18165. [Google Scholar] [CrossRef]
  41. Chen, C.; Li, R.; Pratt, L.J.; Limeburner, R.L.; Beardsley, R.C.; Bower, A.S.; Jiang, H.; Abualnajia, Y.; Xu, Q.; Lin, H.; et al. Process modeling studies of physical mechanisms of the formation of an anticyclonic eddy in the central Red Sea. J. Geophys. Res. Oceans 2014, 119, 1445–1464. [Google Scholar] [CrossRef] [Green Version]
  42. Quadfasel, D. Red Sea Circulation. In Encyclopedia of Ocean Sciences; Steele, J.H., Thorpe, S.A., Turekian, K.K., Eds.; Academic Press: San Diego, CA, USA, 2001; pp. 2366–2376. [Google Scholar]
  43. Osipov, S.; Stenchikov, G. Regional effects of the Mount Pinatubo eruption on the Middle East and the Red Sea. J. Geophys. Res. Oceans 2017, 122, 8894–8912. [Google Scholar] [CrossRef] [Green Version]
  44. Sofianos, S.S.; Jones, W.E. An oceanic general circulation model (OGCM) investigation of the Red Sea circulation, 1. Exchange between the Red Sea and the Indian Ocean. J. Geophys. Res. 2002, 107, 17-1–17-11. [Google Scholar] [CrossRef]
  45. Papadopoulos, V.P.; Zhan, P.; Sofianos, S.S.; Raitsos, D.E.; Qurban, M.; Abualnaja, Y.; Bower, A.; Kontoyiannis, H.; Pavlidou, A.; Asharaf, T.T.M.; et al. Factors governing the deep ventilation of the Red Sea. J. Geophys. Res. Oceans 2015, 120, 7493–7505. [Google Scholar] [CrossRef] [Green Version]
Figure 1. Map and topography (using GEBCO_2014 data) of the study area and the connection of Red Sea with Gulf of Aden through Bab-el-Mandab Strait. Dashed line at the strait was used to calculate the horizontal heat flux across it.
Jmse 10 00846 g001
Figure 2. Monthly series of the numbers of raw SST measurements (ICOADS) within Red Sea. The dots are valued by the right coordinate axis, standing for the enlarged figure of partial line segments.
Jmse 10 00846 g002
Figure 3. Long-term variations in SST, surface air temperature, and air–sea heat flux. (a) Monthly time series of anomalies of SST in Red Sea since 1876; (b) annual SST anomalies in Red Sea (two diagonal lines show the variation trends through linear fitting for 1876–2019 and 1985–2019; in two fitting formulas, “a” represents the year; three horizontal lines show the averages for 1876–1921, 1922–1994, and 1995–2019, respectively); (c) the variation trend of Red Sea SST, where UF and UB are MK statistics of time and time-reversed series, respectively, and u0.05 = ±1.96 are two critical lines. Two phases before/after 1955 were individually analyzed.
Jmse 10 00846 g003
Figure 4. Anomalies of Red Sea SST versus SST anomalies of Gulf of Aden, Arabian Sea, and Northern Hemisphere (NHT) (a) and anomalies of surface air temperature and the net air–sea heat flux (b). A positive heat flux corresponds to a downward flux.
Jmse 10 00846 g004
Figure 5. Correlation analysis for Red Sea SST. Cross-correlation coefficients between annual SST anomalies of Red Sea and those of adjacent seas and NHT (a) and Red Sea air temperature anomalies (b); (c) cross-correlation coefficients between Red Sea SST and air temperature (RS_SST-AT), Red Sea SST anomalies and air temperature anomalies (RS_SSTA-ATA), as well as Red Sea SST and Gulf of Aden SST (RS_AD-SST). A positive lag represents SST/SSTA series lagging behind other variables.
Jmse 10 00846 g005
Figure 6. Advective transport between Red Sea and Gulf of Aden. (a) Monthly average zonal velocities at Bab-el-Mandab Strait for 2001–2010, with negative values corresponding to the inflow to Red Sea (across the dashed line, Figure 1); (b) variations in annual net heat transports to Red Sea (heat gains) during 1876–2010 (1 TW = 1012 W), with the diagonal line showing the linear-fitted trend; (c) annual heat transports to Red Sea at each layer (between two adjacent dashed lines); (d) contrast of variation trends for annual SST anomalies (red curve) of Gulf of Aden and heat transports (black curve) via strait’s surface layer from the gulf.
Jmse 10 00846 g006
Figure 7. Schematic of the heat transport and circulation patterns in upper layers, upper deep layers, and deep layers in Red Sea. Dotted topography represents Gulf of Aqaba. SW: surface water; RSOW: Red Sea outflow water.
Jmse 10 00846 g007
Table 1. The variation trends of SST and air temperature anomalies in Red Sea and adjacent seas and their correlation coefficients over the 140 years analyzed. Heat flux variations are also listed.
DescriptionValue of Trend or Correlation
SST variation in Red Sea0.043 °C/decade
(0.187 °C/decade since 1985)
SST variation in Gulf of Aden0.046 °C/decade
SST variation in Arabian Sea0.06 °C/decade
SST variation in Northern Hemisphere0.045 °C/decade
Air temperature variation over Red Sea0.037 °C/decade
(0.26 °C/decade since 1985)
Air temperature variation over Gulf of Aden0.061 °C/decade
Air temperature variation over Arabian Sea0.061 °C/decade
Air temperature variation over Northern Hemisphere0.063 °C/decade
Variation in net air–sea heat flux to Red Sea−0.191 W/m2/decade
(1.93 W/m2/decade since 1985)
Variation in net heat transport to Red Sea0.15 W/m2/decade
Correlation coefficient of SST anomalies between Red Sea and Gulf of Aden0.72
Correlation coefficient of SST anomalies between Red Sea and Arabian Sea0.7
Correlation coefficient of SST anomalies between Red Sea and Northern Hemisphere0.71
Correlation coefficient of SST anomalies between Gulf of Aden and Arabian Sea0.85
Correlation coefficient of SST anomalies between Gulf of Aden and Northern Hemisphere0.77
Correlation coefficient of SST anomalies between Arabian Sea and Northern Hemisphere0.89
Correlation coefficient between SST and air temperature anomalies of Red Sea0.84
Publisher’s Note: MDPI stays neutral with regard to jurisdictional claims in published maps and institutional affiliations.

