1. Introduction
As the dominant mode of interannual variability for tropical air–sea interactions [
1,
2], the El Niño Southern Oscillation (ENSO) can have a significant impact on the global climate and social economy [
3,
4]. Additionally, ENSO has become the most effective forecasting factor for short-term climate predictions, such as for Asian monsoons [
5]. Therefore, accurate ENSO predictions are very important. Many ENSO prediction studies have been performed in recent decades and significant progress has been made [
6,
7,
8,
9,
10,
11]. Based on these achievements, many climate agencies are now using a variety of dynamical and statistical methods for short-term climate predictions [
12,
13]. Because of the diversity of ENSO and the so-called spring predictability barrier, accurate and real-time forecasting of ENSO remains a major challenge [
14,
15,
16,
17,
18]. For example, some ENSO forecast models failed to predict the La Niña evolutions during 2011/2012 and 2021/2022, which re-intensified during the second year [
18,
19]. These were consecutive two-year La Niña events and are referred to as “second-year cooling La Niña events” [
20,
21].
After 1980, certain La Niña events had a tendency to persist and reappear for consecutive second-year cooling [
22,
23], and these consecutive La Niña events have occurred more frequently in this century. The evolutions of these second-year cooling La Niña events are very interesting, because the multi-year cooling event occurs against a warm climate background. The frequent occurrence of these events is incompatible with the theory of the recharging and discharging oscillatory ENSO cycles [
24]. The relationship between entrainment temperature in the mixed layers and sea level in the Intermediate Coupled Model (ICM) clearly indicates that thermocline feedback was the key factor influencing the second-year cooling in 2011 [
19]. Hu et al. [
20] proposed two preconditions for the occurrence of consecutive La Niña events: first, the previous La Niña must be a strong event; second, there must be an eastward propagating downwelling warm Kelvin wave during the previous La Niña decay phase. Wang and Yang [
25] studied the response of the equatorial ocean to the subtropical Pacific sea surface temperature (SST) anomaly and explored the decisive role that air–sea coupling in the subtropical SST anomaly has on the equatorial thermocline. Zheng et al. [
21] demonstrated that subsurface cold-water intrusion and southern wind in the South Pacific played an important role in the “double-dip” cooling event in 2011. Tropical eastern Pacific wind stress and subsurface thermal anomalies were responsible for the generation and maintenance of the second-year cooling of the 2017/2018 La Niña event [
11]. However, the mechanisms underlying decadal changes in ENSO are still unclear. La Niña events were observed in 2020/2021 and 2021/2022, which makes 2020–2022 a consecutive two-year La Niña event [
26,
27]. In terms of the 2021 sea surface temperature (SST) evolution in the eastern equatorial Pacific, the local cooling effect in the east played a more critical role than the warming effect from the west. In particular, there was a lack of satisfactory explanations for the evolution of the recent consecutive two-year La Niña event in 2020–2022 [
18].
Previous studies have demonstrated that ENSO is not only related to changes in SST and surface trade winds, but it is also expressed as changes in subsurface variability [
21,
28]. Moreover, the changes in the ocean subsurface layer provide the mechanism for ENSO to move from one phase to another [
29]. The onset of La Niña is controlled by slowly propagating variations along the thermocline; this boundary divides the upper warm water from the deeper cold water [
23]. In this study, to illustrate the causal mechanisms for the second-year cooling of the 2021/2022 La Niña, we present a detailed analysis of the atmospheric and oceanic processes associated with the evolution of the 2021/2022 La Niña event. This work focuses on the role of off-equatorial subsurface temperature anomalies in the tropical Pacific by analyzing the evolution of the temperature at thermocline depths. As subsurface temperature anomalies have a tendency to propagate along isothermal surfaces, we adopted three-dimensional (3D) temperature fields for the isothermal analysis. This allows for a better characterization of the temporal evolution and 3D structure of the upper ocean.
The remainder of this paper is organized as follows.
Section 2 presents the data and methods. The evolution of the 2021/2022 La Niña event is shown in
Section 3.
Section 4 illustrates the process of off-equatorial subsurface cold-water incursion across the equator. Finally, the conclusions are presented and discussed in
Section 5.
3. The Evolution of the 2021/22 La Niña
This section characterizes the tropical Pacific atmospheric and oceanic evolution for the 2020–2022 consecutive two-year La Niña event by analyzing the GODAS and NCEP data. The 2020/2021 La Niña event began in August 2020 and decayed to neutral conditions in the spring of 2021, with the peak value of the Niño 3.4 index being below −1.0 °C in October 2020 [
35,
36].
Figure 1 displays the annual evolution of the monthly mean SST, SL, zonal and meridional wind stress (Taux and Tauy), and thermocline depth anomalies in the equatorial Pacific (averaged at 2° S–2° N) in 2020. From January to April 2020, the predominance of the southeasterly wind anomaly in the central equatorial Pacific prevented the strengthening of westerly winds over the warm pool. Subsequent easterly wind anomalies over the whole equatorial Pacific further triggered strong oceanic upwelling Kelvin waves, driving the development of 2020/2021 La Niña events (
Figure 1c,d). Significant cold water propagated eastward with the upwelling Kelvin wave, corresponding to the negative SL and shallower thermocline depth in the central-eastern equatorial Pacific (
Figure 1b,e). Negative SST anomalies gradually intensified through the end of 2020 after the subsurface cold water reached the surface of the eastern tropical Pacific (
Figure 1a). This is a clear and typical La Niña event development process, which is consistent with the ENSO theory of ocean–atmosphere coupling.
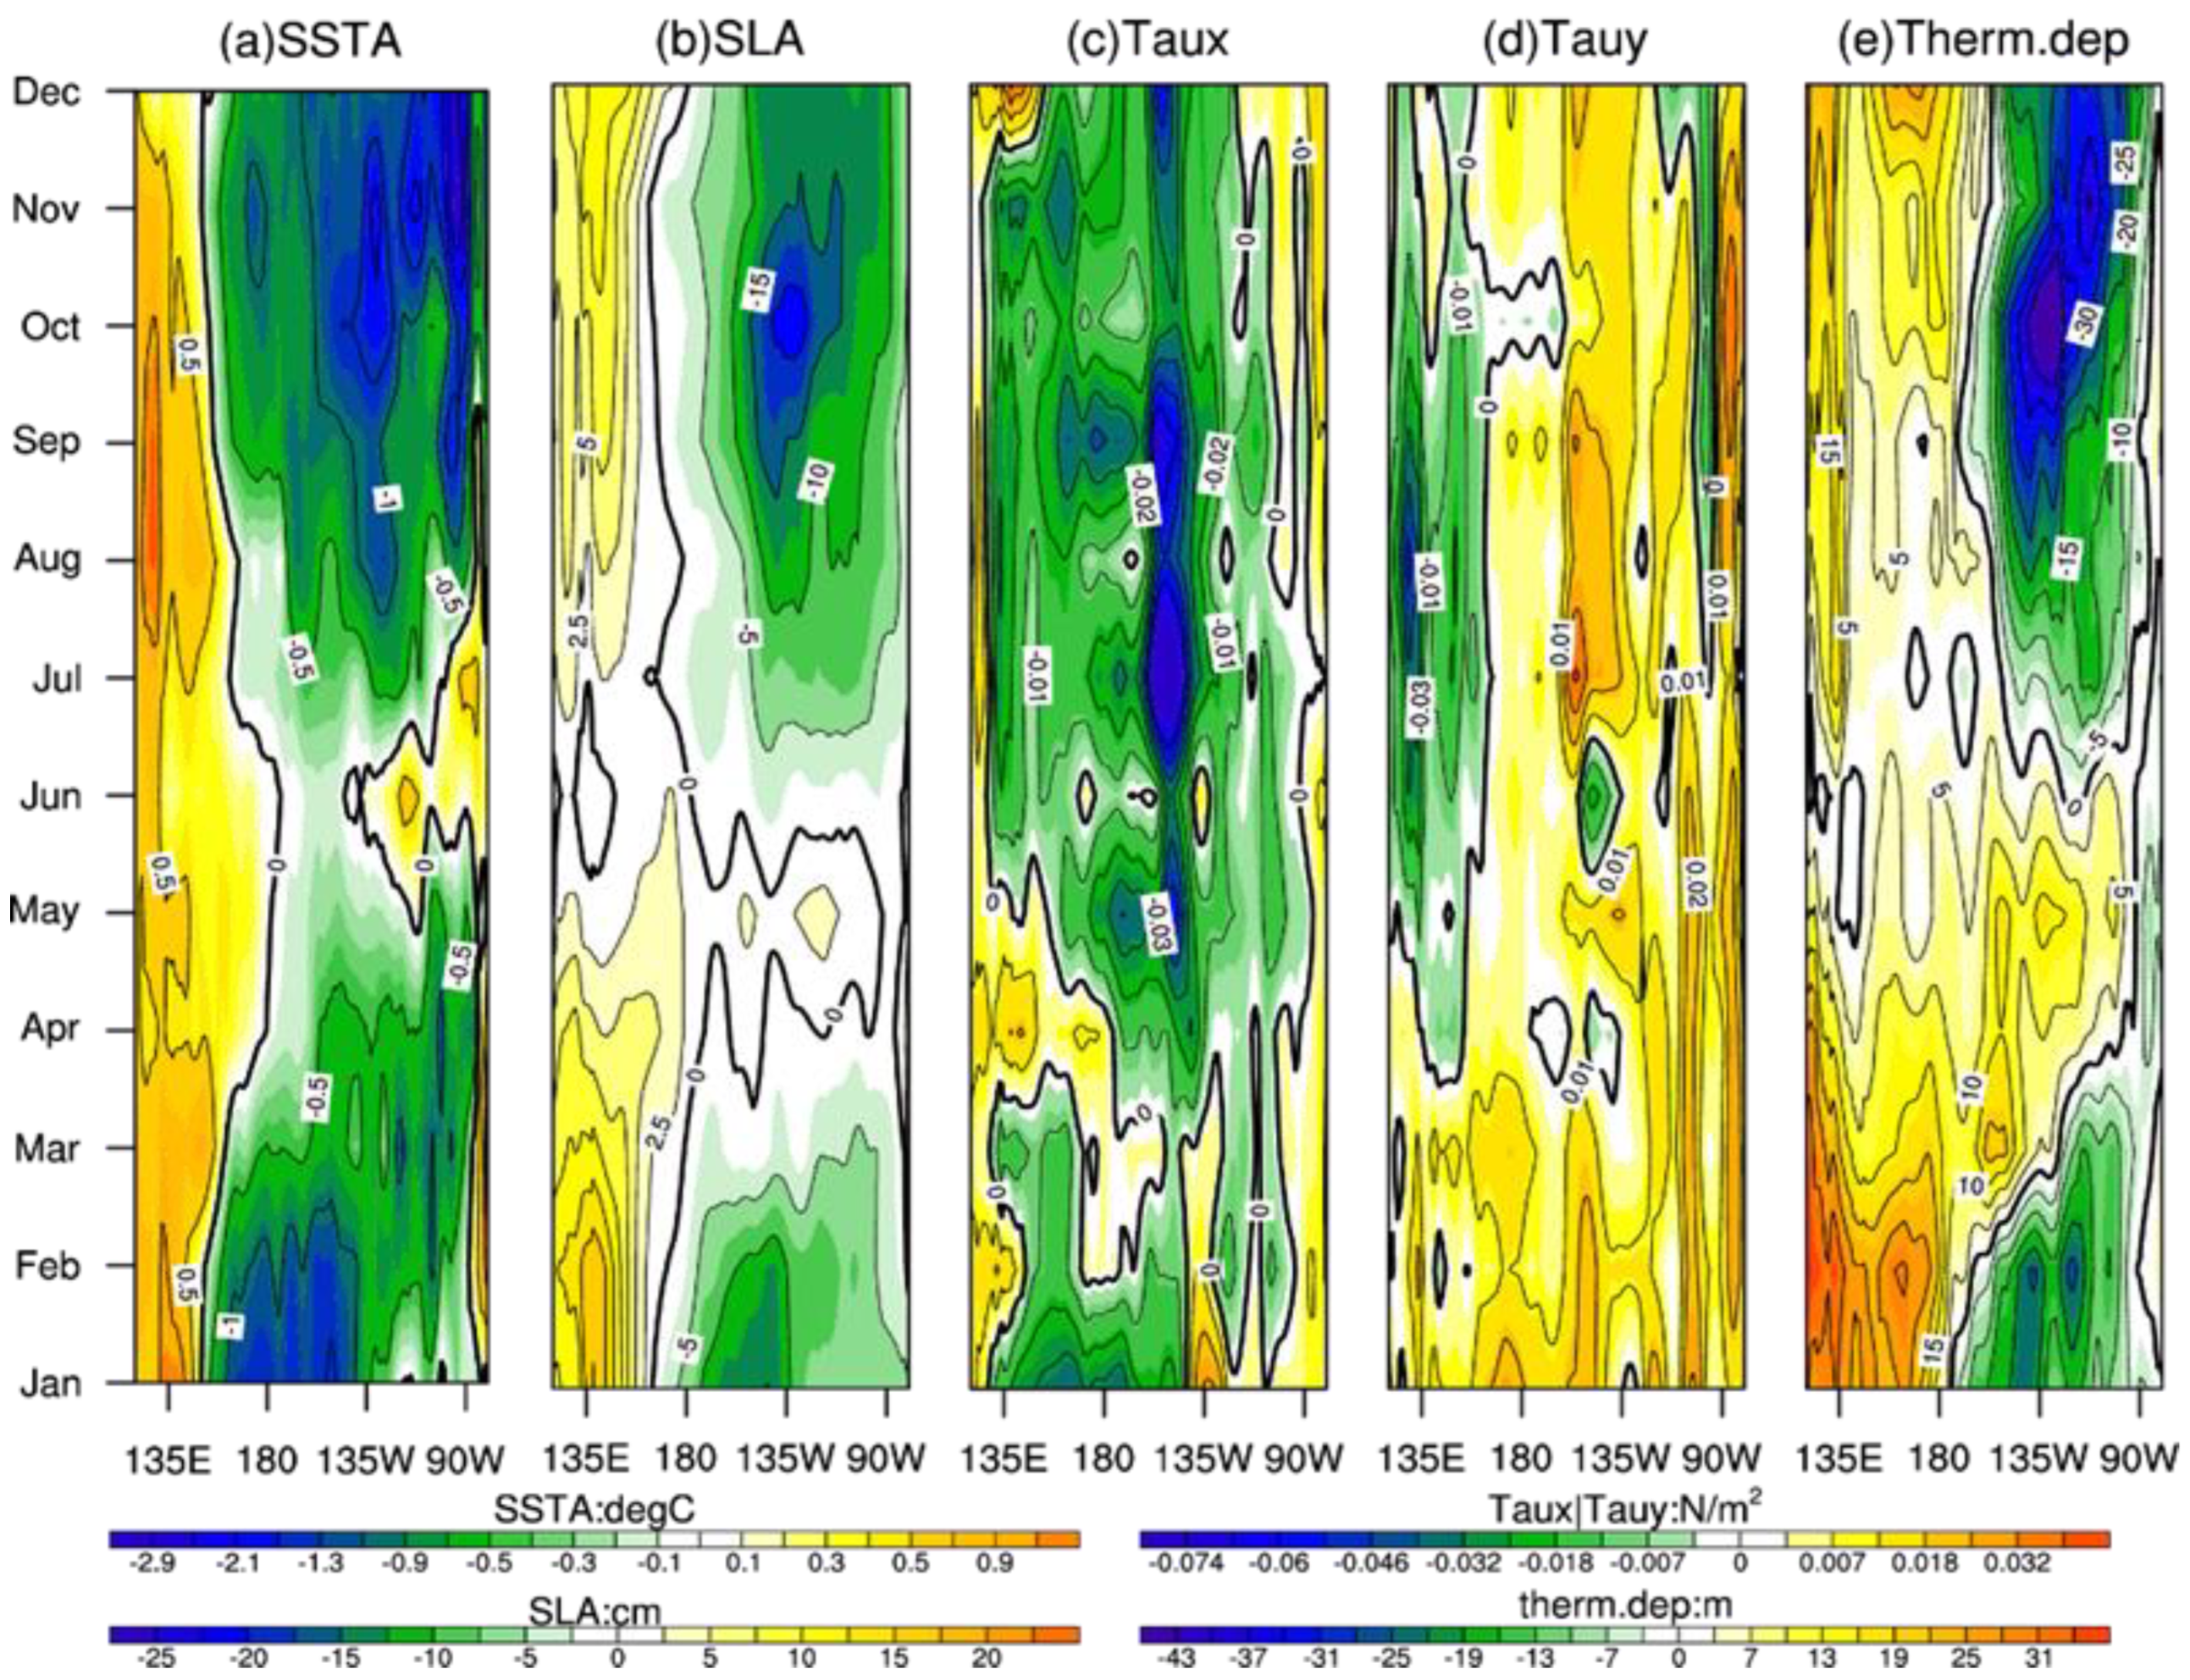
The equatorial Pacific SST was anomalously cold in early 2021 and then decayed to neutral conditions in the spring season of 2021, and the cold conditions returned again in the second half of 2021 (
Figure 2a). In terms of SST variability, the central-eastern equatorial Pacific generally experienced cold–warm–cold conditions throughout 2021. The turning point of the second-year cooling occurred in June 2021. Corresponding to the characteristics of the SST anomalies, the SL and thermocline depth anomalies over the central-eastern equatorial Pacific showed a similar pattern of variability (negative–positive–negative) (
Figure 2b,e). The zonal and meridional wind stresses, which corresponded to the easterly and southerly anomalies, respectively, demonstrated a southeasterly wind anomaly that prevailed in the central-eastern equatorial Pacific (
Figure 2c,d). From January to May 2021, the positive thermocline depth anomalies in the equatorial Pacific represented the downwelling Kelvin wave (
Figure 2e). The pronounced warming process in the central-eastern equatorial Pacific occurred in the first half of 2021, concurrent with the eastward propagation of the Kelvin wave (
Figure 2a). However, when the Kelvin wave reached the eastern boundary of the tropical Pacific, the warming process in the central-eastern equatorial Pacific stopped and transitioned into a cooling process.
To better understand the evolution of SST anomalies in 2020,
Figure 3 shows the spatial distribution of SST anomalies in the tropical Pacific during selected months. From January to April, the area of positive SST anomalies in the tropical Pacific gradually shrank, with a cold SST signal in the eastern equatorial Pacific (
Figure 3a–c). In May, negative SST anomalies prevailed along the equator between 170°–90° W. Thereafter, the cold water spread westward and intensified dramatically, and cold water occupied the tropical central-eastern Pacific over the following months.
Figure 4 presents the spatial distribution of SST anomalies in the tropical Pacific during the selected months of 2021. The energetic period of the 2020 La Niña event lasted until January 2021, and cold SST anomalies prevailed in the tropical Pacific with a minimum of less than −1.5 °C along the equator between 180°–150° W (
Figure 4a). From March to May, the area of cold SST anomalies in the tropical Pacific gradually shrank, with warm SST signal appearing in the eastern equatorial Pacific (
Figure 4b–d). Therefore, neutral SST conditions in the eastern equatorial Pacific were established before June 2021 (
Figure 4e). Additionally, the cold SST anomalies persisted in the off-equatorial Pacific regions, particularly in the tropical southeast Pacific. Subsequently, the area of positive SST anomalies in the eastern equatorial Pacific gradually disappeared and was occupied by cold water over the following months to start a second-year La Niña event (
Figure 4f–h).
Compared with the temperature at the surface layer, the subsurface layer variability is the best indicator for studying ENSO.
Figure 5 shows the spatial distribution of interannual temperature and ocean current anomalies at the thermocline depth. Different from the SST anomalies, in January, the warm and cold subsurface waters were located in the tropical western and eastern Pacific, respectively, separated at 170° W (
Figure 5a). From February to April, the warm water at the thermocline depth in the tropical western Pacific began to spread eastward along the equator before eventually occupying nearly the entire equatorial Pacific (
Figure 5b,c). In May, the eastward propagation of warm water along the equator in the tropical western Pacific weakened, and the subsurface cold water persisted in the off-equatorial region of the eastern Pacific. In June, there was an unexpected occurrence of cold water in the equatorial region between 115°–125° W, which then interrupted the eastward propagation of warm water along the thermocline (
Figure 5e). Subsequently, the negative temperature anomalies at the thermocline depth gradually intensified in the tropical central-eastern Pacific through autumn 2021 (
Figure 5f–h). In terms of the ocean current field at the subsurface layers, the ocean current originating from the tropical southeast Pacific showed a prominent northwestward propagation feature in June, transporting cold water to the equator and mixing with the subsurface layer of cold water in the tropical north Pacific. Thus, compared with the SST anomalies, the temperature anomalies at the subsurface layers could provide a clearer reflection of the evolution of the second-year cooling La Niña event, in which the ocean current played a crucial role.
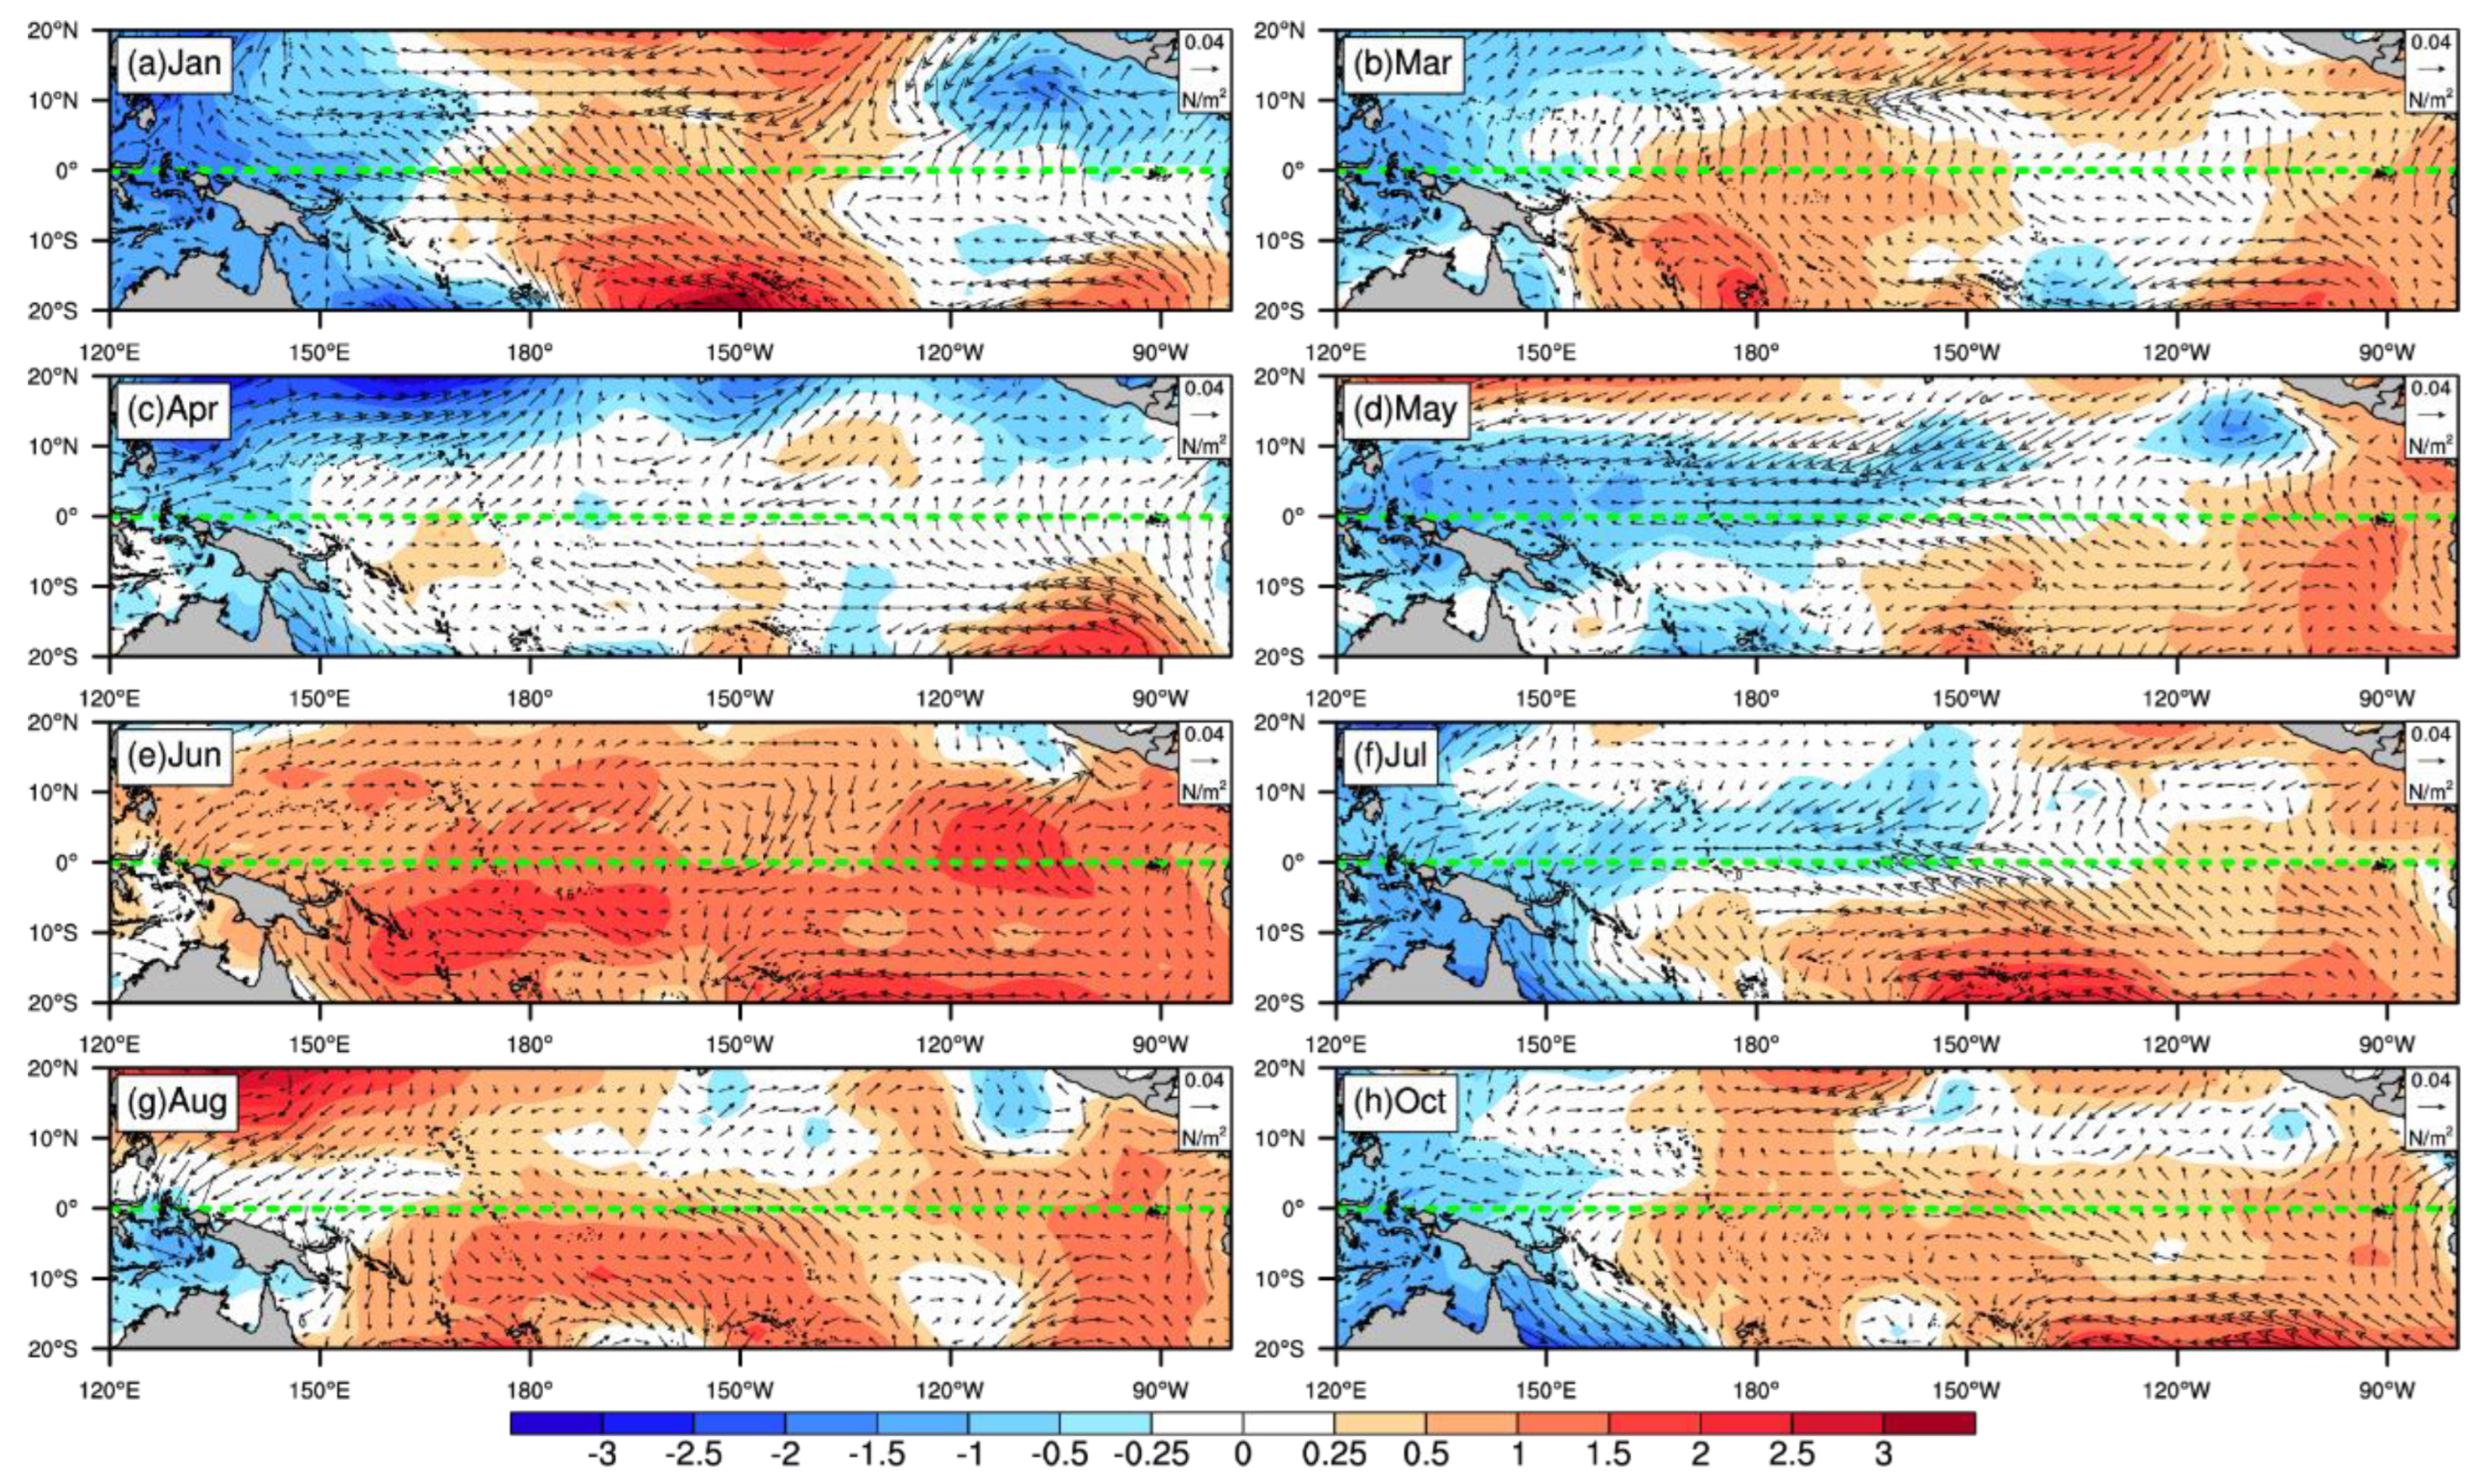
Because the evolution of atmospheric anomalies in the tropical Pacific plays an important role in ENSO development, the role of atmospheric components in the second-year La Niña event is analyzed in this section. Here, the horizontal distribution of annual SLP and wind stress anomalies are shown in
Figure 6. In January, similar to the distribution of negative SST anomalies, positive SLP anomalies were located in the tropical central Pacific. From March to May, the region of positive SLP anomalies occupied the tropical southeast Pacific, and southeasterly wind stress anomalies prevailed in the tropical southeast Pacific (
Figure 6b–d). The positive SLP anomalies occupied the entire tropical Pacific in June and persisted in the tropical central-eastern Pacific in the following months (
Figure 6e–h), which induced the anomalous wind stress divergence in this region and favored the upwelling of cold water from the subsurface to maintain the negative SST anomalies. Finally, southeasterly wind stress anomalies can cause surface cold water from the tropical South Pacific to flow northward across the equator.
4. The Process of Off-Equatorial Subsurface Cold-Water Incursion across the Equator
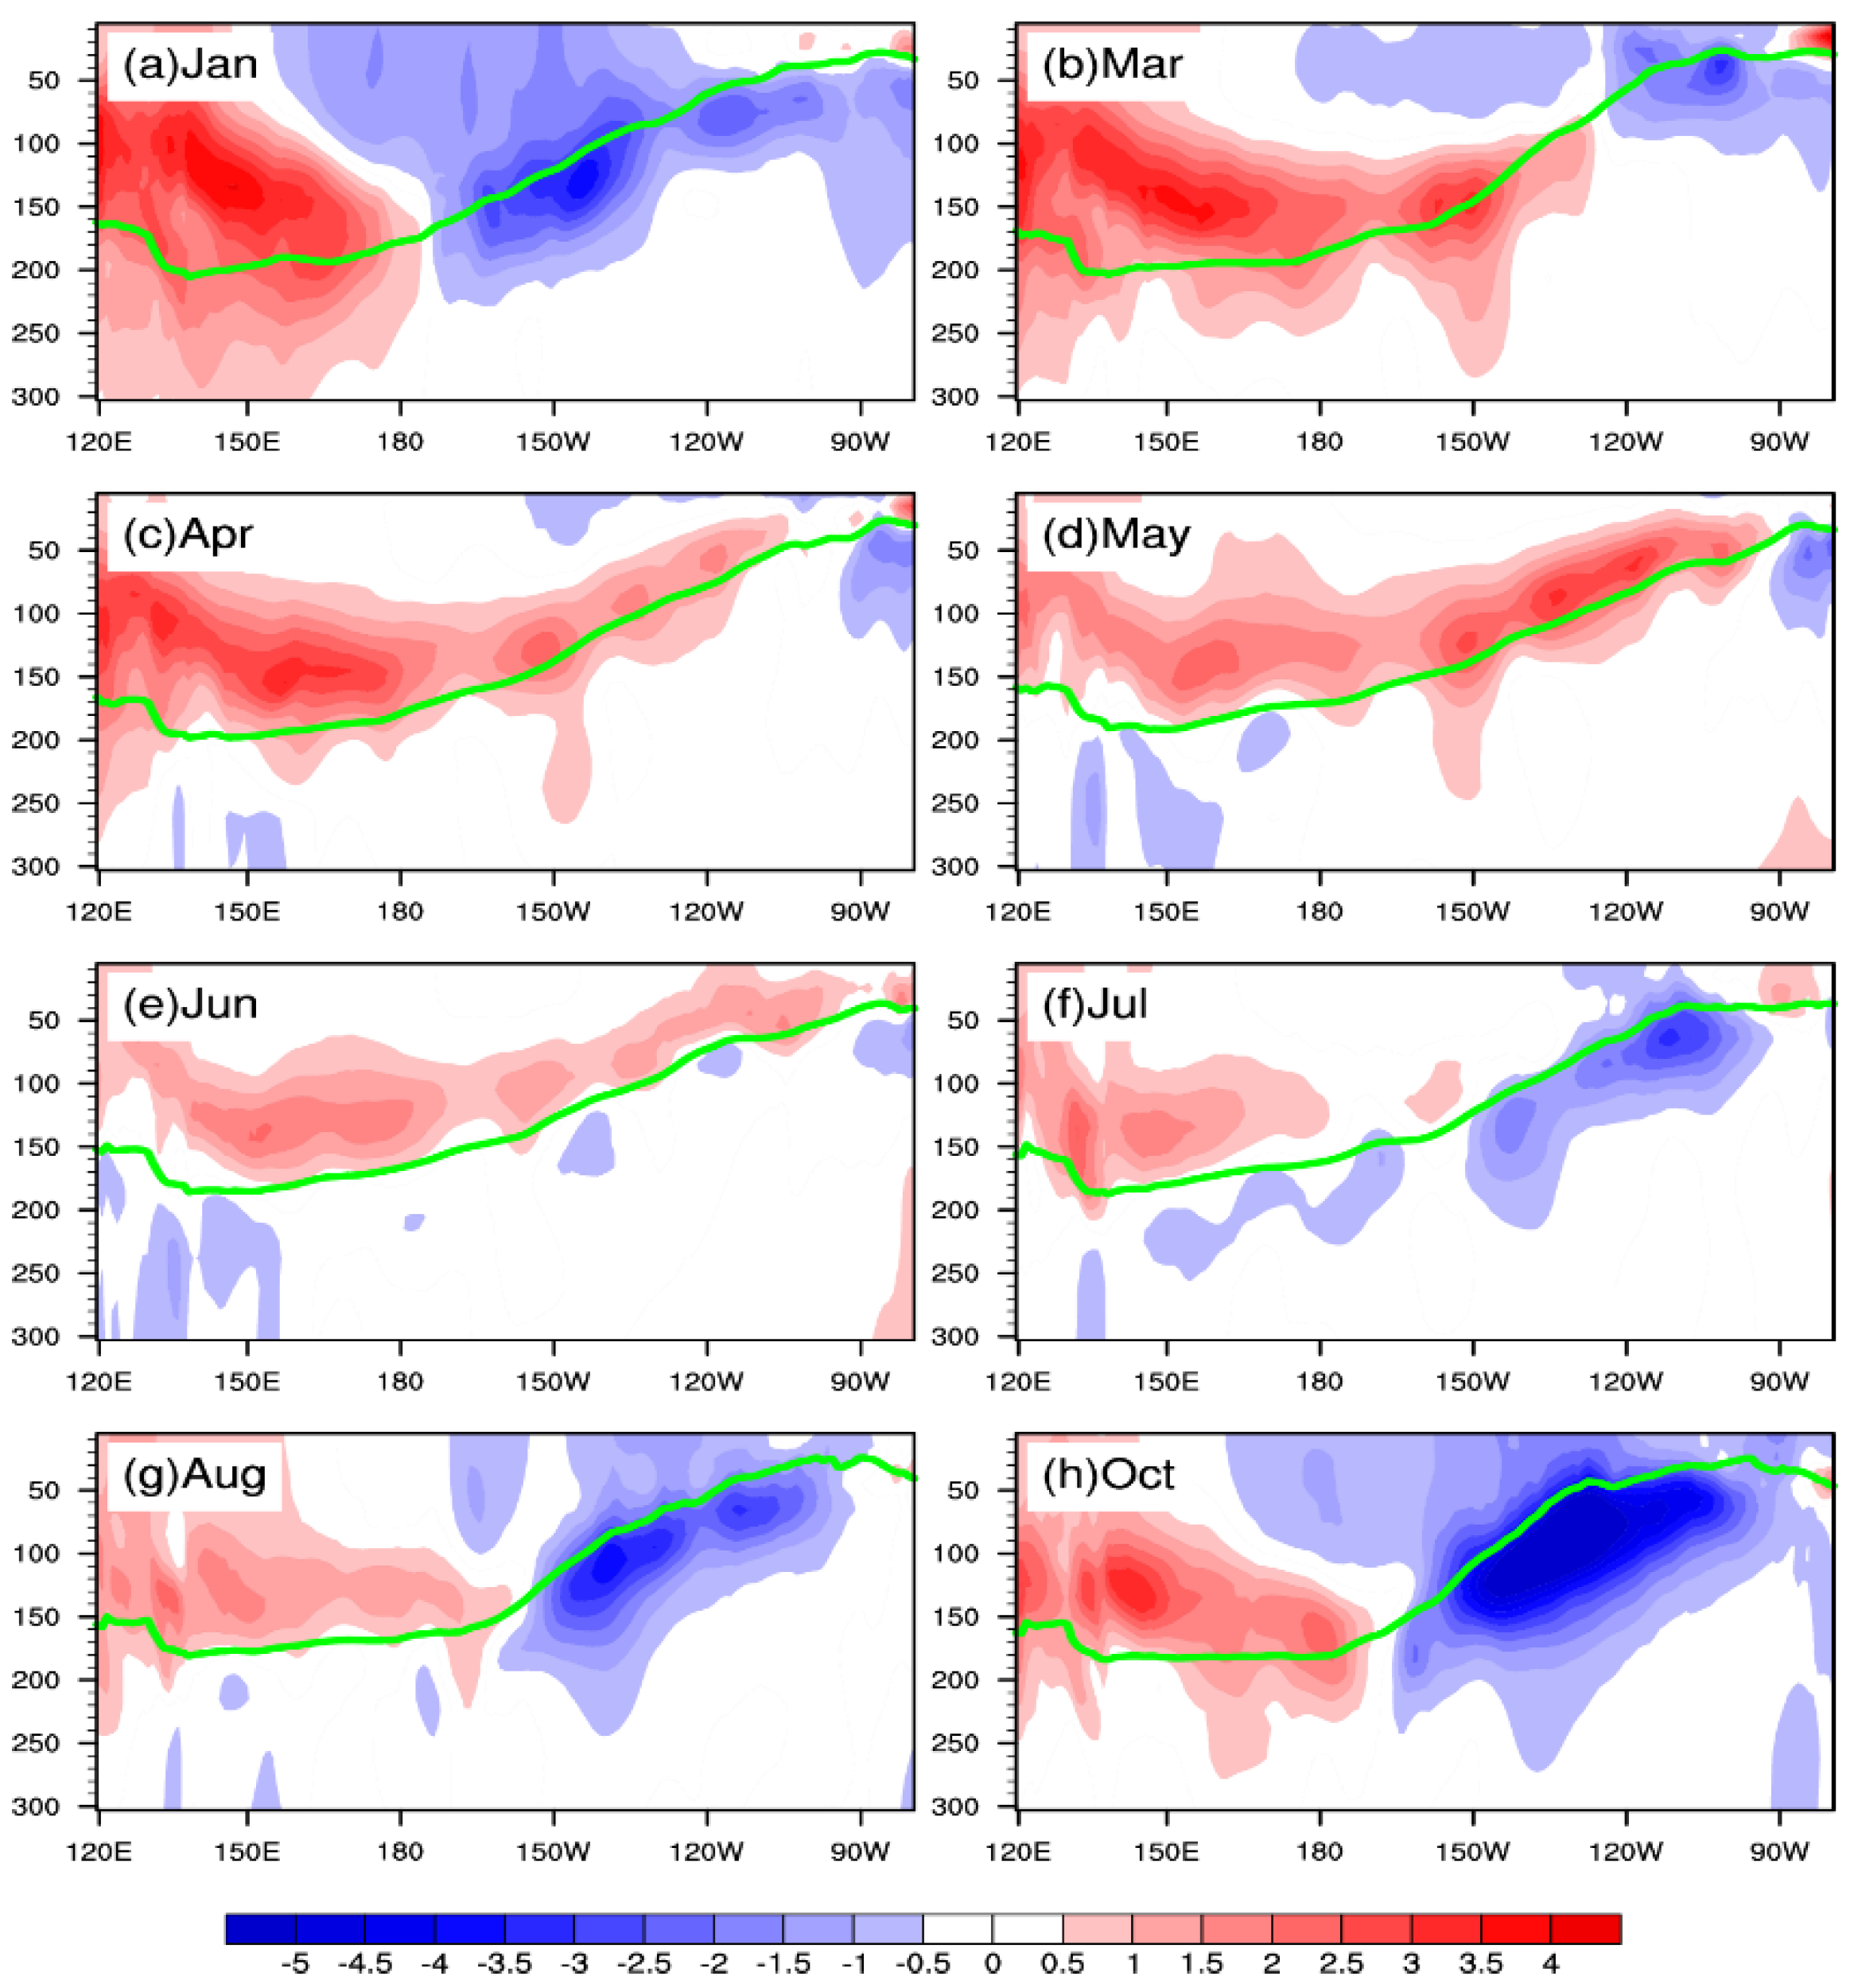
In this section, we focus on the developmental process of the off-equatorial subsurface cold-water incursion into the equatorial region. The vertical section of the annual equatorial Pacific temperature anomalies from the sea surface down to 300 m are shown in
Figure 7, which can reflect the heat exchange between the surface and subsurface layers. In January, the surface warm and cold waters were located in the tropical western and central Pacific, respectively. Similar to
Figure 5a, the positive temperature anomalies and negative temperature anomalies in the subsurface layer separated at 170° W. Subsequently, the cold surface temperature anomalies gradually weakened to a neutral condition, and the positive subsurface temperature anomalies propagated eastwards to occupy almost the entire equatorial thermocline (
Figure 7b–d). In June, cold water above the thermocline depth nearly disappeared in the equatorial Pacific region. However, an apparent cold center unexpectedly appeared at a thermocline depth at 120° W (
Figure 7e). From July to October, the cold-water region at the thermocline depth gradually increased and finally filled the upper 300 m of the central-eastern equatorial Pacific (
Figure 7f–h).
Consistent with the results of the analysis by Huang et al. and Zheng et al. [
21,
37], the climatological current with anomaly temperatures plays a more important role on the incursion region (2° S–0°, 122° W–110° W) cooling effect than the anomalous current with temperature anomalies.
Figure 8 displays the temperature tendency at the thermocline depth in the incursion region in 2021. The climatological current with anomaly temperatures is more consistent with the total temperature tendency. During the critical April–May–June timing for the onset of the second-year cooling La Niña event, the cooling effect has a significant effect on the temperature tendency. In contrast, the anomalous current with temperature anomalies for the temperature tendency is almost the opposite.
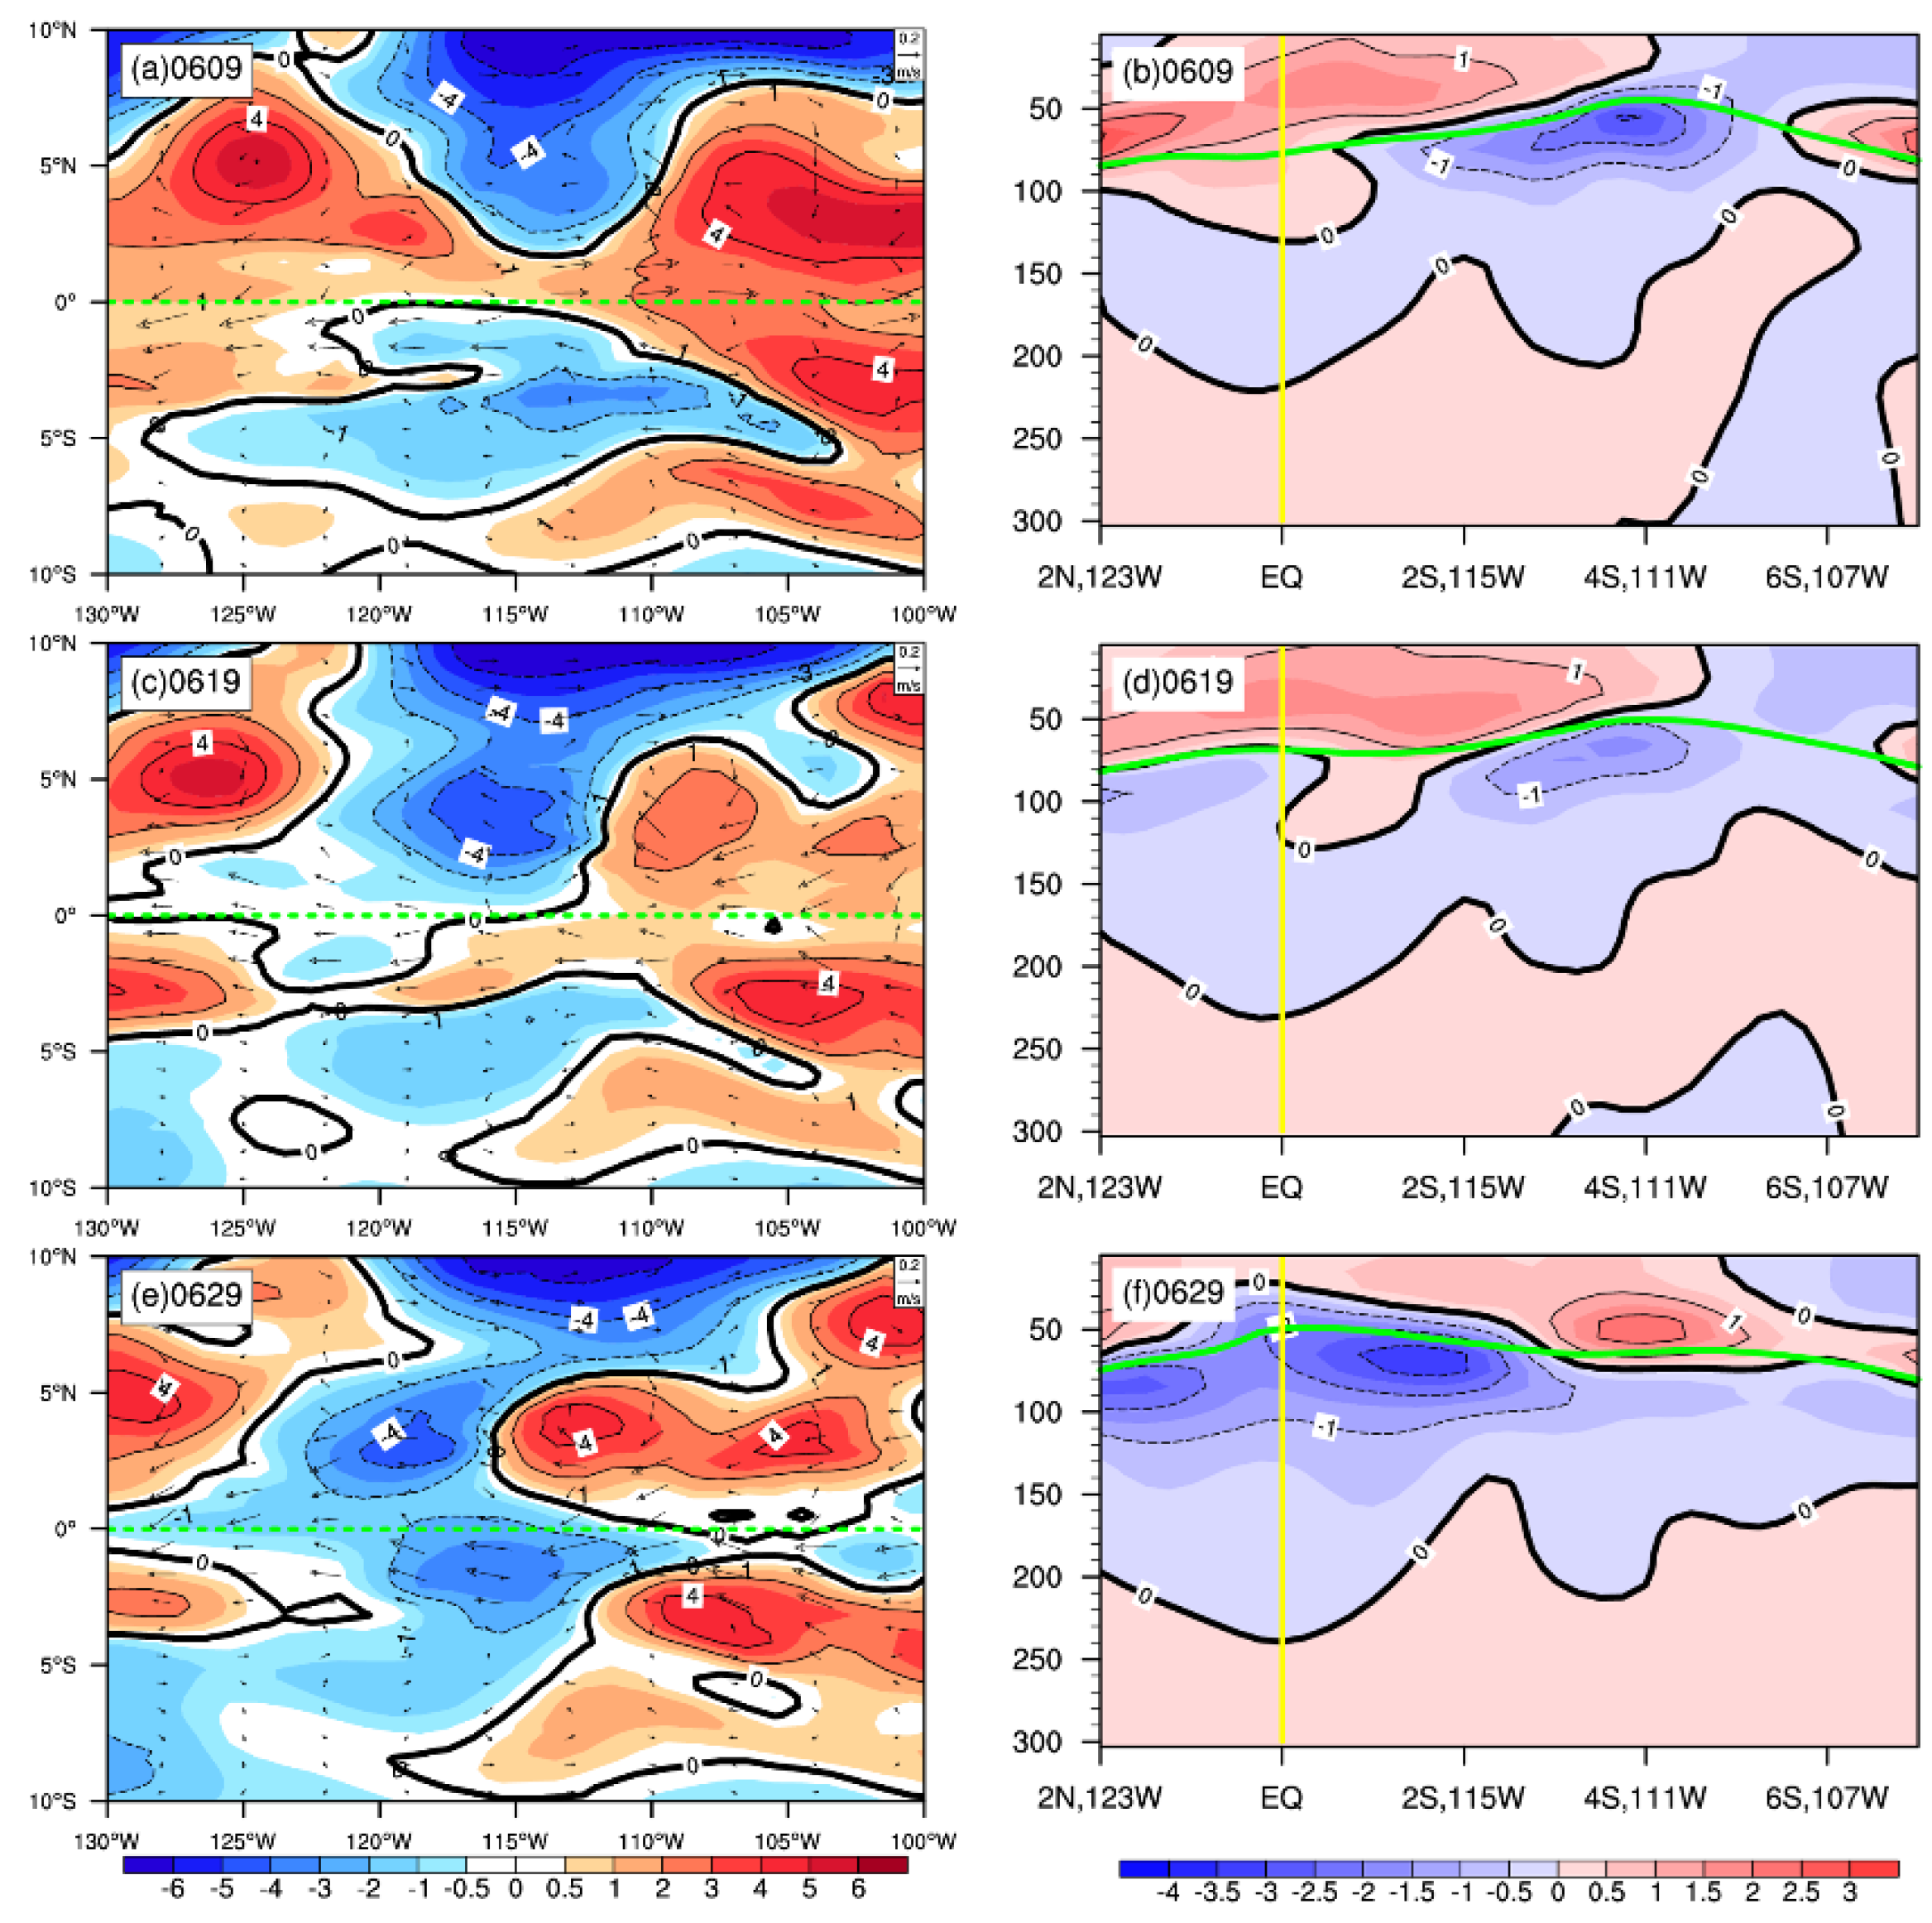
These analyses suggest that cold water from the off-equatorial regions invaded the equatorial region along the thermocline depth in June and then caused the second-year La Niña event in 2021. In this section, we examine the specific locations of subsurface sources of cold water. To further examine the incursion process, we analyzed the evolution of the temperature and ocean current anomalies in 9 June 2021 (the five-day mean of 5 June to 9 June), 19 June 2021 (the five-day mean of 15 June to 19 June), and 29 June 2021 (the five-day mean of 25 June to 29 June).
Figure 9a,c,e displays the horizontal distribution of the temperature and ocean current anomalies at a thermocline depth of a smaller area (10° S–10° N, 130° W–100° W) in the pentad-averaged periods of June 2021. The vertical distribution of the temperature anomalies (the upper 300 m) from (2° N, 123° W) to (7° S, 105° W) in the pentad-averaged intervals of June 2021 are shown in
Figure 9b,d,f. On 9 June 2021, the equatorial Pacific temperature had positive anomalies at the thermocline depth, with the tropical north and south Pacific dominated by negative anomalies. The subsurface layer ocean current originating from the tropical southeast Pacific showed a prominent northwestward propagation feature in which the transported cold water had reached the equator (
Figure 9a). At the thermocline depth, the oblique profile clearly revealed warm temperature anomalies north of the equator and cold temperature anomalies south of the equator, and similar to
Figure 8a, the cold water almost reached the equator (
Figure 9b). Thereafter, on 19 June 2021, cold temperature anomalies penetrated the equator at the thermocline depth, and equatorial warm temperature anomalies faded away at this point (
Figure 9c). Negative temperature anomalies south of the equator enter the equatorial region through horizontal advection along the thermocline, and then mix with negative temperature anomalies located north of the equator, with cold water occupying almost the entire oblique profile of the thermocline (
Figure 9d). Finally, on 29 June 2021, cold water dominated along the equator, preventing the onset of a warm event following the La Niña event and inducing the generation of the second-year cooling of the 2021/2022 La Niña event (
Figure 9e–f).
Atmospheric wind forcing is a significant factor that influences upper ocean cold water incursion [
21,
33].
Figure 10 presents the annual temporal evolution of the wind stress anomalies south and north of the equator in 2021. The southerly wind stress anomalies prevailed along the central-eastern tropical South Pacific in early 2021. From May to September, the southeasterly wind stress anomalies covered the south of the equator between 170°–110° W, which supported surface cold water from the tropical South Pacific northward across the equator (
Figure 10a).
Figure 10b shows the central-eastern tropical North Pacific occupied by southerly wind stress anomalies, which were not favorable to cold water incursion from the tropical North Pacific.
5. Conclusions and Discussions
The purpose of this study was to analyze the evolution of atmospheric and oceanic anomalies in the equatorial Pacific in 2020–2022 and to describe and illustrate the processes that led to the second-year cooling La Niña event of 2021 (
Figure 11). In particular, we found that subsurface cold-water intrusion and southeasterly wind anomalies in the tropical South Pacific played an important role in the generation and persistence of negative temperature anomalies in the central-eastern Pacific.
During 2020–2022, a consecutive two-year La Niña event occurred in the tropical Pacific, and there was a distinct difference between the two La Niña event development processes. The 2020/2021 La Niña endured from autumn 2020 to spring 2021 and had a shallower thermocline depth indicative of a strong oceanic upwelling Kelvin wave that was propagating eastward. This is a typical La Niña event development process, which is consistent with the ENSO theory of ocean–atmosphere coupling. After the first year of the 2020/2021 La Niña event, the warm layers of the subsurface water were located in the tropical western Pacific, conditions that were different from the SST anomalies, and then the warm water began to spread eastward along the equator and occupy nearly the entire equatorial Pacific during the first half of 2021. Meanwhile, neutral SST conditions in the eastern equatorial Pacific were established before June 2021. However, in the first half of 2021, significant cold water persisted at the surface and thermocline depth in the off-equatorial areas, which was more noticeable in the tropical South Pacific. In the months after June 2021, there was an unexpected occurrence of cold water in the equatorial region between 115°–125° W, which then interrupted the eastward propagation of warm water along the thermocline. Subsequently, the negative SST anomalies gradually intensified in the tropical central-eastern Pacific and led to a second-year La Niña event through autumn 2021.
Furthermore, this study demonstrates the roles that the off-equatorial subsurface cold-water incursions play in the equatorial region. The turning point of the second-year cooling event occurred on June 2021, following the first year of La Niña conditions in 2020. The negative SST anomalies and positive SLP anomalies occupied the tropical southeast Pacific, which strengthened southeasterly wind stress anomalies from the tropical South Pacific northward across the equator. Subsequently, the ocean currents originating in the subsurface layers of the tropical southeast Pacific showed a prominent northwestward propagation feature that transported cold water across the equator before mixing with the cold subsurface water in the tropical north Pacific.
This work mainly illustrates the causal mechanisms for the second-year cooling event of the 2021/2022 La Niña. The results of this study can be used to provide guidance on the predictions of the atmosphere–ocean coupled model, and the assimilation of accurate atmospheric and oceanic subsurface data into coupled models clearly facilitates the predictions of these second-year cooling events [
38]. However, other two-year consecutive La Niña events have occurred for a variety of reasons. For example, there were no significant off-equatorial intrusion processes in 2000, and subsurface cold-water intrusions into the North Pacific and South Pacific occurred in 2008 and 2011, respectively [
21]. Hence, the similarities and differences between these two-year consecutive La Niña events require further analysis in order to investigate the relationship between the evolution of La Niña and the decadal modulation of ENSO.


