Abstract
The dynamic process of the wetland can reflect its impact on the environment, and finding a balance point supporting harmonious coexistence between man and nature has become an issue of increasing concern. On the basis of previous studies that have focused on local coastal wetlands, the temporal and spatial changes and driving forces of wetlands in the Yancheng coastal area from 1991 to 2021 were analyzed over a larger area. According to the study findings: (1) The results of the study of the Yancheng coastal wetland with a larger scope differed significantly from findings resulting from a study of coastal wetland only. This difference was mainly reflected in the relatively stable situation of wetland ecology as a whole, while the changes in local surface features were more significant. (2) Natural wetlands were transformed into artificial wetlands and non-wetland types, and artificial wetlands were transformed into non-wetland types; additionally, reverse transformations and internal transformations of surface features also took place. For instance, the saltpan was transformed into mudflats (86.26 km2), and some mudflats into herbaceous vegetation (193.47 km2). (3) When analyzing the impact intensity of human activities on the Yancheng wetland, it was found that this factor has experienced a process of first rising and then falling. The index was 0.650, 0.653, 0.664, 0.661, and 0.641 in 1991, 2000, 2008, 2016, and 2021, respectively. (4) Lastly, an analysis of factors driving wetland change revealed that human factors were the most critical reasons for wetland landscape change. Our work can play a reference and inspiration role in the monitoring and protection of similar coastal wetlands.
1. Introduction
The wetland ecosystem plays a significant role in the global ecosystem [1]. The role of purifying the Earth’s environment is reflected in the vital influence on the composition of the atmosphere, which can absorb carbon dioxide and release oxygen at the same time [2]. Wetlands can be used directly as water resources and are an integral part of the water circle, supplementing groundwater. The efficacy of wetlands has a positive effect on the control of floods and soil desertification [3]. Wetlands also make an essential contribution to protecting biodiversity, providing favorable habitats for birds and amphibians, which is of extraordinary significance for enriching biodiversity and providing the energy and food needed for human survival [4,5]. With population growth and rapid urban development, the conflict between people and land has become increasingly prominent. As a significant reserve land resource, wetland is of great significance in alleviating the conflict between people and land during the process of rapid urbanization. With the proposal and promotion of the “The Belt and Road Initiative” strategic plan [6], coastal development is gradually advancing from south to north, and the urbanization process in China is accelerating. Human activities are becoming increasingly intense. As a result, the land cover pattern of the coastal zone has undergone tremendous changes, leading to a series of ecological and environmental problems, such as coastal erosion, wetland reduction, and coastal water quality deterioration [7,8,9], which to some extent restricts the sustainable development of China’s social economy and the scientific implementation of the land-sea overall planning strategy. Wetland is located in a sensitive and fragile environment. In the sea–land ecotone, which is vulnerable to natural changes and human activities, the quantitative study of the change characteristics and landscape change pattern of human activities in wetland areas under the influence of rapid urbanization is of great significance, offering the potential to provide strong support for the implementation of national strategic plans related to wetland resources [10].
The Yancheng wetland is located in the eastern Jianghuai Plain of northern Jiangsu Province. It is the largest coastal wetland in the Asian continental margin and a vital component of the muddy plain beach in China. The region is rich in biodiversity, with crisscrossed by rivers and dense water networks that have a significant radiation effect on the coastal wetland ecosystem of Jiangsu Province. In 2019, it was listed as a World Natural Heritage Site. It has the reputation of “Wetland Capital.” However, the rapid development of the global economy has brought with it severe ecological and environmental problems, intensifying the conflict between human activities and the natural ecology. As a province that plays a major role in China’s economy, Jiangsu has always been at the forefront of the country’s development. Meanwhile, the Yancheng wetland serves as a protective barrier for Jiangsu’s ecosystem, highlighting the urgent need to strengthen the monitoring and protection of this natural area [11]. In the first place, humans have directly transformed areas in the interest of the continuing advance of progress, which represents the main reason for the loss of historical and contemporary coastal wetlands [12,13]. Although, historically, the agricultural transformation was responsible for the loss of wetlands, urbanization has become the main factor currently leading to wetland transformation. Rapidly expanding metropolitan areas create conditions whereby wetlands can be extensively invaded, fragmented, and destroyed by nonnative species [14]. Research has shown that wetland loss due to development is three times greater in coastal areas than inland areas [15]. Many existing studies have focused on various coastal wetlands in the Yancheng area, but an overall examination of a wider range of its extensive areas remains insufficient. For example, the research on the quantitative evaluation method of the driving force of Yancheng coastal landscape succession only studied coastal wetlands [16]. The exploration of the Yancheng coastal wetland landscape characteristics and ecological risk assessment [17], as well as the analysis of landscape grain effect in Yancheng coastal wetland, their study areas were also limited [18]. In this investigation, remote sensing analysis was carried out in six districts and counties, including Xiangshui County, Binhai County, Sheyang County, Tinghu District, Dafeng District, and Dongtai City. The research findings can contribute to understanding the temporal and spatial changes of the Yancheng wetland from a larger perspective than previous research that has confined its focus to the coastal wetlands.
Traditional wetland monitoring methods make it difficult to obtain large-scale, long-term series data, and the cost of such monitoring is high [19]; therefore, effective data collection methods are essential for monitoring the dynamic changes of wetland ecosystems [20,21]. In previous studies, researchers have widely used remote sensing technology in previous investigations of land use studies, such as land cover/land use classification in the study of the urban heat island effect. The classification results for the data yielded by this technological approach have allowed a deeper study of the relationship between land cover composition and urban heat islands [22]. Remote sensing satellite data, which offer such advantages as timeliness, wide-coverage, and relatively low cost, provide the main data source for dynamic wetland monitoring [23,24,25,26]. Combining remote sensing and GIS data and performing analyses substantially facilitates the study of the spatial change and evolution of wetland morphology. With the support of remote sensing monitoring and landscape evaluation methods, quantitative analysis of landscape patterns at a regional scale can reveal the changing laws of landscape patterns [27,28]. These techniques facilitate data analysis and produce results that can be used to develop and implement measures to protect wetlands and slow their degradation.
The human activity intensity evaluation method, which is based on the human interference index (Hemeroby index, HI), has been widely used to quantitatively evaluate the human activity intensity in different types of ecosystems, such as forests, grasslands, wetlands, and cities [29,30,31,32]. The theory of human interference was first proposed by Jalas to evaluate the impact of human activities on plants [33]. Later, this theory was expanded to the evaluation of forest and wetland ecosystems. Subsequently, Li et al. developed and translated the concept as “human interference degree.” The basic theory denotes regional land cover types, while the interference index is assigned to different types of human activities [34,35,36]. By definition, affected by the ecosystem coupling of land and sea, coastal zones that are experiencing rapid urbanization are also disturbed by the process of urbanization, demonstrating the typical characteristics of both urban and coastal vulnerability.
Over the past three decades, due to the increasing intensity of human activities, the pressure on the environment of the Yancheng coastal wetland has intensified, and the wetland landscape has changed dramatically. Quantitative analysis of wetland landscape is a necessary means to study this issue. Thus, for this investigation, the Yancheng coastal wetland area was selected as the research object. Based on the combination of spectral and textural features of random forest, the wetland landscape pattern was dynamically monitored with the help of remote sensing data and GIS spatial information processing technology. The observed changes in coastal wetlands were analyzed, and the relevant driving factors were assessed. On the assumption that the Yancheng wetland environment is greatly influenced by human factors, a series of studies and discussions are carried out. The main purposes of this study included the following: (1) performing a quantitative analysis of Yancheng coastal wetlands from 1991 to 2021, combined with an evaluation of human activity intensity during rapid urbanization; (2) evaluating the results of the wetland analysis and exploring the driving factors behind the observed changes.
2. Study Area
Yancheng City (32°34′–34°28′ N, 119°48′–120°56′ E) is located in the coastal area of the Jianghuai Plain in eastern China, which is generally characterized by loamy soil. The area includes a large number of muddy beaches, and the coastal beach area is 4553 km2, accounting for more than 25% of the city’s area. The coastline of the Yancheng coastal wetland accounts for 60% of the total coastline of Jiangsu Province, which is the largest prefecture-level city in Jiangsu Province and ranks eighth in the country. This city has the longest coastline and the broadest sea area in the province, which is known as the “land of fish and rice,” and is an important ecological treasure house and strategic zone for sustainable development in Jiangsu Province.
The wetland in this area belongs to the subtropical monsoon climate, with abundant annual precipitation and solar heat. The average annual precipitation in the city is more in the south and less in the north, and the annual distribution of precipitation is uneven [37]. Yancheng coastal wetland is rich in animal and plant resources. There are 47 species of mammals and 381 species of birds in the reserve, which accounts for 80–90% of the world’s total red-crowned cranes (Grus japonensis). It is the largest wintering place for red-crowned cranes in the world [38]; however, at the same time, the coast has been strongly affected by human activities, especially in the past 30 years. A series of ecological problems such as large-scale land reclamation, pollution, over-exploitation, and alien species invasion [37] has had a significant impact on biodiversity conservation. The area of the natural landscape is gradually decreasing. Great changes have taken place in the landscape pattern. The selected study areas include Xiangshui County, Binhai County, Sheyang County, Tinghu District, Dafeng District, and Dongtai City, which are the main distribution areas of the Yancheng wetland (as shown in Figure 1).
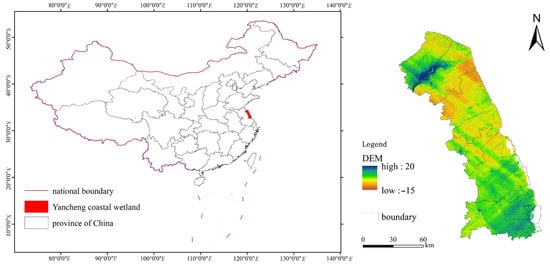
Figure 1.
Geographical location of the study area.
3. Materials and Methods
3.1. Datasets
In this study, Landsat TM and Landsat 8 OLI Collection 1 Level-2 surface reflectance data were obtained under clear and cloudless conditions. All images were downloaded from the United States Geological Survey (USGS) global visualization viewer (https://earthexplorer.usgs.gov/, accessed on 2 July 2021). As one image is not enough to cover the entire study area, two images were needed to combine. Considering the clear sky and cloudless conditions, if a constant time interval is adopted, some spliced images are unable to meet our requirements. A total of 10 scenes of imagery were selected from five individual years (i.e., 1991, 2000, 2008, 2016, and 2021). All images were acquired in winter and spring (between January and April) (as shown in Table 1).

Table 1.
Landsat images for wetland mapping.
When only Landsat spectral features are used for wetland classification, different objects may have the same spectral features, so only spectral features cannot distinguish wetland types [39,40]. In order to improve the accuracy of wetland recognition, we use two image enhancement methods: principal component analysis (PCA) and minimum noise fraction rotation (MNF). PCA can map the high-dimensional data to the low-dimensional space and expect the maximum information of the data in the projected dimension so as to use fewer data dimensions while retaining more characteristics of the original data points [41]. MNF is used to determine the intrinsic dimensionality of the image data, separate the noise in the data, and reduce the computational requirements in subsequent processing. MNF is essentially a double principal component transformation. The first transformation is used to separate and readjust the noise in the data, and the second step is the standard principal component transformation for noise whitening [42]. We perform PCA and MNF on Landsat images, respectively, and then extract the first two components of PCA (e.g., PCA1 and PCA2) and the first three components of MNF (e.g., MNF1, MNF2, and MNF3).
In addition to Landsat image enhancement, we also extract the texture features of PC1 and PC2, which have been proved to improve the classification accuracy of remote sensing images [43,44]. We use the gray level co-occurrence matrix (GLCM) to extract eight texture features for PCA1 and PCA2, which are mean, variance, homogeneity, contrast, dissimilarity, entropy, second moment, and correlation. When using the GLCM to extract texture features, it is necessary to set the gray level of the image, the size, and the direction of the moving window. According to the summary of previous scholars [43,45], when using Landsat images for classification, the greyscale quantization level is generally set to 64, the size of the moving window set to (7,7) and the orientation set to 45° [43,45].
According to the National standard of Wetland Classification in China, the national wetland classification system is divided into natural wetland and artificial wetland. The natural wetland is divided into two and three levels according to the geomorphological characteristics, hydrological characteristics and vegetation types of wetland, and the artificial wetland is divided into two and three levels according to its main uses. Considering the specific situation of the Yancheng wetland, we divided the land cover into construction land, vegetation, river system, farmland, aquaculture, salt pan, and tidal flat.
In order to accurately estimate different wetland types, it is necessary to select appropriate training samples before classification, and the selection of training samples will have an important impact on the classification results. We also had two times of fieldwork on 8–11 April and 9–12 July 2021 to take some samples and photos to verify our results of image classification. When we made visual interpretation, we used Google Earth history images to help us identify the types of land features, better classify them, and extract sample points of different wetland types. Different classifiers have different classification performances for different data. Multi-classifier fusion is to combine the advantages of different classifiers to obtain the best classification results. Among many machine learning algorithms, random forest (RF) can show its advantages when the feature space is complex and the data presents different distributions [46,47,48,49]. In this paper, RF is used to perform the fusion of multiple classifiers. RF is a machine learning algorithm commonly used in remote sensing image processing. It is suitable for multi-feature data classification or regression. It is an ensemble learning algorithm. By combining multiple weak classifiers, the final result is voted or averaged, which makes the result of the whole model has higher accuracy and generalization performance.
The information of a certain class () in a random forest can be defined as follows:
where is the information of the random variable and is the probability of occurring. Entropy is used to measure uncertainty, and the greater the entropy, the greater the uncertainty of this category.
In this study, we first used 100 trees, and then set the number of split variables to the square root of the number of features.
After RF classification, we selected verification points on Landsat images using the random point selection function in Arcgis10.2 (Esri, RedLands, America), classified the verification points using visual interpretation, and then deleted the verification points overlapping with the training samples (about 300 sets of verification points per year). Finally, the Kappa coefficient between the verification point and the classified image was calculated to verify the classified image.
3.2. Assessment of Human Activity Impact Intensity
The index of human disturbance degree can be divided into “no disturbance,” “half disturbance,” and “full disturbance” according to the disturbance degree of the land cover type and landscape. The classification is based on the land cover classification system of the urban ecosystem and the characteristics of land cover classification of coastal cities in the period of rapid urbanization [29,30,31,32]; we refer to the classification system of coastal zone ecological elements based on the change of ecological service value, combined with the classification of land use degree and the contribution rate of ecosystem service variation of each cover type proposed by Zhuang et al. [50]. From the ecological point of view, the coastal zone landscape types are divided into positive ecological elements and negative ecological elements, and the positive ecological elements include “non-interference” and “semi-interference”. For example, wetland, woodland, garden plot, grassland, and cultivated land have a positive impact on the environment, while negative ecological elements are “total interference”, such as bare soil, traffic land, residential land, industrial land, and some others.
Based on the landscape type classification system of ecological disturbance index, the multiple-assessment method of human activity impact intensity is constructed:
is the sum of the comprehensive index of human activity impact intensity of positive ecological elements () and the comprehensive index of human activity impact intensity of negative ecological elements (), where is the ecological interference value of each landscape type in the positive ecological element type multiplied by the corresponding ecological interference weight of the landscape type; is the ecological interference value of each landscape type in the negative ecological element type multiplied by the ecological interference weight corresponding to the landscape type (see Formula (2) for details). In theory, the larger the area of positive ecological elements is, the greater the ability to resist external interference is, while the larger the area of negative ecological elements is, the stronger the ability to resist external interference and influence is.
4. Results
We got the results after classifying the images. In Figure 2, we used the Kappa coefficient to show the accuracy of classification. Accuracies of different landscape types were proved to be higher than 88%, which indicates that our classification results are accurate.
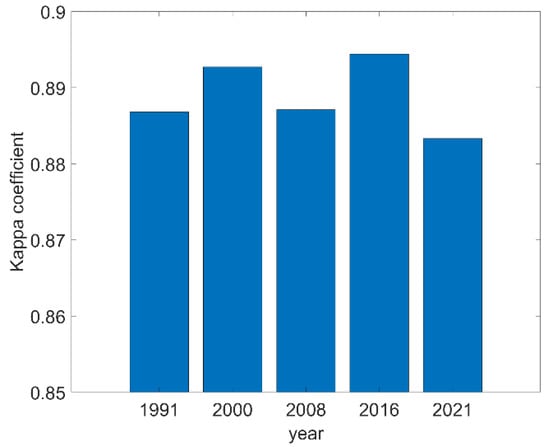
Figure 2.
Accuracy of wetland classification.
4.1. Land Use Change Analysis
According to the research results shown in Table 2 and Figure 3, over 30 years from 1991 to 2021, the overall spatiotemporal pattern of natural wetlands and artificial wetlands in the six coastal districts and counties of Yancheng has changed greatly. Notably, this finding differs from the previous local analysis of coastal wetlands. It can be seen from Table 1 that the area of natural wetland (water system, herbaceous marshes, and mudflats) experienced an ongoing decrease from 1430.83 km2 in 1991 to 1416.67 km2 in 2000 and 1160.52 km2 in 2008; however, 2016 and 2021 saw an upward trend due to the continuous growth of herbaceous wetlands. Examining the changes in the area for the individual components that make up the wetlands provided an interesting insight into the nature of the changes that were occurring during the period under consideration. Specifically, the area of the water system increased slightly from 324.23 km2 in 1991 to 472.31 km2 in 2021. In contrast, the area featuring mudflats decreased from 898.90 km2 in 1991 to 455.71 km2 in 2021. In terms of artificial wetlands, the area of salt fields increased from 1991 to 2000, then began to decrease, followed by a sharp decrease from 2008 to 2016. This latter change was related to the development of the salt industry in the Yancheng area, and the trend continued, leaving only a small area of salt fields by the time the 2016 and 2021 observations were made. Even as the area of the salt pan decreased, the area occupied by breeding farms began to rise. Summing the two reveals that the area of artificial wetlands has remained generally stable, with the salt pan area gradually being replaced by the breeding farm area. Among the non-wetland areas, the area of cultivated land decreased from 9379.15 km2 in 1991 to 6536.63 km2 in 2021. Similarly, the decrease in the cultivated land area was accompanied by an increase in the area of construction land, a trend that has continued, reflecting the increasing intensity of human activities.
Table 2.
Area statistic of landscape types in the Yancheng coast.
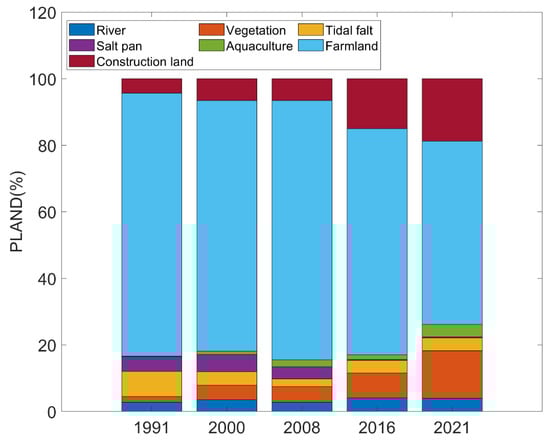
Figure 3.
Percentage of landscape (PLAND).
According to the remote sensing image (Figure 4) and data, in 1991, the mudflat accounted for 7.58% of the land feature classification in Yancheng, which represented the highest proportion of wetland types. The reason for its formation was that a large amount of sediment carried by the Yellow River into the sea met the Pacific incoming tide and formed radial sand ridges and shoals in the sea area near Dongtai City under the joint action of the Bohai tidal forces. With the continuous enhancement of human activities, including the main transformation methods of tidal flat reclamation, as well as seawater and freshwater aquaculture, the proportion of tidal flats showed a downward trend as a whole, although it began to rebound starting in 2008 to 3.84% in 2021. According to the data, due to the invasion of alien species, especially the rapid expansion of Spartina alterniflora (from the United States) from patch distribution to strip distribution from east to west and from north to south since 1979 [47], the ecological structure and distribution characteristics of bare beach and herbaceous marsh were affected. The competition pattern evolved from the competition between Suaeda salsa and Phragmites communis community to the coexistence of the competition between Suaeda salsa and Spartina alterniflora community and the competition of the two communities, and then to the competition of three communities, and finally to the competition dominated by Spartina alterniflora community [47].
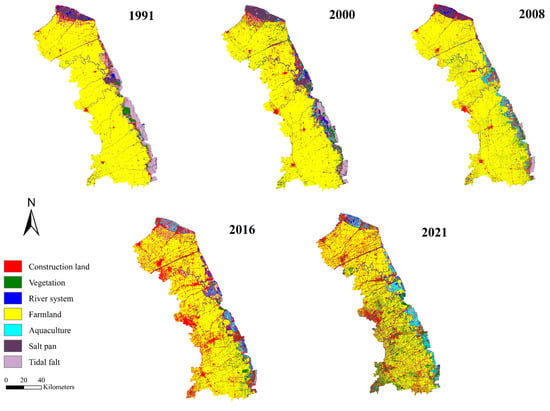
Figure 4.
Spatial distribution of landscapes in Yancheng coast during 1991–2021.
Salt pans in artificial wetlands are mainly distributed in Binhai County, Xiangshui County, and central coastal areas in the north of the coast. In recent years, with the acceleration of the development of coastal cities, the rapid advancement of urbanization, and industrialization, salt pans have gradually disappeared, and with the progress of salt production technology, groundwater can be used to produce refined salt directly. By 2016, With the continuous innovation of the production process, the number of salt pans in the north of Binhai County has gradually decreased to disappear, and the main direction of transformation is aquaculture areas. According to remote sensing images and data, in 1991, the coastal area of Yancheng had not yet formed a large-scale aquaculture area, which has changed since 2000. There are many aquaculture areas in the central region, which have formed a certain scale by 2008, and there is a trend of expansion to the north and south. In the study area, the reduction in the cultivated land area is mainly converted into construction land. Generally speaking, the natural wetlands in Yancheng wetland are mainly concentrated in the central and southern coastal areas, and the inland areas are scattered. The main distribution types are plant community and herbaceous marsh. There is an internal transformation from salt pan to aquaculture area in artificial wetland, and its development has experienced a process that the proportion of aquaculture area gradually exceeds that of the salt pan, then equals that of aquaculture area, and then far exceeds that of the salt pan. This process also reflects the rapid process of industrialization and urbanization and the increasing intensity of human activities.
4.2. Assessment of Human Activity Impact Intensity
In the analysis and evaluation of the Yancheng wetland, the water system, herbaceous marshes, and mudflats were classified as “non-interference” positive ecological elements, while salt pans, breeding farms, and cultivated land were deemed “semi-interference” positive ecological elements, and areas of built-up land were considered “full interference” negative ecological elements. (Table 3).
Table 3.
Landscape type classification system of ecological disturbance index in rapidly urbanized coastal zone.
According to calculations based on the human disturbance index using the multiple-assessment method of human activity impact intensity, in 1991, the water system accounted for 2.73%, the herbaceous marsh wetland comprised 1.75%, the mudflat represented 7.58%, the salt pan took up 4.43%, the breeding farm occupied 0.15%, and the cultivated land was calculated at 79.04%. The interference index of the water system, herbaceous marshes, mudflats, saltpans, breeding farms, cultivated land, and building land was 0.25, 0.25, 0.25, 0.55, 0.55, 0.70, and 0.95, respectively. The calculated HI was 0.650. Similarly, HI calculated for 2000, 2008, 2016, and 2021 was 0.653, 0.664, 0.661, and 0.641, respectively.
According to the calculation results of the human disturbance index (Figure 5), the dynamic changes in human activity intensity can be obtained (Figure 6). From 1991 to 2000, it increased from 0.650 to 0.653, with an increase of 0.003. From 2000 to 2008, it increased from 0.653 to 0.664, with an increase of 0.011. From 2008 to 2016, it decreased from 0.664 to 0.661, with a decrease of 0.003. From 2016 to 2021, it decreased from 0.661 to 0.641, with a decrease of 0.02. It can be seen that during the 30 years from 1991 to 2021, the human disturbance index of the Yancheng coastal area experienced a process of first rising and then falling. The period from 1991 to 2000 was a slow growth stage, while the period from 2000 to 2008 was a rapid growth stage. During the decline period, the period from 2008 to 2016 is a slow decline period, and the period from 2016 to 2021 is a rapid decline period.
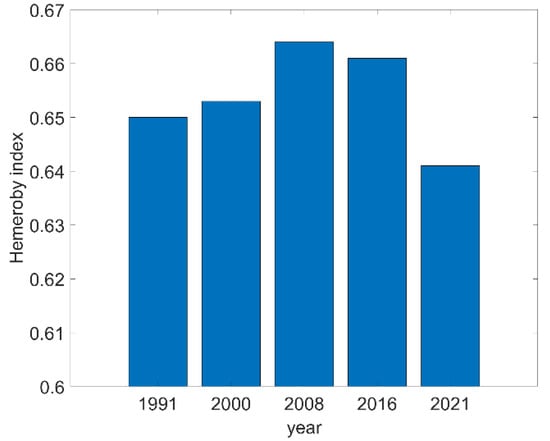
Figure 5.
Dynamic change of Hemeroby index in Yancheng coast.
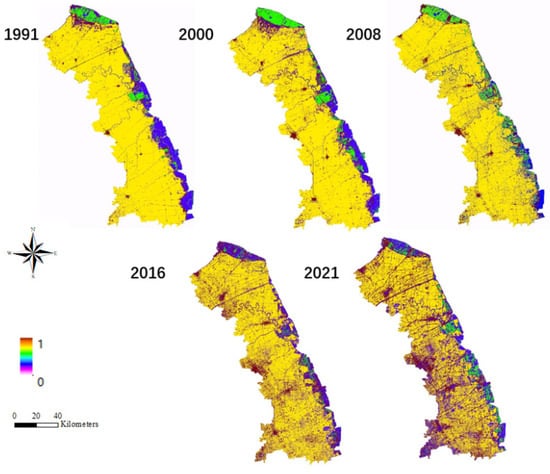
Figure 6.
Dynamic change of human activities intensity in Yancheng coast.
4.3. Analysis of Spatio-Temporal Changes of Wetland Landscape
Analysis of the transfer matrix for the Yancheng coastal landscape from 1991 to 2021 revealed the spatiotemporal change characteristics of the landscape types. Water system areas were converted into aquiculture (35.23 km2), while mudflats were adapted to accommodate aquiculture (196.42 km2), cultivated land (220.05 km2), building land (85.238 km2), and herbaceous vegetation became cultivated land (102.75 km2). The salt pan was primarily converted into breeding farms (113.68 km2) and building land (98.49 km2). While natural wetlands were transformed into artificial wetlands and non-wetland types, and artificial wetlands were transformed into non-wetland types, reverse transformations and simultaneous transformations were also observable within feature types. Specifically, the water system was transformed into the herbaceous marsh (50.94 km2), the salt pan into mudflats (86.26 km2), and the mudflats into herbaceous vegetation (193.47 km2).
From the perspective of annual transfer rate, Table 4 shows the annual transfer rate of the water system during the four periods as 3.17 (1991–2000), −2.64 (2000–2008), 5.78 (2008–2016), and −0.35 (2016–2021). Thus, this rate was relatively stable, showing only slight fluctuations. Herbaceous plants demonstrated an upward trend, with a more rapid rate of increase in the first and fourth periods (16.76, 0.83, 7.61, 17.95). The annual transfer rate for the mudflats decreased at first and then slightly increased (−5.17, −5.28, 7.69, 0.32). Meanwhile, the annual transfer rate for salt pan areas displayed a small positive value only in the first and fourth periods, and the transfer rate was faster in the second and third periods. Aquaculture increased at a large annual transfer rate (65.18, 12.99) in the first and second stages but then decreased at a weak rate in the third and fourth stages (−4.35, −0.79). In terms of non-wetland types, the annual transfer rate for cultivated land fluctuated slightly and was generally stable. Lastly, the annual transfer rate for building land remained positive and reached 16 in the third phase.
Table 4.
Dynamic transfer rate of land use on Yancheng coast.
The characteristics of landscape change can be reflected in the change in the annual transfer rate (Table 4). The continuous positive transfer of building land, the positive transfer rate of aquaculture farms, and the reduction in mudflats in the first two stages all reflect the impact of human activities on landscape change. At the same time, the growth of mudflats and the increase in plant communities in the latter two stages reflect the impact of environmental protection in the period of rapid development.
4.4. Driving Factors
Researchers investigating the forces driving land-use changes at home and abroad have divided these forces into natural factors and human factors. Natural factors mainly include climate, soil, water, marine conditions, and so on, which mostly affect the landscape on a large scale and can cause dramatic changes in the landscape. Human factors include population growth, urban expansion, economic policy, market demand, scientific and technological progress, social ideology, and other factors, which affect the transformation of land use types and changes in land-use intensity. The interaction of these natural and socio-economic driving forces at different spatial scales has resulted in the current land use situation.
Combined with the actual situation of the study area, it may be helpful to discuss the factors affecting the change of landscape pattern in this area. In terms of natural driving forces, the landform type of the Yancheng area is a plain and is a part of the North Jiangsu Plain. The terrain in the whole study area is low and undulating, and most areas are less than 5 m above sea level. There are many rivers and canals in Yancheng, extending in all directions. Because wetland is a special land type, with water as its carrier, the hydrological condition of the basin has become the main limiting factor driving the evolution of wetland. At the same time, the influence of temperature on the formation of wetlands has multiple functions, mainly affecting the species types and growth of vegetation. Temperature also affects the process and intensity of surface evaporation. Temperature rise alone can accelerate the process of water surface evaporation, causing a reduction in the water surface area, resulting in the shrinkage of intertidal silt beaches, estuarine waters, rivers, lakes, artificial aquaculture, and other areas. Salinity was also found to be a major factor in determining the path of coastal landscape succession. In the early stage of reclamation, a large amount of soil salinization was caused by water evaporation. Soil with high salt content can only be used for mariculture or salt field development. The salinity of the tidal flat area is reduced by the deposition of rain showers and the introduction of fresh water for irrigation. The land can be used for large-scale farmland cultivation and freshwater aquaculture.
In terms of human factors, population pressure is one of the main driving forces leading to land-use change, and population growth is usually accompanied by the enhancement of human activity intensity. The study shows that human activity is a very important factor causing wetland landscape changes in Yancheng during the past 30 years. In 1991, 2000, 2008, 2016, and 2021, the value of intensity affected by human activities was 0.650, 0.653, 0.664, 0.661, and 0.641, respectively. On the one hand, due to the growth of the population, people’s demand for housing, living infrastructure, and construction land is also rising; on the other hand, the demand for food is also increasing. To some extent, this will have an impact on land use types and environmental changes. Economic interest is another major factor in the human driving force. With the unique conditions for the development of aquaculture, aquaculture has developed rapidly. A large number of expansion of artificial farms is one of the reasons for the conversion of wetland types.
5. Discussion
5.1. Temporal and Spatial Changes of Yancheng Wetland
This paper analyzes the evolutionary trends and driving forces of four stages of Yancheng coastal transformation from 1991 to 2021. During this time frame, the dominant landscape has been farmland, not wetlands; however, the coastal landscape pattern of Yancheng has changed significantly in that same time frame. The types of landscape transformation can be divided into the internal transformation of the natural landscape, the transformation of the natural landscape into the artificial landscape, the internal transformation of the artificial landscape, and the transformation of the artificial landscape into the natural landscape [51,52].
According to the regional characteristics of the rapidly urbanized coastal zone, a land cover information extraction method suitable for the rapidly urbanized coastal zone was constructed, and the regional land cover was dynamically monitored based on a multi-source remote sensing fusion monitoring method [53,54]. Considering the difference between positive and negative ecological types of land cover elements, we constructed a comprehensive assessment method of human activity impact intensity in the coastal zone. Moreover, the dynamic changes in human activity impact intensity in the Yancheng area from 1991 to 2021 were also studied. The results demonstrate that the extraction results of land cover information with high precision were key to ensuring the assessment results of human activity impact intensity. According to the assessment requirements and the characteristics of the rapid urbanization coastal zone, the land cover extraction method was proposed, and the supervised classification extraction method was adopted. The assessment results for the impact intensity of human activities reveal that the change took place in stages, that is, a slow-growth stage from 1991 to 2000 and a rapid-growth stage from 2000 to 2008. The period from 2008 to 2016 was a period characterized by a slow decline, followed by a period of rapid decline from 2016 to 2021. The assessment method successfully identified the spatial distribution, intensity, and mode of action of different human activities.
This paper studies the coastal wetlands in Yancheng from a larger scope and explores the impact of the coastal wetlands in Yancheng on the ecological changes of the surrounding areas with the strongest radiation, which provides a new perspective and direction for further monitoring and research of Yancheng wetlands. More refined and high-resolution remote sensing analysis results and future change prediction of the Yancheng wetland are our next key research directions.
5.2. Discussion on Driving Factors
From 1991 to 2021, the wetland landscape types in the Yancheng wetland study area changed strongly, and human activities were deemed to be the main reason for the reduction in natural elements in the Yancheng wetland landscape. From 1991 to 2021, much natural landscape was transformed into an artificial landscape. The influence of human activity as a driving force is obviously greater than that of natural driving forces. The government has taken a series of measures. Yancheng Wetland Nature Reserve was established in 1983, and it was promoted to a national nature reserve in 1992. Since 2006, Yancheng has issued a series of policies focused on land use planning, urban planning, and wetland protection and restoration planning, clearly stipulating the regional management requirements for prohibiting and developing ecological functions such as wetlands and nature reserves. The Yancheng government has invested funds in central and provincial projects. Projects have been used to restore polluted wetlands, providing wetland ecological compensation, establishing ecological management, and promoting ecological restoration have formed the core of financial expenditures. Natural wetlands have been restored, and a large number of natural wetlands have been included within the scope of natural wetland protection. From 2015 to 2020, the protection rate for natural wetlands in Yancheng increased from 41.5% to 61.8%. These measures are reflected in the current study’s observations.
Nevertheless, many problems remain to be addressed in the current situation regarding wetland resources in Yancheng. First, due to the negative impact of human activities on the environment near wetlands, the fragmentation trend affecting the natural wetlands is obvious, and the biodiversity of the wetlands is gradually decreasing. This troubling change poses a great challenge to the survival of wild animals such as elk. Second, the wetland ecological compensation mechanism is not perfect. The destruction of crops and fisheries around wetlands caused by the government’s efforts to protect wetlands urgently needs the establishment and improvement of a sound ecological compensation mechanism. In order to use more accurate remote sensing data and more accurate land cover information extraction to further monitor the wetland environment in Yancheng in the future, we offer the following suggestions and countermeasures. First, it is necessary to further strengthen the protection of natural wetlands, label ecological management, and restoration as the key direction of public financial expenditures, intensify wetland restoration efforts, and constantly improve the protection rate of natural wetlands. Second, the establishment and improvement of the wetland ecological compensation mechanism drive the competent authorities of some wetland areas in Yancheng to implement wetland protection regulations; however, the current protections are not enough for the protection and sustainable development of the whole wetland, pointing to the urgent need for a wider range of wetland legislation to be implemented. Third, it is necessary to strengthen brand building. At present, the proportion of high-quality wetland parks in the Yancheng area is less than 10%, which is an urgent problem Yancheng should face. Fourth, more scientific and ecological urban planning is needed. Even as rapid economic development continues to unfold, we should strive to achieve an organic balance between man and nature.
6. Conclusions
Based on the Landsat images data for the Yancheng coastal area in 1991, 2000, 2008, 2016, and 2021, the random forest method was applied to classify the landscape types of this area by fusing the information concerning impact characteristics. A combination of the evaluation method of human activity intensity in the period of rapid urbanization and the transferring matrix was used to analyze the spatiotemporal dynamic changes of the Yancheng coastal wetland landscape, and the factors driving change were explored in light of the analysis results. In conclusion, the results have certain theoretical and practical reference value for the protection and sustainable development of the Yancheng wetland. The main conclusions are as follows: (1) While the changes in the wetland landscape in the Yancheng coastal area have mainly been reflected in the form of dramatic changes in local surface features, from an overall point of view, the area is relatively stable. (2) The transformation of wetland types has been multi-directional, including the transformation from natural wetland to the artificial wetland and non-wetland types, the internal transformation of artificial wetland, and the reverse transformation from non-wetland types to wetland. (3) Using the evaluation method of human activity intensity in the period of rapid urbanization, our findings reveal that the intensity of human activity in the Yancheng coastal area has experienced a process of first rising and then falling. (4) Analysis of the driving factors reflected in the analysis results showed that temperature and salinity were the main natural driving factors, while human factors imposed the greatest effects on the landscape changes characterizing the Yancheng coastal wetland.
Due to the limitations of available data and in situ measurements, we have not analyzed the Yancheng wetland situation with a more precise perspective, which is something we need to be refined in the future. Meanwhile, for wetland landscape changes and driving force analysis, such as the impact of human policies, continuous monitoring and future prediction of human activities is one of our promising further studies.
Author Contributions
Conceptualization, C.C. and Y.Z.; methodology, J.F.; software, C.C.; validation, J.F., C.W. and L.M.; formal analysis, C.C.; investigation, J.F.; resources, Y.Z.; data curation, C.C.; writing—original draft preparation, C.C.; writing—review and editing, Y.Z.; visualization, J.F.; supervision, Y.Z.; project administration, Y.Z.; funding acquisition, Y.Z. All authors have read and agreed to the published version of the manuscript.
Funding
This research was funded by the Marine Special Program of Jiangsu Province in China (JSZRHYKJ202007), the National Natural Science Foundation (U1901215), and the Natural Scientific Foundation of Jiangsu Province (BK20181413).
Institutional Review Board Statement
Not applicable.
Informed Consent Statement
No applicable.
Data Availability Statement
Not applicable.
Acknowledgments
The Landsat data and local yellow-book data are highly appreciated. This research was supported by the National Natural Science Foundation (U1901215) and the Marine Special Program of Jiangsu Province in China (JSZRHYKJ202007).
Conflicts of Interest
The authors declare no conflict of interest.
References
- Ausseil, A.G.E.; Dymond, J.R.; Shepherd, J.D. Rapid mapping and prioritisation of wetland sites in the Manawatu–Wanganui Region, New Zealand. Environ. Manag. 2007, 39, 316–325. [Google Scholar] [CrossRef] [PubMed]
- MMitsch, W.J.; Wu, X.; Nairn, R.W.; Weihe, P.E.; Wang, N.; Deal, R.; Boucher, C.E. Creating and restoring wetlands. BioScience 1998, 48, 1019–1030. [Google Scholar] [CrossRef]
- Mitsch, W.J.; Gosselink, J.G. The value of wetlands: Importance of scale and landscape setting. Ecol. Econ. 2000, 35, 25–33. [Google Scholar] [CrossRef]
- Bohemen, H.V. Book Review: Wetlands: Ecoloy, Engneering; Mitsch, W.J., Gosselink, J.G., Eds.; John Wiley and Sons: Hoboken, NJ, USA, 2007; Volume 34, pp. 251–252. [Google Scholar]
- Mulder, J.P.M.; Hommes, S.; Horstman, E.M. Implementation of coastal erosion management in the Netherlands. Ocean. Coast. Manag. 2011, 54, 888–897. [Google Scholar] [CrossRef]
- Pavlićević, D. China, the EU and one belt, one road strategy. China Brief 2015, 15, 9–13. [Google Scholar]
- Mars, J.C.; Houseknecht, D.W. Quantitative remote sensing study indicates doubling of coastal erosion rate in past 50 yr along a segment of the Arctic coast of Alaska. Geology 2007, 35, 583–586. [Google Scholar] [CrossRef]
- Lee, S.Y.; Dunn RJ, K.; Young, R.A.; Connolly, R.M.; Dale PE, R.; Dehayr, R.; Welsh, D.T. Impact of urbanization on coastal wetland structure and function. Austral Ecol. 2006, 31, 149–163. [Google Scholar] [CrossRef]
- Brando, V.E.; Dekker, A.G. Satellite hyperspectral remote sensing for estimating estuarine and coastal water quality. IEEE Trans. Geosci. Remote Sens. 2003, 41, 1378–1387. [Google Scholar] [CrossRef]
- Wu, B.; Wang, G.; Wang, Z.; Liu, C.; Ma, J. Integrated hydrologic and hydrodynamic modeling to assess water exchange in a data-scarce reservoir. J. Hydrol. 2017, 555, 15–30. [Google Scholar] [CrossRef]
- Zorrilla-Miras, P.; Palomo, I.; Gómez-Baggethun, E.; Martín-López, B.; Lomas, P.L.; Montes, C. Effects of land-use change on wetland ecosystem services: A case study in the Doñana marshes (SW Spain). Landsc. Urban Plan. 2014, 122, 160–174. [Google Scholar] [CrossRef]
- Pijl, A.; Brauer, C.C.; Sofia, G.; Teuling, A.J.; Tarolli, P. Hydrologic impacts of changing land use and climate in the Veneto lowlands of Italy. Anthropocene 2018, 22, 20–30. [Google Scholar] [CrossRef]
- Viero, D.P.; Roder, G.; Matticchio, B.; Defina, A.; Tarolli, P. Floods, landscape modifications and population dynamics in anthropogenic coastal lowlands: The Polesine (northern Italy) case study. Sci. Total Environ. 2019, 651, 1435–1450. [Google Scholar] [CrossRef] [PubMed]
- Faulkner, S. Urbanization impacts on the structure and function of forested wetlands. Urban Ecosyst. 2004, 7, 89–106. [Google Scholar] [CrossRef]
- Brady, S.J.; Flather, C.H. Changes in wetlands on nonfederal rural land of the conterminous United States from 1982 to 1987. Environ. Manag. 1994, 18, 693–705. [Google Scholar] [CrossRef]
- Wang, Z.; Xu, W.; Xia, X.; Yu, H.; Lv, Y.; Zhang, J. Novel Quantitative Method for Assessing Driving Forces of Landscape Succession: Case Study From Yancheng Coast, China. Front. Ecol. Evol. 2021, 341. [Google Scholar] [CrossRef]
- Tian, P.; Cao, L.; Li, J.; Pu, R.; Gong, H.; Li, C. Landscape characteristics and ecological risk assessment based on multi-scenario simulations: A case study of Yancheng Coastal Wetland, China. Sustainability 2020, 13, 149. [Google Scholar] [CrossRef]
- Tian, P.; Cao, L.; Li, J.; Pu, R.; Shi, X.; Wang, L.; Liu, R.; Xu, H.; Tong, C.; Zhou, Z.; et al. Landscape grain effect in Yancheng coastal wetland and its response to landscape changes. Int. J. Environ. Res. Public Health 2019, 16, 2225. [Google Scholar] [CrossRef] [Green Version]
- Held, A.; Ticehurst, C.; Lymburner, L.; Williams, N. High resolution mapping of tropical mangrove ecosystems using hyperspectral and radar remote sensing. Int. J. Remote Sens. 2003, 24, 2739–2759. [Google Scholar] [CrossRef]
- Hettiarachchi, M.; Morrison, T.H.; McAlpine, C. Forty-three years of Ramsar and urban wetlands. Glob. Environ. Chang. 2015, 32, 57–66. [Google Scholar] [CrossRef] [Green Version]
- Lhermitte, S.; Verbesselt, J.; Verstraeten, W.W.; Coppin, P. A comparison of time series similarity measures for classification and change detection of ecosystem dynamics. Remote Sens. Environ. 2011, 115, 3129–3152. [Google Scholar] [CrossRef]
- Lazzarini, M.; Marpu, P.R.; Ghedira, H. Temperature-land cover interactions: The inversion of urban heat island phenomenon in desert city areas. Remote Sens. Environ. 2013, 130, 136–152. [Google Scholar] [CrossRef]
- Song, S.; Wu, Z.; Wang, Y.; Cao, Z.; He, Z.; Su, Y. Mapping the rapid decline of the intertidal wetlands of China over the past half century based on Remote Sensing. Front. Earth Sci. 2020, 8, 16. [Google Scholar] [CrossRef]
- Arebey, M.; Hannan, M.A.; Begum, R.A.; Basri, H. Solid waste bin level detection using gray level co-occurrence matrix feature extraction approach. J. Environ. Manag. 2012, 104, 9–18. [Google Scholar] [CrossRef] [PubMed]
- Chen, B.; Li, M.; Wang, J.; Wu, F.X. Disease gene identification by using graph kernels and Markov random fields. Sci. China Life Sci. 2014, 57, 1054–1063. [Google Scholar] [CrossRef] [Green Version]
- Runhong, L.; Shichu, L.; Hongyan, Z. Progress of Chinese coastal wetland based on remote sensing. Remote Sens. Technol. Appl. 2018, 32, 998–1011. [Google Scholar]
- Huang, L.; Xu, L. Spatiotemporal Evolution of the Oasis and Change of Landscape Pattern in the Manas River Basin. Arid. Zone Res. 2019, 36, 1261–1269. [Google Scholar]
- Chen, A.; Sui, X.; Wang, D.; Liao, W.; Ge, H.; Tao, J. Landscape and avifauna changes as an indicator of Yellow River Delta Wetland restoration. Ecol. Eng. 2016, 86, 162–173. [Google Scholar] [CrossRef]
- Hao, J.F.; Wang, D.Y.; Li, Y.; Yao, X.L.; Zhang, Y.B.; Zhan, M.C.; Qi, J. Effects of human disturbance on species diversity of Phoebe zhennan communitis in Jinfengshan Moutain in western Sichuan. Acta Ecol. Sin. 2014, 34, 6930–6942. [Google Scholar]
- Liu, J.P.; Dong, C.Y.; Sheng, L.X.; Liu, Y. Landscape pattern change of marsh and its response to human disturbance in the small Sanjiang Plain, 1955–2010. Sci. Geogr. Sin. 2016, 36, 879–887. [Google Scholar]
- Hill, M.O.; Roy, D.B.; Thompson, K. Hemeroby, urbanity and ruderality: Bioindicators of disturbance and human impact. J. Appl. Ecol. 2002, 39, 708–720. [Google Scholar] [CrossRef]
- Walz, U.; Stein, C. Indicators of hemeroby for the monitoring of landscapes in Germany. J. Nat. Conserv. 2014, 22, 279–289. [Google Scholar] [CrossRef]
- Jalas, J. Hemeroby and hemerochore of plant species. A terminological reform effort. Acta Soc. Fauna Flora Fenn 1955, 72, 1. [Google Scholar]
- Li, M.H.; Kräuchi, N.; Yang, J. Hemeroby: A method to assess the naturalness of vegetation. Prog. Geogr. 2002, 21, 450–458. [Google Scholar]
- Ai-lian, C.; Bo-qin, Z.; Li-ding, C.; Yan-hua, W.; Ran-hao, S. Dynamic changes of landscape pattern and eco-disturbance degree in Shuangtai estuary wetland of Liaoning Province China. Yingyong Shengtai Xuebao 2010, 21, 1120–1128. [Google Scholar]
- Sun, Y.G.; Zhao, D.Z.; Wu, T.; Wei, B.Q.; Gao, S.G.; Li, Y.; Cao, F.F. Temporal and spatial dynamic changes and landscape pattern response of Hemeroby in Dayang estuary of Liaoning Province, China. Acta Ecol. Sin. 2012, 32, 3645–3655. [Google Scholar]
- Sun, X.B.; Liu, H.Y. Research progress of coastal wetland in Jiangsu province. Mar. Environ. Sci. 2011, 30, 599–602. [Google Scholar]
- Marceau, D.J.; Howarth, P.J.; Dubois JM, M.; Gratton, D.J. Evaluation of the grey-level co-occurrence matrix method for land-cover classification using SPOT imagery. IEEE Trans. Geosci. Remote Sens. 1990, 28, 513–519. [Google Scholar] [CrossRef]
- Dong, X.; Meng, Z.; Wang, Y.; Zhang, Y.; Sun, H.; Wang, Q. Monitoring Spatiotemporal Changes of Impervious Surfaces in Beijing City Using Random Forest Algorithm and Textural Features. Remote Sens. 2021, 13, 153. [Google Scholar] [CrossRef]
- Wold, S.; Esbensen, K.; Geladi, P. Principal component analysis. Chemom. Intell. Lab. Syst. 1987, 2, 37–52. [Google Scholar] [CrossRef]
- Frohn, R.C.; Autrey, B.C.; Lane, C.R.; Reif, M. Segmentation and object-oriented classification of wetlands in a karst Florida landscape using multi-season Landsat-7 ETM+ imagery. Int. J. Remote Sens. 2011, 32, 1471–1489. [Google Scholar] [CrossRef]
- Zhang, L.; Gao, S.; Wei, B.; Li, Y.; Li, H.; Wang, L.; Ye, B. Effects of urbanization on rural drinking water quality in Beijing, China. Sustainability 2017, 9, 461. [Google Scholar] [CrossRef] [Green Version]
- Chica-Olmo, M.; Abarca-Hernandez, F. Computing geostatistical image texture for remotely sensed data classification. Comput. Geosci. 2000, 26, 373–383. [Google Scholar] [CrossRef] [Green Version]
- Zhang, Y.; Zhang, H.; Lin, H. Improving the impervious surface estimation with combined use of optical and SAR remote sensing images. Remote Sens. Environ. 2014, 141, 155–167. [Google Scholar] [CrossRef]
- An, S.Q.; Gu, B.H.; Zhou, C.F.; Wang, Z.S.; Deng, Z.F.; Zhi, Y.B.; Liu, Y.H. Spartina invasion in China: Implications for invasive species management and future research. Weed Res. 2007, 47, 183–191. [Google Scholar] [CrossRef]
- Rodriguez-Galiano, V.F.; Ghimire, B.; Rogan, J.; Chica-Olmo, M.; Rigol-Sanchez, J.P. An assessment of the effectiveness of a random forest classifier for land-cover classification. ISPRS J. Photogramm. Remote Sens. 2012, 67, 93–104. [Google Scholar] [CrossRef]
- Cracknell, M.J.; Reading, A.M. Geological mapping using remote sensing data: A comparison of five machine learning algorithms, their response to variations in the spatial distribution of training data and the use of explicit spatial information. Comput. Geosci. 2014, 63, 22–33. [Google Scholar] [CrossRef] [Green Version]
- Nasiri, V.; Deljouei, A.; Moradi, F.; Sadeghi SM, M.; Borz, S.A. Land Use and Land Cover Mapping Using Sentinel-2, Landsat-8 Satellite Images, and Google Earth Engine: A Comparison of Two Composition Methods. Remote Sens. 2022, 14, 1977. [Google Scholar] [CrossRef]
- Talukdar, S.; Eibek, K.U.; Akhter, S.; Ziaul, S.K.; Islam AR, M.T.; Mallick, J. Modeling fragmentation probability of land-use and land-cover using the bagging, random forest and random subspace in the Teesta River Basin, Bangladesh. Ecol. Indic. 2021, 126, 107612. [Google Scholar] [CrossRef]
- Zhuang, D.F.; Liu, J.Y. Study on the model of regional differentiation of land use degree in China. J. Nat. Resour. 1997, 12, 105–111. [Google Scholar]
- Mohammadi, A.; Karimzadeh, S.; Valizadeh Kamran, K.; Matsuoka, M. Extraction of land information, future landscape changes and seismic hazard assessment: A case study of Tabriz, Iran. Sensors 2020, 20, 7010. [Google Scholar] [CrossRef]
- Tian, Y. Mapping suburbs based on spatial interactions and effect analysis on ecological landscape change: A case study of Jiangsu Province from 1998 to 2018, Eastern China. Land 2020, 9, 159. [Google Scholar] [CrossRef]
- Wang, S.W.; Gebru, B.M.; Lamchin, M.; Kayastha, R.B.; Lee, W.K. Land use and land cover change detection and prediction in the Kathmandu District of Nepal using remote sensing and GIS. Sustainability 2020, 12, 3925. [Google Scholar] [CrossRef]
- Hall, F.G.; Strebel, D.E.; Sellers, P.J. Linking knowledge among spatial and temporal scales: Vegetation, atmosphere, climate and remote sensing. Landsc. Ecol. 1988, 2, 3–22. [Google Scholar] [CrossRef]
Publisher’s Note: MDPI stays neutral with regard to jurisdictional claims in published maps and institutional affiliations. |
© 2022 by the authors. Licensee MDPI, Basel, Switzerland. This article is an open access article distributed under the terms and conditions of the Creative Commons Attribution (CC BY) license (https://creativecommons.org/licenses/by/4.0/).