Article

Sediment Nitrate Dissimilatory Reduction Processes along a Salinity Gradient in an Estuarine and Coastal Wetland, China

1
College of Life Sciences, Shandong Agricultural University, Tai’an 271018, China
2
Shandong Key Laboratory of Eco-Environmental Science for the Yellow River Delta, Binzhou University, Binzhou 256600, China
3
Frontiers Science Center for Deep Ocean Multispheres and Earth System, Key Laboratory of Marine Chemistry Theory and Technology, Ministry of Education, Ocean University of China, Qingdao 266100, China
4
Key Laboratory of Marine Environmental Survey Technology and Application, Ministry of Natural Resources, Guangzhou 510300, China
*
Authors to whom correspondence should be addressed.
J. Mar. Sci. Eng. 2022, 10(6), 761; https://doi.org/10.3390/jmse10060761
Submission received: 6 May 2022 / Revised: 27 May 2022 / Accepted: 30 May 2022 / Published: 31 May 2022
(This article belongs to the Special Issue Advances in Marine Nitrogen Cycle)

Abstract

:
Nitrate (NO3) dissimilatory reduction processes (denitrification, anammox and dissimilatory NO3 reduction to ammonium (DNRA)) in estuarine and coastal ecosystems play a crucial role in regulating reactive nitrogen loadings. However, nitrate reduction process rates and relative proportions along the estuarine salinity gradient remain poorly understood. Here, denitrification, anammox and DNRA were explored simultaneously along a salinity gradient in Yangtze Estuary based on nitrogen isotope-tracing experiments. Measured denitrification, anammox and DNRA process rates were in the range of 2.33–28.21 nmol g−1 h−1, 0.43–1.87 nmol g−1 h−1 and 0.28–0.74 nmol g−1 h−1, respectively, with a large spatio-temporal variation. The changes in these nitrate reduction process rates were mainly affected by the TOC, TN, NH4+ and NOx concentrations, rather than salinity and related functional gene abundance. Denitrification dominated the total NO3 reduction process (67.52 to 93.85%), while anammox (3.67 to 25.01%) and DNRA (2.48 to 11.21%) also played a substantially important role in nitrate reduction. The proportions of denitrification to gross nitrate reduction in high-salinity areas were generally lower than those in freshwater, but the opposite was true for DNRA. Overall, our study reported the simultaneous observation of nitrate dissimilatory reduction processes along the salinity gradient of the estuary and highlighted that changes in sediment environmental variables affected by human activities can alter the distribution patterns of NO3 reduction processes.

1. Introduction

Nitrogen (N) is an important element, playing a crucial role in biological growth and primary productivity in estuarine and coastal ecosystems [1,2,3]. Over the past few decades, intensive industrial and agricultural activities have resulted in the massive production of reactive N in a global context [4]. Therein, about 25% of reactive N has been transported into the wetlands of estuaries and coasts via runoff and atmospheric dry and wet deposition [5,6]. Estuaries and coasts, as intermediate areas of land-sea interaction, play a crucial role in regulating the budgets of reactive N [7,8]. Thus, microbial N conversion processes and eco-environmental implications in estuarine and coastal wetlands have been studied widely.
In these N conversion processes, nitrate (NO3) dissimilatory reduction, including denitrification, anaerobic ammonium oxidation (anammox) and dissimilatory NO3 reduction to ammonium (DNRA), are considered to be the major pathway regulating reactive N loadings in the ecosystems of estuaries and coasts [2,9]. Denitrification mainly reduces NO3/nitrite (NO2) to dinitrogen gas (N2), while in anammox, ammonium (NH4+) is oxidized to N2 through the reduction of NO2/NO3 [10]. Both denitrification and anammox eliminate reactive N from the ecosystems. Conversely, DNRA retains reactive N within the ecosystem via reducing NO3 into available NH4+ [11,12]. It has been reported that denitrification is the prominent microbial process of total NO3 reduction in most wetlands of estuaries and coasts [10,13], but some works also found that DNRA is the pivotal process to regulate reactive N fate [11,14]. To date, large numbers of studies have documented the variations in NO3 dissimilatory reduction in the wetlands of estuaries and coasts, and noted that the process rates were mainly influenced by temperature, salinity, oxygen level, sulfide, carbon (C) and N substrates [2,5,10,11,15,16,17]. Meanwhile, these processes are also mediated by microbial communities, and the nirS, hzo and nrfA gene abundance commonly reflects denitrification, anammox and DNRA activities in estuarine and coastal wetlands, respectively [18,19,20,21]. Among these influencing factors, salinity is a significant variable in the wetlands of estuaries and coasts [17]. On the one hand, an obvious salinity gradient is generally observed in estuarine wetlands from downriver to upriver zones [11]. On the other hand, seawater intrusion can alter the variations in salinity of estuaries and coasts [22]. Previous studies have explored the changes in greenhouse gas fluxes along the salinity gradients and confirmed the important role of salinity [23]. Besides, there are a few works on the sediment N transformation processes along the salinity gradients, and major changes were observed in nitrification, DNRA and N fixation [24,25]. In this ecosystem, competition between DNRA, anammox and denitrification is predictable. Nevertheless, past works about NO3 dissimilatory reduction processes along with salinity gradients were mainly concentrated on a single process [24]. Simultaneous exploration of denitrification, anammox and DNRA process rates and their relative importance in total NO3 reduction is lacking.
The Yangtze (Changjiang) River is the largest river in China, and extensive tidal flats develop in this estuary, with an obvious salinity gradient [26]. In addition, large numbers of reactive N have been delivered into the estuary over the past several decades, which significantly affected the ecological environment here [6]. With these in mind, we conducted an experiment to explore the changes in NO3 reduction processes along a salinity gradient in the Yangtze Estuary. The specific aims of our study were (1) to explore the variations in potential denitrification, anammox and DNRA processes as well as related gene abundances along with a salinity gradient, (2) to reveal the key physical and chemical parameters regulating the potential process rates of denitrification, anammox and DNRA, and (3) to evaluate the importance of three processes in gross NO3 reduction and eco-environmental significance in different salinity habitats.

2. Materials and Methods

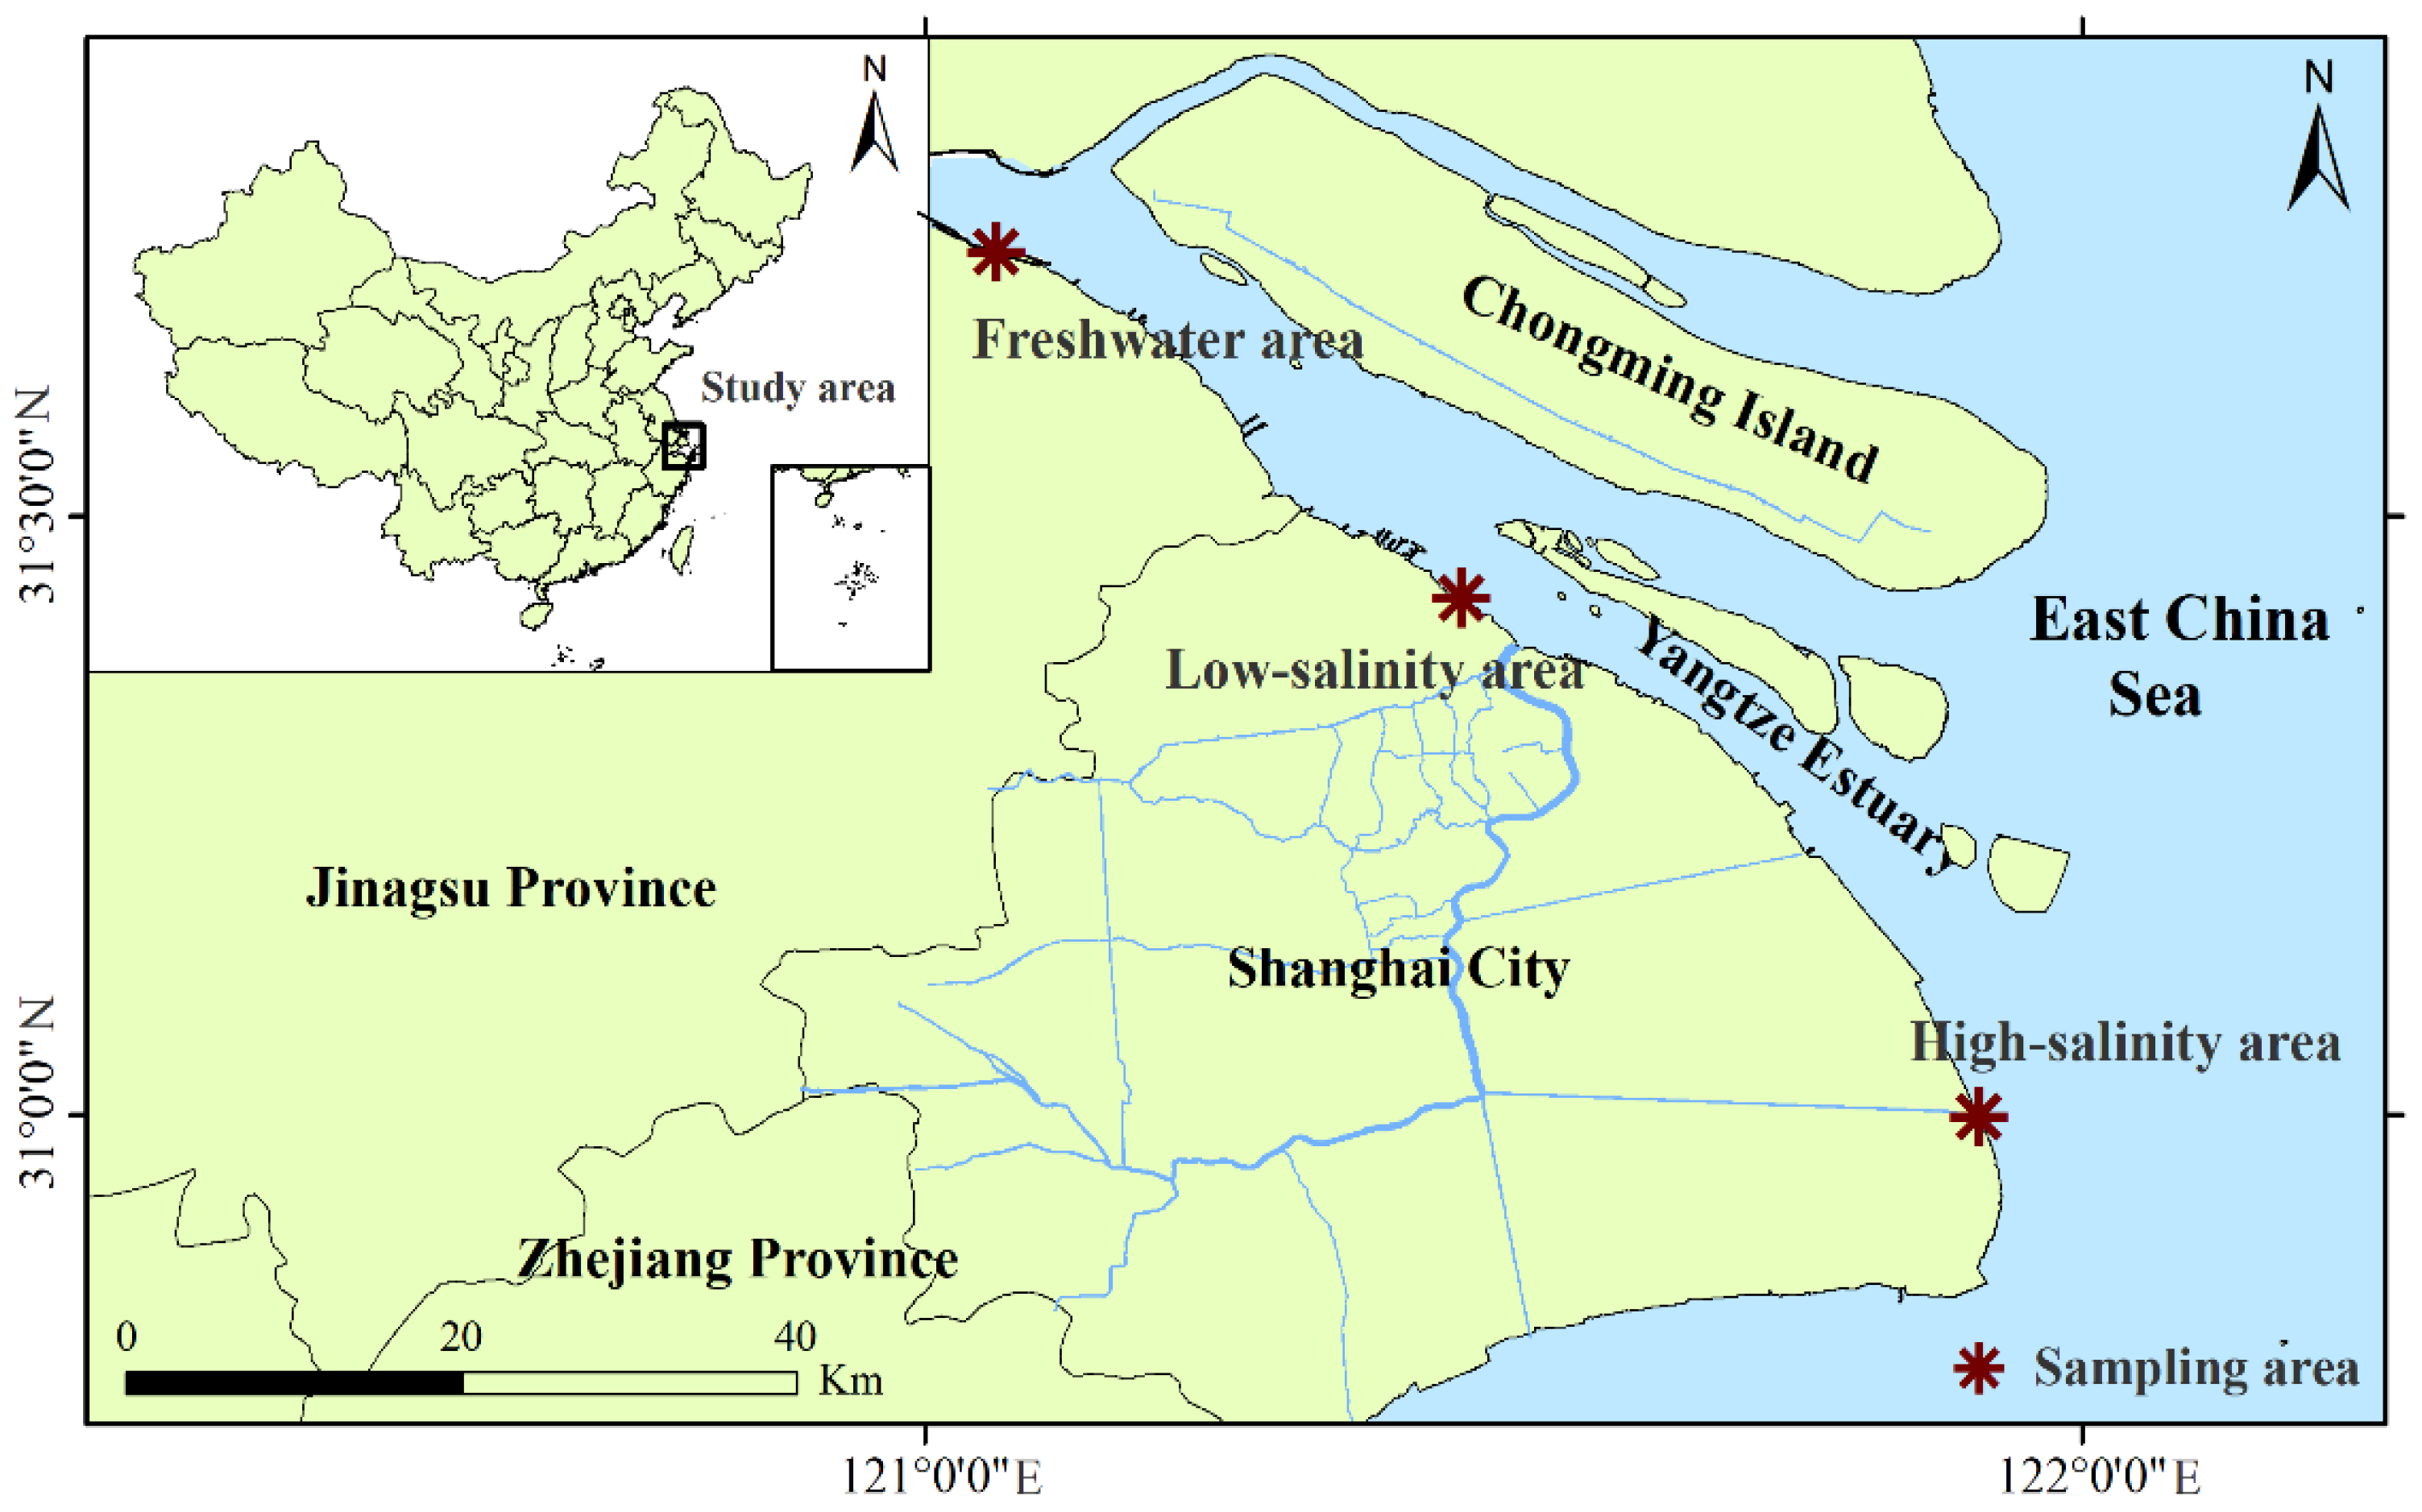
2.1. Study Site and Field Sample Collection

This study was conducted in the Yangtze Estuary, Shanghai City, China (Figure 1). The area is affected obviously by a typical semitropical monsoon climate [26,27], with a mean annual temperature of 16.0 °C, and a mean annual precipitation of 1144 mm [24]. The study area has been receiving an increasing amount of reactive N, which has led to a series of ecological and environmental problems. Sampling locations were chosen along the Yangtze Estuary, including freshwater, low-salinity, and high-salinity areas (Figure 1). Field sample collections were conducted in summer (August 2020) and winter (December 2020). Three sediment samples were taken from the 0–10 cm layer in each area (freshwater, low-salinity, and high-salinity area). After collection, all samples were immediately stored in sterile ziplock bags and kept on ice in coolers, and directly transported to the laboratory. Collected sediment samples were separated into two fractions: the first fraction was preserved at 4 °C for analysis of NO3 reduction processes and physico-chemical properties; and the other part was frozen at −20 °C for molecular analysis.

2.2. Sediment Physico-Chemical Properties Analysis

Moist sediment was dried at 60 °C to determine the sediment water content (WC) [28]. The salinity of the sediment was determined using a YSI-30 portable salinity meter, while sediment pH was measured by a Mettler-Toledo pH meter [24,29,30]. Sediment total N (TN) and total organic carbon (TOC) were analyzed using a Vario EL CN Elemental Analyzer (Elementar, Germany) [13]. The extractable Fe and ferrous oxides (Fe2+) in the sediment were extracted with 0.5 M HCl and then analyzed according to the ferrozine method [31], and the ferric iron (Fe3+) was obtained by the difference between total Fe and Fe2+. Sediment sulfide was extracted with 1 M HCl containing antioxidant and determined by the methylene blue spectrophotometry [32,33]. Sediment inorganic N was extracted with 2 M potassium chloride, and the concentrations of NH4+ and NOx (NO3 plus NO2) were analyzed by a flow injection analysis (Skalar Analytical SAN++, Breda, The Netherlands) [24].

2.3. DNA Extraction and Quantitative PCR (q-PCR) Analysis

We quantified the relevant gene abundance (nirS, hzo and nrfA) to reveal the potential effects of specific microorganisms on the NO3 reduction rates. In the quantification process, the total DNA was extracted from 0.25 g of sediment using PowersoilTM DNA Isolation Kits (MO BIO, Carlsbad, CA, USA) based on the manufacturer’s instructions. The extracted DNA was stored at −80 °C before analysis. The nirS, hzo and nrfA genes, which encode the key enzymes for denitrification, anammox and DNRA, respectively, were quantified by the real-time q-PCR with an ABI 7500 Sequence Detection System (Applied Biosystems, Canada) using the SYBR green method. Each qPCR of the extracted DNA sample had three replicates using double-distilled water as the negative control. Table 1 showed the detailed primers and qPCR thermocycling conditions. The relative abundances of the functional gene (nirS, hzo and nrfA) in the sediment were calculated by the standard curve which was constructed by diluting a known amount of plasmid DNA including the target fragment. The amplification efficiency was above 95% in the present study, and the correlation coefficient was higher than 0.98.

2.4. Analyzing Potential NO3 Rates Based on the 15N Tracer Method

Potential denitrification and anammox rates of the sediment were measured by the N isotope-tracing technique combined with slurry incubation experiments [10,13]. Briefly, slurries were made with collected sediments and tidewater at a ratio of 1:7 in a 200 mL glass bottle, and the mixed slurries were purged with He for approximately 30 min to drive off dissolved oxygen. Then, gas-tight vials (Exetainer, Labco) were filled with the mixed slurries in a helium-filled glove box, and all slurry vials were preincubated at near field temperature (33 °C for August and 6 °C for December) for 48 h to eliminate surplus NOx and dissolved oxygen. All vials were injected with 0.1 mL helium-purged stock solutions of 15NO3 (15N at 99%) through the septum after 48 h preincubation. The final contents of 15NO3 in each vial were approximately 100 μM. Subsequently, these vials were separated into two groups (group A and group B). The microbial activity in vials of group A was stopped by adding 0.2 mL saturated zinc chloride solution and labeled as initial slurry samples. The vials of group B (final slurry samples) were further incubated for 8 h, and the microbial activity in these vials was also stopped by adding 0.2 mL saturated zinc chloride solution. The 29N2 and 30N2 concentrations in initial and final slurry samples were analyzed by membrane inlet mass spectrometry (MIMS). According to the 29N2 and 30N2 concentrations in initial and final slurry samples, we calculated potential denitrification and anammox process rates [5].
The ammonium oxidation membrane inlet mass spectrometry (OX/MIMS) method was used to determine the potential DNRA rates [36]. The slurry samples were made in similar ways as the abovementioned denitrification and anammox incubation. Likewise, all the vials were injected with 0.1 mL helium-purged stock solutions of 15NO3 (15N at 99%) after pre-incubation. Then, these vials were also separated into group A and group B. The vials of group A (initial samples) were preserved with 0.2 mL saturated zinc chloride solution. Then, the vials of group B (final samples) were further incubated for 8 h before injecting 200 μL saturated zinc chloride solution. All vials were again purged by He (30 min) to drive off the 29+30N2 generated via denitrification and anammox in the incubation period. Then, 0.1 mL of hypobromite iodine oxidizer was added to convert the 15NH4+ produced by DNRA into 15N2, and the 15N2 contents were analyzed by MIMS. According to the changes in 15NH4+ concentrations during the incubation, we further calculated the potential DNRA rates [5,36].

2.5. Statistical Analysis

We applied a one-way analysis of variance (ANOVA) to determine the spatial variations in sediment physicochemical parameters and NO3 reduction rates and relevant functional gene abundances. The Pearson correlation analysis was used to reveal the relationships between potential NO3 reduction rates (denitrification, anammox and DNRA) with measured functional gene abundances and physico-chemical parameters. In our study, all the statistical analyses were conducted on the SPSS 19.0 software package (SPSS, Inc., Chicago, IL, USA).

3. Results

3.1. Sediment Physicochemical Parameters

The physical and chemical properties of the sediment are shown in Table 2. Sediment WC ranged from 53.80 ± 4.23% to 56.76 ± 2.78% in summer and from 50.56 ± 2.58 to 55.08 ± 2.46% in winter, and no significant spatial variations were observed in this study. The pH and salinity of sediment varied from 7.21 ± 0.04 to 8.25 ± 0.13 and from 0.13 ± 0.02 to 6.41 ± 0.39, respectively, and they exhibited an increasing tendency from the freshwater area to the high-salinity area (Table 2). Sediment TOC contents in the low-salinity area (summer: 18.73 ± 1.84 g C kg−1; winter: 18.35 ± 2.57 g C kg−1) were notably larger than those in the freshwater area (summer: 15.15 ± 1.12 g C kg−1; winter: 13.70 ± 0.56 g C kg−1) and the high-salinity area (summer: 12.53 ± 1.73 g C kg−1; winter: 11.70 ± 0.35 g C kg−1) (Table 2). Sediment TN contents varied from 0.98 ± 0.13 g N kg−1 to 2.22 ± 0.14 g N kg−1 in summer and from 1.10 ± 0.21 g N kg−1 to 2.11 ± 0.20 g N kg−1 in winter, exhibiting a similar spatial variation to TOC (Table 2). In addition, the spatial variation patterns similar to those of TOC and TN were also detected in NH4+ (36.11 ± 4.35 to 86.75 ± 9.00 mg N kg−1) and NOx (7.32 ± 0.89 to 13.89 ± 1.34 mg N kg−1). The Fe2+ contents in the sediment were generally higher in the low-salinity area than in the freshwater and high-salinity areas, but the opposite was true for Fe3+ concentrations (Table 2). The Fe2+/Fe3+ ratios in the low-salinity area were significantly larger than those in the freshwater area and high-salinity area (Table 2). Sediment sulfide concentrations varied from 2.80 ± 0.22 mg S kg−1 to 53.75 ± 11.41 mg S kg−1, and the concentrations in the low-salinity area were significantly higher than those in the freshwater and high-salinity areas (Table 2).

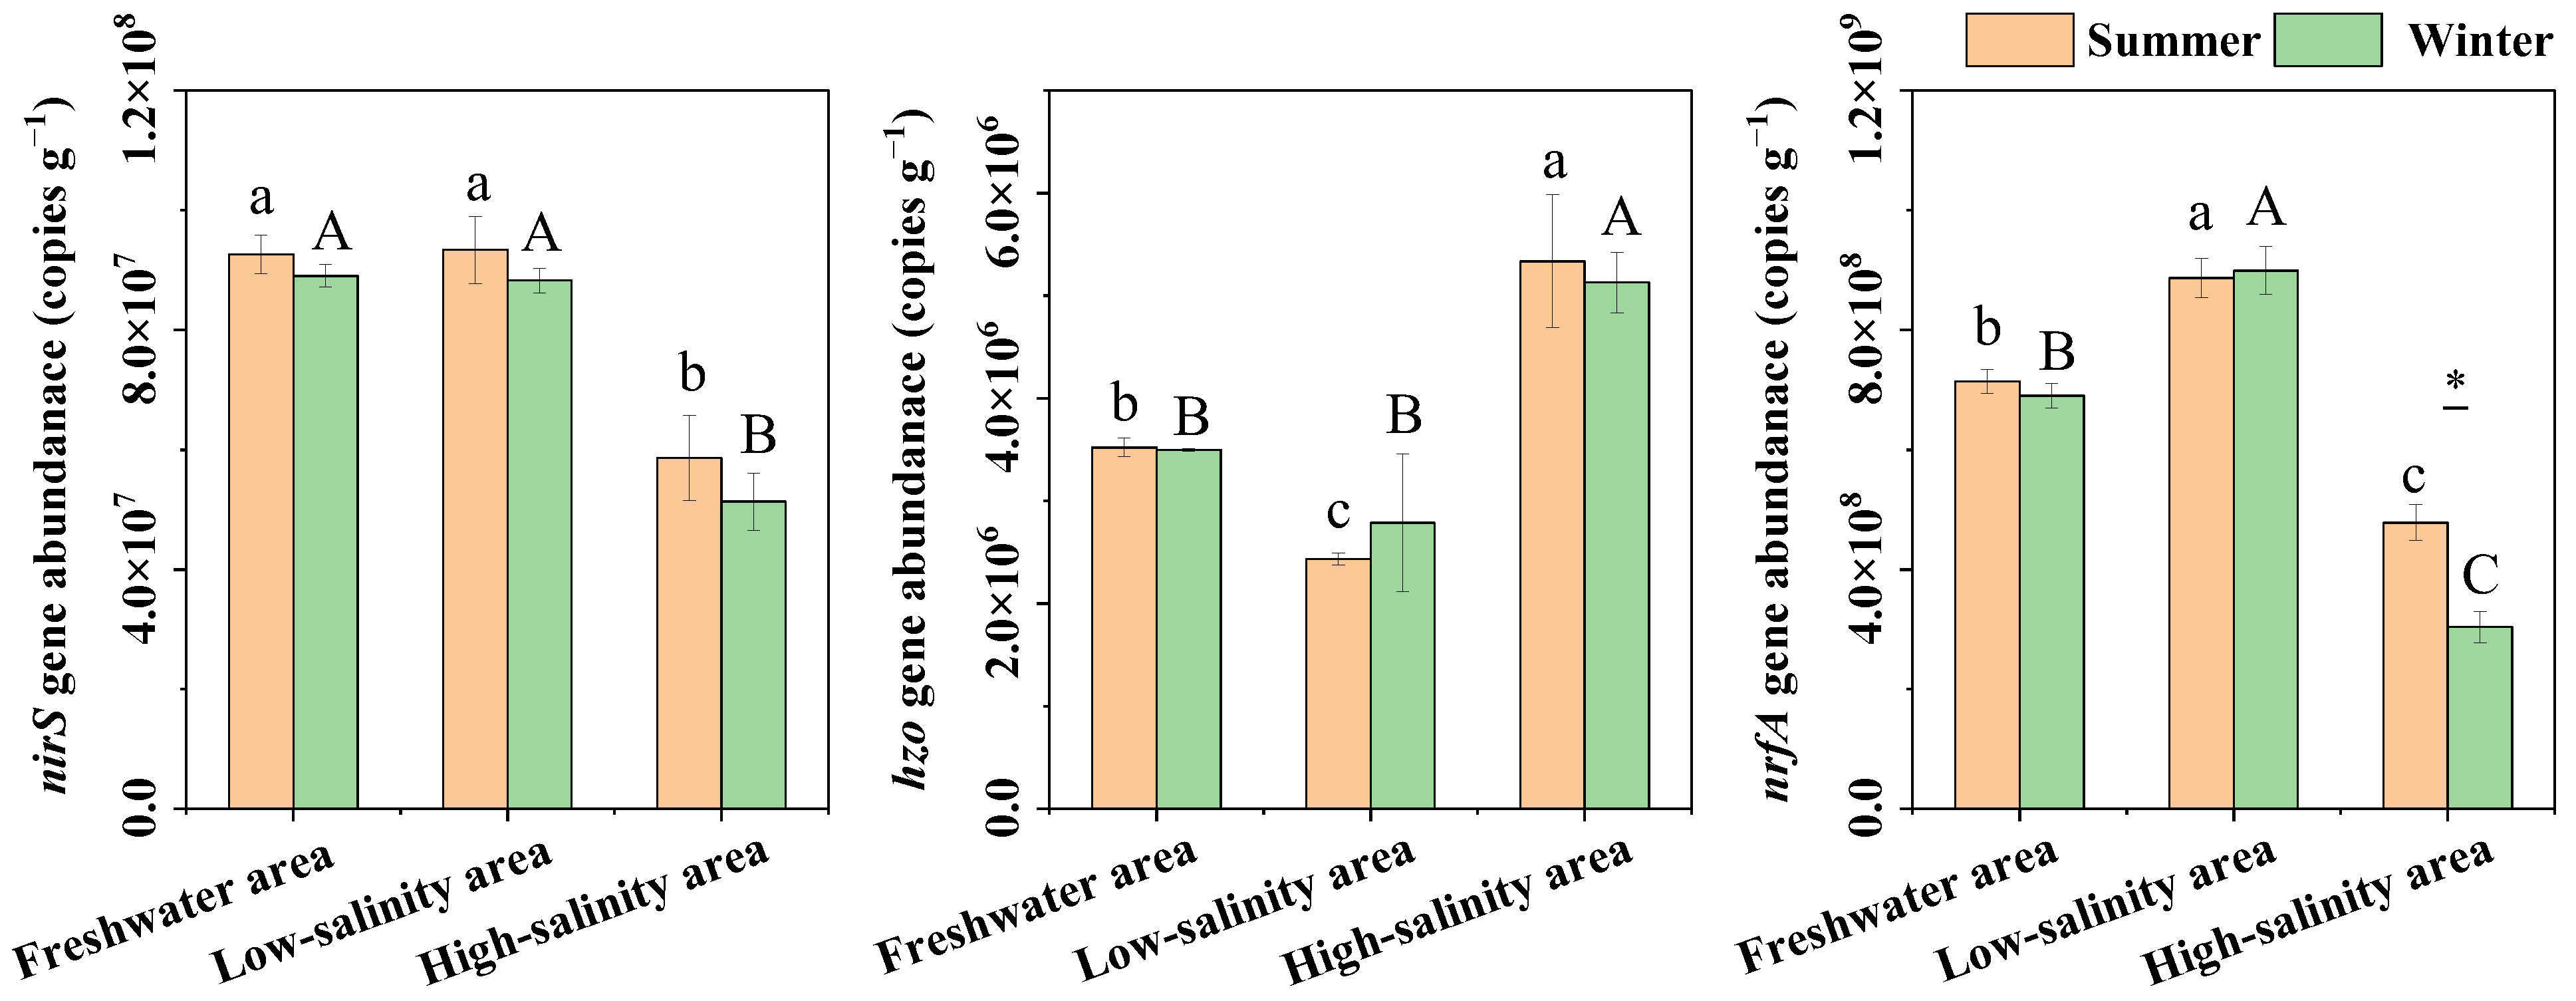
3.2. Sediment nirS, hzo, and nrfA Gene Abundance

Sediment nirS gene abundances varied from 5.86 × 10⁷ to 9.33 × 10⁷ copies g−1 in summer and from 5.13 × 10⁷ to 8.89 × 10⁷ copies g−1 in winter, and the values in the high-salinity area were significantly lower than those in the freshwater and low-salinity areas (Figure 2). The hzo abundances of the sediment were generally lower in the low-salinity (summer: 2.4 × 10⁶ ± 9.0 × 10⁴ copies g−1; winter: 2.8 × 10⁶ ± 6.7 × 10⁴ copies g−1) area than in the freshwater area (summer: 3.5 × 10⁶ ± 9.0 × 10⁴ copies g−1; winter: 3.5 × 10⁶ ± 1.4 × 10⁴ copies g−1) and the high-salinity area (summer: 5.3 × 10⁶ ± 6.5 × 10⁵ copies g−1; winter: 5.1 × 10⁶ ± 2.9 × 10⁵ copies g−1). Sediment nrfA gene abundances ranged from 3.0 × 10⁸ to 3.0 × 10⁸ copies g−1, and the highest and lowest values were observed in the low-salinity and high-salinity areas, respectively (Figure 2). In addition, no obvious seasonal changes were observed for the measured gene abundance, except for the nrfA gene in tg = he high-salinity area (Figure 2).

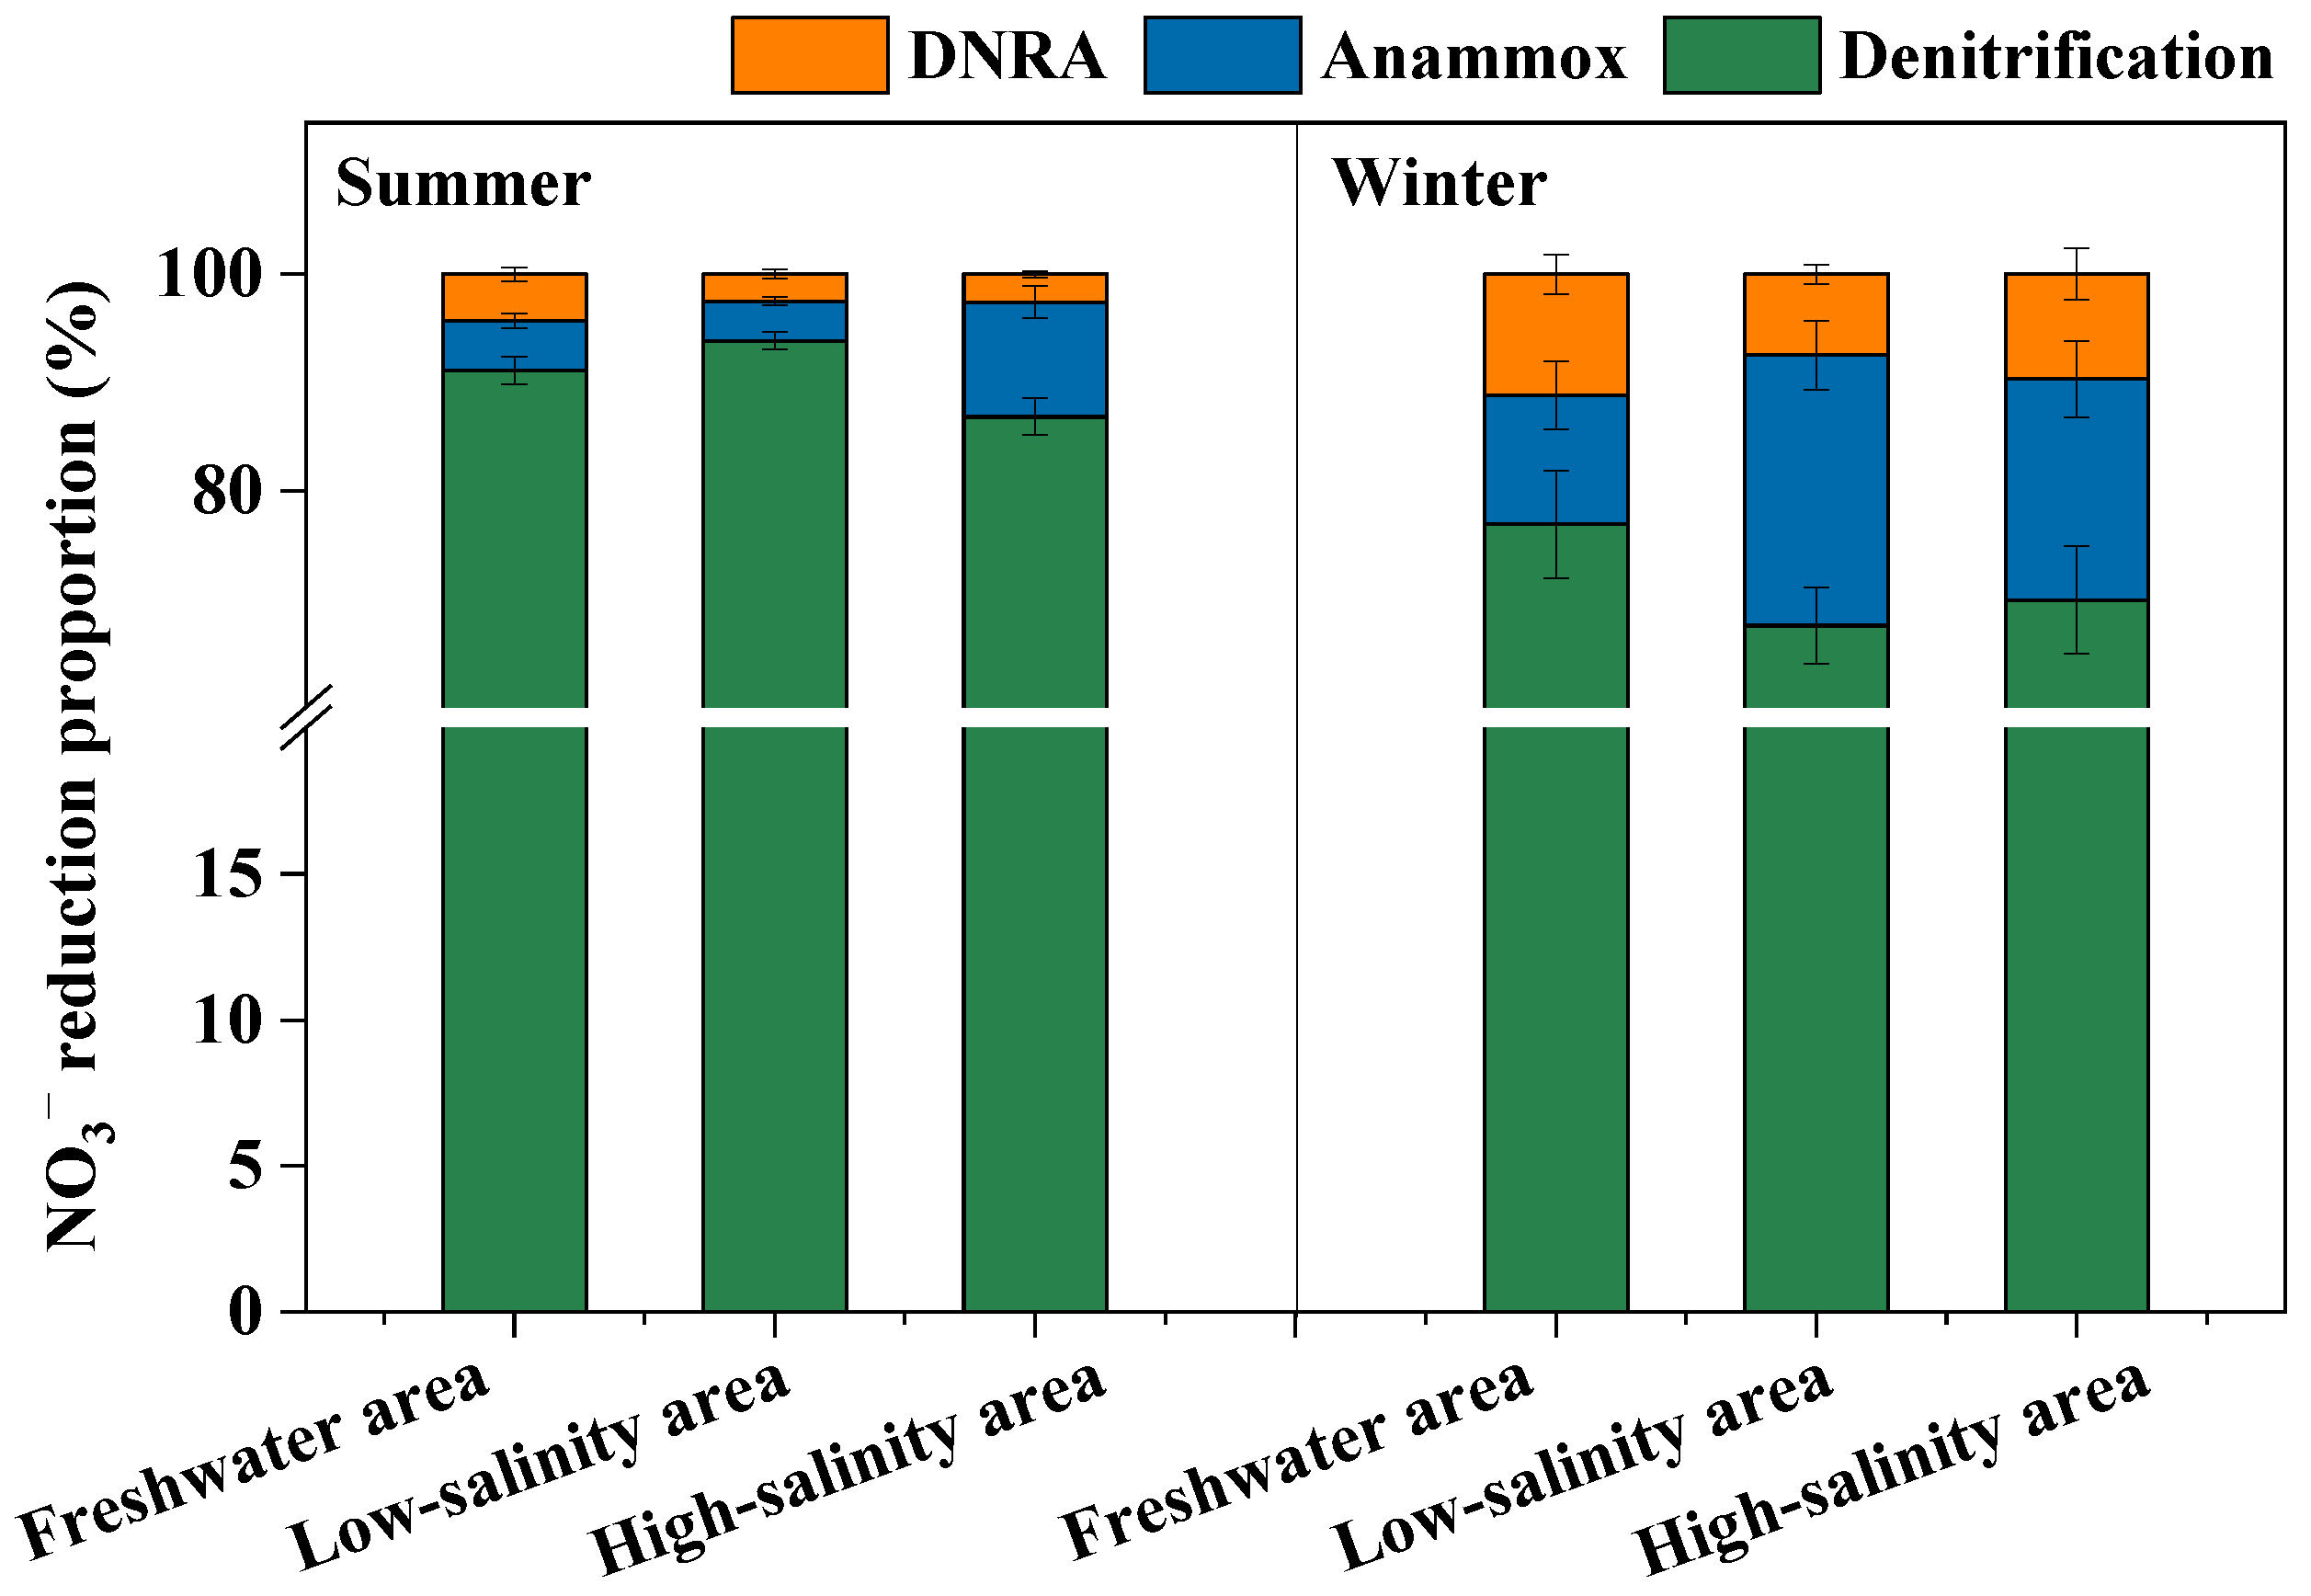
3.3. Sediment Denitrification, Anammox and DNRA Processes

Sediment denitrification rates ranged from 9.23 to 28.21 nmol g−1 h−1 in summer and from 2.33 to 5.08 nmol g−1 h−1 in winter, and summer rates were significantly higher than those in winter. Spatially, potential denitrification rates in the low-salinity area were significantly higher than in the freshwater and high-salinity areas (Figure 3). Summer anammox rates in the low-salinity and high-salinity areas were higher than those in the freshwater area, while the largest anammox rates were observed in the low-salinity area in winter (Figure 3). Potential DNRA rates varied from 0.27 to 0.73 nmol g−1 h−1 in summer and from 0.32 to 0.56 nmol g−1 h−1 in winter, and the values in the freshwater and low-salinity areas were larger than those in the high-salinity area. There were no remarkable seasonal differences in DNRA except for the freshwater area (Figure 3).
In NO3 reduction processes, denitrification was the dominant pathway, contributing 86.83 to 93.85% and 67.52 to 72.51% to the gross NO3 reduction in summer and winter, respectively (Figure 4). The anammox (summer: 3.67 to 10.57%; winter: 11.88 to 25.01%) and DNRA processes (summer: 2.48 to 4.32%; winter: 7.48 to 11.21%) also played a substantial contribution in total NO3 reduction. Denitrification contributed more NO3 reduction in winter than in summer, but the opposite was true for anammox and DNRA (Figure 4). In summer, the contribution of denitrification to total NO3 reduction in the freshwater and low-salinity area was higher than that in high-salinity areas. Conversely, in winter, the importance of denitrification to total NO3 reduction in freshwater was higher than that in the low-salinity and high-salinity areas. The changes in the contribution of anammox to NO3 reduction were opposite to those of denitrification, but there were no obvious differences in DNRA contribution across different salinity habitats (Figure 4).

3.4. Sediment Environmental Variables Influencing NO3 Reduction Rates

The relationships between NO3 reduction rates with related gene abundance and physico-chemical properties wearere shown in Table 3. Therein, potential denitrification rates were positively related to hzo and nrfA gene abundance, TOC, TN, NH4+, NO3, Fe2+, and Fe2+/Fe3+ (p < 0.05 or p < 0.01). The anammox rates were only related to salinity, TOC, TN, NH4+, NO3, Fe2+, Fe2+/Fe3+ and sulfide, but not related to other variables (Table 3). Potential DNRA rates were positively correlated with nirS and nrfA gene abundance, TOC, TN, NH4+, NO3, Fe2+, Fe2+/Fe3+ and sulfide, but negatively related to hzo gene abundance and pH (Table 3).

4. Discussion

The NO3 dissimilatory reduction processes, including denitrification, anammox and DNRA, play an important role in controlling reactive N loadings in the ecosystems of estuaries and coasts [10,11]. In this study, we explored the spatio-temporal variations in sediment NO3 reduction processes along a salinity gradient in the Yangtze Estuary. Our results showed that an obvious distribution characteristic was observed for denitrification, anammox, and DNRA rates along the salinity gradient, and the highest process rates generally occurred in low-salinity areas (Figure 3). Here, there was no significant relationship between denitrification and anammox with salinity, except for DNRA (Table 3), indicating that salinity may not be the most important factor controlling NO3 reduction process rates. Previous studies have noted that sediment denitrification and DNRA rates are tightly related to redox potential, TOC, NO3 and sulfide in aquatic environments [2,13,37]. Denitrification, anammox and DNRA are anaerobic processes, and they are favorable in low oxygen environments [5,13]. Although we did not measure the oxygen concentrations, the Fe2+/Fe3+ indicated this phenomenon (Table 2). The TOC, sulfide and NO3 can act as available electron donors and substrates for denitrification and DNRA and promote these two processes [9,16]. Additionally, many studies also indicated that anammox is easily stimulated by C and N available substrates, which can provide an advantageous condition for anammox bacteria although it does not require a direct energy source [1,5]. These speculations were supported by the positive relationships between sediment denitrification, anammox and DNRA with TOC, TN, NH4+, NOx and Fe2+/Fe3+ in the present study (Table 3). In general, the C and N substrates were larger in upriver areas because there were more loadings of terrestrial substrates here [38]. Based on this principle, denitrification, anammox and DNRA rates may show a decreasing trend from freshwater to high-salinity areas, but the same was not true for these process rates (Figure 3). The highest process rates of denitrification, anammox and DNRA in low-salinity areas were mainly attributed to the higher C and N substrate contents [10,13,16]. The sampling locations of low-salinity areas are located near the wastewater outfall with more wastewater input [26], which significantly increased sediment C and N concentration and NO3 reduction rates. Besides, the turbulent condition could increase dissolved oxygen concentration at the sediment level and consequently delay the denitrification rates [39]. Here, the turbulent condition may be more evident in the high-salinity area than in the freshwater and low-salinity areas, which helps to explain the lower denitrification rates in the high-salinity area.
In addition, many works have suggested that NO3 dissimilatory reduction processes are regulated largely by the related microorganism, and nirS, hzo and nrfA gene abundance can be regarded as an important indicator in the understanding of denitrification, anammox and DNRA process rates, respectively [19,40]. However, an obvious association was only observed between DNRA rates and the abundance of the nrfA gene (Table 3). This result implied that functional gene abundance may not be the most important factor affecting the denitrification and anammox processes. Nevertheless, functional gene abundance at the DNA level may not truly convey microbial activities [2,40], and further studies should be carried out to explore the importance of microorganisms in nitrogen transformations.
Seasonally, NO3 reduction rates in summer were generally larger than those in winter, except for anammox in low-salinity areas and DNRA in high-salinity areas (Figure 3). This phenomenon might be attributed to temperature changes [13,16]. In general, denitrification, anammox and DNRA activities are sensitive to temperature. Previous works have shown that the optimum temperatures for denitrification and anammox processes are about 25–27 °C and 30–35 °C, respectively, while DNRA rates generally increase with increasing temperature in natural ecosystems [11,41,42,43]. In this study, the temperature in summer and winter was about 32 °C and 5 °C, respectively. Hence, higher temperatures in summer can promote NO3 reduction rates to a certain extent, shaping the seasonal patterns of these process rates. However, it should be noted that summer anammox rates in low-salinity areas were lower than those in winter (Figure 3). The result might be ascribed to the fact that larger sulfide concentrations inhibit anammox activity in high-temperature conditions [13], but this needs to be confirmed further.
Reactive N loadings in the environments of estuaries and coasts have significantly increased over the past century, which resulted in a series of eco-environmental problems [44,45]. Hence, N transformation processes and their ultimate fate have attracted much attention in estuarine and coastal ecosystems [10,13,16]. A comprehensive understanding of sediment NO3 reduction processes and relative contributions along estuarine salinity gradient is indispensable in the context of high N loadings [2,16]. In the present study, denitrification dominated the total NO3 reduction process (summer: 86.83 to 93.85%; winter: 67.52 to 72.51%), while anammox (summer: 3.67 to 10.57%; winter: 11.88 to 25.01%) and DNRA (summer: 2.48 to 4.32%; winter: 7.48 to 11.21%) also played a substantially important role in NO3 reduction (Figure 4). The relative proportions of denitrification, anammox and DNRA to gross NO3 reduction in this study area were comparable to other estuarine and coastal wetlands [13,16,42,46]. This implied that denitrification played a vital role in eliminating reactive N loads, and we also should consider the anammox and DNRA processes when evaluating the NO3 reduction processes and their fate in these estuarine and coastal zones. Additionally, the importance of DNRA in gross NO3 reduction in winter was markedly higher than that in summer, indicating reactive N retention in winter was larger than in summer. It should be noted that the contributions of denitrification and DNRA in high-salinity areas were generally lower and higher than those in freshwater areas, respectively (Figure 4), suggesting that the estimations of reactive N budgets in different salinity areas should be based on actual environmental variables [13,16]. Overall, our study provided valuable information about the N transformation processes in estuarine zones, which was helpful for us to comprehend the control of reactive N loadings.

5. Conclusions

In the present study, we explored the anaerobic NO3 reduction process dynamics along the estuarine salinity gradient. Potential denitrification, anammox and DNRA process rates showed a large spatio-temporal variation, ranging from 2.33 to 28.21 nmol g−1 h−1, 0.43 to 1.87 nmol g−1 h−1 and 0.28 to 0.74 nmol g−1 h−1, respectively. The NO3 reduction processes in low-salinity areas were generally higher than those in freshwater and high-salinity areas due to the higher available C and N substrate. Denitrification was the dominant process (67.52 to 93.85%) in total NO3 reduction, while anammox (3.67 to 25.01%) and DNRA (2.48 to 11.21%) also played a substantial contribution in NO3 reduction. The proportions of denitrification and DNRA to NO3 reduction in high-salinity areas were lower and higher than those in freshwater areas, respectively. Sediment TOC, TN, NH4+ and NO3, rather than salinity and relevant gene abundance, were the important environmental variables affecting NO3 reduction process rates and proportions. These results highlighted that changes in sediment environmental variables caused by human activities can alter the distribution patterns of NO3 reduction processes.

Author Contributions

Conceptualization: X.L., M.L. and L.G.; Sampling: L.G. and C.L.; Formal analysis and Investigation: L.G. and C.L.; Writing—review and editing: L.G., X.L., M.L. and C.L. All authors have read and agreed to the published version of the manuscript.

Funding

This work was supported by the Natural Science Foundation of China (grant numbers: 42001088, 42007208, and 31970486). It was also funded by the Youth Innovation Support Program of Shandong Universities (2021KJ081), the Open Science Foundation of Key Laboratory of Marine Environmental Survey Technology and Application (MESTA-2021-A003), the Guangdong Basic and Applied Basic Research Foundation (2020A1515010908), and the Science and Technology Program of Guangzhou (No. 202002030453). Thanks are given to the editor and anonymous reviewers for valuable comments on this manuscript.

Conflicts of Interest

The authors declare no conflict of interest.

References

  1. Zhang, Y.H.; Wang, L.; Xie, X.J.; Huang, L.D.; Wu, Y.H. Effects of invasion of Spartina alterniflora and exogenous N deposition on N2O emissions in a coastal salt marsh. Ecol. Eng. 2013, 58, 77–83. [Google Scholar] [CrossRef]
  2. Damashek, J.; Francis, C.A. Microbial Nitrogen Cycling in Estuaries: From Genes to Ecosystem Processes. Estuar. Coast. 2018, 41, 626–660. [Google Scholar] [CrossRef]
  3. Lin, G.M.; Huang, J.; Lu, J.G.; Su, M.; Hu, B.Q.; Lin, X.B. Geochemical and Microbial Insights into Vertical Distributions of Genetic Potential of N-cycling Processes in Deep-sea Sediments. Ecol. Indic. 2021, 125, 107461. [Google Scholar] [CrossRef]
  4. Canfield, D.E.; Glazer, A.N.; Falkowski, P.G. The evolution and future of Earth’s nitrogen cycle. Science 2010, 330, 192–196. [Google Scholar] [CrossRef] [PubMed] [Green Version]
  5. Deng, F.Y.; Hou, L.J.; Liu, M.; Zheng, Y.L.; Yin, G.Y.; Li, X.F.; Lin, X.B.; Chen, F.; Gao, J.; Jiang, X.F. Dissimilatory nitrate reduction processes and associated contribution to nitrogen removal in sediments of the Yangtze Estuary. J. Geophys. Res. Biogeosci. 2015, 120, 1521–1531. [Google Scholar] [CrossRef]
  6. Chen, F.; Hou, L.; Liu, M.; Zheng, Y.; Yin, G.; Lin, X.; Li, X.F.; Zong, H.B.; Deng, F.Y.; Gao, J.; et al. Net anthropogenic nitrogen inputs (NANI) into the Yangtze River basin and the relationship with riverine nitrogen export. J. Geophys. Res. Biogeosci. 2016, 121, 451–465. [Google Scholar] [CrossRef] [Green Version]
  7. Hou, L.J.; Zheng, Y.L.; Jiang, X.F. Anaerobic ammonium oxidation and its contribution to nitrogen removal in China’s coastal wetlands. Sci. Rep. 2015, 5, 15621. [Google Scholar] [CrossRef]
  8. Wankel, S.D.; Ziebis, W.; Buchwald, C.; Charoenpong, C.; de Beer, D.; Dentinger, J.; Xu, Z.J.; Zengler, K. Evidence for fungal and chemodenitrification based N2O flux from nitrogen impacted coastal sediments. Nat. Commun. 2017, 8, 15595. [Google Scholar] [CrossRef]
  9. Hardison, A.K.; Algar, C.K.; Giblin, A.E.; Rich, J.J. Influence of organic carbon and nitrate loading on partitioning between dissimilatory nitrate reduction to ammonium (DNRA) and N2 production. Geochim. Cosmochim. Acta 2015, 164, 146–160. [Google Scholar] [CrossRef] [Green Version]
  10. Plummer, P.; Tobias, C.; Cady, D. Nitrogen reduction pathways in estuarine sediments: Influences of organic carbon and sulfide. J. Geophys. Res. Biogeosci. 2015, 120, 1958–1972. [Google Scholar] [CrossRef] [Green Version]
  11. Dong, L.F.; Sobey, M.N.; Smith, C.J.; Rusmana, I.; Phillips, W.; Stott, A.; Osborn, A.M.; Nedwell, D.B. Dissimilatory reduction of nitrate to ammonium, not denitrification or anammox, dominates benthic nitrate reduction in tropical estuaries. Limnol. Oceanogr. 2011, 56, 279–291. [Google Scholar] [CrossRef]
  12. Murphy, A.E.; Anderson, I.C.; Smyth, A.R.; Song, B.; Luckenbach, M.W. Microbial nitrogen processing in hard clam (Mercenaria mercenaria) aquaculture sediments: The relative importance of denitrification and dissimilatory nitrate reduction to ammonium (DNRA). Limnol. Oceanogr. 2016, 61, 1589–1604. [Google Scholar] [CrossRef] [Green Version]
  13. Gao, D.Z.; Li, X.F.; Lin, X.B.; Wu, D.M.; Jin, B.S.; Huang, Y.P.; Liu, M.; Chen, X. Soil dissimilatory nitrate reduction processes in the Spartina alterniflora invasion chronosequences of a coastal wetland of southeastern China: Dynamics and environmental implications. Plant Soil 2017, 421, 383–399. [Google Scholar] [CrossRef]
  14. Cao, W.; Yang, J.; Li, Y.; Liu, B.; Wang, F.; Chang, C. Dissimilatory nitrate reduction to ammonium conserves nitrogen in anthropogenically affected subtropical mangrove sediments in Southeast China. Mar. Pollut. Bull. 2016, 110, 155–161. [Google Scholar] [CrossRef] [PubMed]
  15. Lin, X.B.; Liu, M.; Hou, L.J.; Gao, D.Z.; Li, X.F.; Lu, K.J.; Gao, J. Nitrogen Losses in Sediments of the East China Sea: Spatiotemporal Variations, Controlling Factors, and Environmental Implications. J. Geophys. Res. Biogeosci. 2017, 122, 2699–2715. [Google Scholar] [CrossRef]
  16. Huang, F.J.; Lin, X.B.; Hu, W.F.; Zeng, F.; He, L.; Yin, K.D. Nitrogen Cycling Processes in Sediments of the Pearl River Estuary: Spatial Variations, Controlling Factors, and Environmental Implications. Catena 2021, 206, 105545. [Google Scholar] [CrossRef]
  17. Zhou, Z.J.; Ge, L.; Huang, Y.F.; Liu, Y.Q.; Wang, S.Y. Coupled relationships among anammox, denitrification, and dissimilatory nitrate reduction to ammonium along salinity gradients in a Chinese estuarine wetland. J. Environ. Sci. 2021, 106, 39–46. [Google Scholar] [CrossRef]
  18. Gao, J.; Hou, L.J.; Zheng, Y.L.; Liu, M.; Yin, G.Y.; Li, X.F.; Lin, X.B.; Yu, C.D.; Wang, R.; Jiang, X.F.; et al. nirS-Encoding denitrifier community composition, distribution, and abundance along the coastal wetlands of China. Appl. Microbiol. Biot. 2016, 100, 8573–8582. [Google Scholar] [CrossRef]
  19. An, Z.R.; Gao, D.Z.; Chen, F.Y.; Wu, L.; Zhou, J.; Zhang, Z.X.; Dong, H.P.; Yin, G.Y.; Han, P.; Liang, X.; et al. Crab bioturbation alters nitrogen cycling and promotes nitrous oxide emission in intertidal wetlands: Influence and microbial mechanism. Sci. Total Environ. 2021, 797, 149176. [Google Scholar] [CrossRef]
  20. Lin, X.B.; Zheng, P.F.; Zou, S.B.; Sun, F.F.; Zhang, X.L.; Gong, J. Seagrass (Zostera marina) Promotes Nitrification Potential and Selects Specific Ammonia Oxidizers in Coastal Sediments. J. Soil Sediment 2021, 21, 3259–3273. [Google Scholar] [CrossRef]
  21. Huang, F.J.; Lin, X.B.; Yin, K.D. Effects of Marine Produced Organic Matter on the Potential Estuarine Capacity of NOx Removal. Sci. Total Environ. 2022, 812, 151471. [Google Scholar] [CrossRef] [PubMed]
  22. Neubauer, S.C.; Franklin, R.B.; Berrier, D.J. Saltwater intrusion into tidal freshwater marshes alters the biogeochemical processing of organic carbon. Biogeosciences 2013, 10, 8171–8183. [Google Scholar] [CrossRef] [Green Version]
  23. Wang, X.M.; Hu, M.J.; Ren, H.C.; Li, J.B.; Tong, C.; Musenze, R.S. Seasonal variations of nitrous oxide fluxes and soil denitrification rates in subtropical freshwater and brackish tidal marshes of the Min River estuary. Sci. Total Environ. 2018, 616, 1404–1413. [Google Scholar] [CrossRef] [PubMed]
  24. Yin, G.Y.; Hou, L.J.; Liu, M.; Li, X.F.; Zheng, Y.L.; Gao, J.; Lin, X.B. DNRA in intertidal sediments of the Yangtze Estuary. J. Geophys. Res. Biogeosci. 2017, 122, 1988–1998. [Google Scholar] [CrossRef]
  25. Hou, L.J.; Wang, R.; Yin, G.Y.; Liu, M.; Zheng, Y.L. Nitrogen fixation in the intertidal sediments of the Yangtze Estuary: Occurrence and environmental implications. J. Geophys. Res. Biogeosci. 2018, 123, 936–944. [Google Scholar] [CrossRef]
  26. Wang, D.Q.; Chen, Z.L.; Wang, J.; Xu, S.Y.; Yang, H.X.; Chen, H.; Yang, L.Y.; Hu, L.Z. Summer-time denitrification and nitrous oxide exchange in the intertidal zone of the Yangtze Estuary. Estuar. Coast. Shelf Sci. 2007, 73, 43–53. [Google Scholar] [CrossRef]
  27. Wei, H.C.; Lin, X.B. Shifts in the relative abundance and potential rates of sediment ammonia-oxidizing archaea and bacteria along environmental gradients of an urban river-estuary-adjacent sea continuum. Sci. Total Environ. 2021, 771, 144824. [Google Scholar] [CrossRef]
  28. Zhang, W.L.; Zeng, C.S.; Tong, C.; Zhai, S.J.; Lin, X.; Gao, D.Z. Spatial distribution of phosphorus speciation in marsh sediments along a hydrologic gradient in a subtropical estuarine wetland, China. Estuar. Coast. Shelf Sci. 2015, 154, 30–38. [Google Scholar] [CrossRef]
  29. Lin, X.B.; Hou, L.J.; Liu, M.; Li, X.F.; Zheng, Y.L.; Yin, G.Y.; Gao, J.; Jiang, X.F. Nitrogen mineralization and immobilization in sediments of the East China Sea: Spatiotemporal variations and environmental implications. J. Geophys. Res. Biogeosci. 2016, 121, 2842–2855. [Google Scholar] [CrossRef]
  30. Liu, R.; Lin, X.B.; Wang, G.Q.; Liu, X. Natural N-bearing Nanoparticles in Sediments of a Shallow Bay of the South China: A New N Form in N-cycling. Ecol. Indic. 2021, 122, 107281. [Google Scholar] [CrossRef]
  31. Luo, M.; Zeng, C.S.; Tong, C.; Huang, J.F.; Yu, Q.; Guo, Y.B.; Wang, S.H. Abundance and speciation of iron across a subtropical tidal marsh of the Min River Estuary in the East China Sea. Appl. Geochem. 2014, 45, 1–13. [Google Scholar] [CrossRef]
  32. Cline, J.D. Spectrophotometric determination of hydrogen sulfide in natural waters. Limnol. Oceanogr. 1969, 14, 454–458. [Google Scholar] [CrossRef]
  33. Wei, H.C.; Gao, D.Z.; Liu, Y.; Lin, X.B. Sediment nitrate reduction processes in response to environmental gradients along an urban river-estuary-sea continuum. Sci. Total Environ. 2020, 718, 137185. [Google Scholar] [CrossRef] [PubMed]
  34. Throback, I.N.; Enwall, K.; Jarvis, A.; Hallin, S. Reassessing PCR primers targeting nirS, nirK and nosZ genes for community surveys of denitrifying bacteria with DGGE. FEMS Microbiol. Ecol. 2004, 49, 401–417. [Google Scholar] [CrossRef]
  35. Fu, L.L.; Chen, Y.Y.; Li, S.Q.; He, H.; Mi, T.Z.; Zhen, Y.; Yu, Z.G. Shifts in the anammox bacterial community structure and abundance in sediments from the Changjiang Estuary and its adjacent area. Syst. Appl. Microbiol. 2019, 42, 383–396. [Google Scholar] [CrossRef]
  36. Yin, G.Y.; Hou, L.J.; Liu, M.; Liu, Z.F.; Gardner, W.S. A Novel Membrane Inlet Mass Spectrometer Method to Measure (NH4+)-N15 for Isotope-Enrichment Experiments in Aquatic Ecosystems. Environ. Sci. Technol. 2014, 48, 9555–9562. [Google Scholar] [CrossRef]
  37. Li, N.; Li, B.; Nie, M.; Wu, J. Effects of exotic Spartina alterniflora on saltmarsh nitrogen removal in the Yangtze River Estuary, China. J. Clean. Prod. 2020, 271, 122557. [Google Scholar] [CrossRef]
  38. Maie, N.; Boyer, J.N.; Yang, C.; Jaffe, R. Spatial, geomorphological, and seasonal variability of CDOM in estuaries of the Florida Coastal Everglades. Hydrobiologia 2006, 569, 135–150. [Google Scholar] [CrossRef]
  39. O’Connor, B.L.; Hondzo, M. Enhancement and inhihition of denitrification by fluid-flow and dissolved oxygen flux to stream sediments. Environ. Sci. Technol. 2008, 42, 119–125. [Google Scholar] [CrossRef]
  40. Shan, J.; Zhao, X.; Sheng, R.; Xia, Y.Q.; Ti, C.P.; Quan, X.F.; Wang, S.W.; Wei, W.X.; Yan, X.Y. Dissimilatory nitrate reduction processes in typical Chinese Paddy soils: Rates, relative contributions, and influencing factors. Environ. Sci. Technol. 2016, 50, 9972–9980. [Google Scholar] [CrossRef]
  41. Egli, K.; Fanger, U.; Alvarez, P.J.; Siegrist, H.; van der Meer, J.R.; Zehnder, A.J. Enrichment and characterization of an anammox bacterium from a rotating biological contactor treating ammonium-rich leachate. Arch. Microbiol. 2001, 175, 198–207. [Google Scholar] [CrossRef]
  42. Canion, A.; Overholt, W.A.; Kostka, J.E.; Huettel, M.; Lavik, G.; Kuypers, M.M. Temperature response of denitrification and anaerobic ammonium oxidation rates and microbial community structure in Arctic fjord sediments. Environ. Microbiol. 2014, 16, 3331–3344. [Google Scholar] [CrossRef] [PubMed]
  43. Smith, C.J.; Dong, L.F.; Wilson, J.; Stott, A.; Osborn, A.M.; Nedwell, D. Seasonal variation in denitrification and dissimilatory nitrate reduction to ammonia process rates and corresponding key functional genes along an estuarine nitrate gradient. Front. Microbiol. 2015, 6, 542. [Google Scholar] [CrossRef] [PubMed]
  44. Cui, S.H.; Shi, Y.L.; Groffman, P.M.; Schlesinger, W.H.; Zhu, Y.G. Centennial-scale analysis of the creation and fate of reactive nitrogen in China (1910–2010). Proc. Natl. Acad. Sci. USA 2013, 110, 2052–2057. [Google Scholar] [CrossRef] [PubMed] [Green Version]
  45. Lin, G.M.; Lin, X.B. Bait input altered microbial community structure and increased greenhouse gases production in coastal wetland sediment. Water Res. 2022, 218, 118520. [Google Scholar] [CrossRef]
  46. Li, N.; Li, B.; Nie, M.; Wu, J.H.; Zhao, J.Y. Contrasting effects of aboveground litters of native Phragmites australis and invasive Spartina alterniflora on nitrification and denitrification. Sci. Total Environ. 2021, 764, 144283. [Google Scholar] [CrossRef]
Figure 1. The geographical location of the Yangtze Estuary and sampling locations.
Jmse 10 00761 g001
Figure 2. The functional gene abundance in the freshwater, low-salinity and high-salinity area. Different lowercase and uppercase letters indicate significant spatial differences (p < 0.05), and the asterisks denote significant seasonal differences (p < 0.05).
Jmse 10 00761 g002
Figure 3. Sediment NO3 reduction process rates in the freshwater, low-salinity and high-salinity area. Different lowercase and uppercase letters indicate significant spatial differences (p < 0.05), and the asterisks denote significant seasonal differences (p < 0.05).
Jmse 10 00761 g003
Figure 4. The proportions of denitrification, anammox and DNRA to gross NO3 reduction in the freshwater, low-salinity and high-salinity area.
Jmse 10 00761 g004
Table 1. Primers and qPCR protocols used in the present study.
Target GenesPrimersSequence (5′-3′)PCR ConditionsReference
nirScd3aFGTSAACGTSAAGGARACSGG50 °C for 2 min, 95 °C for 10 min, 45 × [95 °C for 30 s, 58 °C for 40 s, 72 °C for 1 min][34]
R3cdGASTTCGGRTGSGTCTTGA
hzohzo5FAGTATGGGTATGTCHAATG50 °C for 2 min, 95 °C for 10 min, 45 × [94 °C for 50 s, 54 °C for 1 min, 72 °C for 40 s][35]
hzo5RCATCWGTCCATACCAAA
nrfAnrfA-2FCACGACAGCAAGACTGCCG50 °C for 2 min, 95 °C for 10 min, 40 × [95 °C for 30 s, 60 °C for 1 min, 72 °C for 1 min][24]
nrfA-2RCCGGCACTTTCGAGCCC
Table 2. Sediment physico-chemical properties in the freshwater, low-salinity and high-salinity area.
SummerWinter
Freshwater
Area
Low-Salinity
Area
High-Salinity
Area
Freshwater
Area
Low-Salinity
Area
High-Salinity
Area
WC (%)56.76 ± 2.78 a56.54 ± 3.38 a53.80 ± 4.23 a54.26 ± 2.94 A55.08 ± 2.46 A50.56 ± 2.85 A
pH7.25 ± 0.22 c7.95 ± 0.14 b8.25 ± 0.13 a7.21 ± 0.04 C7.82 ± 0.13 B8.21 ± 0.11 A
Salinity0.13 ± 0.02 c0.28 ± 0.04 b5.48 ± 0.50 a0.13 ± 0.02 C0.28 ± 0.02 B6.41 ± 0.39 A
TOC (g C kg−1)15.15 ± 1.12 b18.73 ± 1.84 a12.53 ± 1.73 b13.70 ± 0.56 B18.35 ± 2.57 A11.70 ± 0.35 C
TN (g N kg−1)1.14 ± 0.01 b2.22 ± 0.14 a0.98 ± 0.13 c1.19 ± 0.16 B2.11 ± 0.20 A1.10 ± 0.21 B
NH4+ (mg N kg−1)50.39 ± 5.65 b86.75 ± 9.00 a36.11 ± 4.35 c42.39 ± 5.40 B78.98 ± 5.28 A36.12 ± 4.90 B
NOx (μg N kg−1)8.49 ± 2.31 b13.75 ± 1.42 a7.54 ± 0.95 b8.00 ± 1.71 B13.89 ± 1.34 A7.32 ± 0.89 B
Fe2+ (g Fe kg−1)1.37 ± 0.32 b2.07 ± 0.34 a1.24 ± 0.13 b1.27 ± 0.10 B1.81 ± 0.22 A1.19 ± 0.19 B
Fe3+ (g Fe kg−1)1.28 ± 0.51 a0.93 ± 0.17 a1.08 ± 0.15 a1.18 ± 0.13 A1.02 ± 0.08 A1.04 ± 0.13 A
Fe2+/Fe3+1.12 ± 0.18 b2.23 ± 0.24 a1.17 ± 0.28 b1.08 ± 0.10 B1.77 ± 0.18 A1.15 ± 0.11 B
Sulfide (mg S kg−1)3.72 ± 0.44 b48.84 ± 7.86 a2.80 ± 0.22 c3.55 ± 0.63 B53.75 ± 11.41 A2.49 ± 0.84 B
Different lowercase and uppercase letters indicate significant spatial differences (p < 0.05).
Table 3. The relationships between NO3 reduction rates with relevant gene abundance and physico-chemical properties.
nirShzonrfAWCpHSalinityTOC
Denitrification0.45−0.49 *0.50 *0.420.07−0.180.53 *
Anammox0.10−0.270.460.050.37−0.63 **0.53 *
DNRA0.79 **−0.85 **0.78 **0.43−0.340.100.77 **
TNNH4+NOxFe2+Fe3+Fe2+/Fe3+Sulfide
Denitrification0.53 *0.60 *0.48 *0.64 **−0.170.69 **0.45
Anammox0.66 **0.61 **0.64 **0.56 *−0.210.55 *0.76 **
DNRA0.72 **0.81 **0.68 **0.75 **0.070.62 **0.62 **
* p < 0.05, ** p < 0.01, n = 18.
Publisher’s Note: MDPI stays neutral with regard to jurisdictional claims in published maps and institutional affiliations.

