Article

Effect of Aquaculture Reclamation on Sediment Nitrates Reduction Processes in Mangrove Wetland

1
School of Geographical Sciences, Fujian Normal University, Fuzhou 350007, China
2
Institute of Geography, Fujian Normal University, Fuzhou 350007, China
3
Fujian Provincial Key Laboratory for Plant Eco-Physiology, Fujian Normal University, Fuzhou 350007, China
*
Author to whom correspondence should be addressed.
J. Mar. Sci. Eng. 2022, 10(7), 857; https://doi.org/10.3390/jmse10070857
Submission received: 8 May 2022 / Revised: 9 June 2022 / Accepted: 9 June 2022 / Published: 23 June 2022
(This article belongs to the Special Issue Advances in Marine Nitrogen Cycle)

Abstract

:
Sediment denitrification, anaerobic ammonium oxidation (anammox), and nitrate dissimilation to ammonium (DNRA) play an important role in controlling the dynamics of nitrates (NOx) and their fate in estuarine and coastal ecosystems. However, the effects of land-use change on NOx reduction processes in mangrove sediments are still unclear. Here, we used a mud experiment method combined with a 15N stable isotope tracer method to study the mechanism and ecological environment of the change of land use pattern on the sediment NOx reduction processes in mangrove wetlands. Our study showed that most physicochemical parameters, NOx reduction rates, and their gene abundances varied considerably. The denitrification, anammox, and DNRA rates in mangrove sediment cores were in a range of 1.04–4.24 nmol g−1 h−1, 0.14–0.36 nmol g−1 h−1, and 0–2.72 nmol g−1 h−1, respectively. The denitrification, anammox, and DNRA rates in aquaculture sediment cores were in a range of 1.06–10.96 nmol g−1 h−1, 0.13–0.37 nmol g−1 h−1, and 0–1.96 nmol g−1 h−1, respectively. The highest values of denitrification, anammox, DNRA, the contribution of denitrification and DNRA to total NOx reduction (DEN% and DNRA%), gene abundances (nirS, Amx 16S rRNA, and nrfA), total organic carbon (TOC), total nitrogen (TN), and TOC/TN in sediments were generally found in the top layer (0–5 cm) and then decreased with depth, while the contribution of anammox to total NOx reduction (ANA%), Fe2+, and Fe2+/Fe3+ were generally increased with sediment depth in both mangrove and aquaculture ecosystems. When mangrove wetlands are transformed into pools, some properties (including TOC, TN, and Fe3+), DNRA rates, DRNA%, and nrfA gene abundances were decreased, while some properties (including NH4+, TOC/TN, Fe2+, and Fe2+/Fe3+), denitrification rates, DEN%, nirS, and ANAMMOX 16S gene abundances were increased. Sediment organic matter (TOC and TN) content and Fe2+ both affected NO3 reduction rates, with organic matter the most prominent factor. Thus, aquaculture reclamation enhances N loss while reducing N retention in sediments of mangrove wetlands, which plays an important role in regulating the source and fate of reactive N in mangrove ecosystems.

1. Introduction

Nitrogen (N) pollution has become increasingly aggravated in global estuarine and coastal ecosystems, in part from increased N inputs from anthropogenic activities [1,2,3,4]. Human activities, especially sewage discharge, agricultural fertilization, and industrial wastewater, have caused a series of environmental problems in estuarine and coastal regions [4,5,6], such as coastal eutrophication globally (McCrackin et al., 2017), increased harmful algal blooms [7], seasonal hypoxia [8], and nitrous oxide (N2O) emission [9], further tipping the balance of N biogeochemical cycles severely. The coastal wetland is a critical link between the land and the sea, which plays an important role in the removal of nutrients [10]. In general, the excess reactive N in estuarine and coastal ecosystems mostly comes in the form of NO3 and NH4+ [11,12,13,14]. Thus, our research mainly focuses on sediment NOx reduction processes, which play a dominant role in estuarine and coastal ecosystems.
Mangrove wetlands have significant eco-environmental functions such as bank protection, maintaining coastal biodiversity and fishery resources, and purifying water quality, but their direct economic value is not prominent, as they belong to the coastal ecosystem whose value is easy to underestimate [15,16]. The global mangrove wetlands are seriously degraded, and the area continues to shrink mainly due to human activities. Global mangrove areas have decreased by about 30–50%, most of which have been changed to agricultural land such as breeding ponds, paddy fields, orchards, and vegetable fields in the past half-century [17]. Thus, most previous studies have focused on the effects of the reclamation of mangrove ecological service functions, carbon storage, and greenhouse gas release [18,19,20,21]. Aquaculture is an important complement to the supply of global fishery resources. Coastal earthen ponds from tidal flat reclamation accounted for ~28% of the total mariculture area in 2016, which contributed to more than 31% of the total mariculture production [16]. Aquaculture has sustained aquatic food production but has also led to a host of environmental problems such as hypoxia expansion, increased eutrophication, and accelerating greenhouse gas emissions [16,22]. Thus, it is of ecological and environmental significance to investigate the N cycles in the land-use conversion of coastal wetlands for aquaculture.
Mangroves can remove ~6% of anthropogenic N inputs to the environment through multiple biochemical and physical processes [23], including denitrification, anammox, microbial activities, physical transport, and N burial [24]. Denitrification, anammox, and DNRA are mainly microbially-mediated NOx reduction processes, and their functional genes nirS, anammox 16S rRNA, and nrfA are used as molecular markers to indirectly reflect the activities of NOx reduction processes [25]. Denitrification and anammox in mangrove sediments could reduce reactive N pollution by converting NOx to harmless N2 into the atmosphere [26]. Furthermore, mangrove wetlands could provide suitable habitats for NOx reduction processes due to an anaerobic sediment environment [23]. However, previous studies related to NOx reduction processes in mangrove ecosystems focused on one or two processes (e.g., denitrification and anammox or DNRA) [27,28]. Simultaneous research on denitrification, anammox, and DNRA rates and their contributions to NOx reduction processes is still lacking after mangrove wetlands were reclaimed for aquaculture.
Here, the mature native Kandelia obovata (>40 years) and adjacent aquaculture ecosystems, which are located on Qi’ao Island in Zhuhai City, were selected as the study sites. We used a 15N stable isotope pairing and quantitative PCR assays to investigate the dynamics of sediment NOx reduction processes and associated gene abundances in these two ecosystems. The main objectives of this study were to explore the effect of aquaculture reclamation on the sediment denitrification, anammox, and DNRA and their relative contribution to NOx reduction processes in mangrove wetlands. The specific questions addressed were as follows: (1) What are the controlling factors of sediment N loss and retention in those two habitats? (2) Is partitioning between DNRA and N loss significantly changed by aquaculture reclamation?

2. Materials and Methods

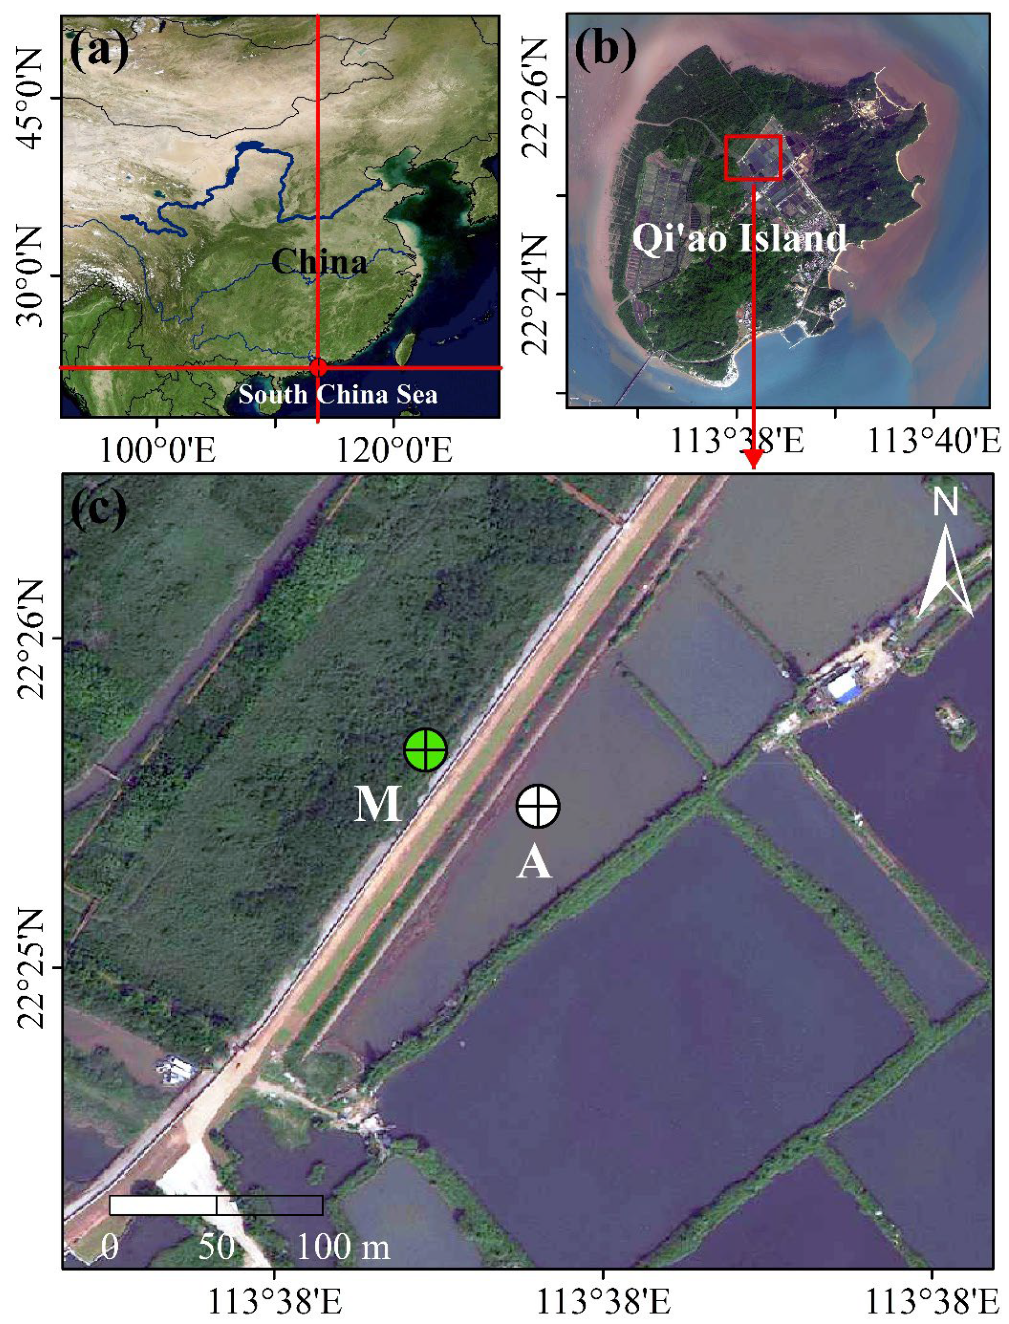
2.1. Study Area and Sampling

The study was conducted in mangroves of the subtropical region of Qi’ao Island, Guangdong Province, China (22.39–22.46° N, 113.61–113.65° E) [29]. This area is characterized by a southern subtropical maritime monsoon climate with an annual temperature and rainfall of 22.4 °C and 1964.4 mm, respectively. The tide is an irregular semidiurnal tide with a mean high and low tide level of 0.17 m and −0.14 m, respectively. The mean annual seawater salinity in this study area is 18.2‰ [29,30]. Avicennia marina, Kandelia obovata, and Aegiceras corniculatum are dominant species in the history of this wetland, but these natural mangroves were severely destroyed in the past decades [30], and then large-scale planting of Sonneratia aperale on Qi’ao Island was conducted since 1999 [30].
Winter samples were collected from the mature native Kandelia obovata (>40 years, M) and adjacent aquaculture ecosystems (A), respectively (Figure 1). In the mangrove wetland, three sampling sites spaced 5 m apart were selected to collect triplicate sediment cores with a self-made columnar mud extraction device (10 cm diameter stainless steel tube). In aquaculture pool, three sampling sites spaced 5 m apart were also selected to collect triplicate sediment cores with a core cylinder, a PVC pipe handle, and a one-way valve [31]. All sediment cores were sliced at 5 cm intervals in the field and placed in sterile plastic bags. Overlying water samples were collected in polyethylene bottles and filtered through 0.2 μm filters (Millipore, Bedford, MA, USA). All samples were frozen and transported to the laboratory within 4 h. Sediment samples were immediately mixed with helium and were divided into three parts: One was stored at −20 °C for a test of TOC, total nitrogen (TN), and other physicochemical parameters, the second was stored at 4 °C for N-cycling rates, and the third was stored at −80 °C for subsequent molecular biological experiments.

2.2. Determination of Environmental Parameters

Moisture of sediment was obtained by freeze-drying the fresh sediments at 60 °C until sediment weight remained constant. The pH was measured by dissolving the sediment in deionized water (sediment:water = 1:5) [32]. Sediment exchangeable NO2, NH4+, and NO3 were extracted by potassium chloride (KCl, 2 M), purged under N2 based on previous protocol, and measured as water nutrient sample except for using 2 M KCl rather than Milli-Q water as standard curve substrate. TOC and TN measurements were obtained by Elemental Analyzer (Vario EL cube, Elementar, Langenselbold, Hessen, Germany) after treating the sediment with 1 M hydrochloric acid (HCl) for 48 h to remove inorganic carbon. The sediment grain size was measured by an LS 13320 Laser particle sizer analyzer after removal of organics and carbonates with 20% H2O2 and 15% HCl solution [33]. After extraction with 0.5 M HCl and 0.25 M hydroxylamine hydrochloride (both purged with N2 for 30 min), a ferrozine-based colorimetric method was used to measure sediment ferrous (Fe2+) and total extractable Fe. The difference between total Fe and Fe2+ is Ferric iron (Fe3+) contents [34].

2.3. Sediment Incubation Experiments

This experiment used an isotope pairing technique to determine potential denitrification and anammox rates [9]. Briefly, saltwater (same salinity as corresponding bottom water) and fresh sediment were mixed completely at a mass ratio of 7:1. The mixture was homogenized by flushing with He for 30 min and then transferred into 12 mL gas-tight vials (Exetainer, Labco, UK) under a He atmosphere and pre-incubated in dark for 24 h to remove DO and ambient NOx (NO3 + NO2). Subsequently, residual ambient NOx was measured in triplicate vials, and the remaining vials (15N labeled compounds (1) 15NH4+, (2) 15NH4+ + 14NO3, (3) 15NO3) were injected through the septa. The ultimate 15N concentration of each vial was 100 µM. Triplicate initial samples were stopped by ZnCl2 solution (200 μL 50%), and the others were returned to the incubator and stopped (incubation for 8 h). The membrane inlet mass spectrometry (MIMS, Hiden Analytical Ltd., Warrington, UK) was used to analyze the concentrations of generated 29N2 and 30N2. Calculation of denitrification and anammox rates were conducted according to previous literature [9,12].
The potential DNRA rates were tested via an isotope-tracing technique [35,36]. The procedures of pre-incubation and pre-treatment were the same as for anammox and denitrification. After pre-incubation, the final concentration of DNRA vials (labeled as 15NO3) was 100 µM, and the final % 15N was 89.97–99.11%. Initial and final samples were stopped by adding 200 μL 50% ZnCl2 solution at 0 h and 8 h, respectively. OX/MIMS method, which involved converting the 15NH4+ into N2 and measuring the 29N2 and 30N2 by MIMS, was employed to determine the concentrations of 15NH4+ produced by DNRA [6]. The DNRA rates were obtained by calculating the difference between the initial and final 15NH4+ concentrations.

2.4. Extraction of DNA and Quantification of N-Cycling Related Genes

The sediment was put into the FastDNA spin kit for DNA extraction (MP Biomedical, Santa Ana, CA, USA). Gene abundance testing was completed using the SYBR Green qPCR method: The real-time qPCR analysis of extracted DNA was performed using ABI 7500 Sequence Detection System (Applied Biosystems, MA, USA) to measure nirS, ANAMMOX 16S, and nrfA gene abundance. The primers used for the nirS, ANAMMOX 16S, and nrfA genes were cd3aF/R3cd, Amx-808-F/Amx-1040-R, and nrfA-2F/nrfA-2R, respectively. The standard curves for the nirS, ANAMMOX 16S, and nrfA genes were obtained by using a 10-fold dilution series (102–109 copies) of the standard plasmid DNA, and its amplification efficiencies were 89.06%, 91.01%, and 86.42%, respectively. These gene abundances were calculated by the constructed standard curve and converted into copies per gram of dry sediment.

2.5. Statistical Analyses

SPSS 19.0 (SPSS Inc., Chicago, IL, USA) was used for statistics and analyses of data. One-way ANOVA, Turkey test (p < 0.05, equal variances assumed), was used to analyze the significant differences in NOx reduction processes, physicochemical properties, and associated gene abundances between these two habitats. The significant differences in NOx reduction processes, associated gene abundances, and physicochemical properties between summer and winter were tested by independent-sample t-tests (p < 0.05). The graphs were drawn by ArcGIS 10.2 (ArcMap 10.2, ESRI, Redlands, CA, USA) and Origin 2016 (OriginLab Corporation, Northampton, MA, USA).

3. Results

3.1. Sediment Physiochemical Characteristics
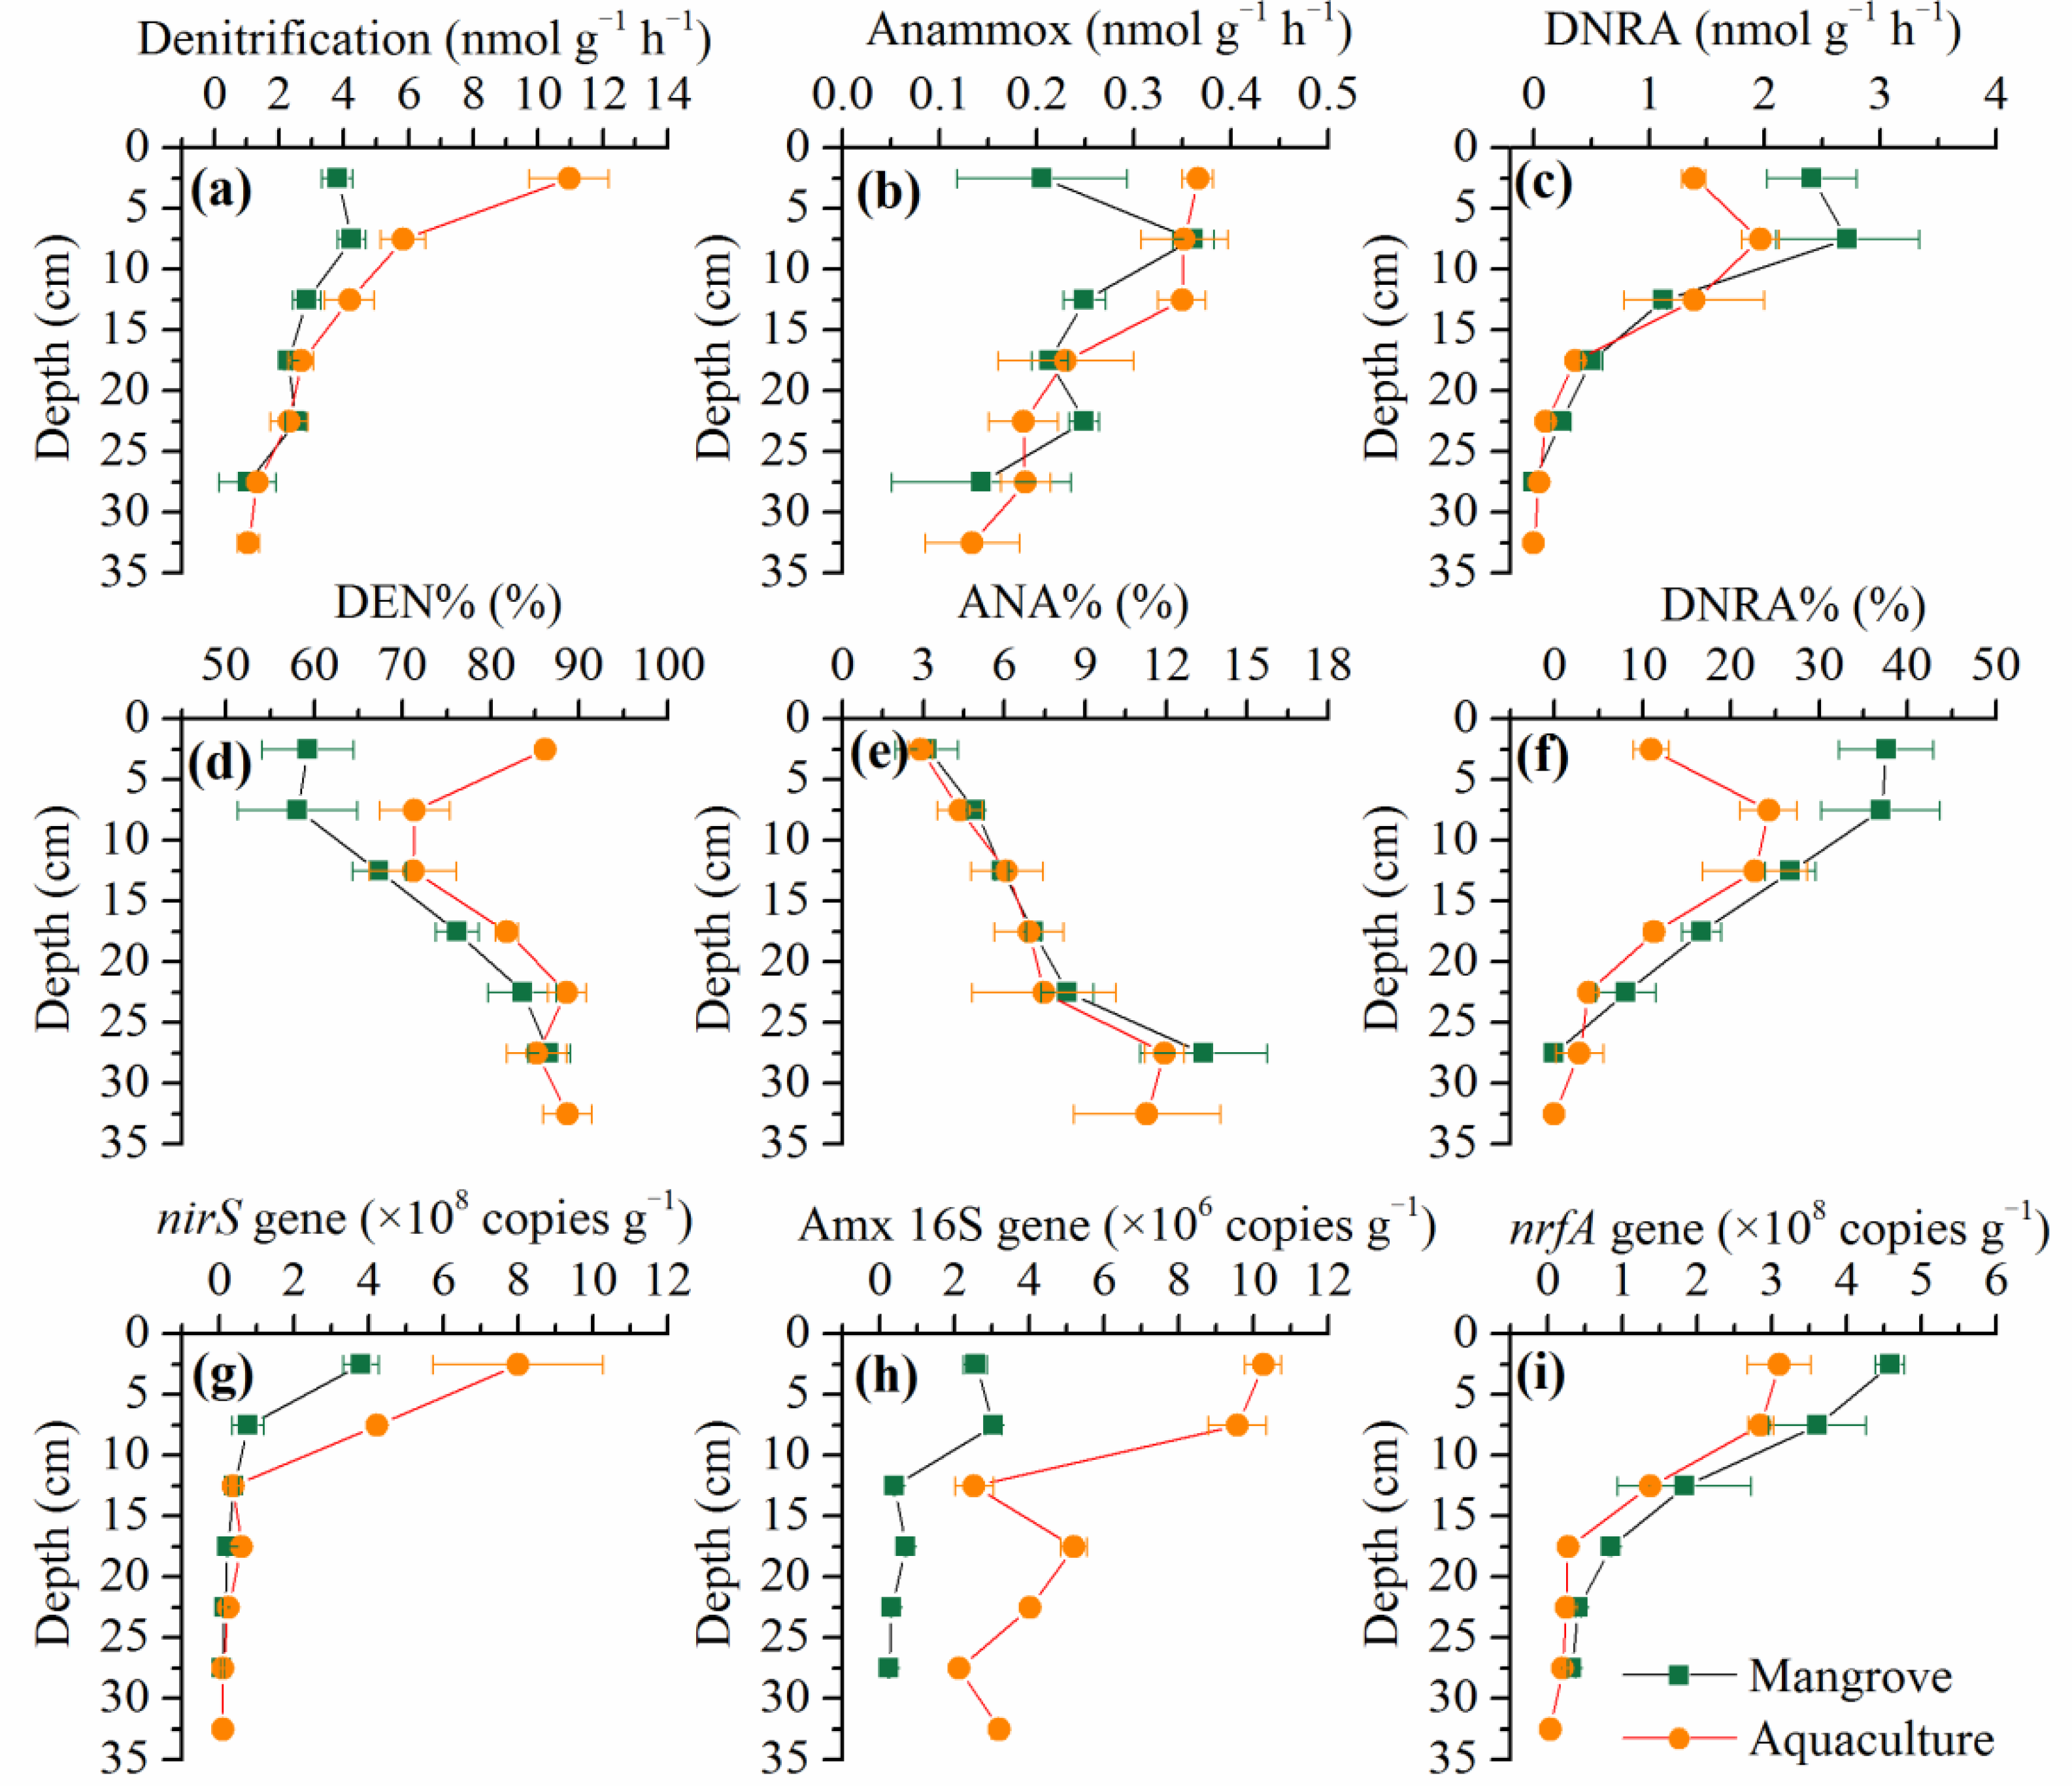
The sediment physicochemical characteristics of mangrove and aquaculture ecosystems are presented in Table 1. The water content, bulk density, and pH of mangrove sediment cores were in a range of 49.3–53.8%, 0.91–1.54 g Ml−1, and 7.66–7.89, respectively. Additionally, the water content, bulk density, and pH of aquaculture sediment cores were in a range of 36.76–50.15%, 1.37–1.66 g mL−1, and 7.28–7.77, respectively. The sediment Fe2+ contents (0.42–1.24 mg Fe g−1) and the ratio of Fe2+ to F3+ (Fe2+/Fe3+: 0.27–0.91) in the aquaculture ecosystem were both significantly higher than those (Fe2+: 1.14–1.93 mg Fe g-1; Fe2+/Fe3+: 0.08–0.29) in the mangrove wetlands (p < 0.05). Conversely, the sediment Fe3+ contents (2.12–4.85 mg Fe g−1) in the aquaculture ecosystem were slightly lower than those (4.18–5.91 mg Fe g−1) in the mangrove wetlands. The sediment NH4+, NO2, NO3, and DIN concentrations of mangrove wetlands were in a range of 2–5.25 μg N g1, 0.06–0.15 μg N g1, 0.32–0.66 μg N g1, and 2.5–5.96 μg N g1, respectively. The sediment NH4+, NO2, NO3, and DIN concentrations of the aquaculture ecosystem were in a range of 1.29–54.25 μg N g1, 0.07–0.10 μg N g1, 0.36–0.79 μg N g1, and 1.73–54.64 μg N g1, respectively. NH4+ was the dominant form in the sediments and constituted an average of 91.93 ± 7.90% and 82.80 ± 4.10% of the DIN in mangrove and aquaculture sediment cores, respectively. The sediment DIN concentrations in the aquaculture ecosystem were much higher than those in the mangrove wetlands, especially the NH4+. The TOC contents varied from 5.30 to 10.61 mg C g−1 with an average of 7.11 ± 2.00 mg C g−1 and varied from 3.67 to 11.89 mg C g−1 with an average of 10.20 ± 0.70 mg C g−1 in mangrove and aquaculture sediment cores, respectively. TN contents varied from 0.61 to 1.42 mg N g−1 with an average of 0.88 ± 0.31 mg N g−1 in mangrove sediment cores and varied from 0.40 to 1.11 mg N g−1 with an average of 0.61 ± 0.25 mg N g−1 in aquaculture sediment cores. The values of TOC/TN varied from 7.49 to 8.81 with an average of 8.22 ± 0.58 in mangrove sediment cores and varied from 9.15 to 11.08 with an average of 10.20 ± 0.67 in aquaculture sediment cores. In addition, all the sediments were mainly composed of fine silt and clay with a low median grain size (MΦ: 5.61–22.55 μm).
Overall, most physicochemical parameters varied vertically. The highest values of TOC, TN, and TOC/TN in sediments were generally found in the top layer (0–5 cm) and then decreased with depth. In contrast, the sediments Fe2+ and Fe2+/Fe3+ were generally increased with depth.

3.2. Spatial Variations of NOx Reduction Pathways

The denitrification rates varied from 1.04 to 4.24 nmol g−1 h−1 and from 1.06 nmol g−1 h−1 to 10.96 nmol g−1 h−1 in mangrove and aquaculture sediment cores, respectively (Figure 2a). The nirS gene abundances and denitrification rates had similar vertical distributions, which varied from 8.55 × 10⁶ to 3.80 × 10⁸ copies g−1 and 9.70 × 10⁶ to 8.01 × 10⁸ copies g−1 in mangrove and aquaculture sediment cores, respectively (Figure 2g). Denitrification is the main pathway of NOx reduction processes in both mangrove (59.15–84.93%) and aquaculture (71.18–88.70%) sediment cores (Figure 2d). In general, the highest values of denitrification rates, nirS gene abundances, and DEN% were found in the top layer (0–5 cm) and then decreased with the sediment depth in both ecosystems. Additionally, the denitrification rates, nirS gene abundances, and DEN% in aquaculture surface sediments were significantly higher than those in mangrove surface sediments (p < 0.05), but there was no significant difference in deeper sediments (p > 0.05).
The measured rates of anammox ranged from 0.14 to 0.36 ng N g−1 h−1 in mangrove sediment cores and 0.13 to 0.37 ng N g−1 h−1 in aquaculture sediment cores (Figure 2b). Anammox rates account for the smallest proportion of NOx reduction in both mangrove (3.14–13.38%) and aquaculture (2.91–11.93%) sediment cores (Figure 2e). The ANAMMOX 16S gene abundances were in a range of 2.57 × 10⁵–2.57 × 10⁶ copies g−1 and 2.12 × 10⁶−1.03 × 10⁷ copies g−1 in mangrove and aquaculture sediment cores, respectively (Figure 2h). At any depth, the sediment ANAMMOX 16S gene abundances of the aquaculture ecosystem were significantly higher than those in the mangrove ecosystem (p < 0.05). These anammox rates and related gene abundances (ANAMMOX 16S) were both generally decreased with sediment depth, whereas the ANA% exhibited opposite vertical distribution patterns. In addition, anammox rates in aquaculture surface sediments were significantly higher than those in mangrove surface sediments (p < 0.05), but there was no significant difference in deeper sediments (p > 0.05). There was no significant difference in ANA% between those two habitats in any of the depth layers (p > 0.05).
The DNRA rates also varied considerably, ranging from 0 to 2.72 nmol g−1 h−1 and 0 to 1.96 nmol g−1 h−1 in mangrove and aquaculture sediment cores, respectively (Figure 2c). This process was an important process in NOx reduction in both mangrove (21.0 ± 15.42%) and aquaculture (10.86 ± 9.57%) sediment cores (Figure 2f). The DNRA% in surface sediments of mangrove ecosystems were significantly higher than those in the surface sediments of the aquaculture ecosystem (p < 0.05). The nrfA gene abundances varied from 3.24 × 10⁷ to 4.58 × 10⁸ copies g−1 and 3.19 × 10⁶ to 3.11 ×10⁸ copies g−1 in mangrove and aquaculture sediment cores, respectively (Figure 2i). In general, the DNRA rates, DNRA%, and nrfA gene abundances were decreased with sediment depth in these two ecosystems. In addition, the DNRA rates, nrfA gene abundances, and DNRA% in mangrove surface sediments were significantly higher than those in the aquaculture surface sediments (p < 0.05), but there was no significant difference in deeper sediments (p > 0.05).

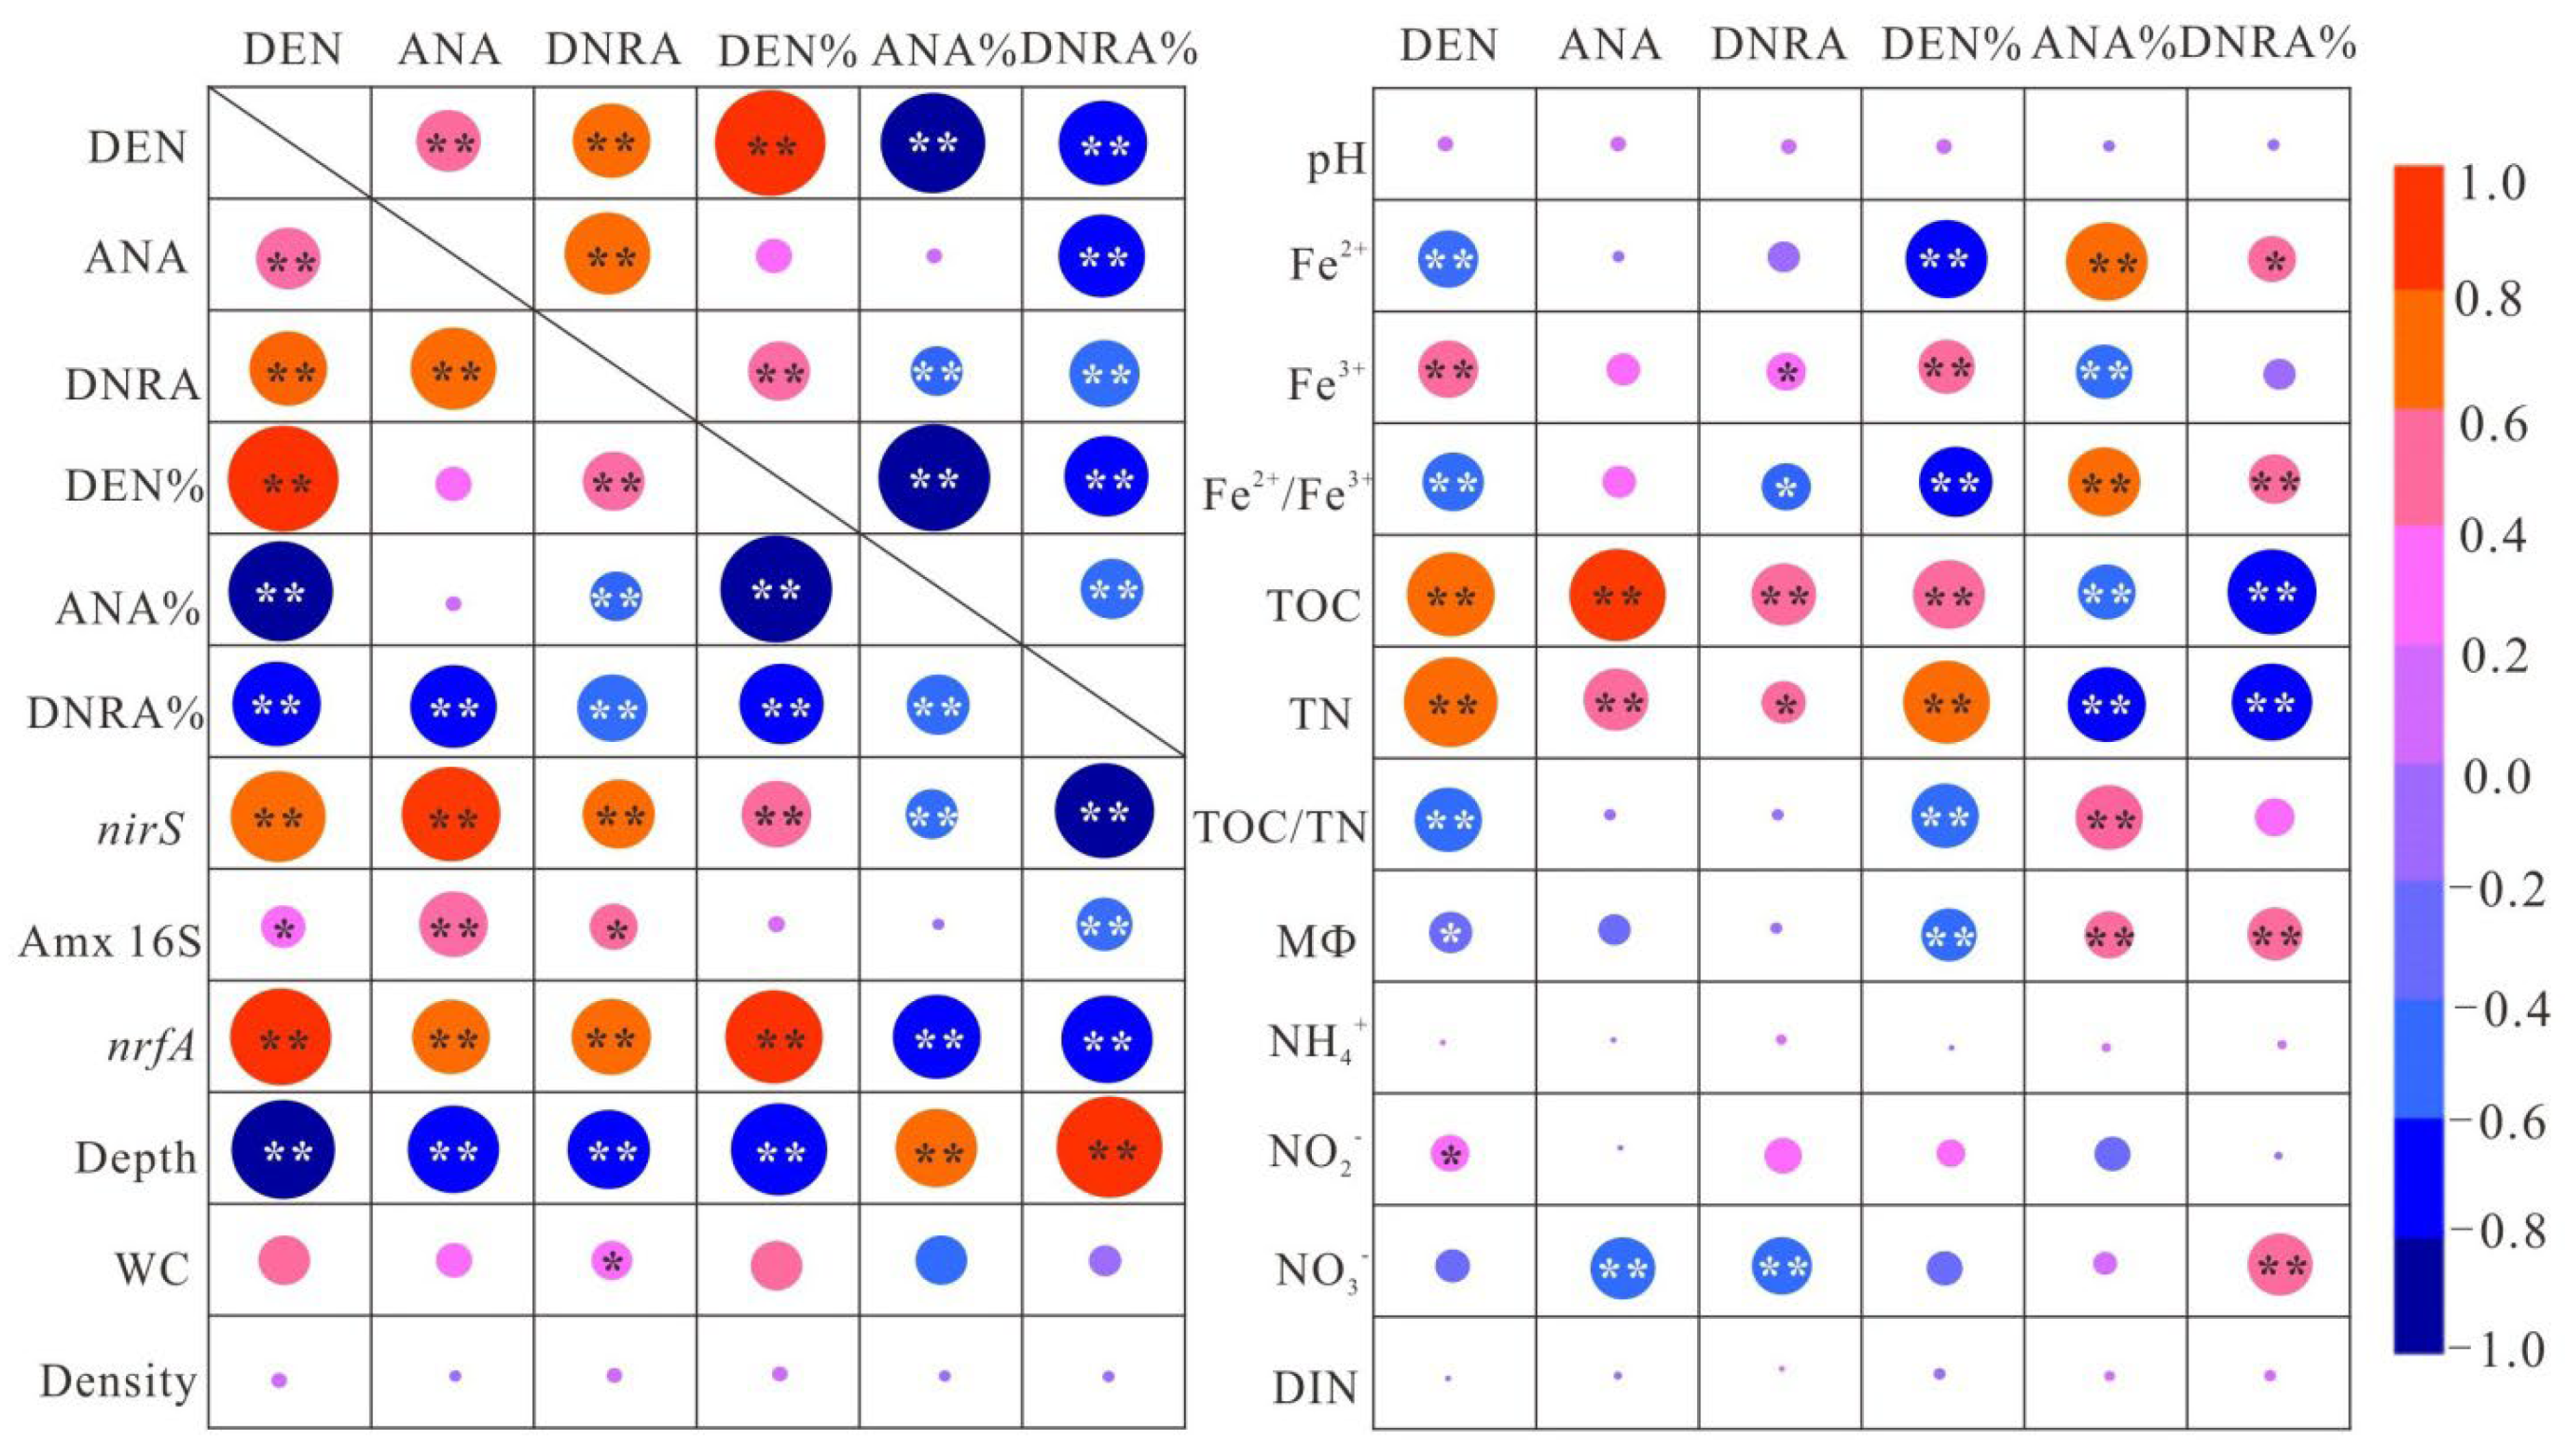
3.3. Environmental Factors Affecting N-Cycling Rates

Irrespective of different habitats, the relationships between N-cycling rates and environmental factors are shown in Figure 3. Denitrification rates were mainly impacted by sediment depth, nirS gene abundances, and organic matter (TOC & TN). Anammox rates were closely related to sediment depth, N-cycling gene abundances, organic matter, and NO3 contents. The DNRA rates were significantly positively correlated with sediment nirS and nrfA gene abundances and TOC contents, whereas they were negatively correlated with sediment depth and NO3 contents. The DEN% were correlated positively with sediment nirS and nrfA gene abundances, TOC, and TN, whereas they correlated significantly negatively with sediment depth, Fe2+, Fe2+/Fe3+, TOC/TN, and MΦ. ANA% were significantly positively correlated with sediment depth, Fe2+, Fe2+/Fe3+, and TOC/TN and significantly negatively correlated with sediment nrfA gene abundances, Fe3+, TOC, and TN. In addition, DNRA% were positively correlated with sediment depth, Fe2+, Fe2+/Fe3+, MΦ, and NO3 and were negatively correlated with sediment N-cycling gene abundances, TOC, and TN.

4. Discussion

4.1. Effects of Environmental Variables on NOx Reduction Processes

The microbial NOx reduction rates and their contributions and associated gene abundances, as well as controlling factors, were investigated in sediment cores of the mangrove and aquaculture ecosystems. The results offer new insight into microbial N reduction pathways in estuarine and coastal ecosystems. Spatially, all NOx reduction rates and their associated gene abundances were generally decreased with sediment depth in this study (Figure 2). Although deep soils/sediments contain ~33% of total N [37] and 35–58% of total microbial biomass [38,39], measured rates in our study were generally highest in the top layer samples (0–5 cm) and declined significantly with depth (Figure 2). Hence, the results in this work assembled patterns reported in previous studies observed in various ecosystems, such as paddies [40], estuaries [41], coasts [42], coastal wetlands [43] and marines [44], with the decline mainly attributed to the vertical profiles of oxygen supply and available substrate concentrations. Compared with anammox, this non-linear pattern of decline with depth in denitrification and DNRA is more obvious in this study (Figure 2). This result is mainly attributed to the fact that denitrification and DNRA are mainly both heterotrophic processes dependent on the consumption of labile organic matter, whereas anammox is an autotrophic process [45]. In general, organic matter in estuarine and coastal sediments plays an important role in controlling sediment NOx reduction processes. As an energy source, organic matter is an electron donor for maintaining heterotrophic N transformation processes, providing energy and substrate sources for microbial growth [6]. Thus, the vertical distributions of N-cycling rates were tightly related to the organic matter (TOC and TN) distribution in those two habitats. Meanwhile, electron acceptors (including oxygen, NO3, and Fe3+) might play an important role in the vertical distributions of NOx reduction rates. Denitrification and DNRA are often coupled to nitrification at the top layer of sediments with an aerobic condition, and this will greatly stimulate the denitrification and DNRA processes because that nitrification can supply substrates (NOx) for them under these NOx-limited ecosystems [41,46]. In addition, gene abundances decreased with sediment depth following the decrease in sediment organic matter in this study. Biomass and microbial abundance can directly affect the N-cycling activities in soils/sediments of various ecosystems [40,42,43]. Hence, the vertical spatial patterns of sediment NOx reduction processes in this study were remarkably affected by the bioavailability of organic matter and microbial abundances.
As we all know, sediment Fe2+ can be a controlling factor in the partitioning of denitrification and DNRA in many aquatic ecosystems [4,6]. In this study, we found that sediment Fe2+ was positively correlated with DNRA% but negatively correlated with DEN% (Figure 3). This is consistent with several previous incubation experiments, which found that Fe2+ addition has been shown to stimulate DNRA but not denitrification in some previous incubation experiments [47,48]. Additionally, we found our measure denitrification rates were negatively correlated with Fe2+, and there was no significant correlation between anammox rates and Fe2+ (Figure 3), which is inconsistent with previous studies [12,49]. Most previous studies generally demonstrated that Fe2+ can serve as an electron donor for NOx reduction in the denitrification and anammox processes (Equations (1) and (2)). These differences might be attributed to the fact that our sediment cores were divided into different depths, and most previous studies only focused on surface sediments/soils. Sediment Fe2+ was generally increased with sediment depth, and this distribution pattern was opposite to that of denitrification and anammox rates in this study.
4Fe2+ + 2NO2 + 8H+ → 4 Fe3+ + N2 + 4H2O
10Fe2+ + 2NO3 + 12H+ → 10Fe3+ + N2 + 6H2O

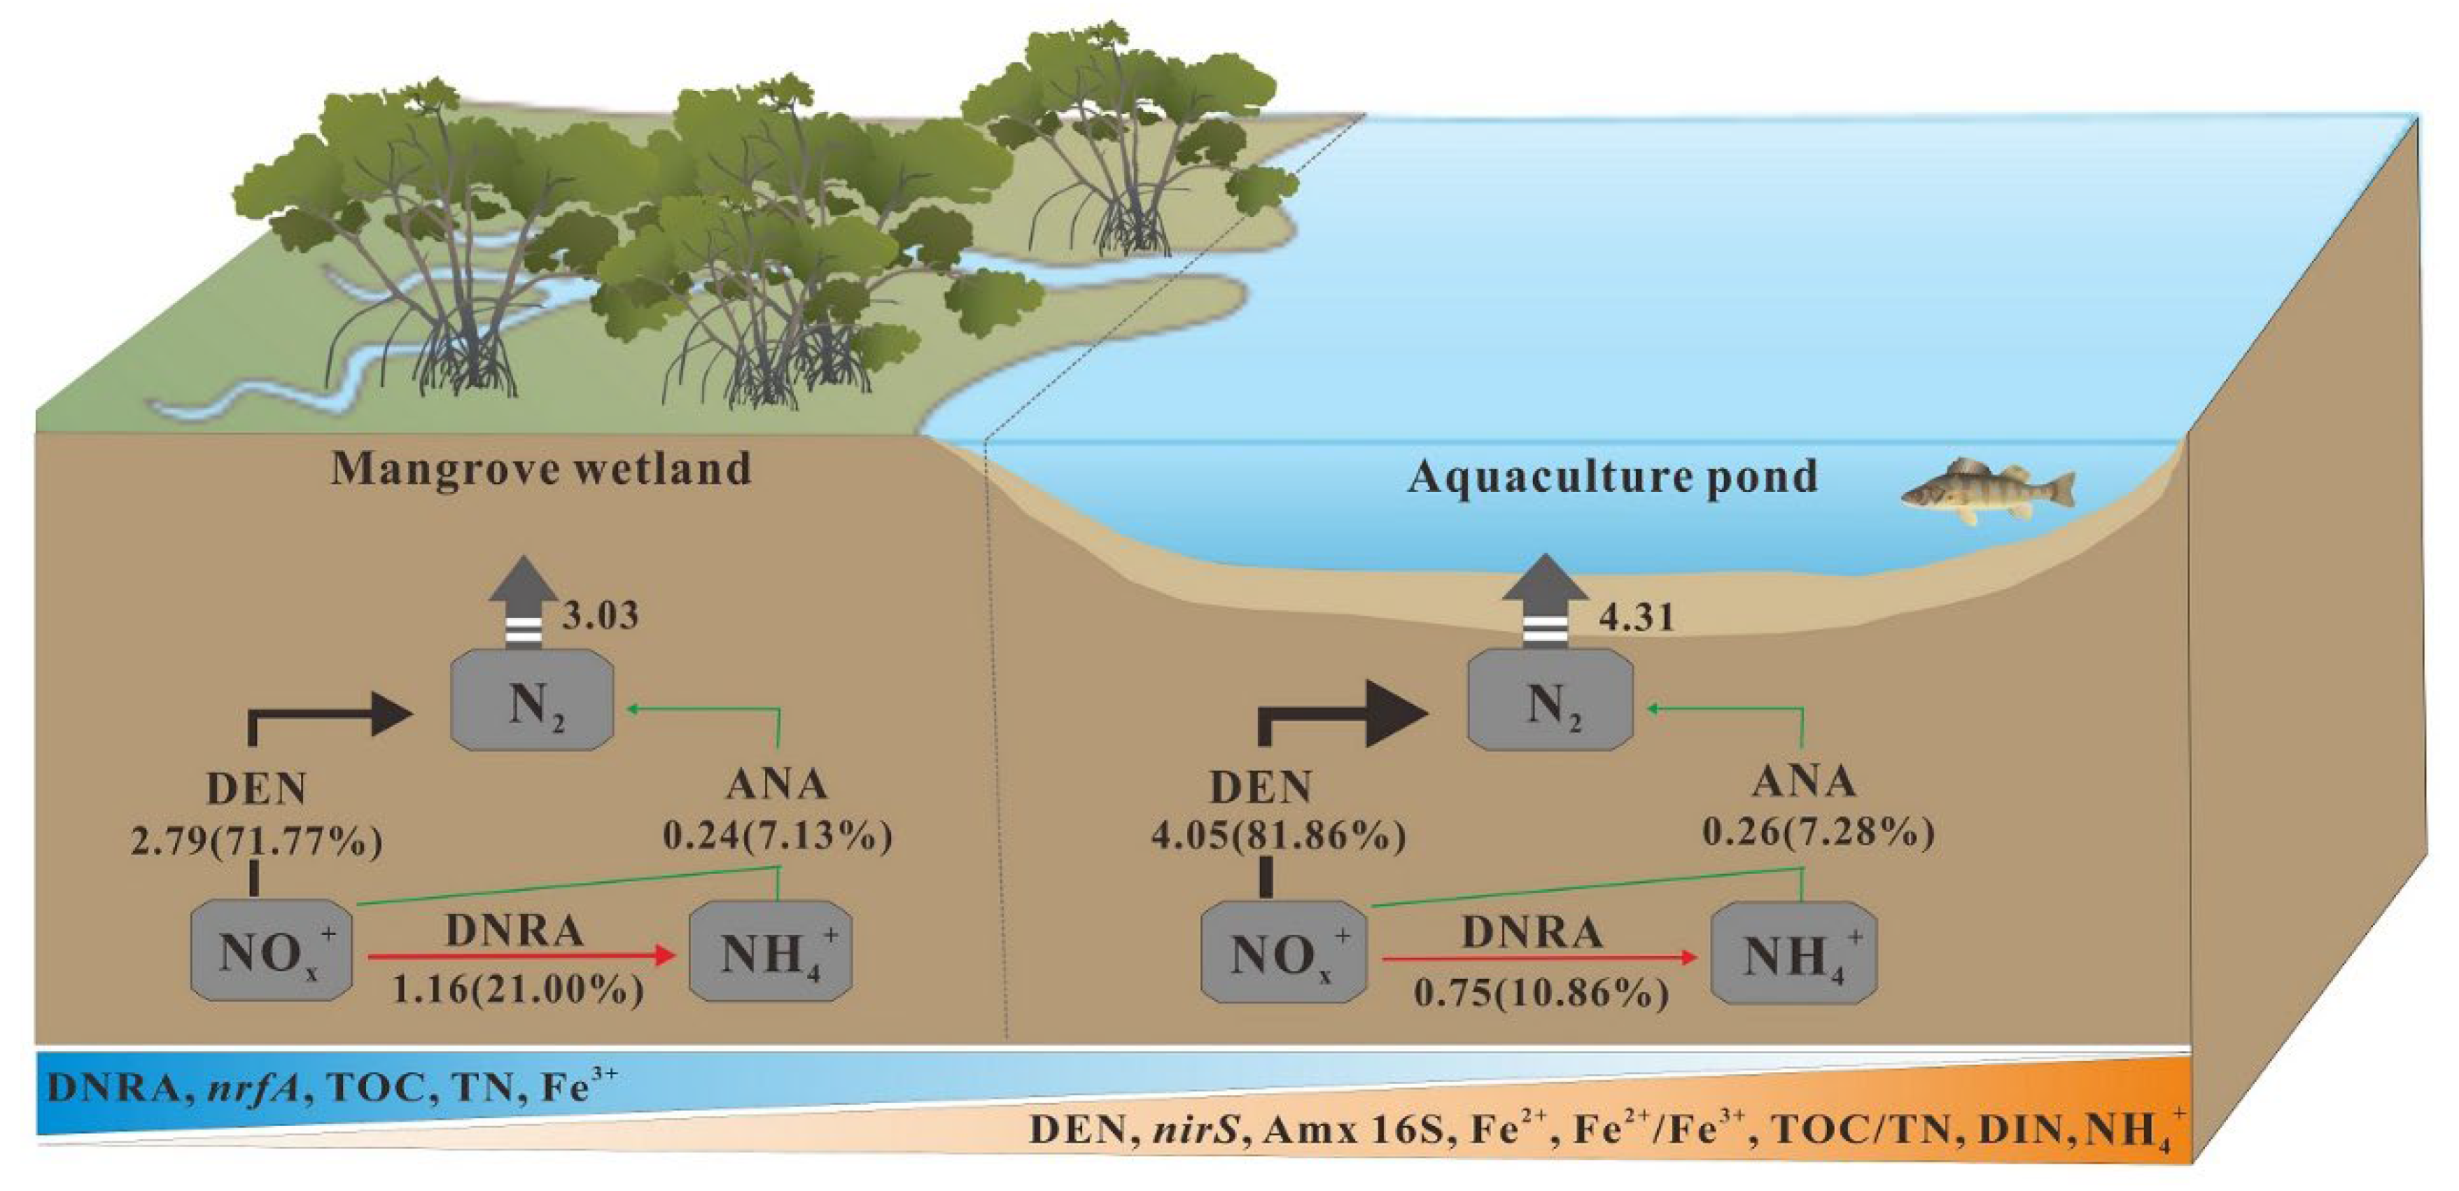
4.2. Effects of Aquaculture Reclamation on Mangrove Sediment NOx Reduction Processes

Our measure rates of denitrification (3.81 ± 0.47 nmol g−1 h−1), anammox (0.21 ± 0.09 nmol g−1 h−1), and DNRA rates (2.41 ± 0.38 nmol g−1 h−1) in the surface sediments (0–5 cm) of the mangrove wetland are much lower than those in other mangrove sediments [23,27,50]. This is mainly due to the fact that we only collected the winter samples, and incubation occurred at a low temperature (~16 °C). Similarly, the denitrification (10.96 ± 1.22 nmol g−1 h−1), anammox (0.37 ± 0.02 nmol g−1 h−1), and DNRA rates (1.39 ± 0.10 nmol g−1 h−1) in aquaculture surface sediments (0–5 cm) were also much lower than those reported in other aquaculture ecosystems [51]. Previous studies have shown that N loss in pond surface sediments was higher than in other natural habitats (including tidal rivers, marines, and reservoirs) due to human nutrients and organic matter inputs [51]. The nirS (3.80 ± 0.47 × 10⁸ copies g−1 and 8.01 ± 2.27 × 10⁸ copies g−1 in mangrove and aquaculture, respectively) and nrfA (4.58 ± 0.19 × 10⁸ copies g−1 and 3.11 ± 0.43 × 10⁸ copies g−1 in mangrove and aquaculture, respectively) genes were detected with high copy numbers in aquaculture and mangrove surface sediments, being higher than those reported for marine, estuarine, and coastal sediments [4,9,12,13,52]. The ANAMMOX 16S gene abundances (2.57 ± 0.32 × 10⁶ copies g−1 and 10.3 ± 0.48 × 10⁶ copies g−1 in mangrove and aquaculture, respectively) in this study are of considerable value when compared with other aquaculture [51,53] and mangrove ecosystems [27].
In agreement with previous studies [27,53,54], denitrification was the dominant pathway of NOx reduction processes in mangrove (59.29 ± 5.14%) and aquaculture (86.13 ± 0.81%) surface sediments. Meanwhile, denitrification rates and their contributions to the total NOx removal (DEN%) both increased after aquaculture reclamation in this study (Figure 4). This result was attributed mainly to the fact that aquaculture sediment not only has a high content of organic matter but also has high nutrients. As we all know, mangrove ecosystems are the most productive ecosystems and have a strong carbon sequestration capacity, and the high net productivity of mangroves can enhance the DNRA process in the system; more available N can be conserved in the system, which might be one of the regulatory mechanisms in the DNRA process [27,50]. The DNRA% in mangrove surface sediment were significantly higher than those in aquaculture surface sediments in this study (Figure 4), implying that aquaculture reclamation can reduce N retention in mangrove wetlands. Thus, aquaculture reclamation enhances N loss while reducing N retention in the sediments of mangrove wetlands, which plays an important role in regulating the source and fate of reactive N in mangrove ecosystems.

5. Conclusions

This study provides insights into NOx reduction processes and the associated environmental significance in sediments of the mature native Kandelia obovata and adjacent aquaculture ecosystems. Our study showed that the denitrification rates (1.04–4.24 nmol g−1 h−1) in aquaculture sediments were much higher than those (1.06–10.96 nmol g−1 h−1) in mangrove sediments, whereas the DNRA rates (0–2.72 nmol g−1 h−1) in aquaculture sediments were lower than those (0–1.96 nmol g−1 h−1) in mangrove sediments. NOx reduction rates, their gene abundances, and most physicochemical properties in mangrove and aquaculture sediments varied considerably in vertical distribution. The highest values of denitrification, anammox, DNRA, DEN%, DNRA%, gene abundances, TOC, TN, and TOC/TN in sediments were generally found in the top layer (0–5 cm) and then decreased with sediment depth, whereas the sediment ANA%, Fe2+, and Fe2+/Fe3+ were generally increased with depth in both mangrove and aquaculture ecosystems. When mangrove wetlands are transformed into aquaculture ponds, some properties (TOC, TN, and Fe3+), DNRA rates, DRNA%, and nrfA gene abundances were decreased, whereas some properties (NH4+, TOC/TN, Fe2+, and Fe2+/Fe3+), denitrification rates, DEN%, nirS, and ANAMMOX 16S gene abundances were increased. We also found that sediment organic matter (TOC and TN) and Fe2+ both affected NO3 reduction rates, and organic matter is the most prominent factor. Thus, aquaculture reclamation enhances sediment N loss while reducing N retention in mangrove wetlands, which plays an important role in regulating the source and fate of reactive N in mangrove ecosystems.

Author Contributions

Conceived and designed the experiments: J.H.; Performed the experiments: L.H., J.H.; Analyzed the data: L.H., J.H.; Contributed reagents/materials/analysis tools: L.H., J.H.; Wrote the paper: L.H., J.H. All authors have read and agreed to the published version of the manuscript.

Funding

This work was jointly supported by the Fujian Forestry Science and Technology Project (No. 2021FKJ30) and National Natural Science Foundation of China (No. 41601102).

Data Availability Statement

The data presented in this study are available on reasonable request from the corresponding author.

Acknowledgments

Thanks are given to the editor and anonymous reviewers for valuable comments on this manuscript.

Conflicts of Interest

The authors declare no conflict of interest.

References

  1. Cabral, H.; Fonseca, V.; Sousa, T.; Leal, M.C. Synergistic Effects of Climate Change and Marine Pollution: An Overlooked Interaction in Coastal and Estuarine Areas. Int. J. Environ. Res. Public Health 2019, 16, 2737. [Google Scholar] [CrossRef] [PubMed] [Green Version]
  2. Lin, X.; Li, X.; Gao, D.; Liu, M.; Cheng, L. Ammonium Production and Removal in the Sediments of Shanghai River Networks: Spatiotemporal Variations, Controlling Factors, and Environmental Implications. J. Geophys. Res. Biogeosci. 2017, 122, 2461–2478. [Google Scholar] [CrossRef]
  3. Lin, X.; Gao, D.; Lu, K.; Li, X. Bacterial Community Shifts Driven by Nitrogen Pollution in River Sediments of a Highly Urbanized City. Int. J. Environ. Res. Public Health 2019, 16, 3794. [Google Scholar] [CrossRef] [PubMed] [Green Version]
  4. Wei, H.; Gao, D.; Liu, Y.; Lin, X. Sediment nitrate reduction processes in response to environmental gradients along an urban river-estuary-sea continuum. Sci. Total Environ. 2020, 718, 137185. [Google Scholar] [CrossRef] [PubMed]
  5. Boesch, D.F. Challenges and opportunities for science in reducing nutrient over-enrichment of coastal ecosystems. Estuaries 2002, 25, 886–900. [Google Scholar] [CrossRef]
  6. Huang, F.; Lin, X.; Yin, K. Effects of marine produced organic matter on the potential estuarine capacity of NOx removal. Sci. Total Environ. 2022, 812, 151471. [Google Scholar] [CrossRef]
  7. Li, H.; Tang, H.; Shi, X.; Zhang, C.; Wang, X. Increased nutrient loads from the Changjiang (Yangtze) River have led to increased Harmful Algal Blooms. Harmful Algae 2014, 39, 92–101. [Google Scholar] [CrossRef]
  8. Roberts, K.; Eate, V.; Eyre, B.; Holland, D.; Cook, P. Hypoxic events stimulate nitrogen recycling in a shallow salt-wedge estuary: The Yarra River estuary, Australia. Limnol. Oceanogr. 2012, 57, 1427–1442. [Google Scholar] [CrossRef]
  9. Lin, X.; Liu, M.; Hou, L.; Gao, D.; Li, X.; Lu, K.; Gao, J. Nitrogen Losses in Sediments of the East China Sea: Spatiotemporal Variations, Controlling Factors, and Environmental Implications. J. Geophys. Res. Biogeosci. 2017, 122, 2699–2715. [Google Scholar] [CrossRef]
  10. Hu, M.; Sardans, J.; Le, Y.; Yan, R.; Zhong, Y.; Huang, J.; Peñuelas, J.; Tong, C. Biogeochemical behavior of P in the soil and porewater of a low-salinity estuarine wetland: Availability, diffusion kinetics, and mobilization mechanism. Water Res. 2022, 219, 118617. [Google Scholar] [CrossRef]
  11. Lin, X.; Hou, L.; Liu, M.; Li, X.; Yin, G.; Zheng, Y.; Deng, F. Gross Nitrogen Mineralization in Surface Sediments of the Yangtze Estuary. PLoS ONE 2016, 11, e0151930. [Google Scholar] [CrossRef] [PubMed] [Green Version]
  12. Huang, F.; Lin, X.; Hu, W.; Zeng, F.; He, L.; Yin, K. Nitrogen cycling processes in sediments of the Pearl River Estuary: Spatial variations, controlling factors, and environmental implications. CATENA 2021, 206, 105545. [Google Scholar] [CrossRef]
  13. Huang, F.; Lin, X.; Yin, K. Effects of algal-derived organic matter on sediment nitrogen mineralization and immobilization in a eutrophic estuary. Ecol. Indic. 2022, 138, 108813. [Google Scholar] [CrossRef]
  14. Wei, H.; Lin, X. Shifts in the relative abundance and potential rates of sediment ammonia-oxidizing archaea and bacteria along environmental gradients of an urban river–estuary–adjacent sea continuum. Sci. Total Environ. 2021, 771, 144824. [Google Scholar] [CrossRef] [PubMed]
  15. Zhang, Q.M.; Sui, S.S. The mangrove wetland resources and their conservation in China. J. Nat. Res. 2001, 16, 28–36. [Google Scholar]
  16. Lin, G.; Lin, X. Bait input altered microbial community structure and increased greenhouse gases production in coastal wetland sediment. Water Res. 2022, 218, 118520. [Google Scholar] [CrossRef]
  17. Hamilton, S.E.; Casey, D. Creation of a high spatio-temporal resolution global database of continuous mangrove forest cover for the 21st century (CGMFC-21). Glob. Ecol. Biogeogr. 2016, 25, 729–738. [Google Scholar] [CrossRef]
  18. Richards, D.R.; Friess, D.A. Rates and drivers of mangrove deforestation in Southeast Asia, 2000–2012. Proc. Natl. Acad. Sci. USA 2016, 113, 344–349. [Google Scholar] [CrossRef] [Green Version]
  19. Thomas, N.; Lucas, R.; Bunting, P.; Hardy, A.; Rosenqvist, A.; Simard, M. Distribution and Drivers of Global Mangrove Forest Change 1996–2010. PLoS ONE 2017, 12, e0179302. [Google Scholar] [CrossRef] [Green Version]
  20. Rovai, A.S.; Twilley, R.R.; Castañeda-Moya, E.; Riul, P.; Cifuentes-Jara, M.; Manrow-Villalobos, M.; Horta, P.A.; Simonassi, J.C.; Fonseca, A.L.; Pagliosa, P.R. Global controls on carbon storage in mangrove soils. Nat. Clim. Chang. 2018, 8, 534–538. [Google Scholar] [CrossRef]
  21. Hamilton, S.E.; Friess, D.A. Global carbon stocks and potential emissions due to mangrove deforestation from 2000 to 2012. Nat. Clim. Chang. 2018, 8, 240–244. [Google Scholar] [CrossRef] [Green Version]
  22. Yang, P.; Zhang, Y.; Yang, H.; Guo, Q.; Lai, D.Y.; Zhao, G.; Li, L.; Tong, C. Ebullition was a major pathway of methane emissions from the aquaculture ponds in southeast China. Water Res. 2020, 184, 116176. [Google Scholar] [CrossRef] [PubMed]
  23. Zhang, M.; Dai, P.; Lin, X.; Lin, L.; Hetharua, B.; Zhang, Y.; Tian, Y. Nitrogen loss by anaerobic ammonium oxidation in a mangrove wetland of the Zhangjiang Estuary, China. Sci. Total Environ. 2020, 698, 134291. [Google Scholar] [CrossRef] [PubMed]
  24. Vitousek, P.M.; Aber, J.D.; Howarth, R.W.; Likens, G.E.; Matson, P.A.; Schindler, D.W.; Schlesinger, W.H.; Tilman, D.G. Human alteration of the global nitrogen cycle: Sources and consequences. Ecol. Appl. 1997, 7, 737–750. [Google Scholar] [CrossRef] [Green Version]
  25. Harhangi, H.R.; Le Roy, M.; van Alen, T.; Hu, B.; Groen, J.; Kartal, B.; Tringe, S.G.; Quan, Z.-X.; Jetten, M.S.M.; Op den Camp, H.J.M. Hydrazine synthase, a unique phylomarker with which to study the presence and biodiversity of anammox bacteria. Appl. Environ. Microb. 2012, 78, 752–758. [Google Scholar] [CrossRef] [Green Version]
  26. Comer-Warner, S.A.; Nguyen, A.T.; Nguyen, M.N.; Wang, M.; Turner, A.; Le, H.; Sgouridis, F.; Krause, S.; Kettridge, N.; Nguyen, N.; et al. Restoration impacts on rates of denitrification and greenhouse gas fluxes from tropical coastal wetlands. Sci. Total Environ. 2022, 803, 803149577. [Google Scholar] [CrossRef]
  27. Cao, W.; Yang, J.; Li, Y.; Liu, B.; Wang, F.; Chang, C. Dissimilatory nitrate reduction to ammonium conserves nitrogen in anthropogenically affected subtropical mangrove sediments in Southeast China. Mar. Pollut. Bull. 2016, 110, 155–161. [Google Scholar] [CrossRef]
  28. Fernandes, S.O.; Michotey, V.D.; Guasco, S.; Bonin, P.C.; Bharathia, P.A.L. Denitrification prevails over anammox in tropical mangrove sediments (Goa, India). Mar. Environ. Res. 2012, 74, 9–19. [Google Scholar] [CrossRef]
  29. Yu, C.X.; Feng, J.X.; Liu, K.; Wang, G.; Zhu, Y.; Chen, H.; Guan, D. Changes of ecosystem carbon stock following the plantation of exotic mangrove Sonneratia apetala in Qi’ao Island, China. Sci. Total Environ. 2020, 717, 717137142. [Google Scholar] [CrossRef]
  30. Zhu, Y.H.; Liu, K.; Liu, L.; Wang, S.; Liu, H. Retrieval of mangrove aboveground biomass at the individual species level with worldview-2 images. Remote Sens. 2015, 7, 12192–12214. [Google Scholar] [CrossRef] [Green Version]
  31. Liu, R.; Lin, X.; Wang, G.; Liu, X. Natural N-bearing nanoparticles in sediments of a shallow bay of the south china: A new N form in N-cycling. Ecol. Indic. 2021, 122, 107281. [Google Scholar] [CrossRef]
  32. Lin, G.; Huang, J.; Lu, J.; Su, M.; Hu, B.; Lin, X. Geochemical and microbial insights into vertical distributions of genetic potential of N-cycling processes in deep-sea sediments. Ecol. Indic. 2021, 125, 107461. [Google Scholar] [CrossRef]
  33. Lin, X.; Zheng, P.; Zou, S.; Sun, F.; Zhang, X.; Gong, J. Seagrass (Zostera marina) promotes nitrification potential and selects specific ammonia oxidizers in coastal sediments. J. Soils Sediments 2021, 21, 3259–3273. [Google Scholar] [CrossRef]
  34. Lovley, D.R.; Phillips, E.J.P. Rapid assay for microbially reducible ferric iron in aquatic sediments. Appl Env. Microb 1987, 53, 1536–1540. [Google Scholar] [CrossRef] [PubMed] [Green Version]
  35. Gao, L.; Liu, C.; Li, M.; Lin, X. Sediment nitrate dissimilatory reduction processes along a salinity gradient in an estuarine and coastal wetland, China. J. Mar. Sci. Eng. 2022, 10, 761. [Google Scholar] [CrossRef]
  36. Cheng, L.; Li, X.; Lin, X.; Hou, L.; Liu, M.; Li, Y.; Liu, S.; Hu, X. Dissimilatory nitrate reduction processes in sediments of urban river networks: Spatiotemporal variations and environmental implications. Environ. Pollut. 2016, 219, 545–554. [Google Scholar] [CrossRef]
  37. Batjes, N.H. Total carbon and nitrogen in the soils of the world. Eur. J. Soil Sci. 1996, 47, 151–163. [Google Scholar] [CrossRef]
  38. Fierer, N.; Schimel, J.P.; Holden, P.A. Variations in microbial community composition through two soil depth profiles. Soil Biol. Biochem. 2003, 35, 167–176. [Google Scholar] [CrossRef]
  39. Schütz, K.; Kandeler, E.; Nagel, P.; Scheu, S.; Ruess, L. Functional microbial community response to nutrient pulses by artificial groundwater recharge practice in surface soils and subsoils. FEMS Microbiol. Ecol. 2010, 72, 445–455. [Google Scholar] [CrossRef] [Green Version]
  40. Ding, B.; Zhang, H.; Luo, W.; Sun, S.; Cheng, F.; Li, Z. Nitrogen loss through denitrification, anammox and Feammox in a paddy soil. Sci. Total Environ. 2021, 773, 145601. [Google Scholar] [CrossRef]
  41. Wu, J.; Hong, Y.; Wilson, S.J.; Song, B. Microbial nitrogen loss by coupled nitrification to denitrification and anammox in a permeable subterranean estuary at Gloucester Point, Virginia. Mar. Pollut. Bull. 2021, 168, 112440. [Google Scholar] [CrossRef] [PubMed]
  42. Wu, J.; Hong, Y.; Liu, X.; Hu, Y. Variations in nitrogen removal rates and microbial communities over sediment depth in Daya Bay, China. Environ. Pollut. 2021, 286, 117267. [Google Scholar] [CrossRef] [PubMed]
  43. Gao, D.; Li, X.; Lin, X.; Wu, D.; Jin, B.; Huang, Y.; Liu, M.; Chen, X. Soil dissimilatory nitrate reduction processes in the Spartina alterniflora invasion chronosequences of a coastal wetland of southeastern China: Dynamics and environmental implications. Plant Soil 2017, 421, 383–399. [Google Scholar] [CrossRef]
  44. Song, G.D.; Liu, S.M.; Marchant, H.; Kuypers, M.M.M.; Lavik, G. Anammox, denitrification and dissimilatory nitrate reduction to ammonium in the East China Sea sediment. Biogeosciences 2013, 10, 6851–6864. [Google Scholar] [CrossRef] [Green Version]
  45. Strous, M.; Pelletier, E.; Mangenot, S.; Rattei, T.; Lehner, A.; Taylor, M.W.; Horn, M.; Daims, H.; Bartol-Mavel, D.; Wincker, P.; et al. Deciphering the evolution and metabolism of an anamox bacterium from a community genome. Nature 2006, 440, 790–794. [Google Scholar] [CrossRef]
  46. Jenkins, M.C.; Kemp, W.M. The coupling of nitrification and denitrification in two estuarine sediments 1, 2. Limnol. Oceanogr. 1984, 29, 609–619. [Google Scholar] [CrossRef]
  47. Robertson, E.K.; Roberts, K.L.; Burdorf, L.D.W.; Cook, P.; Thamdrup, B. Dissimilatory nitrate reduction to ammonium coupled to Fe(II) oxidation in sediments of a periodically hypoxic estuary. Limnol. Oceanogr. 2016, 61, 365–381. [Google Scholar] [CrossRef] [Green Version]
  48. Robertson, E.K.; Thamdrup, B. The fate of nitrogen is linked to iron(II) availability ina freshwater lake sediment. Geochim. Cosmochim. Acta 2017, 205, 84–99. [Google Scholar] [CrossRef] [Green Version]
  49. Yang, Y.F.; Xiao, C.C.; Lu, J.H.; Zhang, Y. Fe(III)/Fe(II) forwarding a new anammox-like process to remove high-concentration ammonium using nitrate as terminal electron acceptor. Water Res. 2020, 172, 115528. [Google Scholar] [CrossRef]
  50. Xiao, K.; Wu, J.; Li, H.; Hong, Y.; Wilson, A.M.; Jiao, J.J.; Shananan, M. Nitrogen fate in a subtropical mangrove swamp: Potential association with seawater-groundwater exchange. Sci. Total Environ. 2018, 635, 586–597. [Google Scholar] [CrossRef]
  51. Cai, M.; Li, S.; Ye, F.; Hong, Y.; Lü, M.; Camp, H.J.M.O.D.; Wang, Y. Artificial ponds as hotspots of nitrogen removal in agricultural watershed. Biogeochemistry 2022, 1–19. [Google Scholar] [CrossRef]
  52. Wang, S.; Zhu, G.; Peng, Y.; Jetten, M.S.M.; Yin, C. Anammox bacterial abundance, activity, and contribution in riparian sediments of the Pearl River Estuary. Environ. Sci. Technol. 2012, 46, 8834–8842. [Google Scholar] [CrossRef] [PubMed]
  53. Gao, D.; Liu, M.; Hou, L.; Lai, Y.; Wang, W.; Li, X.; Zeng, A.; Zheng, Y.; Han, P.; Yang, Y.; et al. Effects of shrimp-aquaculture reclamation on sediment nitrate dissimilatory reduction processes in a coastal wetland of southeastern China. Environ. Pollut. 2019, 255, 113219. [Google Scholar] [CrossRef] [PubMed]
  54. Wang, F.; Song, A.; Zhang, Y.; Lin, X.; Yan, R.; Wang, Y.; Chen, N. Saltmarsh sediments with wastewater input emit more carbon greenhouse gases but less N2O than mangrove sediments. CATENA 2022, 213, 106205. [Google Scholar] [CrossRef]
Figure 1. Study area (a,b) and sampling sites (c).
Jmse 10 00857 g001
Figure 2. Denitrification, anammox, and DNRA rates (ac) and their contributions to the total NOx removal rates (DEN%, ANA%, and DNRA%; (df) and related gene abundance (nirS, Amx 16S rRNA, and nrfA; (gi) in mangrove and aquaculture sediment cores. The error bars represent standard deviations.
Jmse 10 00857 g002
Figure 3. Pearson’s correlation analyses between NOx reduction processes with environmental variables. * Significant at p < 0.05. ** Significant at p < 0.01. DEN, ANA, WC, MΦ, and DIN mean denitrification rate, anammox rate, sediment water content, sediment median grain size, and dissolve inorganic nitrogen, respectively.
Jmse 10 00857 g003
Figure 4. A conceptual map of the controlling factors on sediment NOx reduction processes in the mangroves and aquaculture sediment cores. DEN and ANA mean denitrification and anammox rates. The unit of denitrification, anammox, and DNRA rates was ng N g−1 h−1.
Jmse 10 00857 g004
Table 1. Physicochemical properties of the sediments in reclamation aquaculture and mangrove ecosystems.
LabelDepthWCDensitypHFe2+Fe3+Fe2+/Fe3+TOCTNTOC/TNNO2NH4+NO3
cm%g mL−1mg Fe g−1Mg Fe g−1mg C g−1mg N g−1μmμg N g−1μg N g−1μg N g−1
Mangrove
H1-10–549.821.377.480.874.590.1912.611.427.486.700.065.250.66
H1-25–1051.301.407.890.565.380.108.231.077.719.020.152.960.55
H1-310–1549.301.547.660.445.550.086.760.857.945.780.092.460.32
H1-415–2050.161.457.740.424.550.096.150.718.685.610.062.000.44
H1-520–2553.211.187.681.234.180.295.610.648.8122.550.083.330.51
H1-625–3053.800.917.671.245.910.215.300.618.7218.130.132.440.59
Mean 51.261.317.690.795.030.167.110.888.2211.300.093.070.51
SD 1.860.230.130.380.680.082.000.310.587.240.041.160.12
Aquaculture
S1-10–550.151.377.59 1.294.850.2711.891.1110.757.930.081.290.36
S1-25–1046.551.457.601.144.290.277.530.7510.0517.830.0954.250.33
S1-310–1548.691.507.601.364.520.306.480.5811.0814.970.1011.560.54
S1-415–2036.821.567.77 1.203.290.375.020.4710.6814.110.085.940.50
S1-520–2537.661.667.641.643.280.504.640.479.789.060.0710.680.53
S1-625–3036.761.557.461.492.960.504.720.489.9111.960.0715.620.79
S1-730–3537.611.637.281.932.120.913.670.409.1518.830.0712.620.73
Mean 42.031.537.561.443.620.446.280.6110.2013.530.0815.990.54
SD 6.110.100.150.280.970.232.780.250.674.140.0117.510.17
Values are means (n = 3), WC and MΦ mean sediment water content and sediment median grain size, respectively.
Publisher’s Note: MDPI stays neutral with regard to jurisdictional claims in published maps and institutional affiliations.

