Article

Model Test of the Pullout Bearing Capacity of End-Bearing Torpedo Anchors

1
Shaanxi Key Laboratory of Safety and Durability of Concrete Structures, Xijing University, Xi’an 710123, China
2
State Key Laboratory of Coastal and Offshore Engineering, Dalian University of Technology, Dalian 116024, China
3
School of Geological Engineering and Geomatics, Chang’an University, Xi’an 710054, China
*
Author to whom correspondence should be addressed.
J. Mar. Sci. Eng. 2022, 10(6), 728; https://doi.org/10.3390/jmse10060728
Submission received: 24 April 2022 / Revised: 20 May 2022 / Accepted: 23 May 2022 / Published: 26 May 2022
(This article belongs to the Special Issue New Challenges in Offshore Geotechnical Engineering Developments)

Abstract

:
Torpedo anchors (TAs) are regarded as one of the most efficient mooring solutions for taut mooring systems, and end-bearing TAs are a new type of TA that primarily relies on end-bearing plates at the tail to generate a pile-end resistance to improve their pulloutbearing capacity (P). Therefore, the estimation of the pullout capacity of the end-bearing TA is vital for the design of offshore floating facilities. In this study, pullout model tests were conducted to investigate the P of conventional and end-bearing TAs and examine the effects of factors such as the embedment depth (h), the relative density (Dr), the pullout angle (α), and the area (A) of the bearing plates on P. The test results show that, under oblique pullout loading, the P on the conventional TA increased slowly as displacement increased, while there was a peak on the load–displacement curve of each end-bearing TA with a relatively large A. The end-bearing TAs considerably outperformed the conventional TAs in terms of the P. In addition, increasing h, Dr, and A significantly increased the P of the end-bearing TAs. However, increasing h and Dr slightly decreased the ability of the bearing plates to increase the P of the end-bearing TAs. These research results can provide a guideline for TA installation in deep-sea engineering.

1. Introduction

Human demand for environmental resources is increasing with rapid social and economic development. Exploitation and effective utilization of marine resources has become a primary means of addressing the imbalance between the supply of, and demand for, limited resources [1,2,3]. Marine oil and gas resources are generally extracted on fixed or floating platforms. The effective anchorage of oil platforms is a central issue in marine oil and gas exploitation. Oil platforms can be fixed to the seafloor through structures such as tension legs, piles, suction caissons, and drag anchors in shallow-sea environments, and through structures such as plate anchors, suction caissons, and drag anchors in deep-sea environments [4,5]. However, the installation of various anchorage systems in deep-sea environments is extremely difficult and costly due to relatively deepwater depths and the significant effects of external loads (e.g., waves and winds). In recent years, taut-leg mooring systems composed of anchors (often torpedo anchors (TAs)) and anchor chains have been used to fix oil platforms for deep-sea oil extraction. TAs rely primarily on gravity to penetrate the seafloor. As a result, their installation is fast, easy, and relatively inexpensive, and does not require special installation vessels [6,7,8].
The pullout bearing capacity (P) of TAs is vitally important for the reliability of a mooring system, and is affected primarily by factors such as the properties of the seafloor soil, the penetration speed and depth, and the TA parameters [9,10]. Chen et al. [11] conducted tests to investigate the penetration and pullout behaviors of torpedo anchors under vibration, and found that the anchoring force reached more than 83.2% of holding capacity after 7 d in the silty bed. Wang et al. [12] studied the penetration depth into cohesive soil, considering the effect of torpedo anchor shape and size, and a formula to calculate the penetration depth was established based on energy conservation principles and measurements. Ads et al. [13] indicated that the fin length of a torpedo anchor correlated negatively with penetration depth, and correlated positively with extraction resistance. With increasing penetration depth, soil displacement initiallyincreased and then keptconstant. Based on centrifuge tests, Hossain et al. [14] studied the dynamic installation and monotonic pullout of torpedo anchors into calcareous silt, and a total energy expression was proposed to predict the embedment depth, accounting for anchor geometry, anchor mass, and impact velocity. Lai et al. [15] assessed the free-fall penetration behavior of dynamically penetrating anchors into marine clay, and an energy-based model and a force-based model were established to predict the penetration depth of anchors with different geometries and impact velocities. Takinginto account the effect of density, aspect ratio, scale ratio, and fin size, Hasanloo et al. [16] investigated the falling velocity and drag coefficient of torpedo anchors during acceleration, and a mathematical model for anchor motion was proposed. Wang et al. [17] studied the relationship between pullout capacity, anchor properties, and soil type, and a formula to calculate the monotonic holding capacity of torpedo anchors was established, accounting for embedded depth, weight, geometry, and soil properties. Wang et al. [18,19,20] investigated the effect of pullout velocity on the pullout behavior of torpedo anchors by numerical analysis and model testing, and formulas to predict the maximum vertical and inclined pullout force were established. Meanwhile, an empirical formula to predict the penetration depth was established and validated, based on energy analysis and test results.Santiago et al. [21] conducted centrifuge tests on torpedo piles installed in loose sand, and found that the interactions between the adjacent piles depended on the load direction and pile spacing. Based on the test results, the optimal pile spacing for maximum cluster efficiency was proposed. During the installation process, Fernandes et al. [22,23] concluded that a torpedo anchor have a minimum directional stability, with a less-than-three degree vertical angle required for control.Compared to four-fin torpedo anchors, Chang et al. [24] noted that the vertical and horizontal bearing capacities of the novel installed ‘fish’ anchors were 4.0 and 5.6 times greater. Raaj et al. [25] found that the hydrodynamic performance of torpedo anchors followed the order of hemispheric nose, ellipse, and ogive, and that the conical nose showed inferior performance. Kunitaki et al. [26] compared the Monte Carlo method and a fuzzy arithmetic method to treat uncertainties during torpedo anchor installation, and concluded that the fuzzy arithmetic method was an effective design tool due to its outstanding computational efficiency. O’Beirne et al. [27] validated the new release-to-rest model for torpedo anchors, based on test results, and found that the model-calculated results were consistent with field data of over 100 anchor installations, with an accuracy of ±10%.Coupling finite element of deformation and fluid flow in porous media, Raie and Tassoulas [28] indicated that the dissipation rate of excess pore-water pressure and recovery of soil strength were critically important for predicting the pull-out capacity of torpedo anchors at different times. Based on the statistical model uncertainty evaluated using test results and finite element simulation results, Sagrilo et al. [29] found that the single reliability safety factor was significantly lower than the value used in the design of torpedo anchors, considering the working stress design method. DeSousa et al. [30] indicated that the total contact area of a torpedo anchor is a necessary parameter for determining the load capacity, and that the load capacity of an anchor can significantly increase with an increase in undrained shear strength and fluke number. Based on a large deformation finite element approach, Kim et al. [31,32,33,34] investigated the installation and pullout process of a torpedo anchor. It was concluded that embedment depth was significantly decreased with increasing strain rate dependency of a soil, and the pullout capacity of a finless anchor under 45° was 29% of that of a four-fin anchor. Based on the results, an improved analytical embedment model considering shearing resistance and drag resistance was established. Sabetamal et al. [35,36] observed that a smooth discretization of the contact interface between soil and structure is a crucial factor for avoiding oscillations of soil when simulating the installation of torpedo anchors.
Current studies have primarily focused on investigating the P of conventional TAs through model tests, combined with numerical simulations, while end-bearing TAs have received relatively less attention. In this study, pullout model tests were performed to investigate the P of conventional and end-bearing TAs, and the effects of factors such as the embedment depth (h), the relative density (Dr), the pullout angle (α), and the area (A) of the bearing plates on the P. The results have a certain reference value for guiding the design and installation of TAs in deep-sea projects.

2. Materials and Methods
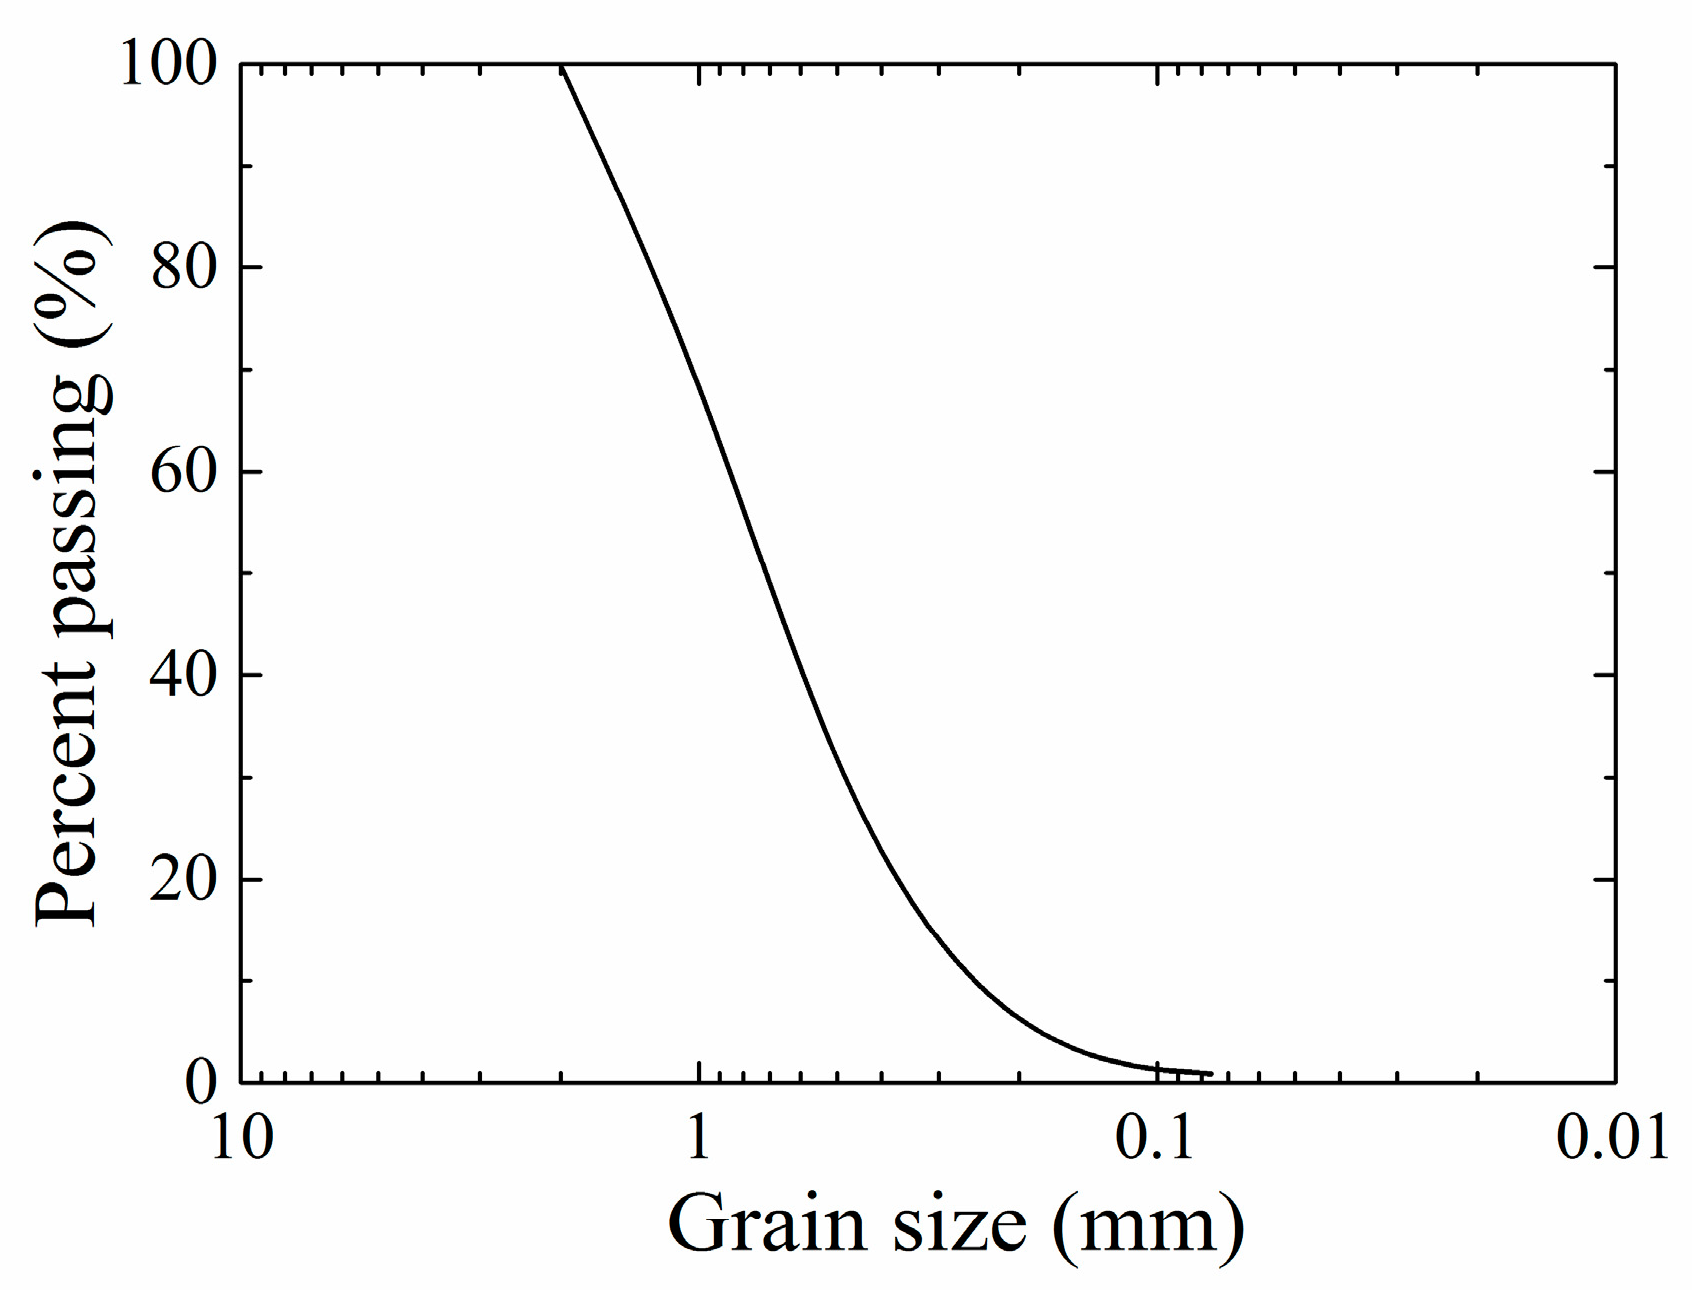
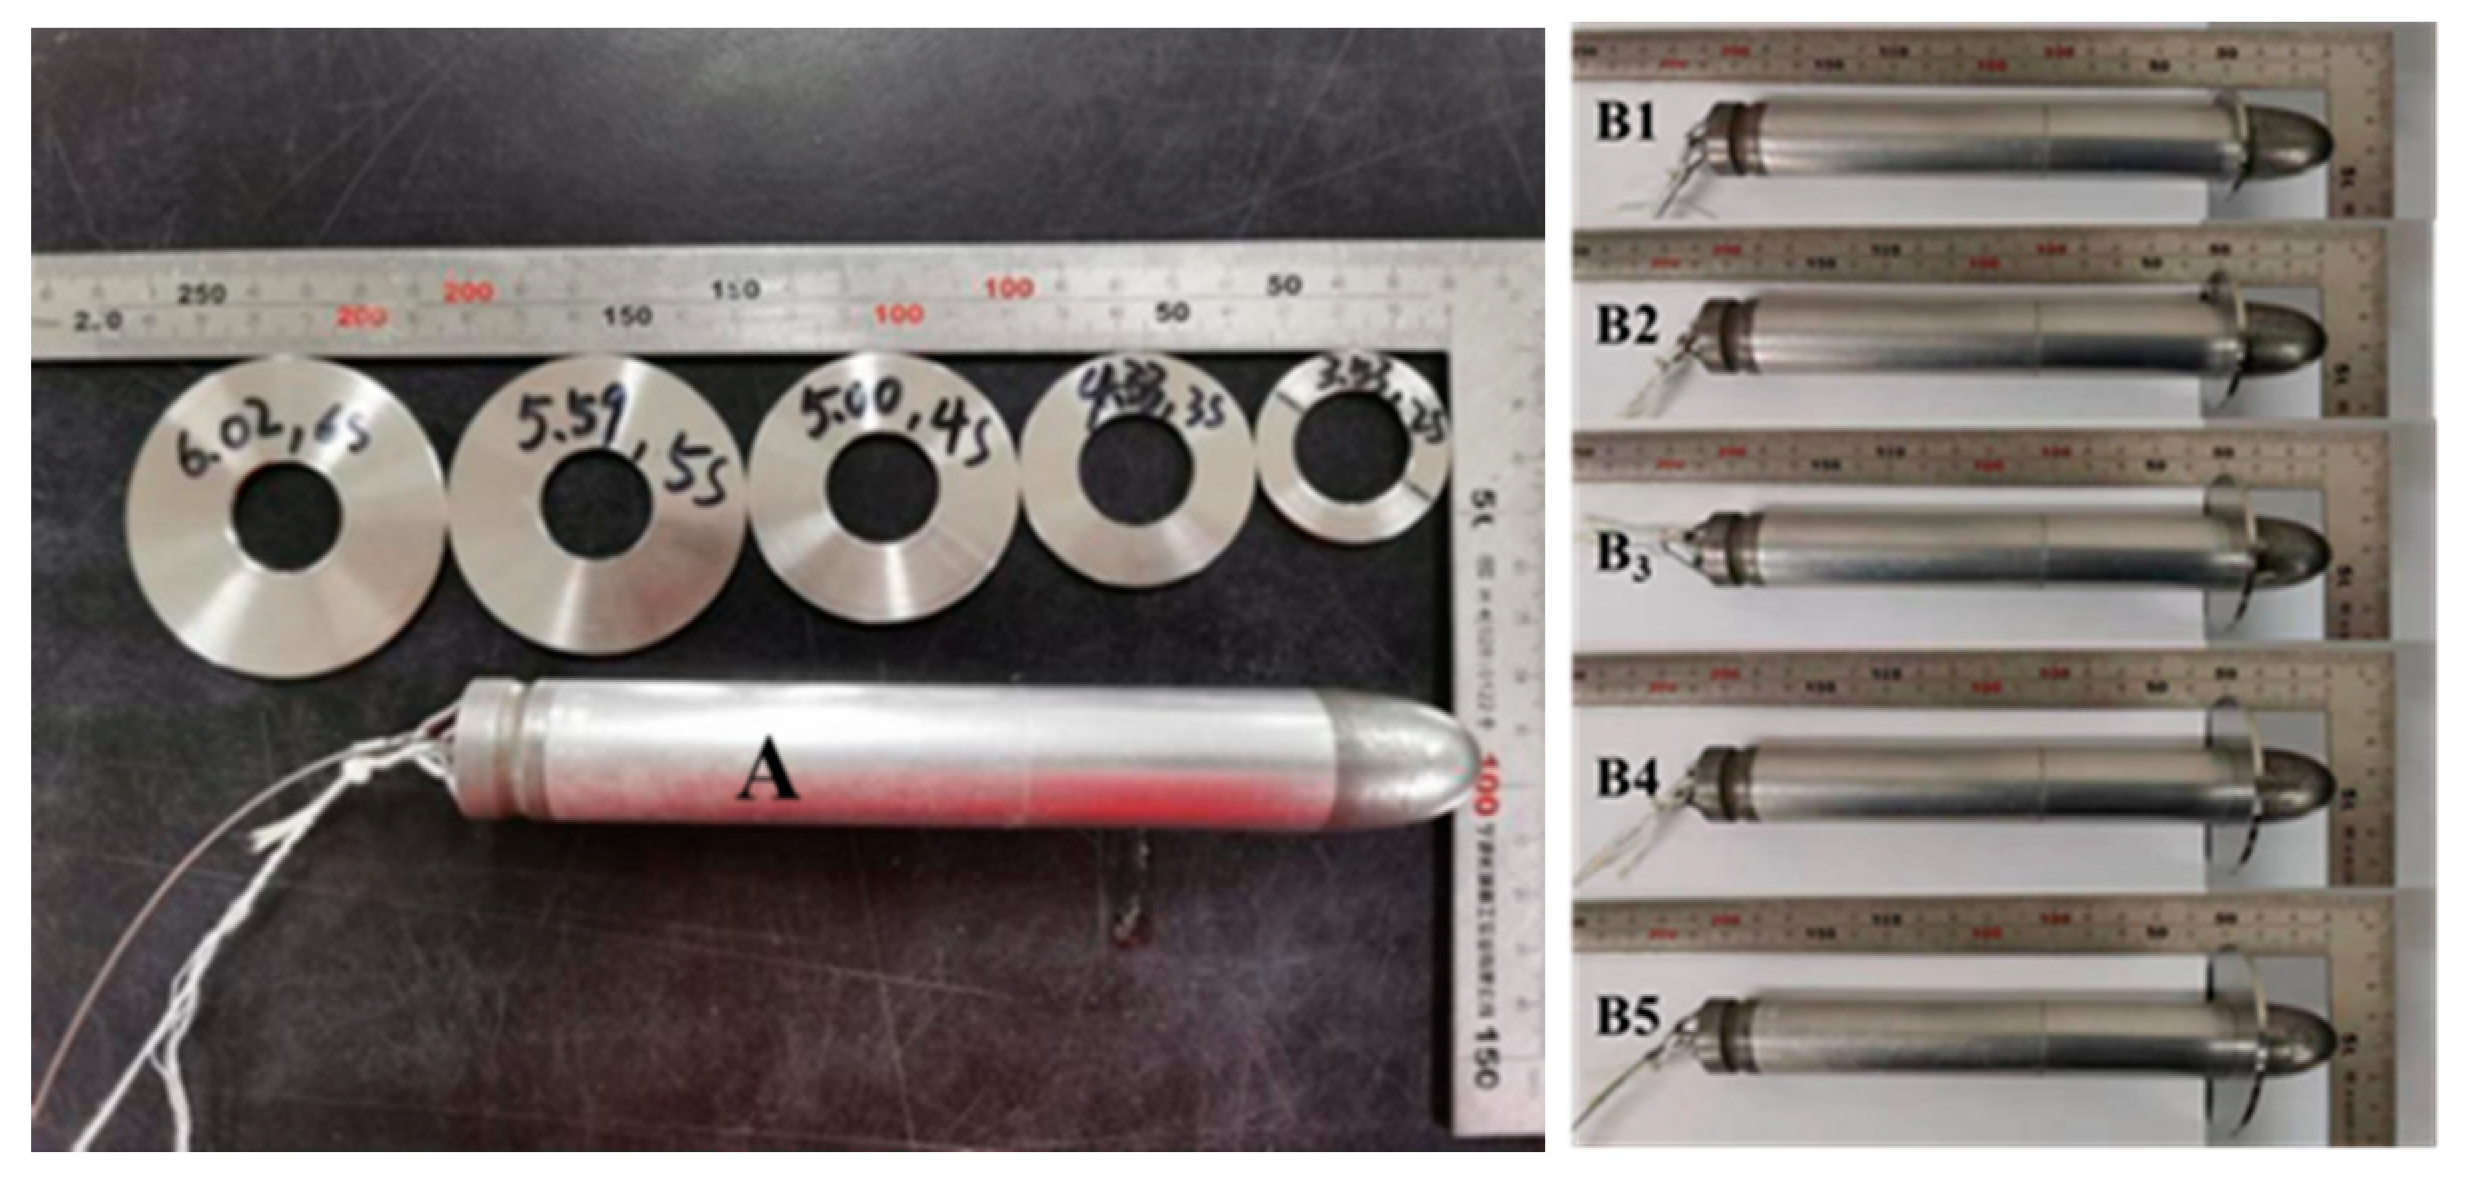
2.1. Test Materials

Fujian standard sand was used in the tests, and the specific gravity test, relative density test, and particle size analysis test were conducted according to the Geotechnical Test Method Standard (GBT 50123-2019). Table 1 summarizes the physical properties of the sand sample. Figure 1 shows the particle-size distribution curve of the test sand. Particles with a diameter of less than 2 mm accounted for 100% of the total weight, and particles with a diameter larger than 0.5 mm exceeded 50% of the total weight. Therefore, the test sand used in this study can be classified as coarse sand. Based on the values of the coefficient of uniformity (3.623) and the coefficient of curvature (1.099), the test sand was determined to be poorly graded.
One conventional TA model (type A) and five end-bearing TA models (type B1–B5) were used in the tests. The tip (2.5 cm in length) and bearing plates of each end-bearing TA were made of stainless steel, while the shank (17.5 cm in length (L), 2.5 cm in diameter (d), and 207.0 g in mass (m)) was made from a hollow aluminum tube. The bearing plates in the type B1–B5 TAs had external diameters of 3.53, 4.33, 5.00, 5.59, and 6.02 cm, respectively, areas that were 2–6 times the cross-sectional area of the shank, and masses of 9.3, 16.9, 26.3, 33.6, and 39.2 g, respectively, as shown in Figure 2. A poly(methyl methacrylate) bucket with a diameter of 45 cm, a height of 75 cm, and a wall thickness of 2 cm was used in the tests.

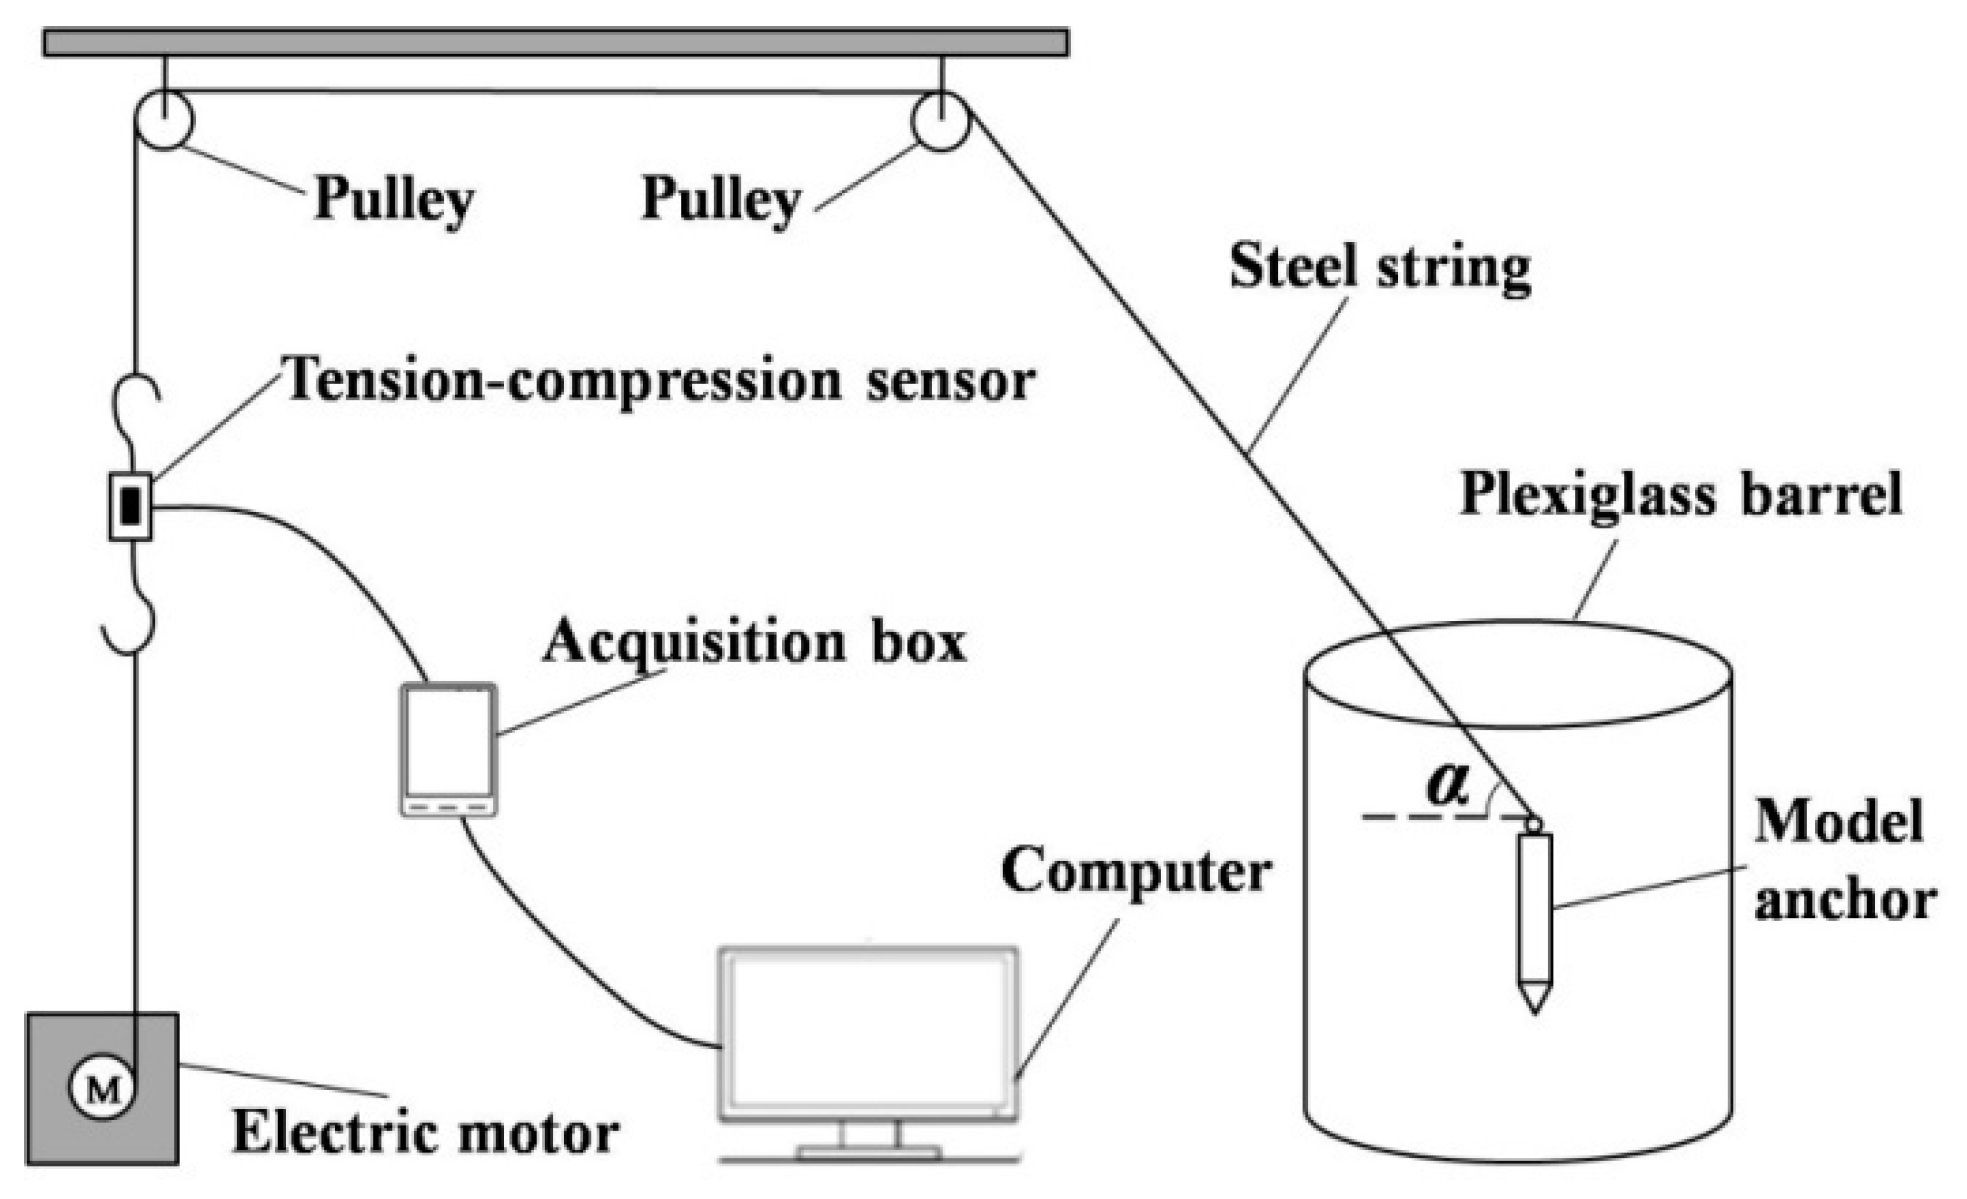
2.2. Model Arrangement

Figure 3 shows the TA pullout test setup, which consisted mainly of a support frame, a fixed pulley, a sample barrel, a drive motor, a tension sensor, and a data acquisition system. The drive motor of a triaxial shear apparatus was used to apply a load, and met the requirement for loading at a constant rate within its loading capacity. During loading, the back of the anchor was connected via a thin steel strand to an “S”-shaped tension/compression sensor with a measuring range of ±200 kg, which was, in turn, connected via a signal magnifier to a TWD information acquisition box using data cables. Data were measured at a frequency of 200 Hz. The sensor was calibrated by graded loading, and the results indicated that the performance of a tension sensor ranging from 0 to 50 kg could meet the test requirements. The measured data were smoothed by MATLAB 2020a software (MathWorks Software (Beijing) Co., Ltd., Beijing, China). The data acquisition system was used to measure and record the data in real time during the test process, in which the model was pulled out. The loading rate was set to 1 mm/s. The corresponding displacement (S) was calculated based on the test time.

2.3. Test Methods

Based on the American Petroleum Institute (API) standard [37] and the similarity principle listed in Table 2, a total of 42 tests were conducted on the type A and B TAs for different values of Dr, h, and α, and Table 3 summarizes the test schemes. Sand samples were prepared through compaction in the test process. Specifically, sand was first weighed according to the predesigned height and Dr of the sample, and subsequently placed layer-by-layer in the barrel until the desired height was reached. Each layer of sand was compacted before the next layer was placed. A 10 cm-tall layer of sand was first placed at the bottom of the barrel. Then, the TA was installed in the center of the barrel via a fixed thin steel strand, the length of which was adjusted to place the TA at a certain depth. When placing sand near the TA, the TA was fixed with a sleeve to prevent this process from affecting its verticality. Subsequently, the water was filled on the surface of the sand bed to ensure sand saturation, and 10 cm of free water was maintained above the sand surface during the model test. Because each TA had a diameter of 2.5 cm, and the barrel had an internal diameter of 41 cm, the boundary effect was effectively eliminated.
During the test process, the embedded TA was first connected to a tension transducer via a steel strand, while α was adjusted through a fixed pulley. Then, the steel strand was connected to the rotating shaft of a triaxial apparatus. The strain-control mode was used. The loading rate was set to 1 mm/s. Data were acquired at a frequency of 200 Hz. The test was terminated when a peak appeared on the PS curve, or when the preset value was reached. To ensure reliable test results, parallel tests were also conducted.

3. Results and Discussion

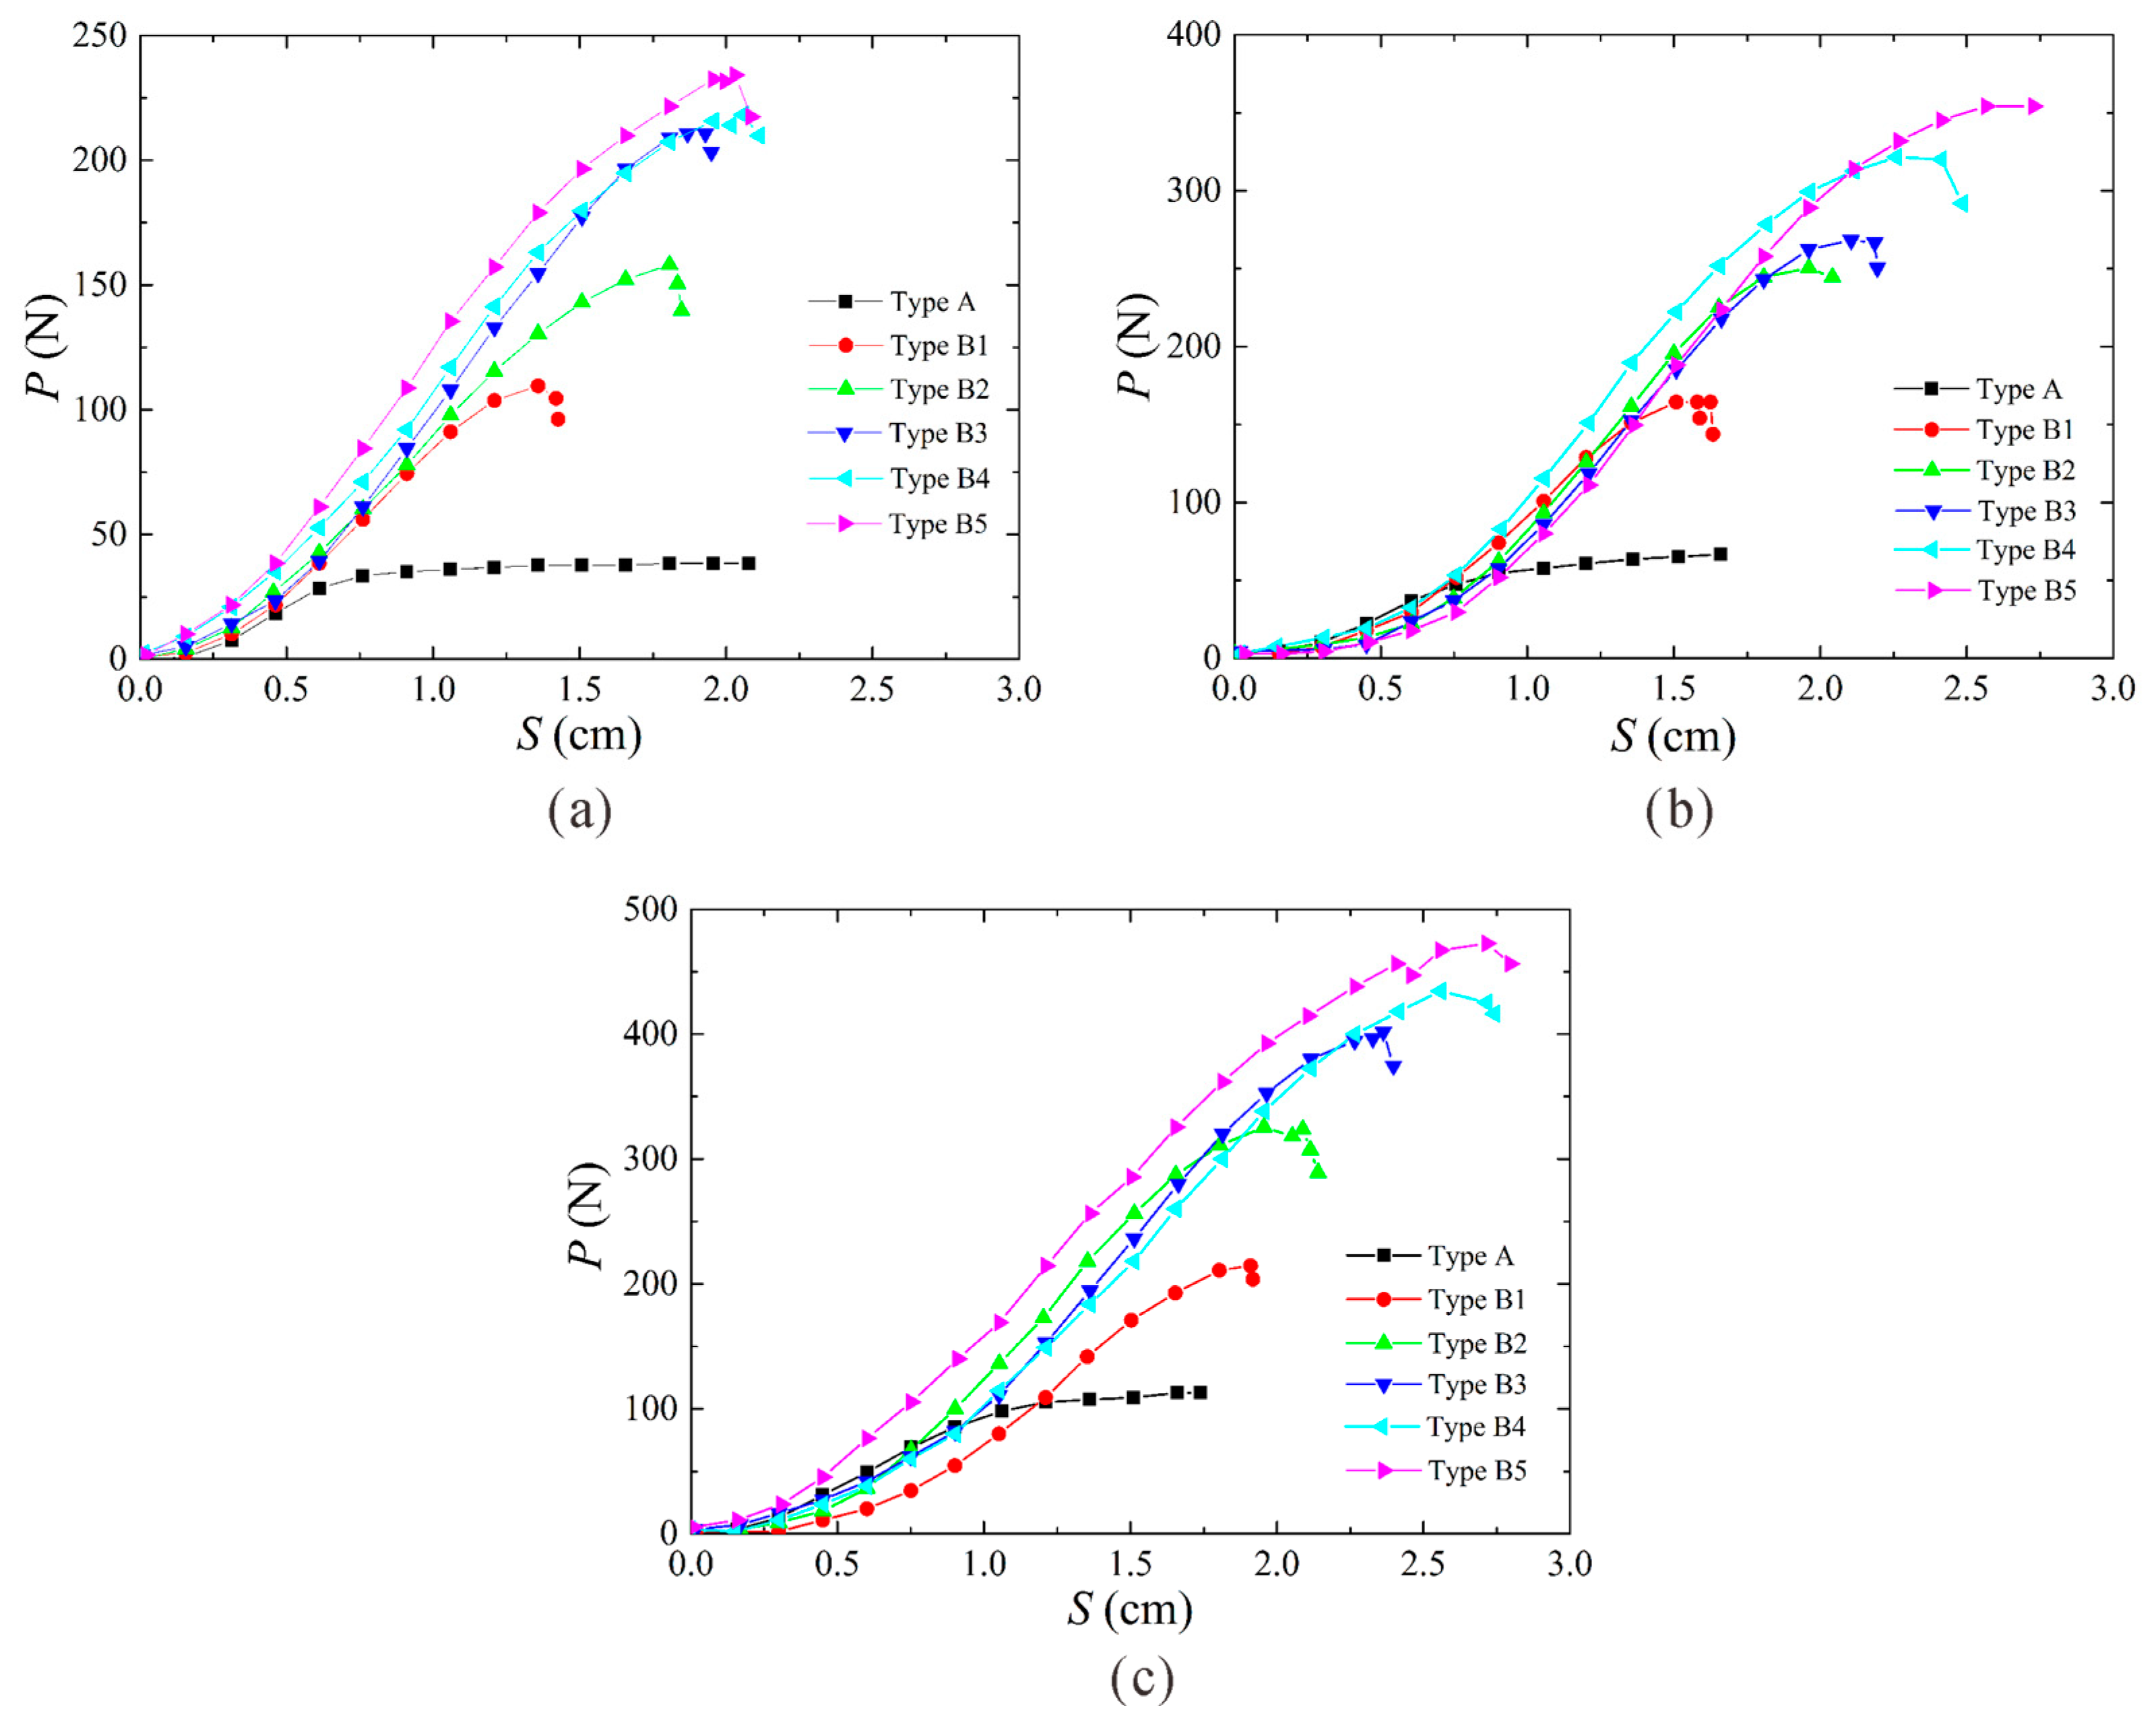
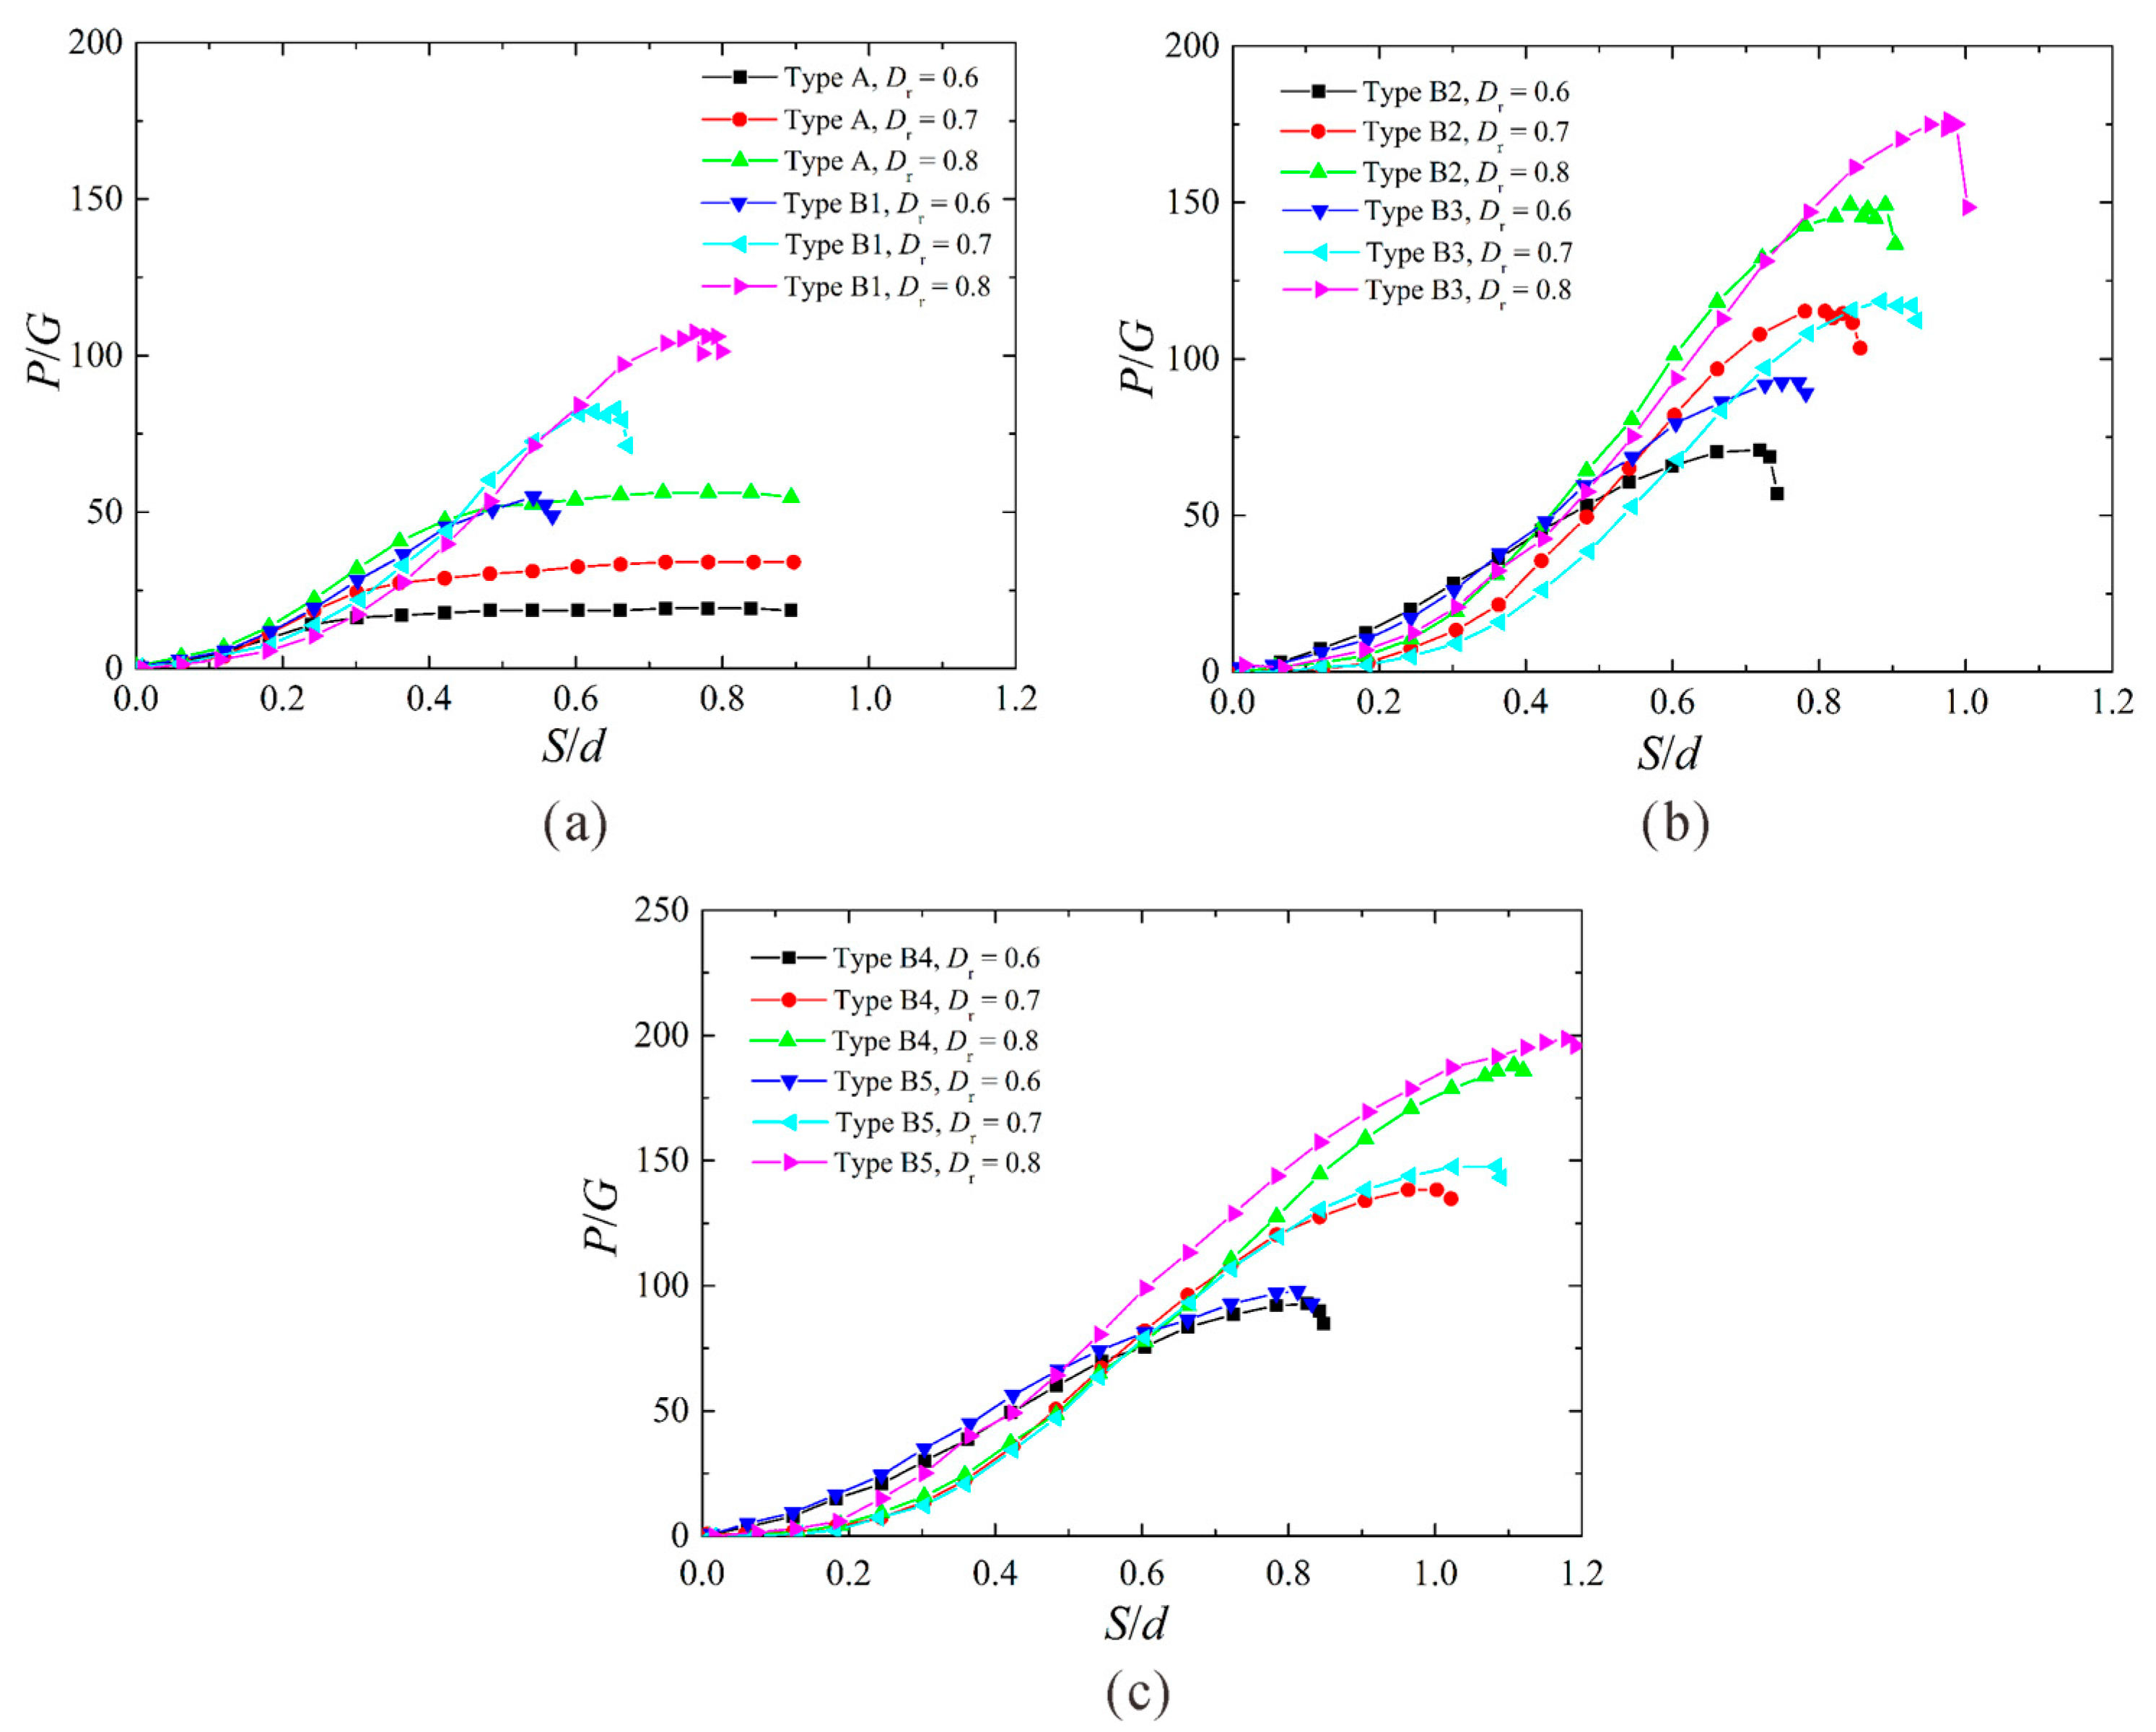
3.1. Analysis of Vertical Load–Displacement Curves

The main factors affecting the P value of a TA include the soil properties, h, the type of TA, α, and the interaction between the TA and the soil. To examine the P of different types of TAs, the PS curves of the TAs in sand with different Dr at h = 2.0L were obtained, as shown in Figure 4. At h = 2.0L, as displacement increased, the P value of the conventional TA increased slowly to a certain value, and then remained approximately at this value, with no notable peak on its curve. In comparison, the P on each end-bearing TA increased rapidly as S increased, with a peak appearing, and then sharply decreased. The main reason for this phenomenon is that the P of the TA increased gradually with the increasing of S. When the P reached a peak, the end-bearing TA loosened the upper soil due to the end-bearing resistance of the bearing plate. If the vertical pullout loading is continuously applied, the P will sharply decrease with increasing of S. Under vertical pullout loading, the P of the end-bearing TA was much higher than that of the conventional TA and increased as A increased. This finding suggests that under vertical pullout loading, the bearing plates of an end-bearing TA compress the soil above them, thereby improving the P of the TA. For an end-bearing TA, a relatively large S is required to reach its P. Therefore, in-depth research is warranted to improve the P of TAs through innovative end-bearing designs.

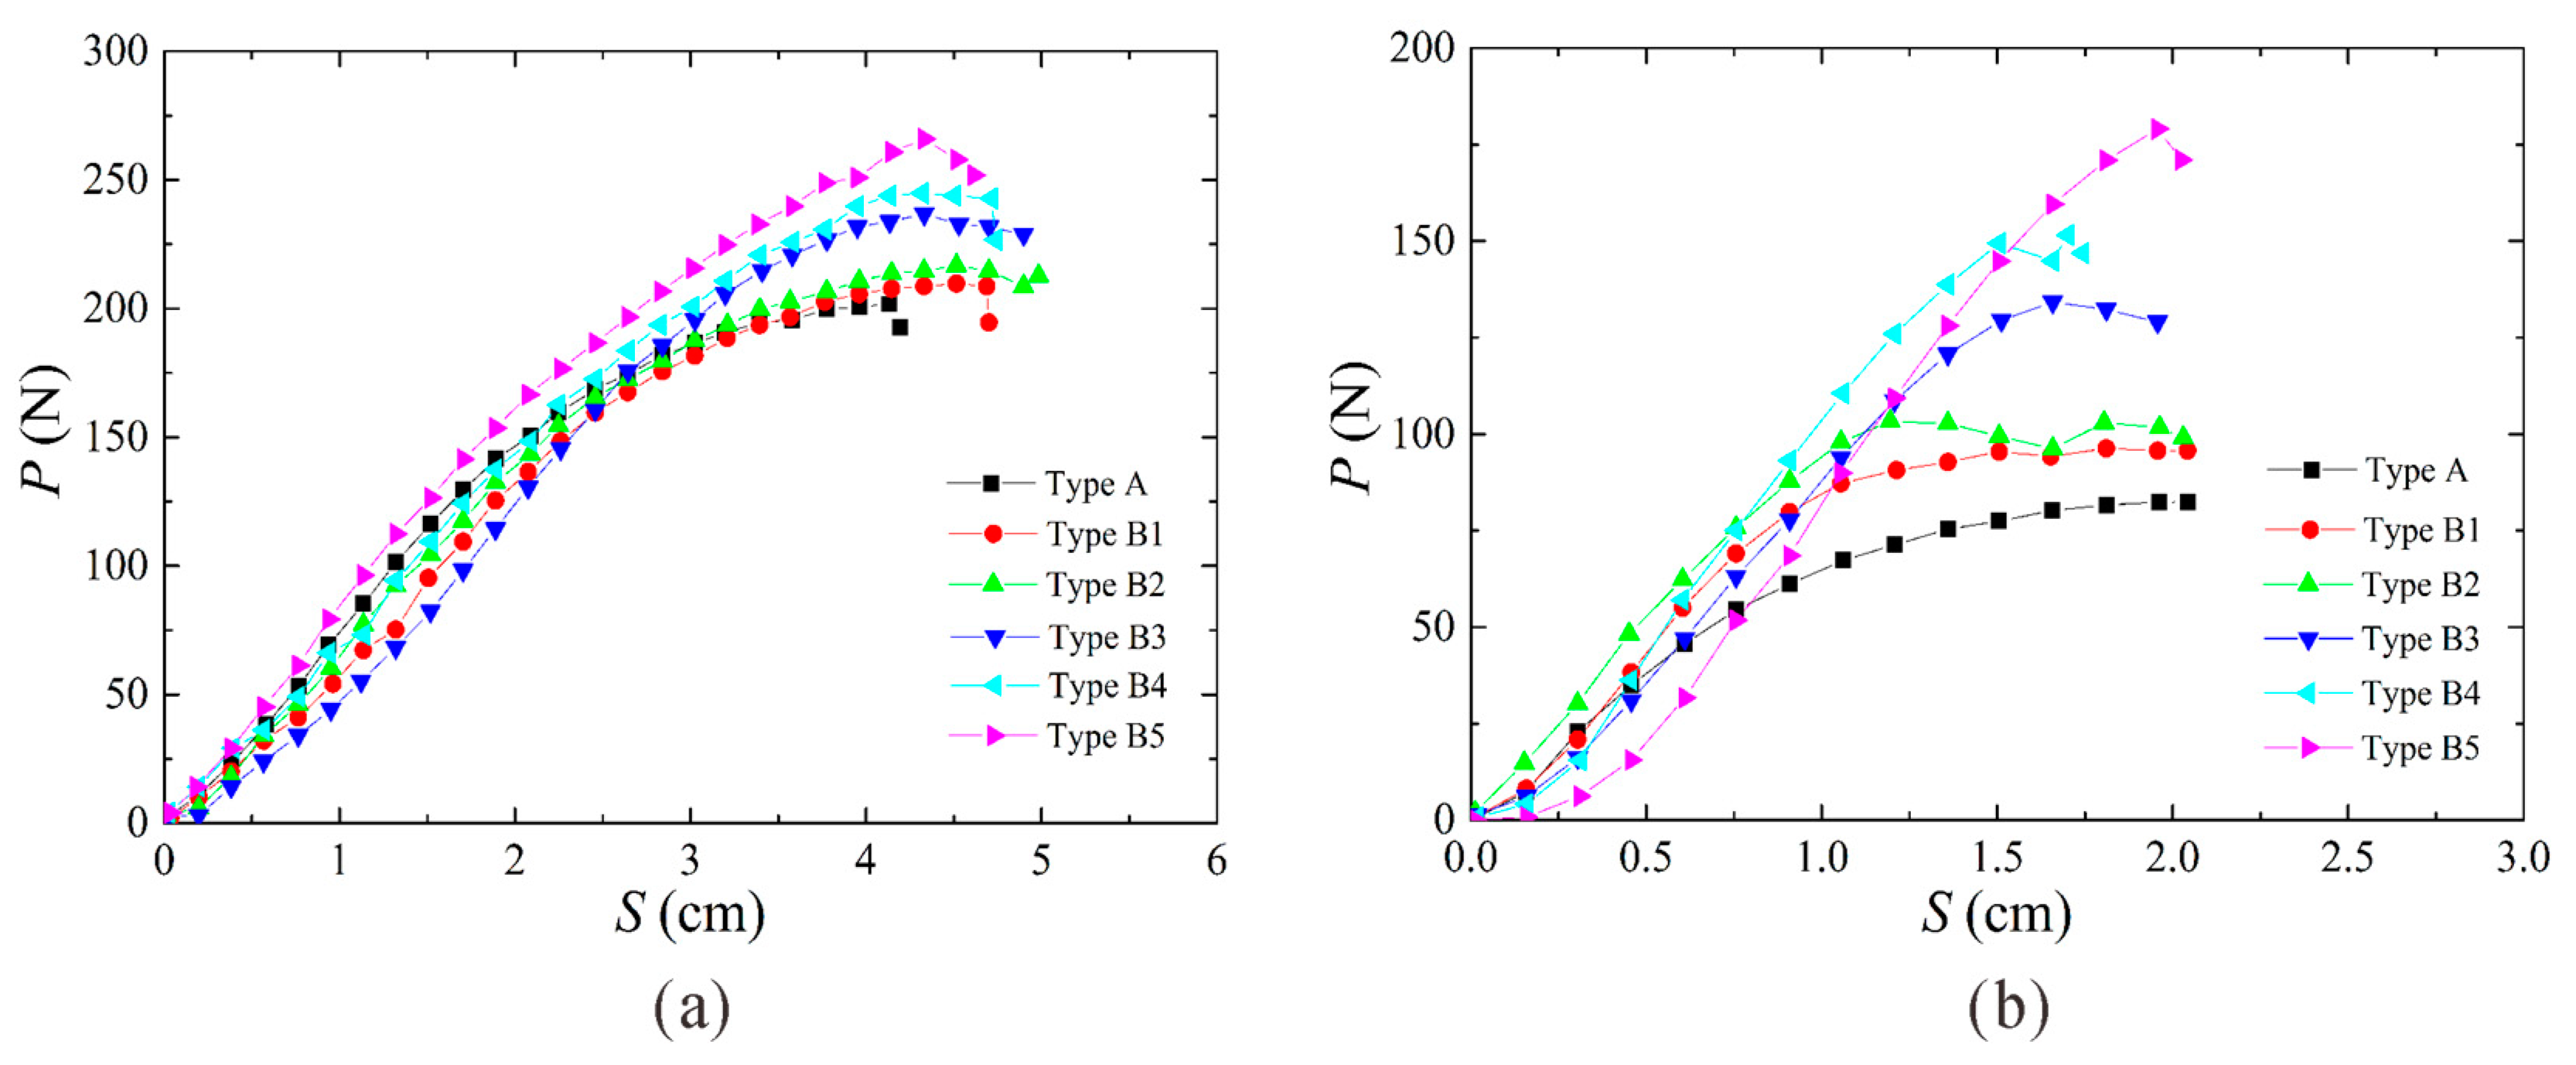
3.2. Analysis of Oblique and Horizontal Load–Displacement Curves

A TA in normal operation is generally subjected to an oblique pullout load. To examine the effects of α on the P value, tests were conducted at Dr = 0.6, h = 2.0L, and α = 0° and 45°. Figure 5 shows the test results. As shown in Figure 5a, the horizontal PS curves of the two types of TAs were similar, and each contained a peak. However, under horizontal pullout loading, the P value of the end-bearing TAs was slightly higher than that of the conventional TA. Under horizontal pullout loading, a TA primarily moves through rotation and is subjected to passive earth pressure at both sides of the center of rotation, and its P depends on the passive earth pressure. The bearing plates of end-bearing TAs are horizontal, the same as the pullout load, and therefore play a relatively non-significant role. As a result, the above test results were obtained. Figure 5b reveals a significant difference between the PS curves of the two types of TAs at α = 45°. For the conventional TA, P increased slowly as S increased, similar to the trend observed under vertical pullout loading. In contrast, each end-bearing TA with a relatively large A exhibited a significantly higher P, with a peak on its curve. The curve of the conventional TA was similar to that of each end-bearing TA with a relatively small A, but the end-bearing TAs had a slightly higher P. Under oblique pullout loading, a TA not only moves vertically, but also rotates horizontally, and its P depends on both the lateral earth pressure and the frictional resistance between it and the soil. The presence of a vertical S allows the end resistance provided by the bearing plates of an end-bearing TA to play its role. Therefore, the P of end-bearing TAs should be higher than that of conventional TAs. The test results show that the P values of the type B1–B5 TAs were 16%, 30%, 64%, 83%, and 118% higher than that of the type A TA, respectively.

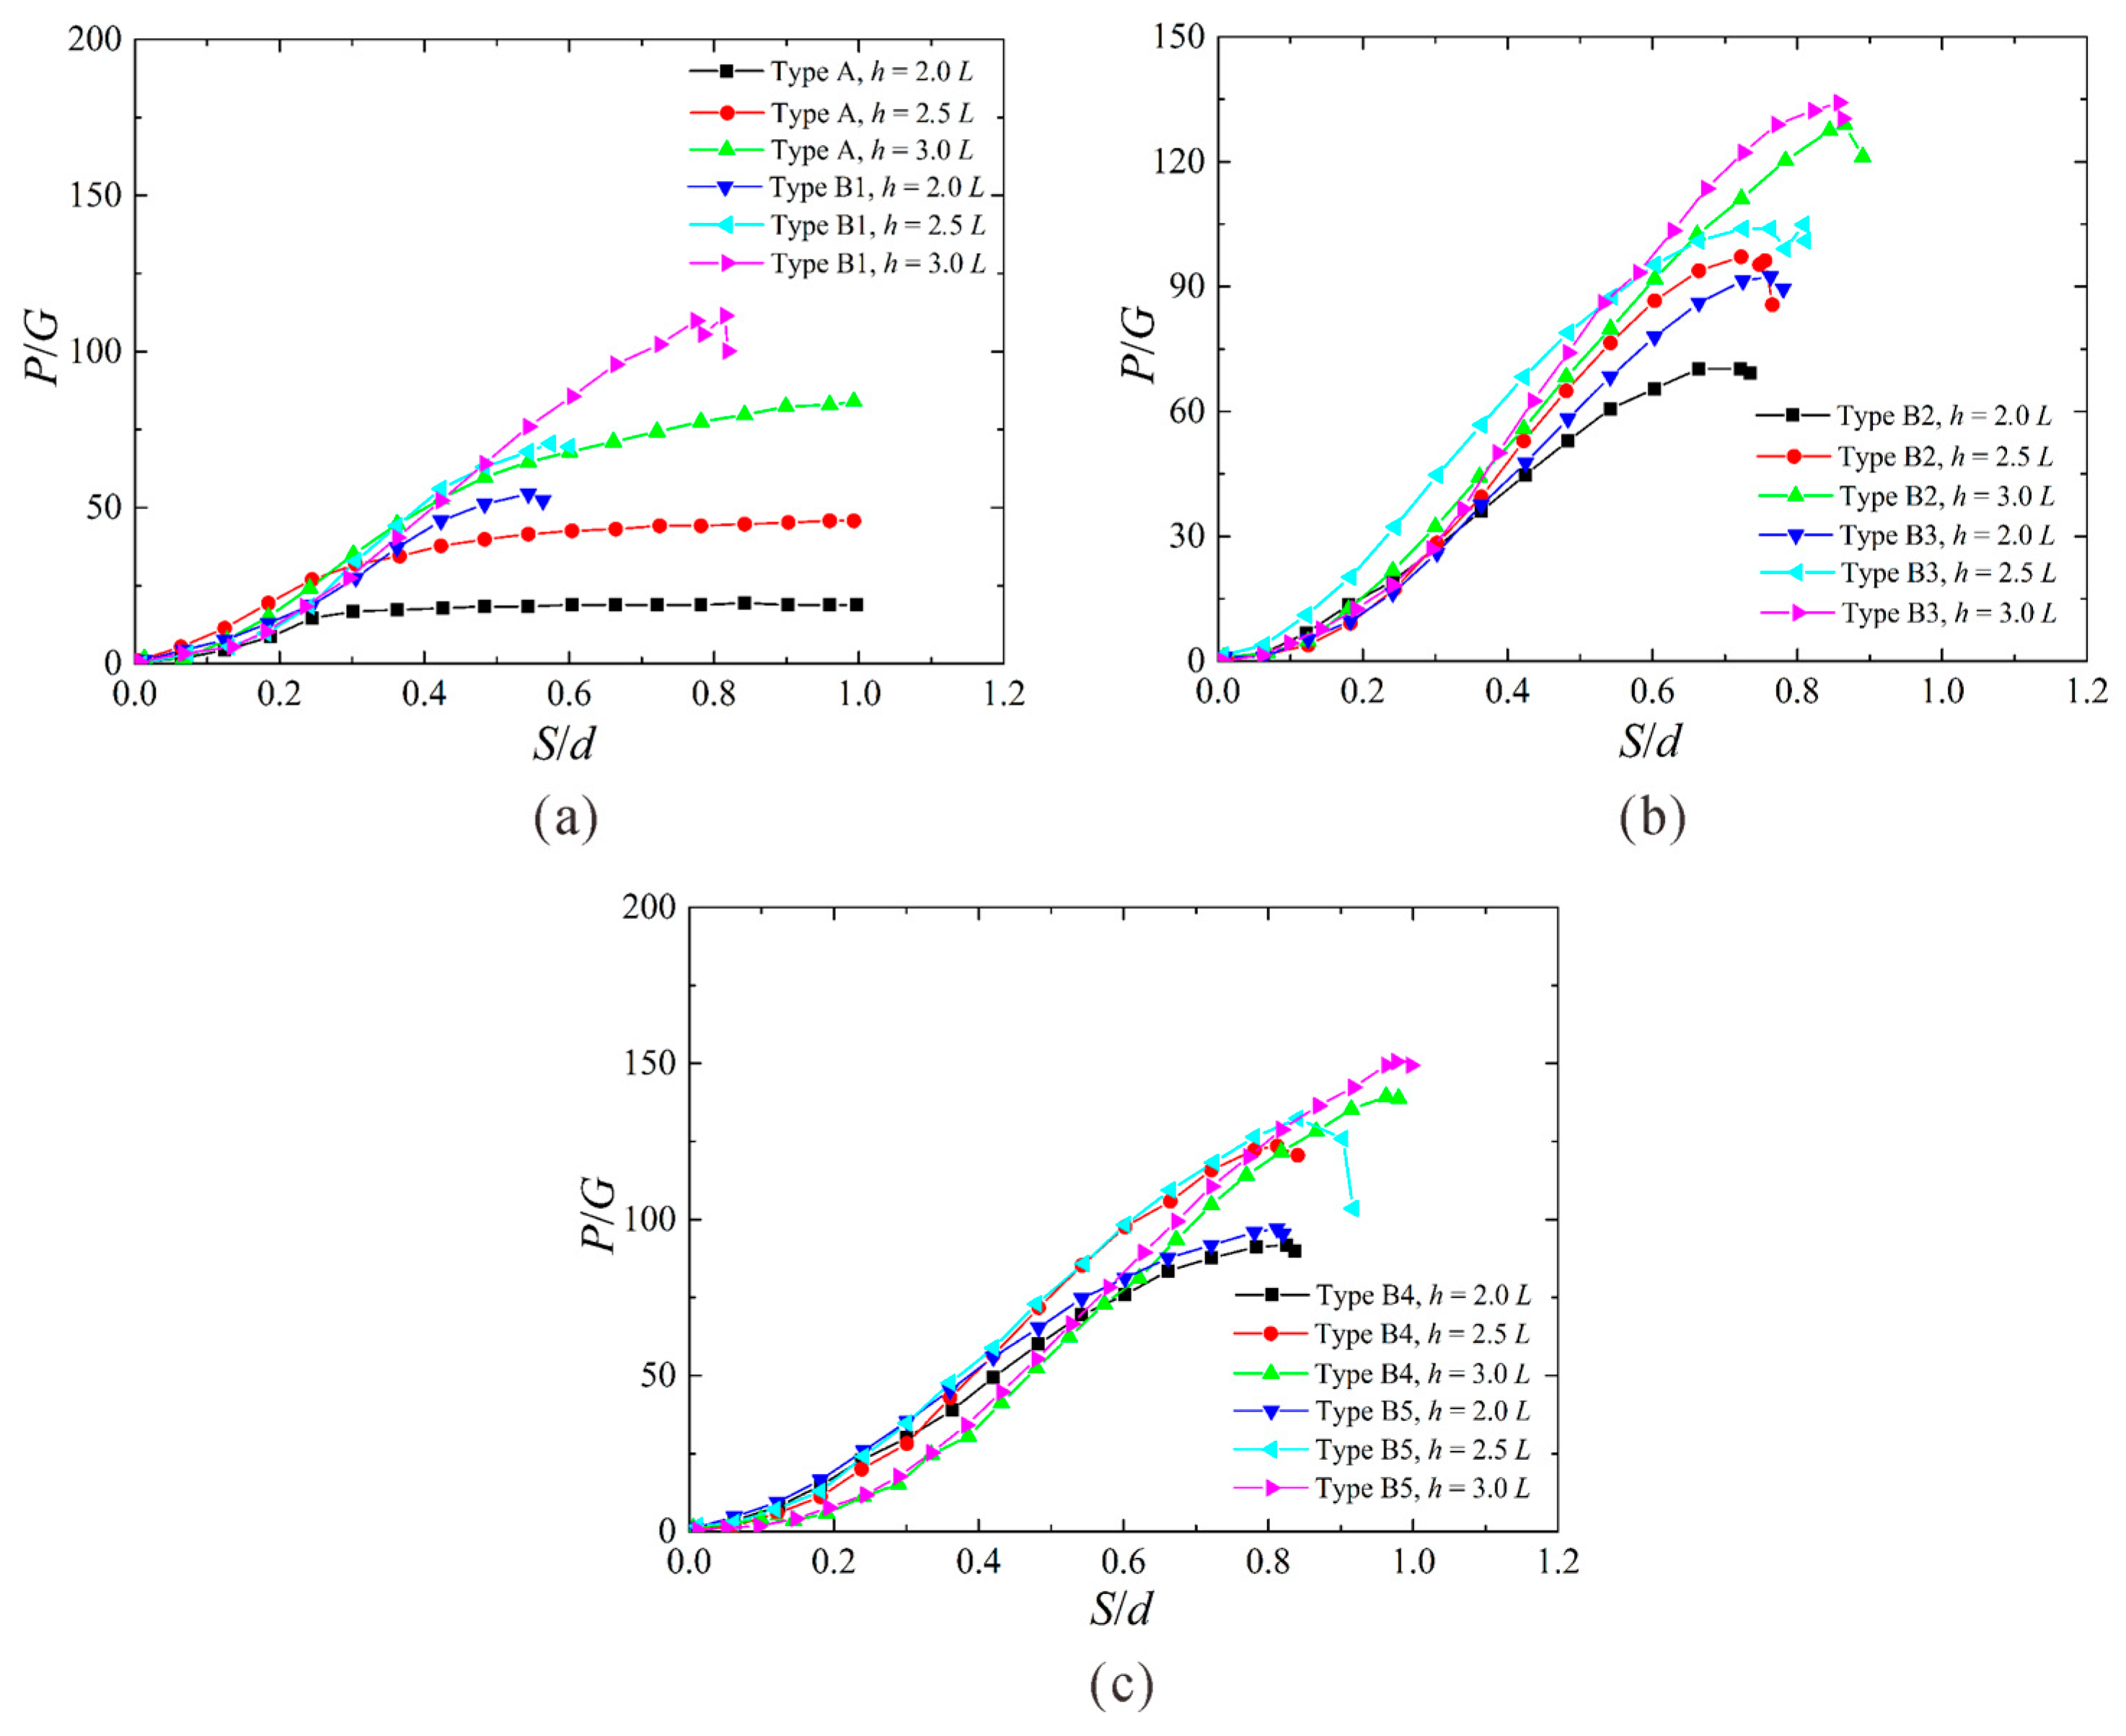
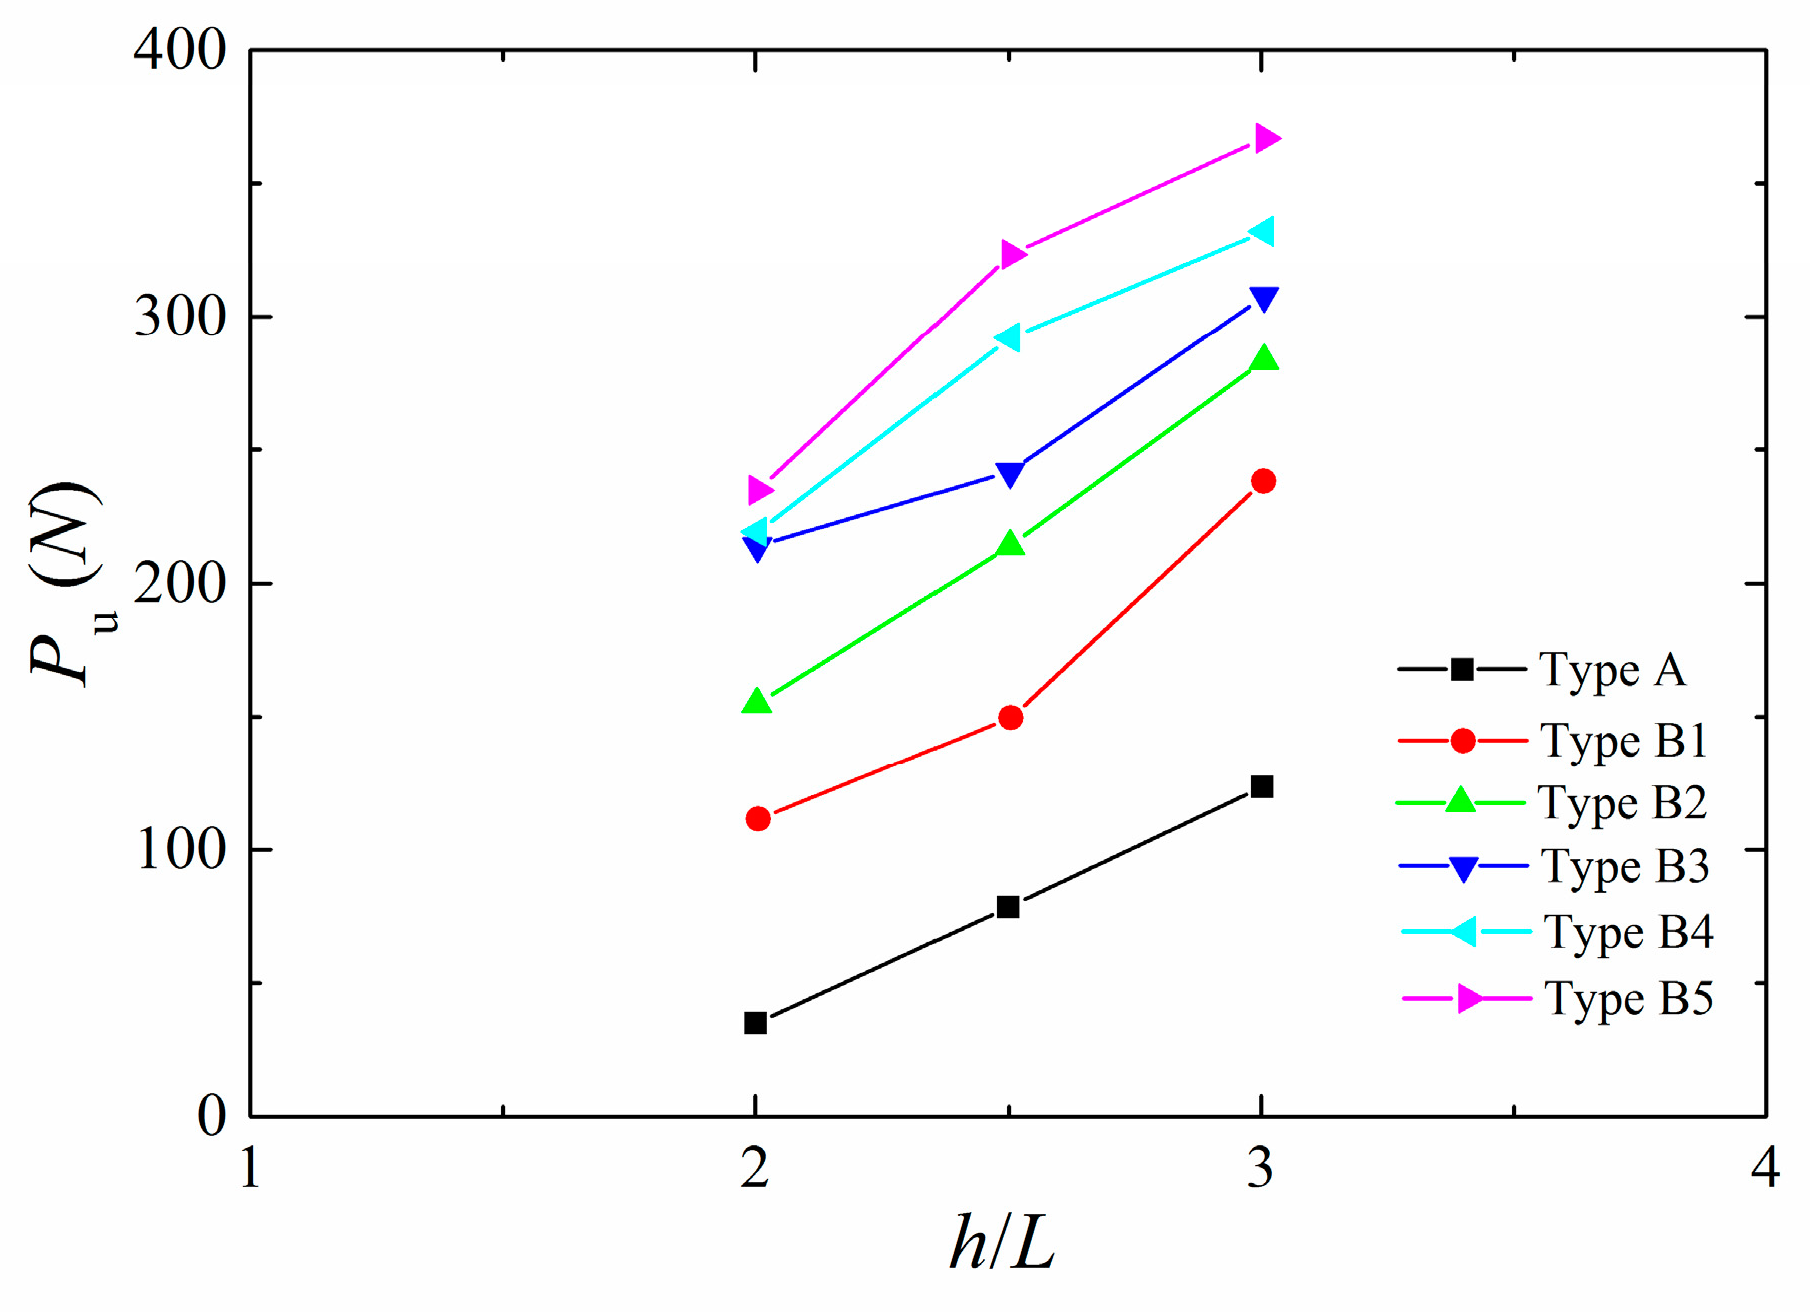
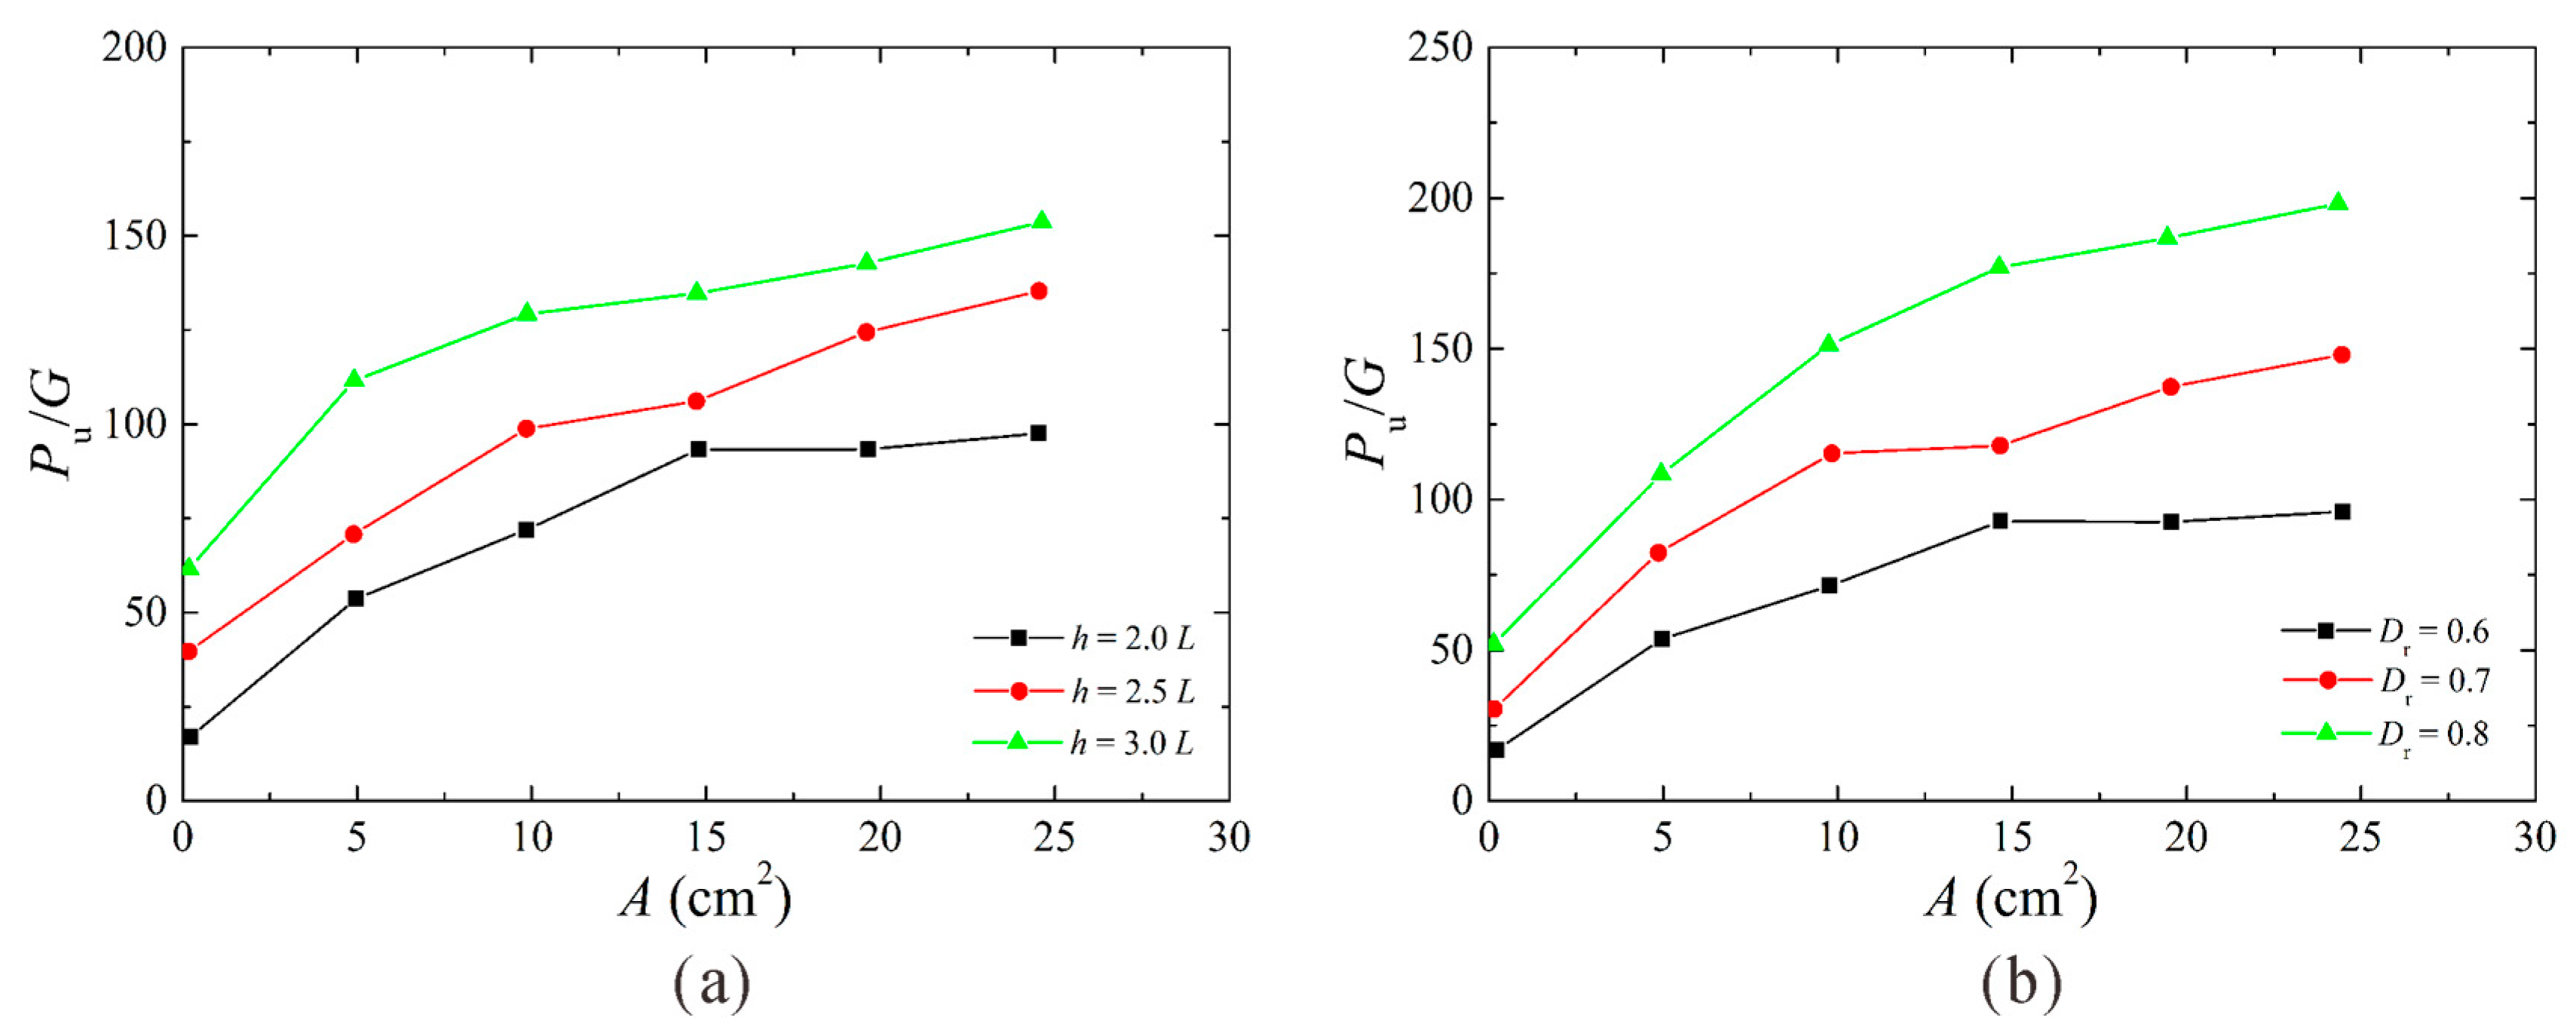
3.3. Effects of h on P

h is a major factor that affects the P of a TA. Therefore, the PS curves of the type A and B TAs at h = 2.0L, 2.5L, and 3.0L under vertical pullout loading were obtained (Figure 6). P and S were non-dimensionalized based on the self-weight of the TA and the diameter of the shank of the TA, respectively. The P of each type of TA increased as h increased. As S increased, the P of the type A TA increased considerably at h = 3.0L, and slowly at h < 3L. Therefore, maximizing h is crucially important for improving the P of type A TAs. For the type B TAs, similar P curves were obtained at different h values.
Figure 7 shows the Ph curves of the two types of TAs at Dr = 0.6. At the same h, the P of the end-bearing TA was significantly higher than that of the conventional TA, and increased as A increased. At h = 2.0L, the P values of the type B1–B5 TAs were 220%, 345%, 515%, 530%, and 575% higher than that of the type A TA, respectively. At h = 3.0L, the P values of the type B1–B5 TAs were 93%, 130%, 149%, 169%, and 197% higher than that of the type A TA, respectively. These results show that increasing h reduces the effectiveness of bearing plates in improving P.

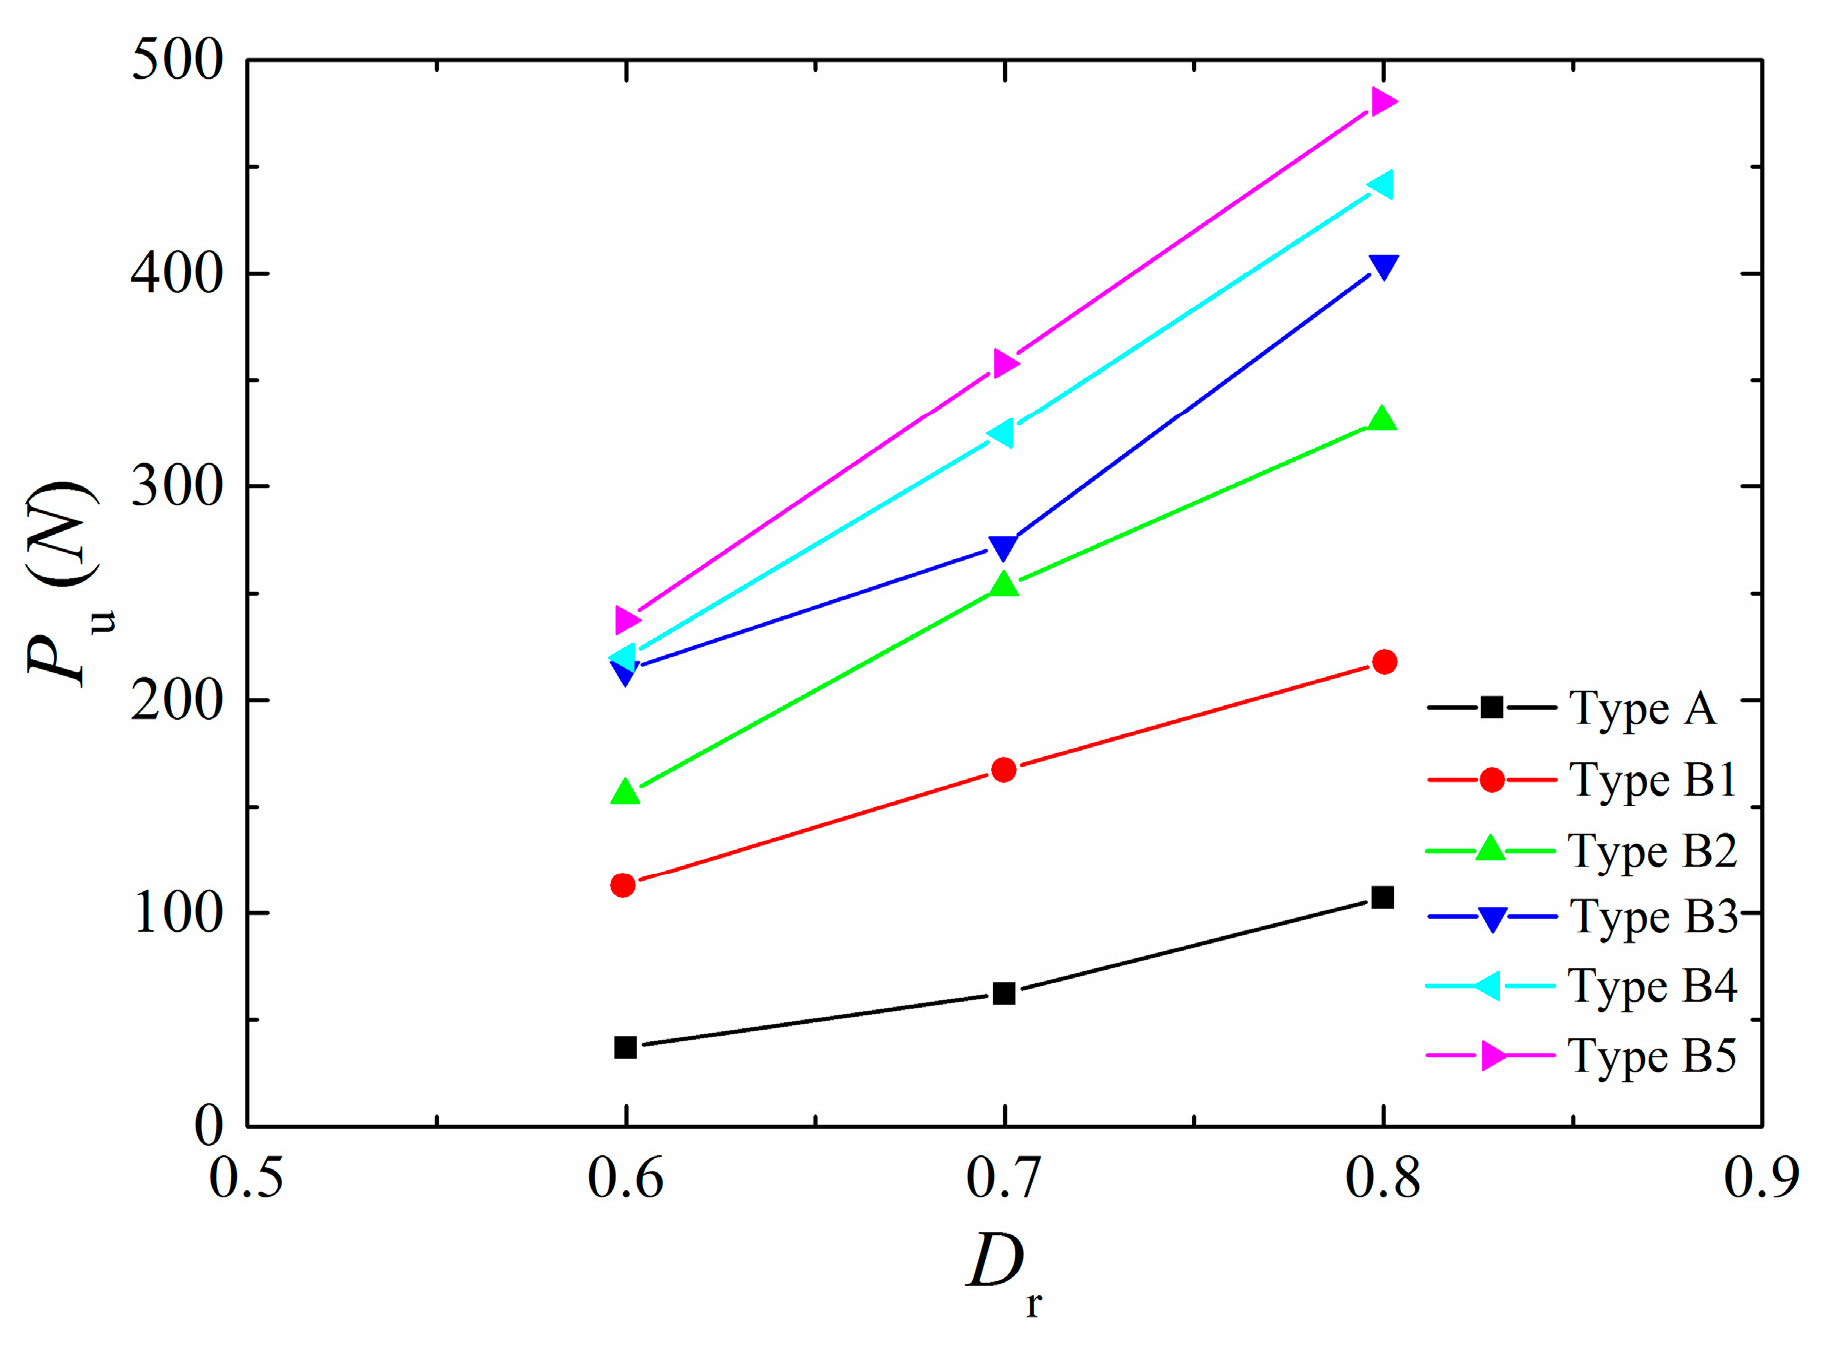
3.4. Effects of Dr on P

The effects of Dr on the P values of the two types of TAs were analyzed. Figure 8 shows the PS curves of the TAs at h = 2.0L under vertical pullout loading. It can be seen that as Dr increased, the P of the type A and B TAs increased. At the same h, the P of each type B TA was significantly higher than that of the type A TA. At Dr = 0.7, the P values of the type B1–B5 TAs were approximately 169%, 309%, 337%, 424%, and 475% higher than that of the type A TA, respectively. Figure 9 shows the PDr curves of the two types of TAs at h = 2.0L. Under vertical pullout loading, the P of the type A and B TAs gradually increased as Dr increased. At each Dr, the P of each type B TA was significantly higher than that of the type A TA. At h = 2.0L, the P of the type A TA increased by 68.4% and 71.9% as Dr increased from 0.6 to 0.7, and from 0.7 to 0.8, respectively. Transducer failure caused errors in the measurement of the P of the type B3 TA. For the remaining type B TAs, the vertical P values of the type B1, B2, B4, and B5 TAs increased by 48.3%, 62.5%, 47.8%, and 50.8% as Dr increased from 0.6 to 0.7, respectively; their vertical P values increased by 30.2%, 30.8%, 35.9%, and 34.2% as Dr increased from 0.7 to 0.8, respectively. This finding suggests that increasing Dr can reduce the effectiveness of bearing plates in increasing the P of a TA.

3.5. Effects of A on P

The P of an end-bearing TA depends on A. The type B1–B5 TAs used in this study had A values of 4.9, 9.8, 14.7, 19.6, and 24.5 cm2, respectively. Figure 10 shows the PA curves at different h and Dr values. At Dr = 0.6, the vertical P of the type B TA increased as A increased, and increased significantly as h increased. At h = 2.0L, the vertical P of the type B TA increased as A increased, and increased considerably as Dr increased. These findings are consistent with those obtained from earlier analyses.

4. Conclusions

Based on the pullout model tests, this study examined the bearing capacity of conventional and end-bearing torpedo anchors and investigated the effects of factors such as embedment depth, relative density, pullout angle, and area of the bearing plates on the bearing capacity. The main findings of this study are summarized as follows:
(1)
When embedment depth reached 2 times the shank length, for the conventional torpedo anchor, the vertical bearing capacity increased slowly as displacement increased, with no peak on the bearing capacity–displacement curve. In comparison, for each end-bearing torpedo anchor, the vertical bearing capacity increased rapidly as displacement increased, with a notable peak on the bearing capacity–displacement curve. Under vertical pullout loading, the bearing capacity of each end-bearing torpedo anchor was much higher than that of the conventional torpedo anchor, and increased as area increased.
(2)
Under horizontal pullout loading, similar bearing capacity-displacement curves were obtained for the conventional and end-bearing torpedo anchors, and each had a peak. In addition, these two types of torpedo anchors displayed essentially similar bearing capacity values. Under pullout loading at a pullout angle equal to 45°, area had a relatively significant impact on the bearing capacity of the end-bearing torpedo anchor. The bearing capacity increased relatively considerably as area increased beyond three times the cross-sectional area of the shank, with a notable peak on the bearing capacity–displacement curve. In contrast, there was no peak on the bearing capacity–displacement curve when the area was smaller than three times the cross-sectional area of the shank.
(3)
Both embedment depth and relative density were found to have a major impact on the bearing capacity. The bearing capacity of the conventional and end-bearing torpedo anchors increased as embedment depth and relative density increased. In addition, increasing embedment depth and relative density had a significantly greater impact on the bearing capacity of the conventional torpedo anchor than that of the end-bearing torpedo anchor. At fixed embedment depth and relative density, the bearing capacity of the end-bearing torpedo anchor was significantly higher than that of the conventional torpedo anchor, and increased as area increased.
(4)
Based on the research results, it can be found that the bearing capacity of torpedo anchors under horizontal pullout loading is greater than that of oblique and vertical pullout loading. The bearing capacity of the end-bearing torpedo anchor significantly increased as shank area, embedment depth, and relative density increased, and it reached maximum when embedment depth reached 3 times the shank length, relative density reached 0.8, and shank area reached 6 times the cross-sectional area. These research results can provide a guideline for installation of torpedo anchors, which need to be validated in further studies.

Author Contributions

Conceptualization, J.Z. and G.L.; methodology, J.Z. and G.L.; validation, J.L., J.Z. and G.L.; writing—original draft preparation, G.L.; writing—review and editing, J.Z.; funding acquisition, G.L. All authors have read and agreed to the published version of the manuscript.

Funding

This research was funded by the Natural Science Basic Research Program of Shaanxi Province, grant number 2021JM-535 and the Special Fund for Scientific Research by Xijing University, grant number XJ18T01.

Institutional Review Board Statement

Not applicable.

Informed Consent Statement

Not applicable.

Data Availability Statement

Not applicable.

Acknowledgments

The Youth Innovation Team of Shaanxi Universities is acknowledged.

Conflicts of Interest

The authors declare no conflict of interest.

References

  1. Zhou, L.L.; Bao, X.W.; Yu, J.; Zhang, Y.; Feng, R.Y. Recent initiatives and developments in the ecological utilization of marine resources (EUMR) in China. J. Coast. Res. 2019, 93, 443–449. [Google Scholar] [CrossRef]
  2. Zereshkian, S.; Mansoury, D. A study on the feasibility of using solar radiation energy and ocean thermal energy conversion to supply electricity for offshore oil and gas fields in the Caspian Sea. Renew. Energy 2021, 163, 66–77. [Google Scholar] [CrossRef]
  3. Tay, J.H.; Show, K.Y.; Lee, D.J.; Hong, S.Y. Reuse of wastewater sludge with marine clay as a new resource of construction aggregates. Water Sci. Technol. 2004, 50, 189–196. [Google Scholar] [CrossRef] [PubMed]
  4. Spagnoli, G.; Doherty, P.; Murphy, G.; Attari, A. Estimation of the compression and tension loads for a novel mixed-in-place offshore pile for oil and gas platforms in silica and calcareous sands. J. Pet. Sci. Eng. 2015, 136, 1–11. [Google Scholar] [CrossRef]
  5. Yan, W.; Zhang, G.X.; Xia, B.; Zhang, L.; Yang, Z.; Lei, Z.Y.; Yao, H.Q. Seismic characteristics and development patterns of miocene carbonate platform in the Beikang basin, southern South China Sea. Acta Geol. Sin. 2020, 94, 1651–1661. [Google Scholar] [CrossRef]
  6. Zhang, N.; Evans, T.M. Discrete numerical simulations of torpedo anchor installation in granular soils. Comput. Geotech. 2019, 108, 40–52. [Google Scholar] [CrossRef]
  7. Kim, Y.H.; Hossain, M.S.; Lee, J.K. Dynamic installation of a torpedo anchor in two-layered clays. Can. Geotech. J. 2017, 55, 446–454. [Google Scholar] [CrossRef] [Green Version]
  8. Soh, B.; Pao, W.; Chen, X.H. Numerical analyses for improved terminal velocity of deep water torpedo anchor. Int. J. Numer. Methods Heat Fluid Flow 2017, 27, 428–443. [Google Scholar] [CrossRef] [Green Version]
  9. Wang, C.; Zhang, M.X.; Yu, G.L. Vertical pullout behaviour of a torpedo anchor vertically in stiff-over-soft cohesive soil bed. IOP Conf. Ser. Earth Environ. Sci. 2019, 300, 022139. [Google Scholar] [CrossRef]
  10. Raie, M.S.; Tassoulas, J.L. Installation of torpedo anchors: Numerical modeling. J. Geotech. Geoenviron. Eng. 2009, 135, 1805–1813. [Google Scholar] [CrossRef]
  11. Chen, X.H.; Zhang, M.X.; Yu, G.L. A self-penetration torpedo anchor with vibrational shearing. Ocean Eng. 2021, 236, 109315. [Google Scholar] [CrossRef]
  12. Wang, W.K.; Wang, X.F.; Yu, G.L. Penetration depth of torpedo anchor in cohesive soil by free fall. Ocean Eng. 2016, 116, 286–294. [Google Scholar] [CrossRef]
  13. Ads, A.; Iskander, M.; Bless, S.; Omidvar, M. Visualizing the effect of Fin length on torpedo anchor penetration and pullout using a transparent soil. Ocean Eng. 2020, 216, 108021. [Google Scholar] [CrossRef]
  14. Hossain, M.S.; O’Loughlin, C.D.; Kim, Y. Dynamic installation and monotonic pullout of a torpedo anchor in calcareous silt. Geotechnique 2015, 65, 77–90. [Google Scholar] [CrossRef] [Green Version]
  15. Lai, Y.; Huang, Y.H.; Chen, C.; Zhu, B. Free-fall penetration behaviors of a new dynamically installed plate anchor in marine clay. China Ocean Eng. 2020, 34, 795–805. [Google Scholar] [CrossRef]
  16. Hasanloo, D.; Pang, H.L.; Yu, G.L. On the estimation of the falling velocity and drag coefficient of torpedo anchor during acceleration. Ocean Eng. 2012, 42, 135–146. [Google Scholar] [CrossRef]
  17. Wang, W.K.; Wang, X.F.; Yu, G.L. Vertical holding capacity of torpedo anchors in underwater cohesive soils. Ocean Eng. 2018, 161, 291–307. [Google Scholar] [CrossRef]
  18. Wang, C.; Wang, X.F.; Chen, X.H.; Yu, G.L. Maximum vertical pullout force of torpedo anchors in cohesive seabeds at different steady pullout velocities. J. Coastal Res. 2020, 36, 1068–1078. [Google Scholar] [CrossRef]
  19. Wang, C.; Chen, X.H.; Yu, G.L. Maximum force of inclined pullout of a torpedo anchor in cohesive beds. China Ocean Eng. 2019, 33, 333–343. [Google Scholar] [CrossRef]
  20. Wang, C.; Zhang, M.X.; Yu, G.L. Penetration depth of torpedo anchor in two-layered cohesive soil bed by free fall. China Ocean Eng. 2018, 32, 706–717. [Google Scholar] [CrossRef]
  21. Santiago, P.C.; Saboya, F.; Tibana, S.; Reis, R.M.; Borges, R.G. Centrifuge modelling of a combined pile-type anchor subjected to general inclined loading. Mar. Struct. 2020, 74, 102815. [Google Scholar] [CrossRef]
  22. Fernandes, A.C.; de Araujo, J.B.; de Almeida, J.C.L.; Machado, R.D.; Matos, V. Torpedoanchor installation hydrodynamics. J. Offshore Mech. Arct. Eng. 2006, 128, 286–293. [Google Scholar] [CrossRef]
  23. Fernandes, A.C.; Sales, J.J.S.; Silva, D.F.C.; Diederichs, G.R. Directional stability of the torpedo anchor pile during its installation. IES J. Part A Civ. Struct. Eng. 2011, 4, 180–189. [Google Scholar] [CrossRef]
  24. Chang, K.; Hossain, M.S.; Kim, Y.H. Performance of a novel dynamically installed fish anchor in calcareous silt. J. Geotech. Geoenviron. Eng. 2019, 145, 04019019. [Google Scholar] [CrossRef]
  25. Raaj, S.K.; Saha, N.; Sundaravadivelu, R. Freefall hydrodynamics of torpedo anchors through experimental and numerical analysis. Ocean Eng. 2022, 243, 110213. [Google Scholar] [CrossRef]
  26. Kunitaki, D.M.K.N.; de Lima, B.S.L.P.; Evsukoff, A.G.; Jacob, B.P. Probabilistic and fuzzy arithmetic approaches for the treatment of uncertainties in the installation of torpedo piles. Math. Probl. Eng. 2008, 2008, 512343. [Google Scholar] [CrossRef] [Green Version]
  27. O’Beirne, C.; O’Loughlin, C.D.; Gaudin, C. A release-to-rest model for dynamically installed anchors. J. Geotech. Geoenviron. Eng. 2017, 143, 04017052. [Google Scholar] [CrossRef]
  28. Raie, M.S.; Tassoulas, J.L. Simulation of torpedo anchor set-up. Mar. Struct. 2016, 49, 138–147. [Google Scholar] [CrossRef]
  29. Sagrilo, L.V.S.; de Sousa, J.R.M.; Lima, E.C.P.; Porto, E.C.; Fernandes, J.V.V. A Study on the holding capacity safety factors for torpedo anchors. J. Appl. Math. 2012, 2012, 102618. [Google Scholar] [CrossRef]
  30. De Sousa, J.R.M.; de Aguiar, C.S.; Ellwanger, G.B.; Porto, E.C.; Foppa, D.; de Medeiros, C.J. Undrained load capacity of torpedo anchors embedded in cohesive soils. J. Offshore Mech. Arct. Eng. 2011, 133, 021102. [Google Scholar] [CrossRef]
  31. Kim, Y.H.; Hossain, M.S.; Wang, D. Effect of strain rate and strain softening on embedment depth of a torpedo anchor in clay. Ocean Eng. 2015, 108, 704–715. [Google Scholar] [CrossRef] [Green Version]
  32. Kim, Y.H.; Roshera, L.T. Performance of novel dynamic installed anchors during installation and monotonic pullout. Geomech. Eng. 2019, 18, 153–159. [Google Scholar]
  33. Kim, Y.H.; Hossain, M.S. Numerical study on pull-out capacity of torpedo anchors in clay. Géotechn. Lett. 2016, 6, 275–282. [Google Scholar] [CrossRef] [Green Version]
  34. Kim, Y.H.; Hossain, M.S.; Wang, D.; Randolph, M.F. Numerical investigation of dynamic installation of torpedo anchors in clay. Ocean Eng. 2015, 108, 820–832. [Google Scholar] [CrossRef] [Green Version]
  35. Sabetamal, H.; Carter, J.P.; Nazem, M.; Sloan, S.W. Coupled analysis of dynamically penetrating anchors. Comput. Geotech. 2016, 77, 26–44. [Google Scholar] [CrossRef]
  36. Sabetamal, H.; Nazem, M.; Carter, J.P.; Sloan, S.W. Large deformation dynamic analysis of saturated porous media with applications to penetration problems. Comput. Geotech. 2014, 55, 117–131. [Google Scholar] [CrossRef]
  37. American Petroleum Institute. Recommended Practice for Planning, Designing and Constructing Fixed Offshore Platforms-Working Stress Design, 21st ed.; RP2A-WSD; American Petroleum Institute: Washington, DC, USA, 2000. [Google Scholar]
Figure 1. Particle-size distribution curve of the test sand.
Jmse 10 00728 g001
Figure 2. Model of torpedo anchors.
Jmse 10 00728 g002
Figure 3. Schematic of the pullout test setup.
Jmse 10 00728 g003
Figure 4. Load–displacement curves of the TAs under vertical pullout loading (a) Dr = 0.6; (b) Dr = 0.7; (c) Dr = 0.8.
Jmse 10 00728 g004
Figure 5. Load–displacement curves of the TAs under oblique and horizontal pullout loading (a) α = 0°; (b) α = 45°.
Jmse 10 00728 g005
Figure 6. Effects of h on the load–displacement curves of the TAs under vertical pullout loading (a) Types A and B1; (b) Types B2 and B3; (c) Types B4 and B5.
Jmse 10 00728 g006
Figure 7. Ph curves of the TAs under vertical pullout loading.
Jmse 10 00728 g007
Figure 8. Effects of Dr on the load–displacement curves of the TAs under vertical pullout loading (a) Types A and B1; (b) Types B2 and B3; (c) Types B4 and B5.
Jmse 10 00728 g008
Figure 9. PDr curves of the TAs under vertical pullout loading.
Jmse 10 00728 g009
Figure 10. PA curves of the TAs under vertical pullout loading (a) Dr = 0.6; (b) h = 2.0L.
Jmse 10 00728 g010
Table 1. Physical parameters of the test sand.
GsemaxeminCuCc
2.6500.8020.3493.6231.099
Table 2. Similarity principle between prototype and model.
ParameterSymbolScale (Prototype/Model)
LengthLλ
Depthhλ
AreaAλ2
Massmλ3
GravityGλ3
Water densityρw1
Soil densityρs1
Timetλ0.5
Drag resistancePλ3
DisplacementSλ
Table 3. Test schemes.
Drh (cm)α (°)
0.62.0L0°, 45°, 90°
0.62.5L, 3.0L90°
0.72.0L90°
0.82.0L90°
Publisher’s Note: MDPI stays neutral with regard to jurisdictional claims in published maps and institutional affiliations.

