Article

Harnessing of Different WECs to Harvest Wave Energy along the Galician Coast (NW Spain)

by
Beatriz Arguilé-Pérez
1,*,
Américo Soares Ribeiro
1,2,
Xurxo Costoya
1,
Maite deCastro
1,
Pablo Carracedo
3,
João Miguel Dias
2,
Liliana Rusu
4 and
Moncho Gómez-Gesteira
1
1
Environmental Physics Laboratory (EPhysLab), Centro de Investigación Mariña, Universidade de Vigo, Campus da Auga, 32004 Ourense, Spain
2
CESAM, Physics Department, University of Aveiro, 3810-193 Aveiro, Portugal
3
MeteoGalicia, 15707 Santiago de Compostela, A Coruña, Spain
4
Department of Mechanical Engineering, Faculty of Engineering, ‘Dunarea de Jos’ University of Galati, 111 Domneasca St., 800201 Galati, Romania
*
Author to whom correspondence should be addressed.
J. Mar. Sci. Eng. 2022, 10(6), 719; https://doi.org/10.3390/jmse10060719
Submission received: 18 April 2022 / Revised: 15 May 2022 / Accepted: 21 May 2022 / Published: 24 May 2022
(This article belongs to the Special Issue Offshore Renewables for a Transition to a Low Carbon Society)

Abstract

:
The wave power resource (WP) was calculated along the Galician coast (NW Spain) over the period 2014–2021 using high spatial resolution hourly data from the SWAN model. In addition, the electrical energy (PE) that can be extracted for a particular wave energy converter (WEC) was analyzed for four different WECs (Oyster, Atargis, Aqua Buoy, and Pelamis). The performance of every WEC was also calculated attending to two parameters: the power load factor (ε) and the normalized capture width with respect to the WEC’s geometry (efficiency). Results show that the WP resource is lower than 10 kWm−1 onshore, but it increases to about 50 kWm−1 offshore. Atargis obtained the highest PE, and it is the most efficient device (ε ~40% and efficiency ~45%). Pelamis showed the lowest performance in offshore areas ( ε ~15%, efficiency < 10%). A different type of WEC should be considered for every location along the coast depending on its size, performance parameters, and coexistence with other socio-economic activities and protected environmental areas.

1. Introduction and Studied Area

More than 81% of the world’s primary energy consumption comes from fossil fuels [1], which have a clear influence on the increase in greenhouse gases and global temperature [2]. In addition, global energy demand continues to rise, and fossil resources are increasingly scarce [3,4], highlighting the urgency of the energy transition. At the United Nations Conference on Climate Change (COP26), held in Glasgow in the autumn of 2021, many countries agreed upon a series of political action guidelines. Among them, the 1.5 ºC scenario was maintained, for which it is necessary to reduce greenhouse gas emissions by 45%—with respect to 2010 levels—at the end of the current decade and reach zero emissions in 2050 [5]. One of the United Nations 2030 Agenda for Sustainable Development goals is to “increase substantially the share of renewable energy in the global energy mix” to mitigate global warming and ensure energy supply [6]. To achieve the necessary success in developing renewable energy, it is essential to use all available renewable sources, including marine energy.
Ocean waves continually form on the ocean surface and can travel thousands of miles with minimal energy loss [7]. A higher and more stable density power [7,8] makes wave energy a clear alternative to other “more conventional” renewable energies. In fact, the theoretical potential of wave power is 29,000 TWh per year, which is enough to meet the world’s electricity demand [9]. In addition, wave energy has the advantage of having more predictability than solar or wind power and is less dependent on environmental factors [10]. Unlike offshore wind power, the wave power resource is not yet being commercially exploited [9]. The survivability of the wave energy converters in the harsh marine environment, the lack of consensus on the choice of the most suitable device, and their economic costs have hindered their commercialization since the first patent in 1799 [11]. However, many of the wave energy converters can be scalable in size according to local wave characteristics to optimize their efficiency and make them economically profitable [10]. Another drawback is that wave energy devices have to coexist with other uses of the sea, such as shipping, fishing, or aquaculture. Nevertheless, these marine businesses—the so-called blue economy—can benefit from the installation of wave energy harvesting devices by not having to look for energy sources on land [9]. In addition, the installation of these devices in the vicinity of shellfishing areas could also protect them from waves by dissipating part of their energy.
The natural wave power (WP) resource depends on the sea state and is determined by the wave significant height (Hs) and the wave peak period (Tp). The WP resource is defined as the amount of energy per unit of time and length of the wave front (expressed in kWm−1) transmitted in the direction of wave propagation [12]. Only a percentage of this resource will be transformed into electricity. This percentage depends on the wave energy converter (WEC) and its physical and technical characteristics (see [13,14,15,16,17] for more details). WECs can be classified attending to several factors. Depending on their operating principle, they can be oscillating water columns (OWS), oscillating bodies, wave-activated bodies, or cycloidal wave absorbers, among others (see [13,18,19,20] for more details). Regarding their optimal location, WECs are categorized into onshore, nearshore, and offshore devices [10,19,20,21]. They can also be classified as point absorbers, attenuators, and terminators according to their orientation with respect to the wavefront and their shape [20,21,22,23]. Attenuators and terminators have an elongated shape and are placed parallel and perpendicular to the direction of the wavefront, respectively, while point absorbers are similar to buoys. Attenuators and terminators must be larger than the predominant wavelength of the prevailing waves, while point absorbers have smaller dimensions than the main wavelength [21,24].
According to IRENA [25], in 2020, there was a total of 33 wave energy converters with a combined capacity of 2.3 MW distributed around the world. However, the European Commission aims to reach 1 GW of installed capacity by 2030 and 40 GW by 2050 [9]. Spain is the European country with the most R&D facilities in floating wind power and other marine energies [26,27]. For example, the experimental zone for the use of marine energy in Punta Langosteira (Galicia, Spain)—within the EnergyMare project—stands out. This site has the second-highest testbed wave energy density in the world, behind the south coast of Wales [27]. The Spanish government has set itself the goal of reaching 7 GW in floating wind power and between 40 and 60 MW of other marine energies—including wave power—by the end of this decade [27]. Galicia is the Spanish region with the highest wave energy potential (40–45 kWm−1), followed by the Cantabrian Sea (30 kWm−1) and the north of the Canary Islands (20 kWm−1) [27].
There are several studies on the wave power resource in large areas such as the Mediterranean Sea [28], the Black Sea [29], or along the western coast of the Iberian Peninsula [7,12]. However, regional studies allow the identification of local phenomena and areas of greatest interest in terms of the available wave energy. These regional studies are of vital importance to promote studies at a local scale in various areas of the planet and achieve a global energy transition. Regional studies require a high or very high spatial resolution. Thus, the Galician shelf was previously analyzed with a spatial resolution of 0.25° × 0.25° and with a higher resolution of 200 m × 200 m at the particular area between Cape San Adrián and Cape Ortegal [30]. In the same way, different locations in the north and west shelf of the Iberian Peninsula were analyzed with a nested grid of 0.5′ × 0.5′ [31,32]. Apart from analyzing the WP resource, previous studies have analyzed the amount of energy that can be actually harnessed by particular WECs at different points of the Iberian Peninsula shelf [12,32,33]. In these previous studies, the performance of the WECs is normally characterized by means of the capture width, which do not consider the dimensions of the different devices, making their comparison impossible.
The aim of this study is to analyze the wave power resource and the electrical power that could have been extracted from four WEC devices along the Galician coast between 2014 and 2021. Due to the narrowness of the continental shelf (Figure 1), the analysis of feasibility of the four WECs along the Galician coast makes it necessary to calculate the WP resource with a very high spatial resolution (a maximum of ~75 m) and also limits the type of device used. This very high spatial resolution makes it possible to calculate the wave power resource and the performance of these devices inside the estuaries. The performance of each WEC will be limited to the optimal depth range for the installation of the device and will be determined attending to two parameters: the power load factor (ε) and the normalized capture width according to the WEC’s geometry (efficiency). At this point, it is important to mention that it was developed as a new metric that allows comparisons to be made between different WECs taking into account their dimensions.

2. Data and Methodology

2.1. Data

The wave parameters H s and T p were provided by MeteoGalicia, the regional administration in charge of weather forecast for Galicia, using simulations of the third-generation SWAN model developed by the Delft University of Technology [34,35,36,37]. SWAN solves the spectral action balance equations [34] (defined in [38]) and is the most adequate tool in order to simulate high-resolution coastal waves [34]. SWAN model uses an unstructured variable mesh, with a higher spatial resolution in coastal and estuarine areas —where it can reach 75 m resolution—than offshore [34]. Consequently, high-resolution wave data are obtained in the areas of interest without exceeding computational time. The SWAN model physics included bottom friction, shoaling, and depth-induced breaking, and the wave spectrum was discretized to a resolution of Δf/f = 0.1 between the frequency range of 0.0521–1 Hz and 36 directional bands. As boundary conditions, the implementation uses MeteoGalicia regional models for waves (WAVEWATCH III, with temporal and spatial resolution of 1 h and 2.5 arc minute, respectively), wind (WRF, with temporal and spatial resolution of 1 h and 4 km, respectively), and water level series (ROMS, with temporal and spatial resolution of 1 h and 4 km, respectively). These specifications are shown in Table 1.
Hourly time resolution data can be downloaded in daily folders from the THREDDS server (Thematic Realtime Environmental Distributed Data Service), http://mandeo.meteogalicia.gal/thredds/catalog/modelos/SWAN_HIST/galicia/catalog.html (accessed on 22 January 2022) [39]. Although each daily file contains data for a 4-day horizon, only the first 24 h of each file were selected to work in hindcast mode. Data series are available from 2014 onwards.
Simulation outputs were validated with Langosteira II buoy data, provided by Puertos del Estado (https://www.puertos.es/es-es/oceanografia/Paginas/portus.aspx (accessed on 22 January 2022), [40]), to assess the accuracy of the model results. This buoy is located in the Northwest Coast, at coordinates 8 °   33   W ,   43 ° 22   N (Figure 1), being the only buoy that offers historical wave data on the Galician coast for the period considered in this study. Wave data have an hourly time resolution and are available from June 2013 to December 2021.

2.2. Methodology

Methods followed to validate the accuracy of SWAN model simulations to reproduce observed wave parameters ( H s and T p ) and to calculate the WP resource, and the WECs’ efficiency are described below.

2.2.1. Validation

The validation process has been carried out by comparing H s and T p measured by the Langosteira II buoy and those calculated by the SWAN model at the point closest to the buoy for the period 2014–2021. This period was selected because it is the common period between both datasets. Four different statistics parameters have been used: normalized root mean square error (NRMSE), normalized bias error (NBias), Spearman’s correlation coefficient ρ S , and the overlapping percentage (OP) between both series. RMSE is defined as the square root of the second sample moment of the differences between numerical and observed values [41,42]. As the magnitude of RMSE depends on the actual values of the series, the NRMSE defined in Equation (1) is a better option to compare two series of data.
NRMSE   % = 100 1 2   x i num ¯ + x i obs ¯ · 1 N i = 1 N x i num x i obs 2 ,
where N is the total number of elements in both the data series, x i num refers to numerical values from the SWAN model, and x i obs denotes the observed data series retrieved from the buoy. Barred variables x i num ¯ and x i obs ¯ correspond to mean values.
The normalized bias error (in percentage) [41] was calculated as
NBias   % = 100 1 2 x i num ¯ + x i obs ¯ · 1 N i = 1 N x i num x i obs .
The Spearman’s correlation coefficient was computed as
ρ S = cov ( R ( x i num ) ,   R ( x i obs ) ) σ ( R ( x i num ) ) · σ ( R ( x i obs ) ) ,
where R x i is the rank of the data series x i , σ ( R ( x i ) ) is its standard deviation, and cov ( R ( x i num ) ,   R ( x i obs ) ) is the covariance between the rank variables [43].
The overlapping percentage was calculated as
OP   % = 100 · i = 1 n min ( f i ( x num ) ,   f i ( x obs ) ) ,
where n is the number of bins in which series are classified, and f i x is the relative frequency of values in a given bin i . A number of 20 bins was used for H s and 10 bins for   T p . An OP of 100% means that the model perfectly represents the observed data. The overlap test consists of calculating the OP between both series, and it has the advantage that the entire data distribution is considered. This method is based on the study of Perkins et al. [44] and has been used in previous studies [45].

2.2.2. Wave Power Resource

The WP resource is the wave power resource available in the natural environment. It is defined as the amount of wave energy flux per unit length of the wave front (expressed in kWm−1) transmitted in the direction of wave propagation [12] and is represented by Equation (5):
WP = ρ g 2 64 π   H S 2   T e ,
where ρ is the density of seawater (considered here as 1025 kgm−3), g   is the gravitational acceleration, H s is the significant wave height, and T e is the energy period. The latter can be expressed in terms of wave peak period, T p , as follows:
T e = α T p .
Factor α varies with the shape of the wave spectrum. A value of α = 0.9 was assumed in the present study. This supposition is equivalent to assuming a standard JONSWAP spectrum with a peak enhancement factor of γ = 3.3 [7].

2.2.3. Parameters to Analyze WEC Performance

Total electric power depends on both the natural WP resource available and the performance of the WEC in extracting it. Every device operates in a different range of depth, H s and T p . This means that if a sea state ( H s   ,   T p ) does not belong to the WEC’s operation range, no electric output will be generated. Operating intervals for H s and T p are included on the named “power matrix”, which contains the electric power produced by the devices according to the sea state. In other words, each WEC obtains more energy with some sea states than with others so that each device is designed for certain wave conditions. The performance depends on this power matrix, which is provided by the manufacturer. Features such as WECs’ geometric shape, size, and power take-off (PTO) parameters significantly influence the power matrix and thus the electric power output.
The expected average electric power ( P E , in kW) that can be extracted with a particular WEC is expressed by the Equation (7):
P E = 1 100 i = 1 n T j = 1 n H p ij P ij ,
where P ij is the electric power obtained from an element ij of the power matrix of a particular WEC, p ij is the probability of occurrence of a given sea state for this element of the power matrix (expressed in percentage), and n T and n H are the number of peak period and significant height bins considered, respectively. The methodology of [7,10,23,33,46] has been followed to compute P E . Note that the power matrix is a matrix defined for a particular WEC, with specific geometric characteristics and a specific PTO principle. The same type of device with a different size, shape, or different PTO parameters would modify the power matrix and cause a change in the expected electrical power output. Additionally, if a sea state H s ,   T p   is unlikely (small p ij ), the electrical power that can be extracted with that WEC will be smaller than if there is a more likely sea state.
Two parameters have been used to evaluate the performance of different devices to extract energy from waves: the power load factor ( ε ) and the efficiency. ε is defined as the relation between P E and the maximum electric power that can produce a particular WEC (Pmax), computed as the power matrix maximum value:
ε   % = 100 · P E P max .
This dimensionless parameter reflects how far   P E   is , which depends on the sea states at a particular location and the properties of the device, from the maximum power extractable from that device. Thus, a device well-fitted to the wave climate in the area would provide ε values close to 100%. Both P E and P max depend on the WEC size. Nevertheless, due to the fact that ε is defined as the ratio between the actual extracted power and the maximum extractable power, it can be used to compare devices with different geometries and sizes.
An additional parameter named efficiency was used to estimate the performance of the WECs in converting the wave energy into electricity. It is defined as the normalized capture width (Cw, in meters) with respect to the WEC’s size [7,47]. In the literature, Cw is the width of the wave front that comprises the same amount of power as that absorbed by the WEC [47], and it is defined by Equation (9):
C w = P E WP .
Cw is, like ε, one of the most common parameters to estimate WECs performances. However, as not all WECs have the same size, the new parameter efficiency has been introduced for this study. It is defined in the Equation (10):
efficiency   % = 100 · P E WP · L
where and L is the WEC’s length of the dimension by which the WEC captures the wave energy. The use of this parameter results in a dimensionless efficiency that allows the comparison among devices with different geometries and sizes.
Four different WECs have been considered: two point absorbers (Oyster and Aqua Buoy), an attenuator (Pelamis), and a terminator device (Atargis). Despite Oyster being classified on some occasions as an onshore terminator device [18,48], here, it is categorized as a point absorber due to its small size in comparison to the predominant wavelength. Although the development of the Oyster device was stopped a time ago [49], this device has been chosen as an example of a converter that operates at shallow depths since similar devices may be developed in the coming decades.
The technical properties of these devices can be found in [10,24,33,46,50,51,52,53,54] and summarized in Table 2. The different power matrices were obtained from [33,53].

3. Results

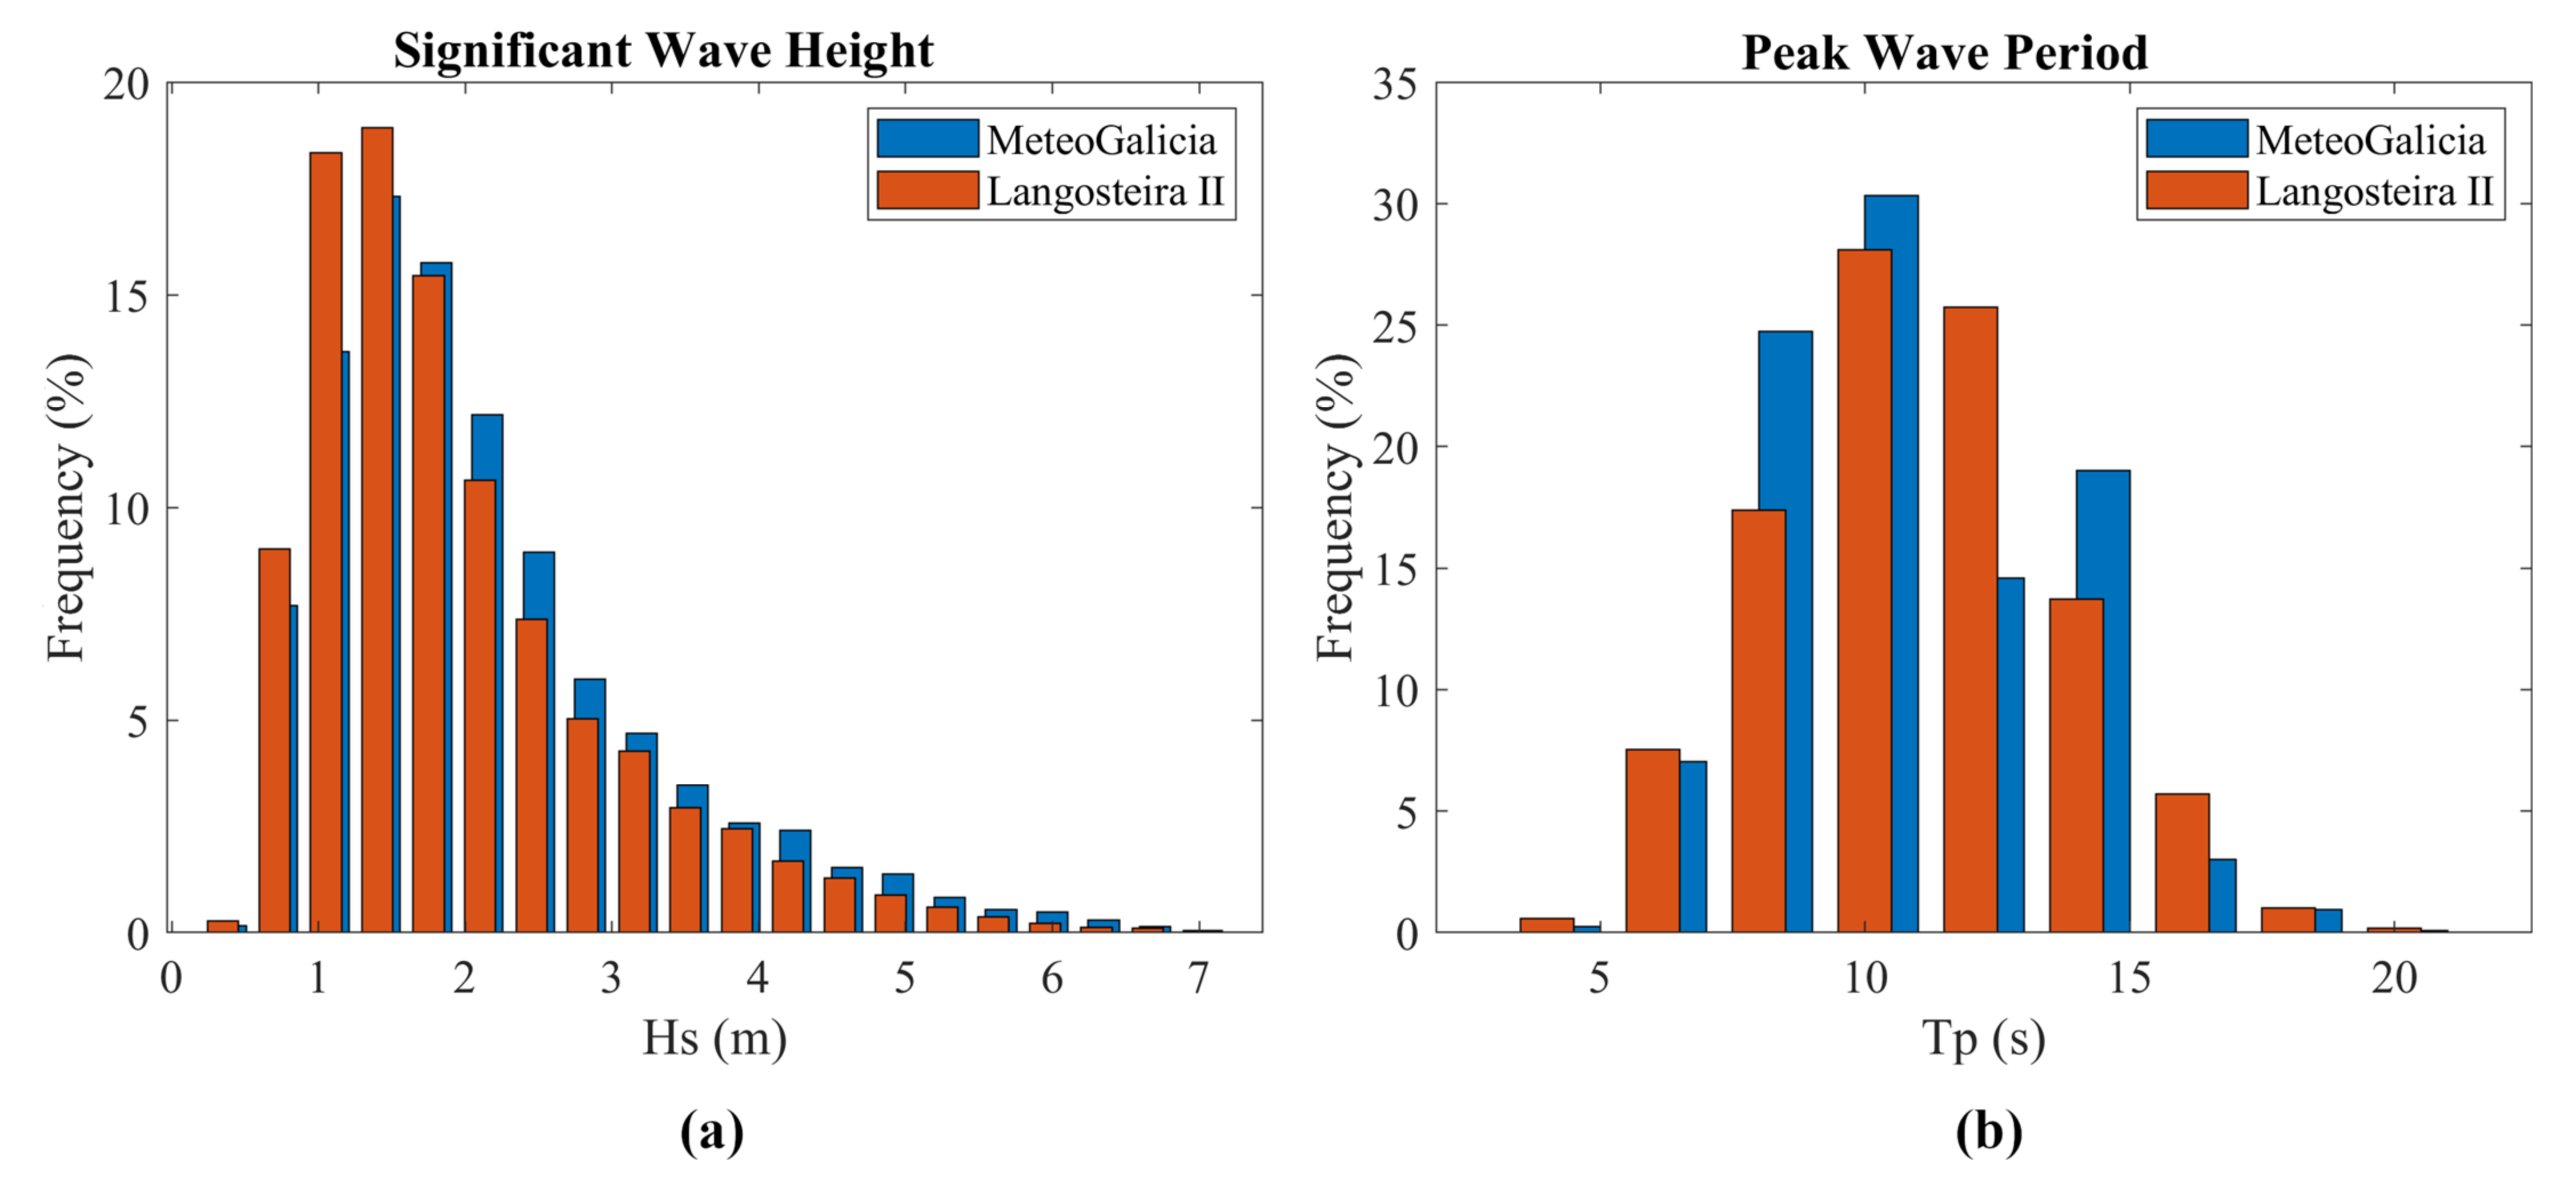
3.1. Numerical Model Validation

The accuracy of the SWAN model to reproduce observed H s and T p measured by the Langosteira II buoy is shown in both Figure 2 and Table 3. Figure 2 represents the relative frequency of occurrence of a certain value of H s (or T p ) contained in each bin. The red (blue) bars represent the relative frequency for the observed (numerical) data. The bars are plotted separately so that they can be properly differentiated. Blanks should not be interpreted as an absence of values, but rather the entire range of values on the x-axis is covered. Despite both data series being distributed over the same intervals, blue bars are drawn displaced with respect to the red ones for visualization purposes. Figure 2a shows that H s data from MeteoGalicia are slightly underestimated for the smallest waves ( H s < 1.575 m) and overestimated for the largest ones. The comparison between the numerical and observed data is not clear for T p . The SWAN model tends to overestimate T p values in the intervals (7, 9), (9, 11), and (13, 15), and underestimates in the other bins (Figure 2b).
The NRMSE, the NBias error, the Spearman correlation coefficient ( ρ S ), and the overlapping percentage (OP) between both series are shown in Table 3. The NRMSE and the NBias error show smaller values for H s and similar values for T p   than those of Bento et al. in [32]. Values of ρ S close to unity and an OP around 90% were obtained for both variables, which allow considering that the numerical simulations adequately reproduce the reality [45].

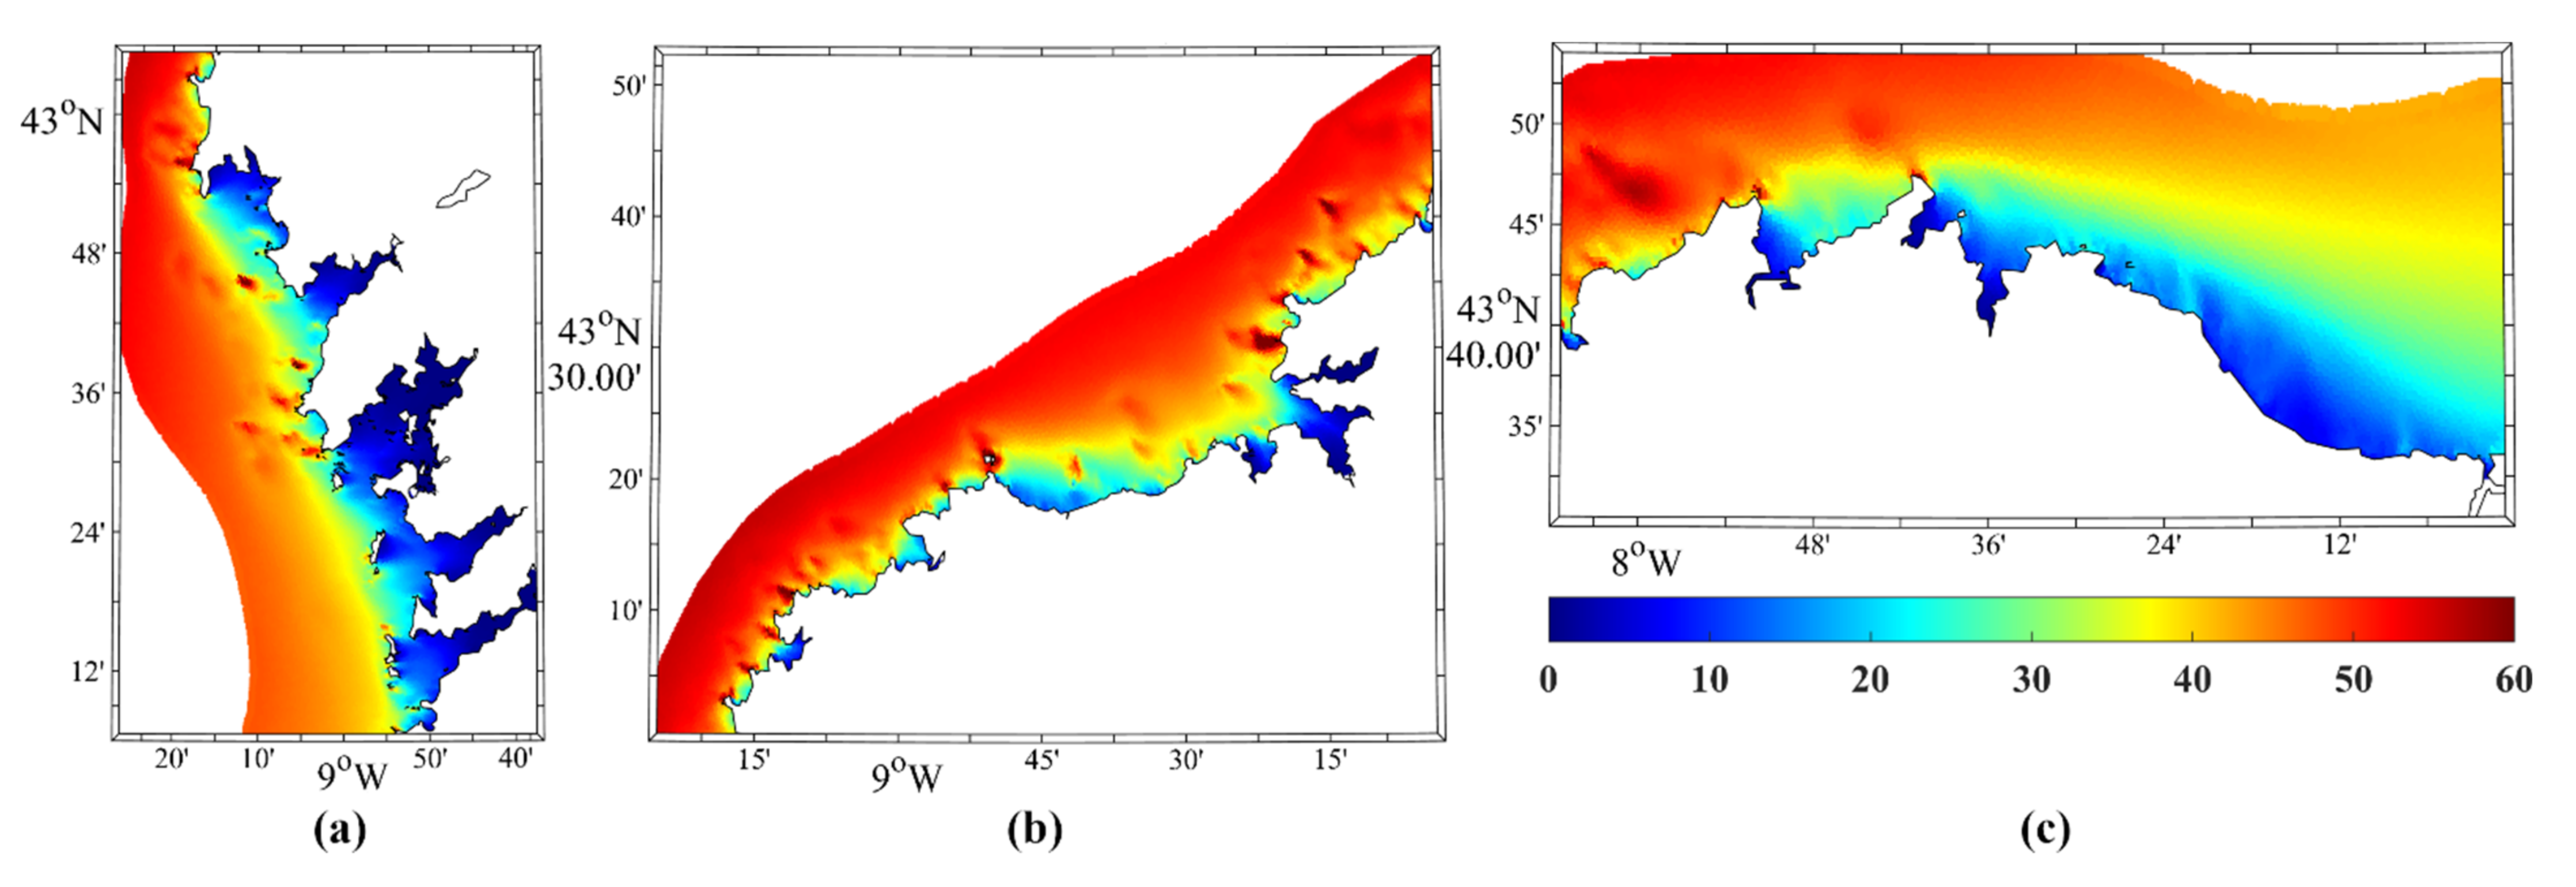
3.2. Wave Power Resource

First, the mean WP resource was calculated along the Galician coast from hourly data over the historical period (2014–2021). Figure 3 shows the WP resource for three regions: the West Coast (a), the Northwest Coast (b), and the North Coast (c). Overall, the WP resource is lower nearshore than offshore. Along the West Coast, WP increases from less than 10 kWm−1 inside the estuaries to around 50 kWm−1 at offshore (Figure 3a). As expected, the WP resource is related to the bathymetry—the shallowest areas are associated with the lowest WP resource. Spots of maximum WP resource (~60 kWm−1) are found in submerged reef systems relatively far from the shore (Figure 3b,c). In the easternmost part of the North Coast, the resource is lower (around 20 kWm−1 at ~10 km from the coast, see Figure 3c) since waves usually come from NW, and that area is leeward.

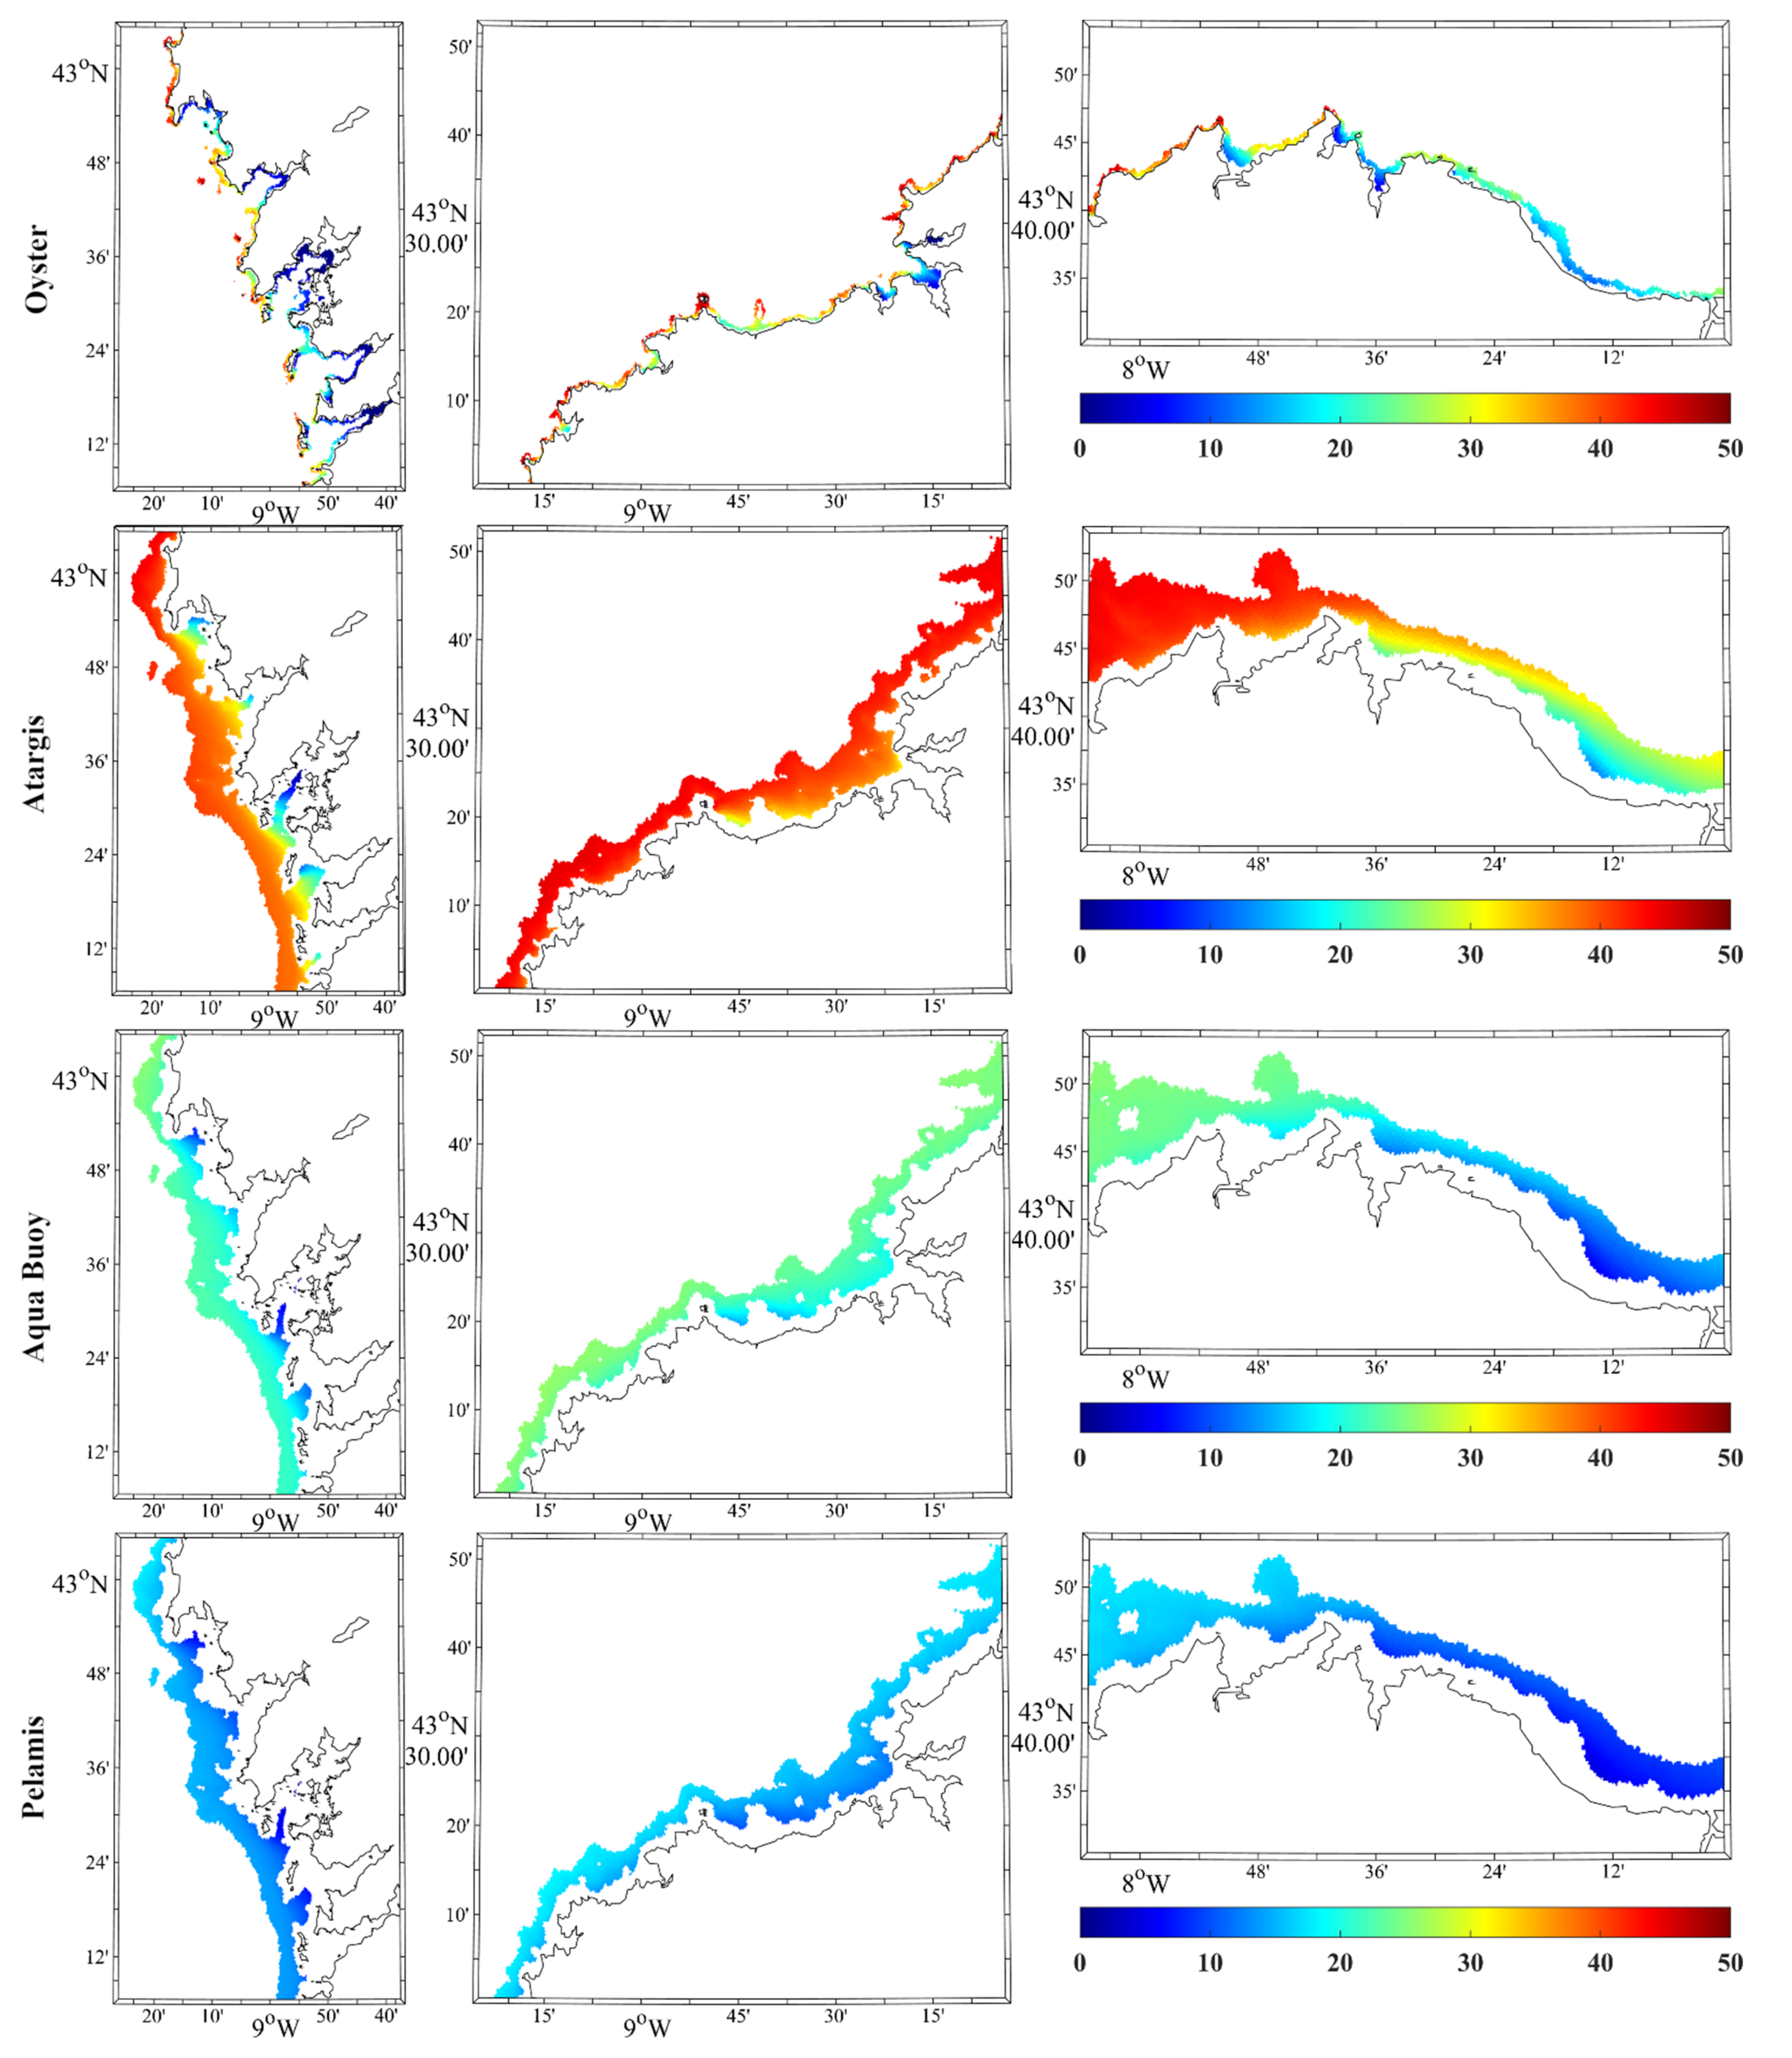
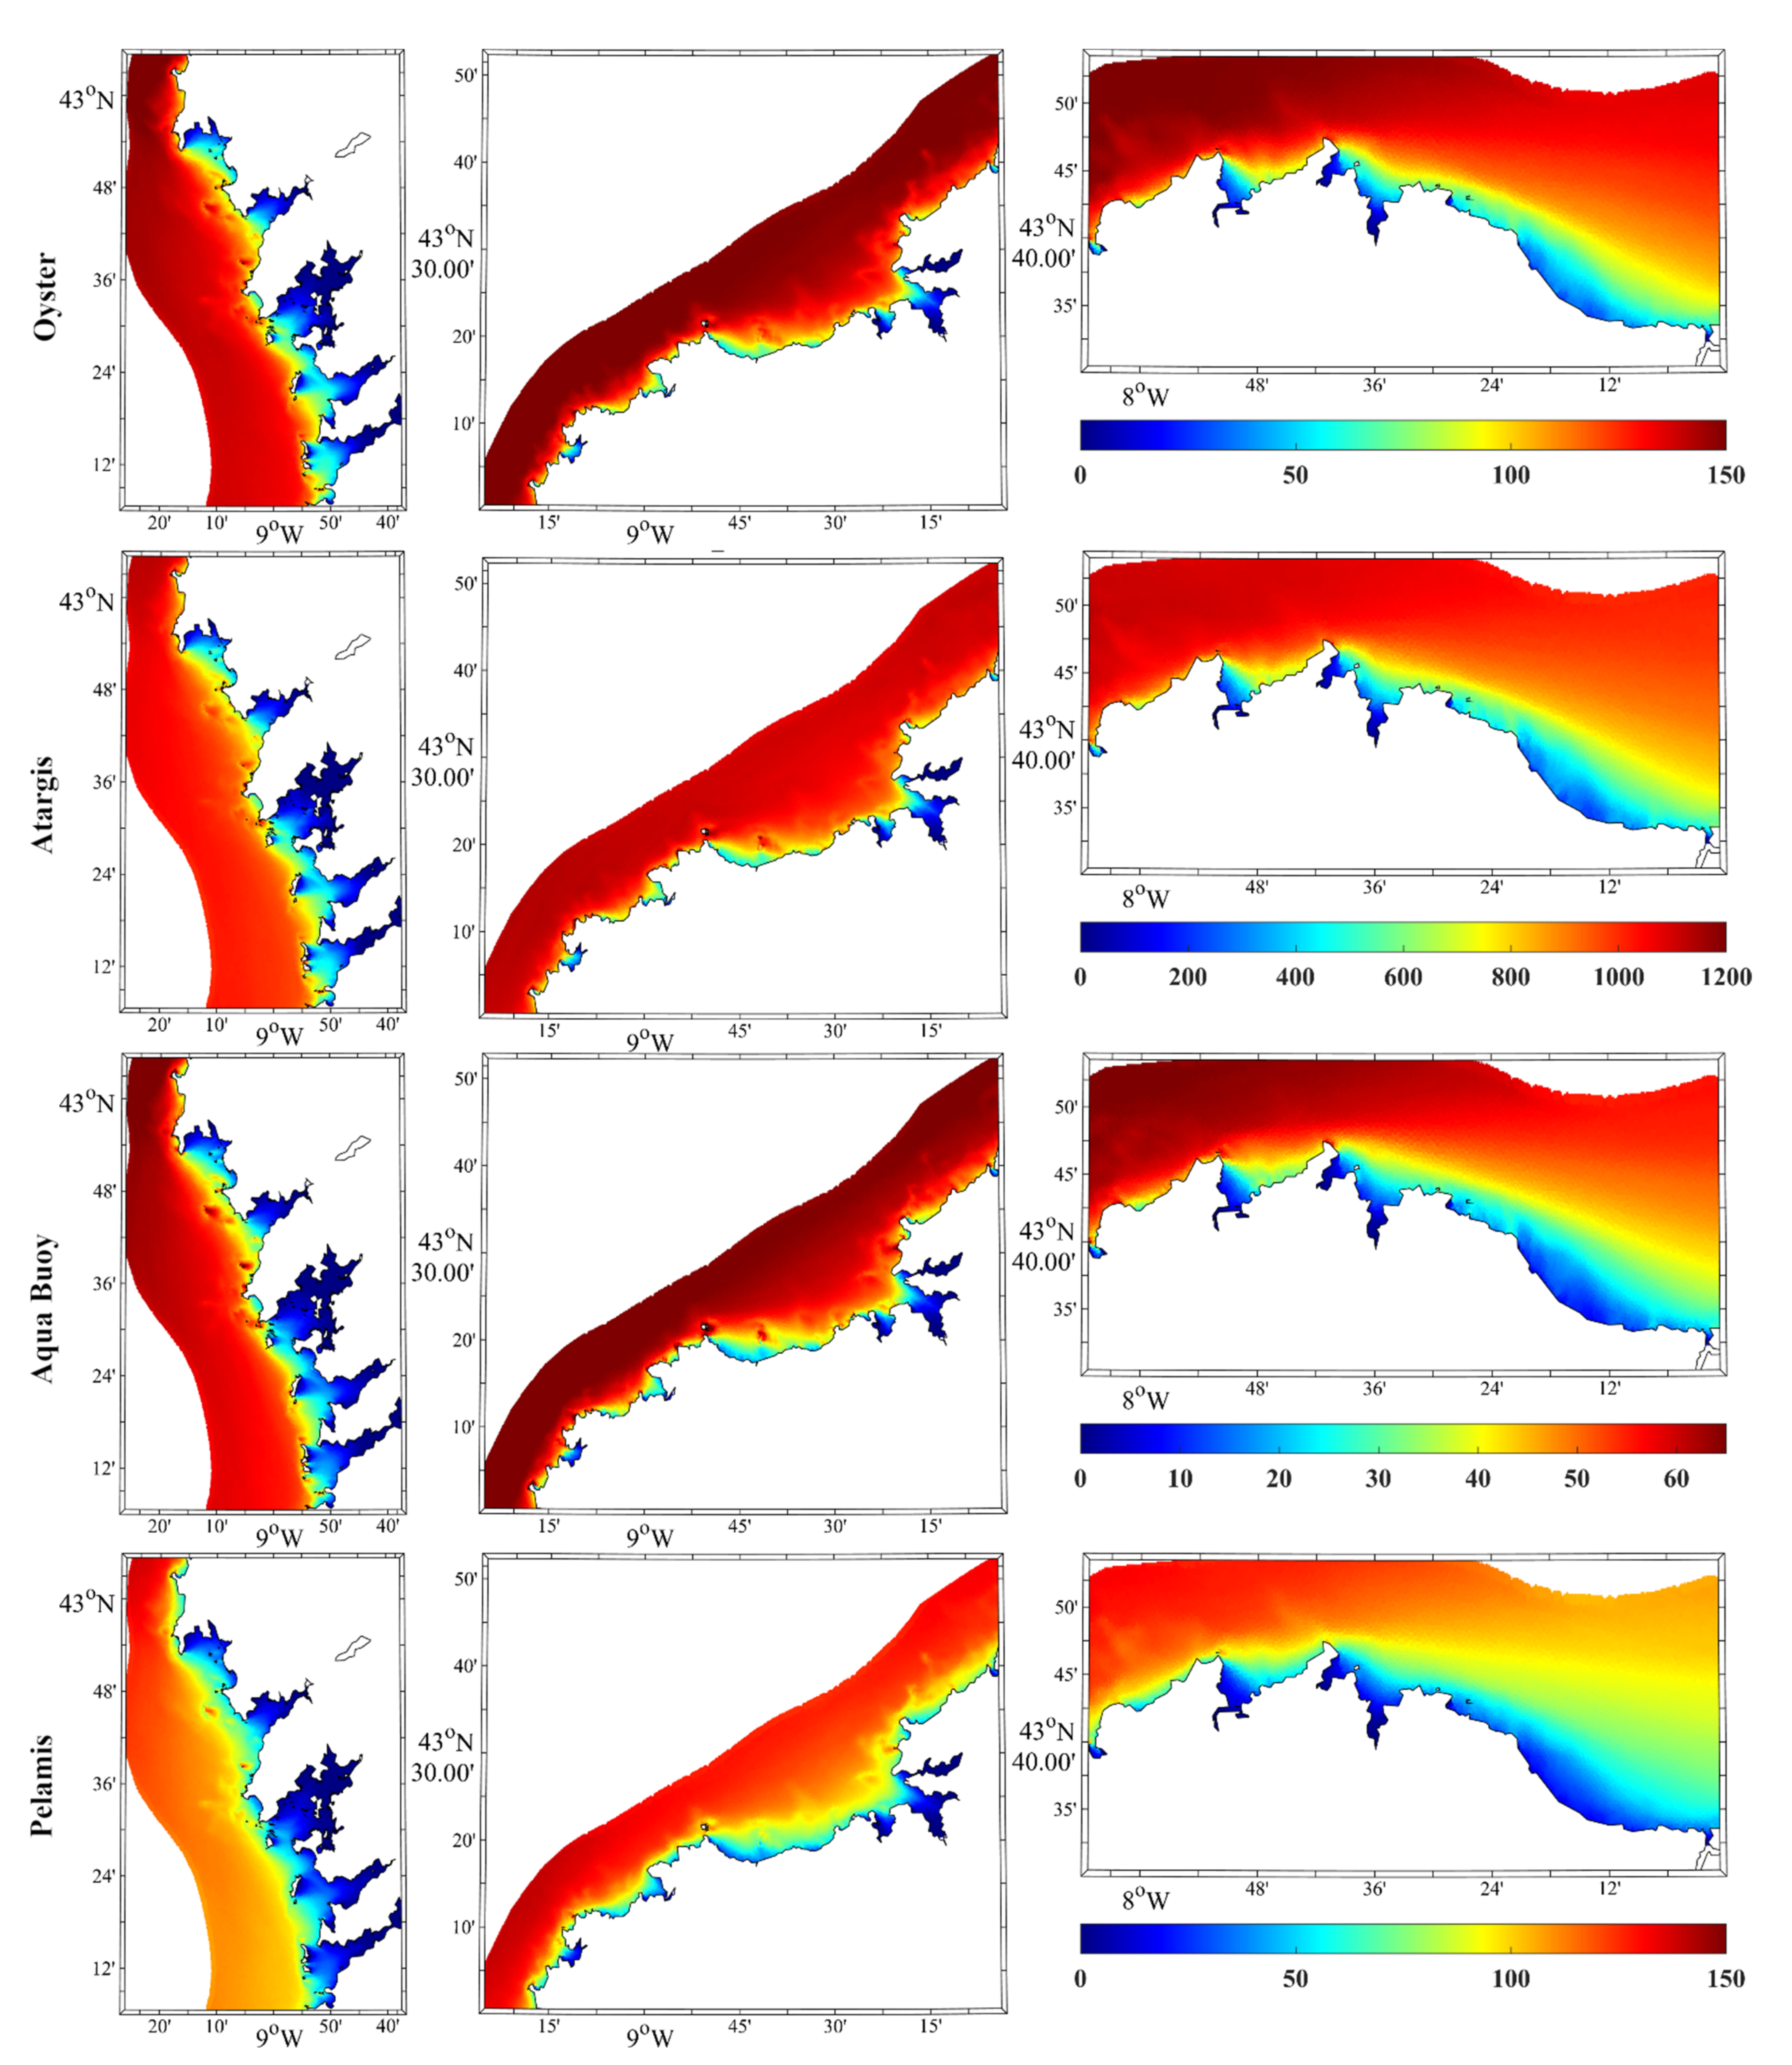
3.3. Performance of WECs

Macroscopically, P E   patterns (Figure 4) are very similar for the three areas, decreasing landward, as previously observed for WP. The electric power that can be extracted from the Atargis device is greater compared to the other converters—an order of magnitude greater than Oyster and Pelamis and two orders greater than Aqua Buoy. These differences are justified by the disparities in the size of the devices, which result in the values of the WECs power matrices, and also by the fact that each device operates in a specific range of sea state ( H s , T p ). Similar values of P E and their spatial distribution were found in [7] for the Aqua Buoy and Pelamis devices.
Along the West and Northwest Coast (Figure 5), the Atargis converter shows the most significant power load factor (ε ~45%), followed by the Oyster converter (~40% in shallow offshore areas) and Aqua Buoy with ε   around 22%. Pelamis shows the most minor power load factor (~15%) in those regions. Note that the plotted area is different for each WEC, as each WEC works at different depth ranges. These results are consistent with those described in [7] for the Aqua Buoy and Pelamis devices, where P E and ε show similar patterns. For example, along the North Coast the WECs performance decreases eastwards (right column). In this region, the power load factor for Atargis ranges between ~30% east of 8 ° 36′ W and ~45% north of the Northwest Coast. It ranges between ~20% east of 8 ° 36′ W and ~40% north of the Northwest Coast.
The efficiency percentage of WECs, represented in Figure 6, has a different distribution than the WP resource, P E and ε , increasing landwards. Atargis shows the highest efficiency in the study area (more than 50% inside the estuaries and ~35% outside). For Oyster, efficiency around 35% is observed inside the estuaries (left column) and around 27% in the Artabro Gulf (middle column) and in the east part of the North Coast (right column). Aqua Buoy has a moderately homogeneous pattern of efficiency (~25%) in all regions. The Pelamis device shows a low efficiency (< 10%) to exploit the WP resource in all the regions. Taking into account that the capture width is the efficiency multiplied by the length of the WEC, the Aqua Buoy and Pelamis efficiencies are consistent with the capture width (Cw) of 1.5 m and 3 m obtained by [7] for Aqua Buoy and Pelamis, respectively, along the North Coast for the period (1979–2005).

4. Discussion

Although the implementation of renewable energies is a key factor in mitigating climate change, not all of them have reached the same level of maturity. Wave energy is an auspicious renewable energy due to its high stability, predictability, and power density. However, it has found many difficulties such as the lack of consensus between the best technology, the conflict with other socio-economic activities, and the high cost [11]. These uncertainties have delayed the development of this marine renewable energy. However, technological advances are expected to allow the installation of wave energy farms in the upcoming decades. As shown in this analysis, the use of high spatial resolution simulations containing wave data is crucial to discover the coastal areas with the best conditions for the future installation of wave energy farms. In addition, this approach is also helpful to know the WEC that best fits each area because it is possible to analyze its efficiency only in the depth range that can be installed. As a whole, this study highlights the great potential that Galicia has to become a wave energy-generating region.
Overall, the results have shown that the highest wave resource is found in the northernmost part of the West Coast, the Northwest Coast, and the westernmost part of the North Coast. This is mainly due to the fact that the swell has a north-western direction [34], and these areas are more exposed to waves, as previously pointed out in [30]. In the same way, the least WP resource is found in the easternmost part of the North Coast. This difference in values is possible because the swell is shielded by the northernmost part of Galicia. The spatial distribution of the WP resource and its values are very similar to those shown in [7,30,34] for other different periods.
The WECs use only part of the WP resource available to produce electricity. The electrical energy capable of producing the WEC depends on the power matrix and the probability of occurrence of the sea states. Looking at the power matrix for the four converters in [33], it is to be expected that the device capable of producing the highest electrical energy is Atargis since the elements in the power matrix are the highest. Pelamis has a high power output, especially for high waves (>6 m), while Aqua Buoy and Oyster have the smallest power elements. However, the probability of occurrence of a sea state (Hs, Tp) has to be also taken into account to estimate the PE. Results have shown that the device capable of producing the most electricity in the three studied regions is undoubtedly Atargis. Oyster also gives high PE values, especially along the Northwest Coast region (Figure 4). Installing Aqua Buoy seems not to be a good idea in terms of energy production because the lowest PE has been obtained for that converter. The Pelamis device has not provided as much electrical power as expected when looking at the power matrix. This is because not as many optimal sea states have occurred for this converter. The PE pattern observed in all WECs is very similar to the wave resource. As the PE decreases towards the coast, it is possible to think that it is better to install wave energy farms away from the coast. However, installing offshore farms entails an increase in installation and maintenance costs, so a balance must be found between high energy production and proximity to the coast. The installation of a farm of Atargis devices seems to be the best option due to their PE and the recommended depth. The Northwest Coast is likely to be the most suitable region for that installation.
The power load factor (ε) provides an approximation of how much the device is being availed because it compares the electrical energy obtained with the maximum energy it can produce. Atargis is the converter that showed the highest ε values in the study regions, followed by Oyster. Although Oyster and Pelamis had similar PE, Pelamis shows the lowest ε due to the higher maximum electric power value (Pmax).
The other parameter to estimate the performance of a WEC is efficiency. The efficiency represents the performance in harvesting the WP resource taking into account the dimensions of the WEC. The results have shown that the efficiency increases towards the coast. One possible explanation is that the WP resource is much larger than the observed offshore PE because PE depends on the WEC limitations and does not consider the most energetic wave states, whereas WP resource does. The similarity between the PE and the WP resource is also observable onshore. Regarding efficiency, Atargis has shown the best results in the study regions although Oyster and Aqua Buoy are acceptable. Size is another aspect to consider, especially in areas with insufficient space available for a large device such as Atargis. The installation of several Aqua Buoys can be considered in this areas to increase energy production. Pelamis is the least efficient device in WP resource harvesting because of its dimensions, being much larger than Oyster (Table 2), although both show similar PE. The high efficiency of Atargis is explained due to its small dimensions and large PE.
Environmental and human factors must also be considered to choose the best device and installation area. Although the analysis of legal concerns is out of the scope of the present analysis, it is important to mention that Galicia has a large number of ports distributed throughout the coast [55] and places with environmental and fishing interest, such as the Atlantic Islands National Park of Galicia and the Os Miñarzos marine reserve in the Rías Baixas [56,57] or the Costa da Morte Bird Protection Zone (ZEPA in Spanish) in the Northwest Coast [56]. In fact, it can be observed that practically the entire Galician coast is bathed in Natural and National Parks, Sites of Community Importance (LIC, in Spanish), marine reserves of fishing interest, and ZEPAs and RAMSAR wetlands [56,58,59]. Fortunately, WECs are barely above the sea level [21], so they do not have to negatively influence the flight paths of birds.
Aqua Buoy and Pelamis have the advantage that they can be installed far from other important socio-economic activities and environmental places—usually located near the coast. However, the installation far from the coast can lead to inflate the installation and maintenance costs. Instead, its installation can be considered to attract offshore blue economy business. The installation of Oyster could be complicated because the most suited areas are coastal waters, where most of the environmental interest sites are located. Possible locations would be near artificial structures, e.g., ports where visual impact and conflict with other activities are less significant. A possible site could be near the Outer Port of A Coruña at Punta Langosteira. Installation near harbors can reduce maintenance costs [30]. Atargis has the advantage that it can be located somewhat further from the coast, avoiding conflict with protected areas. In addition, Atargis is installed under the surface, nullifying the visual impact. For this, Atargis seems to be the better option for implementing wave energy on the Galician coast. However, its size makes it difficult to install within the estuaries where the Aqua Buoy device appears to be one of the most efficient due to its small size. The Atargis impact on the seabed could also be studied in the future.

5. Conclusions

This study analyzed the wave energy resource in three regions of the Galician coast over the period 2014–2021 and the expected electrical energy output from four wave energy converters—Oyster, Atargis, Aqua Buoy, and Pelamis. Their performance was also investigated attending to their power load factor and efficiency. To fulfil this task, high-resolution significant wave height and peak period data were obtained from simulations of the third-generation SWAN model. These data were validated with the measurements of a buoy located on the Northwest Coast, obtaining a high overlapping percentage. The main findings of this study can be summarized as follows:
The wave power resource, the expected electrical energy output, and the power load factor decrease landward, while the efficiency increases landward.
The highest wave power resource is found in the northernmost part of the West Coast, the Northwest Coast, and the westernmost part of the North Coast.
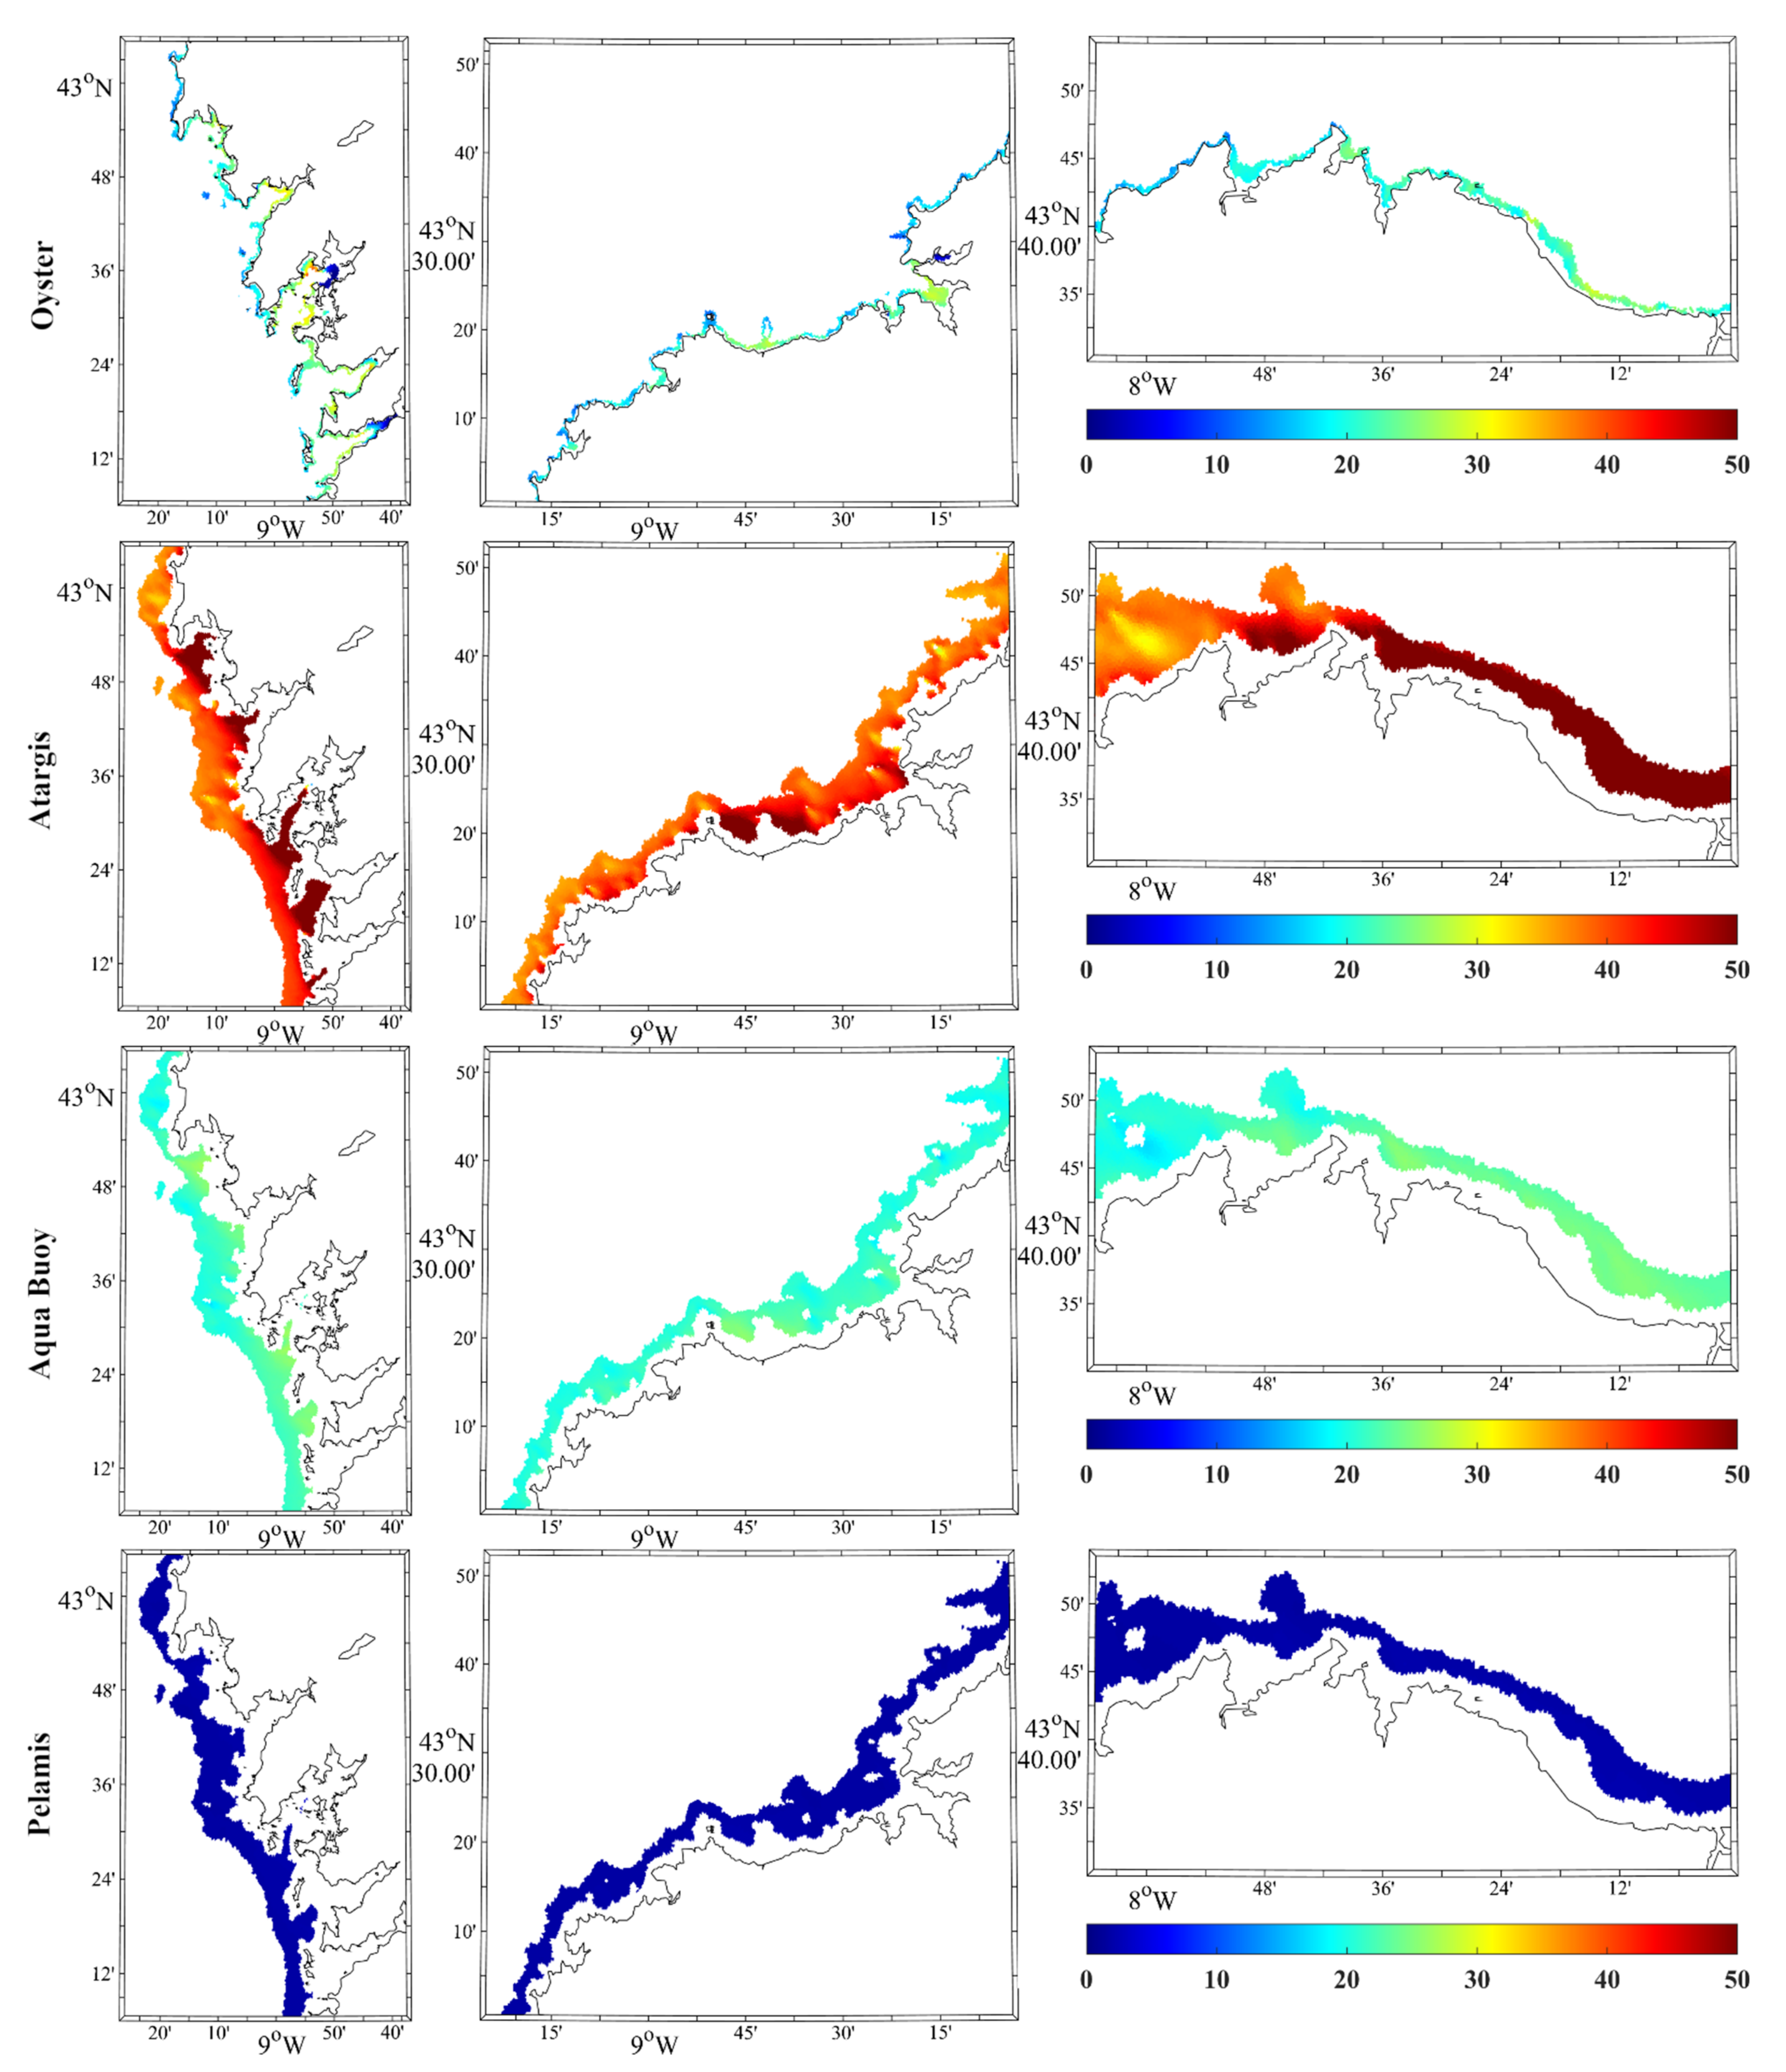
Atargis is the device that shows the highest expected electrical energy output, followed by Oyster. Aqua Buoy is the device with the lowest electrical energy output.
Attending to the power load factor, Atargis is the best-availed device, followed by Oyster. Pelamis has obtained the lowest performance in the three regions.
The parameter efficiency could substitute capture width in future studies in order to estimate the WEC performance because it allows making comparisons between different WECs regarding their dimensions.
Looking at the efficiency, Atargis is definitely the most efficient device, while Oyster and Aqua Buoy are quite efficient in harvesting the wave power resource in the three regions. Pelamis has shown a low efficiency in the whole area.
Atargis seems to be the best device to be installed in the Galician coast—especially in the Northwest Coast region—due to its expected electrical output, performance, its location under the surface, and optimum depth, avoiding areas of environmental interest.
The present study showed the Galicia’s great potential to become a wave energy-generating region. Regarding the parameters considered to determine the performance of the different types of WECs, and taking into account the size and location of WECs, Atargis is the most suitable to be installed in the Artabro Gulf, where it shows high values of PE, load capacity factor, and efficiency. In addition, it can be located somewhat further from the coast than the others, avoiding conflicts with protected areas. The Aqua Buoy is shown to be the most suitable to be installed within estuaries, where the available space is limited and must coexist with other economic activities, such as raft aquaculture, restricting the installation of large devices such as Atargis or Oyster. The Aqua Buoy has high efficiency due to its small size, and the power output can be increased by considering various devices. The installation of these devices in the vicinity of shellfishing areas could also protect them from waves by dissipating part of their energy. The appropriate locations for the Oyster device, which shows high efficiency and capacity factor for the entire area, are in the vicinity of harbors such as the Outer Port of A Coruña to reduce costs and avoid conflicts with protected and shellfishing areas. Finally, it should be mentioned that future studies should estimate the economic profitability of the devices to fulfil a more comprehensive assessment of their economic viability of the wave power in the study areas.

Author Contributions

Conceptualization, B.A.-P., X.C., M.d., and M.G.-G.; methodology, B.A.-P., X.C., M.d., A.S.R., J.M.D., P.C., L.R., and M.G.-G.; software, B.A.-P., X.C., and M.G.-G.; validation, B.A.-P.; formal analysis, B.A.-P. and L.R.; investigation, P.C. and M.G.-G.; resources, M.d., P.C., and M.G.-G.; data curation, B.A.-P. and P.C.; writing—original draft preparation, B.A.-P.; writing—review and editing, M.d., X.C., A.S.R., J.M.D., P.C., L.R., and M.G.-G.; visualization, B.A.-P., X.C., M.d., A.S.R., J.M.D., L.R., and M.G.-G.; supervision, M.G.-G.; project administration, M.d.; funding acquisition, M.d. All authors have read and agreed to the published version of the manuscript.

Funding

This research was funded by the Spanish Government through a Juan de la Cierva Postdoctoral Fellowship (IJC2020-043745-I). This work was partially supported by Xunta de Galicia under project ED431C 2021/44 (Grupos de Referencia Competitiva) and Ministry of Science and Innovation of the Government of Spain under the project SURVIWEC PID2020-113245RB-I00. We acknowledge financial support to CESAM by FCT/MCTES (UIDP/50017/2020+UIDB/50017/2020+LA/P/0094/2020), through national funds.

Institutional Review Board Statement

Not applicable.

Informed Consent Statement

Not applicable.

Data Availability Statement

Publicly available datasets were analyzed in this study. This data can be found here: http://mandeo.meteogalicia.gal/thredds/catalog/modelos/SWAN_HIST/galicia/catalog.html and https://www.puertos.es/es-es/oceanografia/Paginas/portus.aspx (accesed on 22 January 2022).

Acknowledgments

The authors thank the MeteoGalicia and Puertos del Estado organizations for the free distribution of wave data.

Conflicts of Interest

The authors declare no conflict of interest. The funders had no role in the design of the study; in the collection, analyses, or interpretation of data; in the writing of the manuscript, or in the decision to publish the results.

References

  1. IEA. World Energy Balances: Overview. Available online: https://www.iea.org/reports/world-energy-balances-overview (accessed on 22 January 2022).
  2. Masson-Delmotte, V.; Zhai, P.; Pirani, A.; Connors, S.L.; Péan, C.; Berger, S.; Caud, N.; Chen, Y.; Goldfarb, L.; Gomis, M.I.; et al. Climate Change 2021: The Physical Science Basis. Contribution of Working Group I to the Sixth Assessment Report of the Intergovernmental Panel on Climate Change; Cambridge University Press: Cambridge, UK; IPCC: New York, NY, USA, 2021. [Google Scholar] [CrossRef]
  3. Oliveira-Pinto, S.; Stokkermans, J. Assessment of the Potential of Different Floating Solar Technologies—Overview and Analysis of Different Case Studies. Energy Convers. Manag. 2020, 211, 112747. [Google Scholar] [CrossRef]
  4. Ritchie, H.; Roser, M. Fossil Fuels. Available online: https://ourworldindata.org/fossil-fuels?country= (accessed on 22 January 2022).
  5. Iberdrola. COP26: Iberdrola En La Cumbre Del Clima 2021. Available online: https://www.iberdrola.com/sostenibilidad/contra-cambio-climatico/cop26 (accessed on 22 January 2022).
  6. General Assembly. Resolution Adopted by the General Assembly on 6 July 2017; United Nations, A/RES/71/313. 2017. Available online: https://ggim.un.org/documents/a_res_71_313.pdf (accessed on 22 January 2022).
  7. Ribeiro, A.S.; deCastro, M.; Rusu, L.; Bernardino, M.; Dias, J.M.; Gomez-Gesteira, M. Evaluating the Future Efficiency of Wave Energy Converters along the NW Coast of the Iberian Peninsula. Energies 2020, 13, 3563. [Google Scholar] [CrossRef]
  8. Lavidas, G.; Blok, K. Shifting Wave Energy Perceptions: The Case for Wave Energy Converter (WEC) Feasibility at Milder Resources. Renew. Energy 2021, 170, 1143–1155. [Google Scholar] [CrossRef]
  9. IRENA. Offshore Renewables: An Action Agenda for Deployment; International Renewable Energy Agency: Abu Dhabi, United Arab Emirates, 2021; ISBN 978-92-9260-349-6. Available online: https://www.irena.org/-/media/Files/IRENA/Agency/Publication/2021/Jul/IRENA_G20_Offshore_renewables_2021.pdf (accessed on 22 January 2022).
  10. Rusu, E. Evaluation of the Wave Energy Conversion Efficiency in Various Coastal Environments. Energies 2014, 7, 4002–4018. [Google Scholar] [CrossRef] [Green Version]
  11. Aderinto, T.; Li, H. Review on Power Performance and Efficiency of Wave Energy Converters. Energies 2019, 12, 4329. [Google Scholar] [CrossRef] [Green Version]
  12. Mota, P.; Pinto, J. Wave Energy Potential along the Western Portuguese Coast. Renew. Energy 2014, 71, 8–17. [Google Scholar] [CrossRef]
  13. Kim, S.-J.; Koo, W.; Kim, M.-H. The Effects of Geometrical Buoy Shape with Nonlinear Froude-Krylov Force on a Heaving Buoy Point Absorber. Int. J. Nav. Archit. Ocean Eng. 2021, 13, 86–101. [Google Scholar] [CrossRef]
  14. Wang, L.; Zhao, T.; Lin, M.; Li, H. Towards Realistic Power Performance and Techno-Economic Performance of Wave Power Farms: The Impact of Control Strategies and Wave Climates. Ocean Eng. 2022, 248, 110754. [Google Scholar] [CrossRef]
  15. Ciappi, L.; Cheli, L.; Simonetti, I.; Bianchini, A.; Talluri, L.; Cappietti, L.; Manfrida, G. Wave-to-Wire Models of Wells and Impulse Turbines for Oscillating Water Column Wave Energy Converters Operating in the Mediterranean Sea. Energy 2022, 238, 121585. [Google Scholar] [CrossRef]
  16. Wang, L.; Ringwood, J.V. Control-Informed Ballast and Geometric Optimisation of a Three-Body Hinge-Barge Wave Energy Converter Using Two-Layer Optimisation. Renew. Energy 2021, 171, 1159–1170. [Google Scholar] [CrossRef]
  17. Mohtat, A.; Yim, S.; Osborne, A. Energy Content Characterization of Water Waves Using Linear and Nonlinear Spectral Analysis. J. Offshore Mech. Arct. Eng. 2022, 144, 011203. [Google Scholar] [CrossRef]
  18. Zhang, Y.; Zhao, Y.; Sun, W.; Li, J. Ocean Wave Energy Converters: Technical Principle, Device Realization, and Performance Evaluation. Renew. Sustain. Energy Rev. 2021, 141, 110764. [Google Scholar] [CrossRef]
  19. Lehmann, M.; Karimpour, F.; Goudey, C.A.; Jacobson, P.T.; Alam, M.-R. Ocean Wave Energy in the United States: Current Status and Future Perspectives. Renew. Sustain. Energy Rev. 2017, 74, 1300–1313. [Google Scholar] [CrossRef]
  20. Mofor, L.; Goldsmith, J.; Jones, F. Ocean Energy: Technology Readiness, Patents, Deployment Status and Outlook. Abu Dhabi 2014, 27. Available online: https://www.irena.org/publications/2014/Aug/Ocean-Energy-Technologies-Patents-Deployment-Status-and-Outlook (accessed on 22 January 2022).
  21. Pecher, A.; Kofoed, J.P. Handbook of Ocean Wave Energy; Springer Nature: Berlin, Germany, 2017. [Google Scholar]
  22. Olmo, B. Explotación Del Potencial de Energía Del Oleaje En Función Del Rango de Trabajo de Prototipos Captadores; Universitat Politècnica de Catalunya: Barcelona, Spain, 2009; Available online: https://upcommons.upc.edu/handle/2099.1/8720 (accessed on 22 January 2022).
  23. Rusu, L.; Onea, F. The Performance of Some State-of-the-Art Wave Energy Converters in Locations with the Worldwide Highest Wave Power. Renew. Sustain. Energy Rev. 2017, 75, 1348–1362. [Google Scholar] [CrossRef]
  24. Bozzi, S.; Archetti, R.; Passoni, G. Wave Electricity Production in Italian Offshore: A Preliminary Investigation. Renew. Energy 2014, 62, 407–416. [Google Scholar] [CrossRef]
  25. La Camera, F. IRENA Chief: Europe Is ‘the Frontrunner’ on Tidal and Wave Energy. 2020. Available online: https://www.euractiv.com/section/energy/interview/irena-chief-europe-is-the-frontrunner-on-tidal-and-wave-energy/ (accessed on 22 January 2022).
  26. IDAE. Eólica Marina y Energías Del Mar En España. Available online: https://www.idae.es/tecnologias/energias-renovables/uso-electrico/eolica/eolica-marina/eolica-marina-y-energias-del-mar (accessed on 22 January 2022).
  27. MITECO. Hoja de Ruta Para El Desarrollo de La Eólica Marina y de Las Energías del Mar en España; MITECO: Madrid, Spain, 2021; Available online: https://www.miteco.gob.es/es/ministerio/planes-estrategias/desarrollo-eolica-marina-energias/eshreolicamarina-pdfaccesiblev5_tcm30-534163.pdf (accessed on 22 January 2022).
  28. Ferrari, F.; Besio, G.; Cassola, F.; Mazzino, A. Optimized Wind and Wave Energy Resource Assessment and Offshore Exploitability in the Mediterranean Sea. Energy 2020, 190, 116447. [Google Scholar] [CrossRef]
  29. Rusu, L. Evaluation of the near Future Wave Energy Resources in the Black Sea under Two Climate Scenarios. Renew. Energy 2019, 142, 137–146. [Google Scholar] [CrossRef]
  30. Iglesias, G.; López, M.; Carballo, R.; Castro, A.; Fraguela, J.A.; Frigaard, P. Wave Energy Potential in Galicia (NW Spain). Renew. Energy 2009, 34, 2323–2333. [Google Scholar] [CrossRef]
  31. Silva, D.; Bento, A.R.; Martinho, P.; Guedes Soares, C. High Resolution Local Wave Energy Modelling in the Iberian Peninsula. Energy 2015, 91, 1099–1112. [Google Scholar] [CrossRef]
  32. Bento, A.R.; Martinho, P.; Soares, C.G. Wave Energy Assessement for Northern Spain from a 33-Year Hindcast. Renew. Energy 2018, 127, 322–333. [Google Scholar] [CrossRef]
  33. Silva, D.; Rusu, E.; Soares, C.G. Evaluation of Various Technologies for Wave Energy Conversion in the Portuguese Nearshore. Energies 2013, 6, 1344–1364. [Google Scholar] [CrossRef]
  34. Carmeáns Rodríguez, M.; Suárez Rey, R.; Arean Varela, N.; Suárez Bilbao, M.; Carracedo García, P.; Gómez Hombre, B. Atlas de Oleaje de Galicia. Caracterización Del Oleaje Costero Con Alta Resolución; MeteoGalicia: Santiago de Compostela, Spain, 2014; Available online: https://www.meteogalicia.gal/datosred/infoweb/meteo/proxectos/energymare/Atlas_Ondas_Galicia.pdf (accessed on 22 January 2022).
  35. SWAN. Available online: https://www.tudelft.nl/en/ceg/about-faculty/departments/hydraulic-engineering/sections/environmental-fluid-mechanics/research/swan (accessed on 22 January 2022).
  36. Welcome to the SWAN Home Page. Available online: https://swanmodel.sourceforge.io/ (accessed on 22 January 2022).
  37. Features of SWAN. Available online: https://swanmodel.sourceforge.io/features/features.htm (accessed on 22 January 2022).
  38. Spectral Action Balance Equation. Available online: https://swanmodel.sourceforge.io/online_doc/swantech/node12.html (accessed on 22 January 2022).
  39. THREDDS Data Server. Available online: http://mandeo.meteogalicia.gal/thredds/catalog/modelos/SWAN_HIST/galicia/catalog.html (accessed on 22 January 2022).
  40. Puertos del Estado Prediccion de Oleaje, Nivel Del Mar; Boyas y Mareografos. Available online: https://www.puertos.es/es-es/oceanografia/Paginas/portus.aspx (accessed on 22 January 2022).
  41. Des, M.; Martínez, B.; deCastro, M.; Viejo, R.M.; Sousa, M.C.; Gómez-Gesteira, M. The Impact of Climate Change on the Geographical Distribution of Habitat-Forming Macroalgae in the Rías Baixas. Mar. Environ. Res. 2020, 161, 105074. [Google Scholar] [CrossRef]
  42. Costoya, X.; Rocha, A.; Carvalho, D. Using Bias-Correction to Improve Future Projections of Offshore Wind Energy Resource: A Case Study on the Iberian Peninsula. Appl. Energy 2020, 262, 114562. [Google Scholar] [CrossRef]
  43. Kumar, A.; Abirami, S. Aspect-Based Opinion Ranking Framework for Product Reviews Using a Spearman’s Rank Correlation Coefficient Method. Inf. Sci. 2018, 460–461, 23–41. [Google Scholar] [CrossRef]
  44. Perkins, S.E.; Pitman, A.J.; Holbrook, N.J.; McAneney, J. Evaluation of the AR4 Climate Models’ Simulated Daily Maximum Temperature, Minimum Temperature, and Precipitation over Australia Using Probability Density Functions. J. Clim. 2007, 20, 4356–4376. [Google Scholar] [CrossRef]
  45. Costoya, X.; Decastro, M.; Santos, F.; Sousa, M.; Gómez-Gesteira, M. Projections of Wind Energy Resources in the Caribbean for the 21st Century. Energy 2019, 178, 356–367. [Google Scholar] [CrossRef]
  46. Rusu, L.; Onea, F. Assessment of the Performances of Various Wave Energy Converters along the European Continental Coasts. Energy 2015, 82, 889–904. [Google Scholar] [CrossRef]
  47. Price, A.A.E.; Dent, C.J.; Wallace, A.R. On the Capture Width of Wave Energy Converters. Appl. Ocean Res. 2009, 31, 251–259. [Google Scholar] [CrossRef] [Green Version]
  48. Choupin, O.; Andutta, F.P.; Etemad-Shahidi, A.; Tomlinson, R. A Decision-Making Process for Wave Energy Converter and Location Pairing. Renew. Sustain. Energy Rev. 2021, 147, 111225. [Google Scholar] [CrossRef]
  49. Curto, D.; Franzitta, V.; Guercio, A. Sea Wave Energy. A Review of the Current Technologies and Perspectives. Energies 2021, 14, 6604. [Google Scholar] [CrossRef]
  50. Henry, A.; Doherty, K.; Cameron, L.; Whittaker, T.; Doherty, R. Advances in the Design of the Oyster Wave Energy Converter. In Proceedings of the Marine Renewable and Offshore Wind Energy Conference, Royal Institution of Naval Architects, London, UK, 21–23 July 2010. [Google Scholar]
  51. Farkas, A.; Degiuli, N.; Martić, I. Assessment of Offshore Wave Energy Potential in the Croatian Part of the Adriatic Sea and Comparison with Wind Energy Potential. Energies 2019, 12, 2357. [Google Scholar] [CrossRef] [Green Version]
  52. Frandsen, J.; Doblaré, M.; Rodriguez, P.; Reyes, M. Technical Assessment of the Pelamis Wave Energy Converter Concept. 2012. Available online: https://www.researchgate.net/publication/317014924_Technical_assessment_of_the_Pelamis_wave_energy_converter_concept (accessed on 22 January 2022).
  53. Ermakov, A.; Ringwood, J.V. Rotors for Wave Energy Conversion—Practice and Possibilities. IET Renew. Power Gener. 2021, 15, 3091–3108. [Google Scholar] [CrossRef]
  54. Siegel, S.G. Numerical Benchmarking Study of a Cycloidal Wave Energy Converter. Renew. Energy 2019, 134, 390–405. [Google Scholar] [CrossRef]
  55. Localizador de Portos EPPG. Available online: https://portosdegalicia.gal/es/web/portos-de-galicia/locportos (accessed on 23 January 2022).
  56. Intecmar. Available online: http://ww3.intecmar.gal/intecmar/ (accessed on 23 January 2022).
  57. Reserva Marina de Interés Pesquero. Available online: https://www.marsostenible.com/reserva-marina-de-interes-pesquero/ (accessed on 23 January 2022).
  58. Zona Especial Protección Para Las Aves—ZEPA. Available online: https://www.indemares.es/areas-marinas/zona-especial-proteccion-para-las-aves-zepa (accessed on 23 January 2022).
  59. Portos de Galicia. Delimitación de Los Espacios y Usos Portuarios del Puerto de BRENS-CEE; Portos de Galicia: Spain, 2012; Available online: https://portosdegalicia.gal/documents/10627/36363/DEUP+Brens+-+Cee_Memoria_1.0.pdf (accessed on 22 January 2022).
Figure 1. Study area. Colors represent the bathymetry (m).
Jmse 10 00719 g001
Figure 2. Histograms for (a) H s and (b) T p from the SWAN simulations (blue) and the Langosteira II buoy measures (red).
Jmse 10 00719 g002
Figure 3. WP resource for (a) West Coast, (b) Northwest Coast, and (c) North Coast from 2014 to 2021.
Jmse 10 00719 g003
Figure 4. Electric power capacity ( P E , in kW) of the Oyster, Atargis, Aqua Buoy, and Pelamis devices for the West Coast (left column), the Northwest Coast (middle column), and the North Coast (right column) for the period (2014–2021).
Jmse 10 00719 g004
Figure 5. Power load factor ( ε , in %) of the Oyster, Atargis, Aqua Buoy, and Pelamis devices for the West Coast (left column), the Northwest Coast (middle column), and the North Coast (right column) for the period (2014–2021).
Jmse 10 00719 g005
Figure 6. Efficiency (in %) of the Oyster, Atargis, Aqua Buoy, and Pelamis devices for the West Coast (left column), the Northwest (middle column), and the North Coast (right column) for the period (2014–2021).
Jmse 10 00719 g006
Table 1. Main characteristics of the SWAN model set up in the present study.
ParameterValue
Computational grid
Spatial gridUnstructured. Variable mesh step: 250 m−75 m
Frequency gridResolution: Δf/f = 0.1. Range: 0.0521 Hz–1 Hz
Directional gridResolution: 10°
Processes activated
Local wave generation by windYes (third-generation)
Limited depth processesYes (bottom friction, refraction, shoaling, depth-induced breaking)
Water level variationsYes
Wave–current interactionsNo
Forcing
Boundary conditionsWaveWatch III. Temporal/Spatial resolution: 1 h/2.5 arc minutes
WindMeteogalicia WRF. Temporal/Spatial resolution: 1 h/4 km
Water levelTime series synthesis using the tidal solution of the MeteoGalicia ROMS model. Temporal/Spatial resolution: 1 h/4 km
Table 2. Type, maximum electric power, length opposite to the wave, and possible interval of depth for the installation of every analyzed WEC.
WECType P m a x   ( kW ) L (m)Depth (m)
OysterPoint absorber2911810–20
AtargisTerminator25306040–100
Aqua BuoyPoint absorber250650–100
PelamisAttenuator75015050–100
Table 3. Normalized root mean square error (NRMSE), normalized bias error (NBias), Spearman correlation coefficient ( ρ S ), and overlapping percentage (OP) for significant wave height ( H s ) and peak period ( T p ).
VariableNRMSE (%)NBias (%) ρ S OP (%)
Hs20.108.720.9492.26
Tp14.82−1.15 0.8391.70
Publisher’s Note: MDPI stays neutral with regard to jurisdictional claims in published maps and institutional affiliations.

