Article

Impacts of Hurricanes on Nutrient Export and Ecosystem Metabolism in a Blackwater River Estuary Complex

1
Whitney Laboratory for Marine Biosciences, University of Florida, St. Augustine, FL 32080, USA
2
Wetland Biogeochemistry Laboratory, Soil and Water Sciences Department, University of Florida, Gainesville, FL 32611, USA
3
Guana Tolomato Matanzas National Estuarine Research Reserve, Ponte Vedra Beach, FL 32082, USA
*
Author to whom correspondence should be addressed.
J. Mar. Sci. Eng. 2022, 10(5), 661; https://doi.org/10.3390/jmse10050661
Submission received: 14 April 2022 / Revised: 29 April 2022 / Accepted: 10 May 2022 / Published: 13 May 2022
(This article belongs to the Section Chemical Oceanography)

Abstract

:
Hurricanes have the ability to export uncharacteristically large amounts of nutrients from terrestrial systems into riverine and estuarine networks, altering rates of ecosystem metabolism throughout the aquatic continuum. In order to explore these impacts and compare these values to common precipitation events, water quality and chemistry data from the National Estuarine Research Reserve’s System Wide Monitoring Program (NERR-SWMP) were combined with discharge data from the United States Geological Survey (USGS) to calculate biogeochemical export from a Florida coastal blackwater river. This analysis was focused on the years 2016–2020, when Hurricanes Matthew, Irma, and Dorian impacted the landscape of Florida’s Atlantic coast. Hurricane Irma, the only hurricane to occur after especially wet summer conditions, dwarfed the other two hurricanes in the export of dissolved organic carbon (DOC), with an increase from <5 kg DOC day−1 to approximately 250 kg DOC day−1. Soluble reactive phosphorus (SRP) and most nitrogen species export exhibited similar trends. Additionally, other spikes in export occurred during non-hurricane months, and no significant differences between monthly export values were found between hurricane and non-hurricane months. However, net ecosystem metabolism (NEM) was calculated at similar intervals and revealed significantly lower NEM during months of hurricane passage. On monthly timescales, this work suggests that lower-category hurricanes might not significantly impact organic matter export, but the shortened export interval associated with hurricane impacts produces significant implications for NEM.

1. Introduction

Storms are disturbances that affect human and natural systems and can disrupt or alter ecological and biogeochemical processes [1,2,3,4]. Tropical cyclones are acute and severe storms, believed to cause the largest disruptions to the environment in the areas where they occur, and their frequency and intensity are predicted to increase as the planet continues to warm in the future [5,6]. However, in subtropical systems prone to hurricanes, thunderstorms (and nor’easters in the Atlantic) are also common and can generate high levels of precipitation. Although thunderstorms and nor’easters occur more frequently than hurricanes and still impact waterway biogeochemistry, there are very few studies that have compared the impacts of hurricanes to other precipitation events [7,8]. Furthermore, this type of study has not been conducted in northeastern Florida’s unique climatic conditions.
Precipitation is a major driving factor in the transport of organic matter (OM), primarily through runoff, but also minimally from atmospheric deposition [8,9,10,11,12,13]. Therefore, storm events greatly aid in transporting organic matter from terrestrial environments into wetlands and waterways, where OM is processed and pushed further downstream through the river continuum. The river continuum concept states that terrestrial uplands are connected to waterways through the transport of organic matter, and within waterways, are a series of shredders, grazers, collectors, predators, and microbes that process organic matter as it is moved downstream [14]. The movement of OM from upstream to downstream can also be labeled export.
The export of organic matter is influenced by a variety of factors, including hydrology and storm events [15,16,17]. Even though storms are short-term disturbances, they can be responsible for the largest percentage of organic matter export. A study of dissolved organic carbon (DOC) export from forested watersheds determined that large hydrologic events (including both storms and snowmelt) transported 86% of all DOC, in thirty watersheds across eight U.S. states [15]. Furthermore, hurricanes generating high precipitation were predominantly responsible for moving allochthonous material from inland watersheds and waterways into the Neuse River Estuary and Pamlico Sound in North Carolina, over the past 20 years [18]. In addition, discharge driven by Hurricanes Harvey and Irma was responsible for mobilizing 98% of monthly carbon and nutrients, within only a 4–5-day period, in five southeastern states in the United States [16]. These massive exports of organic matter powered by short sporadic events can have wider reaching effects that go beyond chemical transport and affect ecosystem metabolic characteristics.
Ecosystem metabolism is an indicator of biological function, which is an assessment of energy processing by all organisms within that ecosystem. Net ecosystem metabolism (NEM) is a balance between community respiration and gross primary production [19]. In a stable ecosystem, NEM is approximately zero, but in a stressed or unbalanced ecosystem, either community respiration (Rt) or gross primary production (Pg) will be more influential and yield a positive or negative ecosystem metabolism [20]. Community respiration measures the release of CO2 from the breakdown of organic matter, whereas primary production measures the increase in biomass from photosynthesis. These processes are very closely tied to carbon cycling and are greatly affected by excess inputs and losses of organic matter [21,22]. As such, storm events with prolific rainfall transport copious quantities of carbon (and other nutrients) into waterways that stress ecosystems through eutrophication, increases in community respiration, and increases in biological oxygen demand [23,24].
Frequent storms and hurricanes in the Southeastern United States make it vital to determine the effects these events have on coastal riverine/estuarine biogeochemistry and ecosystem metabolism. Florida averages 1360 mm (53 in) of rainfall and 70–100 thunderstorms per year (depending on location within the state), the highest number in the United States (FSU climate center, NOAA, Tallahassee, FL). During the winter months, when thunderstorms are less common, Florida’s Atlantic coast commonly experiences the effects of nor’easters. In northeast Florida, nor’easters may produce storm surges up to 1.2–1.3 m in inland waterways, which is slightly less than hurricanes and tropical storms that create surges of 1.3–1.5 m in this region [25]. Wind and precipitation from nor’easters and thunderstorms mobilize pulses of organic matter that are transported into waterways through runoff and contribute to biogeochemical cycling [26]. Additionally, due to the location of the study site along the South Atlantic Bight, which has a concave shape that readily funnels seawater into estuaries, the pulses of water could add to the intensity of DOM flux [25].
In order to determine if nor’easters and other storms with high precipitation have as significant an impact as hurricanes on northern Florida chemical cycling, export was calculated for several analytes that have been measured monthly in Pellicer Creek over the past several years. In the past five years, Hurricanes Matthew, Irma, and Dorian affected regions on the Atlantic coast of north Florida, not impacted in the previous decade. These events were compared to a collection of other precipitation events in this study. Ecosystem metabolic characteristics were also calculated by using continuously monitored dissolved oxygen concentrations. The hypothesis of this study was that hurricanes would have a larger impact on DOM loading and export than other common storm events and cause significant changes in ecosystem metabolic characteristics, not seen during other storms. In order to examine this hypothesis, there were three main goals of this study. The first goal was to determine how hurricanes Matthew, Irma, and Dorian impacted St. Augustine, FL, over the past 5 years. The second goal was to examine if these hurricanes increased nutrient export more than nor’easters or other storms with high rainfall. The third was to observe how the export of nutrients associated with these storms affected local biological responses. By answering these questions, this study assesses the impact of hurricanes on waterways and the importance of examining multiple levels of storm impacts on biogeochemical and metabolic pathways.

2. Materials and Methods
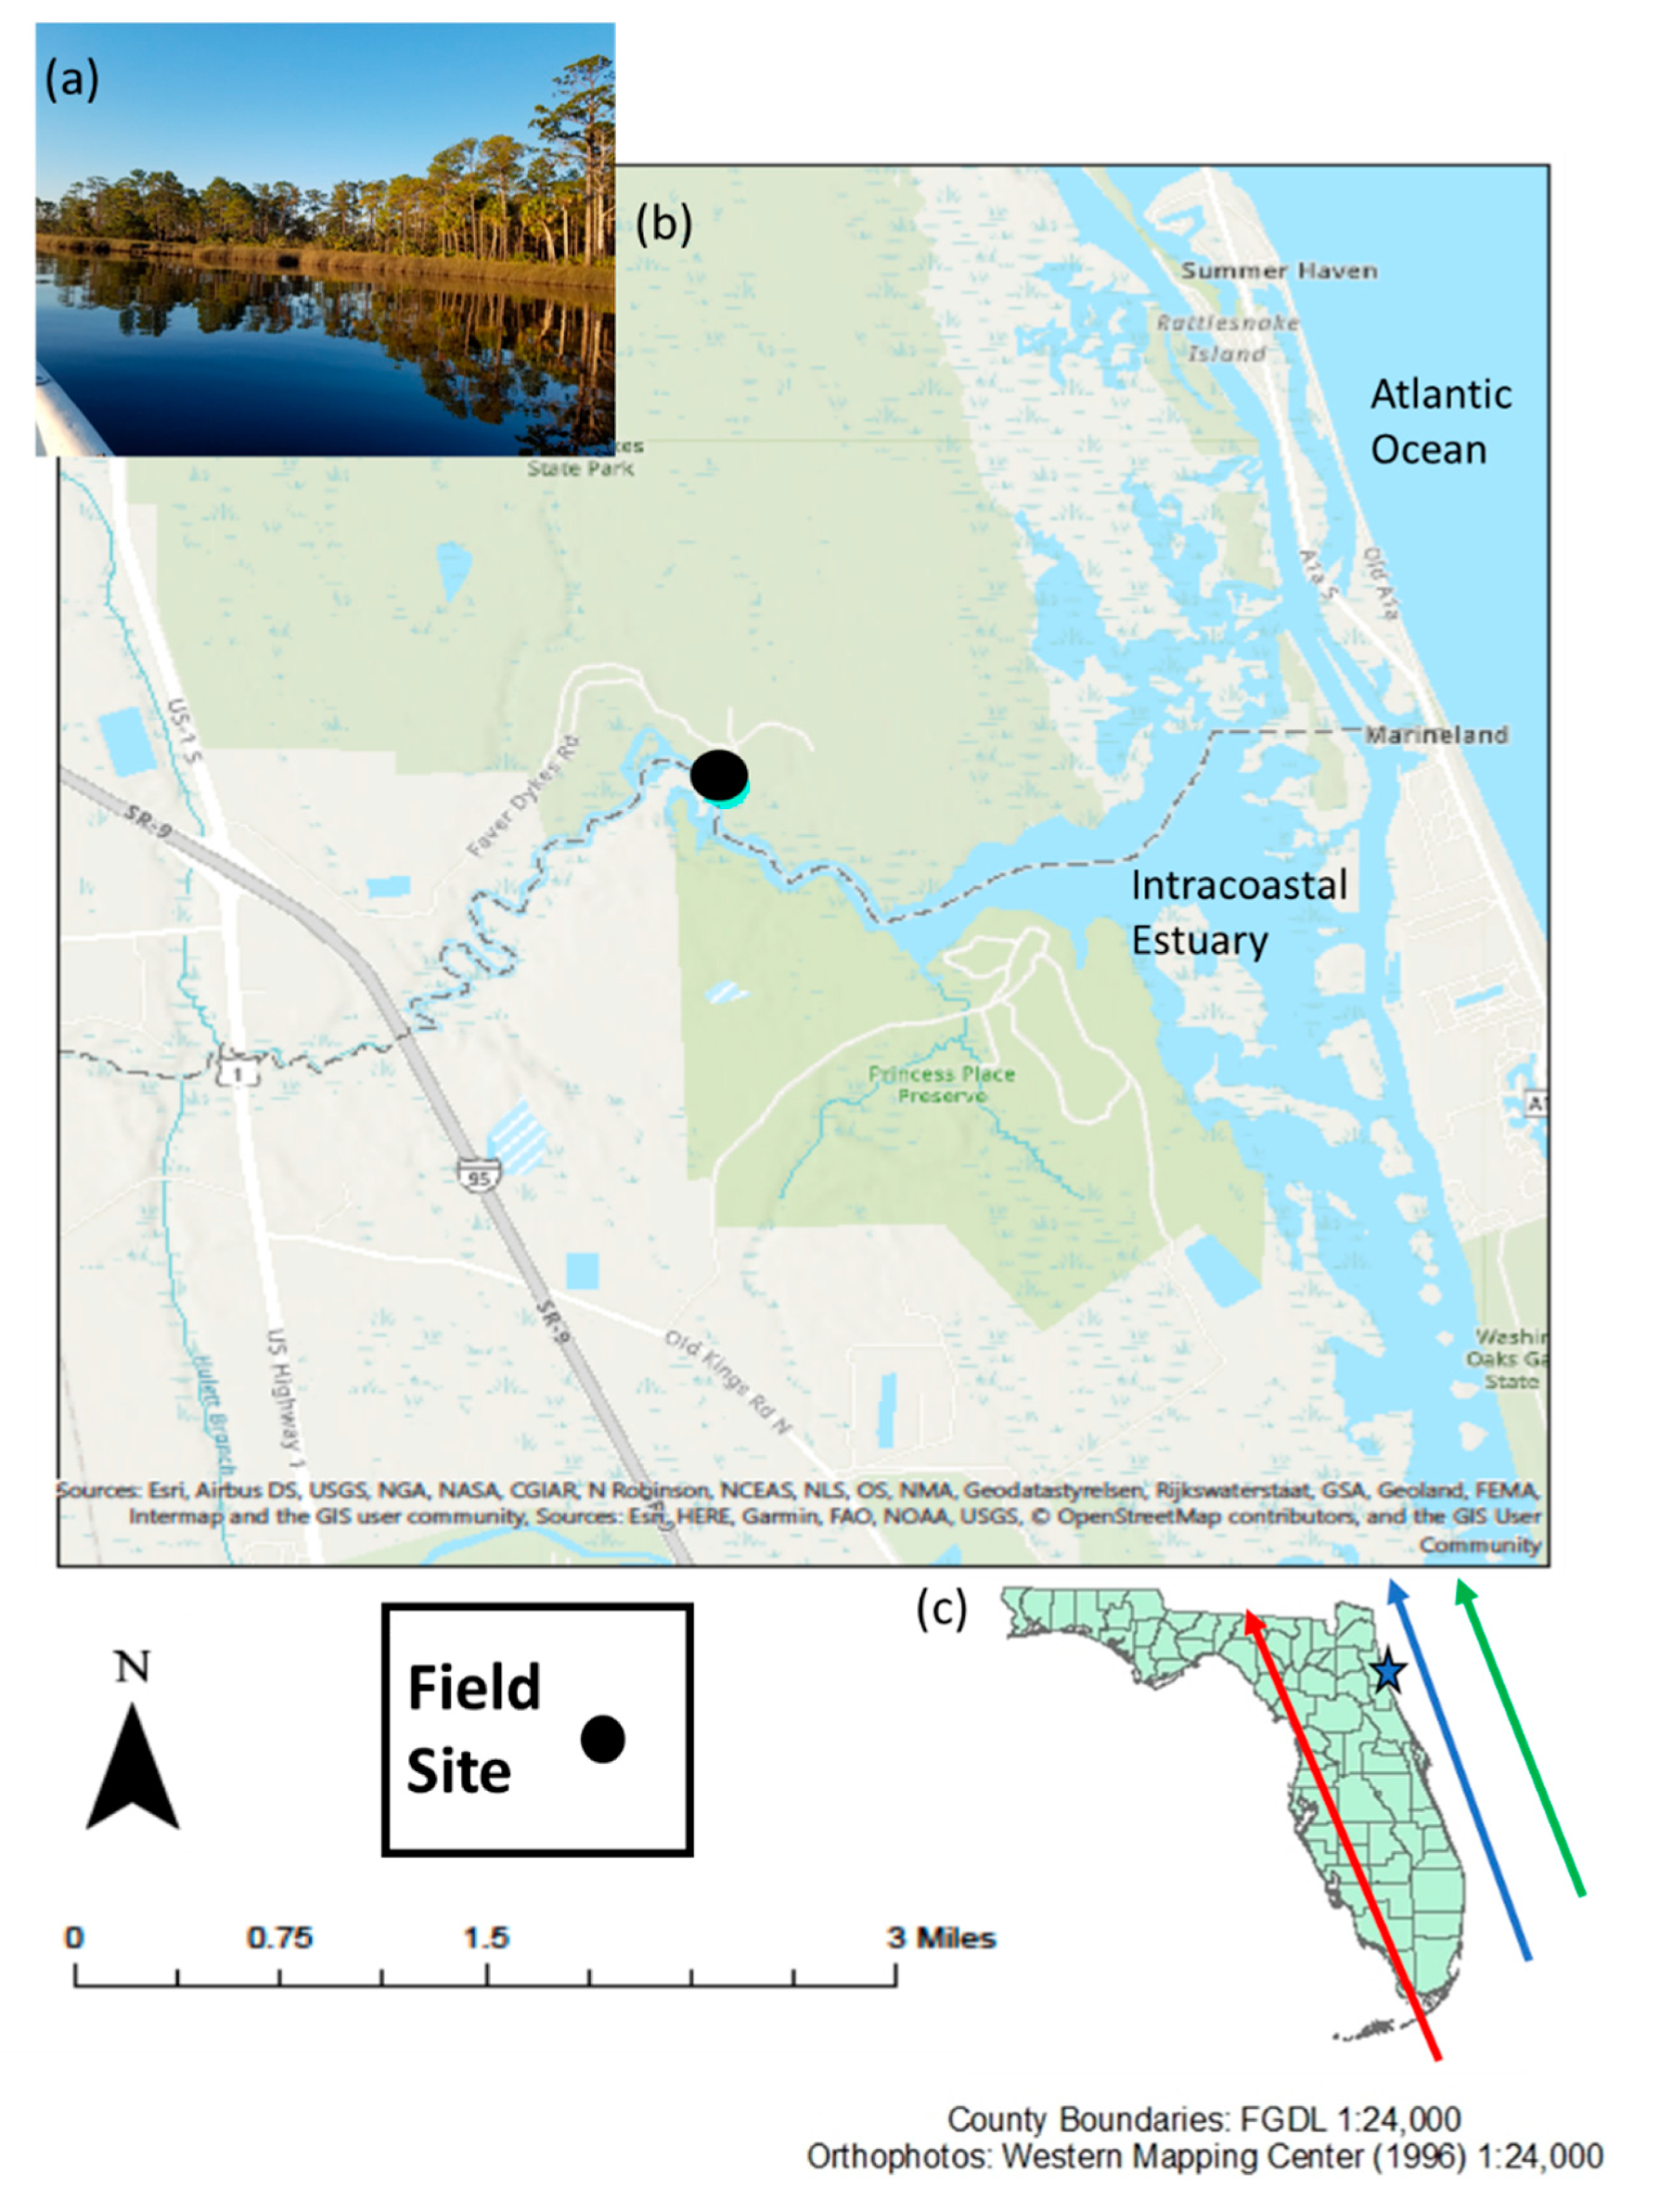
2.1. Study Site

The study site is located in a blackwater river in St. Augustine, FL, in the Southeastern United States. St. Augustine is located in northeastern Florida, adjacent to the Atlantic Ocean, and has a humid subtropical climate with hot rainy summers and drier mild winters. The river on which the study site is located is Pellicer Creek, and it is the largest tributary of the Matanzas River estuary, approximately 10 km from the Matanzas Inlet (Figure 1).
Pellicer Creek is relatively pristine. It is a state Aquatic Preserve within the Guana Tolomato Matanzas National Estuarine Research Reserve (GTMNERR), bordered by Faver-Dykes State Park and other conservation lands. The creek is influenced by daily tidal cycles and watershed inputs with salinity concentrations ranging from 0–35 psu. The surrounding watershed consists of mixed mangrove and salt marsh species downstream, Juncus roemerianus marsh surrounding the study site, and mixed freshwater forest species (primarily Taxodium distichum) and Cladium marsh upstream. There are also some sparse pine plantations and horse farms located upstream near the headwaters of Pellicer Creek and limited residential development throughout the watershed.

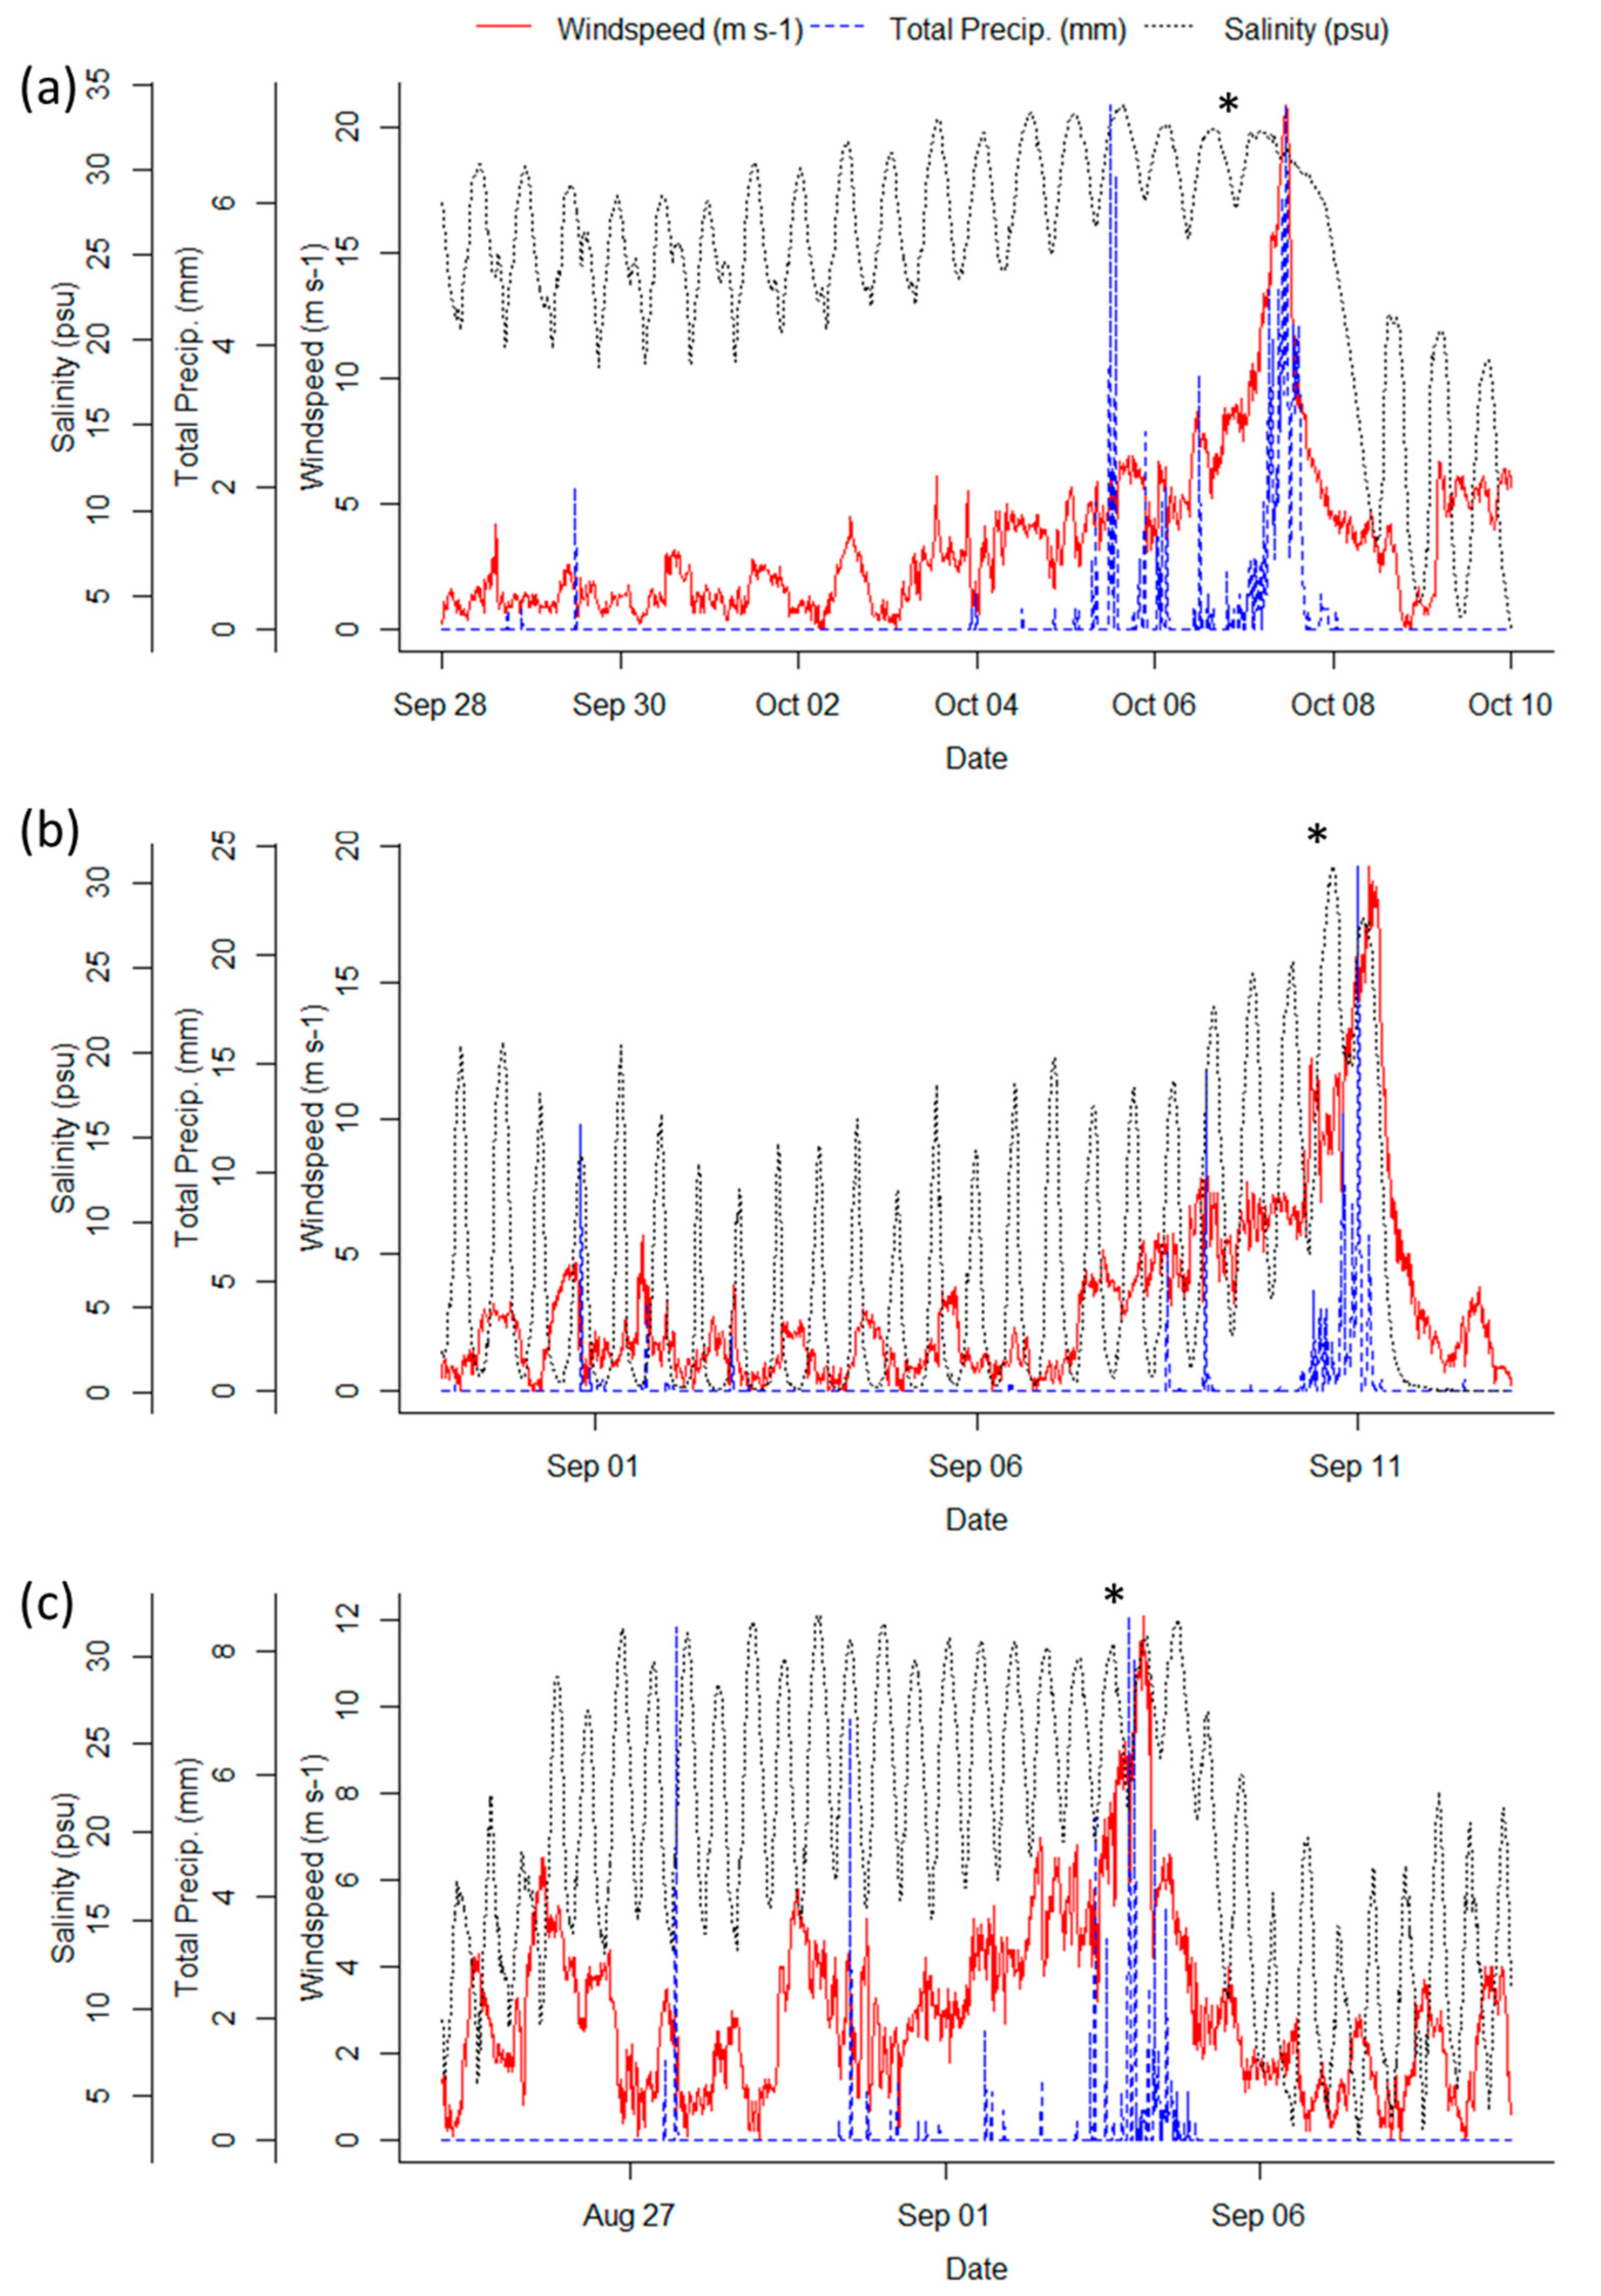
2.2. Meteorological Events

Three hurricanes influenced this site over a four-year period, between 2016 and 2020: Hurricane Matthew on 7 October 2016; Hurricane Irma on 10–11 September 2017; and Hurricane Dorian on 4 September 2019. Hurricane Matthew, a Category 3 hurricane traveling forty miles off the coast of St. Augustine dropped 34.5 cm of rainfall in the St. Augustine area (14.2 cm measured at the study site [27]). Hurricane Irma traveled across the entire state of Florida as a Category 1 hurricane and deposited 26 cm of rainfall in St. Augustine (16.3 cm at the study site [28]). Hurricane Dorian skirted the United States’ Atlantic Coast and created only 5.6 cm of precipitation measured only at the study site ([27,28,29]; Table 1). Hurricane Matthew created the largest storm surge of 1.6 m, followed by Irma with 1.3 m, and Dorian with 0.9 m.
Thunderstorms and other precipitation events occurred regularly in Florida during the period of study, especially during summer months. Occasional nor’easters also impacted the area of study during fall/winter months. These storms and total monthly precipitation varied greatly based on storm number and intensity. Precipitation data were collected at the GTMNERR meteorological station (GTMPCMET) located within the Pellicer Creek Aquatic Preserve on a high marsh flat in Princess Place Preserve on the south bank of the Creek (Lat: 29.65770, Long: −81.23274 NAD27; Figure 1). The station has continuously recorded measurements every 15 min since 2003. Data from this station include air temperature, relative humidity, barometric pressure, wind speed/ direction, and photosynthetically active radiation. This station is part of the National Estuarine Research Reserve System (NERRS) [29] System-Wide Monitoring Program (SWMP) and data are publicly accessible via nerrsdata.org [29].

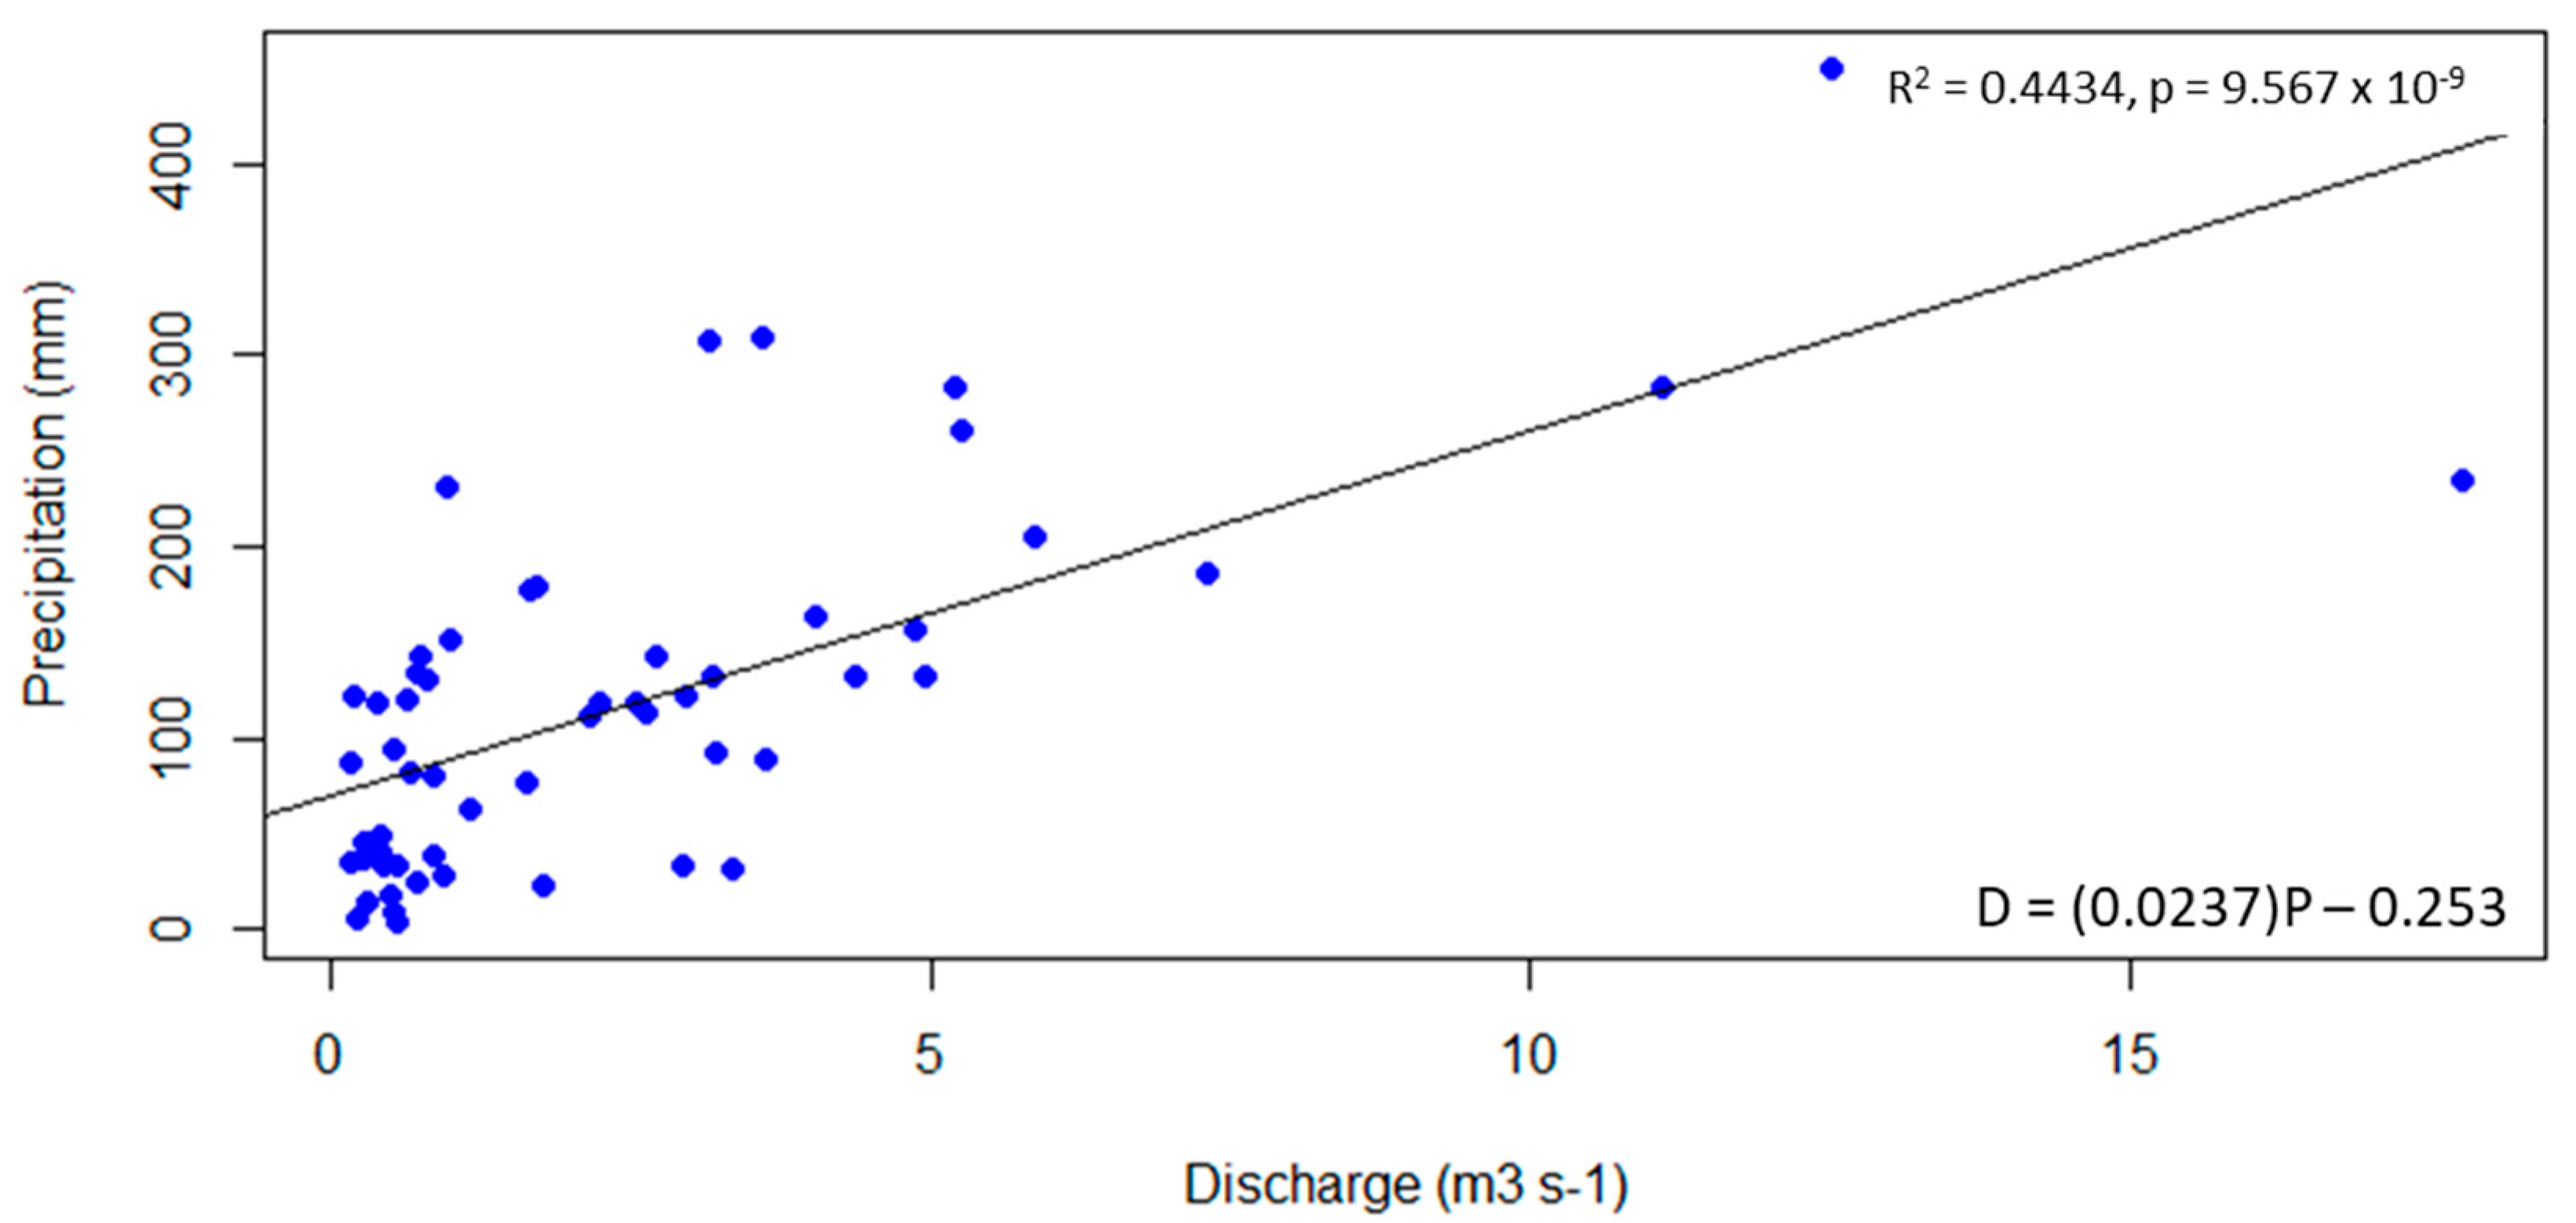
2.3. Export Calculations and Statistical Analysis

Tidally filtered discharge (ft3 s−1) was retrieved from the United States Geological Survey on the National Water Information System Website [30] for gage #02247222 at Pellicer Creek (Lat: 29.66917, Long: −81.25972 NAD27; Figure 1). The gage at this location has been inconsistently maintained over the past 15 years and tidally filtered discharge was available from October 2007 to August 2013 and April 2017 to the present. Therefore, data from 2014–2016 (during Hurricane Matthew) were unavailable.
Nutrient data used for export calculations were collected by the GTMNERR SWMP. Monthly discrete water samples were collected 1 m off the bottom at the Pellicer Creek station (GTMPCNUT; Figure 1) for dissolved organic carbon (DOC), ortho-phosphate (PO43−, SRP), total phosphorus (TP), nitrate-N (NO3-N), ammonia-N (NH3-N), and total kjeldahl nitrogen (TKN). In addition, an ISCO autosampler collected water samples at the same depth every 2.5 h over a 24 h period (approximately two tidal cycles) preceding the grab samples [29]. Analysis of water samples were conducted using EPA methods 365.1 Rev. 2.0 (SRP), 365.1 Rev. 2.0 (TP), 351.2 Rev. 2.0 (TKN), 353.2 Rev 2.0 (NO3-N), 350.1 Rev 2.0 (NH3-N), and SM 5310 B-00 (DOC).
Export was calculated from SWMP nutrient data and USGS discharge data in kg day−1 using tidally filtered discharge and nutrient concentrations for DOC, TKN, NO3-N, and NH3-N, SRP, and TP in mg L−1. Nutrient concentrations were matched according to timestamps from USGS tidally filtered discharge data to calculate export using the equation below (Equation (1)), where Q is discharge (ft3 s−1), C is concentration (mg L−1), and the other constants are conversion factors between mg to kg, L to ft3, and seconds to days.
Export   ( kg   day 1 ) = QC × 1 × 10 8 × 28.32 × 86400
Export was then averaged, and standard deviation was calculated across each sampling event (approximately two tidal cycles) using the ‘ggplot2′ package in R [31].
Since the USGS gage was out of commission during Hurricane Matthew, a linear regression was calculated between precipitation (mm) from the GTMNERR meteorological station and discharge (m3 s−1) from the USGS gage using the “ggpubr” package in R [31]. For the correlation analysis, precipitation data were summed for all available months where discharge data were collected (56 data points). The assumptions of linearity, normality, and homogeneity required for a Pearson correlation were confirmed before analysis. Based on the correlation (r = 0.4434, p = 9.567 × 10⁻⁹; Figure 2), estimated discharge for Hurricane Matthew (precipitation = 142 mm) was 33.8 m3 s−1. Estimates of discharge from precipitation were also calculated for Hurricanes Irma and Dorian to verify the accuracy of the calculated values for Hurricane Matthew. Estimated discharge was 40.8 m3 s−1 for Irma (precipitation = 168.3 mm) and 11.6 m3 s−1 for Dorian (precipitation = 56 mm).
Additionally, monthly cumulative precipitation was used to determine periods of storm influence and applicable months were categorized as follows: low precipitation = monthly precipitation <40 mm (storm group 1); intermediate precipitation = 40–130 mm (storm group 2); high precipitation = >130 mm (storm group 3); and hurricane months = months when Hurricanes Matthew, Irma, and Dorian affected the study site (storm group 4; Figure 3). Storm groups 1–3 were established by ranking and equally dividing the data from the period of study (approximately 30% of the data allocated to each group). Export estimates were graphed with box plots using the ‘ggpubr’ package in R [31]. Kruskal–Wallis tests were performed using the ‘dplyr’ package in R to test for significant differences between storm groups for each nutrient exported [32].

2.4. Ecosystem Metabolism

The ‘SWMPr’ package in R was used to calculate and graph ecosystem metabolism characteristics in Pellicer Creek from dissolved oxygen (DO) values continuously collected by a YSI EXO data sonde at the study site [29,33]. Net ecosystem metabolism (NEM, dC/dt) was calculated using community respiration (Rt, mg L−1 h−1), gross primary production (Pg, mg L−1 h−1), and rate of oxygen uptake from diffusion across the air–water interface (mg L−1 h−1) according to Equation (2) [19,33,34].
NEM = ( dC dt ) = Pg Rt  
NEM was averaged (aggregated) by month and grouped into the four storm groups discussed previously. A Kruskal–Wallis test was run using the “dplyr” package in R to test for differences in NEM between storm groups [31]. Significant differences were found, so the Dunn post-hoc test was utilized in the “FSA” package with p-values adjusted with the Benjamini–Hochberg method [35]. As mentioned above, all statistical operations were performed with R© (Ver 3.1.2, R Foundation for Statistical Computing, Vienna, Austria) with the critical level of significance set at α = 0.05.

3. Results

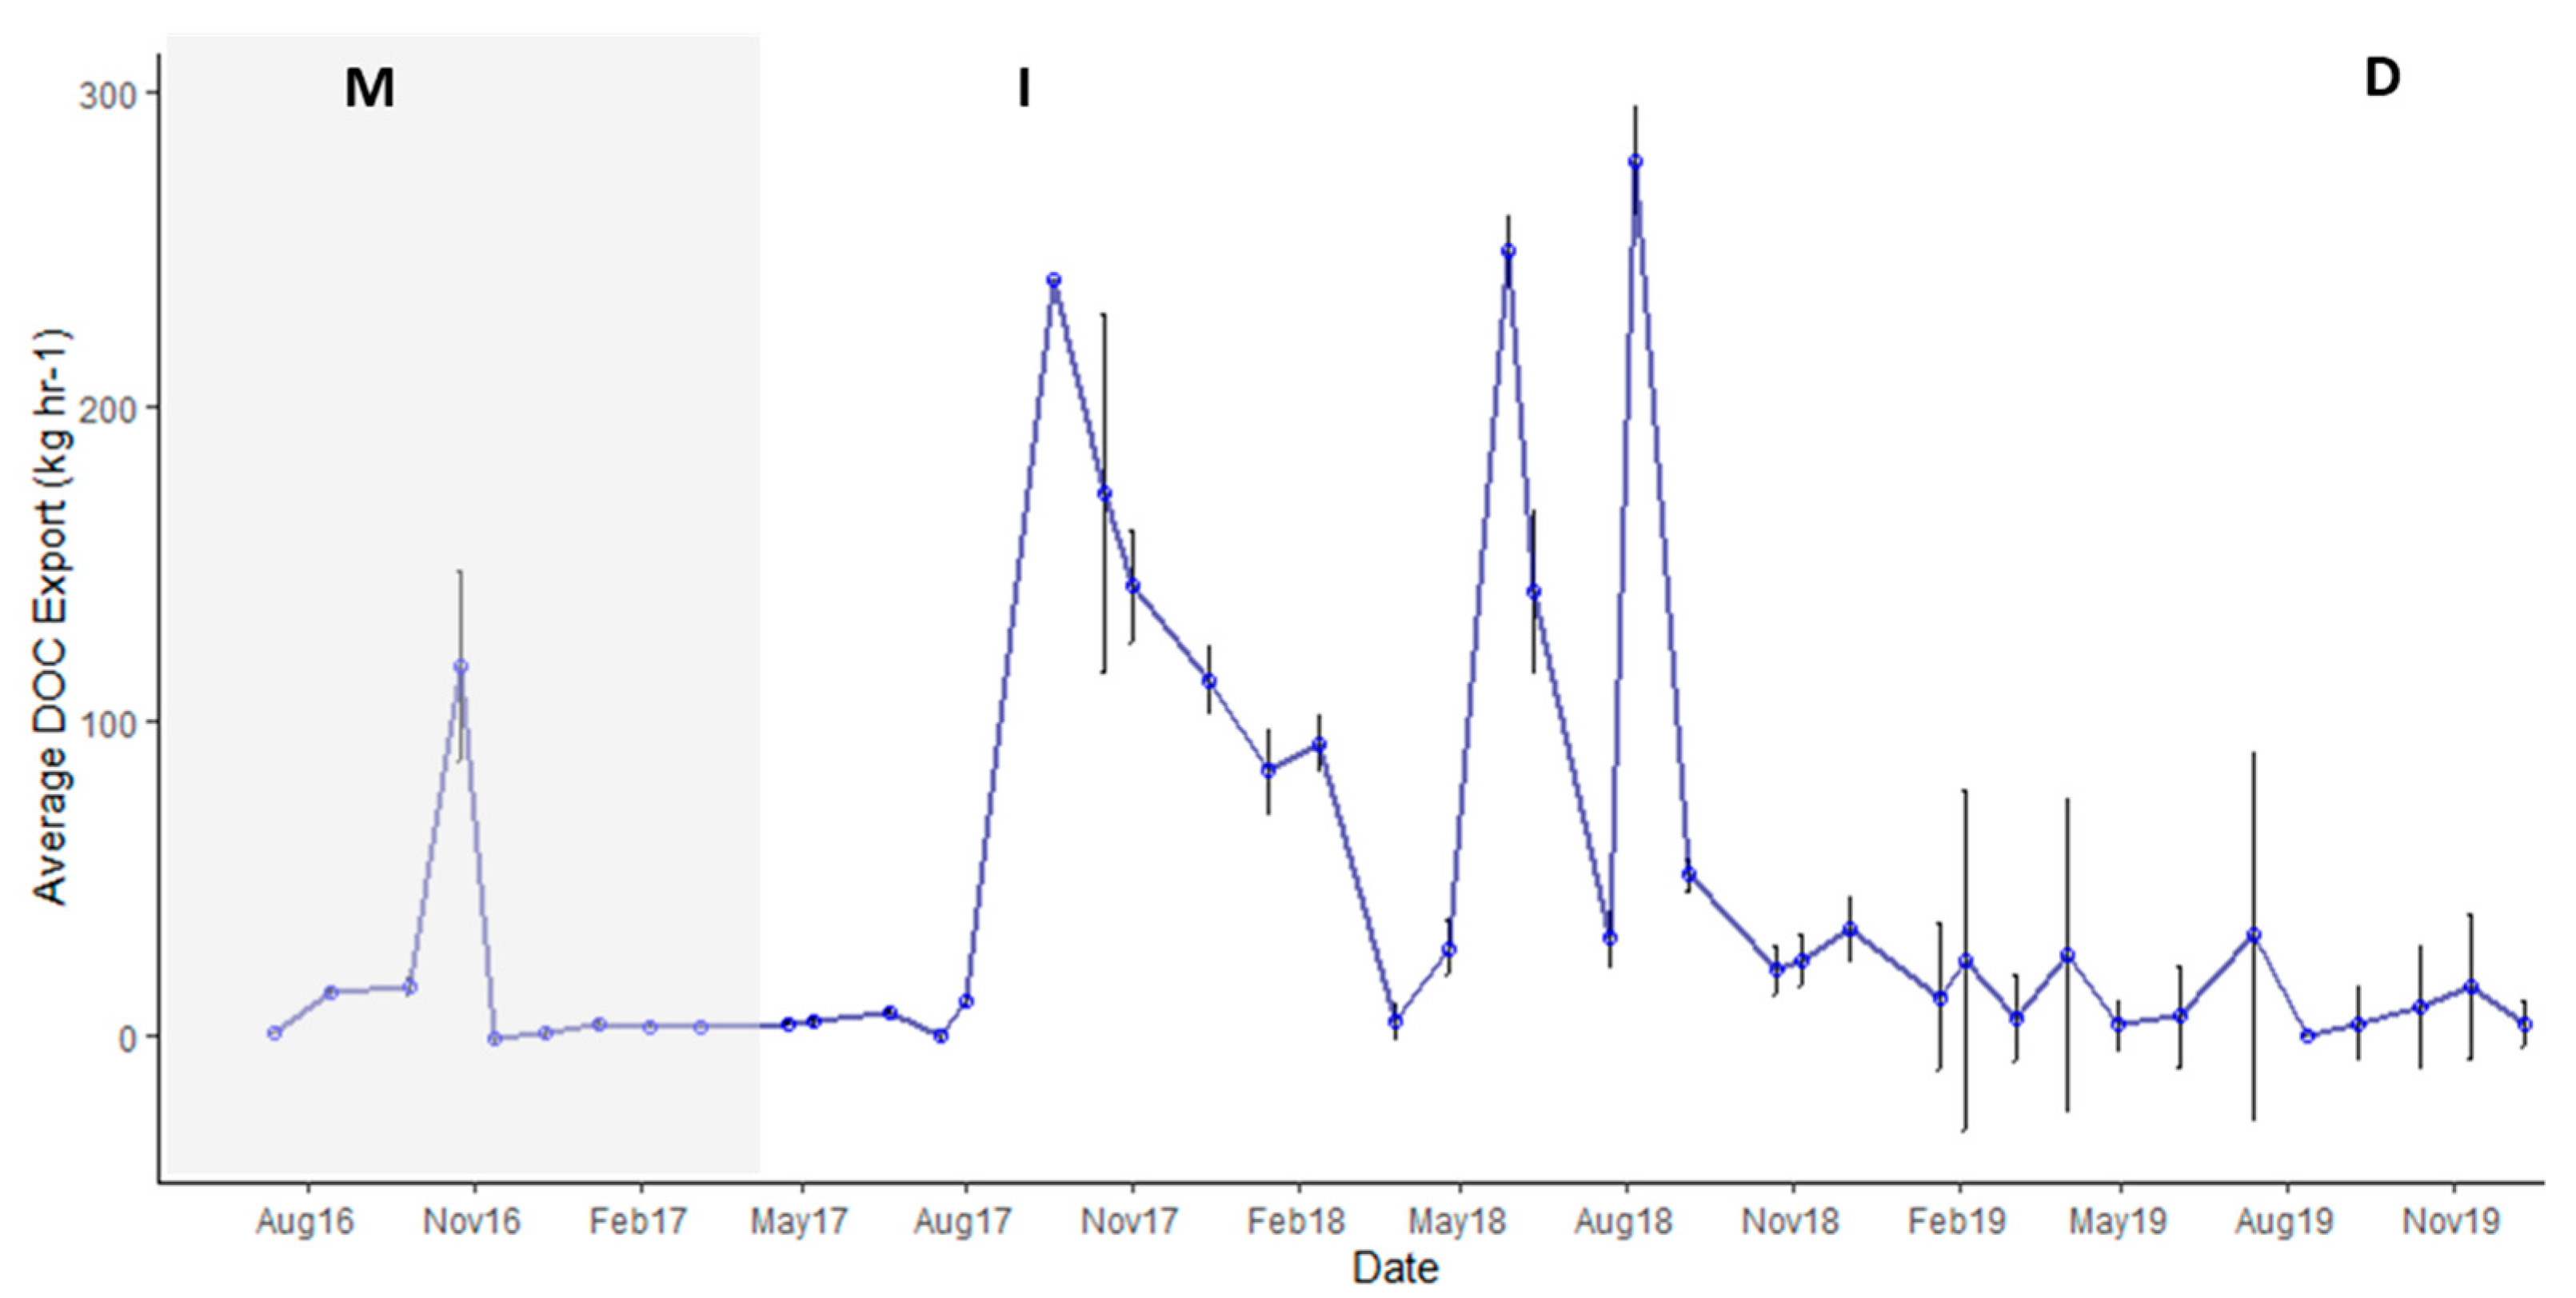
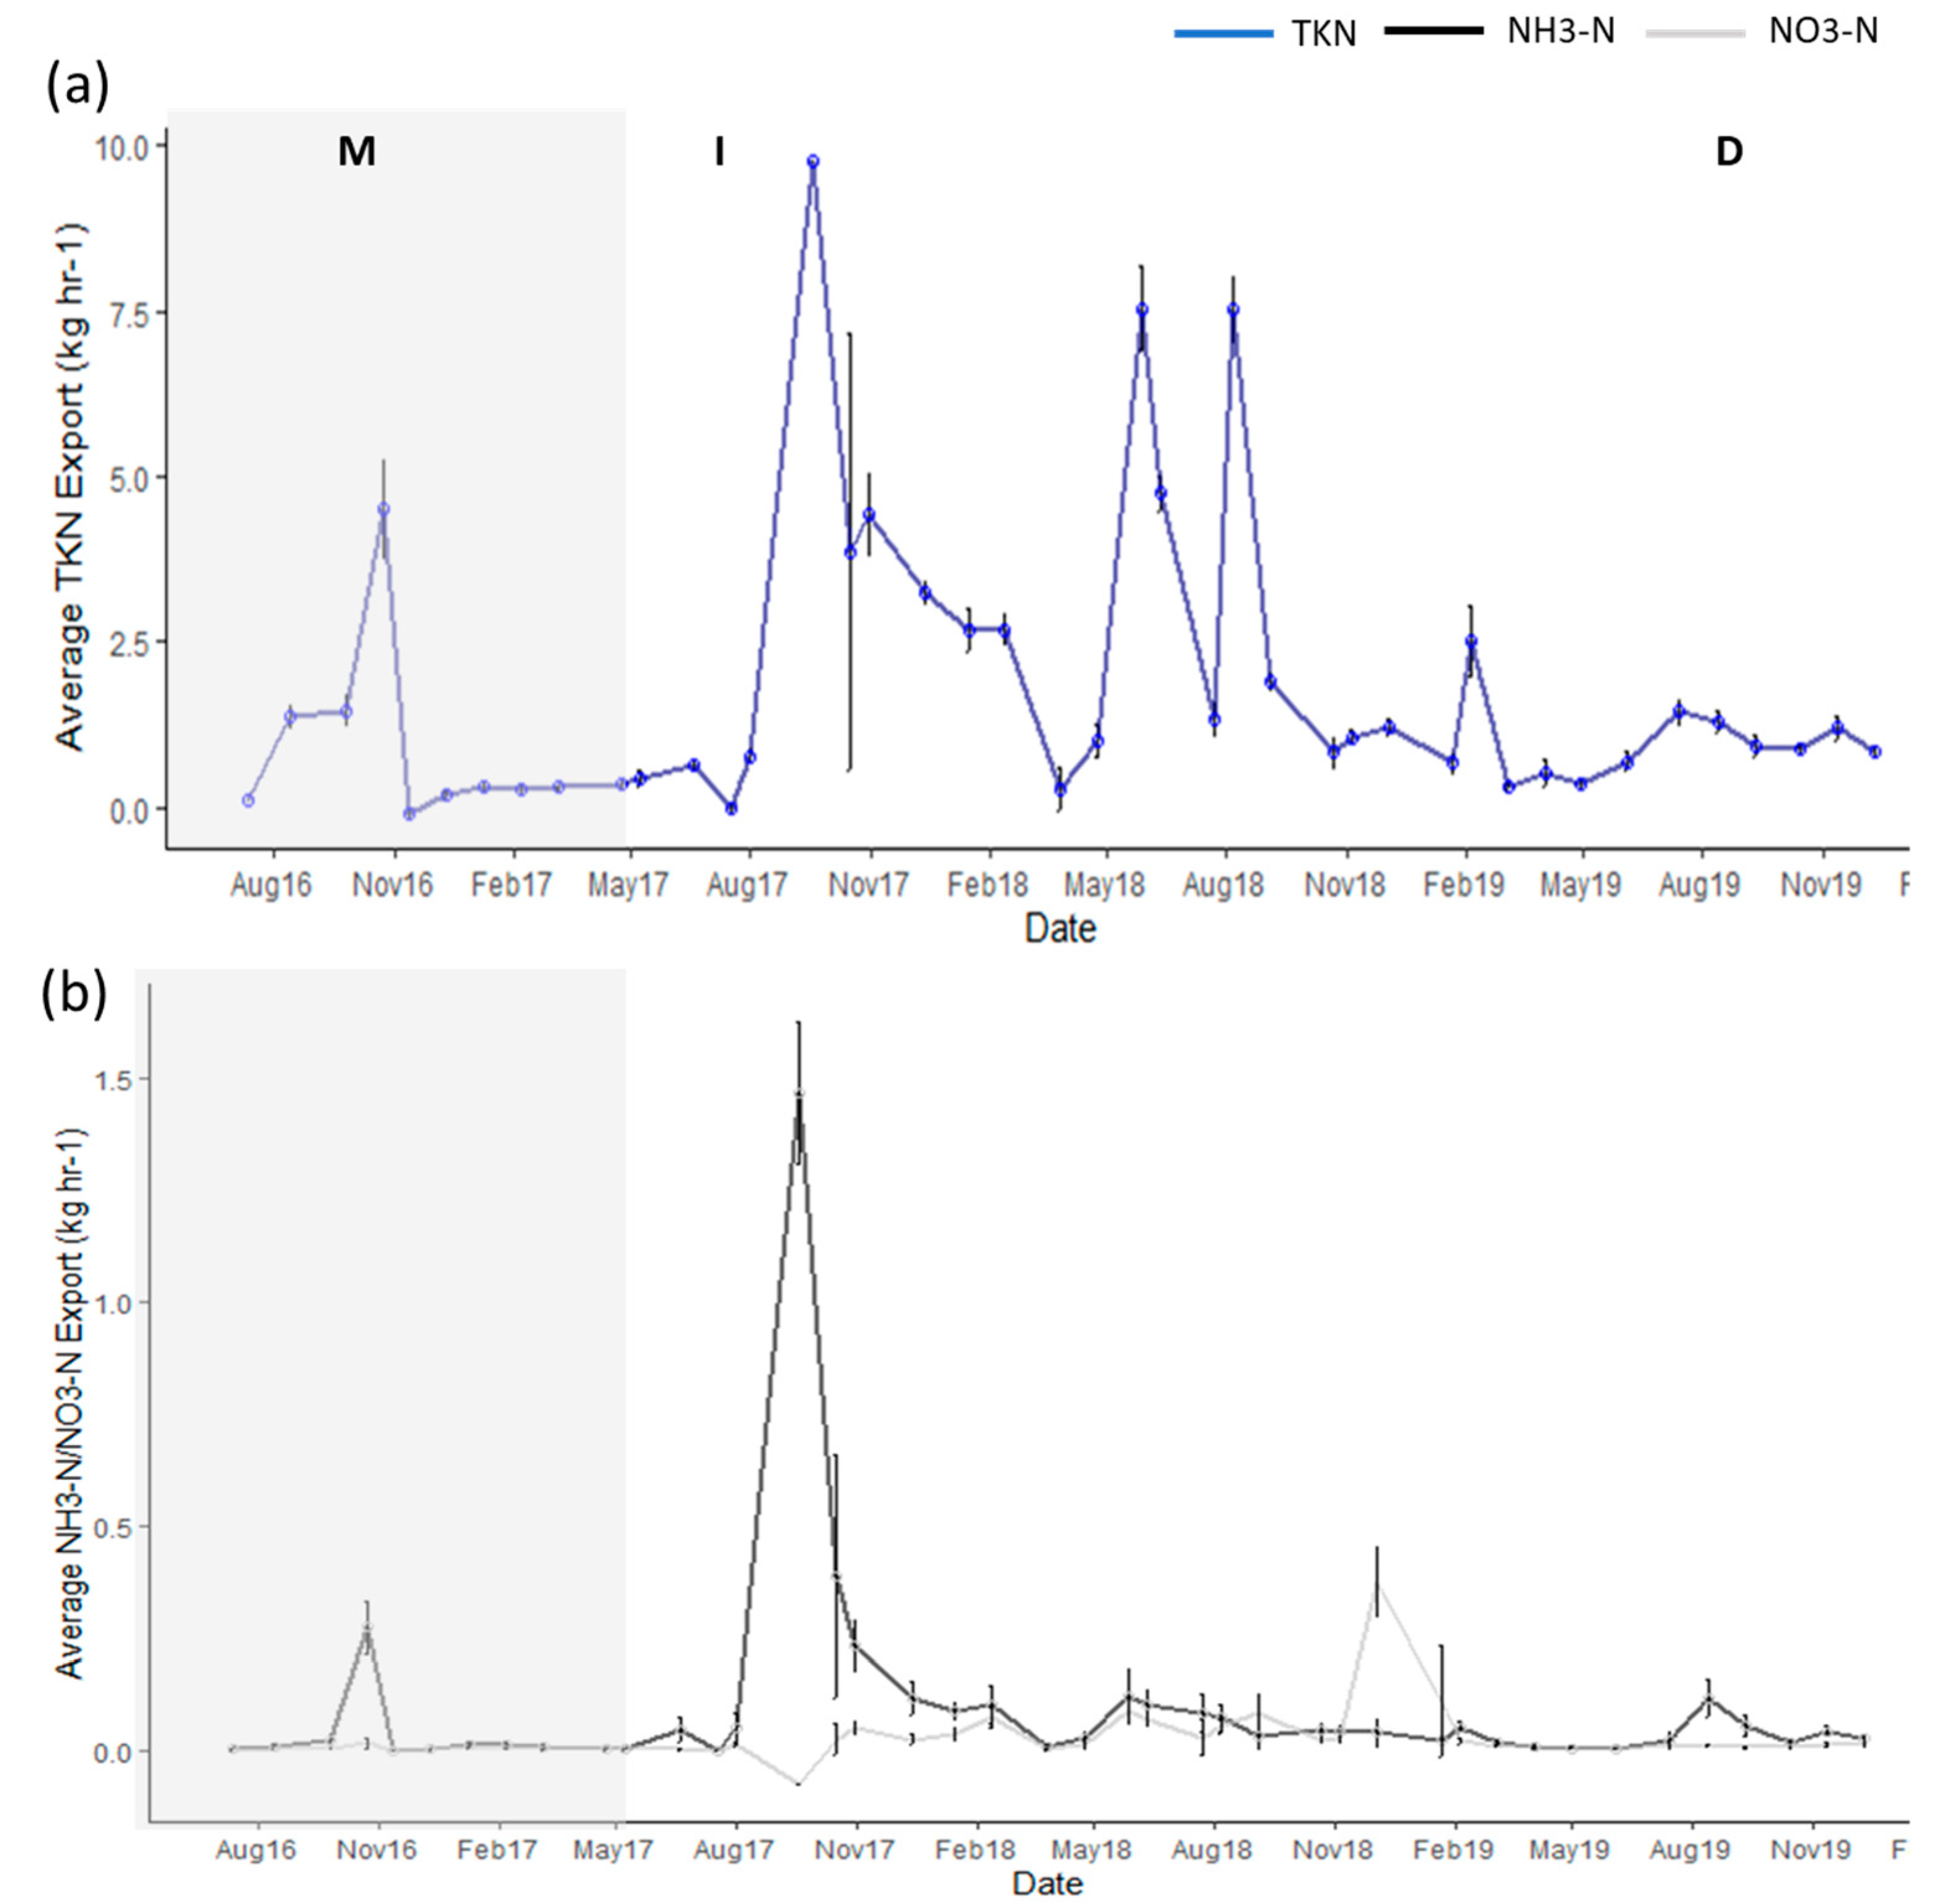
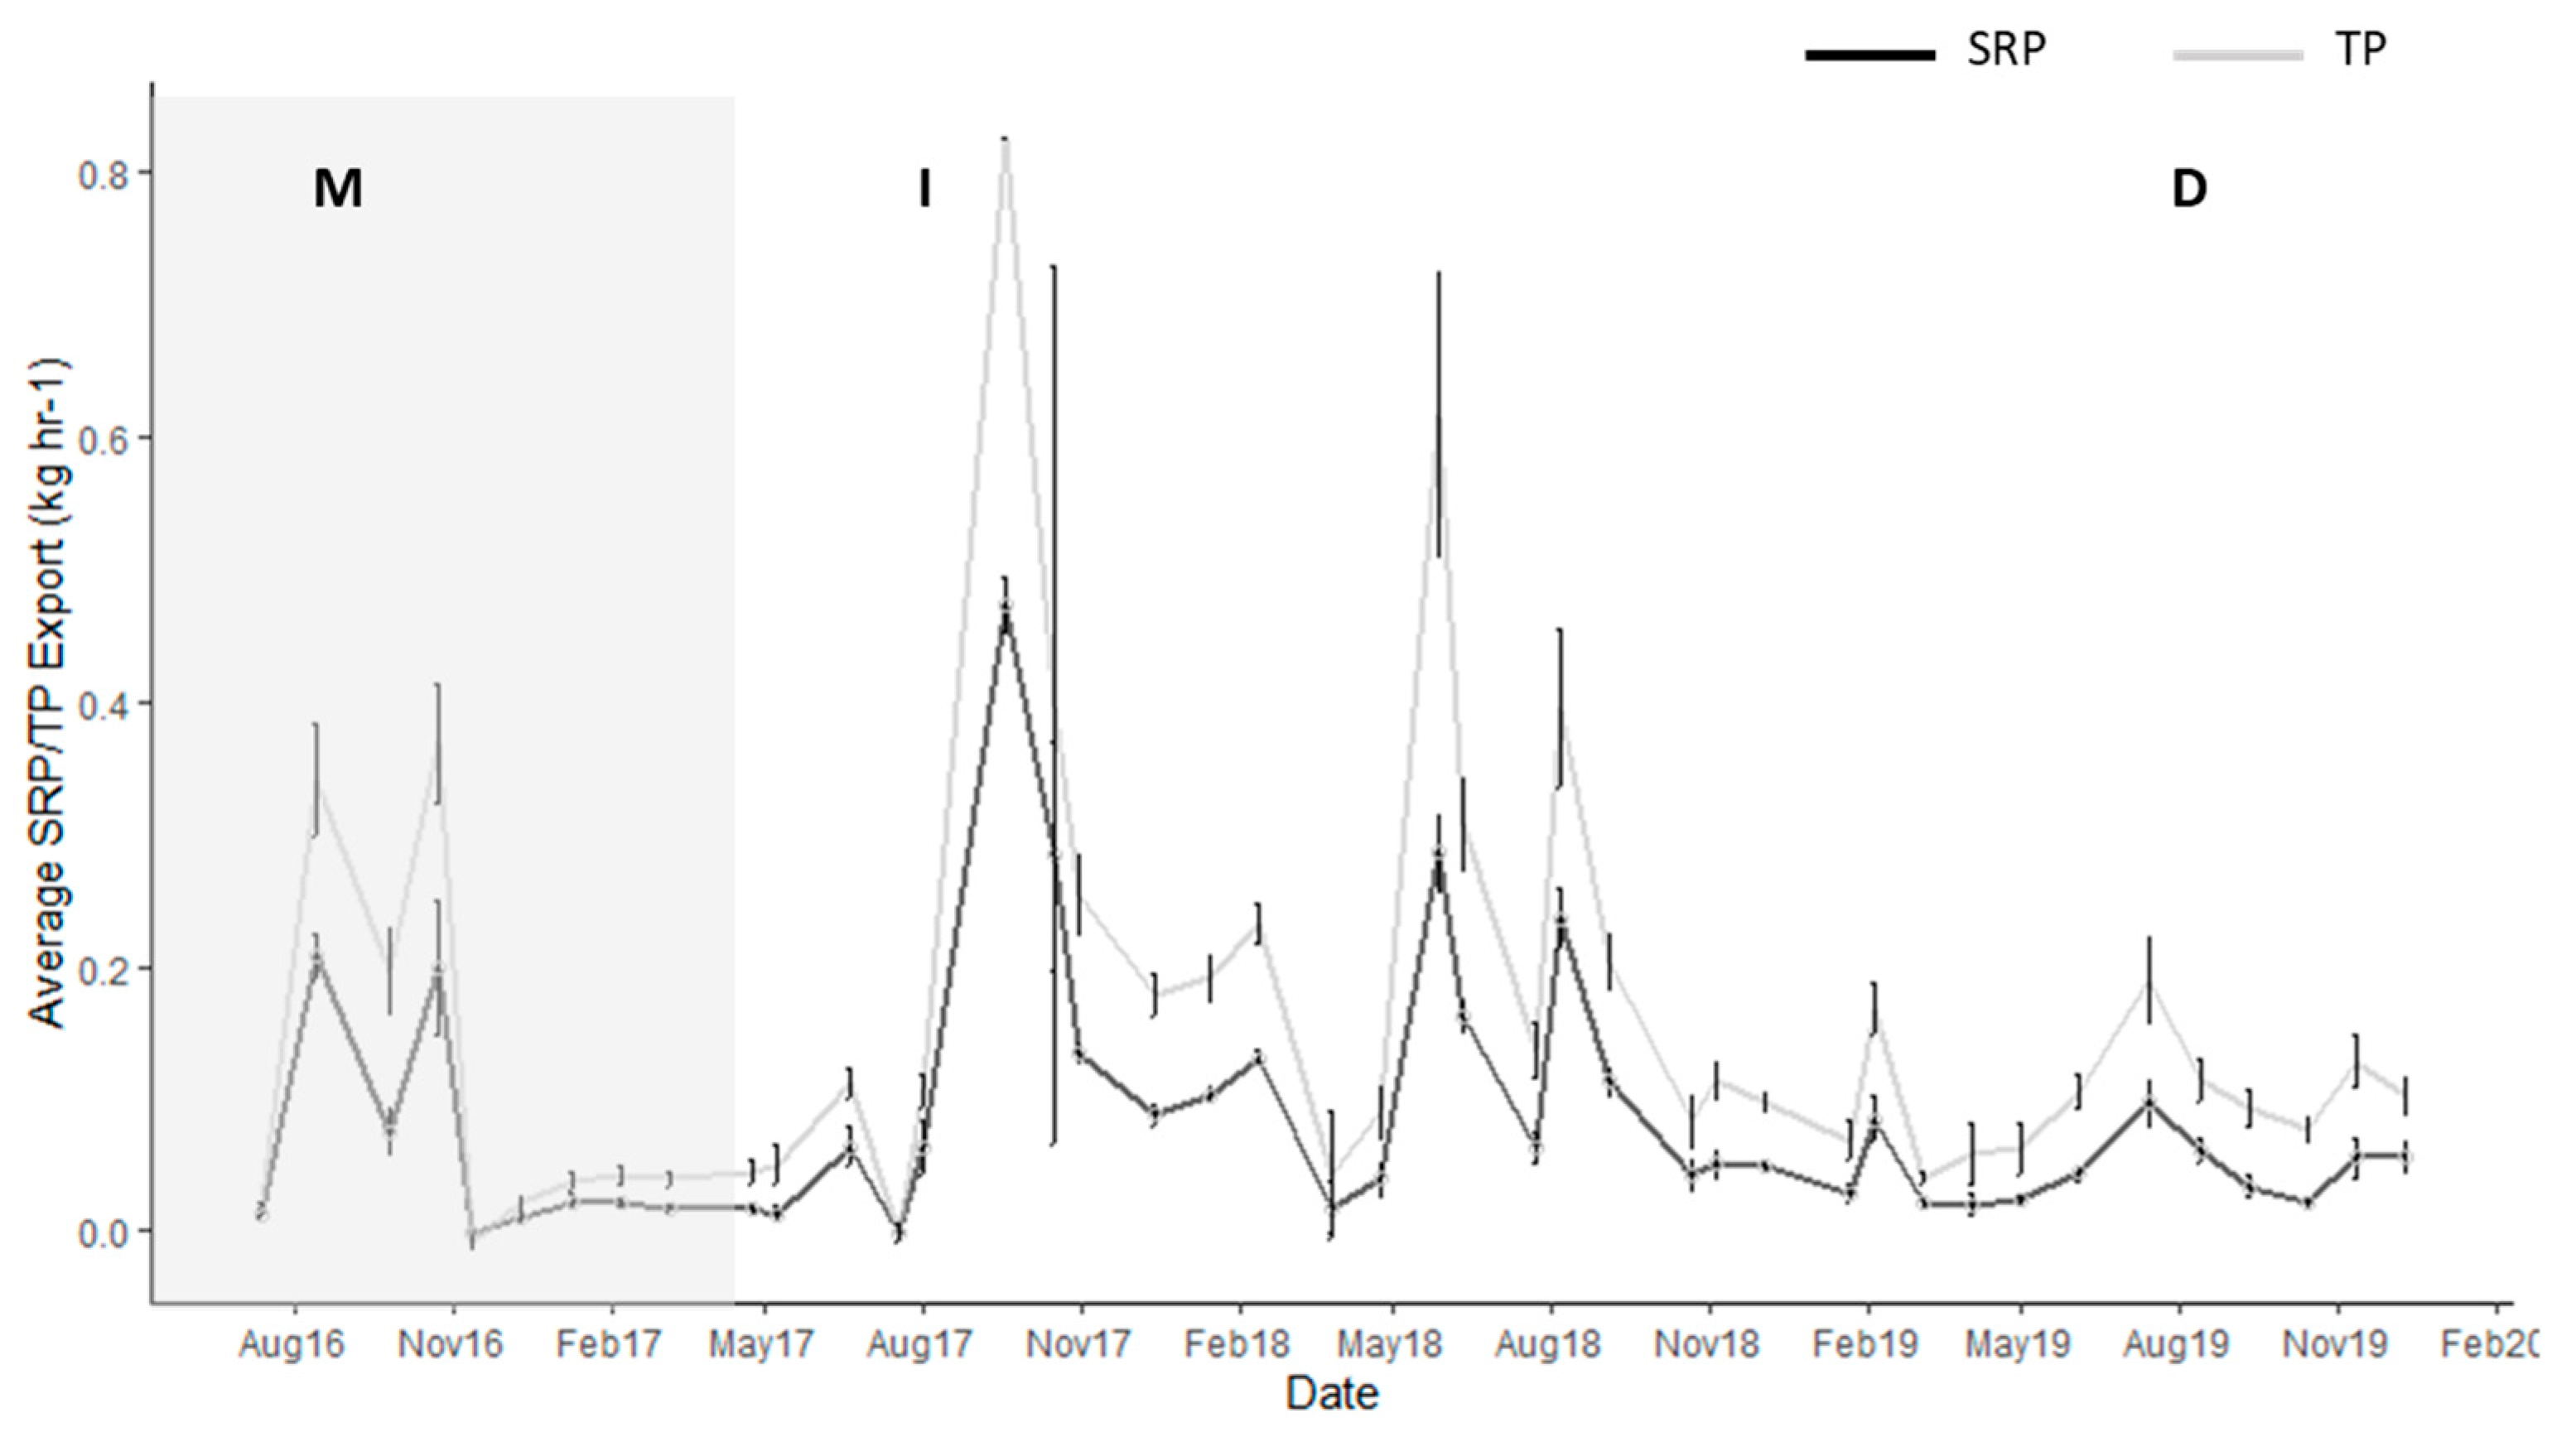
3.1. Export of DOC and Nutrients

The export of carbon and nutrients varied among analytes, although all analytes exhibited large increases in export in September 2017, one week after Hurricane Irma (Figure 4, Figure 5 and Figure 6). DOC export peaked at approximately 240 kg C day−1 in September 2017, slowly decreased to 9 kg day−1 in March 2018, then peaked again at 245 kg C day−1 at the end of May 2018 and 294 kg C day−1 in August 2018 (Figure 5). There was a smaller peak in DOC export in October 2016 (after Hurricane Matthew).
TKN displayed a similar pattern to DOC, with the largest spikes in export in September 2017, around 9.8 kg TKN day−1, followed by a slow decrease to approximately 0 kg day−1 in March 2018, then two secondary peaks in May 2018 (7.9 kg TKN day−1) and August 2018 (7.8 kg TKN day−1) (Figure 6a). There was a smaller spike in February 2019 at 2.5 kg TKN day−1 and otherwise values ranged from 0 to 1.7 kg TKN day−1. Ammonia-N export peaked in September 2017 at 1.5 kg NH3-N day−1 but otherwise consistently ranged between 0.02 kg NH3-N day−1 and 0.09 kg NH3-N day−1 (Figure 6b). Nitrate-N exhibited a unique pattern compared to the rest of the analytes, with a negative export of −0.18 kg NO3-N day−1 in September 2017, but the largest spike in December 2018 at 0.4 kg NO3-N day−1 (Figure 6b). SRP and TP export patterns were similar to TKN and DOC, with the strongest peak in September 2017 (0.5 kg SRP day−1, 0.9 kg TP day−1) and smaller peaks in August 2016, October 2016, May 2018, and August 2018 (Figure 7).

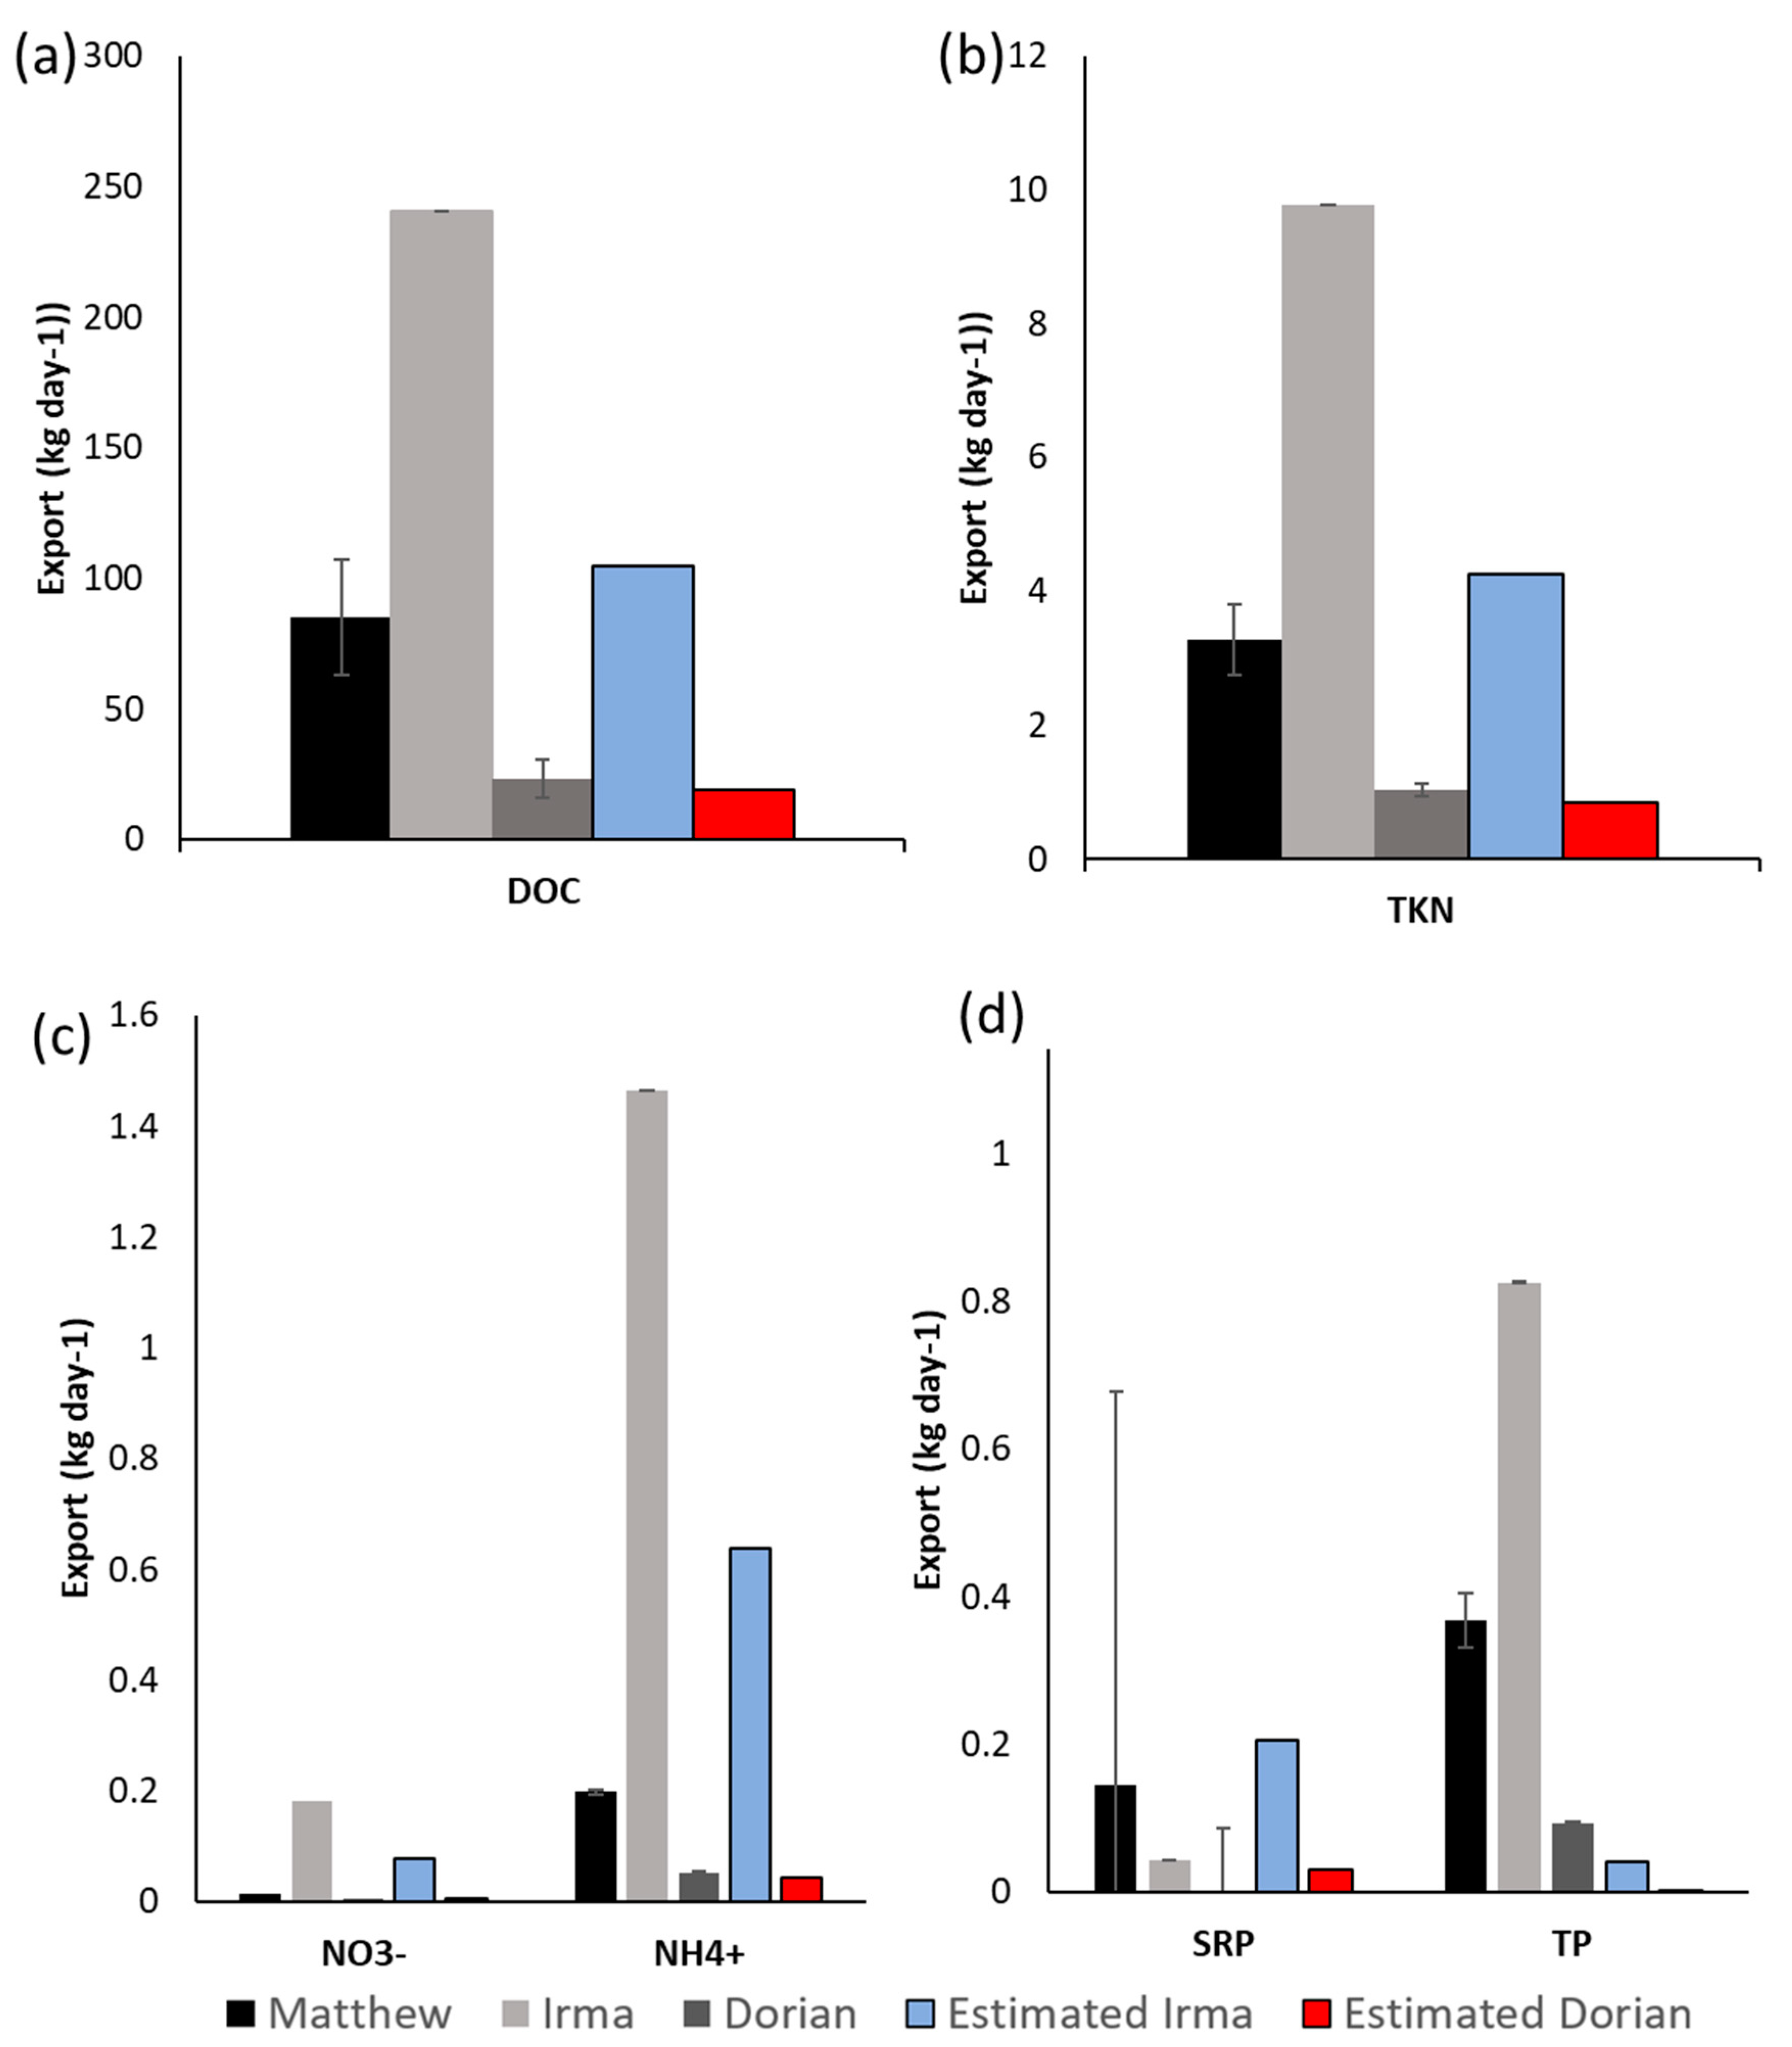
3.2. Hurricane Export

Irma displayed the largest DOC export of the three hurricanes at 240 kg C day−1, Matthew exported 85 kg C day−1, and Dorian exported only 24 kg C day−1 (Figure 8a). Average TKN during Irma also yielded the largest value of 9.8 kg TKN day−1, followed by Matthew with 3.3 8 kg TKN day−1, and Dorian with 1.0 8 kg TKN day−1 (Figure 8b). Average SRP export was highest after Matthew, 0.14 kg SRP day1, Irma exported 0.04 kg SRP day−1, and Dorian exported 0.002 kg SRP day−1 (Figure 8d). Average nitrate export was highest after Irma at 0.2 kg NO3-N day1, then Matthew at 0.01 kg NO3-N day−1, and last Dorian at 0.006 kg NO3-N day−1 (Figure 8c). Ammonia-N export was also greatest after Hurricane Irma at 1.5 kg NH3-N day−1, second greatest was Matthew at 0.20 NH3N day−1, and then Dorian at 0.05 NH3-N day−1 (Figure 8c).
Estimated values for Hurricane Irma were 105 kg C day−1, 4.3 kg TKN day−1, 0.21 kg SRP day−1, 0.08 kg NO3-N day−1, and 0.64 kg NH3-N day−1, which were not very close to actual values. Estimated values for Hurricane Dorian were 19 kg C day−1, 0.85 kg TKN day−1, 0.03 kg SRP day−1, 0.005 kg NO3-N day−1, and 0.04 kg NH3-N day−1, which were more similar to actual values. Due to the largest number of points being clustered below 200 mm precipitation and 5.66 m3 s−1 discharge, it is assumed that the estimation of values below this range are probably more accurate than estimates of points above this range. Besides low values for SRP and NO3-N (concentrations near limit of detection), estimated values for Dorian were within 15–20% the actual values. Estimates for Hurricane Matthew were in a similar range within the area of the graph with most data points, so estimates for Hurricane Matthew are likely within a 20% window, but these are the best estimates available without actual discharge values.

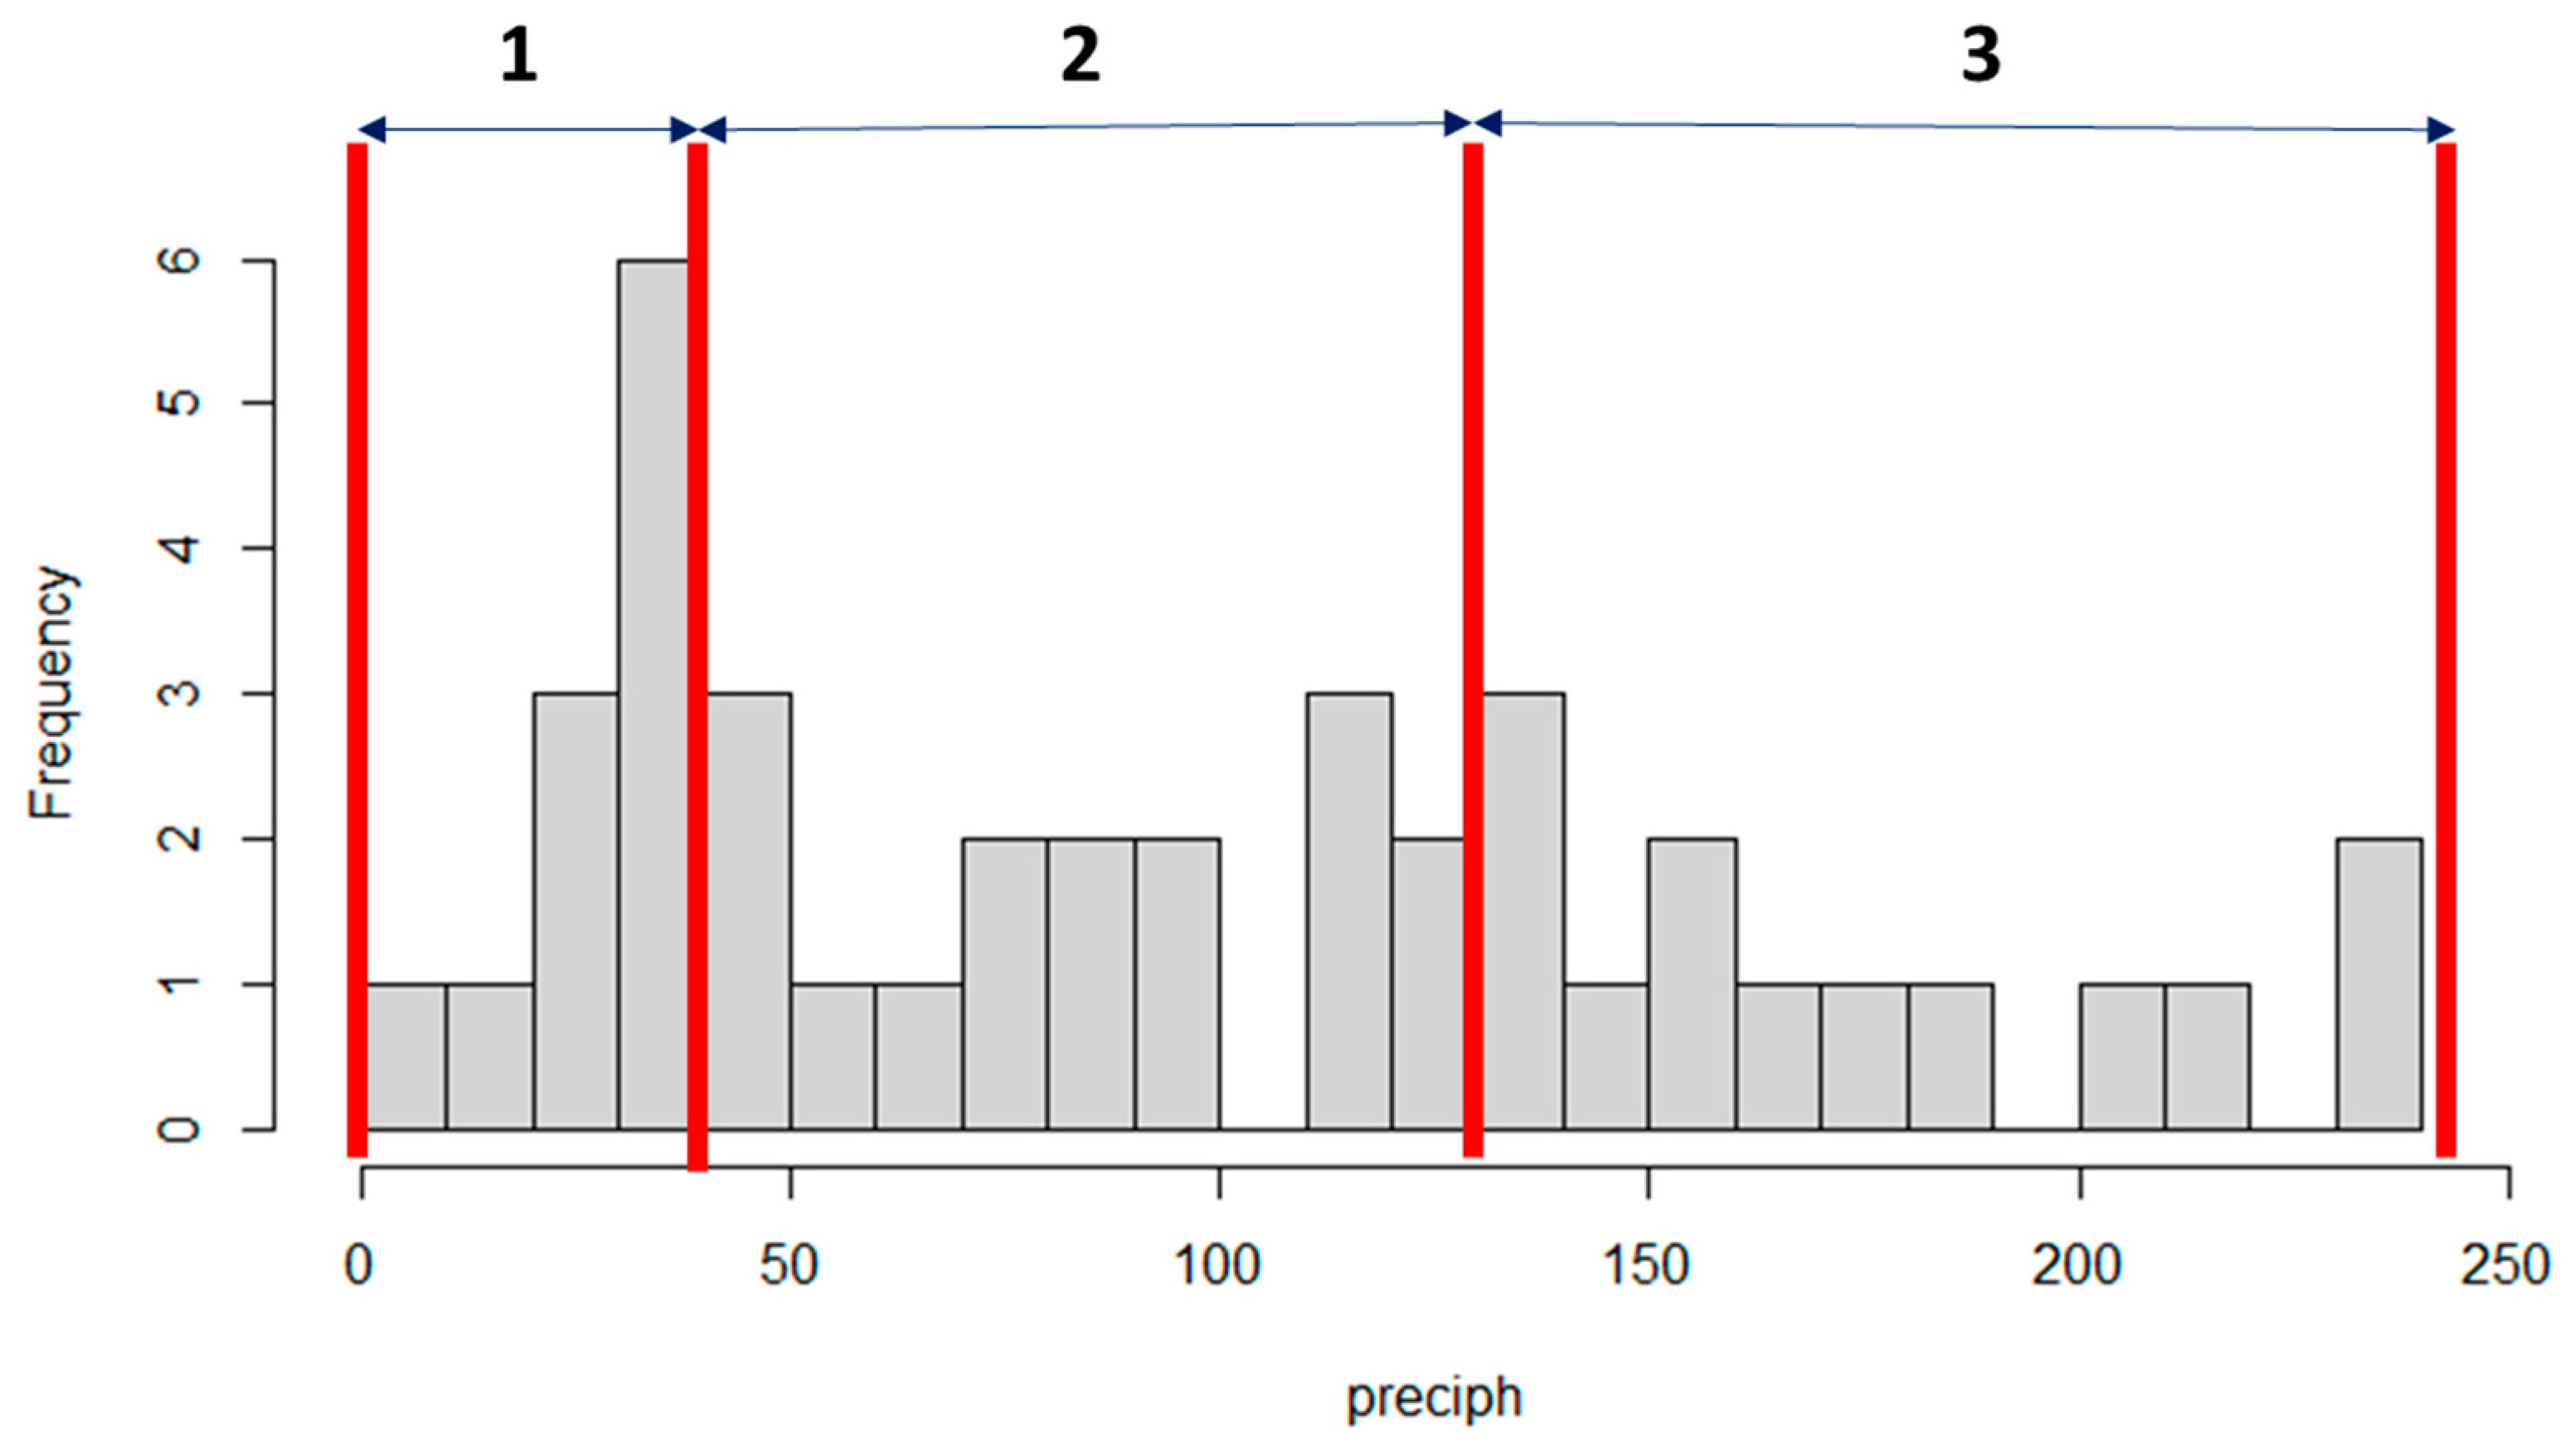
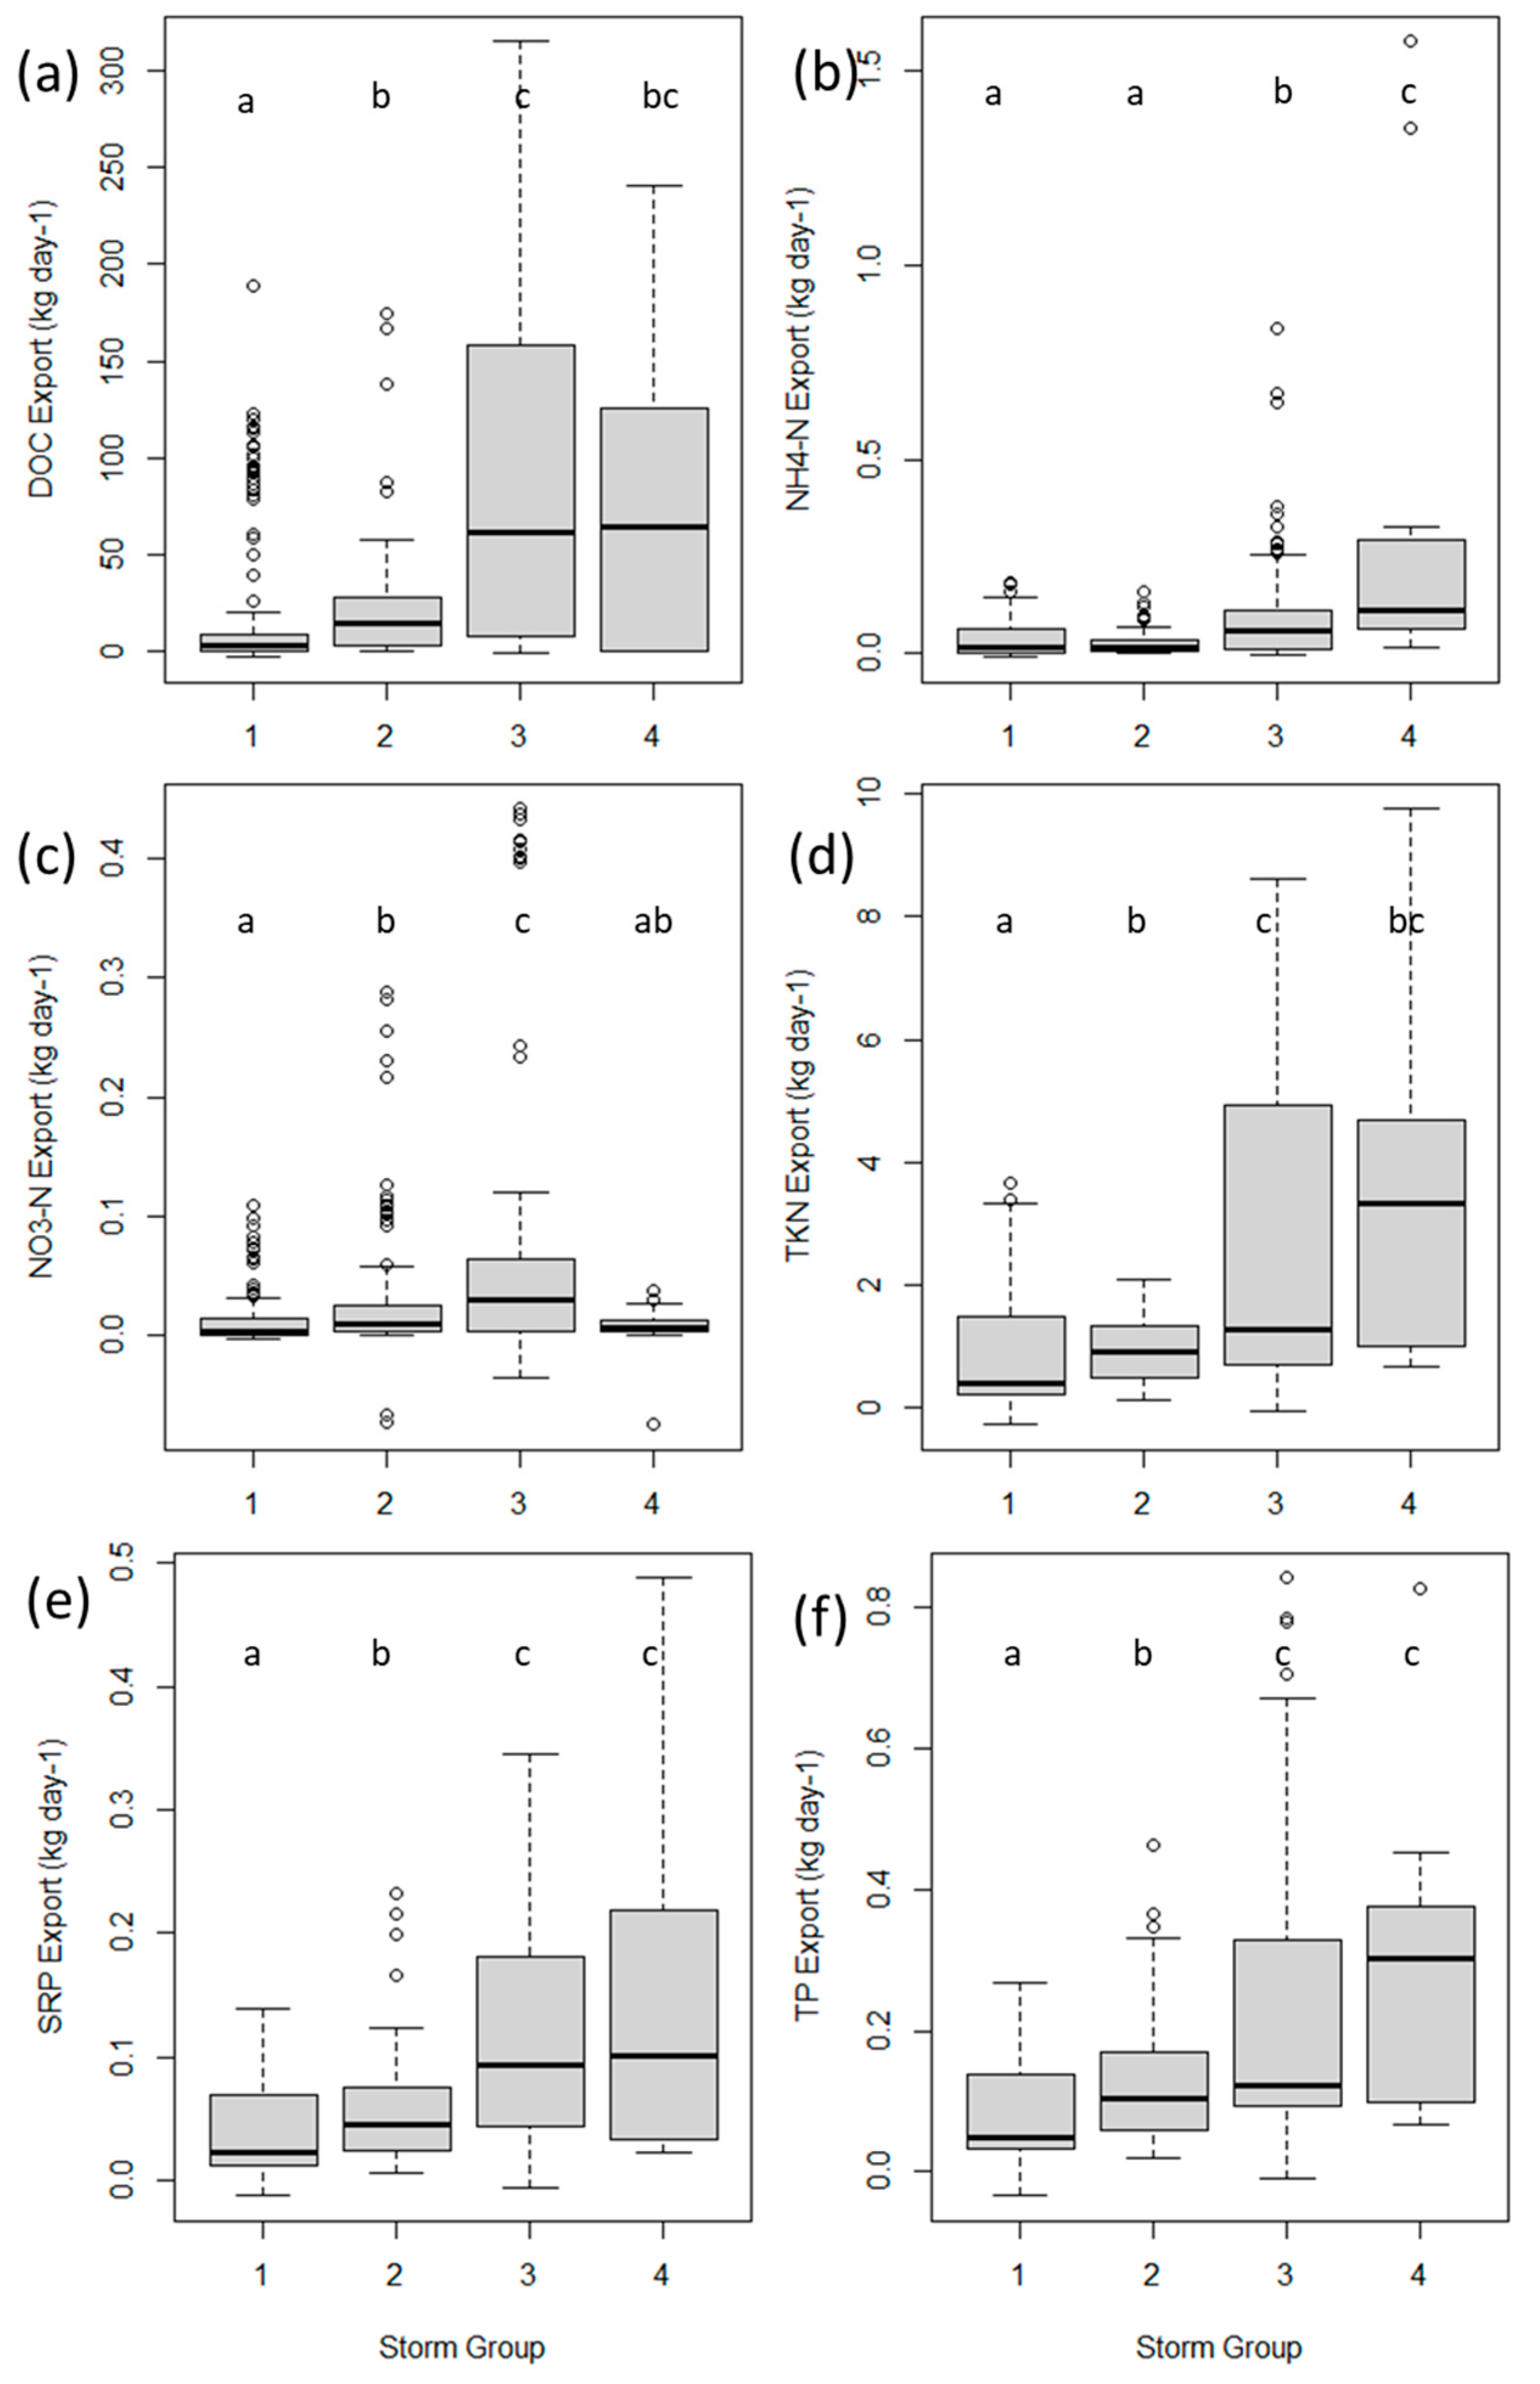
3.3. Storm Group Comparison

Trends were inconsistent when comparing the export of various analytes. DOC exports during hurricane months (storm group 4) were not significantly different than exports during intermediate and high-precipitation months (storm groups 2 and 3). However, DOC exports were significantly lower in low-precipitation months (storm group 1).
Nitrogen species export showed vastly different trends between storm groups, but phosphorus species were much more similar. TKN exports during hurricane months (storm group 4) were not significantly different than exports during intermediate and high-precipitation months (storm groups 2 and 3) (Table S1; Figure 3 and Figure 9a,d). NH3-N exports during hurricane months were significantly higher than all other months, while NO3-N exports were highest during non-hurricane, high-precipitation months (Figure 9b,c). SRP and TP exports were highest in both high-precipitation and hurricane months (Figure 9e,f).

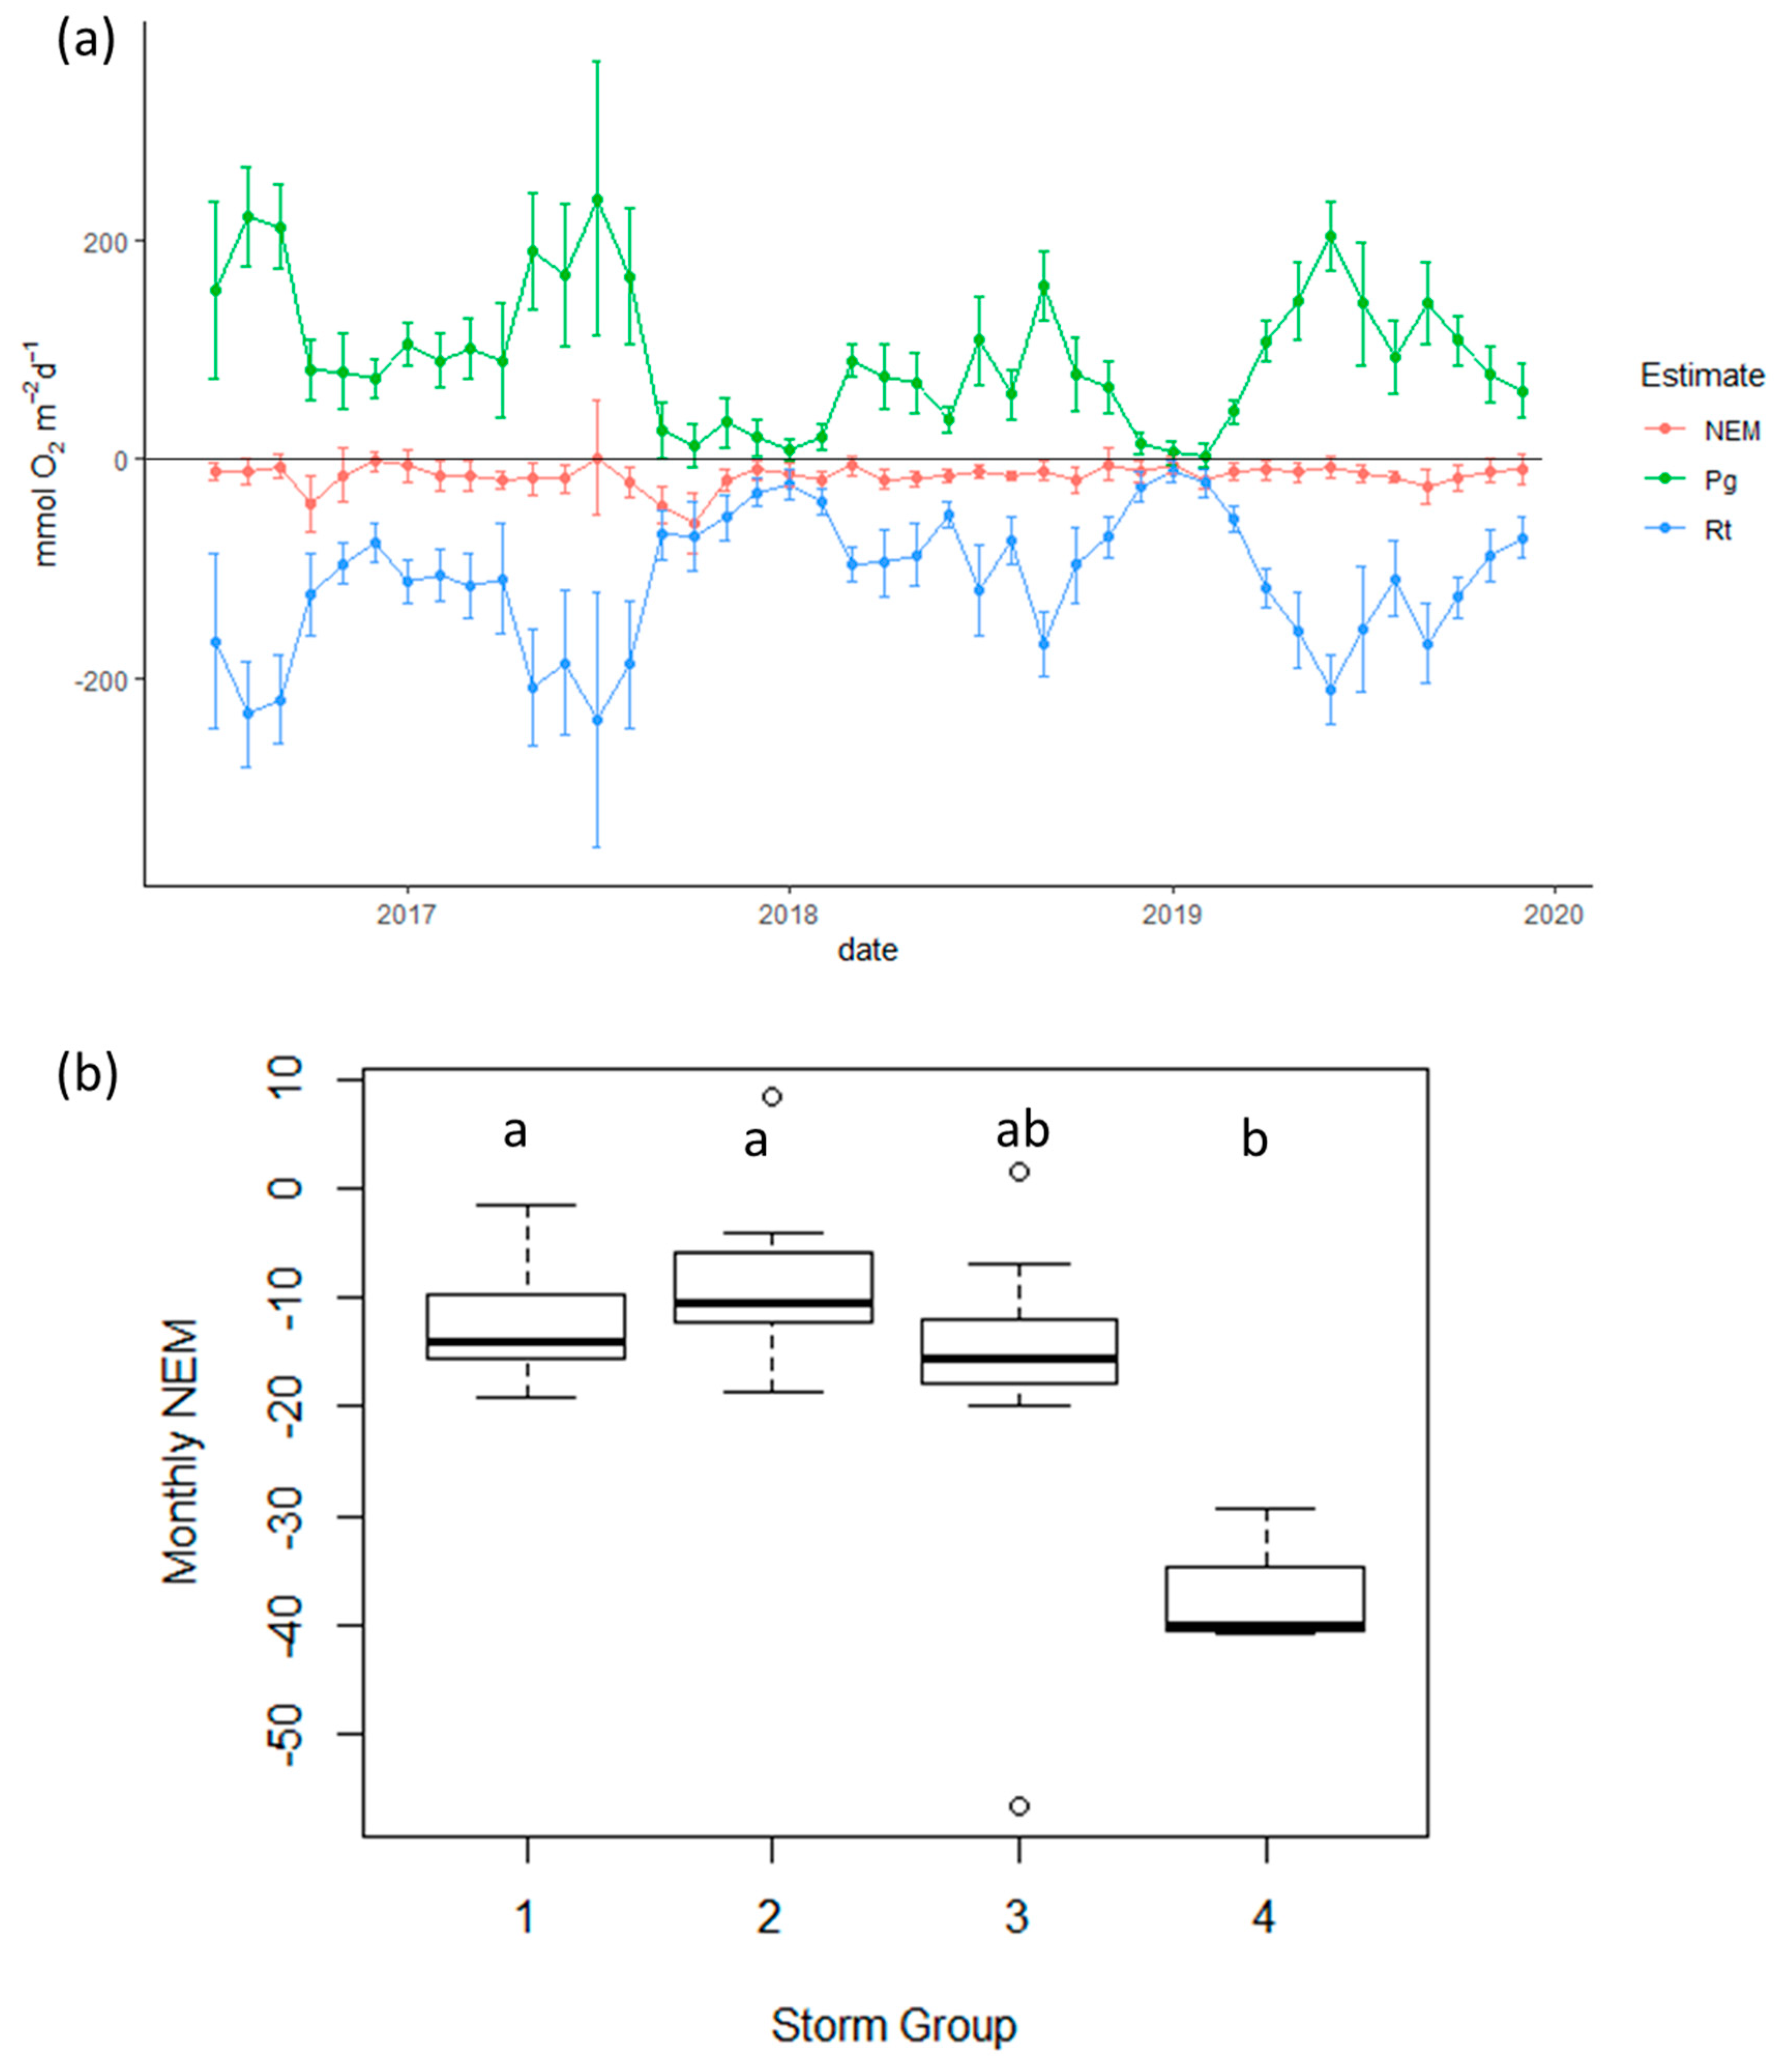
3.4. Ecosystem Metabolism

Generally, Pellicer Creek appears to be net heterotrophic, but each hurricane event caused a drop in NEM, increasing community respiration and decreasing gross primary production (Figure 10). Before Matthew in September 2016, average NEM = -6.4 mmol O2 m−2 day−1 and in October 2016 it dropped to −40 mmol O2 m−2 day−1. Before Irma in August 2017, average NEM = −20 mmol O2 m−2 day−1, but in September and October 2017, post Irma, NEM dropped to −41 mmol O2 m−2 day−1 (September) and −57 mmol O2 m−2 day−1 (October). Before Dorian in August 2019, NEM = −16 mmol O2 m−2 day−1 and it dropped to −29 mmol O2 m−2 day−1 in September.
The non-hurricane months showed similar averages and ranges in NEM (between −10 and −20 mmO2m−2day−1), but hurricane months had an average value and a range that was significantly lower (average = approx. −30; p = 0.033). Since the Kruskal–Wallis test indicated significant differences between some storm groups, a post-hoc Dunn test was run and a non-significant p-adjusted value of 0.5 was found between groups 1 and 2 (low and intermediate-precipitation months). However, a significant difference was found between hurricane months and the low and intermediate-precipitation months (1–4: p-value = 0.030, 2–4: p-value = 0.034).

4. Discussion

4.1. Organic Matter Export

Precipitation-driven runoff into Pellicer Creek is the largest driver of nutrient concentrations within the waterway (Figures S1 and S2). However, lag times for the export of organic matter from terrestrial to aquatic environments are extremely variable and the monthly sampling times were inadequate to determine a timeline between runoff and export of organic matter into Pellicer Creek [36,37]. A previous study conducted a meta-analysis on thirty forested watersheds that determined that mean annual stream yield from precipitation for the Eastern United States was 100 cm [15]. Therefore, it could be assumed that a significantly larger annual stream yield from precipitation could occur from runoff during years of hurricane influence, but again, this could not be directly calculated for this study. Precipitation drives organic matter into waterways, but river-mediated transport of carbon and nutrients is critical in exporting OM from high-order streams to the ocean.
Rivers, globally, transport 0.45 peta-grams OC yr−1 or 1.2 × 10⁹ kg OC day−1 to the ocean [38]. Pellicer Creek discharges less water and DOC when compared to larger Florida systems, with an average discharge of 1.16 m3s−1 for spring, 1.78 m3s−1 for summer, and 2.09 m3s−1 for fall, and exports an average of 38.9 kg DOC day−1 (spring), 62.6 kg DOC day−1 (summer), and 87.7 kg day−1 (fall). In comparison, Apalachicola Bay seasonally discharges 757 m3s−1 for spring, 441 m3s−1 for summer, and 272 m3s−1 for fall and exports 177,120 kg DOC day−1 (spring), 97,632 kg DOC day−1 (summer), and 56,160 kg DOC day−1 (fall) [39]. However, Pellicer Creek represents blackwater rivers, which are organic-rich waters and prolific feeders of larger coastal systems in the Southeastern United States [40,41]. Additionally, Pellicer Creek is only 5% developed and has been continuously monitored for a variety of parameters in the past 3–15 years, making it a model for a predominantly natural coastal Florida system.
Hurricanes, a relatively common occurrence in Florida, have the ability to drive the export of DOC and nutrients in natural and non-natural systems alike, rapidly pulsing a sizable percentage of annual export into aquatic systems [16,42]. A study on Hurricane Irene determined that 25–45% of annual carbon and 11–35% of annual nitrogen were exported from a forested watershed into the Esopus Creek in New York [42]. Another study of Hurricane Gustav determined that 24% of DOC, 1.7% of dissolved inorganic nitrogen, and 6% of phosphate yearly exports were transported downstream in the Pearl River in only 9 days [43]. A long-term (20-year) study discovered that wet hurricanes (hurricanes with high precipitation) export 21% DOC, 26% soluble reactive phosphorus (SRP), and 11% total nitrogen (TN) of long-term loads in the Neuse River Estuary in North Carolina [18]. Additionally, hurricanes in Puerto Rico were shown to increase riverine nitrogen by 297-times and riverine phosphorus by 306-times. This study, in addition to many other hurricane studies, indicated that the primary driver of these inputs is surface runoff from heavy precipitation [44,45]. In this study, Pellicer Creek exported 39% of annual average DOC, 180% annual average ammonia-N, 54% annual average ortho-phosphate, 48% annual average TKN, and 33% annual average nitrate during the month of Hurricane Irma (Table 2 and Table 3). Although differences in sampling methods make it difficult to compare studies directly, the high percentages of annual nitrogen species and SRP export are similar or higher than estimates from examples for other systems discussed above. Most hurricane nutrient transport is driven by “wet” hurricanes with high precipitation, whereas windy, dry hurricanes may not drive nutrient loading in coastal systems to the same extent [18]. In this study, September 2019 (Hurricane Dorian) only exported 3% yearly average DOC, 7% yearly average NH3-N, 4% yearly average phosphate, 5% yearly average TKN, and 1% yearly average NO3-N. These values are much lower than for other non-hurricane months and at least a degree of magnitude less than the month of Hurricane Irma, indicating substantial variability in hurricane impact, depending on intensity, proximity, antecedent conditions, etc.
Antecedent conditions pre-hurricane are predominately dependent on landscape saturation from summer storms in the months preceding hurricane impact. In the summer of 2016, before Hurricane Matthew, St. Augustine experienced a period of drought with fewer summer thunderstorms than average, creating dry terrestrial conditions and higher salinities in local waterways (Figure 4). On the contrary, the months preceding Hurricane Irma were rainy, saturating the upland systems, lowering salinity levels in the waterway. Since soil saturation will increase sheet-flow runoff from landscapes into streams and rivers, rainy summers, pre-hurricane Irma, aided in the spikes of carbon and nutrients in Pellicer Creek [46]. Additionally, Hurricane Irma’s storm surge pushed saline water into the previously fresh upper reaches of the creek, leaching additional ions from the soil in the rapid transition from fresh to saline water [47,48]. Since salinity in Pellicer Creek was already elevated pre-Matthew, it is less likely that this mechanism of ion release had an equivalent impact. Additionally, it is possible that Matthew’s approach of St. Augustine from the Atlantic led to a longer storm surge period, which can be seen by the heightened salinities and possibly by the lower nutrient values in comparison to Irma (Figure 2; Table 3). Irma approached from the western side of Florida and might have created a flashier storm surge, which led to the quick spike in salinity and higher nutrient exports than Matthew (Figure 2).
Hurricane Irma created a 1.3 m storm surge, causing saltwater to creep into the previously freshwater portion of the river [48]. The increased ionic strength of saltwater may have displaced or obstructed ions from ion exchange sites in soil, causing ammonium, phosphate, and other ions to desorb [49]. Desorbed ammonium, phosphate, and other ions were then added to the bioavailable nutrient pool within the water column. Due to higher exchangeable ammonium present in freshwater wetlands and waterways, salinization can release adsorbed ammonium from soils rapidly and increase water column ammonium concentrations within hours [47,50,51]. Due to the bioavailability of ammonium, ammonium desorption and diffusion into the water column can increase microbial processing, increasing biological oxygen demand and driving down DO concentrations [52]. Furthermore, microbial sulfate reduction becomes the dominant degradation pathway as salinity increases, in situ organic matter mineralization doubles, and additional nutrients are released into the water column, further increasing DOM concentrations [49].
In forested watersheds, it is estimated that 86% of DOC is exported during storm and snowmelt events [15]. A watershed in Maryland contributed 53% annual carbon export from storm events, totaling 1052 mm of precipitation in 2008, and 60% annual carbon export from storm events, yielding 1238 mm of precipitation in 2009. The same study produced similar estimates for hurricane years and calculated 972 mm of precipitation in 2010 (Hurricane Nicole) contributed 57% of yearly carbon export, and 1462 mm in 2011 (Hurricane Irene) contributed 76% annual export [11]. In Juneau, Alaska, storms between September 6–9 and 9–14 July produced 48 mm and 72 mm of precipitation, which exported 22–28% annual DOC and 31–37% annual DOC [53]. In comparison, the two largest storm/precipitation months from this study contributed 42% annual DOC export (May 2018) and 47% annual DOC export (August 2018). Although coarse estimates, these values are in line with other estimates and display the contributions of non-hurricane storm events to DOC export.

4.2. Evaluation of Ecosystem Metabolism

The export of DOC and other nutrients is vital to biogeochemical processing that is coupled with metabolic processes in streams and rivers [14]. A transition occurs between heterotrophic and autotrophic conditions moving downstream from headwaters to estuaries. Heterotrophic portions of waterways are dominated by allochthonous inputs and organisms that gain energy from organic matter consumption, whereas autotrophic zones are dominated by autochthonous organic matter added to the waterway by primary production [19,54]. Pellicer Creek is a 3–4 order predominantly heterotrophic stream, indicating high allochthonous inputs in that area of the river. A study on the Ogeechee River (another blackwater river in Georgia, USA) revealed that allochthonous inputs were the largest driver of stream metabolism, regardless of stream order [55]. Due to the coloration and high-DOM concentrations indicative of blackwater rives, it is understandable that heterotrophy tends to be prevalent in these systems. Rapid additions of organic matter during hurricane disturbance further decrease net ecosystem metabolism in Pellicer Creek (increasing the heterotrophic condition) (Figure 10). Net ecosystem metabolism was significantly lower in hurricane months than other time points in Pellicer Creek during the study interval, even though no significant differences were seen across export values (Figure 10b).
On a monthly timescale, no significant differences are seen in overall export, but the rapid pace of runoff into Pellicer Creek during a hurricane is much quicker than another storm event. A study in Cape Fear found that hurricanes multiplied organic matter inputs by three times, adding considerably more labile organic matter than runoff from other events and increasing biological oxygen demand [23]. Pellicer Creek experienced a similar phenomenon, and the rapid addition of TKN and ammonia-N (during Irma) into this nitrogen-limited system catalyzed microbial processing and further increased respiration rates [56]. A spike in community respiration resulted in a drop in net ecosystem metabolism that persisted in Pellicer Creek for up to 3–4 months (Figure 10a).
One additional factor in the initial decrease in NEM is rapidly increased turbidity that occurs during a hurricane event [48]. As turbidity increases, photo-synthetic organisms are out-shaded or potentially exported with increased discharge, as seen by the decrease in chl-a downstream after Hurricane Irma. Although high turbidity (up to 70 NTU) was only seen to persist for a couple of days after Hurricane Irma’s passage, it is possible that the turbidity spike aided in decreasing primary production initially [48].

5. Conclusions

On a monthly scale, no significant differences were found between the export of organic matter in hurricane months and months of low precipitation (<50 mm) or high precipitation (>150 mm). However, due to the more rapid inputs of nutrients during hurricanes, biological oxygen demand and turbidity drove down net ecosystem metabolism. Therefore, hurricanes do not affect nutrient export more than thunderstorms or nor’easters, but wet hurricanes can have a more significant and persistent effect on ecosystem metabolic characteristics. Biogeochemical cycling and ecosystem metabolism are tightly coupled processes that can be drastically altered by disturbance, calling for more extensive study of the relationship between these processes to better understand future shifts in rivers and estuaries as Earth’s climate and associated disturbance events continue to change.
This study involved some estimated values due to post-event analysis that increased the amount of potential error and limited the experimental design. Although, these methods and results were validated, studies on future hurricane and precipitation events might be able to reduce error and explore these events in a wider variety of systems, with regular monitoring and additional resources. Similar studies that compare a wide variety of sites would help to increase the understanding of the relationships between biogeochemical export and ecosystem metabolism, in order to comprehend how changes in storm severity and regularity might impact aquatic systems in the future.

Supplementary Materials

The following are available online at https://www.mdpi.com/article/10.3390/jmse10050661/s1, Figure S1: Precipitation overlaid with dissolved organic carbon and nitrogen species concentrations, Figure S2: Precipitation overlaid with phosphorus species concentrations. Table S1: Cumulative precipitation per month between June 2016 and December 2019.

Author Contributions

Conceptualization, T.S., K.R.R. and T.Z.O.; methodology, T.S., N.D. and S.D.; formal analysis, T.S.; investigation, T.S.; resources, N.D. and S.D.; writing—original draft preparation, T.S.; writing—review and editing, T.Z.O., K.R.R., N.D. and S.D.; supervision, T.Z.O. and K.R.R. All authors have read and agreed to the published version of the manuscript.

Funding

This research received no external funding.

Data Availability Statement

Gage data from this study site are publicly available from the United States Geological survey at https://waterdata.usgs.gov (accessed 15 October 2019), and water quality data from the Guana Tolomato National Estuarine Research Reserve are available at https://cdmo.baruch.sc.edu (accessed 15 October 2019).

Acknowledgments

Thank you to all Guana Tolomato Matanzas Estuarine Research Reserve staff that spent time and effort maintaining equipment and collecting water samples that were analyzed for this study. Thank you to Anna Thornton for assistance with editing and discussion, as well as Christine Angelini and Thomas Bianchi for their insight and advice on this topic.

Conflicts of Interest

The authors declare no conflict of interest.

References

  1. Edmiston, H.L.; Fahrny, S.A.; Lamb, M.S.; Levi, L.K.; Wanat, J.M.; Avant, J.S.; Wren, K.; Selly, N.C. Tropical Storm and Hurricane Impacts on a Gulf Coast Estuary: Apalachicola Bay, Florida. J. Coast. Res. 2008, 2008, 38–49. [Google Scholar] [CrossRef]
  2. Carey, R.O.; Wollheim, W.M.; Mulukutla, G.K.; Mineau, M.M. Characterizing Storm-Event Nitrate Fluxes in a Fifth Order Suburbanizing Watershed Using In Situ Sensors. Environ. Sci. Technol. 2014, 48, 7756–7765. [Google Scholar] [CrossRef] [PubMed]
  3. Morton, R.A.; Barras, J.A. Hurricane Impacts on Coastal Wetlands: A Half-Century Record of Storm-Generated Features from Southern Louisiana. J. Coast. Res. 2011, 275, 27–43. [Google Scholar] [CrossRef]
  4. Xi, W.; Peet, R.K.; Lee, M.T.; Urban, D.L. Hurricane Disturbances, Tree Diversity, and Succession in North Carolina Piedmont Forests, USA. J. For. Res. 2019, 30, 219–231. [Google Scholar] [CrossRef] [Green Version]
  5. Masson-Delmotte, V.; Zhai, P.; Pörtner, H.-O.; Roberts, D.; Skea, J.; Shukla, P.R.; Pirani, A.; Moufouma-Okia, W.; Péan, C.; Pidcock, R.; et al. Global Warming of 1.5 °C: An IPCC Special Report on the Impacts of Global Warming of 1.5 °C above Pre-Industrial Levels and Related Global Greenhouse Gas Emission Pathways, in the Context of Strengthening the Global Response to the Threat of Climate Change. Available online: https://www.ipcc.ch/ar6-syr/ (accessed on 1 October 2019).
  6. Emanuel, K. Increasing Destructiveness of Tropical Cyclones over the Past 30 Years. Nature 2005, 436, 686. [Google Scholar] [CrossRef]
  7. Dhillon, G.S.; Inamdar, S. Storm Event Patterns of Particulate Organic Carbon (POC) for Large Storms and Differences with Dissolved Organic Carbon (DOC). Biogeochemistry 2014, 118, 61–81. [Google Scholar] [CrossRef]
  8. Dhillon, G.S.; Inamdar, S. Extreme Storms and Changes in Particulate and Dissolved Organic Carbon in Runoff: Entering Uncharted Waters? Geophys. Res. Lett. 2013, 40, 1322–1327. [Google Scholar] [CrossRef]
  9. Zhang, J.Z.; Kelble, C.R.; Fischer, C.J.; Moore, L. Hurricane Katrina Induced Nutrient Runoff from an Agricultural Area to Coastal Waters in Biscayne Bay, Florida. Estuar. Coast. Shelf Sci. 2009, 84, 209–218. [Google Scholar] [CrossRef]
  10. Li, L.; He, Z.; Li, Z.; Zhang, S.; Li, S.; Wan, Y.; Stoffella, P.J. Spatial and Temporal Variation of Nitrogen Concentration and Speciation in Runoff and Storm Water in the Indian River Watershed, South Florida. Environ. Sci. Pollut. Res. 2016, 23, 19561–19569. [Google Scholar] [CrossRef]
  11. Majidzadeh, H.; Uzun, H.; Ruecker, A.; Miller, D.; Vernon, J.; Zhang, H.; Bao, S.; Tsui, M.T.K.; Karanfil, T.; Chow, A.T. Extreme Flooding Mobilized Dissolved Organic Matter from Coastal Forested Wetlands. Biogeochemistry 2017, 136, 293–309. [Google Scholar] [CrossRef]
  12. Felix, J.D.; Elliott, E.M.; Avery, G.B.; Kieber, R.J.; Mead, R.N.; Willey, J.D.; Mullaugh, K.M. Isotopic Composition of Nitrate in Sequential Hurricane Irene Precipitation Samples: Implications for Changing NOxsources. Atmos. Environ. 2015, 106, 191–195. [Google Scholar] [CrossRef]
  13. Iavorivska, L.; Boyer, E.W.; Grimm, J.W.; Miller, M.P.; DeWalle, D.R.; Davis, K.J.; Kaye, M.W. Variability of Dissolved Organic Carbon in Precipitation during Storms at the Shale Hills Critical Zone Observatory. Hydrol. Processes 2017, 31, 2935–2950. [Google Scholar] [CrossRef]
  14. Vannote, R.L.; Minshall, G.W.; Cummins, K.W.; Sedell, J.R.; Cushing, C.E. The River Continuum Concept. Can. J. Fish. Aquat. Sci. 1980, 37, 130–137. [Google Scholar] [CrossRef]
  15. Raymond, P.A.; Saiers, J.E. Event Controlled DOC Export from Forested Watersheds. Biogeochemistry 2010, 100, 197–209. [Google Scholar] [CrossRef]
  16. Chen, S.; Lu, Y.; Dash, P.; Das, P.; Li, J.; Capps, K.; Majidzadeh, H.; Elliott, M. Hurricane Pulses: Small Watershed Exports of Dissolved Nutrients and Organic Matter during Large Storms in the Southeastern USA. Sci. Total Environ. 2019, 689, 232–244. [Google Scholar] [CrossRef] [PubMed]
  17. Villa, J.A.; Mitsch, W.J.; Song, K.; Miao, S.L. Contribution of Different Wetland Plant Species to the DOC Exported from a Mesocosm Experiment in the Florida Everglades. Ecol. Eng. 2014, 71, 118–125. [Google Scholar] [CrossRef]
  18. Paerl, H.W.; Crosswell, J.R.; Van Dam, B.; Hall, N.S.; Rossignol, K.L.; Osburn, C.L.; Hounshell, A.G.; Sloup, R.S.; Harding, L.W., Jr. Two Decades of Tropical Cyclone Impacts on North Carolina’s Estuarine Carbon, Nutrient and Phytoplankton Dynamics: Implications for Biogeochemical Cycling and Water Quality in a Stormier World. Biogeochemistry 2018, 141, 307–332. [Google Scholar] [CrossRef]
  19. Odum, H.T. Primary Production in Flowing Waters. Limnol. Oceanogr. 1956, 1, 102–117. [Google Scholar] [CrossRef]
  20. Odum, E.P. Trends Expected in Stressed Ecosystems. BioScience 1985, 35, 419–422. [Google Scholar] [CrossRef]
  21. Hoellein, T.J.; Bruesewitz, D.A.; Richardson, D.C. Revisiting Odum (1956): A Synthesis of Aquatic Ecosystem Metabolism. Limnol. Oceanogr. 2013, 58, 2089–2100. [Google Scholar] [CrossRef]
  22. Caffrey, J.M. Production, Respiration and Net Ecosystem Metabolism U.S. Estuaries. Environ. Monit. Assess. 2003, 81, 207–219. [Google Scholar] [CrossRef] [PubMed]
  23. Avery, G.B.; Kieber, R.J.; Willey, J.D.; Shank, G.C.; Whitehead, R.F. Impact of Hurricanes on the Flux of Rainwater and Cape Fear River Water Dissolved Organic Carbon to Long Bay, Southeastern United States. Glob. Biogeochem. Cycles 2004, 18, GB3015. [Google Scholar] [CrossRef]
  24. Pinckney, J.L.; Paerl, H.W.; Tester, P.; Richardson, T.L. The Role of Nutrient Loading and Eutrophication in Estuarine Ecology. Environ. Health Perscpectives 2001, 109, 699–706. [Google Scholar]
  25. Bacopoulos, P. Tide-Surge Historical Assessment of Extreme Water Levels for the St. Johns River: 1928–2017. J. Hydrol. 2017, 553, 624–636. [Google Scholar] [CrossRef]
  26. Raymond, P.A.; Saiers, J.E.; Sobczak, W.V. Hydrological and Biogeochemical Controls on Watershed DOM Transport: Pulse-Shunt Concept. Ecology 2016, 97, 5–16. [Google Scholar] [CrossRef]
  27. Stewart, S.R. Hurricane Matthew; National Hurricane Center: Miami, FL, USA, 2016. [Google Scholar]
  28. Cangialosi, J.P.; Latto, A.S.; Berg, R. National Hurricane Center Tropical Cyclone Report; National Hurricane Center: Miami, FL, USA, 2018. [Google Scholar]
  29. NERR National Estuarine Research Reserve System- Centralized Data Management Office. Available online: https://cdmo.baruch.sc.edu (accessed on 15 October 2019).
  30. USGS National Water Information System: Web Interface. Available online: https://waterdata.usgs.gov/nwis/inventory/?site_no=02247222 (accessed on 15 October 2019).
  31. Kassambara, A. “ggplot2” Based Publication Ready Plots [R Package Ggpubr Version 0.4.0]. Available online: https://rdocumentation.org/packages/ggplot2/versions/3.3.3 (accessed on 19 May 2021).
  32. Wickham, H.; Francois, R.; Henry, L.; Muller, K. A Grammar of Data Manipulation [R Package Dplyr Version 1.0.6]. Available online: https://CRAN.R-project.org/package=dplyr (accessed on 19 May 2021).
  33. Beck, M.W. SWMPr: An R Package for Retrieving, Organizing, and Analyzing Environmental Data for Estuaries. R J. 2016, 8, 219–232. [Google Scholar] [CrossRef] [Green Version]
  34. Thébault, J.; Schraga, T.S.; Cloern, J.E.; Dunlavey, E.G. Primary Production and Carrying Capacity of Former Salt Ponds after Reconnection to San Francisco Bay. Wetlands 2008, 28, 841–851. [Google Scholar] [CrossRef] [Green Version]
  35. Ogle, D.; Wheeler, P.; Dinno, A. FSA: Fisheries Stock Analysis. Available online: https://fishr-core-team.github.io/FSA/ (accessed on 19 May 2021).
  36. Askew, A.J. Derivation of Formulae for Variable Lag Time. J. Hydrol. 1970, 10, 225–242. [Google Scholar] [CrossRef]
  37. Laurenson, E.M. A Catchment Storage Model for Runoff Routing. J. Hydrol. 1964, 2, 141–163. [Google Scholar] [CrossRef]
  38. Cole, J.J.; Prairie, Y.T.; Caraco, N.F.; McDowell, W.H.; Tranvik, L.J.; Striegl, R.G.; Duarte, C.M.; Kortelainen, P.; Downing, J.A.; Middelburg, J.J.; et al. Plumbing the Global Carbon Cycle: Integrating Inland Waters into the Terrestrial Carbon Budget. Ecosystems 2007, 10, 171–184. [Google Scholar] [CrossRef] [Green Version]
  39. Arellano, A.R.; Bianchi, T.S.; Osburn, C.L.; D’Sa, E.J.; Ward, N.D.; Oviedo-Vargas, D.; Joshi, I.D.; Ko, D.S.; Shields, M.R.; Kurian, G.; et al. Mechanisms of Organic Matter Export in Estuaries with Contrasting Carbon Sources. J. Geophys. Res. Biogeosci. 2019, 124, 3168–3188. [Google Scholar] [CrossRef]
  40. Mallin, M.A.; Mciver, M.R.; Ensign, S.H.; Cahoon, L.B. Photosynthetic and Heterotrophic Impacts of Nutrient Loading to Blackwater Streams. Ecol. Appl. 2004, 14, 823–838. [Google Scholar] [CrossRef] [Green Version]
  41. Meyer, J.L. A Blackwater Perspective on Riverine Ecosystems. BioScience 1990, 40, 643. [Google Scholar] [CrossRef]
  42. Yoon, B.; Raymond, P.A. Dissolved Organic Matter Export from a Forested Watershed during Hurricane Irene. Geophys. Res. Lett. 2012, 39, L18402. [Google Scholar] [CrossRef]
  43. Cai, Y.; Guo, L.; Wang, X.; Lohrenz, S.E.; Mojzis, A.K. Effects of Tropical Cyclones on River Chemistry: A Case Study of the Lower Pearl River during Hurricanes Gustav and Ike. Estuar. Coast. Shelf Sci. 2013, 129, 180–188. [Google Scholar] [CrossRef]
  44. Sun, J.; Wei, X.; Zhou, Y.; Chan, C.; Diao, J. Hurricanes Substantially Reduce the Nutrients in Tropical Forested Watersheds in Puerto Rico. Forests 2022, 13, 71. [Google Scholar] [CrossRef]
  45. Mok, J.S.; Kim, S.H.; Kim, J.; Cho, H.; An, S.U.; Choi, A.; Kim, B.; Yoon, C.; Thamdrup, B.; Hyun, J.H. Impacts of Typhoon-Induced Heavy Rainfalls and Resultant Freshwater Runoff on the Partitioning of Organic Carbon Oxidation and Nutrient Dynamics in the Intertidal Sediments of the Han River Estuary, Yellow Sea. Sci. Total Environ. 2019, 691, 858–867. [Google Scholar] [CrossRef]
  46. Kirkby, M.J. Do Not Only Connect: A Model of Infiltration-Excess Overland Flow Based on Simulation. Earth Surf. Processes Landf. 2014, 39, 952–963. [Google Scholar] [CrossRef] [Green Version]
  47. Herbert, E.R.; Boon, P.; Burgin, A.J.; Neubauer, S.C.; Franklin, R.B.; Ardón, M.; Hopfensperger, K.N.; Lamers, L.P.M.; Gell, P. A Global Perspective on Wetland Salinization: Ecological Consequences of a Growing Threat to Freshwater Wetlands. Ecosphere 2015, 6, 1–43. [Google Scholar] [CrossRef]
  48. Schafer, T.; Ward, N.; Julian, P.; Reddy, K.R.; Osborne, T.Z. Impacts of Hurricane Disturbance on Water Quality across the Aquatic Continuum of a Blackwater River to Estuary Complex. J. Mar. Sci. Eng. 2020, 8, 412. [Google Scholar] [CrossRef]
  49. Stumm, W.; Morgan, J.J. Aquatic Chemistry: Chemical Equilibria and Rates in Natural Waters; Wiley: Hoboken, NJ, USA, 1996; ISBN 0471511854. [Google Scholar]
  50. Weston, N.B.; Dixon, R.E.; Joye, S.B. Ramifications of Increased Salinity in Tidal Freshwater Sediments: Geochemistry and Microbial Pathways of Organic Matter Mineralization. J. Geophys. Res. Biogeosci. 2006, 111, G01009. [Google Scholar] [CrossRef] [Green Version]
  51. Ardón, M.; Morse, J.L.; Colman, B.P.; Bernhardt, E.S. Drought-Induced Saltwater Incursion Leads to Increased Wetland Nitrogen Export. Glob. Change Biol. 2013, 19, 2976–2985. [Google Scholar] [CrossRef] [PubMed]
  52. Mallin, M.A.; Corbett, C.A. How Hurricane Attributes Determine the Extent of Environmental Effects: Multiple Hurricanes and Different Coastal Systems. Estuaries Coasts 2006, 29, 1046–1061. [Google Scholar] [CrossRef]
  53. Fellman, J.B.; Hood, E.; Edwards, R.T.; D’Amore, D.V. Changes in the Concentration, Biodegradability, and Fluorescent Properties of Dissolved Organic Matter during Stormflows in Coastal Temperate Watersheds. J. Geophys. Res. 2009, 114, G01021. [Google Scholar] [CrossRef]
  54. Webster, J.R. Spiraling down the River Continuum: Stream Ecology and the U-Shaped Curve. J. N. Am. Benthol. Soc. 2007, 26, 375–389. [Google Scholar] [CrossRef]
  55. Meyer, J.L.; Edwards, R.T. Ecosystem Metabolism and Turnover of Organic Carbon along a Blackwater River. Ecology 1990, 71, 668–677. [Google Scholar] [CrossRef]
  56. Dix, N.G.; Phlips, E.J.; Gleeson, R.A. Water Quality Changes in the Guana Tolomato Matanzas National Estuarine Research Reserve, Florida, Associated with Four Tropical Storms. J. Coast. Res. 2008, 55, 26–37. [Google Scholar] [CrossRef] [Green Version]
Figure 1. (a) Photograph of Pellicer Creek study site. (b) Map of study site located on a dock in Faver-Dykes State Park in St. Augustine, FL, (c) and accompanying inset map of hurricane tracks for Hurricanes Matthew (blue), Hurricane Irma (red), and Hurricane Dorian (green).
Jmse 10 00661 g001
Figure 2. Linear regression between monthly discharge and precipitation used to estimate discharge for Hurricane Matthew based on precipitation value of 142 mm (33.8 m3 s−1).
Jmse 10 00661 g002
Figure 3. Histogram created from the distribution of monthly precipitation values. The 1, 2, 3 indicate the low (1), intermediate (2), and high (3) storm groups that were created for statistical analysis. Hurricane months (4) were excluded from the histogram since they were analyzed as a separate group.
Jmse 10 00661 g003
Figure 4. Wind speed (red line), total precipitation (blue dashed line), and salinity (black dashed line) collected by the GTMNERR meteorological station (NEERS 2019) at the study site during (a) Hurricane Matthew, (b) Hurricane Irma, and (c) Hurricane Dorian. * indicates the time in which the peak (eye) of the hurricane was at its closest point to St. Augustine.
Jmse 10 00661 g004
Figure 5. Dissolved organic carbon export from Pellicer Creek from July 2016 to September 2019. Points represent average export and error bars indicate one standard deviation. The letters indicate the three hurricanes that impacted Pellicer Creek during this study, M = Matthew, I = Irma, and D = Dorian. The shaded region represents the modelled data that used estimates of discharge to calculate export during the period when the USGS stream gage was not maintained.
Jmse 10 00661 g005
Figure 6. (a) Total Kjeldahl nitrogen export and (b) ammonia-N and nitrate-N export from Pellicer Creek from July 2016 to September 2019. Points represent average export and error bars indicate one standard deviation. The letters indicate the three hurricanes that impacted Pellicer Creek during this study, M = Matthew, I = Irma, and D = Dorian. The shaded region represents the modelled data that used estimates of discharge to calculate export during the period when the USGS stream gage was not maintained.
Jmse 10 00661 g006
Figure 7. Soluble reactive phosphorus and total phosphorus export from Pellicer Creek from July 2016 to September 2019. Points represent average export and error bars indicate one standard deviation. The letters indicate the three hurricanes that impacted Pellicer Creek during this study, M = Matthew, I = Irma, and D = Dorian. The shaded region represents the modelled data that used estimates of discharge to calculate export during the period when the USGS stream gage was not maintained.
Jmse 10 00661 g007
Figure 8. Export compared between Hurricanes Matthew, Irma, and Dorian for (a) DOC, (b) TKN, (c) nitrate and ammonia-N, and (d) SRP and TP. Estimated values for Hurricanes Irma and Matthew were also calculated and compared as validation for the estimated values calculated for Hurricane Matthew.
Jmse 10 00661 g008
Figure 9. Export in kg day−1 of (a) dissolved organic carbon, (b) ammonia-N, (c) nitrate-N, (d) total kjeldahl nitrogen, (e) soluble reactive phosphorus, and (f) total phosphorus compared in box plots between the four storm groups from Pellicer Creek. Letters represent significant differences found by Kruskal-Wallis and Dunn post-hoc statistical tests.
Jmse 10 00661 g009
Figure 10. (a) Net ecosystem metabolism (NEM) and associated characteristics gross primary production (Pg), and ecosystem respiration (Rt) in Pellicer Creek from July 2016–December 2019. M, I, and D represent the passage of Hurricanes Matthew, Irma, and Dorian. (b) Net ecosystem metabolism divided into storm groups and displayed as a box plot showing averages and range of data. Kruskal–Wallis test with p-values corrected by the Benjamini–Hochberg method and Dunn post-hoc test with α = 0.5 was used to determine significant differences between groups as represented by lowercase letters.
Jmse 10 00661 g010
Table 1. Precipitation, wind speed, and storm surge measurements for St. Augustine, FL, during Hurricanes Matthew, Irma, and Dorian.
HurricaneApprox. Cumulative Precip. (cm)Max Wind Speed (m s−1)Sustained Wind Speed (m s−1)Storm Surge (m)Source
Matthew34.538.629.31.6[27]
Irma25.9637.430.41.3[28]
Dorian5.626.420.60.93[29]
Table 2. Summary of precipitation (month), concentration, and standard deviation (SD) of DOC, NH3-N, TKN, NO3-N, SRP, and TP collected in Pellicer Creek during the months of Hurricanes Matthew, Irma, and Dorian, and during the six highest precipitation events.
Concentration (mg L−1)
HurricanesP (mm)DOCSDNH3-NSDTKN SDNO3-NSDSRPSDTPSD
Matthew142318.40.0320.0310.530.160.0050.0020.0530.0130.370.05
Irma2843200.1950.0211.300.000.0240.0000.0630.0030.830.00
Dorian112214.80.0590.0260.950.080.0060.0020.0340.0060.0930.01
High Precipitation
June 2017231110.60.0600.0370.910.060.0040.0000.0910.0200.110.01
August 2017179112.00.0510.0390.800.130.0110.0050.0660.0210.110.01
October 2017236376.20.0700.0351.240.230.0100.0050.0500.0100.400.33
May 2018164411.20.0190.0091.230.080.0170.0030.0470.0030.620.11
June 2018185376.60.0270.0081.250.080.0200.0040.0430.0030.310.04
August 201815740.60.0110.0051.150.070.0110.0030.0360.0040.400.06
Table 3. Estimation of % average annual export of DOC, NH3-N, TKN, NO3-N, and SRP from the hurricane and highest precipitation months.
Storm/MonthDOCNH3-NSRPTKNNO3-N
October 2016 (Matthew)14.325.217.016.72.6
September 2017 (Irma)39.0180.854.048.232.8
September 2019 (Dorian)3.36.83.84.61.0
June 20171.25.27.13.10.5
August 20171.86.27.53.92.1
October 201727.541.025.622.09.3
May 201841.815.333.738.519.1
June 201822.912.818.423.414.0
August 201846.79.227.838.413.2
Publisher’s Note: MDPI stays neutral with regard to jurisdictional claims in published maps and institutional affiliations.

