Article

Filtration Rates and Scaling in Demosponges

by
Hans Ulrik Riisgård
1,* and
Poul S. Larsen
2
1
Marine Biological Research Centre, University of Southern Denmark, 5300 Kerteminde, Denmark
2
Department of Mechanical Engineering, Technical University of Denmark, 2800 Lyngby, Denmark
*
Author to whom correspondence should be addressed.
J. Mar. Sci. Eng. 2022, 10(5), 643; https://doi.org/10.3390/jmse10050643
Submission received: 29 March 2022 / Revised: 2 May 2022 / Accepted: 6 May 2022 / Published: 8 May 2022
(This article belongs to the Special Issue Filter-Feeding in Marine Invertebrates)

Abstract

:
Demosponges are modular filter-feeding organisms that are made up of aquiferous units or modules with one osculum per module. Such modules may grow to reach a maximal size. Various demosponge species show a high degree of morphological complexity, which makes it difficult to classify and scale them regarding filtration rate versus sponge size. In this regard, we distinguish between: (i) small single-osculum sponges consisting of one aquiferous module, which includes very small explants and larger explants; (ii) multi-oscula sponges consisting of many modules, each with a separate osculum leading to the ambient; and (iii) large single-osculum sponges composed of many aquiferous modules, each with an exhalant opening (true osculum) leading into a common large spongocoel (atrium), which opens to the ambient via a static pseudo-osculum. We found the theoretical scaling relation between the filtration rate (F) versus volume (V) for (i) a single-osculum demosponge to be F = a3V2/3, and hence the volume-specific filtration rate to scale as F/VV−1/3. This relation is partly supported by experimental data for explants of Halichondria panicea, showing F/V = 2.66V−0.41. However, for multi-oscula sponges, many of their modules may have reached their maximal size and hence their maximal filtration rate, which would imply the scaling F/V ≈ constant. A similar scaling would be expected for large pseudo-osculum sponges, provided their volume was taken to be the structural tissue volume that holds the pumping units, and not the total volume that includes the large atrium volume of water. This may explain the hitherto confusing picture that has emerged from the power-law correlation (F/V = aVb) of many various types of demosponges that show a range of negative b-exponents. The observed sharp decline in the volume-specific filtration rate of demosponges from their very small to larger sizes is discussed.

1. Introduction

There are nearly 9500 living species of sponges, and the class of demosponges contains 82% of all sponge species [1]. All demosponges are modular filter-feeding organisms that are made up of aquiferous units or modules with one osculum per module [2,3]. The many different species of demosponges show a high degree of morphological complexity [4]. Therefore, they are not easy to classify and scale regarding basic features, such as filtration rate versus sponge size. In the present study, we distinguish between: (i) small single-osculum single-module sponges consisting of one aquiferous module, which includes very small [5] and larger explants [6] (Figure 1); (ii) multi-oscula multi-modular sponges consisting of many aquiferous modules each with a separate osculum leading to the ambient, which could be small explants [7] or larger sponges, such as Halichondria panicea [8,9,10]; and (iii) large single-osculum multi-modular sponges (or large single-pseudo-osculum sponges) composed of many aquiferous modules each with an exhalant opening (true osculum) leading to a common large spongocoel (atrium), which opens to the ambient via a static pseudo-osculum, such as Xestospongia muta [11,12]. A contraction of the true oscula in the atrial lining of Verongia gigantea was described by [13] and only “very small specimens” with a body volume <200 mL were able to occlude the joint pseudo-osculum.
Single-osculum and multi-oscula sponges have contraction–inflation behavior, including the closure and opening of the osculum; furthermore, in these sponges, the speed of the exhalant jet correlates to the size of the osculum [5,6,14]. Here, [6] suggested the following theoretical allometric scaling parameters for the osculum jet speed (U), osculum cross-sectional area (OSA), and pumping rate (=filtration rate, F) could be expressed as:
U = a1OSAb1; b1 = 1/2
F = a2OSAb2; b2 = 3/2
These scaling parameters, which rely on the suggested uniform density of pumping units (choanocyte chambers), were found to agree with the measurements on both single-osculum explants [6] and multi-oscula explants of Halichondria panicea [7]. However, to examine how the theoretical scaling relationships applies to larger sponges, [15] measured in situ the filtration rate of 20 sponge species and found that their results showed “an opposite trend of an allometric decrease in U with OSA for two-thirds (12 out of 18) of the species”, and they concluded that the allometric scaling parameters did not apply to large sponges with “fully open and static oscula”, but only to small explants that “dynamically constrict and expand their oscula” [15] found that their data showed a different scaling than that of Equations (1) and (2), because the decrease in volume-specific pumping rate with increasing sponge size for the larger sponges indicated that the density of choanocyte chambers decreases with increasing sponge volume.
To help in the understanding of the allometric data correlations [16], the compiled available data on the volume-specific filtration rate (F/V) versus sponge volume (V) approximated as F/VVb in demosponges, but the observed large and confusing variations could not be immediately explained. Therefore, an important aspect of the present study is to clear up this situation. It is our hypothesis that F/V versus V of (i) single-osculum single-module demosponges decreases with increasing size, while it remains essentially constant for (ii) multi- and (iii) single-oscular multi-modular demosponges, provided that volume is considered to be that of structural sponge tissue, which, again, is proportional to the sponge dry weight.
Here, we first examine the scaling relation between the filtration rate and body volume in (i) single-osculum single-module explants before we compare it with scaling in (ii) multi-oscular multi-modular sponges. Next, we examine if (iii) a large single-osculum multi-modular sponge may be regarded as a population of modules that share the characteristics of single-osculum explants, or if such sponges have different scaling characteristics. Finally, we discuss how to arrive at a better understanding of specific filtration rates in demosponges. We arrive at the classification of demosponges from the concept of “modules”, which is then used in the scaling of the filtration rates.

2. Materials and Methods

We used published data on single-osculum sponge explants consisting of one aquiferous module of various sizes obtained from colonies of the demosponge Halichondria panicea. Branches of the collected sponges were either cut into very small pieces without an osculum [5] or in fragments of various sizes with a single osculum [6]. The cut-off pieces were individually fixed with whipping twine on substrate plates in flowing seawater and were allowed to develop into explants over a couple of weeks, which reorganized their elements of the aquiferous system [3] in such a way that each osculum cross-sectional area (OSA) became adjusted to the size (volume, V) of the individual sponge explant. The experimental data obtained for these explants at 15 °C were used to scale the filtration rate with the size of the sponge module. Due to the very low volume-specific filtration rates in the single-osculum explants reported by [7], we suggest that these explants may not have been fully reorganized, and therefore not used in the present study. Power-function regression curves (LM) were fitted the in [17] for growth rate estimates, based on the sponge body volume over time.

3. Results and Discussion

In the present study, the scaling relation between the filtration rate and volume of single-osculum explants is presented and compared with scaling in multi-oscular sponges. The findings are discussed in order to obtain a better understanding of how to deal with specific filtration rates in demosponges.

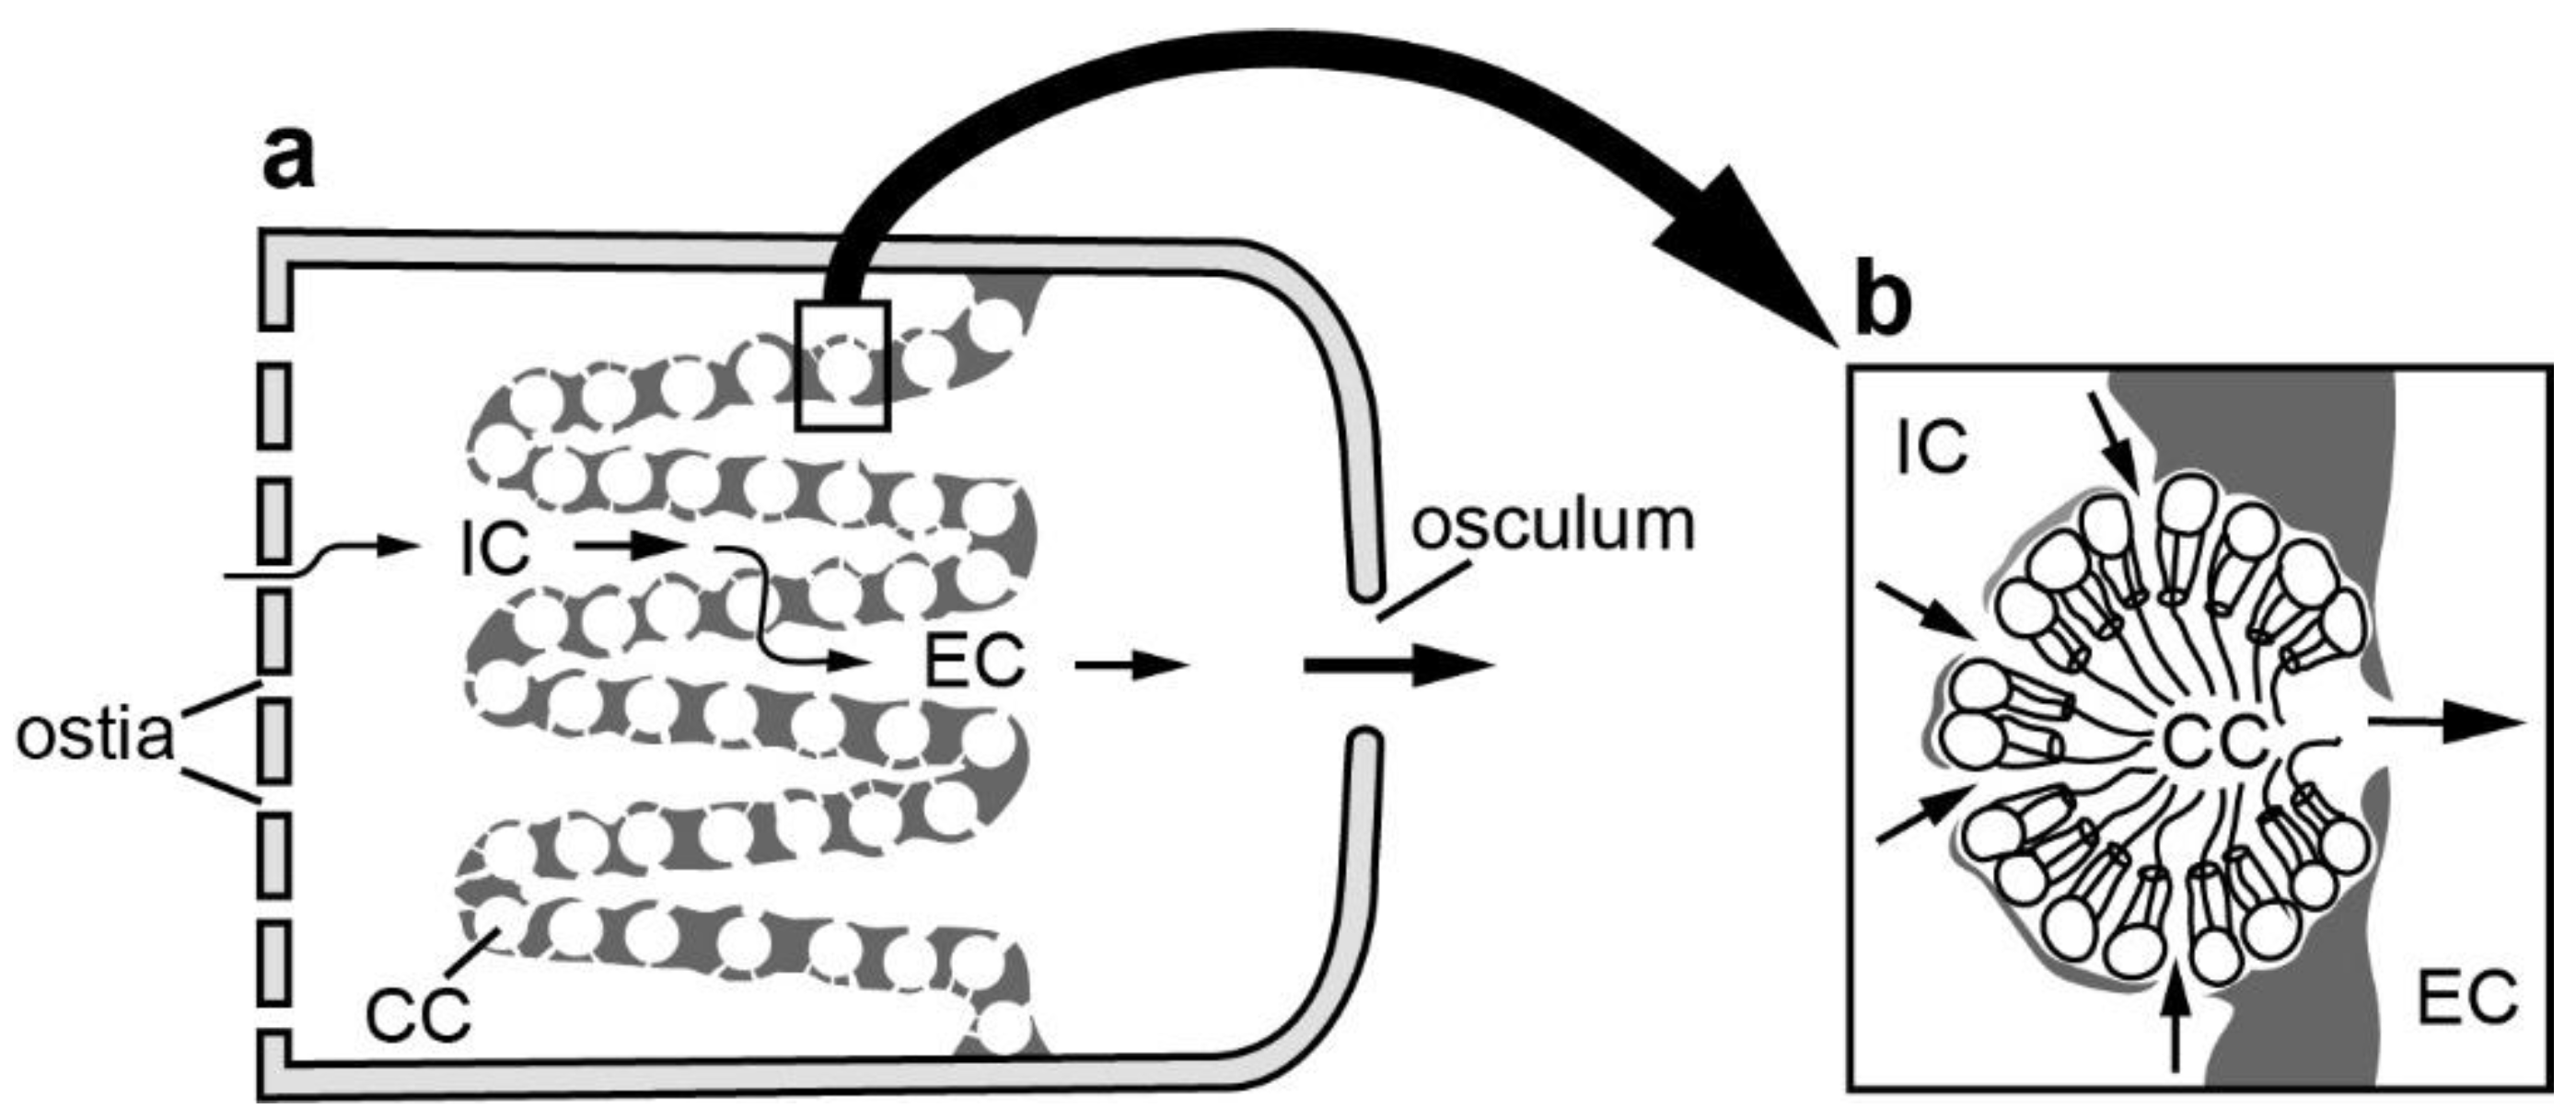
3.1. Scaling in Single-Osculum Single-Module Demosponges

A scaling relation between the water-pumping rate and sponge-body volume may be derived by considering a single inhalant canal of length L in a single-osculum demosponge (Figure 1). The thin wall separating the tapered inhalant and exhalant canal system is for a great part (30% to 50%) made up of water-pumping choanocyte chambers with a diameter of approximately 30 µm embedded in mesenchyme. The pumping rate (=filtration rate, F) from these chambers is proportional to the product of pumping rate (FCC) of each choanocyte chamber and their number, which is proportional to the wall area (~L2) of the canal, i.e., FL2, and the sponge volume associated with canals and walls would scale as V ~ L3 for the isometric growth. It follows that F ≈ (V1/3)2 and thus:
F = a3Vb3; b3 = 2/3
Hence, the volume-specific filtration rate would scale as F/V = V2/3−1 = V−1/3, which indicates a decrease with increasing sponge volume. This scaling may be expected to apply when a small single-osculum sponge grows bigger. Thus, [5] measured the filtration rate in 15 small single-osculum Halichondria panicea explants of the same size (V = 0.018 mL) and found that the mean filtration rate was F = 0.28 ± 0.06 mL min−1, which indicates a volume-specific filtration rate of F/V = 0.28/0.018 = 15.6 min−1, thus showing that the explant filters an amount of water that is equivalent to 15.6 times its body volume per min. Using Equation (3) F = a3V2/3 the filtration rate (F, mL min−1) versus sponge body volume (V, mL) can be predicted to be F = 3.97V2/3 because a3 = F/V2/3 = 0.28/0.0182/3 = 3.97 and consequently caused the volume-specific filtration rate to be F/V = 3.97V2/3−1 = 3.97V−1/3. The predicted F/V versus V is depicted in Figure 2. Furthermore, [5] measured F/V in a number of single-osculum H. panicea explants with various body sizes (V = 0.018 to 1.977 mL), which are also shown in Figure 2. It can be observed that the model-predicted curve describes the experimental data fairly well. Another example of a single aquiferous module is the sponge branch cut from a colony of Haliclona urceolus [9], for which F = 6 mL min−1 and V = 1.726 mL was measured. These results lead to F/V = 3.48 min−1 and in are good agreement with the foregoing example, which implies a3 = F/V2/3 = 4.17. Furthermore, the regression analysis of the measured filtration rate and size of 8 H. urceolus specimens [8] produced F/V = 3.96V−0.39. Likewise, the exponent (b3 = 0.59) for the power function regression line for F versus V for the same data is close to the model-predicted (Equation (1)) b3 = 0.66 (Figure 3). We should add that the same results from [6] were shown in [7], where, we as co-authors, erroneously assume the linear scaling relation F = aV now replaced by F = 2.66 V0.59. The same mistake was made in [7].
An aquiferous module is “a certain volume in the sponge that is supplied by a system of choanocyte chambers and aquiferous canals associated with a single osculum. Therefore, a sponge represents a modular organism” [18]. A demosponge, such as Halichondria panicea consists of multiple modules, each with an osculum (Figure 4). If a module is only able to grow until it has obtained a certain volume, most of the whole modular sponge organism will consist of full-grown modules with a near similar F/V ratio. Therefore, the F/V ratio of a growing multi-oscula sponge in which most of the modules are full-grown should be expected to also be constant. Thus, the present scaling, Equation (3) only applies when a small single-osculum sponge—or an aquiferous module—grows larger.

3.2. Scaling in Multi-Oscula Multi-Modular Demosponges

To our knowledge, the first attempt to outline the size and number of aquiferous modules in a multi-oscular sponge was made by [7] in explants of branching Halichondria panicea. Here, the boarders of each module were identified through observations of incurrent and excurrent water flow using fluorescein deposited on the sponge surface (exopinacoderm) using a micromanipulator, and subsequently the volume (Vmod) of each module was measured by cutting along the borders and weighing the module. Because the modules were not growing, a plot of F/V versus V showed no trend, i.e., F/V = constant, and for modules of sizes between 0.5 and 2.7 mL, the mean F/V was found to be 1.2 ± 0.8 min−1 [7]. Similar studies in other multi-oscula multi-modular demosponges are awaiting in order to verify if F/V ~ constant.

3.3. Scaling in Single-Osculum Multi-Modular Demosponges

Many large tropical single-osculum sponges are composed of many modules, each with a true osculum that opens into a common spongocoel (atrium), which opens to the ambient water via a fully open motionless pseudo-sculum. Here, Aplysina lacunosa may serve as an example of a typically large tropical species, which has a tubular shape with a large pseudo-osculum on top [19]. Another example is Verongia gigantea in which the (pseudo)osculum becomes unable to occlude when the diameter becomes greater than about 15 mm, whereas the atrial wall with true oscula shows periodic cessation [13].
For clarity, when dealing with multi-oscular sponges, we define “structural volume Vstr” as that of the sponge-tissue structure that excludes any large spongocoel (atrium cavity), while the “total volume Vtot” of a sponge includes the atrium. Here, Vstr may be expected to be proportional to the dry weight of sponge tissue, W. Small single-osculum explants have no large atrium, just exhalant canals that join to one canal leading to the osculum; therefore, here, there is no significant difference between the 2 volumes. Likewise, in a multi-oscular sponge, such as Halichondria panicea, each module has its own osculum. However, for large vase, jar, urn- or tube-shaped sponges, the 2 volumes may be quite different, as it appears from the following.
In [11], it was found that the relationship between the spongocoel volume (Vspongo) and total sponge volume (Vtot) could be described by the following allometric equation: Vspongo = αVtot1.214 where the exponent β = 1.214 indicates that the relative volume of the spongocoel may increase by as much as 20 to 25% for sponge sizes of 50 to 200 L for the total volume of Xestospongia muta. Other β-exponents may apply for other large sponge species with a spongocoel of various shapes, and therefore a scaling of F/V in one sponge species may not apply to another species. Furthermore, [15,20] found in some twenty sponge species that the F/V ratio decreases with increasing Vtot calculated from photos, including the spongocoel. Here, it is noteworthy that [21] excluded the spongocoel (“atrial cavity”) when the field sizes of the three demosponges Mycale sp., Verongia gigantea, and Tethya crypta, were determined, in which the tissue-volume specific filtration rate was found to be constant, independent of the sponge body size [22]. This trend of constancy is the same as the above suggestion that the F/V ratio of a multi-oscular sponge tends to be constant because all the modules that build up the sponge body are not growing and/or of comparable size with a comparable F/V ratio.
Determining the “flux per unit sponge tissue” for 14 species, [23] found volume-specific filtration rates that were also essentially constant, b = 0.045. Data by [24] shows that 24 to 27 °C leads to b = –0.071 for Cinachyrella cf. cavernose, while including their data at 30 to 33 °C leads to b = 0.23, which suggest an increase in their size rather than a decrease, which is difficult to explain.
For five Mediterranean sponge species, [20] determined exponents b4 and b5 in the correlations W ~ Vtotb4 and F ~ Vtotb5 from which we calculated the exponent b6 = b5/b4 − 1 in F/W ~ W b6 as the values of b6 = −0.63, −0.10, −0.17, −0.13, and −0.42. The near-zero value of b6 for three of the sponges (Crambe crambe, Petrosia ficiformis, and Chondrosia reniformis) suggest that they have a nearly constant weight-specific filtration rate. This example shows that an increasing fraction of the sponge volume in these types of sponges is made up of canals with water. Therefore, for these types of sponges, specific filtration rates should be based on the dry weight (W), in which case, the specific filtration rates appear to be nearly independent of size in this sense.
Although many big vase-, jar-, urn-, or barrel-type sponges have only one common exhalant opening (pseudoosculum), these sponges cannot be directly compared to single-osculum modules because a large (unknown) number of modules enter into, e.g., a giant barrel sponge and because, possibly, the majority of these modules have grown to their maximum size. In the study of allometry and scaling of sponges, it appears to be essential to distinguish between types of sponges as described in Section 1, Section 2 and Section 3, and specifically employ the structural volume in F/V. However, F/W versus W (or biomass, AFDW) for the same species would probably show that F/W = constant.
As can be observed from the literature, there is a considerable interest in estimating the grazing impact from observed populations of given species of sponges at a given site. This has led to the much data on the filtration rate versus size in terms of the volume of various species of demosponges summarized by [16], who compiled available data on volume-specific filtration rate (F/V) versus sponge volume (V) approximated as F/V = aVb in demosponges. However, the observed variations were large and confusing and could not be immediately explained. However, the present assessment should help to clarify the situation. The scaling represented by Equation (3) does not apply for multi-oscula multi-modular sponges and single-osculum multi-modular demosponges, which explains the confusing picture of the species shown in Figure 1 of [16], in which all the various types of demosponge species have been shown together and approximated by the power-law F/V = aVb1−1 = aVb, where b ~ 0 when b1 is close to 1, but without a more precise definition of V (i.e., sponge-body volume with or without spongocoel).

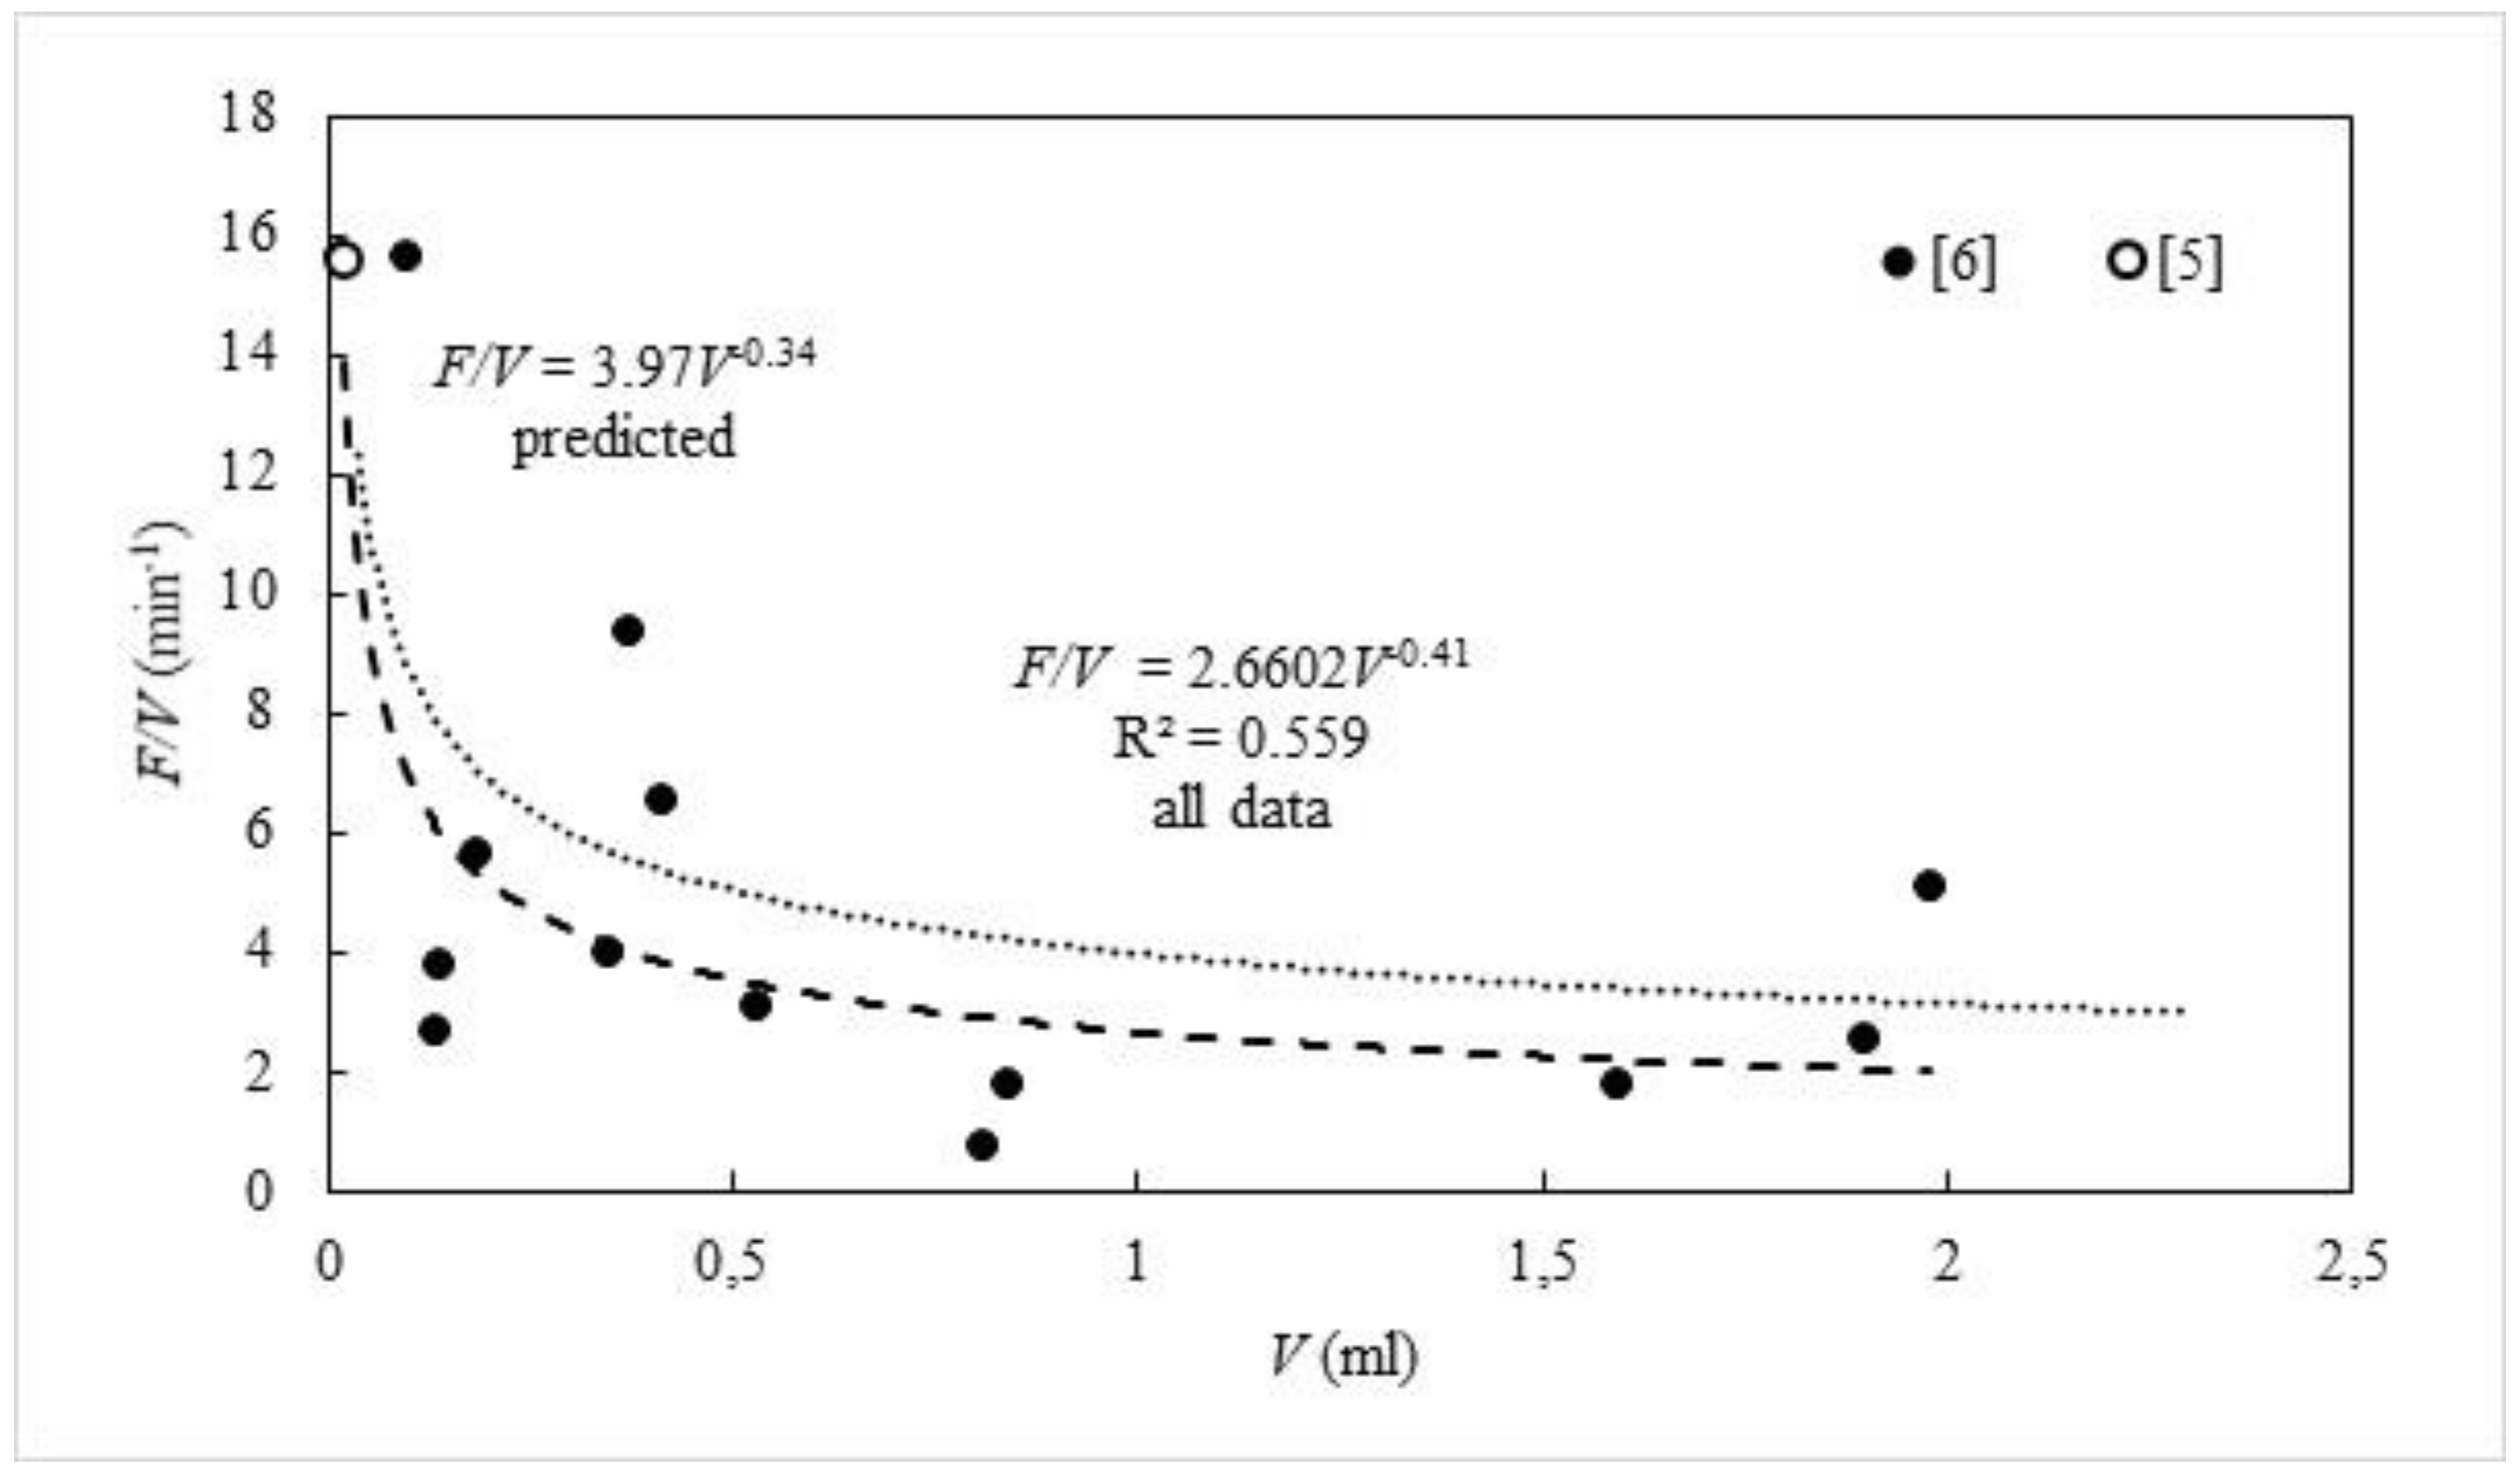
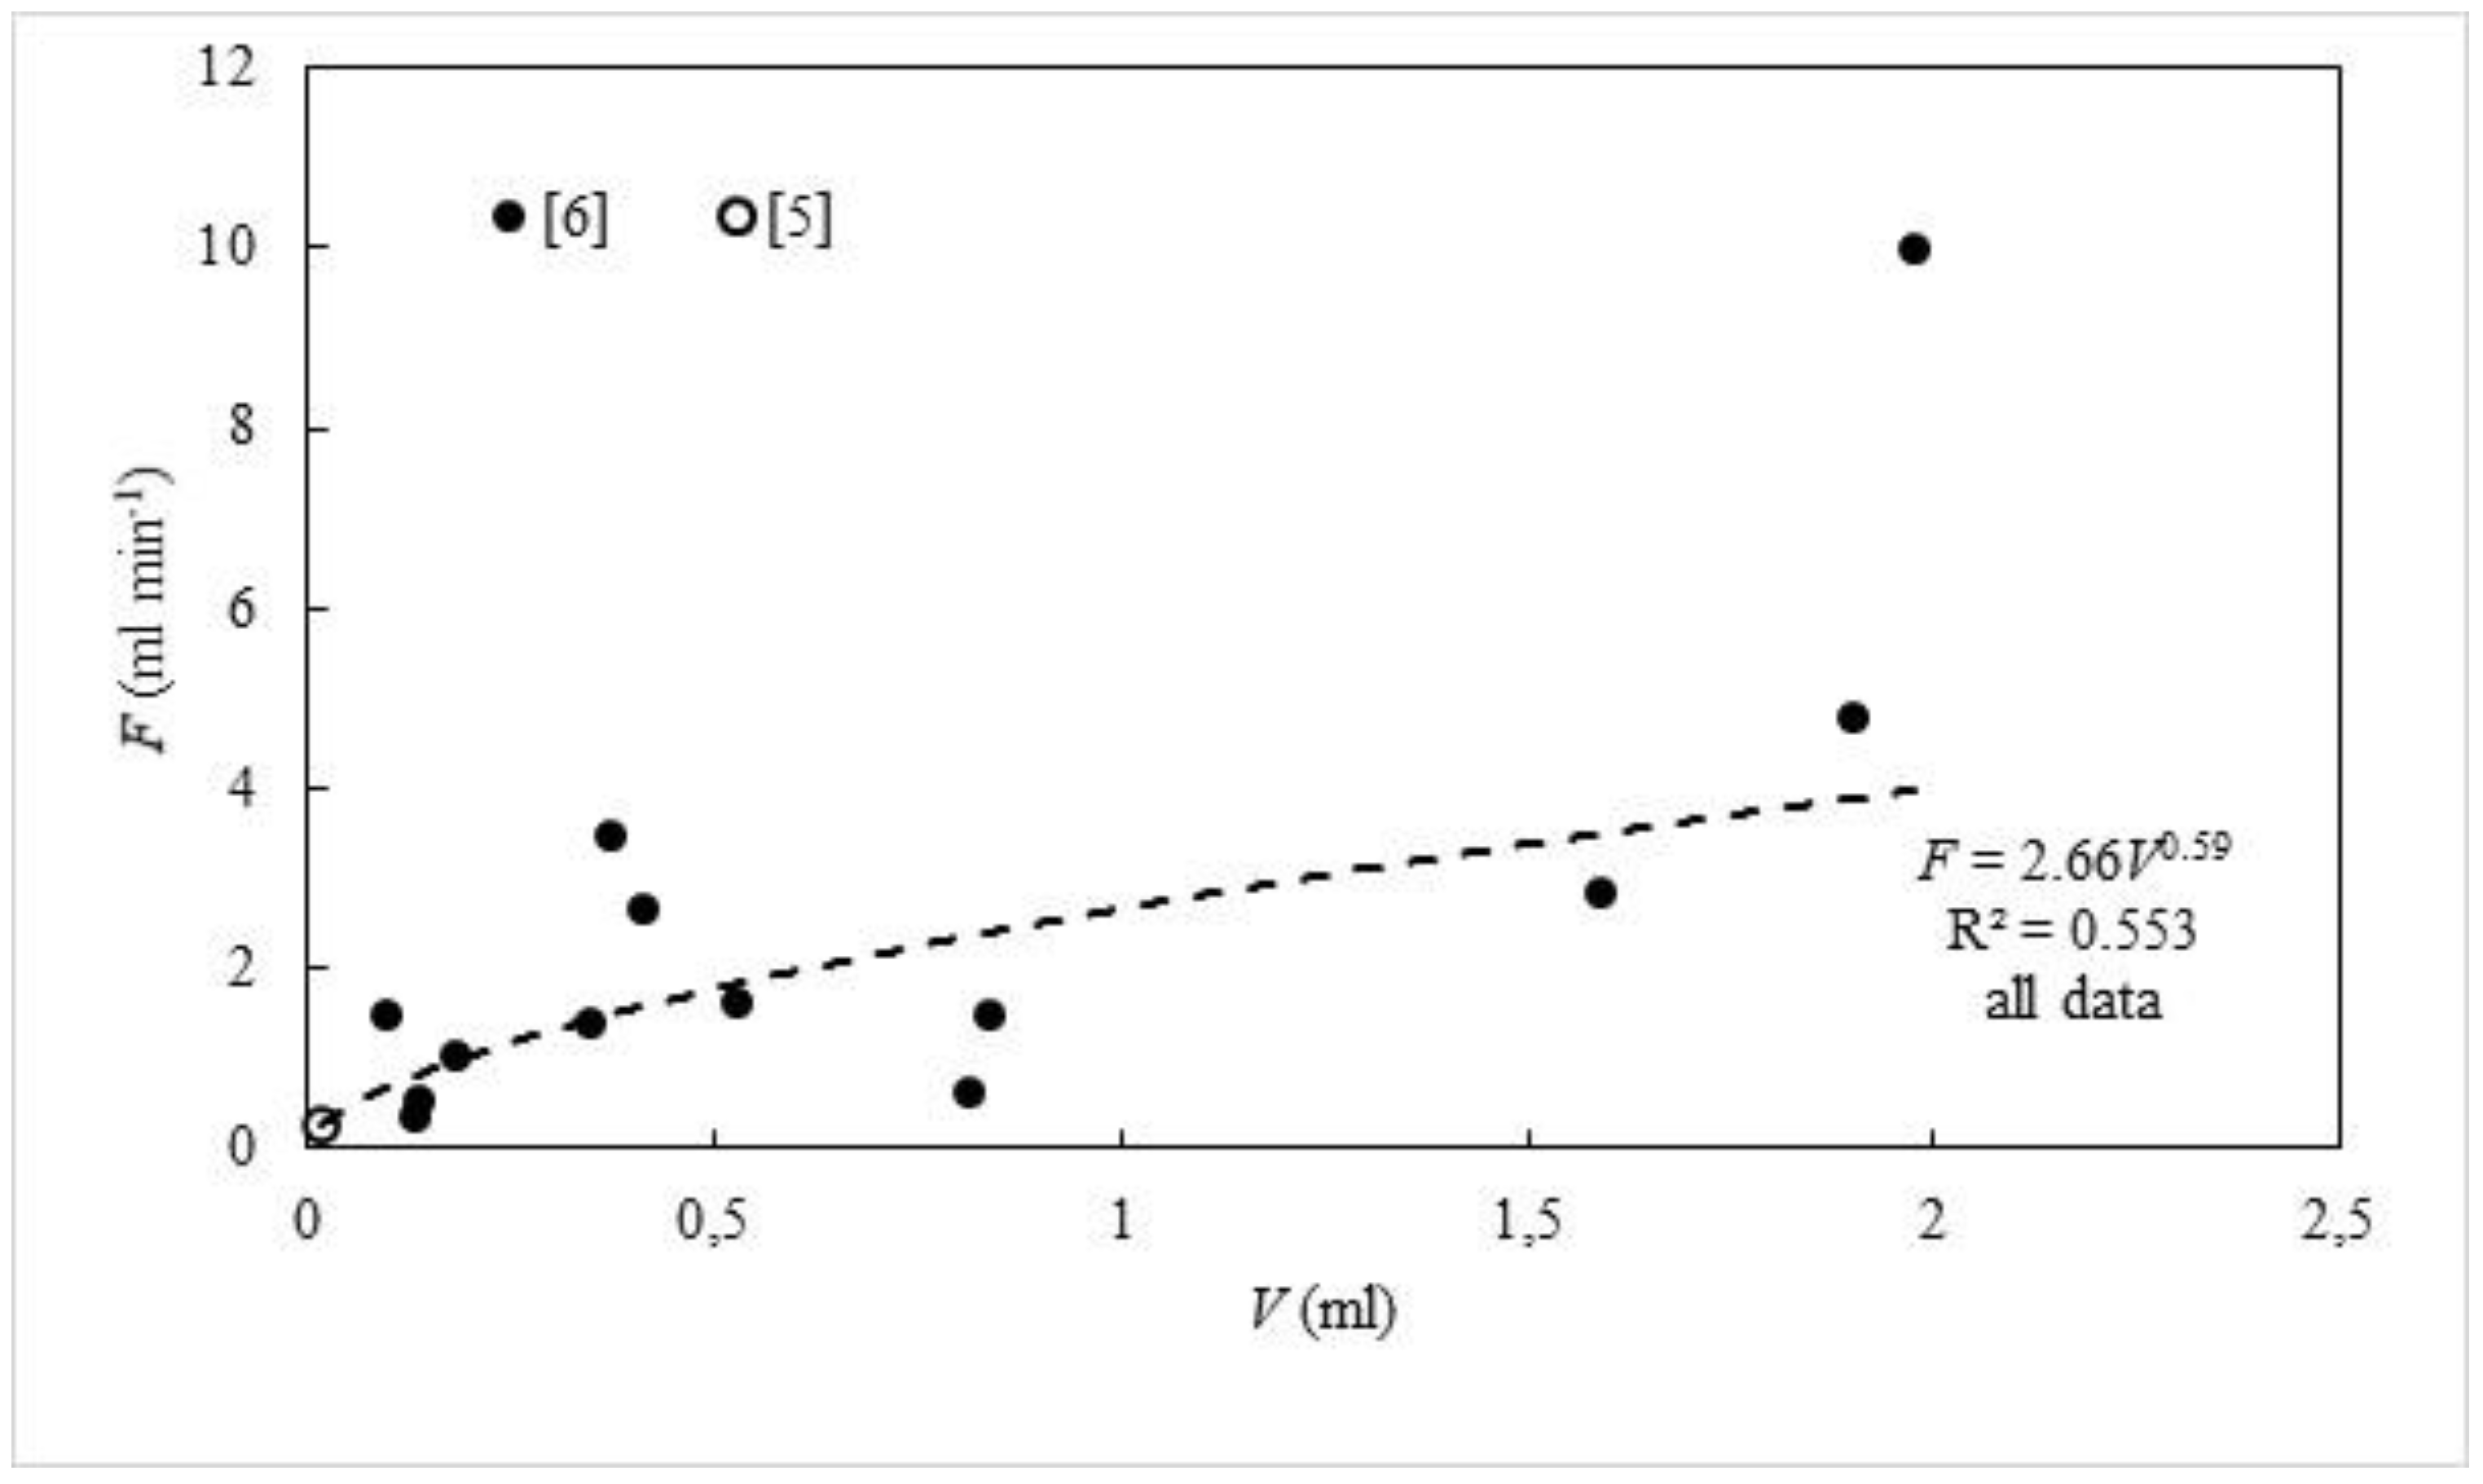
4. Filtration Rate, OSA, and Size

From the foregoing, it appears that a multi-oscula demosponge may be regarded as a population of modules each sharing the characteristics of a single-osculum explant, but also that the scaling of F/V versus V in single-osculum modules does not apply to multi-oscula sponges, which, due to their population of modules, obtained different and scaling characteristics for F/V versus the total sponge volume V.
The scaling relations between the filtration rate and osculum cross-sectional area is of interest because “the number of oscula and their OSA were the best predictors” of the filtration rate of sponges [15]. However, again, we must distinguish between the different types of demosponges. Thus, F = a2OSAb2 and b2 = 3/2 in Equation (2) for single-osculum modules but have the values of b2 = 0.75 to 1.07 for single-osculum multi-modular demosponges [15].
As an example of scaling, Figure 4 shows an underwater photo of Halichondria panicea, which consists of multi-oscular multi modules, each with an osculum with a mean diameter of 1.9 ± 0.6 mm (29 July 2019), giving rise to OSA = 2.84 mm2, V = 3.2 mL, F = 7.4 mL min−1, and F/V = 2.3 min−1 when using Equation (2) F = a2OSA3/2 with a2 = 1.55 [6], and a3 = 3.97 in F = a3V2/3 (Equation (3)) shown in Figure 2. Obviously, the in situ measurement of F and the calibration of the scaling relations to the actual temperature are desirable in order to verify the predictions, but the example illustrates how scaling relations may be useful in field studies because only the dimensions of the oscula need to be measured to obtain information about both the size and filtration rate of each module of a multi-oscula sponge, which can be considered as a population of modules.
The size of an aquiferous sponge module and its OSA are closely interconnected and follow a fixed scaling, but the module size and the OSA are not stable as evident from the following, where Halichondria panicea again serves as an example. An earlier measurement of the average size of OSA in H. panicea at the same field location (Figure 4) was measured by [7] to the lower value of 1.0 ± 0.6 mm2 (17 December 2018). Thus, it is likely that the mean size of otherwise full-grown modules and concurrently the OSA and F change over the season, along with pronounced changes in the condition index [25,26]. Furthermore, [27] observed that the range of the oscular diameter in H. panicea was 1 to 4 mm of sponges from sites with “medium to high current velocities”, but smaller, 0.5 to 2 mm, at “low current” sites. From these observations, it can be concluded that the size of modules and their OSA vary between localities and over the season, and that the size and shape of the individual modules of H. panicea are not stable, but depend on the living site and time of the year. The degree of polymorphism in this sponge is “much higher than observed in most other sponges”, and its growth form may be encrusting, lumpy, or ramose (Figure 4), depending on the current velocities and degree of exposure to waves [27].

5. Density and Filtration Rates of Choanocyte Cambers in a Single-Osculum Module

The prerequisite for the scaling leading to Equation (3) is that the “area specific filtration rate” of the thin wall separating the inhalant and exhalant canals is constant, i.e., the wall-specific density of choanocytes (CCs) and their individual filtration rate is constant. The suggested scaling is verified by the experimental data shown in Figure 2. Because of this scaling, the CC density decreases with increasing V, whereas the filtration rate of the single choanocyte may be reduced due to increasing the system resistance when the canals become longer.
Here, it should be mentioned that Figure 1 is very schematic. Thus, although “the exhalant system, in a crude sense, mirrors the inhalant system” [4], the two systems serve different functions. Food particles >5 µm are filtered out of the inflowing water in the inhalant canal system and phagocytosed here, whereas smaller particles are retained in the CCs [28]. The exhalant canal system acts as a sewage system, which carries filtered water, excretion products, and indigestible matter out of the sponge, and it is noteworthy that the diameter of the exhalant apertures are more than two times larger than the inhalant apertures [4,29]. The significance of this difference in the aperture diameter remains unknown, but the resistance to flow may be relatively lower in the larger exhalant canals.

5.1. Filtration Rates

It is our hypothesis that the volume specific filtration rate (F/V) versus sponge volume (V) of single-osculum single-module demosponges decreases with the increasing size, while it remains essentially constant for multi-oscular multi-modular and single-osculum multi-modular demosponges, provided the sponge volume is that of the structural sponge tissue, which, again, is proportional to the sponge dry weight. Furthermore, we seek to understand the cause of the observed strong decrease in F/V with increasing V. The specific filtration rate equals the product of density (nCC) and filtration rate (FCC) of the choanocyte chambers, F/V = nCC × FCC, where each factor may decrease in the process of growth, nCC due to an increasing volume fraction of the tissue, FCC due to the changing choanocyte pump performance related to seal imperfections in pumps and/or increasing pressure losses in the aquiferous system with increasing size.
For 5 sponges, [20] shows very large volume-specific pumping rates (10 to 40 min−1) for small individuals that then decrease with increasing size to more typical values (2 to 6 min−1); however, these results may be subject to corrections for the use of total volume rather than structural tissue volume. Furthermore, based on the decreasing F/V with increasing V observed “in most of the sponges” studied by [15], the authors suggested that the CC density was concurrently reduced. This possibility is now discussed by considering some examples of the demosponge Halichondria panicea.
A very small explant of volume V = 0.018 mL was found to have the high-volume specific filtration rate of F/V = 15.6 min−1 [5], while the larger, near full grown explant of volume V = 1 mL had the smaller value F/V = 2.66 min−1 [6]. For an estimate of the order of magnitude of nCC and FCC, we considered a Halichondria panicea specimen having F/V = 6.1 min−1 [30] and nCC = 18,000 mm−3 [4], which produced FCC = (6.1/18,000)/60 = 5.65 × 10⁻⁶ mm3 s−1 = 5650 µm3 s−1.
As a first scenario, we assumed FCC = 5650 µm3 s−1 to prevail for the small and the larger explants. This would imply that the choanocyte chamber density should decrease from nCC = (15.6 × 10⁹/5650)/60 = 46,018 mm−3 to nCC = 7847 mm−3, i.e., by a 5.9 factor, as determined by the ratio of F/V values. Furthermore, assuming a typical chamber diameter of 30 µm, the volume fraction of the chambers would be π/6 × 303 × 46,018 × 10−9 × 100 = 65% and 11%, respectively, leaving little space for aquiferous canals and other structure in the first case, which can be justified by the very short canals in a very small explant.
The density (nCC = 18,000 mm−3) reported by [4] represents “mature regions with relatively stable dimensions” in Halichondria panicea, and the attainment of samples from “growth points” was deliberately avoided. Because the very small explant represents a “growth point”, this may suggest a higher chamber density here, but verification awaits further information on the structure and dimensions of the canal system at these “growth points”.
With 80 choanocytes in a CC [4], the filtration rate of a single choanocyte in Halichondria panicea was estimated at Fch = (5650/80 =) 70.6 µm3 s−1. With 95 choanocytes per CC in Haliclona permollis [4] and F/V = 6.0 min−1 measured in the closely related H. urceolus [8], it was estimated that Fch = (6.0 × 60)/(12,000 × 95 × 103) = 0.32 × 10⁻⁶ mL h−1 or 89 µm3 s−1. For the comparison with other demosponges, [22] found that the tropical demosponge Tethya crypta had a volume-specific filtration rate of F/V = 10.8 min−1, and from this, it was estimated (using CC density and number of choanocytes per CC reported by [31] that Fch = 648/(14,403 × 99 × 103) = 0.46 × 10⁻⁶ mL h−1 or 128 µm3 s−1. Other, but strongly varying, values were calculated by [32]) using the data reported by [31]. Thus, Fch was calculated from the measured F/V ratio divided by the CC density. However, the CC density was determined for sponge tissue, whereas V was “calculated by measuring the dimensions of the sponge from images taken of whole animals in situ” [31], and this may explain some of the strong variations in Fch between species, but also the differences between CC density in “growth points” and “full grown” modules may have contributed to the variation.
In the second scenario, we assume that the CC density was constant, which would lead to a change in the CC filtration rate produced by the factor 5.9 of the F/V ratio of the very small explant to the larger one. Using the aforementioned value of FCC = 5650 µm3 s−1, or Fch = 70.6 µm3 s−1 for 80 choanocytes per CC, for the larger explant, it would suggest a high value of Fch = 70.6 × 5.9 = 416 µm3 s−1 for the very small explant. Although an increase in Fch would be expected for the much shorter canals in the very small explant, it would be less than suggested here unless the choanocyte pumps at this stage were more efficient. A value of 453 µm3 s−1 for an opposing system pressure of 1 mm H2O was computed by [32], provided good seals represented by the second reticulum (acting as a “gasket”) and the glycocalyx mesh on the upper part of the collar.
By comparing the two scenarios, it appears that the main contribution to the decrease in the F/V ration during growth of the single-osculum explant module was due to the decrease in the chamber density because of the increase in the volume of structural elements and increased aquiferous system. No similar decrease should be expected for multi-oscular or single-module multi-oscular sponges, where most of the modules are full grown with a relatively low and constant chamber density. For these cases, any reported decrease in the chamber density (and filtration rate), as suggested by [15], would arise if based on the total sponge volume, including an increasing spongocoel volume.

5.2. Closing Remarks: Towards a Better Understanding

From our present examination of F/V versus V, we realized that certain assumptions presented in our recent article on the pumping rate and size of demosponges [16] were not completely correct. Thus, the modeling of a tubular-type demosponge, equivalent to a single-osculum module, was made on the assumption of the constant choanocyte density, which we now find to be unlikely. Furthermore, we realized that the present scaling for (i) single-osculum module (F/V ~ V−1/3) cannot be applied to (ii) multi-oscular multi-modular and (iii) single-osculum multi-modular demosponges. We think that the observed and modeled dependence of the filtration rate on the sponge volume for growing single-osculum modules may primarily be governed by a decreasing density of choanocytes with increasing V in all sponge species. However, the hydraulics of the pump and pressure losses of the aquiferous system possibly resulting in a reduction in the choanocyte filtration rate may also play a role, which awaits further assessment. However, the present assessment of F/V versus V among various types of demosponge species should help to clarify the large and confusing variations that we observed, but could not immediately explain.

6. Conclusions

The concept of “modules” was used to classify the demosponges and develop the scaling laws of growth at different stages and the types of sponges. The scaling analysis for single osculum explants leads to a volume-specific filtration rate that scales as F/V = V−1/3, which also applies when an aquiferous module grows larger. A multi-oscula sponge is a population of modules each sharing the characteristics of a single-osculum explant. However, many of their modules may have reached their maximal size, and hence their maximal filtration rate, which would imply the scaling F/V ≈ constant. A similar scaling would be expected for large pseudo-osculum sponges, provided their volume was taken to be the structural tissue volume that holds the pumping units, and not the total volume that includes the large atrium volume of water. The observed decrease in the F/V ratio by a factor of 5.9 when a very small Halichondria panicea explant grows to a near full-grown explant is primarily ascribed to a decrease in the density of the choanocyte chambers.

Author Contributions

H.U.R. and P.S.L. equally contributed with input and text writing. All authors have read and agreed to the published version of the manuscript.

Funding

This research received no external funding.

Institutional Review Board Statement

Not applicable.

Informed Consent Statement

Not applicable.

Data Availability Statement

Not applicable.

Acknowledgments

Thanks are due to Josephine Goldstein for aid with the technical drawing and statistics, and to 4 anonymous reviewers for constructive comments on the manuscript.

Conflicts of Interest

The authors declare no conflict of interest.

References

  1. De Voogd, N.J.; Alvarez, B.; Boury-Esnault, N.; Carballo, J.L.; Cárdenas, P.; Díaz, M.-C.; Dohrmann, M.; Downey, R.; Hajdu, E.; Hooper, J.N.A.; et al. World Porifera Database. 2022. Available online: https://www.marinespecies.org/porifera (accessed on 28 March 2022). [CrossRef]
  2. Fry, W.G. The sponge as a population: A biometric approach. Symp. Zool. Soc. Lond. 1970, 25, 135–162. [Google Scholar]
  3. Ereskovskii, A.V. Problems of coloniality, modularity, and individuality in sponges and special features of their mor-phogeneses during growth and asexual reproduction. Russ. J. Mar. Biol. 2003, 29, 46–56. [Google Scholar] [CrossRef]
  4. Reiswig, H.M. The aquiferous systems of three marine demospongiae. J. Morph. 1975, 145, 493–502. [Google Scholar] [CrossRef]
  5. Kumala, L.; Riisgård, H.U.; Canfield, D.E. Osculum dynamics and filtration activity studied in small single-osculum explants of the demosponge Halichondria panicea. Mar. Ecol. Prog. Ser. 2017, 572, 117–128. [Google Scholar] [CrossRef] [Green Version]
  6. Goldstein, J.; Riisgård, H.U.; Larsen, P.S. Exhalant jet speed of single-osculum explants of the demosponge Halichondria panicea and basic properties of the sponge-pump. J. Exp. Mar. Biol. Ecol. 2019, 511, 82–90. [Google Scholar] [CrossRef]
  7. Kealy, R.A.; Busk, T.; Goldstein, J.; Larsen, P.S.; Riisgård, H.U. Hydrodynamic characteristics of aquiferous modules in the demosponge Halichondria panicea. Mar. Biol. Res. 2019, 15, 531–540. [Google Scholar] [CrossRef]
  8. Riisgård, H.U.; Thomassen, S.; Jakobsen, H.; Weeks, J.; Larsen, P.S. Suspension feeding in marine sponges Halichondria panicea and Haliclona urceolus: Effects of temperature on filtration rate and energy cost of pumping. Mar. Ecol. Prog. Ser. 1993, 96, 177–188. [Google Scholar] [CrossRef]
  9. Larsen, P.S.; Riisgård, H.U. The sponge pump. J. Theor. Biol. 1994, 168, 53–63. [Google Scholar] [CrossRef]
  10. Thomassen, S.; Riisgård, H.U. Growth and energetics of the sponge Halichondria panicea. Mar. Ecol. Prog. Ser. 1995, 128, 239–246. [Google Scholar] [CrossRef]
  11. McMurray, S.E.; Blum, J.E.; Pawlik, J.R. Redwood of the reef: Growth and age of the giant barrel sponge Xestospongia muta in the Floridas Keys. Mar. Biol. 2008, 155, 159–171. [Google Scholar] [CrossRef]
  12. McMurray, S.E.; Pawlik, J.R.; Finelli, C.M. Trait-mediated ecosystem impacts: How morphology and size affect pumping rates of the Caribbean giant barrel sponge. Aquat. Biol. 2014, 23, 1–13. [Google Scholar] [CrossRef] [Green Version]
  13. Reiswig, H.M. In situ pumping activities of tropical Demospongiae. Mar. Biol. 1971, 9, 38–50. [Google Scholar] [CrossRef]
  14. Strehlow, B.W.; Jørgensen, D.; Webster, N.S.; Pineda, M.C.; Duckworth, A. Using a thermistor flowmeter with attached video camera for monitoring sponge excurrent speed and oscular behaviour. PeerJ 2016, 4, e2761. [Google Scholar] [CrossRef] [PubMed] [Green Version]
  15. Morganti, T.M.; Ribes, M.; Moskovich, R.; Weisz, J.B.; Yahel, G.; Coma, R. In situ pumping rate of 20 marine demosponges is a function of osculum area. Front. Mar. Sci. 2021, 8, 583188. [Google Scholar] [CrossRef]
  16. Larsen, P.S.; Riisgård, H.U. Pumping rate and size of demosponges-towards an understanding using modeling. J. Mar. Sci. Eng. 2021, 9, 1308. [Google Scholar] [CrossRef]
  17. R Development Core Team. R: A Language and Environment for Statistical Computing; R Foundation for Statistical Computing: Vienna, Austria, 2022; Available online: https://www.R-project.org/ (accessed on 2 March 2022).
  18. Fry, W.G. Taxonomy, the individual and the sponge. Biology and Systematics of Colonial organisms. Syst. Ass. Spec. 1979, 11, 49–80. [Google Scholar]
  19. Pinheiro, U.S.; Hajdu, E. Shallow-water Aplysina Nardo (Aplysinidaee Verongida, Demospongiae) from the São Sebastião Channel and its environs (Tropical southwestern Atlantic), with the description of a new species and a literature review of other brazilian records of genus. Rev. Bras. Zool. 2001, 18 (Suppl. S1), 143–160. [Google Scholar] [CrossRef]
  20. Morganti, T.M.; Ribes, M.; Yahel, G.; Coma, R. Size is the major determinant of pumping rates in marine sponges. Front. Physiol. 2019, 10, 1474. [Google Scholar] [CrossRef] [Green Version]
  21. Reiswig, H.M. Population dynamics of three Jamaican Demospongiae. Bull. Mar. Sci. 1973, 23, 191–226. [Google Scholar]
  22. Reiswig, H.M. Water transport, respiration and energetics of three tropical marine sponges. J. Exp. Mar. Biol. Ecol. 1974, 14, 231–249. [Google Scholar] [CrossRef]
  23. Southwell, M.W.; Weisz, J.B.; Martens, C.S.; Lindquist, N. In situ fluxes of dissolved inorganic nitrogen from the sponge community on Conch Reef, Key Largo, Florida. Limnol. Oceanogr. 2008, 53, 986–996. [Google Scholar] [CrossRef] [Green Version]
  24. Dahihande, A.S.; Thakur, N.L. Temperature- and size-associated differences in the skeletal structures and osculum cross-sectional area influence the pumping rate of contractile sponge Cinachyrella cf. cavernosa. Mar. Ecol. 2019, 40, e12565. [Google Scholar] [CrossRef]
  25. Barthel, D. On the ecophysiology of the sponge Halichondria panicea in Kiel Bight. I. Substrate specificity, growth and reproduction. Mar. Ecol. Prog. Ser. 1986, 32, 291–298. [Google Scholar] [CrossRef]
  26. Lüskow, F.; Riisgård, H.U.; Solovyeva, V.; Brewer, J.R. Seasonal changes in bacteria and phytoplankton biomass control the condition index of the demosponge Halichondria panicea in temperate Danish waters. Mar. Ecol. Prog. Ser. 2019, 608, 119–132. [Google Scholar] [CrossRef]
  27. Barthel, D. Influence of different current regimes on the growth form of Halichondria panicea Pallas. In Fossil and Recent Sponges; Reitner, J., Keupp, H., Eds.; Springer: Berlin/Heidelberg, Germany, 1991; pp. 387–394. [Google Scholar]
  28. Imsiecke, G. Ingestion, digestion, and egestion in Spongilla lacustris (Porifera, Spongillidae) after pulse feeding with Chlamydomonas reinhardtii (Volvocales). Zoomorphology 1993, 113, 233–244. [Google Scholar] [CrossRef]
  29. Weissenfels, N. The filtration apparatus for food collection in freshwater sponges (Porifera, Spongillidae). Zoomorphology 1992, 112, 51–55. [Google Scholar] [CrossRef]
  30. Riisgård, H.U.; Kumala, L.; Charitonidou, K. Using the F/R-ratio for an evaluation of the ability of the demosponge Halichondria panicea to nourish solely on phytoplankton versus free-living bacteria in the sea. Mar. Biol. Res. 2016, 12, 907–916. [Google Scholar] [CrossRef]
  31. Ludeman, D.A.; Reidenbach, M.A.; Leys, S.P. The energetic cost of filtration by demosponges and their behavioural response to ambient currents. J. Exp. Biol. 2017, 220, 995–1007. [Google Scholar] [CrossRef] [Green Version]
  32. Asadzadeh, S.S.; Larsen, P.S.; Riisgård, H.U.; Walther, J.H. Hydrodynamics of the leucon sponge pump. JRSI 2019, 16, 20180630. [Google Scholar] [CrossRef] [Green Version]
Figure 1. Sketch of a single-osculum demosponge showing the water flow from outside through ostia into inhalant canals (ICs) to the water pumping choanocyte chambers (CCs), where the water is filtered, then further into exhalant canals (ECs) and subsequently out through the osculum. The thin wall separating the tapered inhalant and exhalant canals is for a great part made up of CCs embedded in the mesenchyme. Adapted from [9].
Jmse 10 00643 g001
Figure 2. Halichondria panicea. Volume-specific filtration rate (F/V) as a function of body volume (V) of single-osculum explants. The model-predicted curve (dotted) based on [5] (open symbol) is shown along with the power-function regression line for all data (dashed, solid symbols) for data obtained from [6] (LM, t0.2969, 12 = −2.859, p = 0.0013).
Jmse 10 00643 g002
Figure 3. Halichondria panicea. Filtration rate (F) of single-osculum explants as a function of sponge-body volume (V). The power-function regression line has been shown along with its equation. The b3-exponent is 0.59, which may be compared to the model-predicted b3 = 2/3 [5,6] (LM, t0.2964, 12 = 4.099, p = 0.0015).
Jmse 10 00643 g003
Figure 4. Halichondria panicea. Underwater photo (29 July 2019) from the inlet to Kerteminde Fjord, Denmark, showing erect branching (ramose) sponges of type (ii) with multi-modules each with an osculum.
Jmse 10 00643 g004
Publisher’s Note: MDPI stays neutral with regard to jurisdictional claims in published maps and institutional affiliations.

