Article

Underwater Noise Measurements around a Tidal Turbine in a Busy Port Setting

1
Pacific Northwest National Laboratory, Coastal Sciences Division, Sequim, WA 98362, USA
2
Pacific Northwest National Laboratory, Earth Systems Science Division, Richland, WA 99354, USA
3
Department of Mechanical Engineering, University of Washington, Seattle, WA 98195, USA
4
Center for Ocean Engineering, University of New Hampshire, Durham, NH 03824, USA
*
Author to whom correspondence should be addressed.
J. Mar. Sci. Eng. 2022, 10(5), 632; https://doi.org/10.3390/jmse10050632
Submission received: 9 March 2022 / Revised: 24 April 2022 / Accepted: 2 May 2022 / Published: 6 May 2022

Abstract

:
Acoustic emissions from current energy converters remain an environmental concern for regulators because of their potential effects on marine life and uncertainties about their effects stemming from a lack of sufficient observational data. Several recent opportunities to characterize tidal turbine sound emissions have begun to fill knowledge gaps and provide a context for future device deployments. In July 2021, a commercial-off-the-shelf hydrophone was deployed in a free-drifting configuration to measure underwater acoustic emissions and characterize a 25 kW-rated tidal turbine at the University of New Hampshire’s Living Bridge Project in Portsmouth, New Hampshire. Sampling methods and analysis were performed in alignment with the recently published IEC 62600-40 Technical Specification for acoustic characterization of marine energy converters. Results from this study indicate acoustic emissions from the turbine were below ambient sound levels and therefore did not have a significant impact on the underwater noise levels of the project site. As a component of Pacific Northwest National Laboratory’s Triton Field Trials (TFiT) described in this Special Issue, this effort provides a valuable use case for the IEC 62600-40 Technical Specification framework and further recommendations for cost-effective technologies and methods for measuring underwater noise at future current energy converter project sites.

1. Introduction

Expanding the nation’s portfolio of renewable power generation capabilities is critical for meeting sustainable future U.S. energy demands and reaching goals for reduced carbon emissions. Marine energy (ME) derived from harnessing free-flowing tidal currents has been identified as a highly viable renewable energy resource [1] and presents an engineering opportunity for creative device design in open water and tidal environments. Deployment of these new technologies has generated regulatory concerns stemming from uncertainties about their environmental impacts as these novel structures are introduced into marine habitats. For instance, many marine animals, including mammals, fish, and invertebrates, are sensitive to the acoustic environment and use soundscape cues in the ocean for a variety of critical life functions including communication, foraging, navigation, reproduction, and protecting territory [2,3]. Anthropogenic effects on acoustic conditions are therefore a key concern for maintaining healthy coastal ecosystems [4,5,6]. Uncertainty surrounding ME-radiated underwater noise and chronic exposure for the animals in these habitats is identified as a key environmental stressor of concern [7]. Marine energy converter (MEC) device deployments in the U.S. have been limited and more sound characterization data are needed to inform the determination of risks to accelerate deployment of the technology. Taking advantage of opportunities to record measured sound levels and characterize underwater noise during initial ME device testing and demonstration will help fill knowledge gaps and ease environmental concerns. This will further promote clear and efficient pathways for future permitting and licensing of ME deployments within existing frameworks and proposed guidelines for sound exposure to marine mammals and fish in U.S. waters [8,9].
Cycled testing of current energy converters (CECs) is a fundamental step toward advancing technologies and ultimately the success of the ME industry. Early-stage deployments are critical for addressing environmental concerns and highlight the importance of measuring and characterizing underwater noise using standardized, environmental monitoring technologies and methods that are transferable across sites and a variety of CECs. Yet, a clear understanding of acoustic emissions from tidal turbines has been deficient because of a limited number of device deployments and the challenges associated with passive acoustic measurements in energetic tidal channels [10,11]. Fortunately, opportunities to measure underwater noise produced by tidal turbines have increased within the last several years, resulting in a handful of studies characterizing acoustic emissions from turbines [12,13,14,15]. The turbines measured and characterized in these studies ranged in scale from 35 kW to 2.2 MW of rated generation capacity. Low-frequency tonal emissions and harmonics radiating from the operating CECs were the most consistent type of signals recorded and ranged from 20 Hz to 4000 Hz, with the majority of the acoustic energy found in the lower decidecade bands (100 Hz). High-frequency and broadband turbine signals and tonal noise from power electronics [12] have also been observed spanning frequencies of up to 20,000 Hz.
Flow noise contamination of low-frequency recordings from turbulent flow across the hydrophone sensor at fixed stations remains a significant challenge for recording long-term underwater noise at tidal energy sites [16]. The most common approach has relied on drifting hydrophone technologies that reduce flow noise by minimizing relative velocities between the sensor and the mean current. This results in reduced low-frequency flow noise contamination of the acoustic recordings and aids in the spatial coverage of range-dependent measurements. This comes at the expense of long-term fixed observations suitable for more time-dependent analysis of turbine-generated underwater noise.
In 2021, as a component of the Triton Field Trials (TFiT) [17], Pacific Northwest National Laboratory (PNNL) carried out an effort to collect and analyze underwater noise data at a tidal turbine site at the University of New Hampshire’s Living Bridge (UNH-LB) Project [18]. The UNH-LB Project provides an opportunity for testing and advancing turbine technology, while also serving as a natural laboratory for environmental monitoring technology testing and data collection, supported by long-term environmental sensor deployments adjacent to the turbine. Commercial-off-the-shelf hydrophone sensor technology and sampling methods aligned with the recent International Electrotechnical Commission 62600-40 Technical Specification (IEC-40) [19] for characterizing acoustic emissions around MECs were used to the extent possible. The objectives were aimed at characterizing the underwater noise of the ME turbine, providing a use case and further recommendations for cost-effective technologies and methods that are technically rigorous, and helping to address regulatory requirements for underwater noise.

2. Materials and Methods

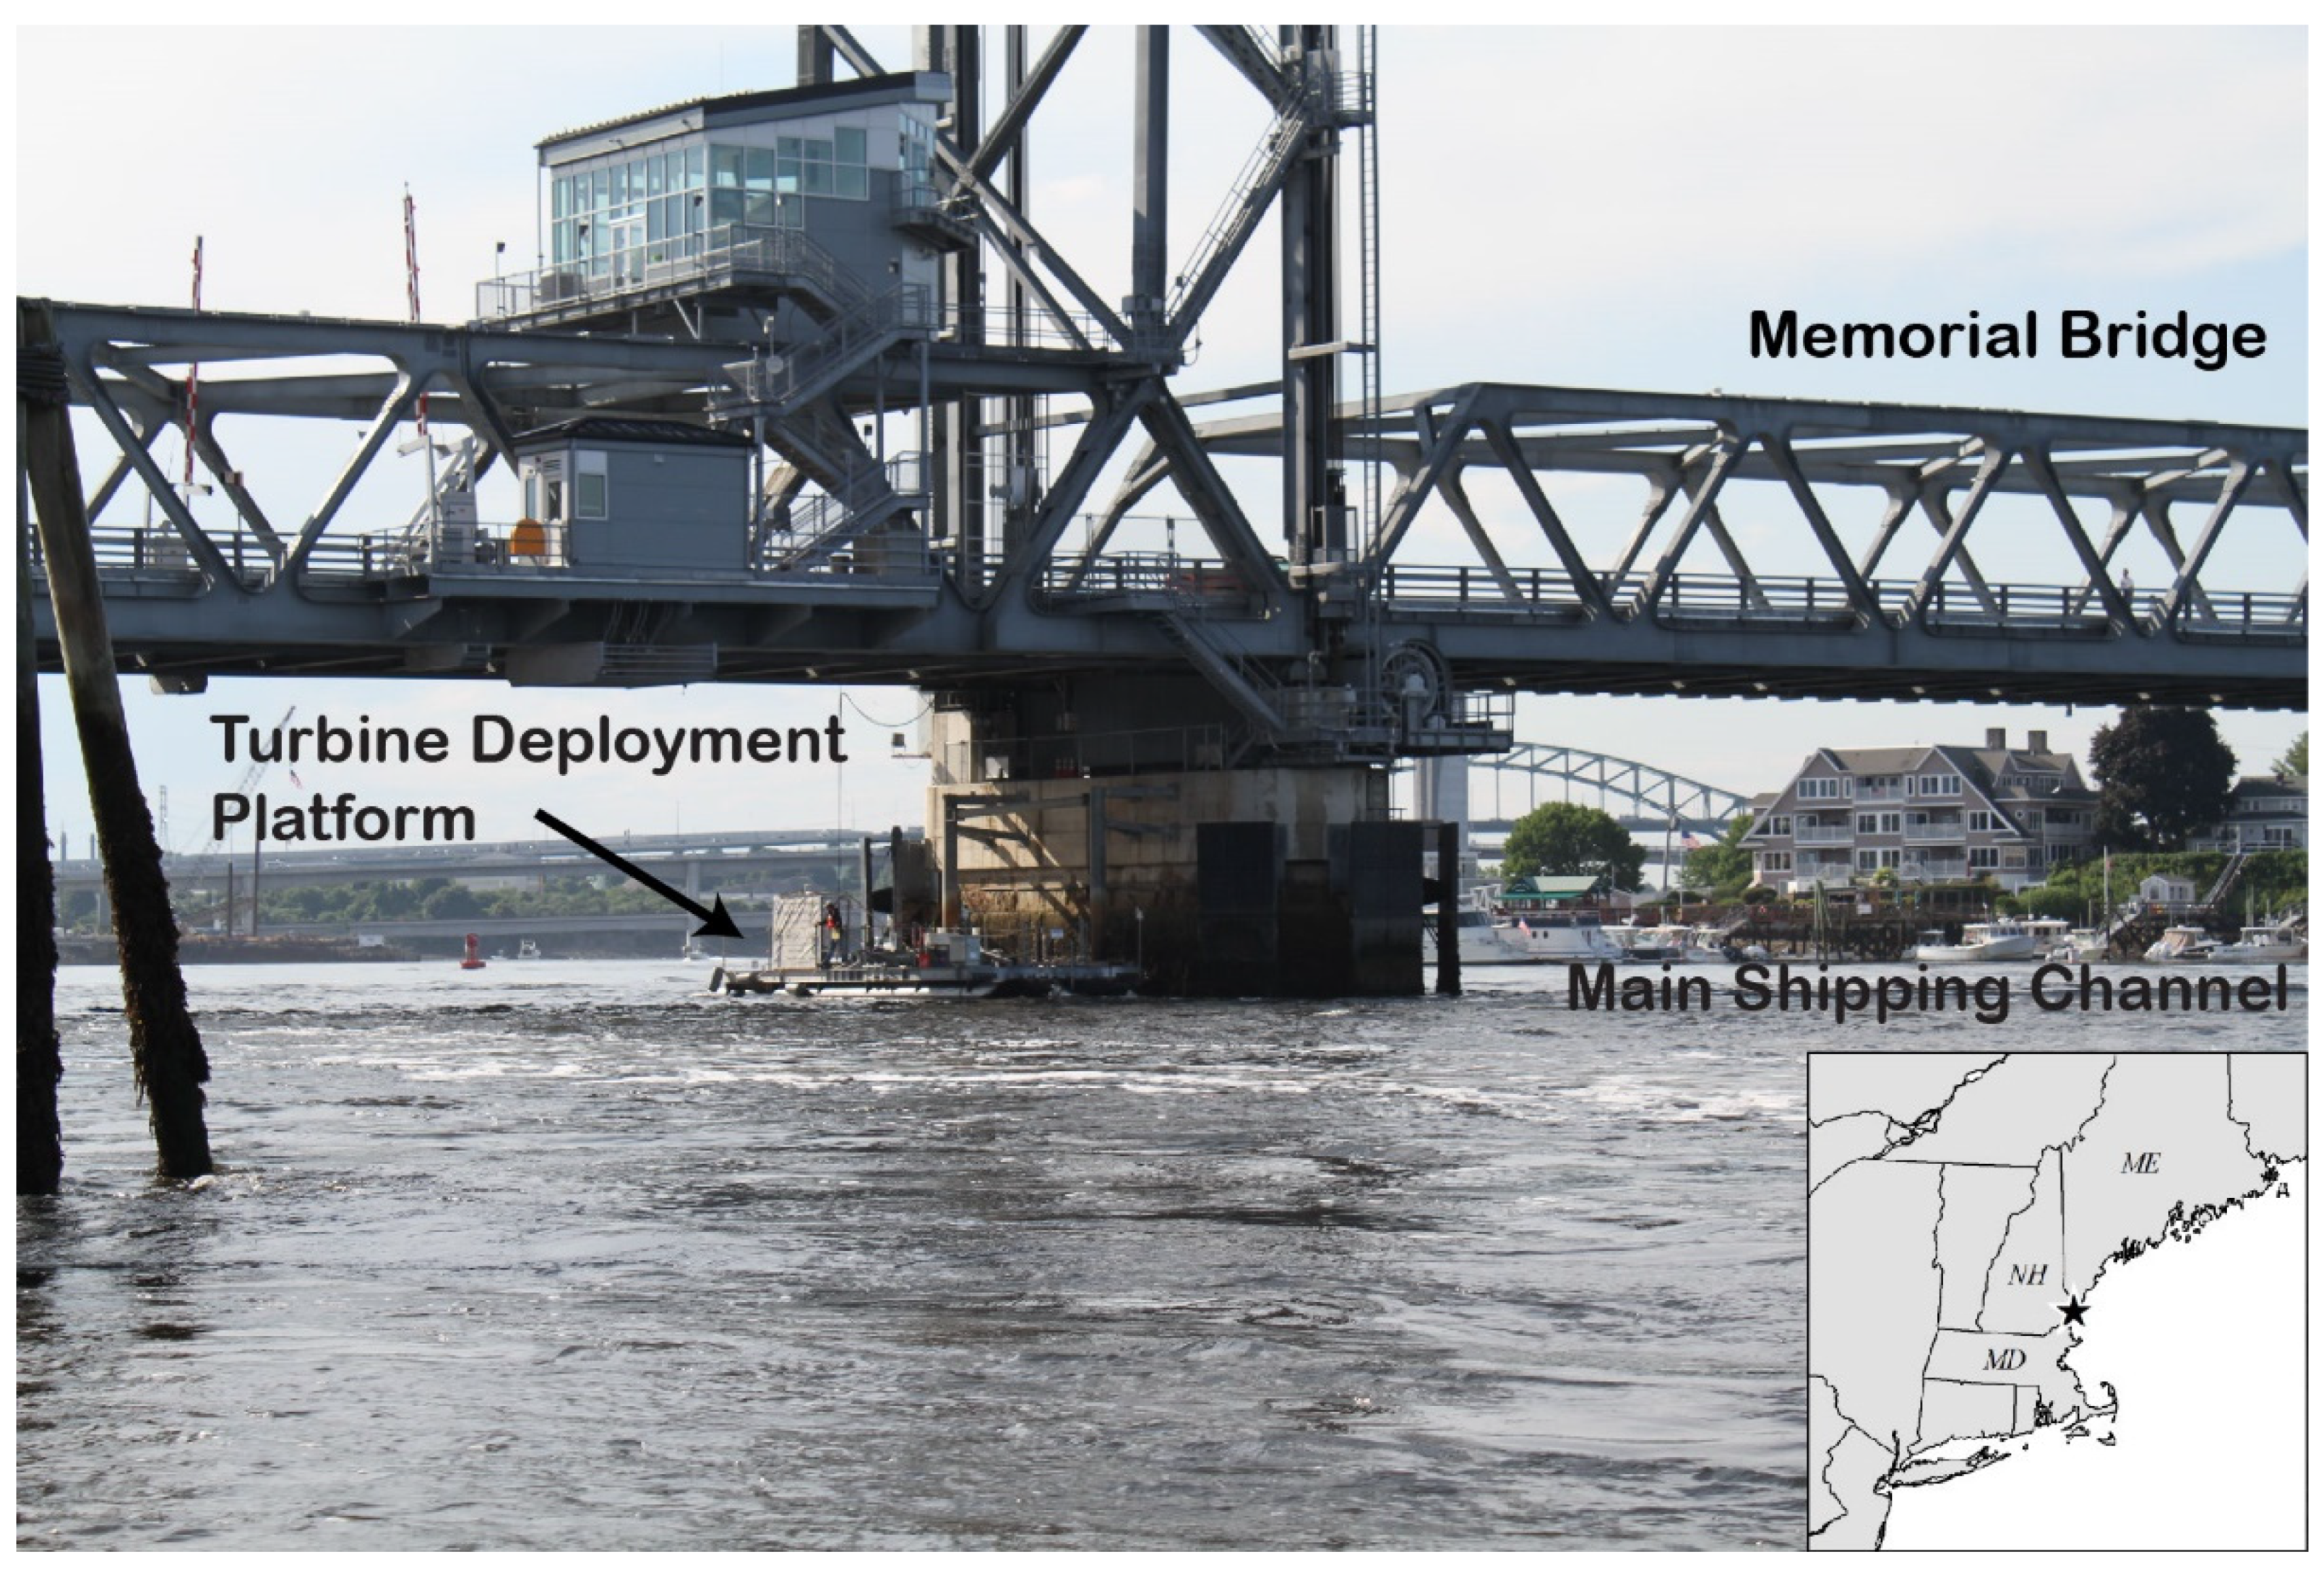
2.1. Site Description

The UNH-LB Project uses the existing infrastructure of the Memorial Bridge connecting motor vehicle and pedestrian traffic between Portsmouth, New Hampshire, and Kittery, Maine, over the tidal Piscataqua River in Great Bay Estuary, roughly 4 km upriver from the Gulf of Maine (Figure 1). The turbine deployment platform (TDP) is moored under the bridge in 18 m deep water adjacent to the second bridge pier on the Portsmouth side, and out of the shipping channel located central to the bridge span. The floating TDP consists of a 15 m long by 6 m wide steel frame with two main and four auxiliary high-density polyethylene floats for buoyancy. It is connected to the bridge pier via two vertical pilings that allow the platform to move up and down with the tides. The site experiences mixed, semi-diurnal tides ranging up to 4 m with significant directional current velocity asymmetry between the ebb and flood stages caused by bathymetric complexities [20]. Tidal energy resource characterization using Acoustic Doppler Current Profiler (ADCP) measurements taken in 2017 [20] on the bow and stern of the TDP show maximum flow during the ebb stage reaching up to 2.85 m/s at the mid-turbine depth 1.4 m below the surface for 2 min ensemble averages during a strong perigean spring tide.
The Port of Portsmouth is developed with commercial, recreational, and industrial activities [21], which result in extensive vessel traffic transiting up- and downriver beneath the Memorial Bridge, and automobile traffic across the bridge. The infrastructure and traffic contribute significantly to the anthropogenically dominated acoustic conditions and surrounding soundscape of the Lower Piscataqua River area.

2.2. Turbine

The UNH-LB Project operated a New Energy Corporation Envirogen 025 turbine during this acoustic monitoring study. The turbine is a 4-bladed vertically oriented crossflow design with a 3.2 m diameter and 1.7 m high rotor that is easily deployed by rotating the turbine assembly with a pitch mechanism through the moon pool in the center of the TDP. Turbine blades are composed of solid aluminum. The turbine energy conversion system includes an above-water direct drive permanent magnet generator with a maximum capacity of 25 kW. It is estimated that this turbine with its slightly smaller rotor (standard is 3.4 m diameter) can achieve this “rated” capacity at tidal current velocities of about 3.3 m/s. Additionally, the power electronics of the energy conversion system including generator, power rectification and grid synchronous inverter are housed above water on the TDP [20].

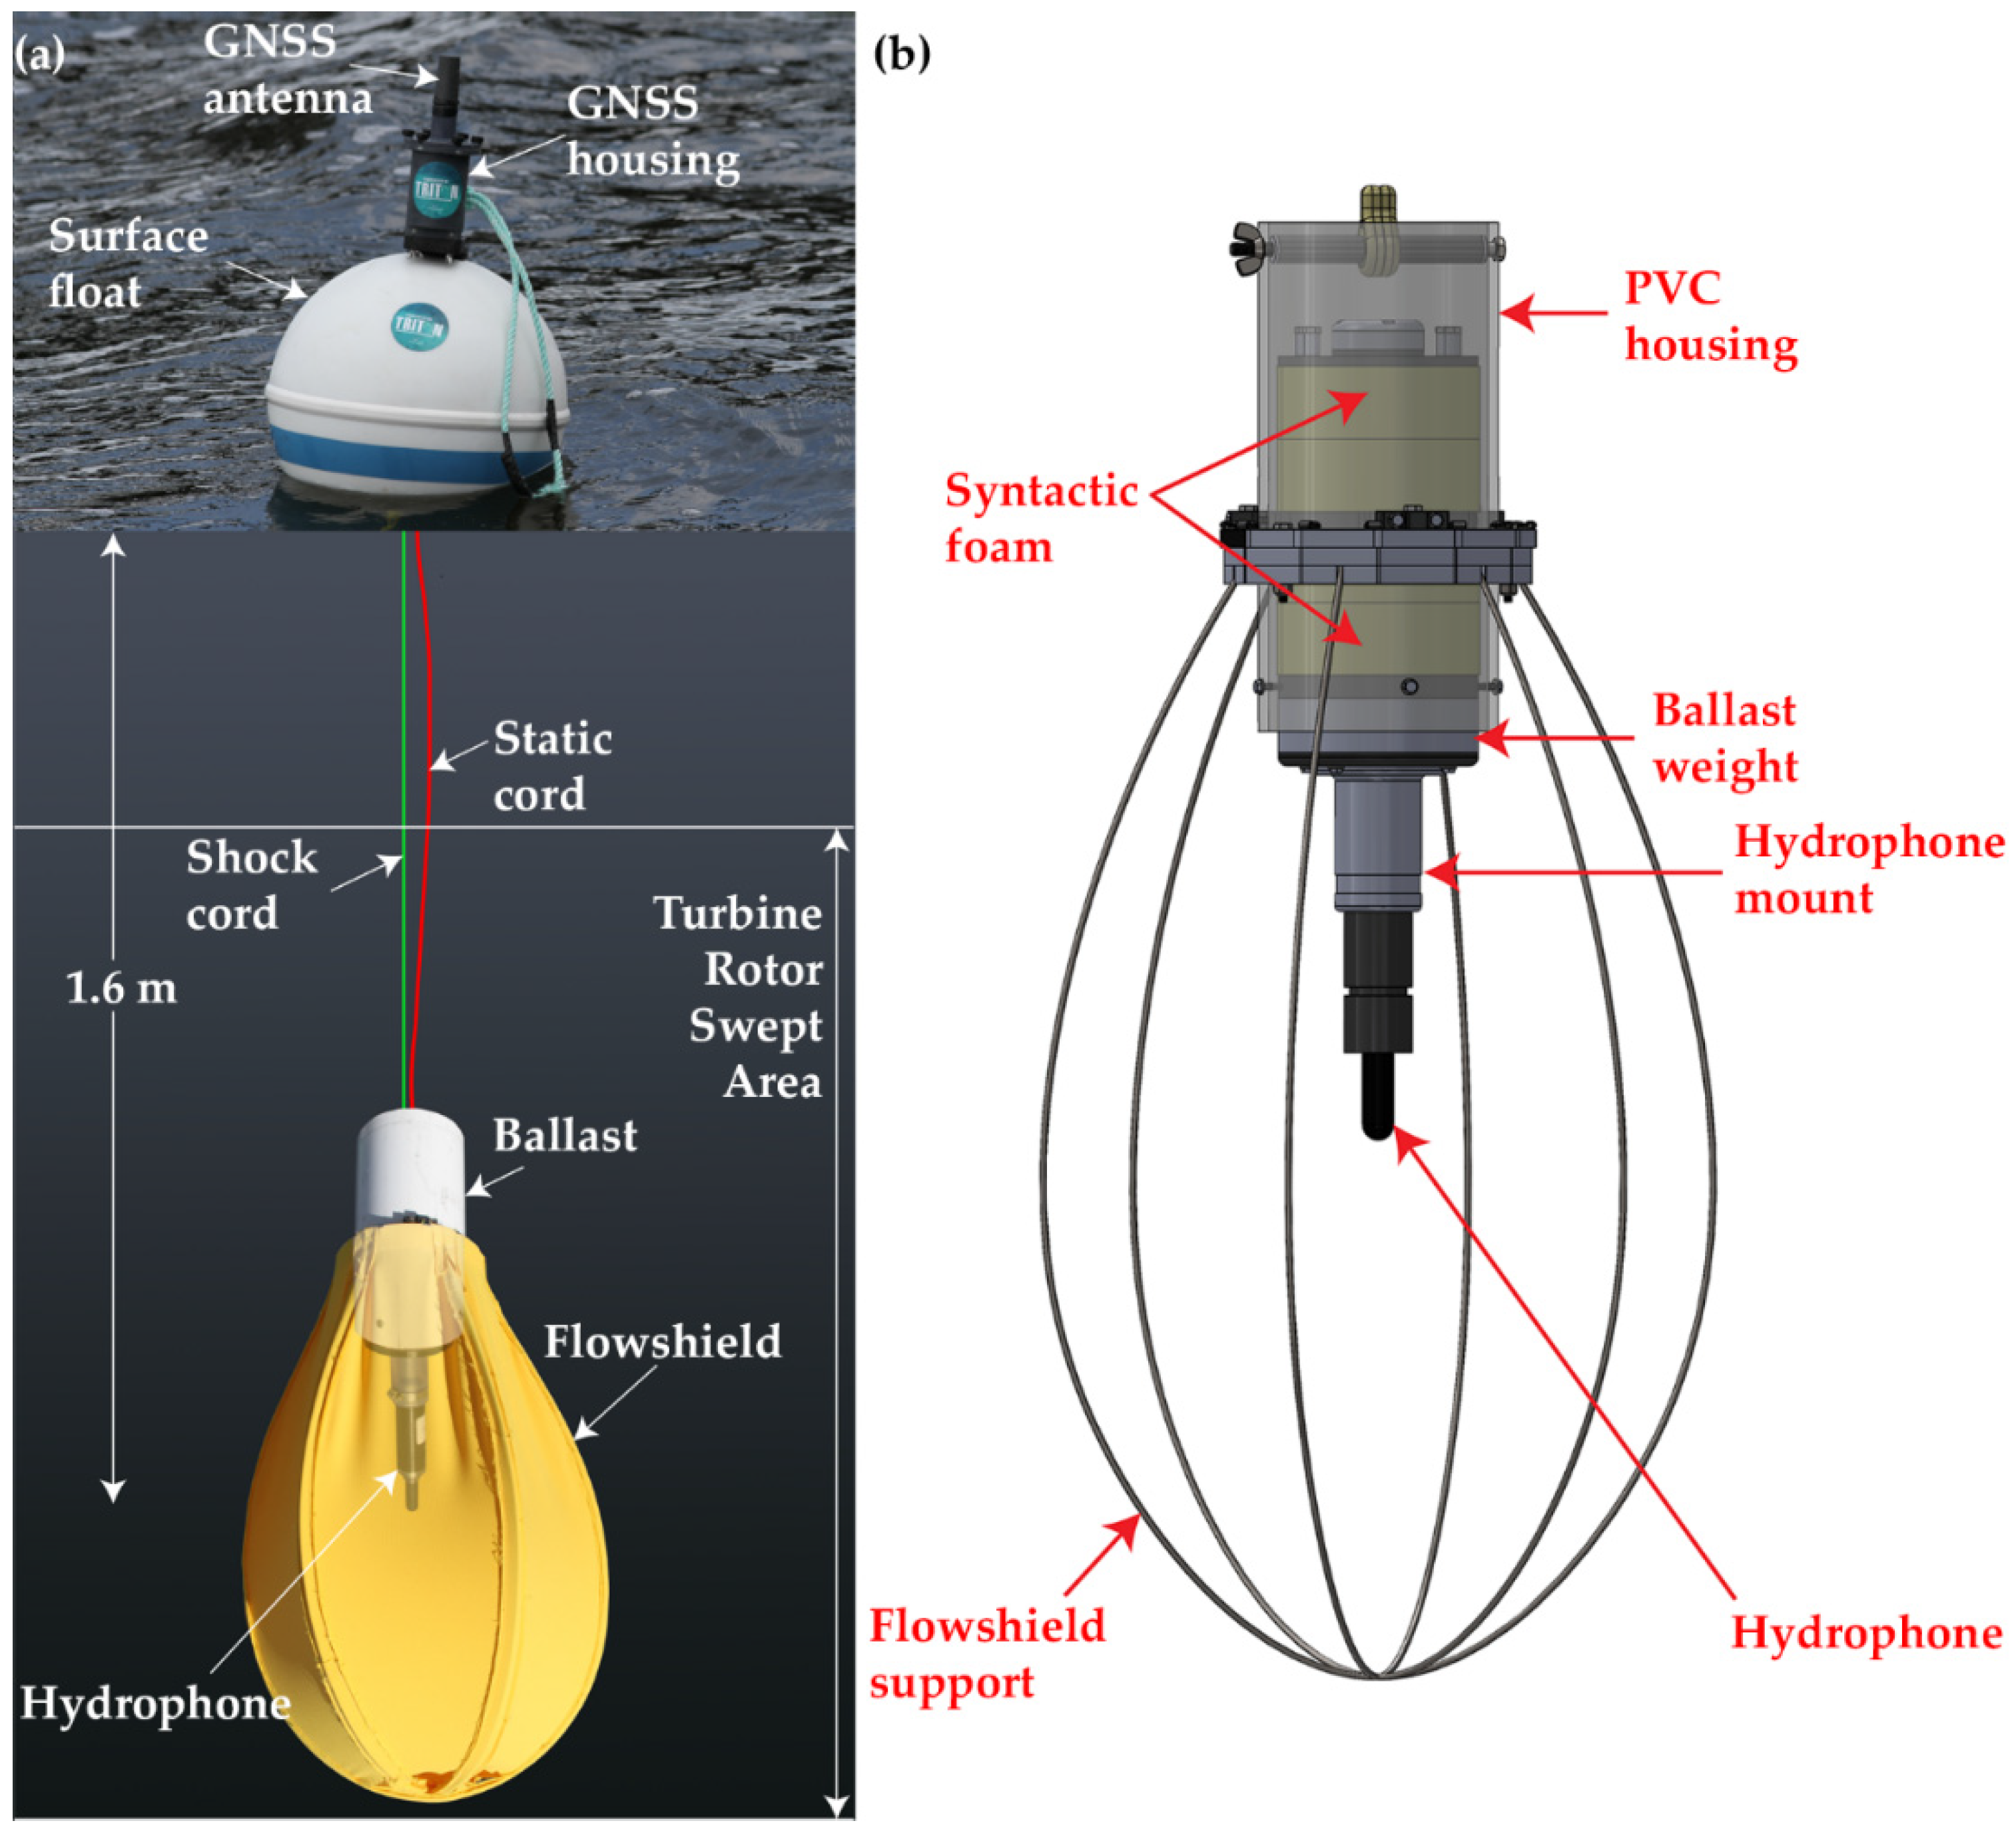
2.3. Drifting Hydrophones

The surface float for the drifting hydrophone system was a Taylor Made Traditional Sur-Moor™ 0.5 m diameter buoy constructed with a polyethylene shell and closed cell foam core with galvanized steel rings on top and bottom connected by a steel shaft running through the buoy center. A 1 m polyethylene loop was attached to the top ring to assist buoy deployments and recoveries. For geolocation positioning, a low-cost Emlid Reach M2™ Global Navigation Satellite System (GNSS) module, 5 V/3 A USB battery bank with a capacity of 10 Ah, and GNSS antenna were mounted in a 3D-printed watertight enclosure adjacent to the top ring of the surface float and set to record at 5 Hz. Suspended underwater from the lower steel ring of the surface float, a 6.4 mm diameter, 0.5 m long shock line and a 3.2 mm diameter, 1 m parachute cord static line were tied to a custom-made, ballasted polyvinyl chloride (PVC) hydrophone housing that was surrounded by a fabric flowshield (Figure 2a). The 0.5 m diameter, 0.8 m long egg-shaped flowshield was constructed of a sewn fabric (DriFit wicking spandex Ripstop™, 84% Polyester, 16% spandex) shell stretched over four 4.1 mm diameter spring-tempered stainless-steel ribs to enclose the hydrophone sensor (Figure 2b). The flow shield was custom built by adapting the proven and performance-tested University of Washington Drifting Acoustic Instrumentation System (DAISY) design [22,23]. Soft connection points were used between the surface float and hydrophone housing at depth to reduce the potential for mechanical system self-noise. The hydrophone was suspended 1.6 m below the water surface, near the center of the crossflow turbine-swept area of 1.3 m below the water surface in alignment with the IEC 62600-40 TS.
The hydrophone sensor was an Ocean Sonics icListen™ model SC2-ETH sampling at 256 kHz with 24-bit resolution. The hydrophone was calibrated by certified laboratories 9 months prior to use for the UNH-LB field recordings. The low-frequency calibration was performed by the accredited Ocean Networks Canada—Hydrocal Laboratory, which reported monotonically increasing sensitivity response from −184 to −180 dB re 1 V/µPa from 10 to 50 Hz, and a flat sensitivity response of −180 dB re 1 V/µPa from 50 to 700 Hz. The high-frequency calibration was performed at the accredited PNNL Bioacoustics and Flow Laboratory [24], which reported a sensitivity response of −184 dB re 1 V/µPa from 50–100 kHz. The hydrophone was also calibrated in the field prior to deployments using a B&K Hydrophone Calibrator Type 4229 pistonphone at 250 Hz.

2.4. Data Collection

To optimize acoustic recordings during the largest possible range of turbine generator power outputs, drifting hydrophone data were collected during the daylight hours of a week close to monthly maximum ebb tidal exchanges on 21–23 July 2021, during which the maximum daytime tidal currents reached 2.0 to 2.3 m/s. Due to this, turbine power generation only reached 5 kW, 20% of the 25 kW capacity rating during the acoustic recording period (described in Section 2.5 below, note that the nighttime tidal currents were about 0.2–0.3 m/s faster due to the daily inequality). Drifts targeting 25 m × 25 m zones centered 100 m upstream and 100 m downstream and slightly offset to the port side from the turbine axis to avoid collision were carried out as specified in the IEC 62600-40 TS. Although specified in the IEC 62600-40 TS, no recordings were collected from the starboard side (north) of the turbine because of the acoustic shadow and blocking from the adjacent bridge pier to which the TDP is attached. The port side (south) zone was moved toward the turbine as required by flow characteristics in the channel and spatial restrictions from nearby docks and shoreline structures. The center of this zone was positioned 25 m from the turbine axis.
During each drift sequence, the UNH support vessel moved into the upstream area above the target zone and, in an effort to avoid acoustic contamination, if there were no vessels operating within sight of the project area, the drifting hydrophone system was deployed, allowing ample time for the hydrophone sensor to settle at the desired depth in the target zone. Meanwhile the UNH vessel moved quickly upstream and turned off the engine and fathometer, going into a quiet mode and drifting with the current. The drifting hydrophone system was tracked visually as it passed the TDP and when it reached a distance ~100 m downstream of the TDP it had to be quickly recovered before drifting into shallow reef and rock structures. Upon recovering the drifting hydrophone system, the UNH support vessel transited back up-current to repeat the process. Drifts lasted 2–4 min depending on flow velocities. High levels of maritime activity on 22 July 2021 and thunderstorms on 23 July 2021 added complexity to the acoustic recording operations. A total of 14 hydrophone drifts were collected on 23 July 2021 and used in this analysis.

2.5. Data Processing and Analysis

GNSS position data for the drifting hydrophone buoy were post process kinematic (PPK) corrected using base station data from the National Oceanic and Atmospheric Administration (NOAA) Continuously Operating Reference Stations (CORS) Network [25] station ID NHUN on the nearby UNH campus in Durham, New Hampshire. Emlid Studio (Version 1) GNSS data processing software was used to PPK correct the Emlid Reach M2™-derived GNSS drifter positions, and flag data quality. Only positions identified with fixed and float solutions representative of the highest data quality with estimated horizontal accuracies <5 cm were included in the analysis, though we note that the compliant nature of the suspension system introduces at least this much ambiguity in the position of the hydrophone relative to the buoy. As the buoy drifted under the Memorial Bridge, the GNSS satellite signal connection was momentarily degraded during a roughly 10–15 m distance where data quality was below standards and therefore the associated data were removed from the analysis. To account for this data gap, linear interpolation was used to connect high-quality GNSS measurements.
Flow measurement data were collected upstream at the turbine mid-swept area depth 1.3 m below the water level using a FlowQuest™ 1000 ADCP from LinkQuest Inc. On 23 July 2021 maximum daytime ebb tidal currents of 2.33 m/s occurred during the afternoon. The turbine power generation time series was measured during periods of turbine operation when flow speeds were strong enough for the generator AC power output voltage, frequency, and phase to be rectified for grid synchronization. The IEC 62600-40 TS defines the percentage power ratings relative to the maximum rated capacity of the turbine, 25 kW in this instance. Since the rated power was never reached during this test, the maximum DC output (~5 kW) was used to normalize the power generation time series and determine the percentage power ratings during the two ebb tidal cycles that occurred during the 24 h period starting at 00:00 EDT 23 July 2021. This is a reasonable deviation from the maximum 25 kW specified overall capacity of the turbine used to calculate the percentage power ratings as defined in the IEC 62600-40 TS. As the 25 kW power generation state of the turbine is never achieved at the UNH-LB site, normalizing the generator output by the maximum measured value during the largest monthly tidal exchanges provides a robust measure of the range of power generation states for the turbine in this environment. The rated capacity was sorted into five categories—0%, 25%, 50%, 75%, and 100% [19]—and each category included the rated capacity values in the range of ±10% (Figure 3). Time stamps corresponding to these categories were identified and sound pressure characterization metrics were extracted according to the sorted capacity range.
Acoustic data were initially reviewed in spectrograms using Ishmael (version 1.0) software [26] to identify obvious periods of vessel noise contamination, thereby reducing the data set to only the times when the drifting hydrophone was deployed in the water. Time periods near the beginning or end of drifts where the UNH support vessel was moving away or toward the hydrophone were removed. Despite caution taken to avoid deploying the hydrophone during periods of visually observed vessel activity, vessel noise from distant boats or boats that appeared after a hydrophone drift began was still present in the acoustic record at low levels, and sequences containing this contamination were also subsequently removed. Flow noise in the acoustic data was limited, and the characteristic f−5/3 flow noise relationship [16] was not readily observed, owing to the successful design of the flow shield and the drifting hydrophone approach. The mean-square sound pressure spectral density level was plotted as a function of time and frequency (i.e., a spectrogram), and closer inspection of spectrograms from the reduced data set did not reveal any obvious noise sources. However, no characteristic acoustic signals attributable to turbines in previous studies [12,13,14,15] could be identified in the hydrophone recordings. Likewise, non-acoustic mechanical self-noise was not observed or was below established requirements [19]. A plot of the mean-square sound pressure spectral density levels from a nearby boat (<1 km), the 50% power capacity rating of the turbine in the port zone at 25 m, and a reference self-noise recording from the laboratory bench show the hydrophone sensor and system response were functioning properly during the turbine test period over a range of received sound levels (Figure 4). It is worth noting the terrestrial electromagnetic interference (EMI) in the bench test self-noise levels (e.g., 60 Hz) that is absent in the marine environment.
Sound pressure spectral density was calculated in the frequency band of 10 Hz to 100 kHz, following the IEC 62600-40 TS. As per the IEC 62600-40 TS, the time series were separated into 1 s windows, with each window overlapping by 50%. Each window was demeaned and weighted with a Hanning window. Time series of voltages recorded by the sound measurement system were converted to pressure and transformed to the frequency domain using a discrete Fourier transform [19]. The magnitude of the resulting mean-squared voltage spectral density was adjusted so that the total energy is equal to the variance in the time-domain window, following Parseval’s theorem. This can be verified by the formula:
V 2 ¯ = 0 f m a x V f 2   ¯ d f  
where the V 2 ¯ is the mean-squared voltage in the time series, f m a x is the maximum frequency component, i.e., Nyquist frequency, and V f 2 ¯ is the mean-squared voltage spectral density.
The mean-squared sound pressure spectral density level is related to the mean-squared voltage spectral density as:
L p , f = 10 l o g 10 ( p f 2 ¯ p 0 2 )   dB = 10 l o g 10 ( V f 2 ¯ V 0 2 )   dB ( G f + S f )  
where G f is the frequency-dependent gains of the power amplifier (in this study there was no power amplifier thus G f is zero), S f is the frequency-dependent receiving voltage sensitivity, p 0 2 is the reference value of 1 µPa2/Hz, p f 2 ¯ is the mean-squared sound pressure spectral density, and V 0 2 is the reference value of 1 V2/Hz. Note that the preamplifier integrated in the hydrophone should not be included as G f in Equation (2).
The decidecade sound pressure level is calculated as
L p , d d e c = 10 l o g 10 [ f 1 f 2 ( p f 2 ¯ ) d f p 0 2 ]   dB  
where f 1 and f 2 are the limits of a specified decidecade frequency band.
Statistics of the sound pressure characterization metrics described above were calculated: mean-squared sound pressure spectral density levels, decidecade sound pressure levels, and root mean square integrated sound pressure levels (SPL). These statistics include the median, first, and third quartile ranges and were evaluated in each zone (described in Section 2.4) for each turbine rated capacity bin. Statistical comparisons of decidecade sound pressure levels at the 25% and 50% turbine power states in each zone were compared pairwise to ambient noise (0% capacity) with a Mann–Whitney’s U-test. The tests used a significance level α of 5% which is modified to compare multiple pairwise decidecade sound pressure levels following the Dunn–Sidak method, with an α = 1 1 ( 1 α ) 1 n , where n = 40 in this case is the number of pairwise decidecade bands [27].

3. Results

Mean-squared sound pressure spectral density levels and integrated root mean-square SPLs were plotted as a function of distance to the turbine, as shown for a representative drift in Figure 5. These comparisons of measured sound levels with proximity to the turbine did not reveal any clear patterns in noise levels associated with the turbine, nor was any repeated, characteristic turbine signal observed above the background ambient acoustic conditions.
The median and interquartile range of the mean-squared sound pressure spectral density level (Figure 6) and decidecade sound pressure level (Figure 7) show that there were no data available for the 75% and 100% capacity bins for the three zones. These higher power generation states of the turbine occurred during the first, stronger ebb tidal sequence of the day, before daylight hours and before acoustic data were collected. The number of samples in each bin is summarized in Table 1. Comparisons of spectral levels within the upstream, downstream, and port zones did not show a clear and consistent increase from the time periods when the turbine was not operating (0%) to the times when it was generating power at a 50% rated capacity of the daily maximum (Figure 6 and Figure 7). Similarly, spectral and decidecade sound pressure density levels do not vary strongly between zones at the 0%-, 25%-, or 50%-rated capacities (Figure 6 and Figure 7).
The Mann–Whitney tests (p-value) provide statistical comparisons of the decidecade sound pressure levels at varying turbine power generation states in the different zones (Figure 8). In the port zone, although several of the decidecade frequency bands (~7000–10,000 Hz) at 25% turbine capacity were statistically different from the ambient acoustic conditions, the different frequencies did not remain consistent at the 50% turbine capacity rating (~1000–1500 Hz). Nor were these statistically different decidecade frequency levels observed in either of the other measurement zones, suggesting the statistical difference could not be attributed to noise from the turbine. In the upstream zone, decidecade acoustic levels from the 25% and 50% turbine power states were not significantly different from ambient levels at 0% capacity. In the downstream zone, both 25% and 50% turbine capacity acoustic measurements appeared to be significantly different from ambient noise in the decidecade bands <100 Hz. Meanwhile at frequencies >1000 Hz, the measured levels were not statistically different from ambient conditions at both 25% and 50% capacity. Again, the lack of consistency in the statistically significant affected frequencies below 100 Hz that are not observed in any other zone suggests alternative sound sources could be affecting turbine sound measurements in this zone. A more likely explanatory hypothesis for these sporadic differences between power states in different zones is temporal variability in ambient noise from other sources, such as recreational and commercial vessel traffic. (e.g., distant passing vessel).
Table 1 shows the median SPL and standard deviation in each measurement zone as a function of rated capacity (0%, 25%, 50%, ±10%) for the average capacity of samples included in the bin. Here, again, we observe no clear pattern of rising noise levels with increasing turbine power generation state. Rather, median SPL values decrease with increasing power capacity in the downstream zone but remain relatively steady in the upstream and port zones. Additionally, median SPL values remain consistent between the upstream and port zones regardless of power generation states. Further evidence of a lack of an acoustic contribution from the turbine to ambient noise levels in the surrounding area is shown in Figure 9. As the current carries the drifting hydrophone past the turbine, there is no associated pattern in the measured SPLs.

4. Discussion

There are several advantages of locating tidal turbine energy conversion systems at bridges, some of which include optimized current speeds resulting from constricted flow in areas that allow the shortest crossing bridge length, as well as being able to leverage existing deployment infrastructure (e.g., piers and pilings) [20]. These benefits help encourage rapid deployment and testing of near-surface turbine technologies from floating platforms and bridge structures with the added value of providing important public exposure to ME systems, and opportunities for environmental monitoring data collection during the early stages of testing, research, and development. Recognizing these benefits, the deployment infrastructure developed for the UNH-LB project will form the basis for a scaled tidal energy test site to be developed under the new Atlantic Marine Energy Center [26].
The IEC 62600-40 TS provides a valuable framework and guidance for standardized data collection, analysis, and presentation of results for underwater noise measurements and acoustic characterization of tidal turbines. Using this framework, acoustic emissions from the UNH-LB 25 kW turbine operating at reduced power generation capacity were not readily observed, and any signal levels remained below the higher ambient acoustic conditions that occur during the daylight recording periods in this busy port setting. Nevertheless, this effort provides a beneficial use case of the IEC 62600-40 TS, and despite a lack of detectable acoustic signal under the higher ambient sound level conditions and lower power generation state of the turbine, it is an important example that helps fill knowledge gaps, assist maintenance of the IEC 62600-40 TS, and inform regulators and industry. The minimal acoustic emissions and limited potential for wildlife disturbance from underwater noise associated with the UNH-LB tidal turbine during this test is viewed as a positive result (from an ocean stewardship perspective) and represents a useful addition to the growing collection of previous acoustic measurements at turbines that will assist future permitting and monitoring of marine renewable energy deployments. One of the main differences between the previous tidal turbine acoustic observations referenced in Section 1 and those associated with the UNH-LB tidal turbine is the location of the power conversion mechanism, gearing, and electronics. Unlike many of the seafloor-mounted turbines, the power conversion components of the UNH-LB turbine are found above water on the TDP, and noise and vibrations generated during power production with the direct-drive generator do not appear to effectively propagate along the turbine shaft or through the TDP structure into the water column. Comparisons of peak decidecade received levels around the UNH-LB turbine during 50% capacity rating power generation are significantly below those reported for other drifting hydrophone measurements of hydrokinetic turbines in similar marine [12,14] and large riverine environments [28] (Table 2). This provides further evidence for a lack of substantial turbine acoustic emissions during the measured power generation states at the Memorial Bridge in the higher, daytime ambient sound environment of the lower Piscataqua River tidal estuary.
Several recommendations and lessons learned from this effort will inform future data collection and measurements of underwater noise around tidal turbine sites. The IEC 62600-40 TS should be followed to the greatest extent possible to collect the most transferable data and analysis for comparisons across sites and devices. Still, because of logistical challenges and data limitations, some modifications to field and analysis efforts were needed to provide meaningful information. The modifications included shifting the upstream and downstream measurement zones slightly to port and bringing the port measurement zone inward to 25 m from the turbine axis due to current flow characteristics and spatial constraints of the site. Similarly, the threshold number of 10 acoustic measurement sequences within a zone for each power capacity rating was reduced to 6. This was a result of data limitations associated with vessel noise contamination during recording sequences. The consistent vessel activity in the busy port setting was the main driver of ambient sound levels and limiting data collection and analysis to times when vessels were both not operating within visual sight and could not be detected in the acoustic records was a significant challenge that made it difficult to cover the measurement zones at all the specified turbine capacity ratings. A recommendation for future acoustic recordings in busy port settings is to maintain flexibility to conduct operations during night hours when vessel traffic may be greatly reduced. Additionally, with maximum tidal current velocities during the tests well below turbine rated speed, the full power generation rating of the turbine was never reached and therefore the capacity rating times series for this analysis was normalized by the 24 h observed maximum, also a forward-looking recommendation.
As more opportunities for measuring and characterizing underwater sound from tidal turbines emerge, standardized, transferable measurements with readily available technologies and methodologies will inform monitoring decisions made to address regulatory concerns. Additionally, these in situ acoustic measurements can be used to parameterize underwater noise modeling efforts for future device deployments and provide important validation for model outputs at active project sites.

Author Contributions

Specific contributions from the authors are as follows: conceptualization, G.S., J.M. and Z.D.D.; methodology, J.H., J.M., G.S. and B.P.; software, X.Z.; formal analysis, J.H. and X.Z.; writing—original draft preparation, J.H., X.Z. and J.M.; writing—review and editing, J.H., X.Z., B.P., G.S., Z.D.D., M.W. and P.O. All authors have read and agreed to the published version of the manuscript.

Funding

This research was funded by the U.S. Department of Energy Water Power Technologies Office under contract DE-AC05-76RL01830 with the Pacific Northwest National Laboratory.

Data Availability Statement

Data will be made available under license CC-Attribution 4.0 via the Portal and Repository for Information on Marine Renewable Energy (PRIMRE) on the Marine and Hydrokinetic Data Repository (MHKDR) [https://mhkdr.openei.org/, accessed on 8 March 2022].

Acknowledgments

The authors acknowledge Jon Hunt and Mason Bichanich of University of New Hampshire for vessel operations and field support, and Corey Crisp of the University of Washington for testing plan discussions and collaboration in the field. We’d also thank Kyle Larson of PNNL for assistance with maps and graphics and Susan Ennor who improved an earlier version of this manuscript.

Conflicts of Interest

The authors declare no conflict of interest. The funders had no role in the design of the study; in the collection, analyses, or interpretation of data; in the writing of the manuscript; or in the decision to publish the results.

References

  1. Kilcher, L.; Fogarty, M.; Lawson, M. Marine Energy in the United States: An Overview of Opportunities; National Renewable Energy Laboratory: Golden, CO, USA, 2021. [CrossRef]
  2. Slabbekoorn, H.; Bouton, N. Soundscape orientation: A new field in need of sound investigation. Anim. Behav. 2008, 4, e5–e8. [Google Scholar] [CrossRef]
  3. Pijanowski, B.C.; Villanueva-Rivera, L.J.; Dumyahn, S.L.; Farina, A.; Krause, B.L.; Napoletano, B.M.; Gage, S.H.; Pieretti, N. Soundscape ecology: The science of sound in the landscape. BioScience 2011, 61, 203–216. [Google Scholar] [CrossRef] [Green Version]
  4. Shannon, G.; McKenna, M.F.; Angeloni, L.M.; Crooks, K.R.; Fristrup, K.M.; Brown, E.; Wittemyer, G.; Warner, K.A.; Nelson, M.D.; White, C.; et al. A synthesis of two decades of research documenting the effects of noise on wildlife. Biol. Rev. 2016, 91, 982–1005. [Google Scholar] [CrossRef] [PubMed]
  5. Peng, C.; Zhao, X.; Liu, G. Noise in the sea and its impacts on marine organisms. Int. J. Environ. Res. Public Health 2015, 12, 12304–12323. [Google Scholar] [CrossRef] [PubMed] [Green Version]
  6. Erbe, C. Effects of underwater noise on marine mammals. In The Effects of Noise on Aquatic Life; Springer: Berlin/Heidelberg, Germany, 2012; pp. 17–22. [Google Scholar]
  7. Copping, A.E.; Hemery, L.G.; Overhus, D.M.; Garavelli, L.; Freeman, M.C.; Whiting, J.M.; Gorton, A.M.; Farr, H.K.; Rose, D.J.; Tugade, L.G. Potential environmental effects of marine renewable energy development—The state of the science. J. Mar. Sci. Eng. 2020, 8, 879. [Google Scholar] [CrossRef]
  8. National Marine Fisheries Service. 2018 Revision to: Technical Guidance for Assessing the Effects of Anthropogenic Sound on Marine Mammal Hearing (Version 2.0): Underwater Thresholds for Onset of Permanent and Temporary Threshold Shifts; National Oceanic and Atmospheric Administration: Washington, DC, USA, 2018.
  9. Popper, A.N.; Hawkins, A.D.; Fay, R.R.; Mann, D.A.; Bartol, S.; Carlson, T.J.; Tavolga, W.N.; Coomabs, S.; Ellison, W.T.; Gentry, R.L.; et al. sound Exposure guidelines. In ASA S3/SC1. 4 TR-2014 Sound Exposure Guidelines for Fishes and Sea Turtles: A Technical Report Prepared by ANSI-Accredited Standards Committee S3/SC1 and Registered with ANSI; Springer: Berlin/Heidelberg, Germany, 2014; pp. 33–51. [Google Scholar]
  10. Polagye, B. Challenges to characterization of sound produced by marine energy converters. In Marine Renewable Energy; Springer: Berlin/Heidelberg, Germany, 2017; pp. 323–332. [Google Scholar]
  11. Wilson, B.; Lepper, P.A.; Carter, C.; Robinson, S.P. Rethinking underwater sound-recording methods to work at tidal-stream and wave-energy sites. In Marine Renewable Energy Technology and Environmental Interactions; Springer: Berlin/Heidelberg, Germany, 2014; pp. 111–126. [Google Scholar]
  12. Risch, D.; van Geel, N.; Gillespie, D.; Wilson, B. Characterisation of underwater operational sound of a tidal stream turbine. J. Acoust. Soc. Am. 2020, 147, 2547–2555. [Google Scholar] [CrossRef] [PubMed] [Green Version]
  13. Schmitt, P.; Elsaesser, B.; Coffin, M.; Hood, J.; Starzmann, R. Field testing a full-scale tidal turbine part 3: Acoustic characteristics. In Proceedings of the European Wave and Tidal Energy Conference 2015, Nantes, France, 6–11 September 2015. [Google Scholar]
  14. Polagye, B. Acoustic characterization of a hydrokinetic turbine. In Proceedings of the 11th European Wave and Tidal Energy Conference, Nantes, France, 6–11 September 2015. [Google Scholar]
  15. Lossent, J.; Lejart, M.; Folegot, T.; Clorennec, D.; Di Iorio, L.; Gervaise, C. Underwater operational noise level emitted by a tidal current turbine and its potential impact on marine fauna. Mar. Pollut. Bull. 2018, 131, 323–334. [Google Scholar] [CrossRef] [PubMed]
  16. Bassett, C.; Thomson, J.; Dahl, P.H.; Polagye, B. Flow-noise and turbulence in two tidal channels. J. Acoust. Soc. Am. 2014, 135, 1764–1774. [Google Scholar] [CrossRef] [PubMed] [Green Version]
  17. Eaves, S.L.; Staines, G.; Harker-Klimeš, G.; Pinza, M.; Geerlofs, S. Triton Field Trials: Promoting Consistent Environmental Monitoring Methodologies for Marine Energy Sites. J. Mar. Sci. Eng. 2022, 10, 177. [Google Scholar] [CrossRef]
  18. University of New Hampshire. Portsmouth Memorial Bridge: The Living Bridge. Available online: https://livingbridge.unh.edu/ (accessed on 10 December 2021).
  19. IEC/TS 62600-40; Acoustic Characterization of Marine Energy Converters. International Electrotechnical Commisssion: Geneva, Switzerland, 2019; p. 44. Available online: https://webstore.iec.ch/publication/31031 (accessed on 8 August 2019).
  20. Chancey, K. Assessment of the Localized Flow and Tidal Energy Conversion System at an Estuarine Bridge. Master’s Thesis, University of New Hampshire, Durham, NH, USA, 2019; p. 135. [Google Scholar]
  21. Gagnon, I. A Hydrokinetic Turbine Deployment System for Use at Bridges with the Memorial Bridge as a Case Study. Master’s Thesis, University of New Hampshire, Durham, NH, USA, 2018; p. 212. [Google Scholar]
  22. Chang, G.; Harker-Klimeš, G.; Raghukumar, K.; Polagye, B.; Haxel, J.; Joslin, J.; Staines, G.; Spada, F. Clearing a Path to Commercialization of Marine Renewable Energy Technologies Through Public–Private Collaboration. Front. Mar. Sci. 2021, 8, 1180. [Google Scholar] [CrossRef]
  23. Polagye, B.; Noe, J.; Murphy, P. Flow-noise mitigation for drifting acoustic measurements in current-dominated environments. In Proceedings of the 6th Marine Energy Technology Symposium, Washington, DC, USA, 30 April–2 May 2018. [Google Scholar]
  24. Deng, Z.; Weiland, M.; Carlson, T.; Eppard, M.B. Design and instrumentation of a measurement and calibration system for an acoustic telemetry system. Sensors 2010, 10, 3090–3099. [Google Scholar] [CrossRef] [PubMed]
  25. NOAA National Geodetic Survey. User Friendly CORS (UFCORS)—Continuously Operating Reference Station Network; NOAA National Geodetic Survey: Silver Spring, MD, USA, 2021.
  26. Mellinger, D.K. Ishmael 1.0 User’s Guide; NOAA Technical Memorandum OAR PMEL: Seattle, WA, USA, 2001; Volume 120.
  27. Tougaard, J. Underwater Noise from a Wave Energy Converter Is Unlikely to Affect Marine Mammals. PLoS ONE 2015, 10, e0132391. [Google Scholar] [CrossRef]
  28. Bevelhimer, M.S.; Deng, Z.D.; Scherelis, C. Characterizing large river sounds: Providing context for understanding the environmental effects of noise produced by hydrokinetic turbines. J. Acoust. Soc. Am. 2016, 139, 85–92. [Google Scholar] [CrossRef] [PubMed]
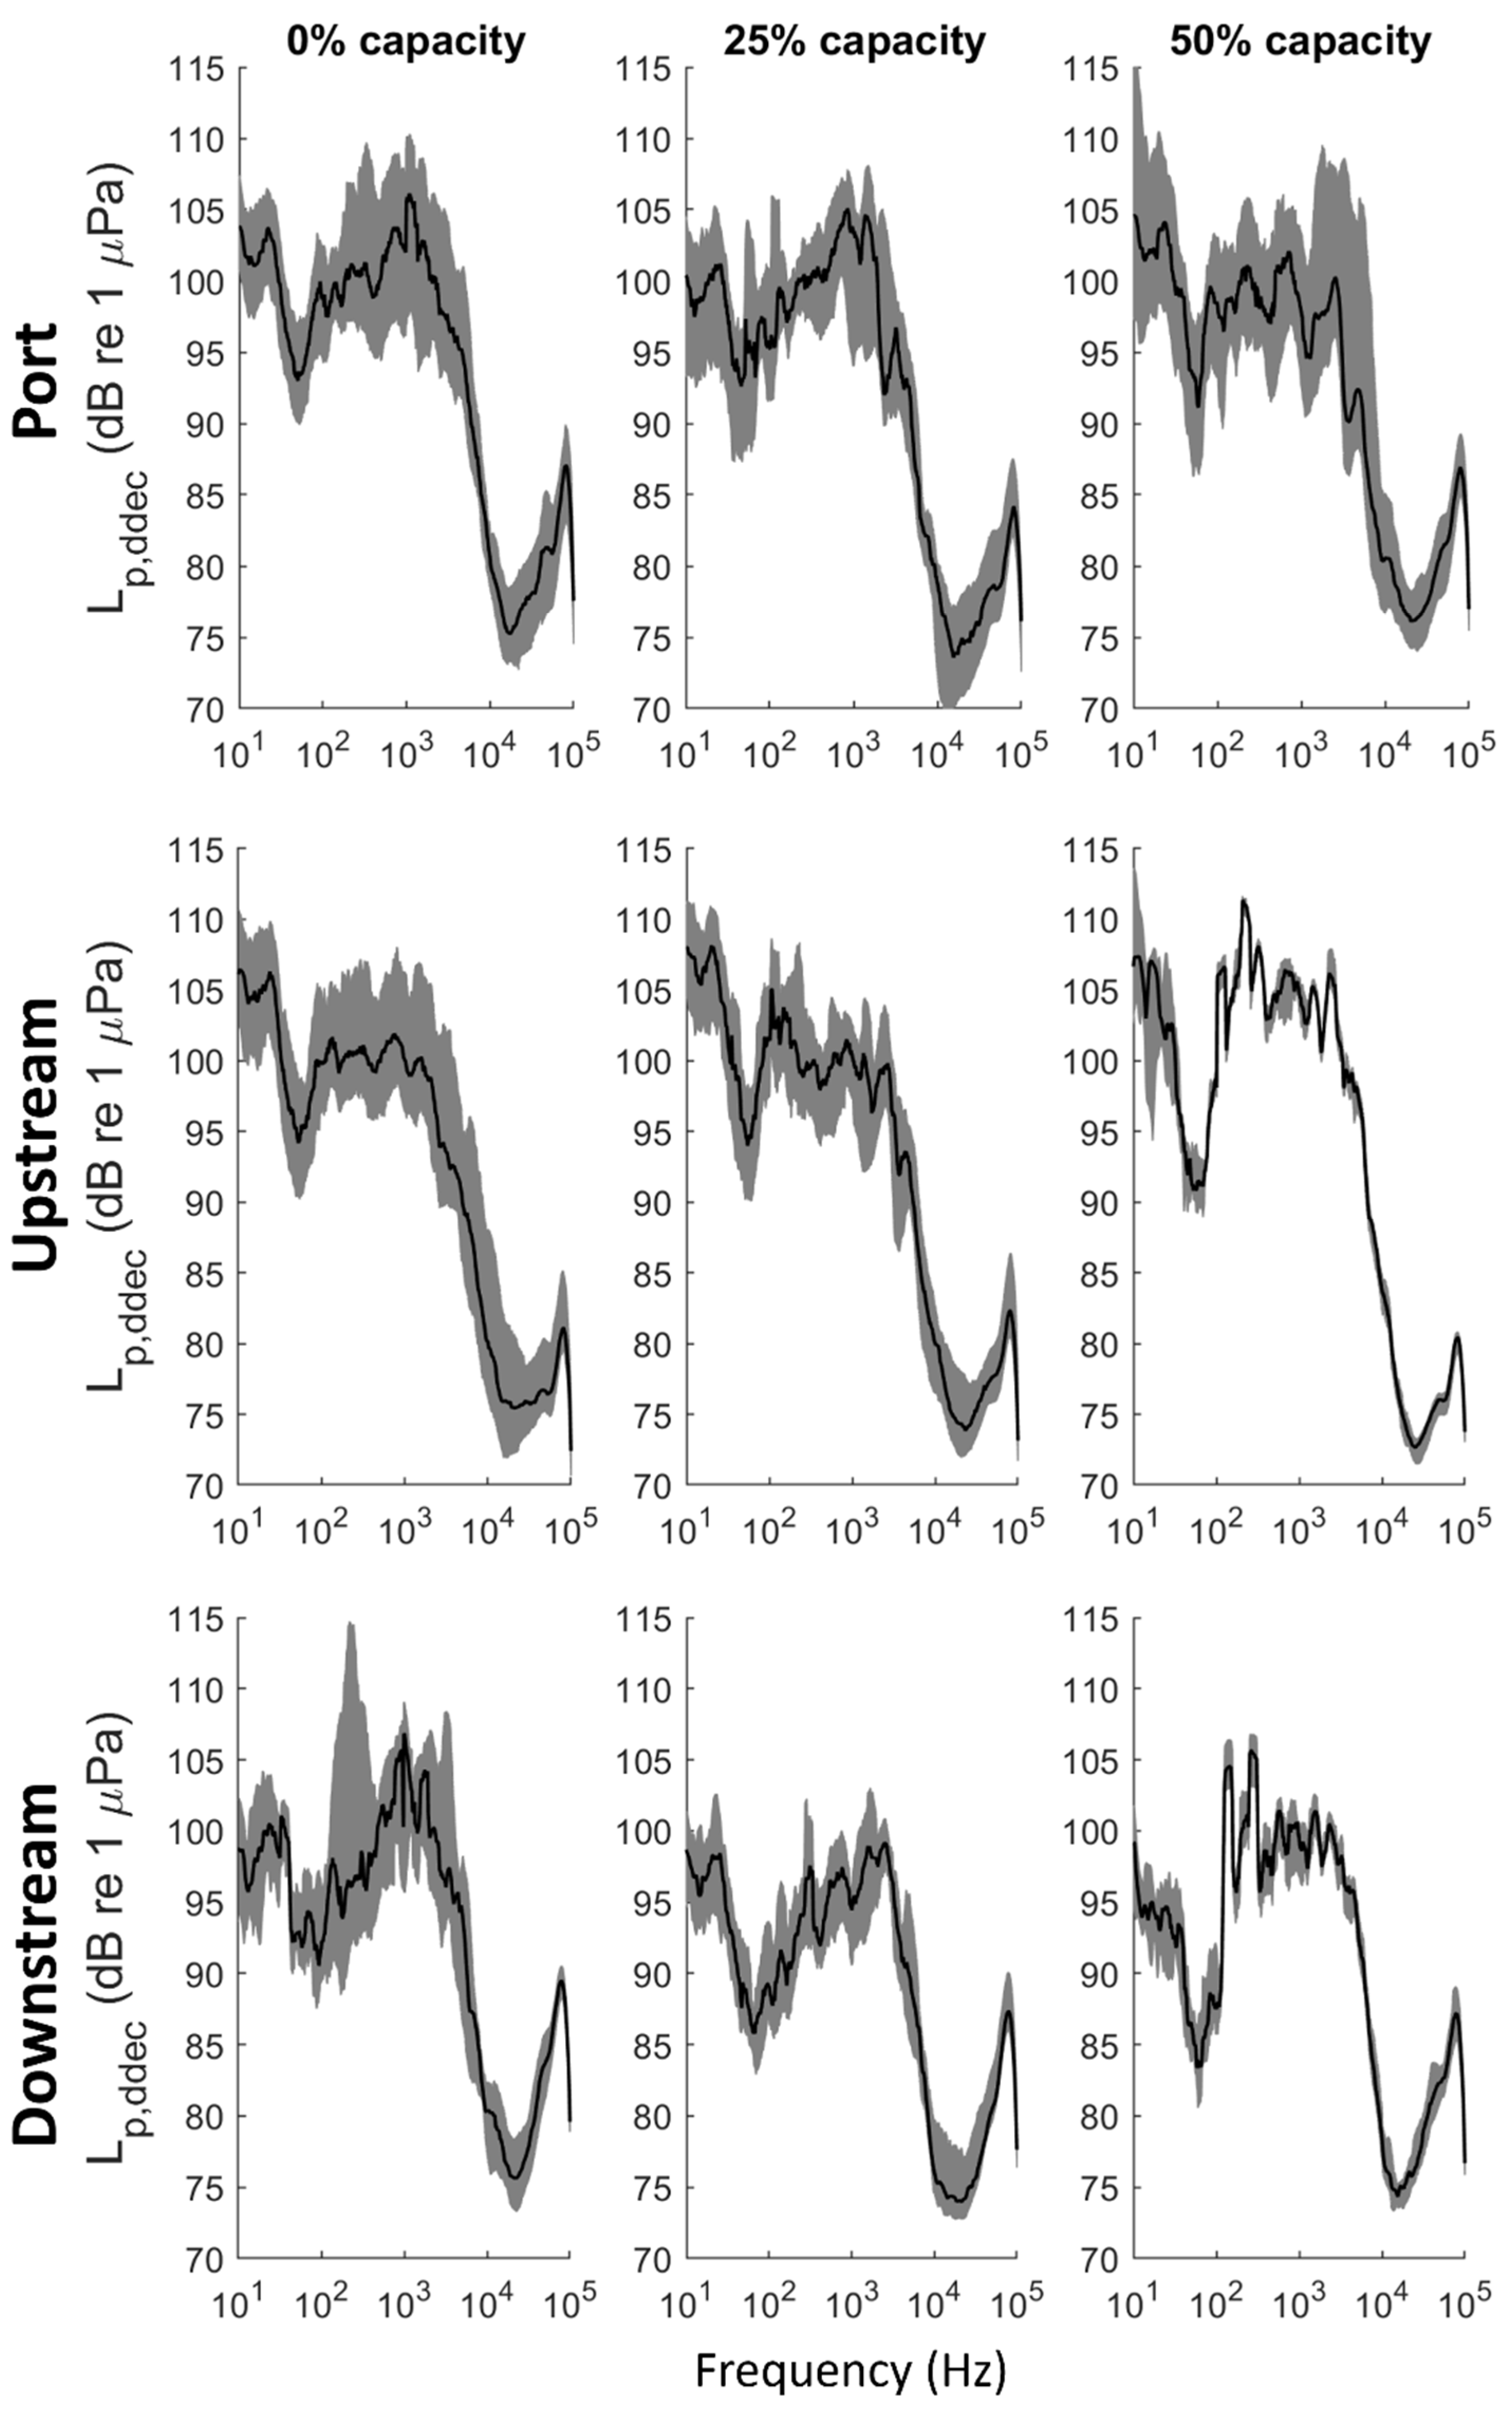
Figure 1. The University of New Hampshire’s Living Bridge Project turbine deployment platform is moored to a pier of the Memorial Bridge that spans the Piscataqua River and tidal estuary on the border of New Hampshire and Maine in the northeastern Unites States. The star in the lower right inset map represents regional reference location of the site.
Jmse 10 00632 g001
Figure 2. (a) The drifting hydrophone system components and configuration including surface buoy, GNSS, shock and static lines connecting the buoy to the lower hydrophone housing and flow shield. (b) A drawing of the lower, underwater housing and mounting configuration of the hydrophone sensor and flowshield support structure. Note that both ballast weights and syntactic foam are incorporated in the mounting design to maintain proper sensor orientation and stability at depth.
Jmse 10 00632 g002
Figure 3. Turbine power-rated capacity at five color-coded ranges (0%, 25%, 50%, 75%, 100%, ±10%), on 23 July 2021, from midnight to 18:39:14, Eastern Daylight Time (EDT). The rated capacity shown here was calculated by dividing the turbine power generation time series by the measured maximum turbine power output observed during the ~19-h period on 23 July 2021. Note, hydrophone recordings were limited to daylight hours during the second ebb tide period (13:54:00–17:16:00 EDT).
Jmse 10 00632 g003
Figure 4. Mean-square sound pressure spectral density levels for a boat (blue) and the 50% rated turbine capacity (black) from the UNH-LB drifting hydrophone recordings. Levels from a reference self-noise recording by the system from the laboratory bench are also shown (green).
Jmse 10 00632 g004
Figure 5. Examples of the sound pressure spectral level (a) and the sound pressure level (b) as a function of distance between the drifting hydrophone and the turbine axis. The horizontal axis denotes measurements from +70 m upstream of the energy converter to the minimum distance of 12 m, and then to −93 m downstream of the turbine. Data are from the fifth drift on 23 July 2021. No significant increase in sound pressure level was observed as the hydrophone approached the turbine, and the turbine power output remained relatively stable (c). A non-recurring increase in sound pressure and spectral levels is observed from −50 m to −60 m, possibly attributed to a distant passing vessel- or bridge-related noise.
Jmse 10 00632 g005
Figure 6. Median values (black curves) and interquartile range (gray region) of the mean-square sound pressure spectral density levels at five rated capacity levels in three 25 m × 25 m zones: port (top row), upstream (middle row), and downstream (bottom row) (see Figure 7). There are no acoustic measurements from the 75% and 100% turbine power generations states, which occurred during the stronger ebb tide of the day in the dark hours before sunrise.
Jmse 10 00632 g006
Figure 7. Median values (black curves) and interquartile range (gray shadow) of the decidecade sound pressure levels at five rated capacity levels in three 25 m × 25 m zones: in the upstream (first row), downstream (second row), and port (third row) directions from the turbine (see Figure 7). The frequency axis labels denote the lower limit of each decidecade frequency band. There are no acoustic measurements from the 75% and 100% turbine power generations states, which occurred during the stronger ebb tide of the day in the dark hours before sunrise.
Jmse 10 00632 g007
Figure 8. Results of pair-wise Mann–Whitney tests (p-value) for the decidecade sound pressure levels comparing values at the 25% (panels a,c,e) and 50% (panels b,d,f) turbine power generation states with baseline noise levels at 0% in each zone. The frequency axis labels denote the lower limit of each decidecade frequency band. Red dash lines indicate 5% significance level, adjusted for multiple comparisons.
Jmse 10 00632 g008
Figure 9. Sound pressure levels along 14 drifting tracks. Note the three 25 m × 25 m zones centered roughly 100 m upstream and downstream of the turbine, and the zone centered 25 m to port where the sound metrics were calculated.
Jmse 10 00632 g009
Table 1. The median and standard deviation values (in brackets) of the sound pressure levels in each measurement zone as a function of rated capacity (0%, 25%, 50%, within ±10% for the average capacity of samples included in the bin). No data points met the 75% or 100% capacity level in any of the assessment zones. N is the number of samples in each zone and capacity range. Units are in dB ref 1 μPa.
Zone0%
Capacity
25%
Capacity
50%
Capacity
Port117.7
(N = 134, std = 5.73)
116.4
(N = 34, std = 4.82)
116.3
(N = 35, std = 7.56)
Upstream118.5
(N = 146, std = 8.95)
116.1
(N = 34, std = 3.46)
119.4 dB
(N = 12, std = 1.75)
Downstream120.6
(N = 25, std = 4.48)
111.8
(N = 33, std = 5.38)
113.0
(N = 12, std = 1.74)
Table 2. Sound pressure levels recorded by drifting hydrophones from four marine and large riverine CECs.
TurbineCapacitySPL
(dB re 1 µPa)
Frequency
(Hz)
Range
(m)
Reference
RivGen35 kW137 dB50–1000 Hz1–2 m[14]
Atlantis
AR1500
1.5 MW136 dB100–1000 Hz<100 m[12]
TidGen150 kW121 dB10–15 kHz21 m[28]
Envirogen
025
25 kW116 dB10–100 kHz10–40 mThis study
Publisher’s Note: MDPI stays neutral with regard to jurisdictional claims in published maps and institutional affiliations.

