Article

Promising Strategies for the Reduction of Pollutant Emissions from Working Vessels in Offshore Wind Farms: The Example of Taiwan

Department of Marine Engineering, National Taiwan Ocean University, Keelung 20224, Taiwan
*
Author to whom correspondence should be addressed.
J. Mar. Sci. Eng. 2022, 10(5), 621; https://doi.org/10.3390/jmse10050621
Submission received: 29 March 2022 / Revised: 28 April 2022 / Accepted: 29 April 2022 / Published: 2 May 2022
(This article belongs to the Topic Marine Renewable Energy)

Abstract

:
There are excellent offshore wind resources in the ocean off the west coast of Taiwan, and renewable offshore wind power has been actively developed in recent years. This study intends to establish a cost-effectiveness assessment model to compare the pollutant emissions and cost benefits of traditional fossil fuel and fuel cells used as the propulsion force of working vessels in Taiwan’s offshore wind farms. According to MARPOL, vessels should use very-low-sulfur fuel oil (VLSFO) with sulfur content of less than 0.5 wt. %. Therefore, this study proposes two strategies: changing marine power from VLSFO to ultra-low-sulfur diesel (ULSD) and a proton exchange membrane fuel cell (PEMFC). The emission reduction and cost benefit were analyzed in comparison with the original condition when VLSFO was used. The results show that compared with the total cost of VLSFO, the total costs of Strategy ULSD and Strategy PEMFC increase by 7.5% and 51.2%, respectively, over five years. Strategy PEMFC brings environmentally friendly benefits primarily by reducing SOx, NOx, HC, PM, and CO2 emissions by 100%, 97.4%, 91.8%, 81%, and 81.6%, respectively, as compared with VLSFO. The cost–benefit ratio (CBR) of Strategy ULSD was higher than that of Strategy PEMFC in the first three years after improvements were made, and then the trend reversed. Strategy PEMFC is suitable as an alternative marine power source for the medium- and long-term (more than three years), while Strategy ULSD is suitable as a short-term investment for less than three years.

1. Introduction

In the face of rapidly accelerating climate change and energy resource shortages, offshore wind energy is crucial to the energy transition strategy [1]. As 16 of the world’s 20 most optimal wind farms are located in the Taiwan Strait, Taiwan is rated as one of the most popular countries for wind farms in the world by 4C Offshore, an international offshore wind power project consulting company [2]. According to studies of the National Aeronautics and Space Administration (NASA) of the United States, in the coastal area of Taiwan, the wind speed is over 7 m/s throughout the year and the average wind power density is over 750 W/m2 [3], which attracts investors in wind energy from many countries to build wind farms on the west coast of Taiwan. The total generating capacity is expected to reach 5.7 GW by 2025 in order to achieve the goal of generating 20% of Taiwan’s total electricity from renewable energy [4]. Hence, different types and sizes of vessels [5], professional crews, and technicians are needed to build offshore wind farms. During the exploration phase, marine ecology observation vessels, submarine drilling-survey vessels, geophysical survey vessels, and offshore support vessels of remotely operated vehicles (ROVs) are required to investigate the site conditions in order to reduce the impact on the environment and ecology [6]. During the installation and construction phases, vessels with different functions, such as ROVs, dredgers, stone dumpers, anchor handlers, floating cranes, tugs, guard vessels, cable installation vessels, jack-up installation vessels, and barges [7], are needed for equipment installation. However, the above-mentioned vessels will emit 28% (i.e., 10 g CO2-eq/kWh) of the total greenhouse gas during marine installation and maintenance in offshore wind farms [8]. A significant amount of pollution created by vessels in offshore wind farms appears during sailing, operation, and maintenance.
The International Convention for the Prevention of Pollution from Ships (MARPOL) Annex VI was amended and executed by the International Maritime Organization (IMO) in January 2020 and mandates a reduction in the maximum sulfur content in marine fuel oil from 3.5 wt. % to 0.5 wt. % [9]. However, vessels can use pollution-reduction devices or alternative fuels with equivalent emission reductions to reduce pollutant emissions from global shipping [10]. The IMO aims at a 50% reduction in the total annual greenhouse gas (GHG) emissions from ships by 2050, as compared with 2008 [11], and a 40% reduction in carbon dioxide (CO2) emissions by 2030. Moreover, it was estimated that, from 2023 to 2026, the annual carbon reduction should be 2% [12]. In order to meet MARPOL’s requirements for the upper limit of sulfur content, carriers have a range of options, such as installing scrubbers or using alternative fuels (such as marine gas oil (MGO) or marine diesel oil (MDO)) or very-low-sulfur fuel oil (VLSFO), which is used by most current carriers [13]. However, as VLSFO is a mixture of heavy fuel oil, distilled oil, and residual fuel oil [14], it can increase the ignition point, degrade the combustion quality, and block devices. As the operating stability of the marine power system is reduced, the possibility of accidents, such as vessel fault and shutdowns, is increased [15]. Hence, as VLSFO cannot effectively eliminate environmental pollution, it can be regarded merely as a transitional fuel.
Possible strategies for reducing pollutant emissions from shipping by various approaches have always attracted the interest of researchers [16]. Advanced mitigation measures for the fuel consumption rate have been proposed as well. Adland et al. [17] investigated the impact of periodic hull cleaning on the daily fuel consumption and energy efficiency of oil tankers. The application of an antifouling coating with lower roughness to reduce the fuel consumption of and greenhouse gas emissions from crude oil and bulk carriers was studied by Farkas et al. [18]. Two wind power technologies, including a towing kite and a Flettner rotor, were applied as the propulsive power of cargo carriers in order to reduce emissions [19]. The authors found that Flettner rotors might reduce the fuel consumption of the main engine by half. Castro et al. [20] took dredgers as an example and used Life Cycle Performance Assessment (LCPA) as a tool to evaluate the effect of changing from heavy fuel oil (HFO) to alternative fuels on working vessels. Łebkowski [5] developed a mathematical simulation model to analyze the possibility of applying electric propulsion systems to crew transportation vessels (CTVs) used to convey maintenance engineers for offshore wind power. The results showed that hybrid electric propulsion systems can significantly reduce pollutant emissions. Fuel cells are mostly used as propulsion power for small-sized vessels, such as ferries, research vessels, and rescue boats [21,22,23,24,25]. McKinlay et al. [26] found that fuel cells can help power large liquefied natural gas (LNG) vessels on international routes. Fuel cells are power-generation devices that use an electrochemical process and have the advantages of a low noise level and high efficiency [27] and have received much attention from all sectors of navigation. Unlike solar panels and batteries, fuel cells can provide continuous power for long and uninterrupted periods of time. A fuel cell, which consists of two electrodes (an anode and a cathode) and an electrolyte, can convert chemical energy into electrical energy without the combustion process and pollutant emissions. Pure deionized water and heat are the side products of the entire fuel-cell electrochemical process, as shown in Equation (1) [28].
2H2(g) + O2(g)→ 2H2O(g) + heat
where g is the gas phase.
The different types of fuel cells have similar working principles and are generally classified according to the fuel used and operating mechanisms. Currently, fuel cells can be divided into the following six types: alkaline fuel cells (AFCs), proton exchange membrane fuel cells (PEMFCs), phosphoric acid fuel cells (PAFCs), molten carbonate fuel cells (MCFCs), solid oxide fuel cells (SOFCs), and direct methanol fuel cells (DMFCs) [29,30,31]. PEMFCs work at relatively lower temperatures, generally under 80 °C, and have few safety concerns. With their other advantages of a quick start, high stability, and small volume, they are often used in transportation vehicles and portable products. McKinlay et al. [32] analyzed three potential fuels, including hydrogen, ammonia, and methanol, and found that hydrogen is the cleanest zero-emission fuel and is easy to produce. According to Castro et al. [20], liquid hydrogen (LH2), which can be easily used in potential fuels, is a promising choice for vessels working near the coast or in inland waterways. PEMFCs are considered as alternative power sources to replace the traditional VLSFO fuel in this study. The main disadvantage of this type of fuel cell is the high price of the noble metal catalyst used. If the amount of catalyst is reduced, the operating temperature will rise, leading to a high operating cost of proton exchange membrane fuel cells.
An appropriate transition from traditional fossil fuel to cleaner fuel or propulsion power for vessels sailing in offshore wind farms is required to effectively reduce pollutant emissions [33]. Adequate evaluation methods are considered for promising alternative fuels for vessels working in offshore wind farms. Few previous studies investigated promising alternative power sources to traditional fossil fuel for vessels working in offshore wind farms. No studies have conducted investigations on alternative clean fuels for vessels working in offshore wind farms to reduce emissions. In order to fill the gap in the literature, the cost–benefit analysis (CBA) method was applied to evaluate competitive pollution-reduction strategies since this method can easily digitize incremental costs spent and benefits obtained. The execution feasibility and priority of the evaluated strategies can be judged accordingly based on the evaluation results of the CBA method.

2. Alternative Fuel Strategies for Improving the Air Quality in Offshore Wind Farms

The two alternative fuel strategies discussed in this study focus on replacing the currently used VLSFO with ULSD or a PEMFC, and we took the pollutant emissions and operating costs of VLSFO (with sulfur content S ≤ 0.5 wt. %) as the basis for comparison. Strategy ULSD and Strategy PEMFC represent the two alternative fuel strategies, as shown in Table 1. The items of operating costs and pollutant emissions of all strategies are different. VLSFO is the main fuel currently used by carriers, and while VLSFO met the IMO’s requirements for sulfur content in 2020, it is a residual fuel oil that is mixed with high- and low-sulfur heavy oils to achieve its sulfur content of less than 0.5 wt. % [34]. Mixing different kinds of heavy oils will lead to different fuel characteristics and reduce the storage and operating stabilities of the heavy oil [15]. In the process of heating, a lighter fuel oil will gasify, delay ignition, discontinue combustion, and accelerate the precipitation of asphalt, colloids, or wax from the fuel into the oily sludge, which can block oil separators and filters, produce carbon deposition, and break down the main and auxiliary engines. From the perspective of environmental protection, VLSFO can still cause a significant amount of pollution. Therefore, this study proposes two alternative fuel strategies for emission reduction, which are explained below.

2.1. Scheme of Strategy ULSD

The fuel oil used by vessels often contains a large amount of sulfur, nonflammable asphalt, and impurities. The chemical compounds produced after fuel combustion are emitted into the environment. After being combined with water, the sulfur oxides will produce highly corrosive sulfuric acids [35], which will erode the surface of the mechanical parts. ULSD is a distilled petroleum-derived oil with sulfur content of less than 10 ppm, which meets the IMO’s sulfur content regulations of 2020. ULSD has high flammability, a short ignition delay, and smooth combustion. Moreover, ULSD can lubricate fuel injection systems well and increase the service life of injection pumps. The lower amount of residual carbon after burning ULSD in an internal combustion engine can help avoid the blockage of piston rings and therefore reduce the maintenance costs arising from poor combustion of inferior fuels such as VLSFO. While ULSD uses the same compression-ignition engine as VLSFO, VLSFO can be directly replaced by ULSD. The density, sulfur content, and cetane index of ULSD are 822.6 kg/m3, 1.7 mg/kg, and 54.3, respectively [36]. The application of Strategy ULSD can reduce the initial investment costs of the heating boilers that are required when VLSFO is used to reduce its viscosity without significant modifications to the engine systems of the vessels. However, the higher cost of ULSD compared with VLSFO is a key issue that needs to be evaluated when determining whether to replace VLSFO.

2.2. Scheme of Strategy PEMFC

Based on the characteristics of the six types of fuel cells, PEMFCs have the characteristics of a low operating temperature and a quick start; therefore, they are suitable for use as an alternative power source for vessels working offshore. Thus, this study proposes a PEMFC as an alternative strategy. Unlike Strategy ULSD, this Strategy has such advantages as the potential for greatly reducing air pollutant emissions, a low working noise level, no diesel engine vibrations, a highly flexible power layout, a short refueling time, and no oil spillages and leakages [32]. A PEMFC requires hydrogen as its fuel source, which is a colorless, odorless, and highly active inflammable gas. Hydrogen is the lightest atom in the periodic table of elements and has a very high calorific value (about 142 MJ/kg) [37]. Hydrogen can be converted from fossil fuels or renewable energy sources. Fossil fuel conversion methods include natural gas restructuring, coal gasification, and oil conversion, while renewable energy source conversion methods include biomass, electrolysis of water using solar energy, microorganisms, biological water–gas conversion, and biophotolysis. All the production technologies and processes for manufacturing hydrogen have different costs. As the most common way to produce hydrogen at present is to convert it from fossil fuels [38], hydrogen was produced from fossil fuels in this study. However, hydrogen storage is also a key technology. The density of liquid hydrogen (LH2) is 845 times that of gaseous hydrogen [39]. The energy density per unit volume of LH2 is much higher than that of compressed hydrogen gas. In order to store hydrogen as efficiently as possible, hydrogen should be converted into its liquid state, which requires expensive equipment, such as equipment for hydrogen liquefaction, storage tanks, and special pipelines.
Currently, hydrogen refueling stations are not widely used at major ports around the world. There are two ways to fill PEMFC vessels with LH2: (1) refueling from on-site stationary tanks; and (2) refueling from tanker trucks [40]. This study conducted cost calculations and benefit evaluations based on refueling vessels with LH2 from on-site stationary tanks. In order to ensure safe navigation, the ranges of hazardous areas should be determined; for example, high-pressure refueling stations (containing refueling joints, gas phase pipelines, and control valves), hydrogen storage tanks (containing hydrogen cylinder units and inert nitrogen systems), and fuel cell locations (containing fuel cell modules and hydrogen pipelines) should be built in ventilated spaces [41] in order to prevent the accumulation of escaped hydrogen gas. In addition, gas detection and automatic disconnection systems should be equipped with a hydrogen-refueling facility. For the safe use of hydrogen fuel cells on working vessels, regulations of the IMO and classification societies should be followed, including the International Convention for the Safety of Life at Sea (SOLAS) and the International Code of Safety for Ships using Gases or other Low-flashpoint Fuels (IGF Code). The hydrogen-related regulations in Part 6 of the Hydrogen Fuel Cell Vessel Manual, as issued by Det Norske Veritas (DNV), can be referred to [42] as well, in order to improve the safety of vessels using gas fuels. It is noted that hydrogen fuel cells have high initial set-up costs, and while liquid hydrogen is more expensive than fuel oil, it has lower maintenance costs.

3. Calculation Methods for the Emissions and Costs of the Implemented Strategy

The cost–benefit analysis (CBA) method is often used to estimate the economic performance or contributions of policies. This study used CBA to evaluate the total annual incremental cost, pollutant emission reduction, and cost–benefit ratio (CBR) of vessels working in offshore wind power farms using alternative clean fuels over a period of five years from 2022 to 2026. An offshore working vessel with a gross tonnage of 7636 [40] owned by a marine construction company working in offshore wind farms on the west coast of Taiwan was taken as the research subject. ULSD and a PEMFC were used as alternative sources of fuel or power to replace the currently used VLSFO. Built in 2012, the vessel is powered by two marine diesel engines (MEs), and the continuous service rating (C.S.R) of the engine is 3500 kW at 750 rpm [43].
This study considered the pollutant emission reductions, incremental costs, and cost–benefit ratio of the offshore working vessel under different strategies (i.e., Strategy ULSD and Strategy PEMFC). The actual cruise hours of the working vessel were taken as an evaluation basis. The voyage of the working vessel off the west coast of Taiwan can be roughly divided into five stages: from the berth at the departure port to the breakwater, from the breakwater to the wind farm, working at the wind farm, from the wind farm to the breakwater at the destination port, and from the breakwater to the berth at the destination port. In Stages 2 and 4, the vessel sailed at a constant speed under normal circumstances, during which the speed of the main engine was not deliberately increased or decreased except in emergencies. The offshore working vessel sailed for a total of 188 days in 2020, for a total of 4512 h in the year, which was taken as the annual number of cruise hours for the working vessel in the offshore wind power farm. The averaged fuel consumption rate of the entire cruise course of the working vessel was taken as 195 g/kWh.
The cost items of the two implemented strategies consist of capital expenditures (CAPEXs) and operating expenditures (OPEXs). CAPEXs refer to funds and fixed asset investments, which are usually included in the annual expenditure as depreciation. OPEXs refer to the ongoing and exhaustive expenditures for a running business. The total cost is the sum of the CAPEXs and OPEXs. The CAPEX and OPEX items required for Strategy ULSD and Strategy PEMFC are shown in Table 2.

3.1. Calculation Method for the Total Incremental Cost of Strategy ULSD

The main engine of the offshore working vessel considered in this study costs 83 USD/kW according to the quotation of 75–108 USD/kW offered by the supplier of the vessel’s engines [44]. Therefore, the purchase cost of a 7000 kW engine was 580,000 USD. Compared with VLSFO, which was originally used by the vessel, Strategy ULSD requires no significant change in the existing vessel. The only significant change is the removal of the heating equipment (boiler) used to reduce the viscosity of the VLFSO. According to the current market price, the CAPEX of the heating equipment (boiler) is about USD 3000–20,000 [45]. In this study, the price of minus 12,000 USD was adopted as the boiler’s incremental cost for Strategy ULSD, where a negative value was taken because Strategy ULSD requires no boiler as compared with the original VLFSO case. The average annual incremental cost for 12 years was amortized by the sum-of-the-years-digits method. According to the parameters of vessel age specified in the Tokyo MoU [46], regardless of the vessel type, any vessel that was built for over 12 years will be given a weighted value of 1 point by the Port State Control (PSC) in the harbor where the ship is operated under the evaluation criteria for high-risk vessels. Therefore, we assumed that this is the age limit for the marine heating equipment and the main engine, that is, any such equipment over 12 years of age will be replaced. The annual total incremental cost (TIC) of Strategy ULSD was calculated according to Equation (2):
TICULSD = CAPEXULSD + OPEXULSD
where
TICULSD is the total incremental cost of Strategy ULSD;
CAPEXULSD is the capital expenditure of Strategy ULSD;
OPEXULSD is the operating expenditure of Strategy ULSD;
OPEXULSD was calculated according to Equation (3) and includes the fuel incremental cost (FIC) and the incremental cost of maintenance and repair (M&RIC).
OPEXULSD= FICULSD + M&RICULSD
where
FICULSD is the fuel incremental cost arising from replacing VLSFO with ULSD;
M&RICULSD is the incremental cost of maintenance and repair arising from replacing VLSFO with ULSD.
The fuel prices of ULSD and VLSFO fluctuate with international crude oil prices. Therefore, this study referred to the forecast of the crude oil price from 2022 to 2026 on Knoema [47] and the ULSD price released by the CPC Corporation [48]. In addition, according to the data from Ship and Bunker [49], the VLSFO and ULSD prices have 3% and 33% premiums over the Brent crude oil price, respectively. On this basis, the fuel prices for five years from 2022 to 2026 were estimated and are shown in Figure 1. The calculation method for the annual cost difference between ULSD and VLFSO is described in Equations (4) and (5). The annual vessel fuel cost is determined by the main engine power output (MEP), fuel consumption rate (FCR), fuel price (FP), and cruise hours per year (TC). The fuel consumption rate (FCR) can be found in the drawing of the initial calculation of marine machinery [50].
FICULSD = fuel cost of ULSD − fuel cost of VLSFO
FICULSD = [FPULSD × FCRULSD − FPVLSFO × FCRVLSFO] × MEP × TC × 10−6
where
FICULSD is the fuel incremental cost arising from replacing VLSFO with ULSD;
FCR is the fuel consumption rate of the main engine in g/kWh;
MEP is the output power of the vessel’s main engine (7000 kW);
FPULSD is the ULSD fuel price per tonne in USD/tonne;
FPVLSFO is the VLSFO fuel price per tonne in USD/tonne;
TC is the number of cruise hours per year in hrs/year.
Figure 1. Forecasts of the Brent crude oil, ULSD, and VLSFO prices for the next five years. Source: plotted by the authors based on the data presented in [47,48,49].
Jmse 10 00621 g001
The original engine maintenance cost of VLSFO (i.e., M&RVLSFO) was calculated based on the maintenance cost of 326 USD/kW, as estimated by New Horizon [10], which can be converted to the maintenance and repair cost of 2282.23 kUSD for VLSFO. Using VLSFO in main marine engines may have negative effects on piston rings, cylinder liners, or fuel pumps [14]. It was estimated that high-quality ULSD could reduce the maintenance cost by about 20%, and the calculation method for the maintenance cost is shown in Equation (6). M&RICULSD, which refers to the incremental cost of maintenance and repair of ULSD, is shown in Equation (7).
M&RULSD = 80% × M&RVLSFO
where
M&RULSD is the maintenance and repair cost of Strategy ULSD;
M&RVLSFO is the original maintenance and repair cost of VLSFO.
M&RICULSD = M&RULSD − M&RVLSFO
where M&RICULSD is the incremental cost of maintenance and repair arising from replacing VLSFO with ULSD.
Based on H.Y.’s 3 years of work experience as a chief mate on an offshore working vessel, the crew payroll varies with such conditions as class, seniority, route, and ship type. Since the working vessel used the two alternatives of ULSD and a PEMFC to sail the same route, it was assumed that the crew of the vessel running with different alternative fuels had the same work experience at sea. There was no difference for the vessel using ULSD and VLSFO in the aspects of safety training for the crew and technical certificates. Since ULSD has more stable fuel properties and lower sulfur content than VLSFO, the crew can reduce the number of regular and irregular maintenance routines [15]. The monthly crew payroll from the ship owner includes the rights granted to the crew in accordance with the Maritime Labor Convention (MLC) of flag states and other measures, such as medical care, employment insurance, personal protective equipment (PPE), recreational facilities, overtime payment, and leave pay. These payments are collectively called fringe benefits and are used to maintain physical and mental health [51]. The monthly fringe benefits were conservatively estimated at about 10% of the monthly payroll costs. In addition, at the end of a one-year service contract, ship owners should grant each crew member an annual leave period of thirty days [52] or the monetary equivalent of a month’s pay in accordance with the seafarers’ employment agreements (SEAs) in addition to the fixed monthly expenses [53]. This study assumed that the premium rate of the monthly crew payroll cost for a working vessel using ULSD fuel would be reduced by 13% as compared with the original case using VLSFO. Moreover, after the fringe benefits and monthly payroll were considered, the monthly payroll cost (PayrollVLSFO) of the original vessel using VLSFO was calculated to be 97,900 USD. The personnel incremental cost (PC) for the annual crew payroll of the working vessel switching from VLSFO to ULSD is expressed as PCULSD as shown in Equation (8).
PCULSD = −1.846 × PayrollVLSFO
where
PCULSD is the annual payroll incremental cost of Strategy ULSD;
−1.846 = [(97,900 × 87% × 110% × 12 + 97,900 × 87%) − (97,900 × 110% × 12 + 97,900)]/97,900;
PayrollVLSFO is the monthly payroll cost of the original vessel using VLSFO.

3.2. Calculation Method for the Total Incremental Cost of Strategy PEMFC

The calculation equation for the total incremental cost of Strategy PEMFC is shown in Equation (9). While Strategy PEMFC can eliminate the cost of the boiler used to heat VLFSO to reduce its viscosity, fuel-cell power units have the incremental costs of the fuel cell (denoted FCC), the hydrogen-refueling equipment (denoted Refuel), and the liquid hydrogen storage equipment (denoted Storage), as shown in Equation (10):
TICPEMFC = CAPEXPEMFC + OPEXPEMFC
CAPEXPEMFC = FCC + Refuel + Storage − BoilerC
where
FCC is the fuel cell incremental cost;
Refuel is the incremental cost of the refueling equipment;
Storage is the incremental cost of the storage equipment for liquid hydrogen;
BoilerC is the incremental cost of the boiler.
As a fuel cell stack composed of fuel cells is the core power source of the offshore working vessel using Strategy PEMFC, the auxiliary equipment and the balance of the plant (BoP) should be configured to keep the fuel cell stack stable and safe. The auxiliary equipment usually includes the additional components of fuel cells, such as the fuel supply system, the cooling system, and the system control unit [54]. The power of the main engine of the working vessel using Strategy PEMFC is 7000 kW. In order to meet the requirements for output power, a total of 234 units of 30 kW hydrogen fuel cells were needed, with HD-30 representing a fuel cell unit. Since the price of each HD-30 unit was 30,000 USD [10], the cost of the fuel cell stack was calculated to be 7,020,000 USD. The average annual fuel cell cost was thus estimated by the sum-of-the-years-digits method. This study assumed that the service life of an entire fuel cell is 10 years based on the service life of the fuel cells used by Klebanoff [22].
The incremental cost of refueling equipment for liquid hydrogen (denoted Refuel) was calculated and is shown in Table 3, excluding onshore facility expansion and infrastructure costs [40]. According to the table, the cost of the manifold and loading arm is 770,000 USD, the one-time permit and license fee is 200,000 USD, and the cost of the on-site storage tank is 625,000 USD. Hence, the incremental cost of all the refueling equipment for liquid hydrogen is 1,595,000 USD. If the service life of the refueling equipment is estimated to be 10 years, according to the amortization calculated by the sum-of-the-years-digits method, then the annual incremental cost of the refueling equipment for liquid hydrogen can be obtained. In addition, the cost of the LH2 refueling equipment is 4.7 times that of the ULSD refueling equipment (338,000 USD), as shown in Table 4.
In order to calculate the cost of the storage tank for liquid hydrogen, 45,422.22 kg of liquid hydrogen is required for a total output power of 7000 kW [10]. The IMO’s type-C storage tank for liquid hydrogen is priced at 167 USD per kilogram [16]. In this study, the service life of the storage tank for liquid hydrogen used was conservatively assumed to be ten years. The annual incremental cost of the LH2 storage tank was calculated by the sum-of-the-years-digits method. In addition, based on the current market price, a boiler for heating VLSFO can cost between 3000 USD and 20,000 USD [45], with a mid-range price of about 12,000 USD. As the service life of the boiler was assumed to be 12 years, the annual amortized cost could be calculated by the sum-of-the-years-digits method.
OPEXPEMFC = FICPEMFC + PCPEMFC + M&RICPEMFC
Based on Equation (11), OPEXPEMFC (i.e., the operating expenditure of Strategy PEMFC) is the sum of the fuel incremental cost of LH2 (denoted FICPEMFC), the payroll incremental cost of the crew operating the PEMFC equipment (i.e., PCPEMFC), and the incremental cost of the PEMFC equipment for maintenance and repair (i.e., M&RICPEMFC). There is no official or global market for LH2 supply [24]. By a conservative assumption, the price of non-renewable liquid hydrogen made from fossil fuel was taken to be 2 USD/kg, which is the lowest price of liquid hydrogen from a renewable source [20]. Compared with the Brent crude oil price, the premium per tonne of LH2 is approximately 260%. The 5-year trend of LH2 and VLSFO costs is shown in Figure 2. The fuel incremental cost for a working vessel using a PEMFC in an offshore wind farm off the west coast of Taiwan can be calculated by Equation (12) or Equation (13).
FICPEMFC = fuel cost of PEMFC − fuel cost of VLSFO
FICPEMFC = [(FPPEMFC × FCRPEMFC) − (FPVLSFO × FCRVLSFO)] × MEP × TC × 10−6
where
FICPEMFC is the fuel incremental cost of Strategy PEMFC compared with the original vessel using VLSFO;
FCRPEMFC is the fuel consumption rate of the main engine using Strategy PEMFC in g/kWh;
FCRVLSFO is the fuel consumption rate of the main engine of the original vessel using VLSFO in g/kWh;
MEP is the output power of the vessel’s main engine in kW;
FPPEMFC is the PEMFC price per tonne in USD/tonne;
FPVLSFO is the VLSFO price per tonne in USD/tonne;
TC is the number of cruise hours per year in hrs/year.
The maintenance and repair cost of Strategy PEMFC (denoted M&RPEMFC) should be calculated according to the estimates of Klebanoff [22]. The incremental cost of maintenance and repair of a non-diesel engine (non-diesel engine M&R) indicates the repair costs irrelevant to a diesel engine, such as the fuel cell overhaul cost of 92 USD/kW [10]. During the service life of a working vessel using Strategy PEMFC, the fuel cell should be replaced every 10 years, and the annual incremental cost for fuel cell replacement was amortized during the 10-year period by the sum-of-the-years-digits method. The annual maintenance cost of the auxiliary equipment (MCAE) was estimated to be 2% of the fuel cell cost [23]. The maintenance and repair cost of Strategy PEMFC is shown in Equation (14), and the incremental cost of maintenance and repair (i.e., M&RICPEMFC) is shown in Equation (15).
Figure 2. VLSFO and LH2 price forecast for the years 2021–2026. Source: plotted by the authors based on the data presented in [20,46,48].
Jmse 10 00621 g002
M&RPEMFC = non-diesel engine M&R + fuel cell replacement + MCAE
M&RICPEMFC= M&RPEMFC − M&RVLSFO
where
M&RICPEMFC is the incremental cost of maintenance and repair of Strategy PEMFC;
M&RPEMFC is the maintenance and repair cost of Strategy PEMFC;
non-diesel engine M&R is the incremental cost of maintenance and repair of a non-diesel engine, including the fuel cell overhaul cost;
fuel cell replacement is the annual amortized incremental cost of USD 7,020,000 for fuel cell replacement during the 10-year period;
MCAE is the incremental cost of maintenance of the auxiliary equipment [23].
As the vessel is refueled with LH2, the crew is required to have a large amount of professional knowledge and awareness of safety and environmental protection in terms of refueling, storage, and vessel operation. Shipping companies should invest internally to increase safety training costs for seamen and require seamen to regularly participate in external training in accordance with international conventions. In order to maintain the crew’s proficiency and reduce risks caused by human factors, both basic safety training regulated by the STCW and professional training for special vessels are required. Therefore, the crew members of the working vessel using Strategy PEMFC must have strong learning abilities, as the payroll costs are higher than those using other strategies. In this study, a monthly premium rate of 22% [24], which corresponds to 25 crew members of a working vessel using LNG, was adopted as a conservative estimate to obtain Equation (16). The personnel incremental cost (denoted PC) under Strategy PEMFC is calculated below.
PCPEMFC = 3.124 × PayrollVLSFO
where
PCPEMFC is the annual personnel incremental cost under Strategy PEMFC;
3.124 = [(97,900 × 122% × 110% ×12 + 97,900 × 122%) − (97,900 × 110% ×12 + 97,900)]/97,900
PayrollVLSFO is the monthly payroll of each crew member on the original vessel using VLSFO in USD.

3.3. Calculation Method for the Pollutant Emissions

This section explains the calculation methods for pollutant emissions from the working vessel in the offshore wind farm using Strategies ULSD and PEMFC, which are powered by ULSD and a PEMFC, respectively, instead of VLSFO. It was considered that various pollutants have the same effects on human health and the marine ecological environment, so the total emission of or total reduction in various pollutants from using the different strategies will be the sum of the emissions of or reductions in all pollutants, including SOx, NOx, HC, and PM. Emissions of black carbon, CO, and VOCs are not restricted by Annex VI of the International Convention for the Prevention of Pollution from Ships (MARPOL). In addition, marine diesel engines emit rather low amounts of CO and VOCs due to their being operated mostly with fuel-lean combustion. Thus, CO and VOCs were not considered in the emission calculation in this study. The total annual emissions from various fuels were calculated as follows:
Emission VLSFO = Σ ( MEP × EF VLSFO × TC × 10 6 )
Emission ULSD = Σ ( MEP × EF ULSD × TC × 10 6 )
Emission PEMFC = Σ ( MEP × EF PEMFC × TC × 10 6 )
where
EmissionVLSFO is the total annual emission of the original vessel using VLSFO in tonnes/year;
EmissionULSD is the total annual emission under Strategy ULSD in tonnes/year;
EmissionPEMFC is the total annual emission under Strategy PEMFC in tonnes/year;
MEP is the output power of the main engine of the vessel in kW;
EFVLSFO is the emission factor of a specific pollutant from the main engine using VLSFO in g/kWh;
EFULSD is the emission factor of a specific pollutant from the main engine using Strategy ULSD in g/kWh;
EFPEMFC is the emission factor of a specific pollutant from the main engine using Strategy PEMFC in g/kWh;
TC is the number of cruise hours per year in h/year.
In order to calculate the pollutant emission reductions under Strategies ULSD and PEMFC over five years, the total pollutant emissions under Strategies ULSD and PEMFC over five years were deducted from the total pollutant emissions of the vessel using VLSFO over five years. The total pollutant emissions of the vessel using VLSFO over five years, the total pollutant emissions under Strategy ULSD over five years, and the total pollutant emissions under Strategy PEMFC over five years were obtained by Equations (17)–(19). Emission factors represent different pollutant emissions from different fuels used by the main engine. Table 5 shows a comparison of emission factors of different pollutants produced by various fuels.
As the equipment for the after-treatment of exhaust gas from the main engine deteriorates over the service period, the emission factors of various pollutants increase gradually [58]. Hence, the pollutant emissions from the engine increase year by year accordingly. In estimating the pollutant emissions over the five years, it was necessary to consider the annual deterioration rate of the emission factors. As shown in Table 6, SOx, NOx, HC, and PM emissions have their own deterioration factors (DFs). The annual emissions of various pollutants over five years were calculated by Equation (20).
Emission   X   ( Y ) = DF Y × EF × MEP × TC × 10 6
where
Emission X (Y) is the emission of pollutant X in the year Y in tonnes/year. X can be SOx, NOx, HC, or PM, and Y can be year 1, 2, … 5;
DFY is the deterioration factor of the equipment for the after-treatment of exhaust gas in year Y;
MEP is the output power of the main engine of the vessel in kW;
EF is the emission factor of a specific pollutant from the main engine in g/kWh;
TC is the number of cruise hours per year in hrs/year.
Table 6. Deterioration factors of various emissions from the marine diesel engine. Unit: %/year.
SOxNOxHCPMCO2
1.021.021.041.061.02
Source: Compiled by the authors based on the data presented in [59].

3.4. Calculation Method for the Cost–Benefit Ratio

The cost–benefit ratio (CBR) is usually used to reveal the relative relationship between costs and benefits and is applied to select the optimal solution among various measures or strategies. Aimed at obtaining the maximum benefit at the minimum cost, it is an analytical method for evaluating project values. Generally, a high CBR indicates a profitable investment, and decision makers can determine the priority of various projects based on the ratio. The cost–benefit ratio (CBR) was calculated by Equation (21) in this study. According to the equation, the reductions in the emission of different pollutants are the benefits of replacing the original VLSFO fuel with different alternative sources of fuel or power, such as ULSD or a PEMFC, in this study, and the incremental costs required under the alternative fuel strategies were used to calculate the CBRs. The total incremental cost in the equation is in the unit of 10 kUSD, representing an incremental cost of 10,000 USD. The pollutant emission reductions and incremental costs under Strategies ULSD and PEMFC were used in the equation, respectively, in order to calculate the CBRs under the different strategies.
CBR = total emission reduction (tonnes)/total incremental cost required (10 kUSD)

4. Results and Discussion

4.1. Comparison of Incremental Costs between Strategies

If VLSFO, the original marine fuel oil, continues to be used, the total fuel oil cost will be 24,426.28 kUSD over the five years from 2022 to 2026, as shown in Table 7, including the boiler cost, refueling equipment cost, VLSFO cost (denoted FPVLSFO), maintenance and repair cost, personnel cost (i.e., PCVLFSO), and main engine cost. Table 8 shows the incremental costs of Strategy ULSD from 2022 to 2026. The last column in Table 8 shows the annual total incremental cost (TIC) of each item and the total incremental cost of all items over the five years, which is 1834.71 kUSD when summing the data according to Equation (2). The second column shows the boiler incremental cost (BoilerC), and the annual costs were amortized by the sum-of-the-years-digits method. As this cost can be eliminated under Strategy ULSD, the boiler incremental cost has a negative value. The third column shows the annual fuel incremental cost (FIC) of Strategy ULSD, which can be calculated by Equation (4) or Equation (5). As the annual fuel price forecast in Figure 2 shows that ULSD is more expensive than VLSFO, the annual incremental cost in this column has a positive value. The fourth column shows the incremental cost of maintenance and repairs, which can be calculated by Equation (7). As the maintenance cost of VLSFO is higher than that of ULSD due to its poor fuel properties, the annual ULSD incremental cost has a negative value. The fifth column shows the personnel incremental cost (PC), which has a negative value according to Equation (8). The comparison between the total cost of using VLSFO in Table 7 and the total incremental cost of Strategy ULSD in Table 8 shows that the total incremental cost of ULSD over the five years increases by 7.5%.
Table 9 shows the incremental costs of Strategy PEMFC from 2022 to 2026, which consist of the CAPEX and the OPEX. The last column of the Table 9 shows the annual total incremental cost (TICPEMFC) of each item, and the total incremental cost of all items over the five years, which is 12,517.34 kUSD when summing the data according to Equation (9). The second column shows the incremental cost of the fuel cell (FCC), and the annual costs were amortized by the sum-of-the-years-digits method and have positive values. The third column shows the incremental cost of the refueling equipment (Refuel), and the annual costs were amortized by the sum-of-the-years-digits method and have positive values. The fourth column shows the annual incremental cost of the liquid hydrogen storage equipment, which has a positive value. The fifth column shows the boiler’s incremental cost (BoilerC), which can be eliminated under Strategy PEMFC, and the annual costs were amortized by the sum-of-the-years-digits method and have negative values. The sixth column shows the annual fuel incremental cost of liquid hydrogen (FICPEMFC), which can be calculated by Equation (12) or Equation (13) and has a positive value. The seventh column shows the incremental cost of maintenance and repair (M&RICPEMFC), which can be calculated by Equation (15) and has a positive value. The eighth column shows the personnel incremental cost (PCPEMFC), which can be calculated by Equation (16). The comparison between the total incremental cost of Strategy PEMFC in Table 9 and the total cost of using VLSFO in Table 7 shows that the total incremental cost over the five years increases by 51.2% after Strategy PEMFC is adopted.

4.2. Comparison of Pollutant Emission Reductions between Strategies

The pollutant emission reductions by different strategies are an important basis for the strategy evaluation method. Table 10 shows the pollutant emission reductions due to Strategy ULSD in the first year. The total emission reduction of all items is 65.93 tonnes. Table 10 also shows that the SOx, NOx, HC, and PM emissions are 13.24 tonnes, 52.56 tonnes, −3.95 tonnes, and 4.07 tonnes, respectively, after VLSFO is replaced with ULSD. EFVLSFO and EFULSD represent the emission factors of the various pollutants produced by VLSFO and ULSD, respectively, and a high EF indicates a high level of pollutant emissions from the engine at unit power in unit time. The SOx, NOx, HC, and PM emission reduction rates are 80%, 12%, −24%, and 60.5%, respectively. It is worth noting that the HC emission reduction under Strategy ULSD is −3.95 tonnes. This is due to the higher elemental hydrogen and carbon contents in ULSD compared with VLSFO, which lead to the emission of a larger amount of HC through the fuel combustion process. However, the HC emissions are actually low because most diesel engines are operated under fuel-lean burning conditions.
Table 11 shows the pollutant emission reductions in the first year after the vessel was powered by a PEMFC instead of VLSFO. The SOx, NOx, HC, and PM emissions were 16.47 tonnes, 425.53 tonnes, 15.60 tonnes, and 5.45 tonnes, respectively, with the emission reduction rates of 100%, 97.4%, 94.6%, and 80.9%, respectively. The comparison between Table 10 and Table 11 shows that, after VLSFO was replaced with ULSD or a PEMFC in the first year, compared with Strategy ULSD, the total amount of pollutants emitted was reduced by 397.14 tonnes under Strategy PEMFC. The pollutants emitted from the working vessel powered by a PEMFC were mainly produced through the process of converting non-renewable hydrocarbons to LH2 [38].
Table 12 shows the total annual emission reductions for those four pollutants (i.e., SOx, NOx, HC, and PM) under Strategies ULSD and PEMFC, including the data over the five-year period from 2022 to 2026, which increase year by year. Compared with Strategy ULSD, the total emission reduction under Strategy PEMFC increases by 397.14 tonnes, 406 tonnes, 415.01 tonnes, 424.36 tonnes, and 433.87 tonnes, respectively, from the first year to the fifth year, indicating the significant advantage of Strategy PEMFC in environmental protection.
The annual emissions of SOx, NOx, HC, and PM under the different strategies were calculated by Equation (20), and the total pollutant emissions in tonnes over the five-year period are shown in the third column of Table 13, which were obtained by summing the annual emissions. The fourth column of the Table 13 shows the difference between the total pollutant emissions under Strategies ULSD and PEMFC over the five years. The last column shows the pollutant emission reduction rates (%) under the different strategies. According to Table 13, Strategy ULSD reduced the SOx, NOx, and PM emissions by 80.3%, 12%, and 60.5% over the five years, respectively, as compared with VLSFO. In contrast, Strategy PEMFC reduced the SOx, NOx, HC, and PM emissions by 100%, 97.4%, 91.8%, and 81%, respectively, as compared with VLSFO. Therefore, Strategy PEMFC is more effective in reducing SOx, NOx, HC, and PM emissions than Strategy ULSD.
Since CO2 plays a crucial role in the greenhouse effect, its emission from fossil-fuel burning is significantly higher than other greenhouse gases [60]. Hence, we present CO2 emissions separately in this section. Table 14 shows the reduction in CO2 emissions under Strategies ULSD and PEMFC, as compared with the original vessel using VLSFO, and presents the data for the five years from 2022 to 2026. According to the table, after Strategies ULSD and PEMFC are adopted for five years, compared with the total CO2 emissions from VLSFO combustion, the CO2 emission reduction rates are −14.6% and 81.6%, respectively; thus, strategy PEMFC has a competitive advantage in reducing CO2 emissions. It is worth noting that the CO2 emission reduction rate under Strategy ULSD has a negative value, and the cause of this phenomenon is that the carbon will combine with oxygen in the air to form CO2 after the complete combustion of the fossil fuel. ULSD, with its higher carbon content, emits a greater amount of CO2 after complete combustion, resulting in the poorer decarburization effect compared with a PEMFC and VLSFO.

4.3. Comparison of Cost–Benefit Ratios between Strategies

As mentioned above, a high cost–benefit ratio (CBR) indicates higher effectiveness and thus a higher implementation priority. By observing the trend of the curve in Figure 3, the evaluation results using cost–benefit analysis for Strategies ULSD and PEMFC can be clearly compared. Figure 3 clearly shows that, while the CBRs of both strategies increase year by year, the slope of the curve for Strategy PEMFC is more significant. The CBR of Strategy ULSD is higher than that of Strategy PEMFC from the first year to the third year. However, this CBR difference gradually narrows after the second year, which can be ascribed to the fact that the equipment cost under Strategy PEMFC decreases year by year after amortization. It is worth noting that, by the third year, the CBR of Strategy PEMFC equals that of Strategy ULSD, after which the trend of the curve reverses. The cost–benefit ratios of Strategies PEMFC and ULSD gradually increase again, and the CBR of Strategy PEMFC becomes significantly higher than that of Strategy ULSD in the fourth year. By the fifth year, namely, the final year, the difference between the cost–benefit ratios of the two strategies is 0.52. Therefore, both strategies are promising alternatives to VLSFO. However, Strategy PEMFC is more suitable as a medium- and long-term investment (i.e., more than three years), while Strategy ULSD is more suitable as a short-term investment (i.e., less than three years).

5. Conclusions

This study investigated the energy transition of vessels working in Taiwan’s offshore wind power farms under increasingly severe marine environmental regulations. We analyzed the pollutant emission reductions, incremental costs, and cost–benefit ratios (CBRs) of two alternative strategies (Strategies ULSD and PEMFC). Our major results can be summarized as follows.
(1)
The total incremental costs under Strategies ULSD and PEMFC increase by 7.5% and 51.2% over five years, respectively, as compared with the total cost of using VLSFO.
(2)
Strategy ULSD reduced the SOx, NOx, and PM emissions by 80.3%, 12%, and 60.5%, respectively, over the five-year period, but the amount of HC emitted was 24% higher compared with VLSFO.
(3)
Strategy PEMFC will bring more environmental benefits and reduced the SOx, NOx, HC, PM, and CO2 emissions by 100%, 97.4%, 91.8%, 81%, and 81.6%, respectively, which are much higher values than those of Strategy ULSD.
(4)
Five years after the adoption of Strategies ULSD and PEMFC, compared with the total CO2 emissions from VLSFO combustion, the emission reduction rates of Strategies ULSD and PEMFC were −14.6% and 81.6%, respectively, with a difference of 96.2%.
(5)
The cost–benefit analysis shows that both Strategy PEMFC and Strategy ULSD have promising advantages over VLSFO.
(6)
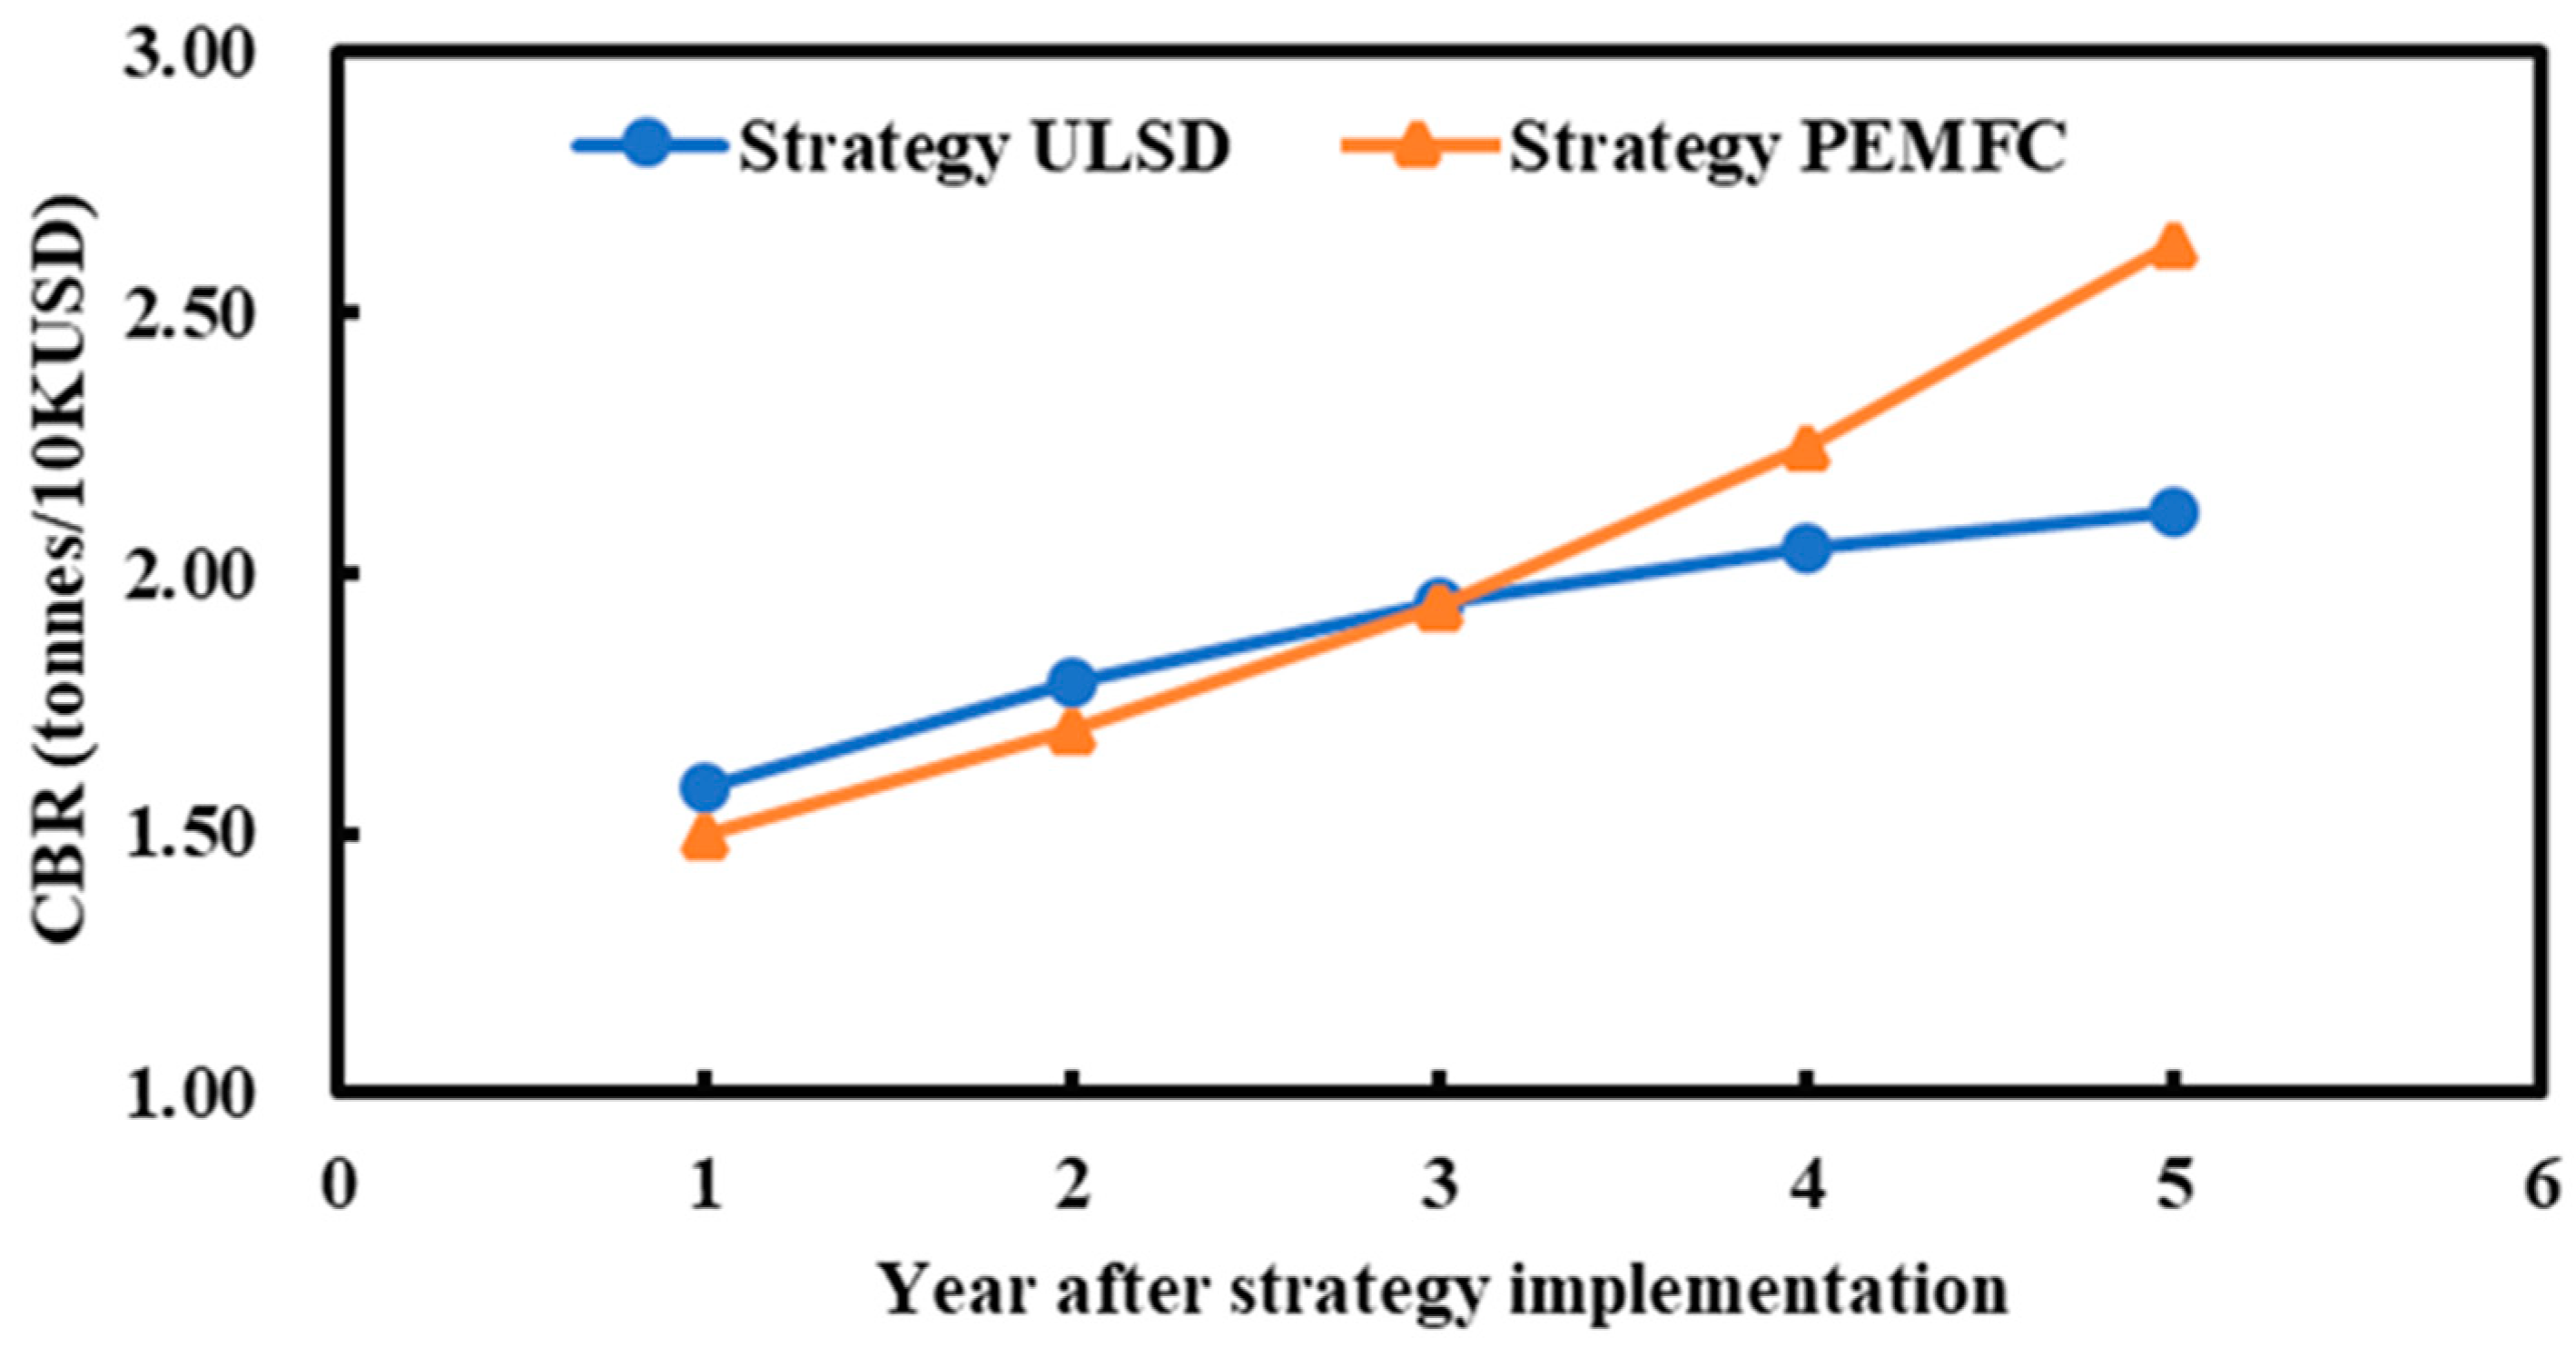
The cost–benefit ratios of Strategy ULSD are likely to increase slowly over the first five years. Therefore, as its long-term cost–benefit ratios are lower than those of Strategy PEMFC, we recommend that it be used as a short-term improvement strategy (i.e., for a period of less than three years). If the IMO’s carbon reduction regulations are implemented in the future, Strategy ULSD will become completely uncompetitive due to its higher carbon content.
(7)
PEMFCs are renewable power sources that can help ship owners have positive social perceptions. The cost–benefit ratios of Strategy PEMFC increased significantly over the five years. The initial capital expenditures of Strategy PEMFC are higher than those of Strategy ULSD. Therefore, we recommend that it be used as a medium- and long-term improvement plan (i.e., for a period of more than three years).
(8)
A cost–benefit analysis for vessels working in offshore wind farms that are powered by other low or zero-carbon sources of alternative energy, such as solar photovoltaic energy, electric power, wind energy, and ammonia or methanol fuel, should be performed in future research work.

Author Contributions

Conceptualization, C.-Y.L.; funding acquisition, C.-Y.L.; methodology, C.-Y.L. and H.Y.; draft preparation, H.Y.; formal analysis, C.-Y.L.; corresponding author, C.-Y.L.; investigation, H.Y.; writing and editing, C.-Y.L.; supervision, C.-Y.L.; validation, H.Y. All authors have read and agreed to the published version of the manuscript.

Funding

This research was funded by the Ministry of Science and Technology of Taiwan, ROC, under contract Nos. MOST 109-2221-E-019-024 and MOST 107-2221-E-019-056-MY2.

Institutional Review Board Statement

Not applicable.

Informed Consent Statement

Not applicable.

Data Availability Statement

All of the data used in this study are presented in this article.

Acknowledgments

The authors gratefully acknowledge the financial support from the Ministry of Science and Technology of Taiwan, ROC, under contract Nos. MOST 109-2221-E-019-024 and MOST 107-2221-E-019-056-MY2.

Conflicts of Interest

The authors declare no conflict of interest.

Abbreviations

AFCAlkaline Fuel Cell
BoilerCBoiler’s incremental cost
CAPEXCapital expenditure
CBACost–benefit analysis
CBRCost–benefit ratio
CO2Carbon dioxide
C.S.RContinuous service rating
CTVCrew transportation vessel
DFDeterioration factor
DNVDet Norske Veritas
EFEmission factor
FCFuel cell
FCCFuel cell incremental cost
FCRFuel consumption rate
Fuel cell replacementAnnual shared incremental cost of replacing fuel cells
FICFuel incremental cost
FPFuel price
GHGGreenhouse Gas
HFOHeavy fuel oil
IMOInternational Maritime Organization
LCPALife Cycle Performance Assessment
LH2Liquid hydrogen
LNGLiquefied Natural Gas Carrier
MCAEMaintenance cost of auxiliary equipment for the fuel cell
MCFCMolten carbonate fuel cell
MDOMarine diesel oil
MEMarine diesel engine
MGOMarine gas oil
M&RMaintenance and repair cost
M&RICMaintenance and repair incremental cost
MLCMaritime Labor Convention
MoUMemorandum of Understanding
NASANational Aeronautics and Space Administration
non-diesel engine M&RMaintenance incremental costs not related to diesel engines
NOxOxides of nitrogen
OPEXOperating expenditure
MEPMain engine power output
PAFCPhosphoric acid fuel cell
PCPersonnel incremental cost
PEMProton exchange membrane
PM
PPE
Particulate matter
Personal protective equipment
PSCPort State Control
RefuelIncremental cost of refueling equipment
ROVRemotely operated vehicle
SEASeafarers Employment Agreement
SOFCSolid oxide fuel cell
SOxSulfur oxides
STCWInternational Convention on Standards of Training, Certification and Watchkeeping for Seafarers
StorageIncremental cost of liquid hydrogen storage equipment
TCCruise hours per year
TICTotal incremental cost
ULSDUltra-low-sulfur diesel
VLSFOVery-low-sulfur fuel oil (0.50 wt. % sulfur or less by mass)

References

  1. Cranmer, A.; Baker, E. The global climate value of offshore wind energy. Environ. Res. Lett. 2020, 15, 054003. [Google Scholar] [CrossRef]
  2. 4C Offshore Company. Global Offshore Wind Farm Database. Available online: https://www.4coffshore.com/windfarms (accessed on 20 January 2022).
  3. Lu, S.-M. A review of renewable energies in Taiwan. Int. J. Eng. Sci. Res. Technol. 2010, 1, 405. [Google Scholar] [CrossRef]
  4. Department of Information Services (Taiwan). Offshore Wind-Power Generation. Available online: https://english.ey.gov.tw/News3/9E5540D592A5FECD/34ff3d6b-412e-458d-afe9-01737d2da52d (accessed on 10 January 2022).
  5. Łebkowski, A. Analysis of the use of electric drive systems for crew transfer vessels servicing offshore wind farms. Energies 2020, 13, 1466. [Google Scholar] [CrossRef] [Green Version]
  6. Whittaker, K.; Young, C.N. Status Review Report of the Taiwanese Humpback Dolphin Sousa chinensis taiwanensis. In National Marine Fisheries Service; National Oceanic and Atmospheric Administration, United States Department of Commerce: Washionton, DC, USA, 2018; pp. 7–12. [Google Scholar]
  7. Paterson, J.; D’Amico, F.; Thies, P.R.; Kurt, R.; Harrison, G. Offshore wind installation vessels– A comparative assessment for UK offshore rounds 1 and 2. Ocean Eng. 2018, 148, 637–649. [Google Scholar] [CrossRef]
  8. Arvesen, A.; Birkeland, C.; Hertwich, E.G. The importance of ships and spare parts in LCAs of offshore wind power. Environ. Sci. Technol. 2013, 47, 2948–2956. [Google Scholar] [CrossRef] [Green Version]
  9. Viana, M.; Rizza, V.; Tobías, A.; Carr, E.; Corbett, J.; Sofiev, M.; Karanasiou, A.; Buonanno, G.; Fann, N. Estimated health impacts from maritime transport in the Mediterranean region and benefits from the use of cleaner fuels. Environ. Int. 2020, 138, 105670. [Google Scholar] [CrossRef]
  10. Knudsen, D.B. Is the Shipping Industry still Sulfuring?—A Study of Compliance Factors from the IMO 2020 Sulfur Cap. Master’s Thesis, Lund University, Lund, Sweden, 2021. [Google Scholar]
  11. Joung, T.-H.; Kang, S.-G.; Lee, J.-K.; Ahn, J. The IMO initial strategy for reducing Greenhouse Gas (GHG) emissions, and its follow-up actions towards 2050. J. Int. Marit. Saf. Environ. Aff. Ship. 2020, 4, 1–7. [Google Scholar] [CrossRef] [Green Version]
  12. Wang, S.; Psaraftis, H.N.; Qi, J. Paradox of international maritime organization’s carbon intensity indicator. Commun. Transp. Res. 2021, 1, 100005. [Google Scholar] [CrossRef]
  13. Van, T.C.; Ramirez, J.; Rainey, T.; Ristovski, Z.; Brown, R.J. Global impacts of recent IMO regulations on marine fuel oil refining processes and ship emissions. Transp. Res. D Transp. Environ. 2019, 70, 123–134. [Google Scholar] [CrossRef]
  14. Fridell, E.; Winnes, H.; Eklund, V. Emission Factors for Shipping in Scenarios; Swedish Meteorological and Hydrological Institute: Norrköping, Sweden, 2020; pp. 11–20. [Google Scholar]
  15. Morales, J. The Impact of IMO’s Global Sulphur Cap the Shipping Industry and the Latter’s Countermeasure. Master’s Thesis, World Maritime University, Malmö, Sweden, August 2019. [Google Scholar]
  16. Ben-Hakoun, E.; Van De Voorde, E.; Shiftan, Y. Marine environmental emission reduction policy in the liner shipping the economic impact from trade lane perspective. Marit. Policy Manag. 2021, 48, 725–753. [Google Scholar] [CrossRef]
  17. Adland, R.; Cariou, P.; Jia, H.; Wolff, F.C. The energy efficiency effects of periodic ship hull cleaning. J. Clean. Prod. 2018, 178, 1–13. [Google Scholar] [CrossRef]
  18. Farkas, A.; Degiuli, N.; Martić, I.; Vujanović, M. Greenhouse gas emissions reduction potential by using antifouling coatings in a maritime transport industry. J. Clean. Prod. 2021, 295, 126428. [Google Scholar] [CrossRef]
  19. Traut, M.; Gilbert, P.; Walsh, C.; Bows, A.; Filippone, A.; Stansby, P.; Wood, R. Propulsive power contribution of a kite and a Flettner rotor on selected shipping routes. Appl. Energy 2014, 113, 362–372. [Google Scholar] [CrossRef]
  20. Castro, M.; Mestemaker, B.; van den Heuvel, H. Towards zero emission work vessels: The case of a dredging vessel. In Proceedings of the 2nd International Conference on Modelling and Optimisation of Ship Energy Systems (MOSES2019), Glasgow, UK, 8–10 May 2019; pp. 8–10. [Google Scholar]
  21. van Biert, L.; Godjevac, M.; Visser, K.; Aravind, P. A review of fuel cell systems for maritime applications. J. Power Sources 2016, 327, 345–364. [Google Scholar] [CrossRef] [Green Version]
  22. Klebanoff, L.E. The Zero-V: Feasibility of a Liquid Hydrogen Fueled Coastal Research Vessel; Sandia National Laboratory: Livermore, CA, USA, 2019. [Google Scholar]
  23. Gianni, M.; Pietra, A.; Taccani, R. Outlook of future implementation of PEMFC and SOFC onboard cruise ships. In E3S Web of Conferences; EDP Sciences: Les Ulis, France, 2021; p. 04004. [Google Scholar]
  24. Tronstad, T.; Åstrand, H.H.; Haugom, G.P.; Langfeldt, L. Study on the Use of Fuel Cells in Shipping; DNV GL Maritime: Hamburg, Germany, 2017. [Google Scholar]
  25. Chiche, A.; Andruetto, C.; Lagergren, C.; Lindbergh, G.; Stenius, I.; Peretti, L. Feasibility and impact of a Swedish fuel cell-powered rescue boat. Ocean Eng. 2021, 234, 109259. [Google Scholar] [CrossRef]
  26. McKinlay, C.; Turnock, S.; Hudson, D. Fuel cells for shipping: To meet on-board auxiliary demand and reduce emissions. Energy Rep. 2021, 7, 63–70. [Google Scholar] [CrossRef]
  27. Guaitolini, S.V.M.; Yahyaoui, I.; Fardin, J.F.; Encarnação, L.F.; Tadeo, F. A review of fuel cell and energy cogeneration technologies. In Proceedings of the 2018 9th International Renewable Energy Congress (IREC), Hammamet, Tunisia, 20–22 March 2018; pp. 1–6. [Google Scholar]
  28. Felseghi, R.-A.; Carcadea, E.; Raboaca, M.S.; Trufin, C.N.; Filote, C. Hydrogen fuel cell technology for the sustainable future of stationary applications. Energies 2019, 12, 4593. [Google Scholar] [CrossRef] [Green Version]
  29. Sazali, N.; Wan Salleh, W.N.; Jamaludin, A.S.; Mhd Razali, M.N. New perspectives on fuel cell technology: A brief review. Membranes 2020, 10, 99. [Google Scholar] [CrossRef]
  30. Inal, O.; Deniz, C. Fuel cell availability for merchant ships. In Proceedings of the 3rd International Naval Architecture and Maritime Symposium, Istanbul, Turkey; 2018; pp. 907–916. [Google Scholar]
  31. Suraparaju, S.K.; Natarajan, S.K.; Karthikeyan, P. A succinct review on fuel cells. In IOP Conference Series: Earth and Environmental Science; IOP Publishing: Bristol, UK, 2019; p. 012012. [Google Scholar]
  32. McKinlay, C.J.; Turnock, S.R.; Hudson, D.A. Route to zero emission shipping: Hydrogen, ammonia or methanol? Int. J. Hydrogen Energy 2021, 46, 28282–28297. [Google Scholar] [CrossRef]
  33. Uyanık, T.; Karatuğ, Ç.; Arslanoğlu, Y. Machine learning approach to ship fuel consumption: A case of container vessel. Transp. Res. Part D Transp. Environ. 2020, 84, 102389. [Google Scholar] [CrossRef]
  34. Thomas, J.F.; Sluder, C.S.; Kass, M.D.; Theiss, T. A guide to Fuel, Lubricant, and Engine Concerns Relative to the IMO 2020 Fuel Oil Sulfur Reduction Mandate; Report number ORNL/SPR-2019/1406; Oak Ridge National Laboratory: Oak Ridge, TN, USA, 2019; pp. 10–22. [Google Scholar]
  35. Saleh, T.A. Characterization, determination and elimination technologies for sulfur from petroleum: Toward cleaner fuel and a safe environment. Trends Environ. Anal. Chem. 2020, 25, e00080. [Google Scholar] [CrossRef]
  36. Chinese Petroleum Corporation. Test Report of Super-low Sulfur Diesel; Chinese Petroleum Corporation: Kaohsiung, Taiwan, 2021. [Google Scholar]
  37. Kayfeci, M.; Keçebaş, A.; Bayat, M. Hydrogen production. In Solar Hydrogen Production; Academic Press: Cambridge, MA, USA, 2019; pp. 45–83. [Google Scholar]
  38. Zhang, F.; Zhao, P.; Niu, M.; Maddy, J. The survey of key technologies in hydrogen energy storage. Int. J. Hydrogen Energy 2016, 41, 14535–14552. [Google Scholar] [CrossRef]
  39. Chen, W.; Gao, R.; Sun, J.; Lei, Y.; Fan, X. Modeling of an isolated liquid hydrogen droplet evaporation and combustion. Cryogenics 2018, 96, 151–158. [Google Scholar] [CrossRef]
  40. Pratt, J.W.; Klebanoff, L.E. Feasibility of the SF-Breeze: A Zero-Emission, Hydrogen Fuel Cell, High-Speed Passenger Ferry; Report number SAND2016-9719; Sandia National Laboratories: Livermore, CA, USA, 2016; pp. 41–69. [Google Scholar]
  41. Kierczynski, O.K.; Towers, J.A.; Jankowski, K.A. Evaluation of a Large Zero-Emission High-Speed Passenger Vessel. In Proceedings of the SNAME International Conference on Fast Sea Transportation, Providence, RI, USA, 26–27 October 2021. [Google Scholar]
  42. DNV AS. Handbook for Hydrogen-Fuelled Vessels. Available online: https://www.iims.org.uk/wp-content/uploads/2021/07/Handbook_for_hydrogen-fuelled_vessels.pdf (accessed on 12 December 2021).
  43. Ching Fu Shipbuiding Corporation Ltd. Particulars of the 7000M3 Hopper Suction Dredger; Ching Fu Shipbuiding Corporation Ltd.: Kaohsiung, Taiwan, 2012. [Google Scholar]
  44. Beijing Avespeed Commercial & Trading Corporation Ltd. Made-in-China Connecting Buyers with Chinese Suppliers. Available online: https://m.made-in-china.com/product/600kw-1350rpm-Convenient-Operation-Marine-Diesel-Engine-for-Tugboats-689959132.html (accessed on 8 October 2021).
  45. Qingdao Kaineng Environmental Protection Technology Corporation Ltd. Made-in-China Connecting Buyers with Chinese Suppliers. Available online: https://knboiler.en.made-in-china.com/product/VXJEWhkPgspL/China-Lzy-Vertical-Thread-Tube-Oil-Fired-Exhaust-Gas-Marine-Composite-Boiler.html (accessed on 27 September 2021).
  46. Xiao, Y.; Wang, G.; Lin, K.-C.; Qi, G.; Li, K.X. The effectiveness of the new inspection regime for port state control: Application of the Tokyo MoU. Mar. Policy 2020, 115, 103857. [Google Scholar] [CrossRef]
  47. Knoema Corporation. Crude Oil Price Forecast; Knoema Corporation: New York, NY, USA, 2022; Available online: https://knoema.com/infographics/yxptpab/crude-oil-price-forecast-2021-2022-and-long-term-to-2050 (accessed on 20 September 2021).
  48. Chinese Petroleum Corporation. Super-low Sulfur Diesel Fuel Price; Chinese Petroleum Corporation: Kaohsiung, Taiwan; Available online: https://www.cpc.com.tw/ (accessed on 20 September 2021).
  49. Ship & Bunker World Bunker Prices. Available online: https://shipandbunker.com/ (accessed on 20 September 2021).
  50. Ching Fu Shipbuiding Corporation Ltd. Drawing of Initial Calculation of Machinery for 7000M3 Hopper Suction Dredger; Ching Fu Shipbuiding Corporation Ltd.: Kaohsiung, Taiwan, 2010. [Google Scholar]
  51. Marbun, H.F.L. Wages of Seafarers: Legal Rights, Protections, and Remedies under the Perspectives of International Conventions. Master’s Thesis, University of Oslo, Oslo, Norway, March 2019. [Google Scholar]
  52. Aguda, O.O. Maritime labour convention 2006: Implications for seafarers after a decade. Nnamdi Azikiwe Univ. J. Int. Law Jurisprud. 2017, 8, 125–134. [Google Scholar]
  53. National Chinese Seamen’s Union. News and Events. Available online: http://www.ncsu.org.tw/news_1.php?id=1147 (accessed on 20 August 2021).
  54. Budak, Y.; Devrim, Y. Investigation of micro-combined heat and power application of PEM fuel cell systems. Energy Convers. Manag. 2018, 160, 486–494. [Google Scholar] [CrossRef]
  55. Durmaz, M.; Kalender, S.S.; Ergin, S. Experimental study on the effects of ultra-low sulfur diesel fuel to the exhaust emissions of a ferry. Fresenius Environ. Bull. 2017, 26, 5833–5840. [Google Scholar]
  56. Ji, C.; El-Halwagi, M.M. A data-driven study of IMO compliant fuel emissions with consideration of black carbon aerosols. Ocean Eng. 2020, 218, 108241. [Google Scholar] [CrossRef]
  57. Zhang, Y.; Gu, J.; Wang, W.; Peng, Y.; Wu, X.; Feng, X. Inland port vessel emissions inventory based on Ship Traffic Emission Assessment Model- Automatic Identification System. Adv. Mech. Eng. 2017, 9, 1687814017712878. [Google Scholar] [CrossRef]
  58. Zhang, Q.; Fan, J.; Yang, W.; Ying, F.; Bao, Z.; Sheng, Y.; Lin, C.; Chen, X. Influences of accumulated mileage and techno-logical changes on emissions of regulated pollutants from gasoline passenger vehicles. J. Environ. Sci. 2018, 71, 197–206. [Google Scholar] [CrossRef]
  59. California Air Resources Board. Appendix B: Emissions Estimation Methodology for Commercial Harbor Craft Operating in California. 2012. Available online: https://ww3.arb.ca.gov/msei/chc-appendix-b-emission-estimates-ver02-27-2012.pdf (accessed on 15 October 2021).
  60. Al-Ghussain, L. Global warming: Review on driving forces and mitigation. Environ. Prog. Sustain. Energy 2019, 38, 13–21. [Google Scholar] [CrossRef] [Green Version]
Figure 3. Comparison of cost–benefit ratios between the two implemented strategies five years into the future.
Jmse 10 00621 g003
Table 1. Abbreviations for the strategies evaluated in this study.
StrategyDescription
ULSDReplacing VLSFO with ULSD (S ≤ 10 ppm)
PEMFCUsing a PEMFC as an alternative power source to VLSFO
Table 2. Cost items of the implemented strategies (ULSD and PEMFC).
Cost Item Strategy
ULSDPEMFC
CAPEX1. Boiler’s incremental cost.1. Incremental cost of the fuel cell;
2. Incremental cost of the refueling equipment;
3. Incremental cost of the storage equipment for liquid hydrogen;
4. Incremental cost of the boiler.
OPEX1. Incremental cost of ULSD;1. Incremental cost of liquid hydrogen fuel;
2. Incremental cost of maintenance and repair.2. Incremental cost of the crew’s payroll;
3. Incremental cost of maintenance and repair.
Table 3. The estimated capital cost of a LH2 bunkering facility. Unit: USD.
Pipe and ManifoldPermit and License FeeOn-Site Storage Tank
770,000200,000625,000
Source: compiled by the authors based on the data presented in [40].
Table 4. Comparison of the capital cost of a bunkering facility for LH2 and ULSD. Unit: USD.
LH2ULSD
Total1,595,000338,000
Source: compiled by the authors based on the data presented in [40].
Table 5. Emission factors of different strategies. Unit: g/kWh.
Fuel TypeSOxNOxCO2HCPM
VLSFO (S < 0.5 wt. %)0.5113.545330.50.2
ULSD (S ≤ 10 ppm)0.111.91611.140.620.07
PEMFC00.34980.020.03
Source: compiled by the authors based on the data presented in [22,55,56,57].
Table 7. The total cost of using VLSFO as the fuel oil of the offshore vessel. Unit: kUSD/year.
YearBoiler CostRefueling Equipment CostFPVLFSOM&RICVLFSOPCVLFSOEngine CostTotal Cost
1st1.8561.453296.44228.231390.1889.235067.38
2nd1.6955.313172.15228.231390.1881.794929.36
3rd1.5449.163104.74228.231390.1874.364848.21
4th1.3843.023073.08228.231390.1866.924802.81
5th1.2336.873062.53228.231390.1859.494778.53
Total------24,426.28
Table 8. Incremental costs of Strategy ULSD. Unit: kUSD/year.
YearCAPEXOPEXTICULSD
BoilerCFICULSDM&RICULSDPCULSD
1st−1.851055.15−456.45−180.72416.13
2nd−1.691015.37−456.45−180.72376.51
3rd−1.54993.79−456.45−180.72355.08
4th−1.38983.66−456.45−180.72345.11
5th−1.23980.28−456.45−180.72341.88
Total----1834.71
Table 9. Incremental costs of Strategy PEMFC five years into the future. Unit: kUSD/year.
YearCAPEXOPEXTICPEMFC
FCCRefuelStorageBoilerCFICPEMFCM&RICPEMFCPCPEMFC
1st1203.86228.551384.53−1.85421.91−451.66305.843091.18
2nd1081.06205.691246.07−1.69406.00−451.66305.842791.31
3rd958.26182.841107.62−1.54397.37−451.66305.842498.73
4th835.45159.98969.17−1.38393.32−451.66305.842210.72
5th712.65137.13830.72−1.23391.97−451.66305.841925.41
Total-------12,517.34
Table 10. Pollutant emission reductions of Strategy ULSD in the first year.
PollutantEFVLSFO
(g/kWh)
EFULSD
(g/kWh)
EmissionVLSFO
(Tonnes)
EmissionULSD
(Tonnes)
Emission Reduction
(Tonnes)
Total Pollutant Emission Reduction
(Tonnes)
SOx0.510.116.473.2313.2465.93
NOx13.5411.91436.62384.0652.56-
HC0.50.6216.4820.44−3.95-
PM0.20.076.742.664.07-
Table 11. Pollutant emission reductions of Strategy PEMFC in the first year.
PollutantEFVLSFO
(g/kWh)
EFPEMFC
(g/kWh)
EmissionVLSFO
(Tonnes)
EmissionPEMFC
(Tonnes)
Emission Reduction
(Tonnes)
Total
Pollutant Emission
Reduction
(Tonnes)
SOx0.510.016.47016.47463.07
NOx13.540.34436.6211.09425.53-
HC0.50.0216.480.8815.60-
PM0.20.036.741.285.45-
Table 12. Total pollutant emission reductions over five years after the strategies were implemented. Unit: tonnes.
StrategyYear of Implementation
1st2nd3rd4th5th
ULSD65.9367.4368.98770.5772.21
PEMFC463.07473.44484.06494.94506.08
Table 13. Total pollutant emission reductions (in tonnes) and total pollutant emission reduction rates (in %) with the adoption of the ULSD and PEMFC strategies over a five-year period.
PollutantPower SourceTotal Emission over Five YearsTotal Pollutant Emission Reduction over Five YearsTotal Pollutant Emission Reduction Rate over Five Years (%)
SOxVLSFO86.27--
ULSD16.9169.3580.3
PEMFC0.0086.27100
NOxVLSFO2276.77--
ULSD2002.69274.0812
PEMFC57.842218.9397.4
HCVLSFO90.01--
ULSD111.61−21.60−24
PEMFC7.3282.6991.8
PMVLSFO38.529--
ULSD15.21923.31060.5
PEMFC7.32031.20881
Table 14. Annual CO2 emission reductions by the ULSD and PEMFC strategies. Unit: tonnes.
StrategyYear the Strategy Was Implemented
1st2nd3rd4th5th
ULSD−2468−2530−2593−2658−2724
PEMFC13,73914,08314,43514,79515,165
Publisher’s Note: MDPI stays neutral with regard to jurisdictional claims in published maps and institutional affiliations.

