Article

Sediment and Radioactivity Transport in the Bohai, Yellow, and East China Seas: A Modeling Study

1
Department of Marine and River System Modelling, Institute of Mathematical Machine and System Problems, 03187 Kyiv, Ukraine
2
Marine Environmental Research Center, Korea Institute of Ocean Science and Technology, Busan 49111, Korea
3
Oceanic Consulting and Trading, Gangneung 25601, Korea
4
Korea Ocean Satellite Centre, Korea Institute of Ocean Science & Technology, Busan 49111, Korea
5
Underwater Survey Technology 21, Incheon 21999, Korea
*
Author to whom correspondence should be addressed.
J. Mar. Sci. Eng. 2022, 10(5), 596; https://doi.org/10.3390/jmse10050596
Submission received: 21 March 2022 / Revised: 19 April 2022 / Accepted: 25 April 2022 / Published: 28 April 2022

Abstract

:
This paper is concerned with the development of a radionuclide dispersion model for the nuclear power plants in the Bohai, Yellow, and East China seas (BYECS) characterized by high turbidity and multi-scale circulations, focusing on the comparison of dispersion processes of 137Cs depending upon, in particular, the suspended sediment concentration and erosion/sedimentation processes. The simulations were carried out using a multi-fraction sediment transport model embedded in the semi-implicit Eulerian–Lagrangian finite-element coupled wave-circulation model linked with the model of radionuclide transport, which describes the key radionuclide transfer processes in the system of water–multi-fraction sediments. In contrast to the Eulerian models used for hydrodynamics and sediment transport processes, the Lagrangian technique was applied to simulate the transport of radionuclides. The simulation results for total suspended concentration agreed with in situ measurements and the Geostationary Ocean Color Imager data. The results of the simulation of hypothetical releases of 137Cs from four nuclear power plants (NPPs) placed in BYECS essentially differ from the real release of activity in the Pacific Ocean shelf due to the Fukushima Daiichi accident, which took place at the same time and released activity that was similar. The total amount of bottom contamination of 137Cs in releases from the Sanmen, Hanbit, and Hongyanhe NPPs was about 40% of dissolved component, and the total amount of suspended component was about 20% of dissolved component, in contrast with the Fukushima Daiichi accident, where the particulate component was only 2%. The results demonstrate the importance of erosion processes in the budget of 137Cs in shallow areas around the Sanmen and Hanbit NPPs, where strong wind and tidal currents took place.

1. Introduction

The Bohai Sea, the Yellow Sea, and the East China Sea (BYECS) are a system of nested marine basins open to the western Pacific Ocean. In the BYECS, the suspended sediment is one of the most important factors characterizing the state of the marine environment. The main sources of fine sediment fractions in this system are rivers, among which the Huang He River, Changjiang River, and Old Huanghe Delta are the most important. Wind and tidal forcings are the main factors causing sediment redistribution. The northerly monsoon in winter and southern monsoon in summer force seasonally varying wind currents and wind waves, redistributing sediments of river origin. An important factor governing circulation in the East China Sea is proximity to the Kuroshio Current.
The suspended sediment concentration (SSC) in BYECS has been studied since the 1960s. In situ measurements were carried out using SSC sampling and turbidity measurements. However, even now there are no in situ measurement data covering BYECS with high spatial and temporal resolution. In recent years, the surface concentration of suspended sediments in the BYECS has been studied using various types of satellite sensors, including Moderate Resolution Imaging Spectroradiometer (MODIS) and the MEdium Resolution Imaging Spectrometer (MERIS) [1]. The Geostationary Ocean Color Imager (GOCI) was the world’s first geostationary ocean color satellite [2,3,4]. It is now continuously observing the BYECS area in its geostationary orbit, which enables high temporal resolution of monitored fields.
Several numerical models were used to describe the resuspension, transport, and deposition of fine-grained sediments by wind and tidal currents, and wind waves. The ECOMSED model [5] and output from spectral wind-wave model WAM cycle 4 were used to simulate the resuspension of two classes of sediments (cohesive and non-cohesive sediments) resulting due to a wintertime storm event [6]. A sediment model was embedded into a wave–tide–circulation coupled model to simulate the transport processes of the Huang He River-derived sediment [7]. A model study of sediment pathways in the BYECS from the Huang He River, Chan Jiang River, and Old Huang He Delta was carried out [8] using an ROMS circulation model with a non-cohesive sediment transport module [9] linked with a spectral wave model, SWAN. The MIKE 3 hydrodynamics model, MIKE 21 Spectral Wave Module, and MIKE 3 MT mud transport model were used to simulate the transport of Huang He River discharged sediments [10].
On the banks of BYECS, there are 7 operating NPPs with 39 reactors with a nominal capacity of about 42,000 MW. A number of reactors and new NPPs are under construction and planned to be built, including floating NPPs. Potential release of radioactivity as a result of a nuclear accident in the NPPs located on the BYECS coasts can essentially contaminate marine environment, resulting in radiological doses to humans and marine biota. The radiologically important long-lived radioisotope 137Cs was released due to the Fukushima Daichi NPP accident [11]. This highly-soluble radionuclide is characterized by moderate reactivity to the sediments. The seafloor sediments on the shelf of Japan contain less than 1% of the 137Cs activity initially released due to the Fukushima Daichi NPP accident [11], which is explained by the low concentration of suspended sediment on the ocean shelf. However, the shallowness of the Bohai and Yellow seas and the high concentration of suspended sediments there affect the distribution of 137Cs and other reactive radionuclides. Therefore, it is important to use models that take into account the processes of transfer of reactive radionuclides by multi-fraction suspended sediments, as well as the mechanisms of exchange with radionuclides in bottom sediments due to diffusion in a dissolved form and due to settling and erosion [12]. The sediment transport and radioactivity model built by [13] satisfies these requirements and will be used in this paper to model the transport of 137Cs as a result of hypothetical accidental release at several nuclear power plants located in BYECS areas with different regimes of currents, tides, and waves.
The paper is organized as follows. The methodology of processing GOCI data is discussed in Section 2.1. The coupled wave–circulation model is briefly considered in Section 2.2.1, the sediment transport model is described in Section 2.2.2, and the radioactivity transport model is presented in more detail in Section 2.2.3. The setup of models and forcing and scenarios of simulation are given in Section 2.3, Section 2.4 and Section 2.5. The validations of tide and wind-wave models predictions are given in Section 3.1. A comparison of model prediction with measurements of total suspended sediment concentration is given in Section 3.2. The results of calculations for the scenarios of potential release from four NPP locations are discussed in Section 3.3. Our findings are summarized in Section 4.

2. Materials and Methods

2.1. GOCI Data

To retrieve the total suspended sediment concentration SSC from GOCI top-of-atmosphere data, the atmospheric correction was initially performed for GOCI images. Then, GOCI images were converted to radiance on the sea surface ( L W ); in turn, L W was converted to remote sensing reflectance ( R r s ) using the extraterrestrial solar irradiance ( F 0 ) values for three GOCI bands (490, 555, and 660 nm). The empirical relation between three values of remote sensing reflectances ( R r s 490 , R r s 555 , and R r s 660 ) and SSC ( g   m 3 ) was obtained in [3] as
S S C = 10 X
where
X = c 0 + c 1 ( R r s 555 + R r s 660 ) + c 2 ( R r s 490 R r s 555 )  
c 0 = 0.6567 , c 1 = 28.83 , c 2 = 6917 . The comparison derived from the GOCI concentration of SSC and in situ measurements [4] carried out by filtering of water samples is given in Figure 1. As seen in the figure, the derived-from-GOCI concentration of SSC correlates well with in situ measurements [4]. The geometric mean (GM) and the geometric standard deviation (GSD) for derived-to-in situ ratios of SSC were 1.29 and 2.26, respectively. The correlation coefficient was 0.75.

2.2. Model Description

2.2.1. Coupled Wave–Circulation Model

The sediment transport model is embedded into the wave–circulation model SELFE [14,15], recently transformed into the SCHISM model [16]. A 3D circulation hydrostatic SELFE model solves Reynolds-stress averaged Navier–Stokes equations using a finite element approach and unstructured grids. The governing equations describe conservation of mass, momentum, salt, and heat with hydrostatic and Boussinesq approximations. The equations of the third-generation spectral wave model WWM II are solved in the same finite elements simultaneously with circulation equations, resulting in an accurate description of the interaction between wind waves and currents by radiation stress mechanism and enhanced bottom friction [15]. Wind stresses, turbulent heat, and moisture fluxes at the surface of the ocean are calculated using a model for the surface layer of the atmosphere [17]. Data flow in the modeling system is given in Figure 2.

2.2.2. Sediment Transport Model

The 3D sediment model is based on the ROMS transport model [9] adapted to the unstructured SELFE grid by [18]. This model was further modified, taking into account the transport of both non-cohesive and cohesive sediments, as well as mixtures of fractions of different sizes of cohesive/non-cohesive sediments [13]. The suspended sediment transport equation is
C p , i t + U C p , i = W p , i C p , i z + z ν T C p , i z + H K H H C p , i .
Here, t is time; z is the vertical coordinate directed upward; U = ( U , V , W ) is the velocity; is the 3D vector operator; i is an index of sediment size class; n + 1 is the total number of sediment classes; i = 0 is cohesive sediment class, whereas non-cohesive sediments ( 1 i n ) are represented by n classes; C p , i is the concentration of i-th class of suspended sediment (kg m−3); W p , i is settling velocity of sediment class i (m s−1); ν T and K H are vertical and horizontal eddy diffusivity, respectively (m2s−1); H is horizontal vector operator.
SELFE uses generic length scale (GLS) turbulence closure by [19], which is governed by two equations for the turbulent kinetic energy k and generic length scale, ψ = k α l β , yielding vertical diffusivity as
ν T = 2 s h k 1 / 2 l ,
where l is a length scale, and s h is stability function. In this study, α = β = 1 (k-kl closure) was used and the stability function was taken from [20].
The boundary conditions for Equation (1) at the free surface z = η and bottom z = −H are, respectively,
ν T C p , i z ( W W p , i ) C p , i = 0 ,
ν T C p , i z W p , i C p , i = D i E i ,
where D i is sediment deposition rate (kg m−2 s−1) and E i is sediment erosion rate (kg m−2 s−1). In contrast to [9], where only non-cohesive sediment transport processes were considered, the model [13] described the deposition and erosion of the mixture of cohesive and non-cohesive sediments following assumptions by [21]. It was assumed that these processes depend on cohesive sediment fraction ϕ 0 in the surface layer of the bed. Erosion of mixtures of cohesive and non-cohesive sediments is independent if cohesive sediment content is below the critical value ϕ 0 , c r . Above critical cohesive sediment content, the bed behaves cohesively. In the non-cohesive regime, exchange of non-cohesive and cohesive sediments with the bottom is independent, whereas in a cohesive regime, an erosion of non-cohesive and cohesive sediments simultaneously occurs with cohesive sediment erosion. The deposition is an independent process for cohesive and non-cohesive sediments.
If the cohesive sediment volume fraction in the surface layer of the bed ϕ 0 is below critical value ϕ 0 , c r , then erosion and deposition occur in a non-cohesive regime. In contrast to [9,18], the erosion flux for non-cohesive sediments ( 1 i n ) is calculated using formulations by [22] as
E i = E 0 , i ( d i ) ( 1 ε ) ϕ i ( τ b τ c r , i ( 1 + ϕ 0 ) 1 ) 1.5 when τ b 1 + ϕ 0 > τ c r , i ,
where E 0 , i ( d i ) = 0.015 ρ s , i d i a i 1 D , i 0.3 is the erosion rate; d i is the sediment particle diameter; D * , i = d i [ g ( ρ s , i ρ w 1 1 ) ν M 2 ] 1 / 3 is the dimensionless sediment diameter; ν M is kinematic viscosity; ρ s , i is the particle density; ε is the porosity of the surface bed layer; ϕ i is the volume fraction of sediments of class i in the surface bed layer ( i = 0 n ϕ i = 1 ); τ b is a bottom shear stress; the critical shear stress for the sediments of class i is τ c r , i = θ c r , i g d i ( ρ s , i ρ w ) , where θ c r , i is the dimensionless critical shear stress derived from critical Shields parameter [23]; a i = 3 d i is reference level above the bottom; ρ w is water density. Following [21], the critical shear stress in (6) was corrected for the presence of a cohesive fraction ϕ 0 . Non-cohesive sediment flux due to sediment deposition is simulated as the flux of particles that fall with settling velocity W p , i :
D i = W p , i C p , i ( H ) ,
where C p , i ( H ) is the near-bottom concentration of suspended sediment of class ( 0 < i n ).
Erosion flux for cohesive sediments is formulated following [24], as
E 0 = E 0 , 0 ( 1 ε ) ϕ 0 ( τ b τ c r , 0 1 )           when           τ b > τ c r , 0 ,
where τ c r , 0 is critical shear stress for the erosion of cohesive sediments, E 0 , 0 is the erosion rate for cohesive sediments, and ε is porosity. For the cohesive sediments, deposition flux appears only if shear stress is less than critical shear stress for deposition:
D 0 = W p , 0 C p , 0 ( 1 τ b τ c d )           when τ b < τ c d ,
where τ c d is the critical shear stress for the deposition of cohesive sediments. If the cohesive sediment fraction in the bed is above critical ( ϕ 0 > ϕ 0 , c r ) , then erosion for all fractions ( 0 < i n ) occurs in the cohesive regime as
E i = E 0 , 0 ( 1 ε ) ϕ i ( τ b τ c r , 0 1 )               when τ b > τ c r , 0 .
The settling velocity W p i for non-cohesive fractions of sediments is calculated according to [22]. For cohesive fraction, settling velocity is corrected for flocculation following [25], as
W p , 0 = W f = ( ρ s ρ w ) g 18 ρ w ν M d 0 3 F D f F 1 1 + 0.15 Re 0.687 ,
where W f is the settling velocity of the floc, ρ s is the dry density of sediment, D f is the floc size, the Reynolds number of the floc is Re = W f D f ν 1 , and F is the fractal dimension. Since Re is a function of W f Equation (11) was solved numerically to find W f .
The floc size can be calculated from the dynamic Equation [25]. Assuming equilibrium between the floc growth and destruction, the floc size D f is estimated at F = 2 [25] as
D f = d 0 + k A C p , 0 k B G 1 / 2 ,
where G = ε T / ν M is the turbulent shear, ε T is the turbulent dissipation rate, k A is the dimensional aggregation parameter (m2 kg−1), and k B is the floc break-up parameter (s1/2 m2) [25].
In general, to estimate erosion flows, it is necessary to calculate changes in the composition of sediments of the upper layer, taking into account the vertical distribution of the composition of sediments and bed surface position. The dynamics of sediment distribution over depth are described by a multilayer model [3,13,18]. However, in this study, we considered a relatively short period, during which it was assumed that the distribution of sediments in the surface layer of the bottom was assumed to be constant in time.

2.2.3. Radioactivity Transport Model

The model of radionuclide transport [13] describes the key processes in the system of water–multi-fraction sediments. In the water column, radionuclides in the dissolved and particulate phases are transported by currents with the simultaneous influence of turbulent diffusion. The radionuclides in the dissolved phase interact with the particulate phase radionuclides in suspended sediments and bottom deposits. A transfer of activity between the dissolved and particulate phases is described by adsorption–desorption processes. The settling of contaminated suspended sediments and bottom erosion are important pathways of radionuclide exchange between the bottom and suspended sediment. We use here a simplified version of the model [13] where only fast reversible exchange processes are considered and the bottom distribution of radionuclide is represented by a single well-mixed layer. The equations of the concentration of the dissolved phase of radionuclide in the water column C d w (Bq m−3) and the concentration of reversible radionuclide phase C p , i w (Bq m−3), respectively, for each suspended sediment size fraction i in the water column are written as
C d w t + U C d w = a d s ( C d w i = 1 n C p , i K d , i C p w ) + z ν T C d w z + H K H H C d w λ C d w ,
C p , i w t + U C p , i w = W p , i C p , i w z + a d s ( C d w S p , i K d , i C p , i w ) + z ν T C d w z + H K H H C d w λ C p , i w ,
where a d s is the desorption rate (m s−1), λ is the decay constant, and K d , i is the distribution coefficient (m3kg−1) that depends on the sediment particle diameter as
K d , i = χ a d s ρ s , i 6 d i ,
where χ is an exchange velocity (m s−1) [26].
The distribution of radionuclides in bottom sediments is approximated by a one-layer model [13], where the pore water concentration C d b and concentration of particulate radionuclide C s , i b in the well-mixed deposit layer of thickness Z are obtained from equations:
C d b = W p w C d w ( H ) + a d s θ Z ( 1 ε ) C ^ s b W p w + a d s θ Z ( 1 ε ) K ^ d ,
ϕ i Z C s , i b t = a b d s ( 1 ε ) ϕ i Z ( C d w ( H ) K d b C s , i b ) + a r s ( 1 ε ) ϕ i Z ( C ^ s b K d , i K ^ d C s , i b ) + ϕ i D i C s , i w C p , i E i C s , i b ρ s , i λ ϕ i Z C s , i b ,
Here,
a b d s = a d s θ W p w W p w + a d s θ Z ( 1 ε ) K ^ d ,             a r s = a d s 2 θ 2 Z 2 ( 1 ε ) K ^ d W p w + a d s θ Z ( 1 ε ) K ^ d ,
where θ is the correction factor for the desorption rate in the bottom sediment [13], and W p w (m s−1) is an exchange rate between the water column and pore water in sediment [27], calculated as
W p w = 0.1778 u * Re 0.2 Sc 0.0.604 ,
where u * is the friction velocity (m s−1), Re = u * δ * ν M 1 is the Reynolds number, Sc = ν M / ν D is the Schmidt number, ν D is the free solution diffusion coefficient (m2 s−1), and δ * is the average height of the roughness elements (m). Weighted parameters in the equations are
C p w = i = 1 n C p , i w ,         C ^ s b = i = 1 n ϕ i ρ s C s , i b ,         K ^ d = i = 0 n ρ s , i ϕ i K d , i .
The boundary conditions for (13) and (14) at the free surface z = η are
ν T C d w z W C d w = q d ,         ν T C p , i w z ( W W p , i ) C p , i w = q p , i .
where q d and q p , i are corresponding fluxes of activity from the atmosphere. The fluxes into the bottom at z = H are
ν T C d w z W C d w = ε W p w ( C d w C d b ) ,         ν T C p , i w z ( W W p , i ) C p , i w = C p , i w D i C p , i + C s , i b E i ,
In contrast to the Eulerian model [13], we used here the Lagrangian technique to simulate the transport of radionuclides, adsorption–desorption of particulate radionuclides, decay, deposition, and resuspension from the bottom [12]. It must be emphasized that Lagrangian models are especially well suited to the emergency phase of an accident simulated in this paper since they can handle the very high concentration gradients in computation domain and since they can be significantly faster than using Eulerian models when the contaminated area initially is a small part of the whole computational domain [12]. The radionuclide concentration was represented by a collection of particles for which the transport problem was solved as a particle tracking problem. The mass of dissolved and particulate radionuclides in the computational domain was divided into a large number of particles of equal mass which have four properties during the simulation: (i) state (either “dissolved” or “particulate”); (ii) grain size class; (iii) source class; (iv) settled or suspended particulate states. To simulate suspended radionuclide transport, we use the random dispersion model (RDM), where the positions of particles were simulated as a random Markov process. A method based on the solution of the Kolmogorov equation was used in the stochastic approach for simulating transfers between different states of the radionuclide [12,28]. A detailed comparison of the model prediction and measurements in the Pacific Ocean after the Fukushima Daiichi accident was carried out in the frame of the IAEA intercomparison study [29].

2.3. Model Setup

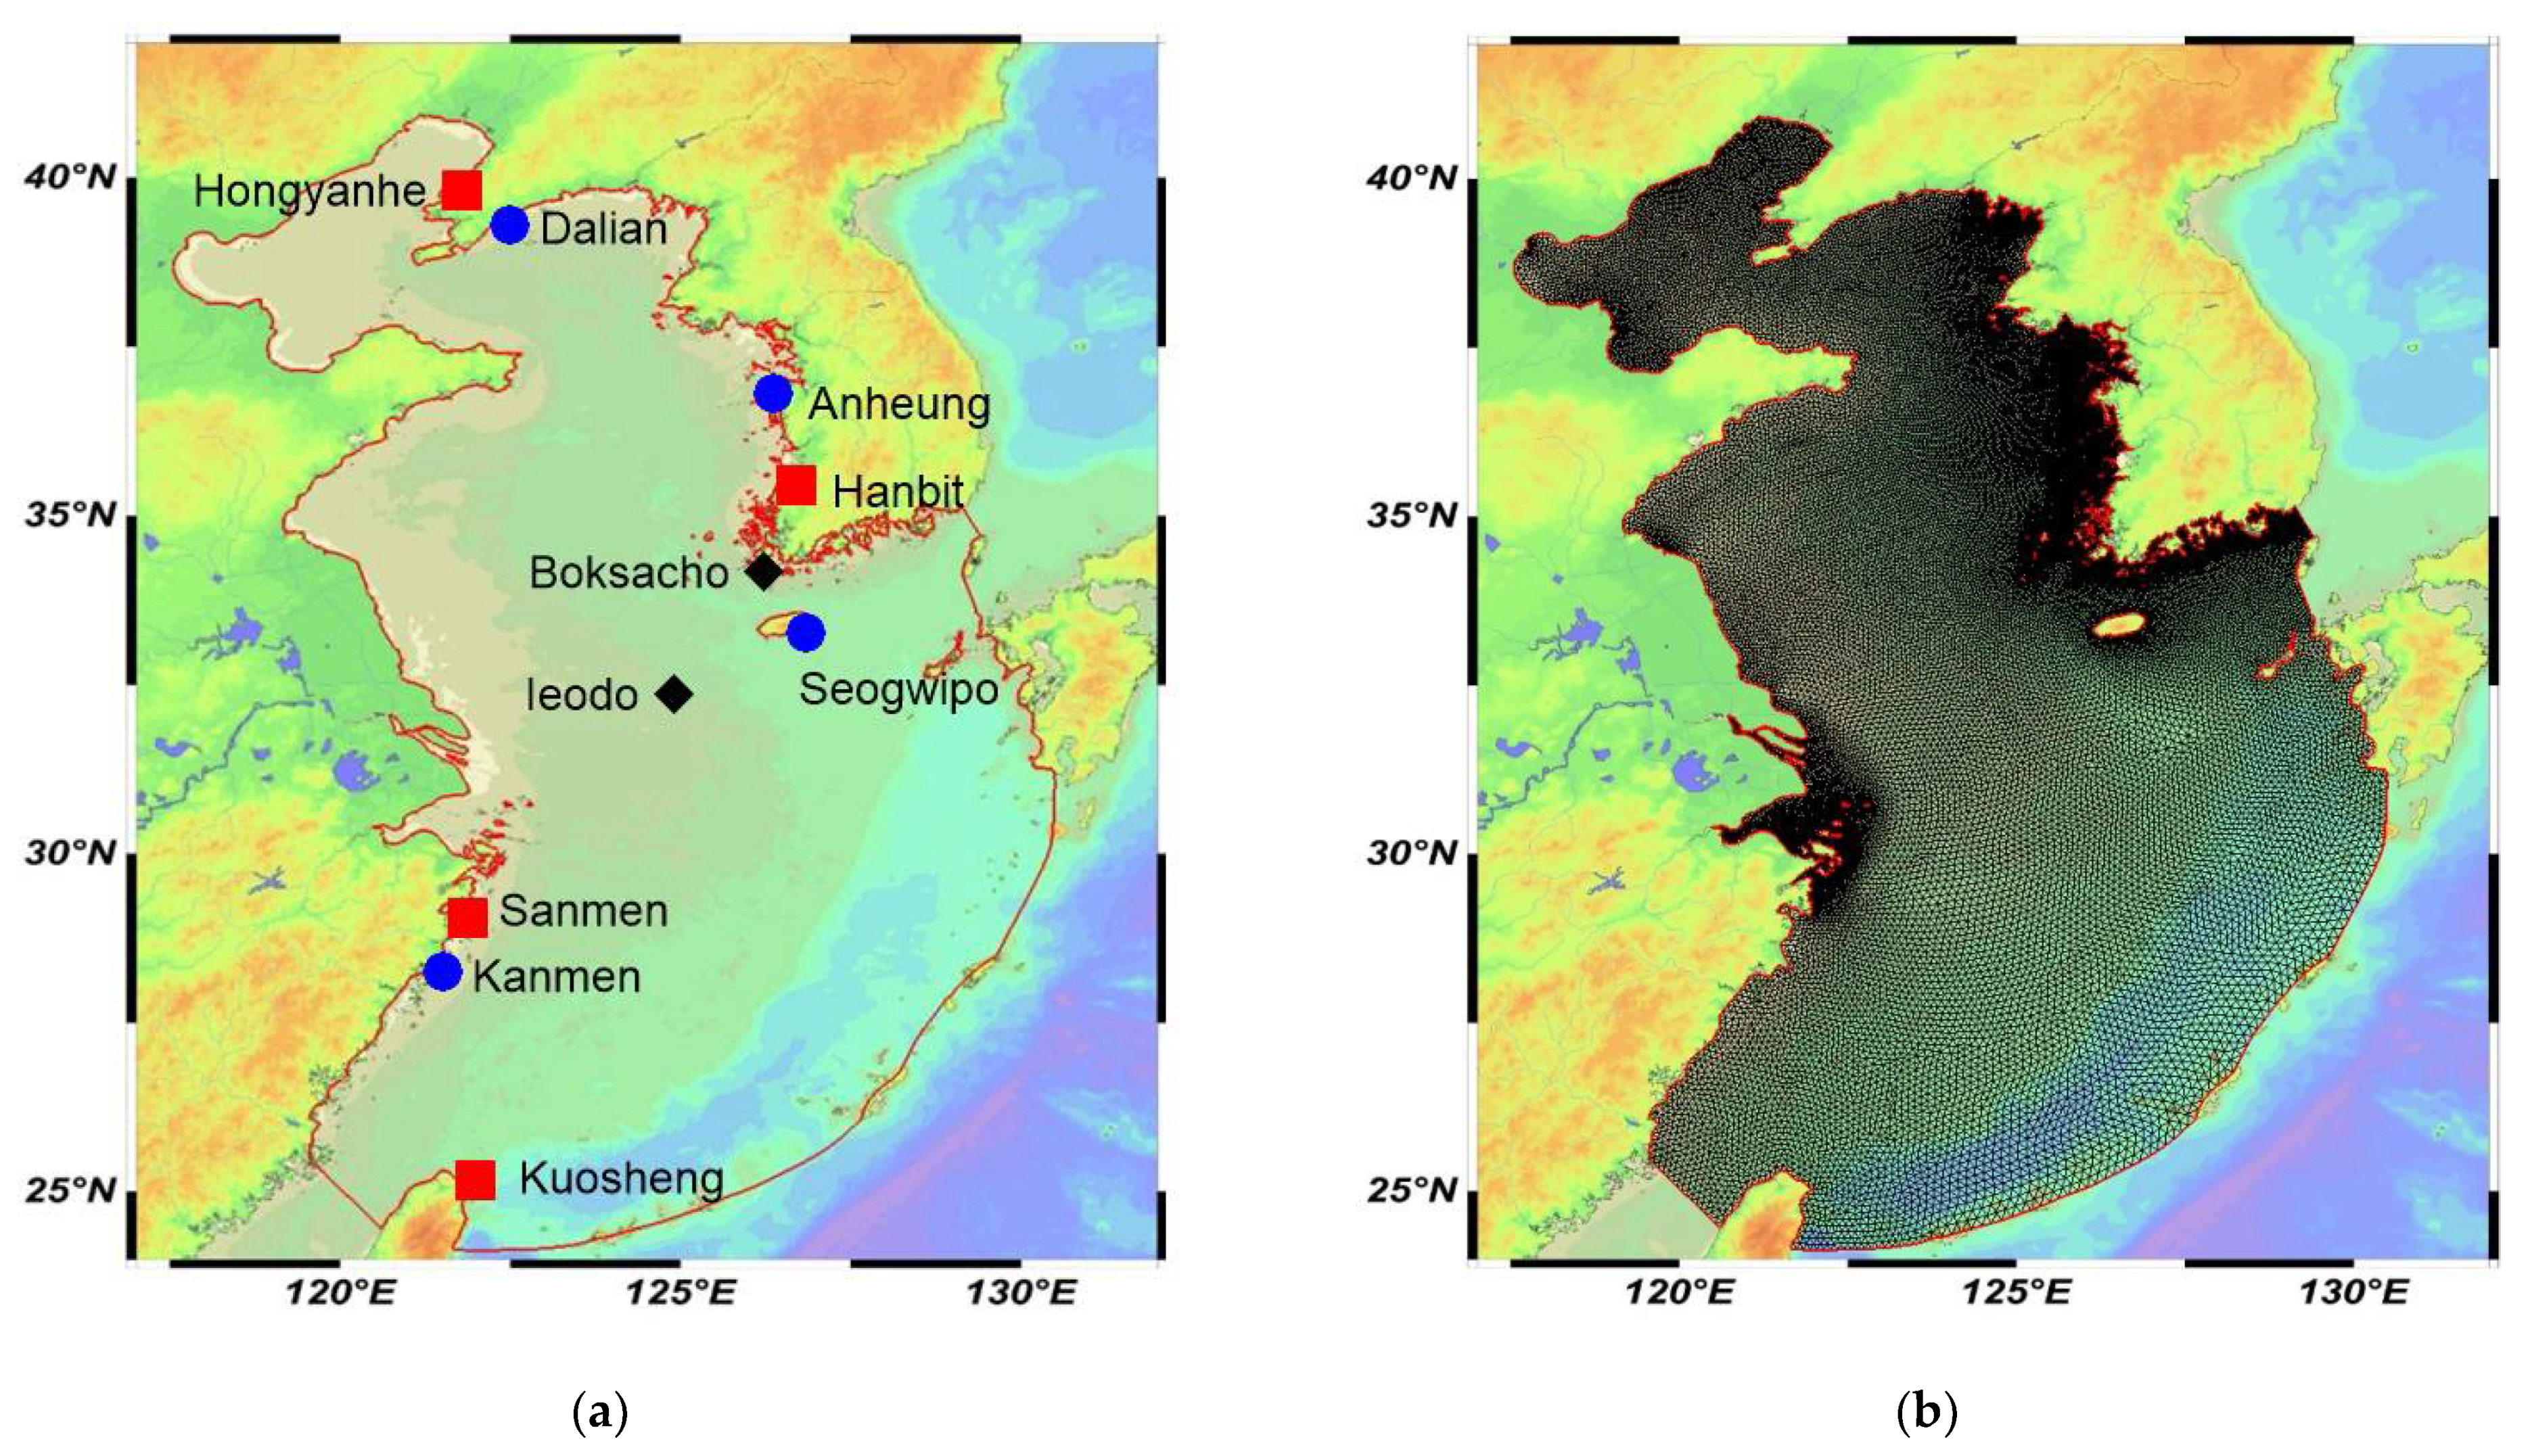
The bathymetry in the modeling domain (Figure 3a) covering BYECS was built from data [30,31] with one-minute resolution. It was merged with the General Bathymetric Chart of the Oceans (GEBCO) data [32]. The model domain was discretized using 50,613 nodes and 96,217 triangle elements (Figure 3b). The mesh resolution ranged from 400 m along Korea and China shorelines to 8 km on the open ocean boundary. The vertical grid consists of 11 sigma layers for the depths shallower 300 m and 7 fixed z-layers below.
Bottom grain sizes in BYECS were divided into five classes (see Table 1) corresponding to the phi scale: (0) clay ( φ > 8 ), (1) fine silt ( 6 < φ < 8 ), (2) coarse silt ( 4 < φ < 6 ), (3) fine sand ( 2 < φ < 4 ), and (4) coarse sand ( φ < 2 ). Detailed distribution of the median sediment bed size d 50 was compiled by the First Institute of Oceanography (China). The corresponding map of the phi scale φ 50 defined as
d 50 [ mm ] = d r e f 2 φ 50
is presented in Figure 4a together with the standard deviation in Figure 4b. Here, d r e f = 1 mm is a reference value. However, maps of the distribution of all mentioned sediment classes are still lacking. The map of mud (clay and silt) distribution according to the available data was compiled by Prof. Choi [30]. We use these data in Figure 3b to reconstruct distributions of the sediment classes. Assuming the normal distribution of the parameter φ (lognormal for the sediment grain diameter d), we can approximate the density of distribution of the phi scale p ( φ ) with standard deviation σ :
p ( φ ) = 1 2 π σ exp ( ( φ φ 50 ) 2 2 σ 2 ) .
Knowing the distribution of the mud fraction of BYECS, it is possible to estimate the unknown standard deviation σ from the integral equation for the mud fraction f m :
f m = 4 1 2 π σ exp ( ( φ φ 50 ) 2 2 σ 2 ) d φ .
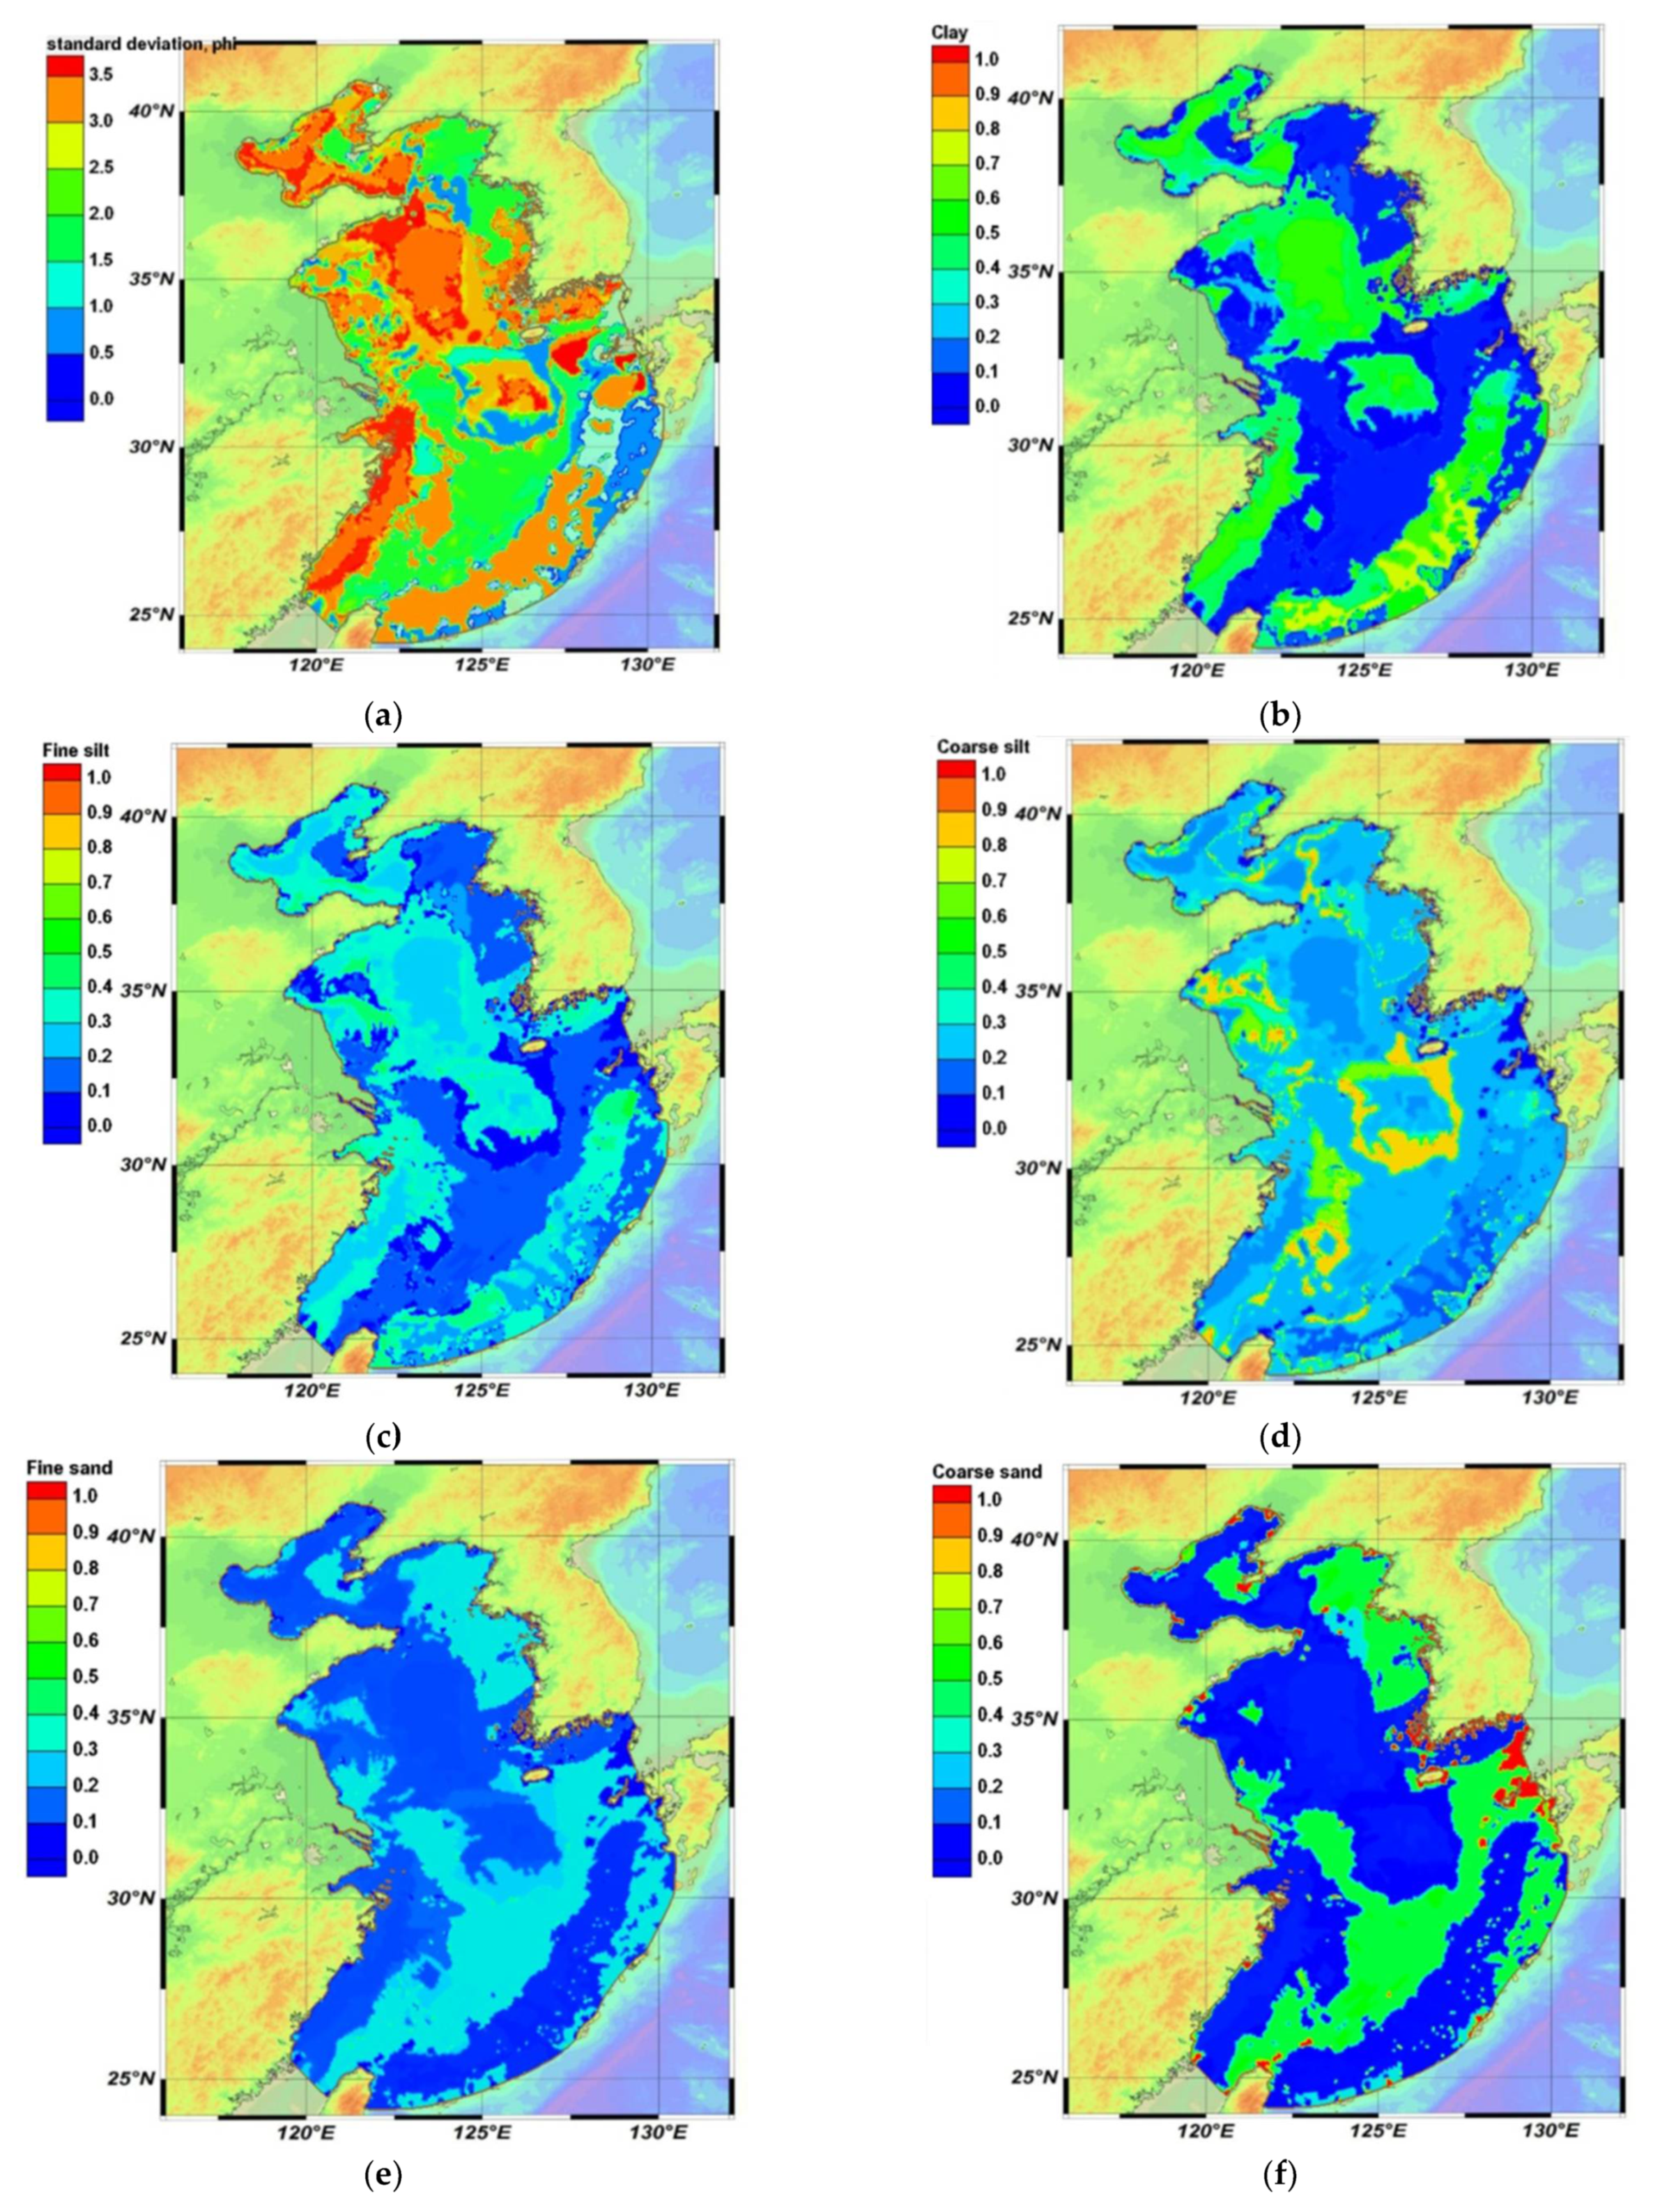
Solving this equation numerically, we built the map of the standard deviation σ in Figure 5a. Then, fractions of all sediment size classes were calculated as
f i = φ i φ i + 1 1 2 π σ exp ( ( φ φ 50 ) 2 2 σ 2 ) d φ .
The distributions of five sediment fractions reconstructed in this way are shown in Figure 5b–e. As seen in Figure 5, deposits of clay and fine silt dominate the Bohai Sea, a patch in the center, along the western coast of the Yellow Sea, and in the deep Okinawa Trough. The fine and coarse sand make up about half of the fractional composition at the edge of the shelf of the East China Sea and the western coast of Korea.

2.4. Model Forcing

To calculate wind surface stresses and heat fluxes through the free surface, the Era-Interim reanalysis data [33] was used with 80 km resolution. Two-dimensional fields of wind velocity, air temperature, cloudiness, humidity, and air pressure were interpolated into each model surface node with a 3 h time step for the period 2011–2013.
To set up open boundary conditions, we used results of global HYCOM [34] simulations. Three-dimensional fields of temperature and salinity from the global model were interpolated into the boundary nodes’ locations. The clamped boundary condition for sea surface elevation η was combined with the radiation boundary condition for the velocities as
η b = η g + η t ,
U b = α ( U h + U t ) + ( 1 α ) U m .
Here, η g is free surface elevation computed by a global model, η t is a tidal elevation on the boundary, U b is 3D global model velocity field interpolated into the boundary nodes, U t is tidal barotropic velocity, U m is the model simulated value of the boundary velocity, and α is relaxation parameter. The relaxation parameter α allows suppressing occurrences of the near-boundary velocity field instabilities which can happen in the case of using pure clamped-elevation open-boundary condition. The TPXO-08 global model database [35] was used to calculate the tidal elevation η t and barotropic tidal velocities U t . It used 13 harmonics with a spatial resolution of 1/30 degree. The value of α was in a range of 0.01–0.1.
The seasonal variations of BYECS main river discharges (Fuchun Jiang, Chan Jiang, Huai He, Huang He, Haiho, and Han rivers) were taken into account [36]. The suspended sediment inflow was accounted for two rivers with the highest sediment load; Huang He and Chang Jiang loads were 1.08 × 10 9 and 4.78 × 10 8 t a−1, respectively. Mean suspended sediment concentration in the Huang He and Chan Jiang rivers was 25 kg m−3 and 0.5 kg m−3, respectively. The overall concentration was divided into several fractions: 0.1 kg m−3 of clay, 0.2 kg m−3 of fine silt, 0.1 kg m−3 of coarse silt, and 0.1 kg m−3 of fine sand for Chang Jiang River, and 3.75 kg m−3 of clay, 10 kg m−3 of fine silt, 7.5 kg m−3 of coarse silt, and 3.75 kg m−3 of fine sand for Huang He River.

2.5. Scenarios of the 137Cs Release

For simulation of hypothetical radioactive releases, four NPPs in BYECS were chosen: Sanmen NPP (29°6′4″N, 121°38′31″ E), Hongyanhe NPP (39°47′45″ N, 121°28′50″ E), Hanbit NPP (35°24′54″ N, 126°25′26″ E), and Kuosheng NPP (25°17′9″ N, 121°35′10″ E), shown in Figure 3a. The release of 137Cs started on 20 March 2011 and lasted for 14 days in all stations simultaneously. Discharges from outlets were constant during all calculation time and equal to 250 m3 s−1. In total, 4 PBq of 137Cs was released with a constant rate during 14 days from each NPP. A parallel version of the Lagrangian model was used with a total number of particles of 18 million.

3. Results

3.1. Validation of Tide and Wind-Wave Model Predictions

To validate the calculation of tides, the model was run considering only tidal forcing. The comparison of the time series of observed tide elevations with model-computed elevations in four locations (Seogwipo, Anheung, Kanmen, and Dalian, in Figure 3a) is shown in Figure 6. The simulations and measurements agree well. The corresponding correlation coefficients were 0.98–0.99, whereas RMSE (root-mean-square error) for Seogwipo was 0.05 m, for Anheung was 0.13 m, for Kanmen was 0.09, and for Dalian was 0.13 m. As seen in Figure 6, the computed amplitudes in Dalian were lower than observed, which can be explained by too-high bottom friction.
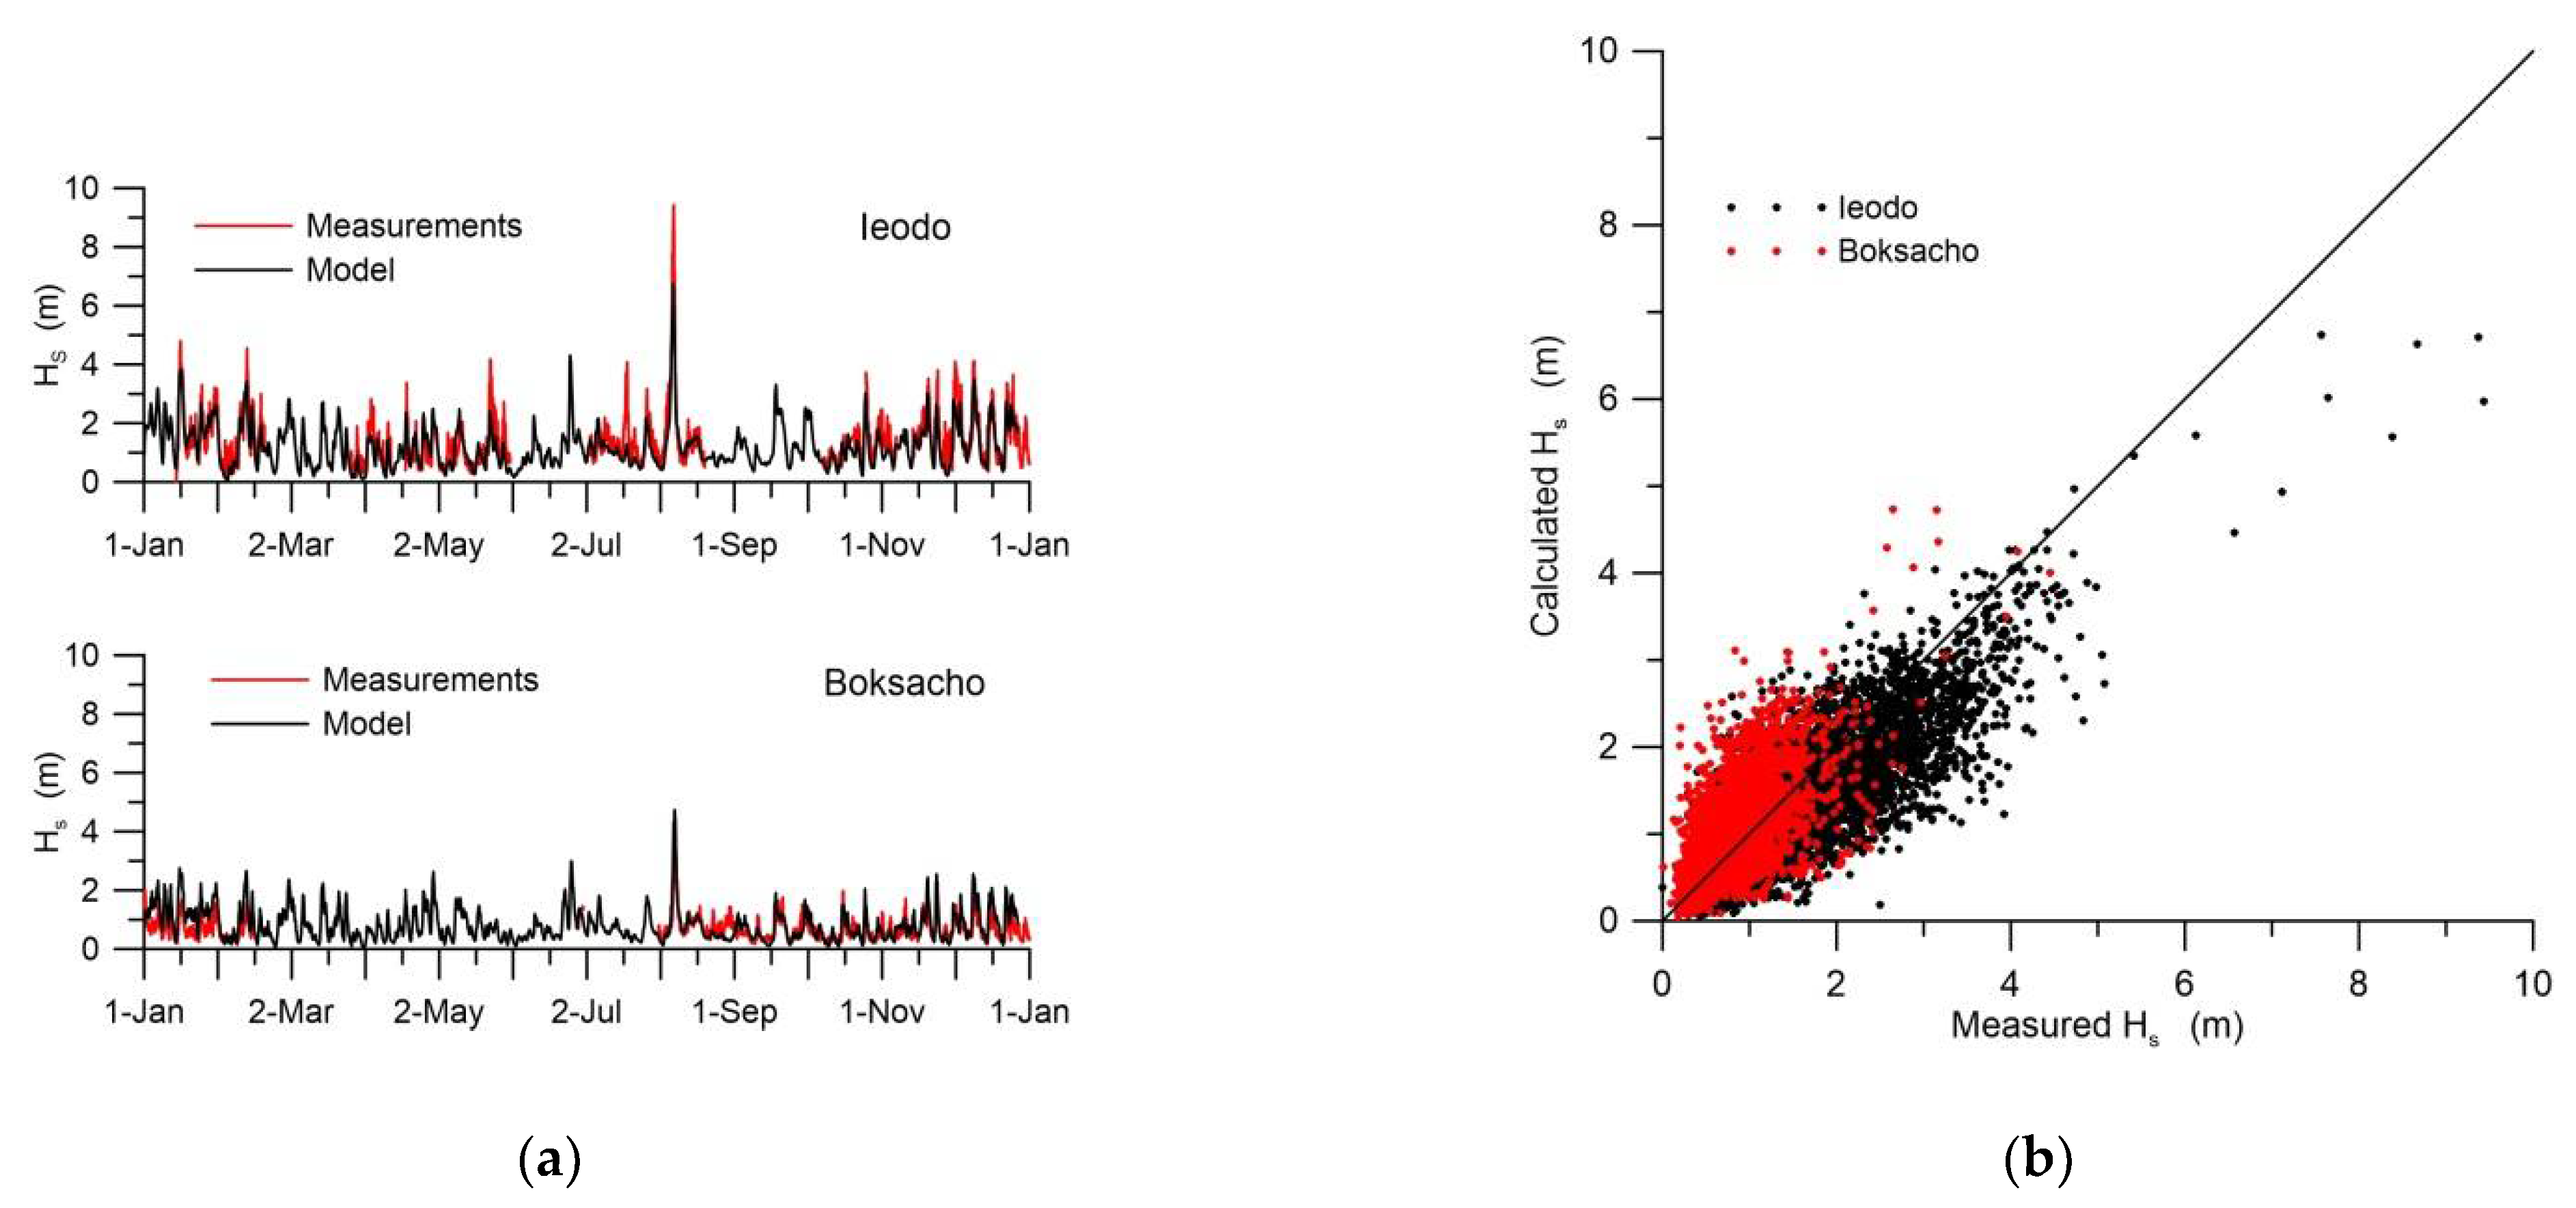
The results of comparing the calculations of wind waves by the model of waves WWMII embedded in the SELFE model in Figure 7 are given for two KHOA (Korea Hydrographic and Oceanographic Administration) [37] buoys: Ieodo and Boksacho (Figure 3a). The correlation coefficient between measurements and calculations was 0.81, whereas RMSE = 0.47 m.

3.2. Comparison of Model Prediction with Measurements of Total Suspended Sediment Concentration

The simulation results of total suspended sediment concentration (SSC) were compared with in situ measurements and GOCI data. The results of the comparison of observed surface SSC measured in situ by [4] in coastal waters of Korea with simulation data are shown in Figure 8. The simulation and observations agree; however, RMSE = 27 mg L−1 was relatively large due to the complicated geometry and bathymetry of the region.
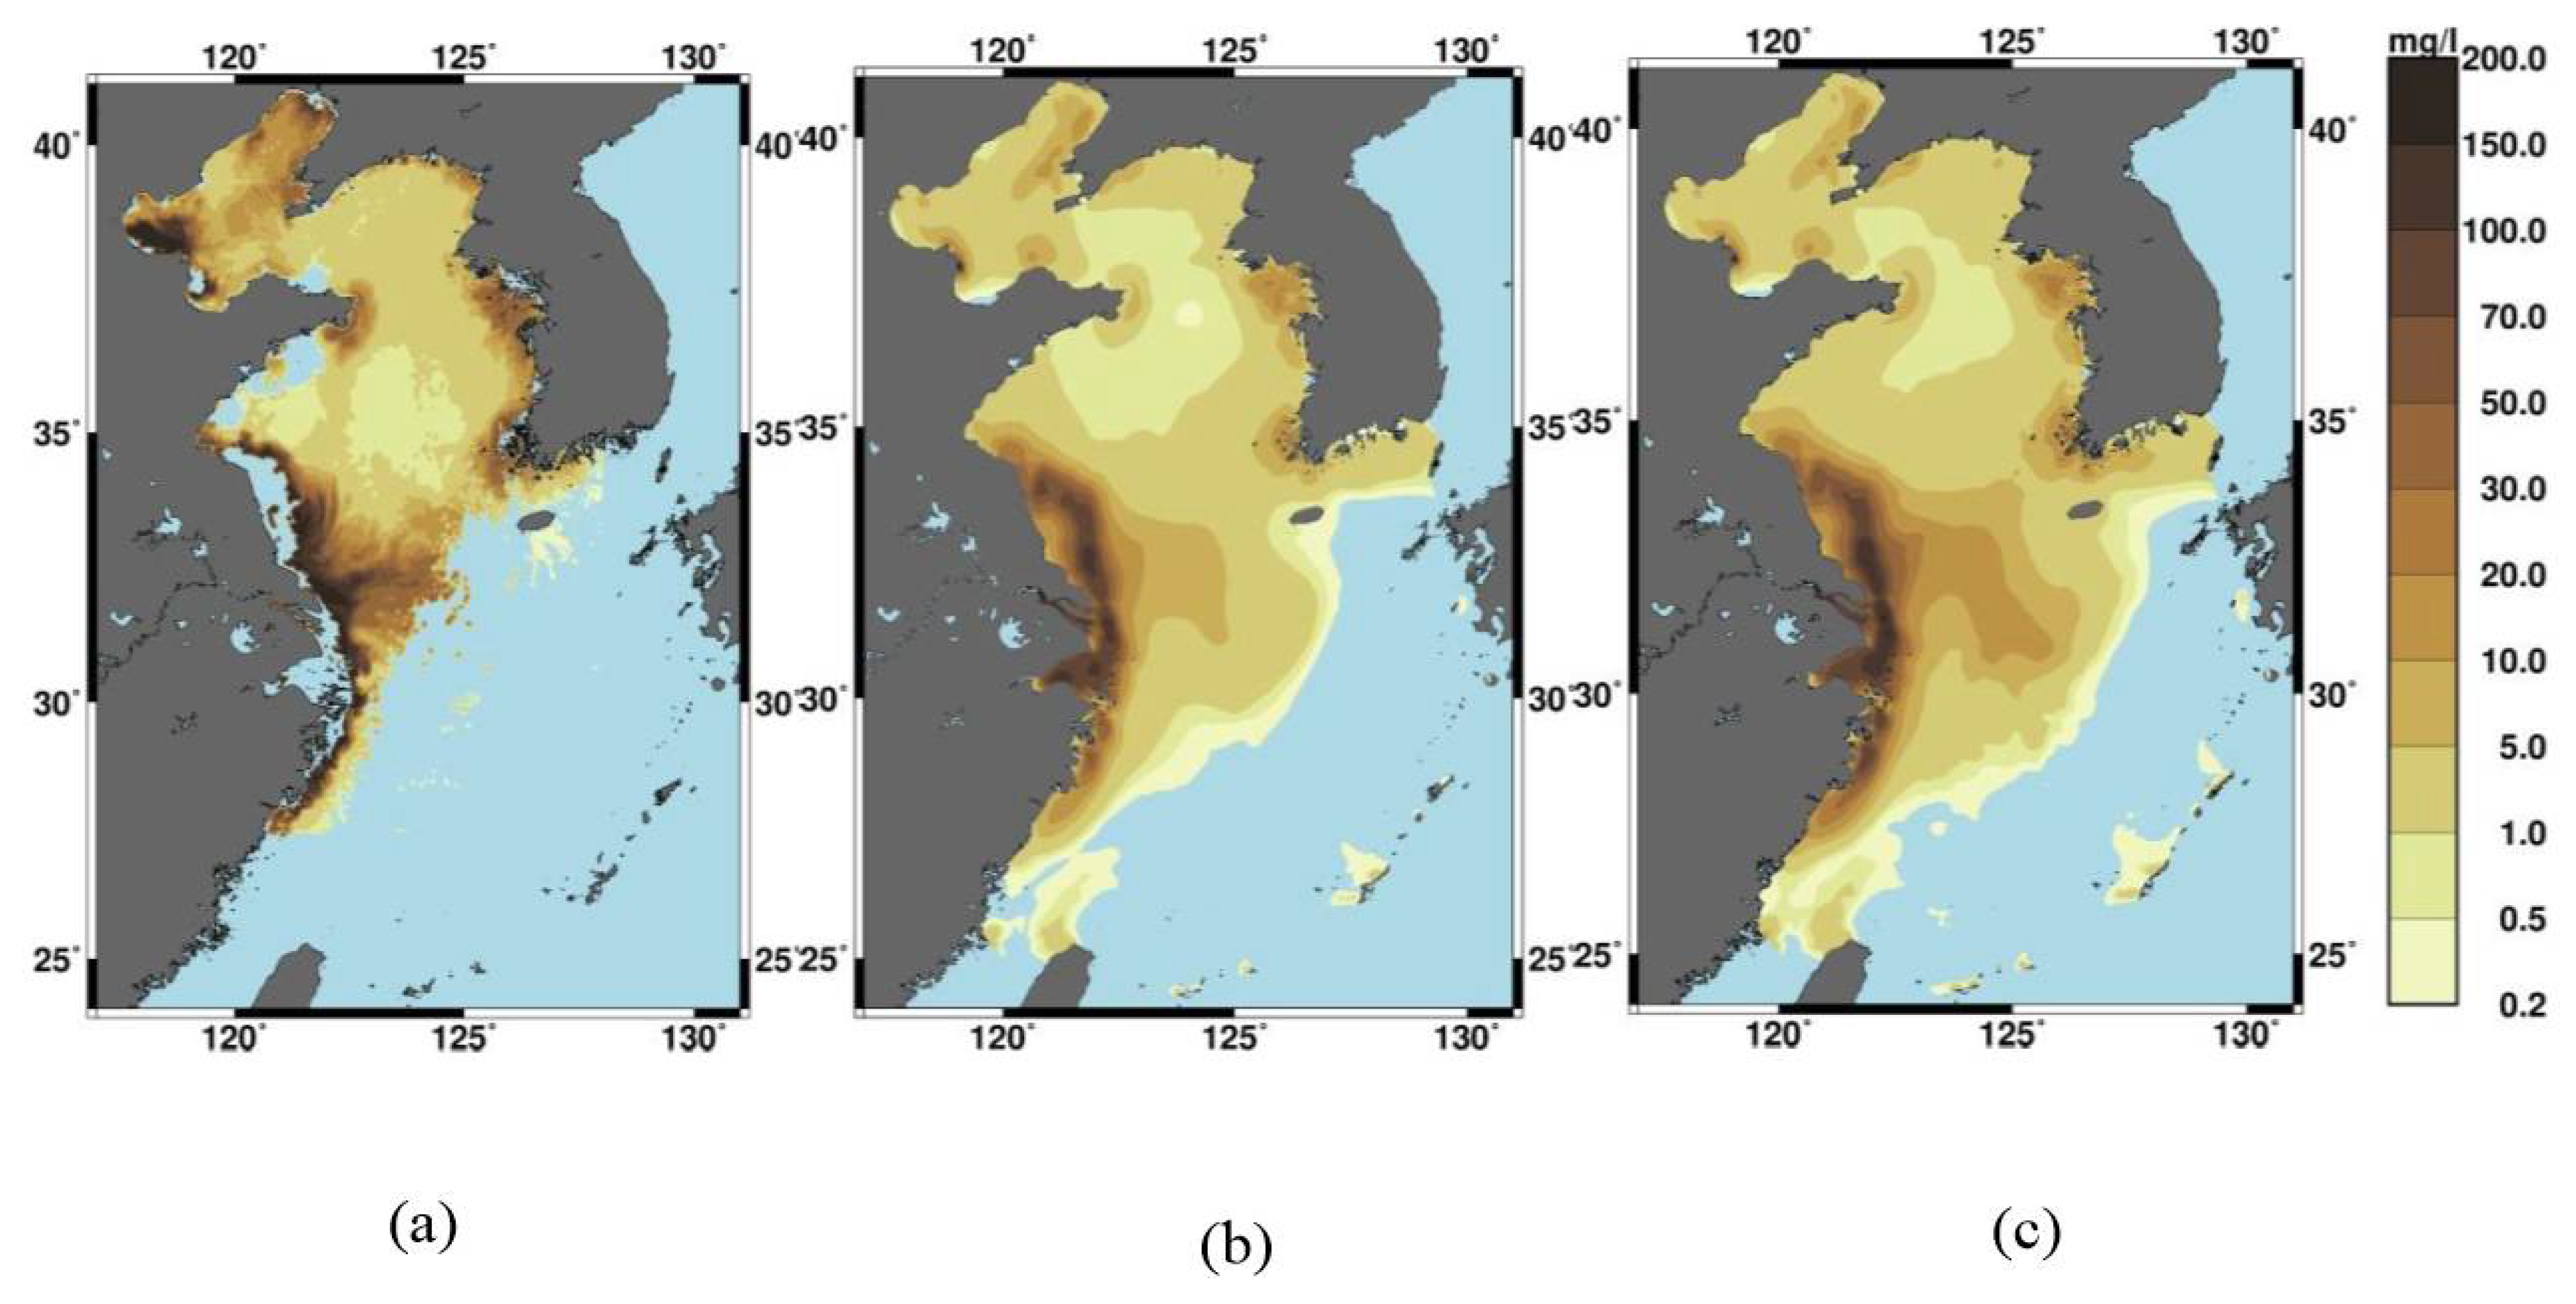
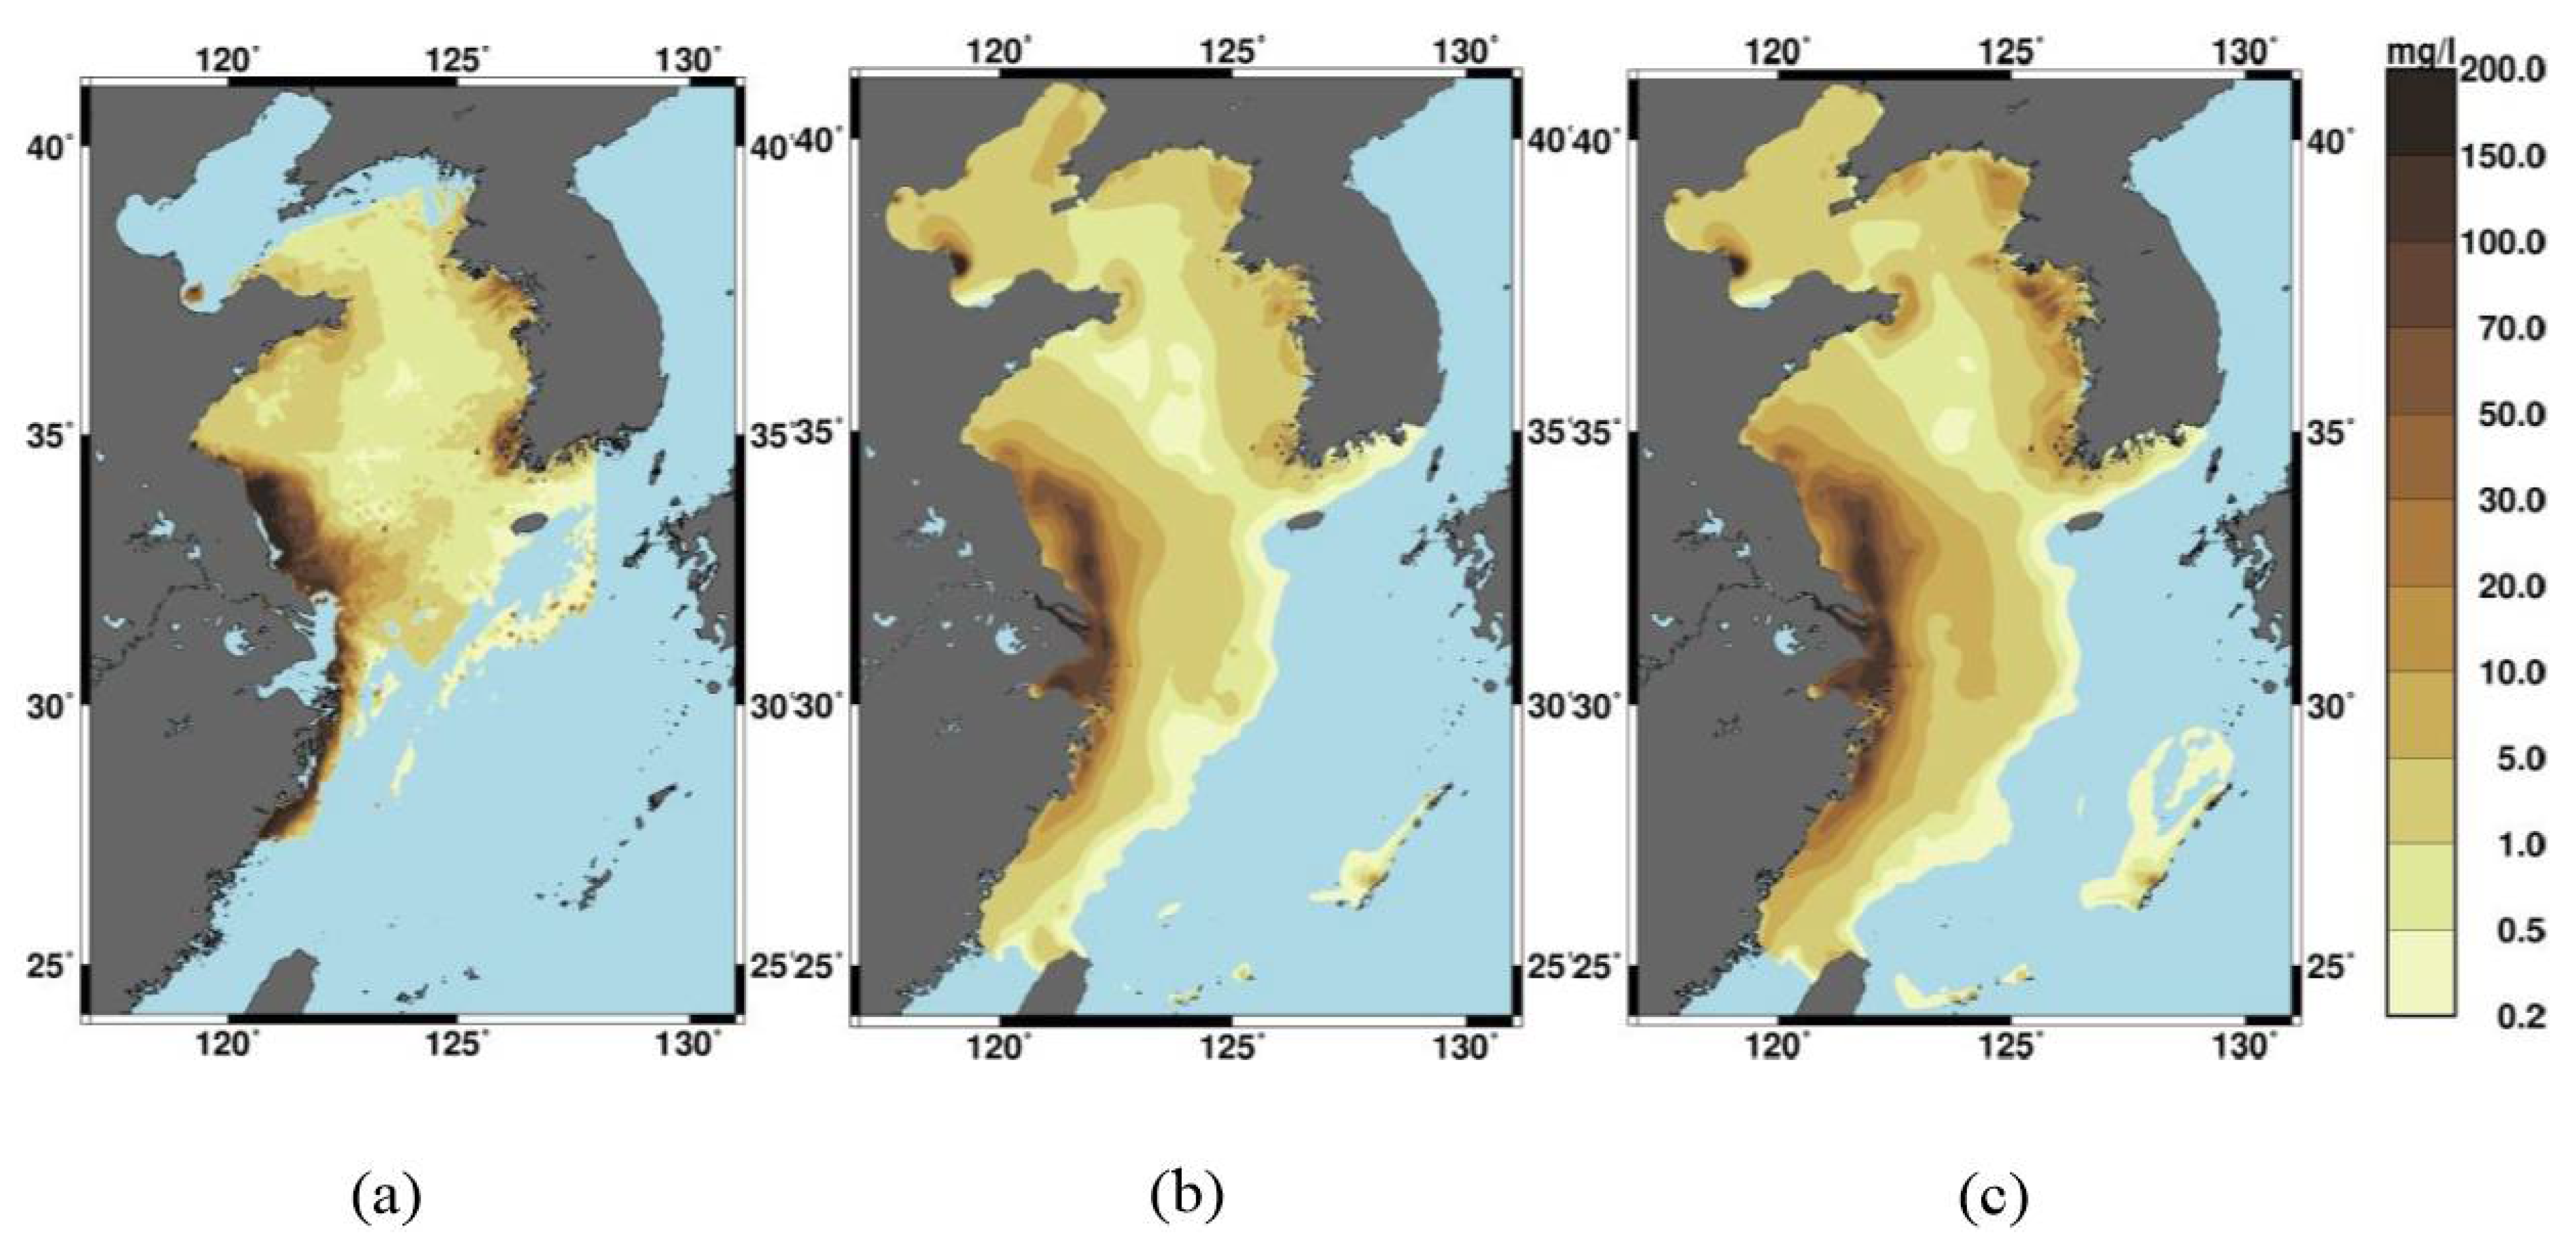
In Figure 9 and Figure 10, the surface distribution of SSC from GOCI remote sensing data, simulation without waves, and simulation with waves are presented for two dates (21 March 2013 and 4 October 2013) with available GOCI data. As can be seen in the figures, the distribution is similar in all cases: maximums along the western coasts of the BYECS caused by the inflow of fine-grained sediments (see Figure 5) and erosion in the shallow waters by wind currents and tides (Figure 2). Another maximum near the Korean coast is also related to strong tidal currents.
The observed and simulated values of SSC change by several orders of magnitude. Therefore, the geometric means (GM) and the geometric standard deviation (GSD) were estimated for observed-to-simulated ratios of SSC concentrations at the surface of the whole BYECS area for simulations without wave modeling and with wave modeling. In the first case, GM = 1.54 and GSD = 2.96, which indicates that calculations without taking into account the effects of erosion by wind waves underestimate the concentration in comparison with GOCI observations. In the second case, GM = 1.05 and GSD = 3.15 confirm the importance of wave-induced erosion and transport of suspended sediments in shallow BYECS areas.

3.3. Results of Calculations for the Scenarios of Potential Release of 137Cs from Four NPP Locations

In this section, the results of the simulation of hypothetical radioactive releases from four NPPs placed in BYECS (Sanmen, Hanbit, Hongyanhe, and Kuosheng NPPs) are given to analyze how the difference in the marine environment, in particular, SSC distribution and erosion/sedimentation processes, can affect the fate of the released reactive radionuclide under the same release scenario. These hypothetic scenarios can be compared with the real release of activity in the Pacific Ocean shelf due to the Fukushima Daiichi accident [11] that took place at the same time, and the released activity of 137Cs was also similar.
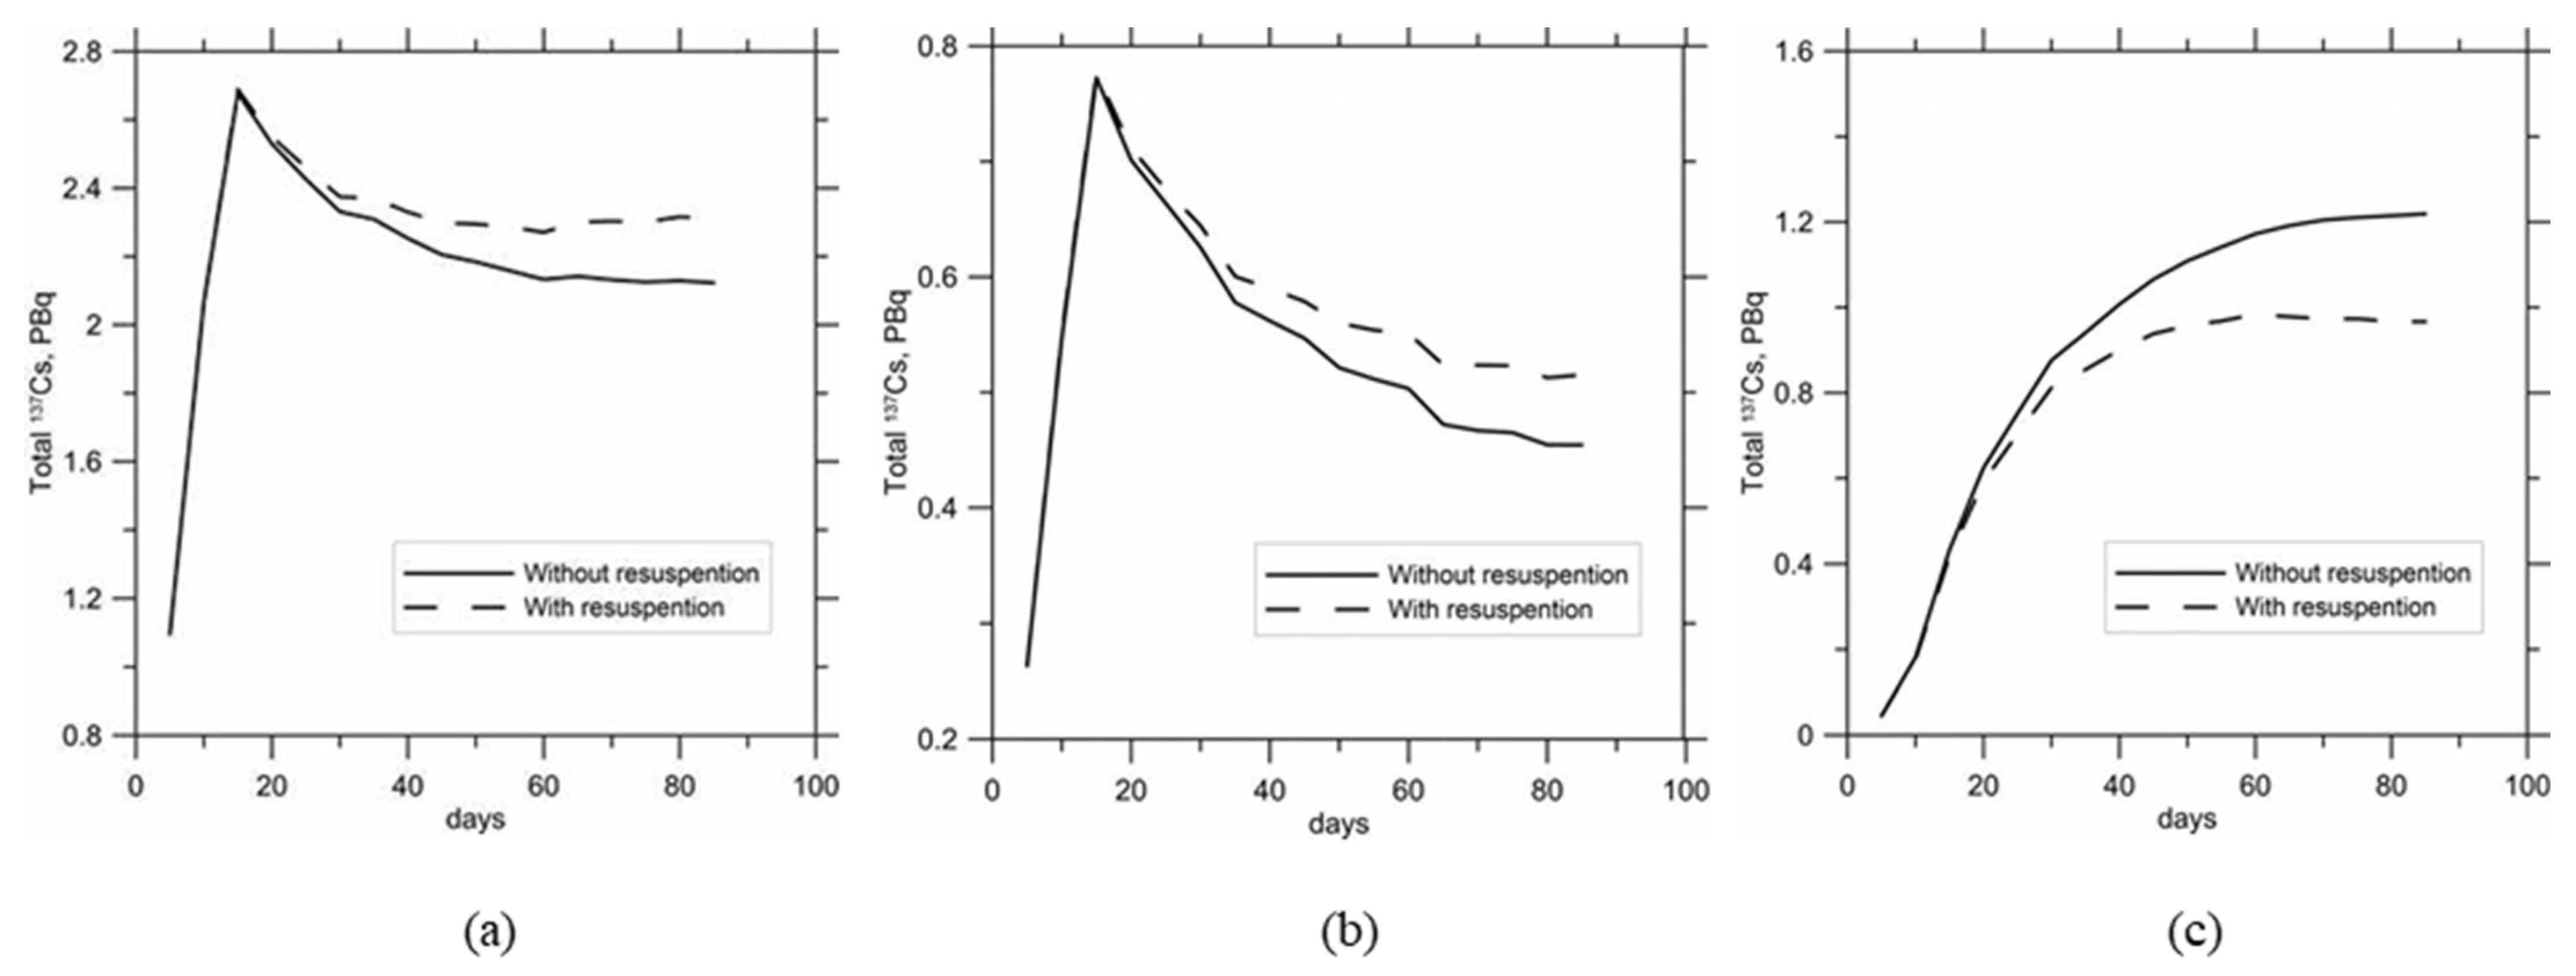
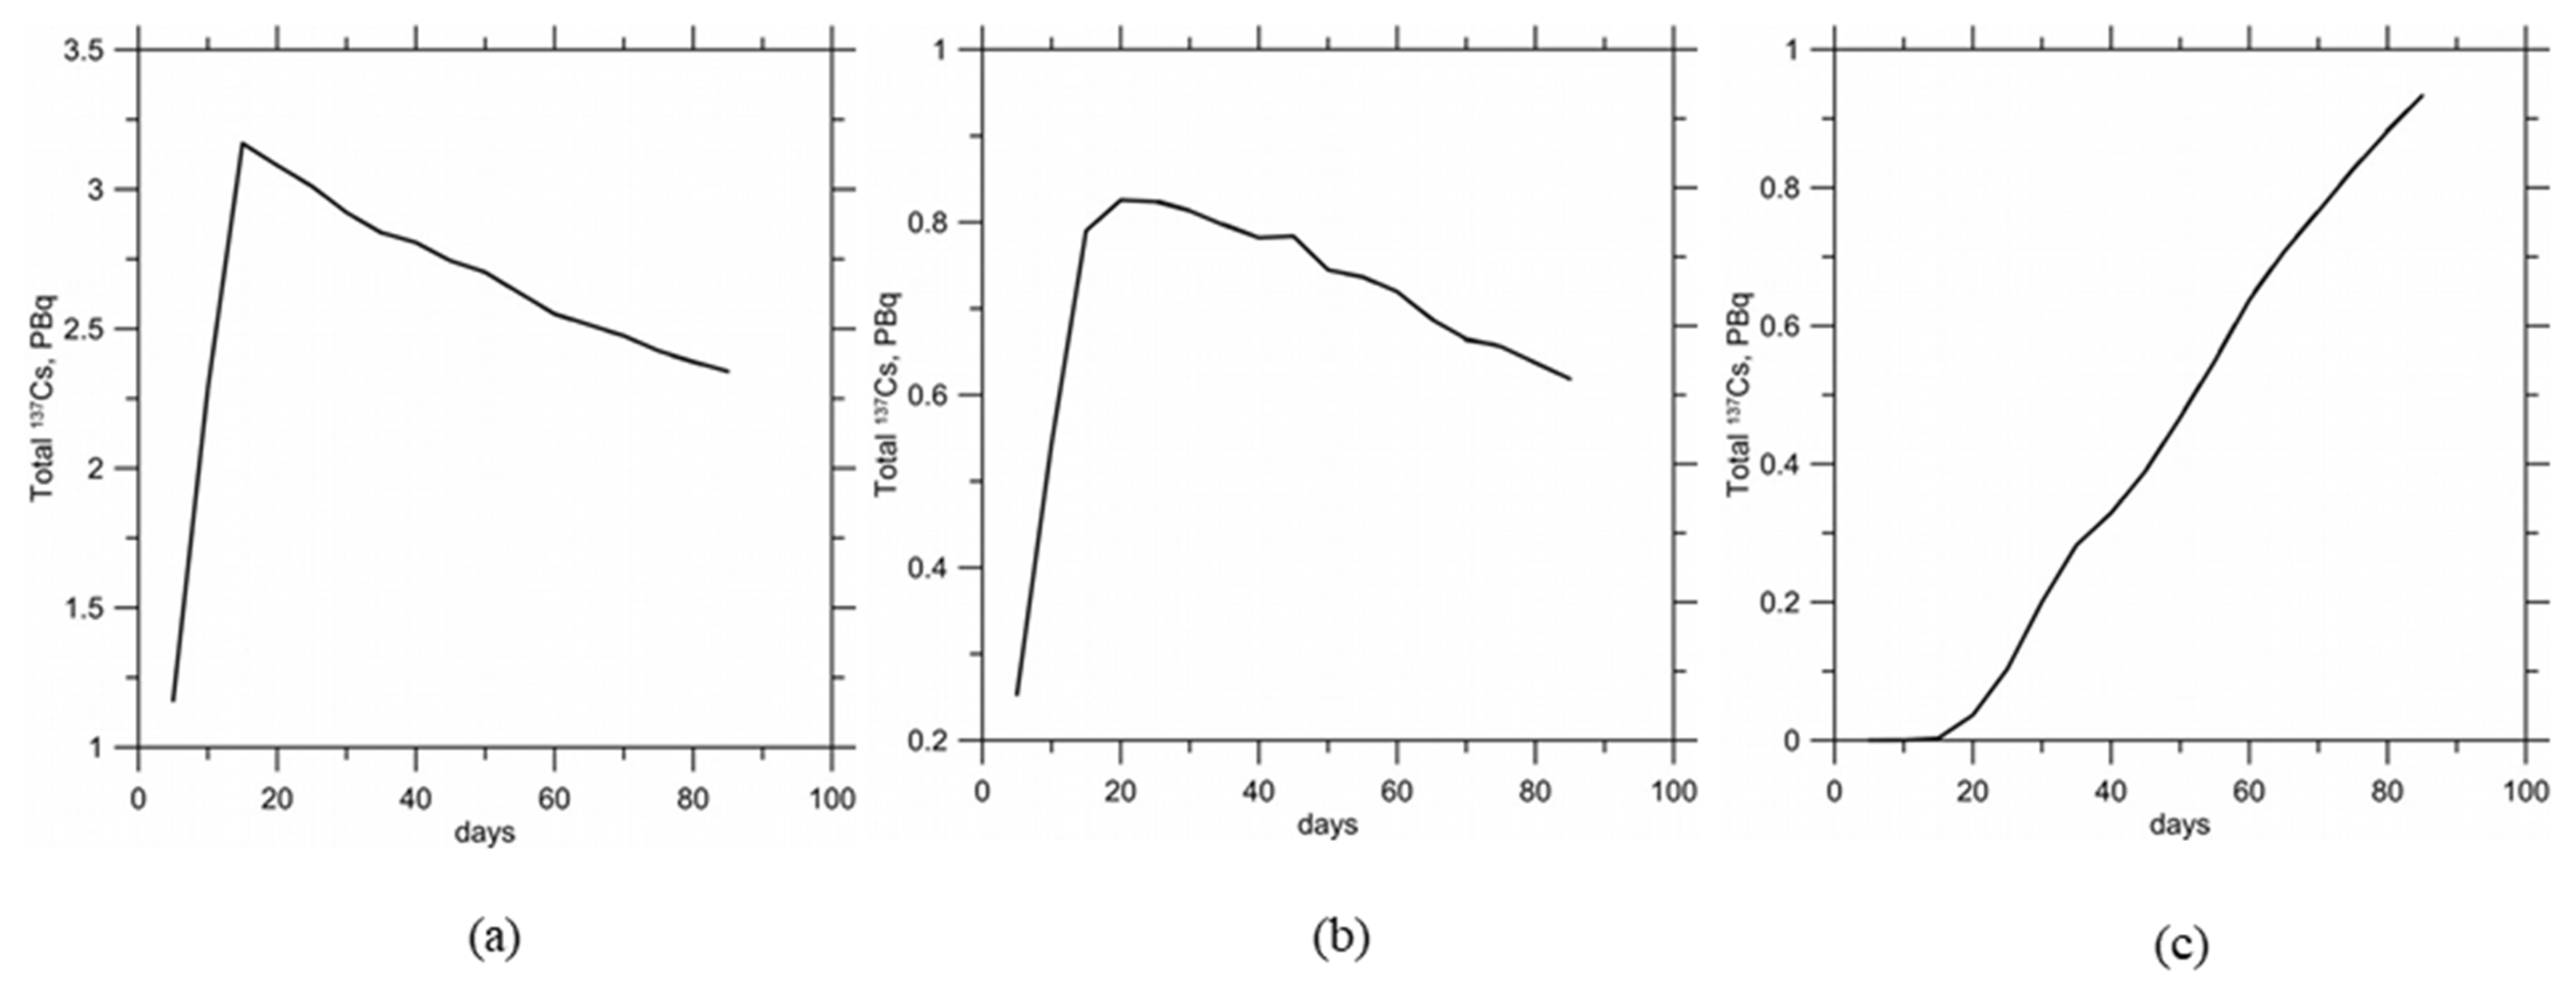
The surface distributions of 137Cs concentration after 10 days, 20 days, and 80 days after beginning of release from Sanmen NPP are shown in Figure 11. As seen in the figure, the plume of contaminated water changes path with time from southeast to northeast, being entrained by the coastal current. The total amount of dissolved 137Cs in Figure 12a initially decreased and then stabilized or slightly grew when resuspension was taken into account. The total amount of 137Cs adsorbed on suspended sediments after release decreased both with and without resuspension (Figure 12b). The total amount of bottom contamination of 137Cs first increased, then stabilized or slightly decreased when resuspension was taken into account (Figure 12c). This case study shows the importance of exchange between dissolved, suspended, and bottom components of 137Cs contamination. The total amount of bottom contamination of 137Cs was about 40% of the dissolved component and the total amount of suspended component was about 20% of the dissolved component, which contrasted with the Fukushima Daiichi accident where the particulate component was only 2% [11]. The resuspension effect changed the amount of 137Cs by about 10%.
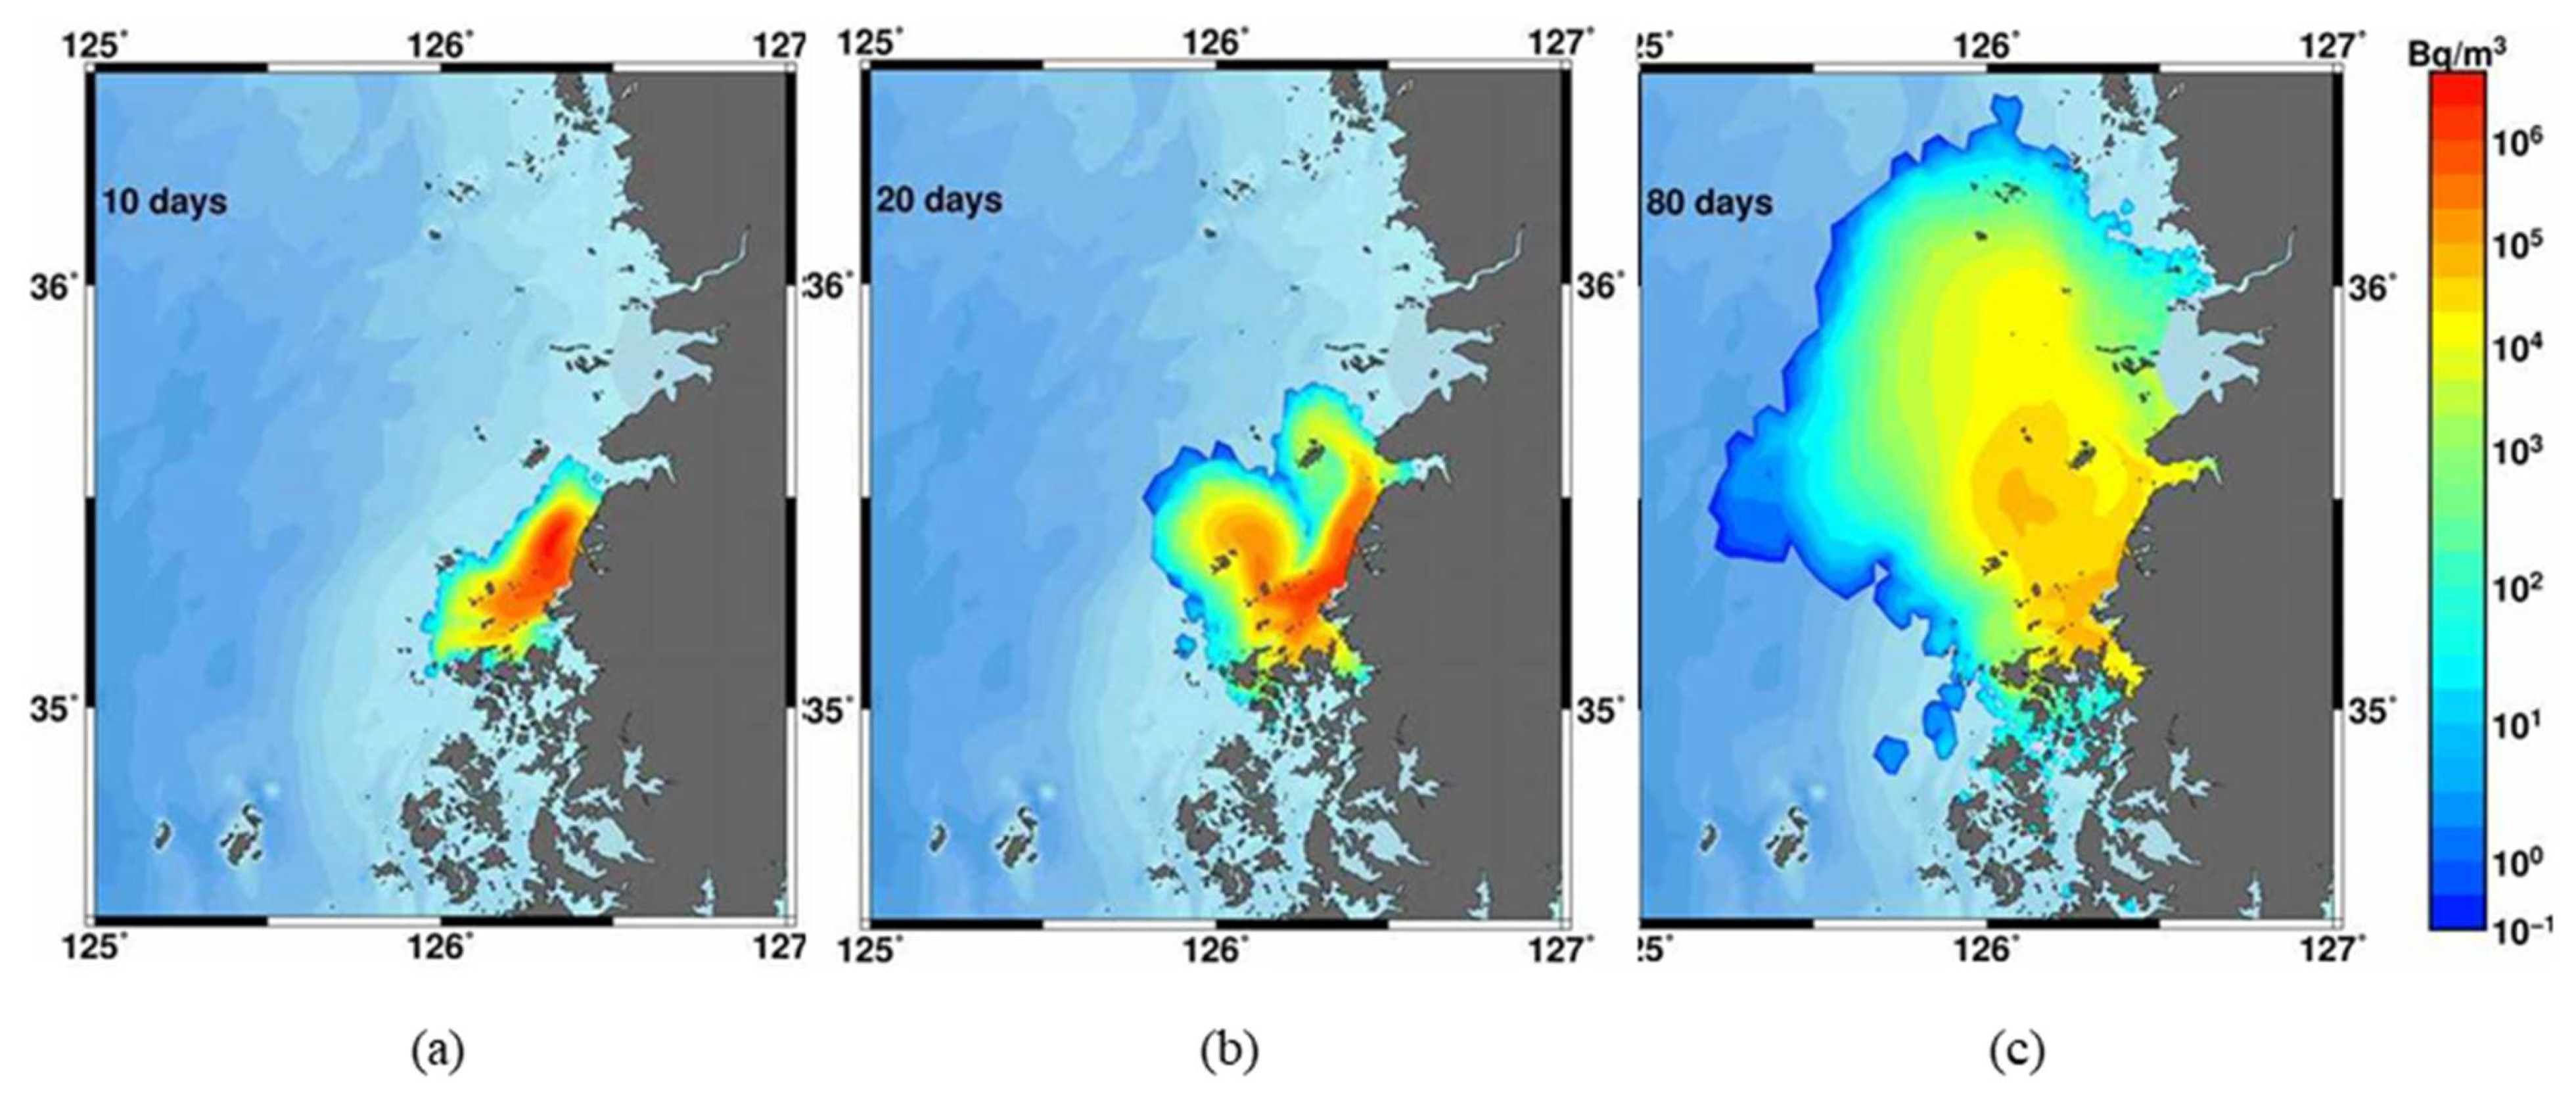
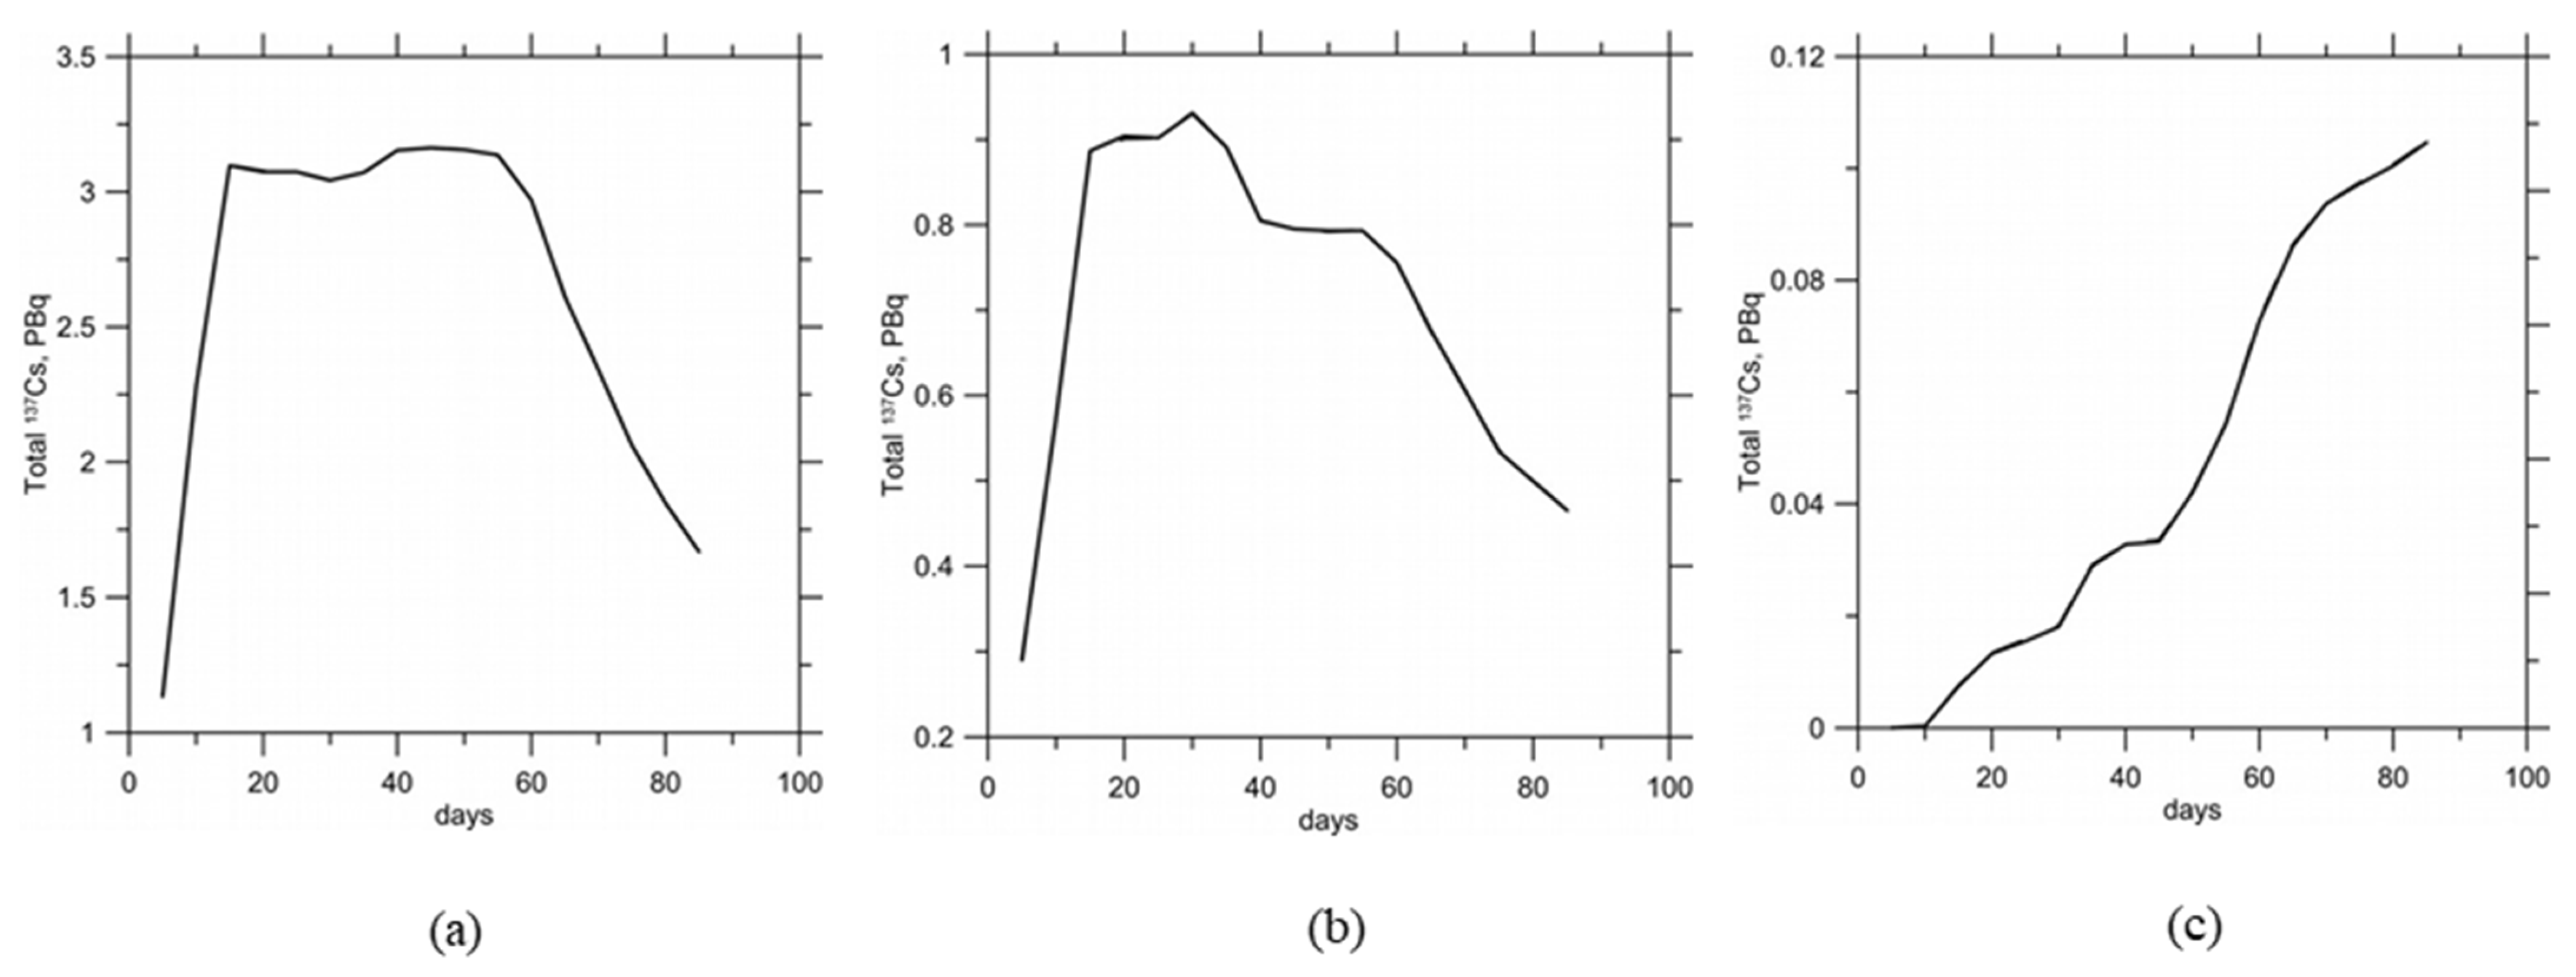
The Hanbit NPP is located on the west coast of the Korean Peninsula in an area with strong tidal currents. As seen in Figure 13, the plume of contaminated water also changed with time, a path being entrained by the eddying coastal current and dispersed by strong tidal currents. The total amount of dissolved 137Cs in Figure 14a after release initially decreased and then increased due to the secondary contamination due to the exchange between the water column and bottom.
The total amount of 137Cs adsorbed on suspended sediments and bottom contamination reaches a maximum and then decreases, both with and without resuspension (Figure 14b,c). The resuspension plays a minor role compared with the Sanmen location. Similarly to the Sanmen case, the total amount of bottom contamination of 137Cs was about 40% of the dissolved component and the total amount of suspended component was about 20% of the dissolved component. This case study confirms the importance of exchange between dissolved, suspended, and bottom components of 137Cs contamination.
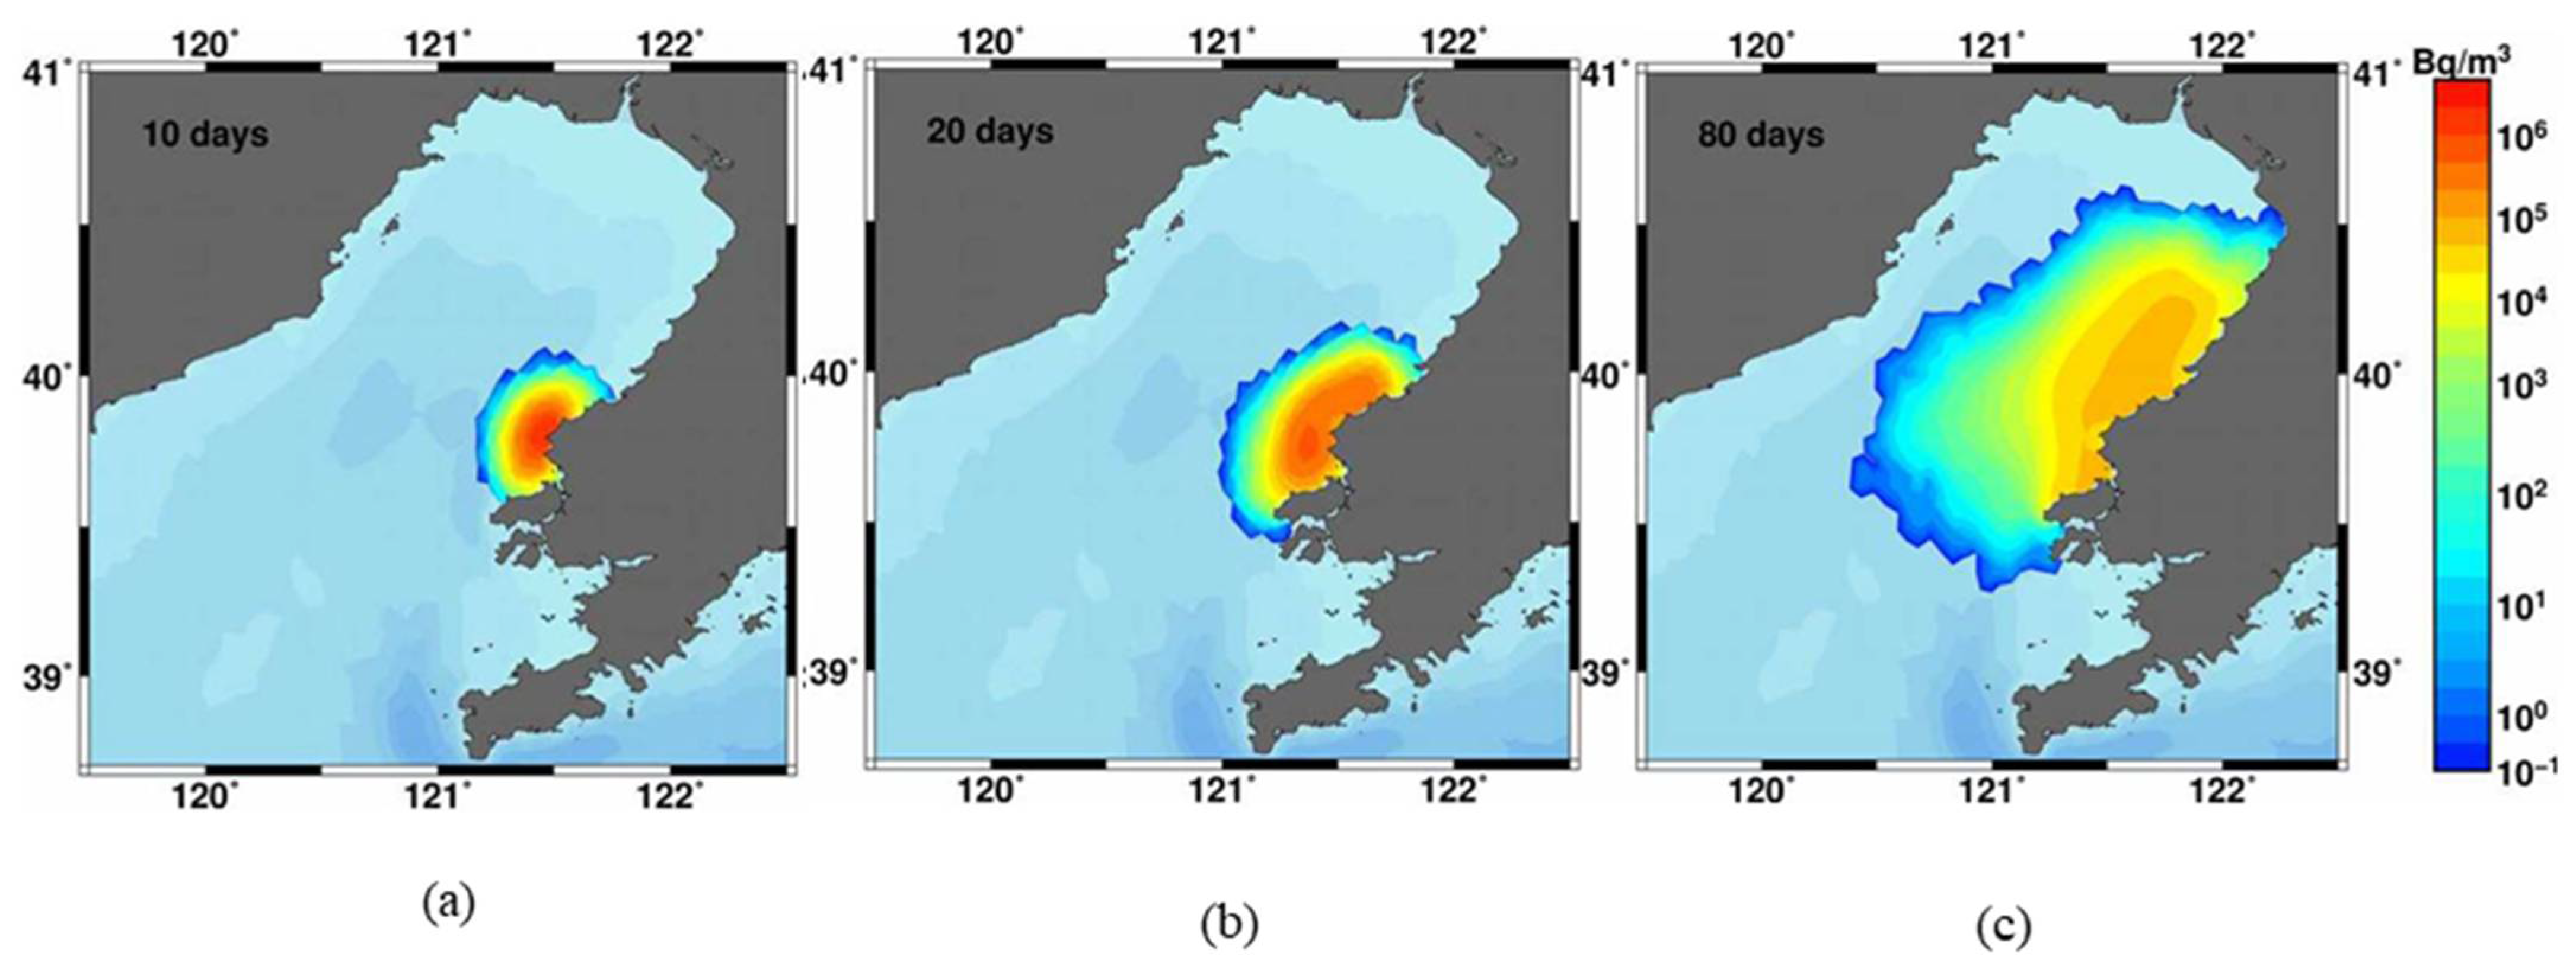
Figure 15 shows the surface distribution of 137Cs concentration at various times after the start of the release from the Hongyahne NPP. This nuclear power plant is placed at the Bohai Sea shore of the Liaodong Peninsula. The plume behavior essentially differs from the Sanmen and Hanbit cases due to relatively weak circulation and tidal mixing. This is confirmed by a comparison of the total amounts of the corresponding component of the 137Cs budget in Figure 16. The activity from water and suspended sediments sinks permanently to the bottom.
The Kuosheng NPP is located in the north of Taiwan island. As seen in Figure 17, released contaminated water quickly enters the Kuroshio current and then is quickly transported and diluted by Kuroshio, flowing over the shelf edge and deep Okinawa trench. Therefore, as shown in Figure 18, the first 50 days’ total amount of dissolved and suspended components changed little, whereas flux from the water column to the bottom is permanent and one way.

4. Discussion

This paper presents the simulation results of suspended sediment and radioactivity transports in the Bohai, Yellow, and East China seas following the hypothetical release of 137Cs from the four nuclear power plants located at the surrounding coasts. The shallowness and the high concentration of suspended sediments in the Bohai and Yellow seas significantly complicate the modeling of the reactive radionuclides. Therefore, in the study, simulations were carried out using a multi-fraction sediment transport model embedded in the finite-element coupled wave–circulation model SELFE. The sediment model describes erosion and deposition processes for the mixture of cohesive/non-cohesive sediments. For the cohesive fraction, settling velocity is corrected for flocculation. This chain of the model is linked with the model of radionuclide transport [13], which describes the key radionuclide transfer processes in the system of water–multi-fraction sediments. In contrast to the Eulerian models used for hydrodynamics and sediment transport processes, we used here the Lagrangian technique to simulate the transport of radionuclides, the adsorption–desorption of particulate radionuclide, decay, deposition, and resuspension from the bottom. The model was chosen for modeling accidental releases because the contaminated area occupies a small part of the computational area at the initial stage, which speeds up the computations. In addition, there is no computational diffusion in Lagrangian models, which makes it possible to accurately describe contamination areas with high concentration gradients.
The simulation results for total suspended concentration (SSC) were compared with in situ measurements and GOCI data. The calculated distribution is similar in all considered cases: maximums along the western coasts of the BYECS caused by the inflow of fine-grained sediments and erosion in the shallow waters by wind currents and tides. Another maximum near the Korean coast is also related to strong tidal currents. It was shown the importance of wave-induced erosion and transport of suspended sediments in shallow BYECS areas.
The results of the simulation of hypothetical releases of 137Cs from four NPPs placed in BYECS essentially differ from the real release of activity in the Pacific Ocean shelf due to the Fukushima Daiichi accident that took place at the same time, whereas released activity was similar. They demonstrated the importance of erosion processes in the budget of 137Cs in shallow areas around the Sanmen and Hanbit NPPs, where strong wind and tidal currents took place. The total amount of bottom contamination of 137Cs in releases from the Sanmen, Hanbit, and Hongyanhe NPPs was about 40% of dissolved component and the total amount of suspended component was about 20% of dissolved component, contrasting with the Fukushima Daiichi accident, where the particulate component was only 2%. These results demonstrate the importance of the suspended sediment pathway in the transport of the reactive radionuclides in the shallow tidal seas.

Author Contributions

Conceptualization, I.B., V.M. and K.T.J.; methodology, I.B. and V.M.; software, I.B. and R.B.; validation, V.M., K.O.K., J.E.M. and J.H.R.; data curation, J.E.M. and J.H.R.; writing—original draft preparation, I.B., V.M. and J.E.M.; writing—review and editing, R.B., K.O.K. All authors have read and agreed to the published version of the manuscript.

Funding

This research was funded by National Research Foundation of Ukraine (Ukraine), grant number 2020.02/0048, and Korea Institute of Ocean Science and Technology (Korea) major project PEA0012.

Data Availability Statement

The measurement and simulation data can be obtained from authors upon the reasonable request.

Acknowledgments

Our article is dedicated to the memory of B. H. Choi, whose works have made a great contribution to the studies of the seas of the northwestern shelf of Asia.

Conflicts of Interest

The authors declare no conflict of interest.

References

  1. Doxaran, D.; Lamquin, N.; Park, J.E.; Mazeran, C.; Ryu, J.H.; Wang, M.; Poteau, A. Retrieval of the seawater reflectance for suspended solids monitoring in the East China Sea using MODIS, MERIS and GOCI satellite data. Remote Sens. Environ. 2014, 146, 36–48. [Google Scholar] [CrossRef]
  2. Choi, J.K.; Park, Y.J.; Ahn, J.H.; Lim, H.S.; Eom, J.; Ryu, J.H. GOCI, the world’s first geostationary ocean color observation satellite, for the monitoring of temporal variability in coastal water turbidity. J. Geophys. Res. 2012, 117, C09004. [Google Scholar] [CrossRef]
  3. Min, J.E.; Choi, J.K.; Yang, H.; Lee, S.; Ryu, J.H. Monitoring changes in suspended sediment concentration on the southwestern coast of Korea. J. Coast. Res. 2014, 70, 133–138. [Google Scholar] [CrossRef]
  4. Min, J.E.; Ryu, J.H.; Park, Y.J. An analysis of the relationship between inherent optical properties and ocean color algorithms around the Korean waters. Korean J. Remote Sens. 2015, 31, 473–490. [Google Scholar] [CrossRef] [Green Version]
  5. Blumberg, A.F. A Primer for ECOMSED; Version 1.3; HydroQual Inc.: Mahwah, NJ, USA, 2002; p. 194. [Google Scholar]
  6. Choi, B.H.; Mun, J.Y.; Seok, K.J. Wintertime suspended sediment simulation in the Huanghai and East China Seas. Acta Oceanol. Sin. 2005, 24, 46–59. [Google Scholar]
  7. Lu, J.; Qiao, F.L.; Wang, X.H.; Wang, Y.G.; Teng, Y.; Xia, C.S. A numerical study of transport dynamics and seasonal variability of the Yellow River sediment in the Bohai and Yellow seas. Estuar. Coast. Shelf. Sci. 2011, 95, 39–51. [Google Scholar] [CrossRef]
  8. Bian, C.; Jiang, W.; Greatbatch, R.J. An exploratory model study of sediment transport sources and deposits in the Bohai Sea, Yellow Sea, and East China Sea. J. Geophys. Res. Oceans 2013, 118, 5908–5923. [Google Scholar] [CrossRef] [Green Version]
  9. Warner, J.C.; Sherwood, C.R.; Signell, R.P.; Harris, C.K.; Arango, H.G. Development of a three-dimensional, regional, coupled wave, current, and sediment-transport model. Comput. Geosci. 2008, 34, 1284–1306. [Google Scholar] [CrossRef]
  10. Qiao, L.; Zhong, Y.; Wang, N.; Zhao, K.; Huang, L.; Wang, Z. Seasonal transportation and deposition of the suspended sediments in the Bohai Sea and Yellow Sea and the related mechanisms. Ocean Dyn. 2016, 66, 751–766. [Google Scholar] [CrossRef]
  11. Buesseler, K.; Dai, M.; Aoyama, M.; Benitez-Nelson, C.; Charmasson, S.; Higley, K.; Maderich, V.; Masque, P.; Morris, P.J.; Oughton, D.; et al. Fukushima Daiichi-derived radionuclides in the ocean: Transport, fate, and impacts. Annu. Rev. Mar. Sci. 2017, 9, 173–203. [Google Scholar] [CrossRef]
  12. Periáñez, R.; Bezhenar, R.; Brovchenko, I.; Duffa, C.; Iosjpe, M.; Jung, K.T.; Kim, K.O.; Kobayashi, T.; Liptak, L.; Little, A.; et al. Marine radionuclide transport modelling: Recent developments, problems and challenges. Environ. Model. Softw. 2019, 122, 104523. [Google Scholar] [CrossRef]
  13. Maderich, V.; Jung, K.T.; Brovchenko, I.; Kim, K.O. Migration of radioactivity in multi-fraction sediments. Environ. Fluid Mech. 2017, 17, 1207–1231. [Google Scholar] [CrossRef] [Green Version]
  14. Zhang, Y.; Baptista, A.M. SELFE: A semi-implicit Eulerian-Lagrangian finite-element model for cross-scale ocean circulation. Ocean Model. 2008, 21, 71–96. [Google Scholar] [CrossRef]
  15. Roland, A.; Zhang, Y.; Wang, H.V.; Meng, Y.; Teng, Y.; Maderich, V.; Brovchenko, I.; Dutour-Sikiric, M.; Zanke, U. A fully coupled wave-current model on unstructured grids. J. Geophys. Res. Oceans 2012, 117, C00J33. [Google Scholar] [CrossRef] [Green Version]
  16. Zhang, Y.; Ye, F.; Stanev, E.; Grashorn, S. Seamless cross-scale modelling with SCHISM. Ocean Model. 2016, 102, 64–81. [Google Scholar] [CrossRef] [Green Version]
  17. Maderich, V.; Heling, R.; Bezhenar, R.; Brovchenko, I.; Jenner, H.; Koshebutskyy, A.; Kuschan, A.; Terletska, K. Development and application of 3D numerical model THREETOX to the prediction of cooling water transport and mixing in the inland and coastal waters. Hydrol. Processes 2008, 22, 1000–1013. [Google Scholar] [CrossRef]
  18. Pinto, L.; Fortunato, A.B.; Zhang, Y.; Oliveira, A.; Sancho, F.E.P. Development and validation of a three-dimensional morphodynamic modelling system for non-cohesive sediments. Ocean Model. 2012, 57–58, 1–14. [Google Scholar] [CrossRef]
  19. Umlauf, L.; Burchard, H. A generic length-scale equation for geophysical turbulence models. J. Mar. Res. 2003, 61, 235–265. [Google Scholar] [CrossRef]
  20. Kantha, L.H.; Clayson, C.A. An improved mixed layer model for geophysical applications. J. Geoph. Res. 1994, 99, 235–266. [Google Scholar] [CrossRef]
  21. Van Ledden, M. Sand-Mud Segregation in Estuaries and Tidal Basins. Ph.D. Thesis, Delft University of Technology, Delft, The Netherlands, 2003. [Google Scholar]
  22. Van Rijn, L.C. Sediment transport. Part II: Suspended load transport. J. Hydraul. Eng. 1984, 110, 1613–1641. [Google Scholar] [CrossRef]
  23. Van Rijn, L.C. Sediment transport. Part I: Bed load transport. J. Hydraul. Eng. 1984, 110, 1431–1456. [Google Scholar] [CrossRef] [Green Version]
  24. Ariathurai, C.R.; Arulanandan, K. Erosion rates of cohesive soils. J. Hydraul. Div. 1978, 104, 279–282. [Google Scholar] [CrossRef]
  25. Winterwerp, J.C.; van Kesteren, W.G. Introduction to the Physics of Cohesive Sediment in the Marine Environment; Developments in Sedimentology Series; Elsevier: Amsterdam, The Netherlands, 2004; Volume 56. [Google Scholar]
  26. Periáñez, R.; Brovchenko, I.; Jung, K.T.; Kim, K.O.; Maderich, V. The marine kd and water/sediment interaction problem. J. Environ. Radioact. 2018, 129, 635–647. [Google Scholar] [CrossRef] [PubMed]
  27. Boudreau, B.P. Diagenetic Models and Their Implementation; Springer: Berlin/Heidelberg, Germany; New York, NY, USA, 1997; pp. 178–188. [Google Scholar]
  28. Maderich, V.; Maderich, V.; Kim, K.O.; Brovchenko, I.; Kivva, S.; Kim, H. Scavenging processes in multicomponent medium with first-order reaction kinetics: Lagrangian and Eulerian modeling. Environ. Fluid Mech. 2021, 21, 817–842. [Google Scholar] [CrossRef]
  29. Periáñez, R.; Bezhenar, R.; Brovchenko, I.; Jung, K.T.; Kim, K.O.; Kamidaira, Y.; Kobayashi, T.; Liptak, L.; Maderich, V.; Min, B.I.; et al. Fukushima 137Cs releases dispersion modelling over the Pacific Ocean. Comparisons of models with water, sediment and biota data. J. Environ. Radioact. 2019, 198, 50–63. [Google Scholar] [CrossRef] [PubMed]
  30. Choi, B.H. The sand transport in the Yellow Sea. In Sedimentation in the Yellow Sea Coasts; Choi, B.H., Ed.; Korean Society of Coastal and Ocean Engineers: Seoul, Korea, 2003; pp. 39–52. [Google Scholar]
  31. Choi, B.H.; Kim, K.O.; Eum, H.M. Digital bathymetric and topographic data for neighboring seas of Korea. J. Korean Soc. Coast. Ocean Eng. 2002, 14, 41–50, (In Korean with English Abstract). [Google Scholar]
  32. GEBCO (General Bathymetric Chart of the Oceans). Available online: https://www.gebco.net/data_and_products/gridded_bathymetry_data/ (accessed on 21 December 2021).
  33. ERA-Interim. Available online: https://www.ecmwf.int/en/forecasts/datasets/reanalysis-datasets/era-interim (accessed on 21 December 2021).
  34. HYCOM (Hybrid Coordinate Ocean Model). Available online: https://hycom.org/ (accessed on 12 December 2021).
  35. Egbert, G.D.; Erofeeva, S.Y. Efficient inverse modeling of barotropic ocean tides. J. Atmos. Ocean. Technol. 2002, 19, 183–204. [Google Scholar] [CrossRef] [Green Version]
  36. Vorosmarty, C.J.; Fekete, B.M.; Tucker, B.A. Global River Discharge, 1807–1991, Version. 1.1 (RivDIS); ORNL DAAC: Oak Ridge, TN, USA, 1998. [CrossRef]
  37. KHOA (Korea Hydrographic and Oceanographic Agency). Available online: http://www.khoa.go.kr (accessed on 12 December 2021).
Figure 1. Derived-from-GOCI concentration of SSC vs. in-situ measurements [4]. The dashed lines correspond to a ratio of 2 and 1/2 of derived to measured values.
Jmse 10 00596 g001
Figure 2. Data flow in the modeling system.
Jmse 10 00596 g002
Figure 3. (a) Modeling domain with locations of tidal stations (blue circles), wave buoys (black diamonds), and NPPs (red squares). (b) Mesh for hydrodynamic simulations.
Jmse 10 00596 g003
Figure 4. (a) Distribution of sediment median size φ 50 ; (b) distribution of mud fraction.
Jmse 10 00596 g004
Figure 5. (a) Standard deviation σ ϕ ; (b) clay fraction; (c) fine silt fraction; (d) coarse silt fraction; (e) fine sand fraction; (f) coarse sand fraction.
Jmse 10 00596 g005
Figure 6. The comparison of the time series of observed tide elevations (red lines) in May 2011 with model-computed elevations (black line) in four locations (Seogwipo, Anheung, Kanmen, Dalian), which are shown in Figure 3.
Jmse 10 00596 g006
Figure 7. (a) The comparison of the time series of observed significant wave heights H s in 2011 with computed values in two locations of KHOA buoys [37] as shown in Figure 3; (b) measured vs. calculated H s for two locations of KHOA buoys in 2011.
Jmse 10 00596 g007
Figure 8. Comparison of calculations of SSC concentration at the surface with in-situ measurements [4].
Jmse 10 00596 g008
Figure 9. Surface distribution of SSC from (a) GOCI remote sensing data; (b) simulation without waves; (c) simulation with waves for 21 March 2013.
Jmse 10 00596 g009
Figure 10. Surface distribution of SSC from (a) GOCI remote sensing data; (b) simulation without waves; (c) simulation with waves for 4 October 2013.
Jmse 10 00596 g010
Figure 11. The surface concentration of 137Cs after 10 days (a), 20 days (b), and 80 days (c) release from the Sanmen NPP.
Jmse 10 00596 g011
Figure 12. (a) Total amount of dissolved 137Cs after release from the Sanmen NPP; (b) total amount of 137Cs adsorbed on suspended sediments after release from the Sanmen NPP; (c) total amount of bottom contamination of 137Cs after beginning of release from the Sanmen NPP.
Jmse 10 00596 g012
Figure 13. The surface concentration of 137Cs after 10 days (a), 20 days (b), and 80 days (c) release from the Hanbit NPP.
Jmse 10 00596 g013
Figure 14. (a) Total amount of dissolved 137Cs after release from the Hanbit NPP; (b) total amount of 137Cs adsorbed on suspended sediments after release from the Hanbit NPP; (c) total amount of bottom contamination of 137Cs after release from the Hanbit NPP.
Jmse 10 00596 g014
Figure 15. Surface concentration of 137Cs after 10 days (a), 20 days (b), and 80 days (c) release from the Hongyanhe NPP.
Jmse 10 00596 g015
Figure 16. (a) Total amount of dissolved 137Cs after release from the Hongyanhe NPP; (b) total amount of 137Cs adsorbed on suspended sediments after release from the Hongyanhe NPP; (c) total amount of bottom contamination of 137Cs after release from the Hongyanhe NPP.
Jmse 10 00596 g016
Figure 17. Surface concentration of 137Cs after 10 days (a), 20 days (b), and 80 days (c) after beginning of release from the Kuosheng NPP.
Jmse 10 00596 g017
Figure 18. (a) Total amount of dissolved 137Cs after release from the Kuosheng NPP; (b) total amount of 137Cs adsorbed on suspended sediments after release from the Kuosheng NPP; (c) total amount of bottom contamination of 137Cs after release from the Kuosheng NPP.
Jmse 10 00596 g018
Table 1. Parameters of the sediment fractions.
Size Classidi (mm) ρ s , i   ( kg   m 3 )
Clay 00.0032300
Fine silt 10.012650
Coarse silt 20.0312650
Fine sand 30.1252650
Coarse sand 40.52650
Publisher’s Note: MDPI stays neutral with regard to jurisdictional claims in published maps and institutional affiliations.