Article

Dissolved Gaseous Mercury (DGM) in the Gulf of Trieste, Northern Adriatic Sea

1
Department of Environmental Sciences, Institut Jožef Stefan, Jamova Cesta 39, SI-1000 Ljubljana, Slovenia
2
Faculty of Civil and Geodetic Engineering, University of Ljubljana, Jamova Cesta 2, SI-1000 Ljubljana, Slovenia
3
Slovenian Environment Agency, Vojkova 1b, SI-1000 Ljubljana, Slovenia
4
National Institute of Biology, Marine Biological Station Piran, Fornače 41, SI-6330 Piran, Slovenia
*
Author to whom correspondence should be addressed.
J. Mar. Sci. Eng. 2022, 10(5), 587; https://doi.org/10.3390/jmse10050587
Submission received: 24 February 2022 / Revised: 15 April 2022 / Accepted: 18 April 2022 / Published: 26 April 2022
(This article belongs to the Special Issue Water Pollution under Climate Change in Coastal Areas)

Abstract

:
Continuous dissolved gaseous mercury (DGM) measurements were performed during the summer months (May to September 2019) in the Gulf of Trieste (northern Adriatic Sea), a well-studied contaminated site due to releases of mercury from the former mercury mine Idrija in Slovenia. Continuous DGM data were regularly checked by the discrete manual method to assure traceability and comparability of the results and used for the calculation of the upward flux of Hg(0) between the water and the air compartment, using the gas exchange model applied in previous studies in the Mediterranean Sea. DGM concentrations measured by continuous and discrete methods showed good agreement, 68.7 and 73.5 ng·m−3, respectively. The diurnal DGM variability examined by sorting the DGM concentrations in 24 1-h intervals was extremely low (68.3–69.2 ng·m−3). Various environmental parameters measured at oceanographic buoy Vida, and the nearby stations were used to determine the relationship between DGM and the individual environmental parameters. The correlation with the oxygen saturation was pronounced during the July high DGM event (R2 = 0.70, p < 0.05), and the gradient between the bottom and surface temperature was correlated with both DGM peaks in June and July (R2 = 0.42 and R2 = 0.43, p < 0.05). Transport from the more polluted northern part of the Gulf was determined as the most probable source of both high DGM events. The computed average annual Hg(0) flux across the water–air interface (5.13 ng·m−2·h−1) was lower than those reported in recent studies. We assume that for an appropriate assessment of the Hg evasion flux and of the temporal DGM variability in such heterogeneously polluted coastal areas, both spatial and temporal coverage are required.

1. Introduction

Closed coastal marine water systems are highly sensitive environments to Hg pollution due to limited exchange of the water with oceans, climatic influences, and more intense inland environmental pressure. The main Hg species present in marine waters are elemental Hg (Hg(0)), Hg(II) and organic molecules (methyl Hg (MeHg), and dimethyl Hg (DMeHg)). Dissolved gaseous Hg (DGM) in water is operationally defined as a form of Hg and composed of dissolved gaseous elemental Hg (Hg0) and DMeHg, which is present in a small fraction (<5%) and measurable mostly in deep waters of the Mediterranean and Adriatic Seas [1,2,3,4]. Most mercury enters Mediterranean and Adriatic waters by wet or dry deposition or by river discharge, with a significant fraction in the oxidized form [3,5]. In marine waters, Hg(0) originates from several biotic and abiotic transformations of oxidized Hg(II) [6,7,8,9] and the decomposition of organo-mercury compounds [10,11]. It must be considered that intense geotectonic activity in the Mediterranean may also be an important source of Hg(0) [1,3,4,12,13].
The most northeastern part of the Adriatic Sea, the Gulf of Trieste, is influenced by the natural and anthropogenic load of Hg from the polluted Soča (Isonzo) River, a watershed in which the world’s second largest Hg mine is located (in Idrija). Centuries of drainage of Hg-polluted soils, cinnabar deposits, and mining and smelting wastes have provided the main source of Hg in the Gulf, making the area one of the most significantly Hg-contaminated areas in the entire Mediterranean region [3,4]. Mercury that enters the Gulf via the River Soča mainly occurs in the particulate form [3,14,15,16]. Measurements of different Hg species in the water column, suspended solids, and sediments have shown several times higher concentrations than in the central and southern parts of the Adriatic Sea [3,15,17,18,19,20]. It has been estimated that the Soča River has contributed approximately 2160 tons of Hg to the Gulf of Trieste during the 500 (1490–1995)-year mining history of Idrija [16].
Due to the weak cloud coverage and high temperatures that characterize the Gulf of Trieste in the summer months, it is also subject to stronger solar radiation. This causes stronger photochemical reactions, thus enhancing the Hg fluxes from the water to the atmosphere, either directly or by interaction of solar radiation with marine biota. Both abiotic and biotic processes have been suggested as pathways for the reduction of oxidized Hg(II) to Hg(0) [7,8,21,22,23,24,25,26,27]. Bratkič et al. [28] reported a pronounced reduction potential of Hg(II), mostly of photochemical origin, in the water column of the Gulf of Trieste, with the high values in autumn being related to phytoplankton blooms. The biogeochemical and physical processes characterizing the Hg cycle in the Gulf, including food webs, are strongly influenced by environmental conditions and Hg pollution entering the Gulf by rivers, particularly the Soča/Isonzo [17,29,30]. Mercury methylation and MeHg demethylation, mostly oxidative, actively occur in surface sediments of the gulf, along with reductive demethylation in oxic conditions, producing Hg(0) [31].
The cycling of Hg in coastal marine systems is comparable to that in the open oceans, although the levels of Hg species are enhanced [32,33,34]. Between 10 and 30% (or even up to 50% in the Adriatic Sea) [3,4] of the total Hg in Mediterranean and Adriatic waters can be present as Hg(0). This form is relatively soluble and usually supersaturated with respect to the atmosphere, especially in surface waters, where its evasion represents an important source to the global atmosphere. This Hg species interacts with water and the atmosphere, making it crucial to understand its cycling in different environments.
The evasion of elemental Hg has been recognized as one of the major mercury sinks from the water compartment in the Mediterranean Sea and its parts [35,36]. Numerous experimental [4,22,28,34,37,38] and modelling studies [5,39,40,41,42,43] have been conducted to increase the knowledge on the air–sea exchange of mercury. Based on the results, the Hg(0) concentrations and fluxes are significantly higher in contaminated coastal sites [22,44], highlighting the importance of understanding the mercury cycling in these areas. The Hg(0) evasion can be measured by various types of flux chambers and micrometeorological methods [45,46]; the most recent methods are non-intrusive flux measurements and Hg-isotope fingerprinting [45]. Furthermore, computation of the Hg(0) sea–air fluxes by gas exchange models (GExM) based on differences in elemental Hg concentrations between the air and the sea compartments has been demonstrated in numerous studies. The basic methodology and equations have been described by Gårdfeldt et al. [35] and improved by Andersson et al. [47], suggesting a new approach for the calculation of Henry’s law constant. Furthermore, Andersson et al. [22] and Mastromonaco et al. [38] have compared various wind parameterizations and suggested the use of the Nightingale et al. [48] parameterization in the Mediterranean, whereas Kuss et al. [49,50] have experimentally determined the diffusivity of Hg(0). Since then, GExMs have been a part of various numerical models [5,39,40,41,42,43] and helped to improve the general knowledge on Hg(0) fluxes between environmental compartments and the established mass balances of the Mediterranean Sea [5,51], the Adriatic Sea [3,42], and the Gulf of Trieste [52]. Evasion in the Gulf of Trieste was first estimated by Širca et al. [14]. Ramšak et al. [52] computed evasion by applying two methods, both based on seasonally averaged input parameters, and the GExM proposed by Gårdfeldt et al. [35]. The recent experimental study by Floreani et al. [44] revealed seasonal flux dynamics in several points around the Gulf of Trieste and computed the evasion from fluxes measured in gas chamber experiments. The annual quantities obtained by Ramšak et al. [52] and Floreani et al. [44], roughly 100 kg·yr−1 and 150 kg·yr−1, respectively, are comparable but could be improved by computing the fluxes with refined input data.
In surface coastal waters of the Gulf of Trieste, DGM was measured by the continuous method developed by Anderson et al. [47] in front of the Marine Biological Station in Piran (MBP), Slovenia. Continuous DGM measurements were performed in the summer months (May to September 2019) in 10 min intervals, and the obtained results were regularly checked by the discrete manual method for the measurement of DGM concentrations [4,53,54].
Such a comprehensive time series of measured DGM values at fine temporal resolution was not previously available; it facilitates both visual comparison and statistical analysis of the acquired data. We tested two driving hypotheses: (i) unknown relationships between the DGM and measured environmental parameters can be revealed through data comparison and statistical analysis, and (ii) the evasion computed by using the extremely high temporal DGM resolution obtained in this sampling campaign and the associated relevant wind and surface temperature data can provide better insight into the dynamics of water–air exchange dynamics. In this way, the research can improve our knowledge of the amount of Hg(0) upward flux in the Gulf of Trieste and possibly the unknown correlations between DGM and environmental parameters obtained from buoy Vida and other nearby stations that provided physical environmental data.

2. Methods

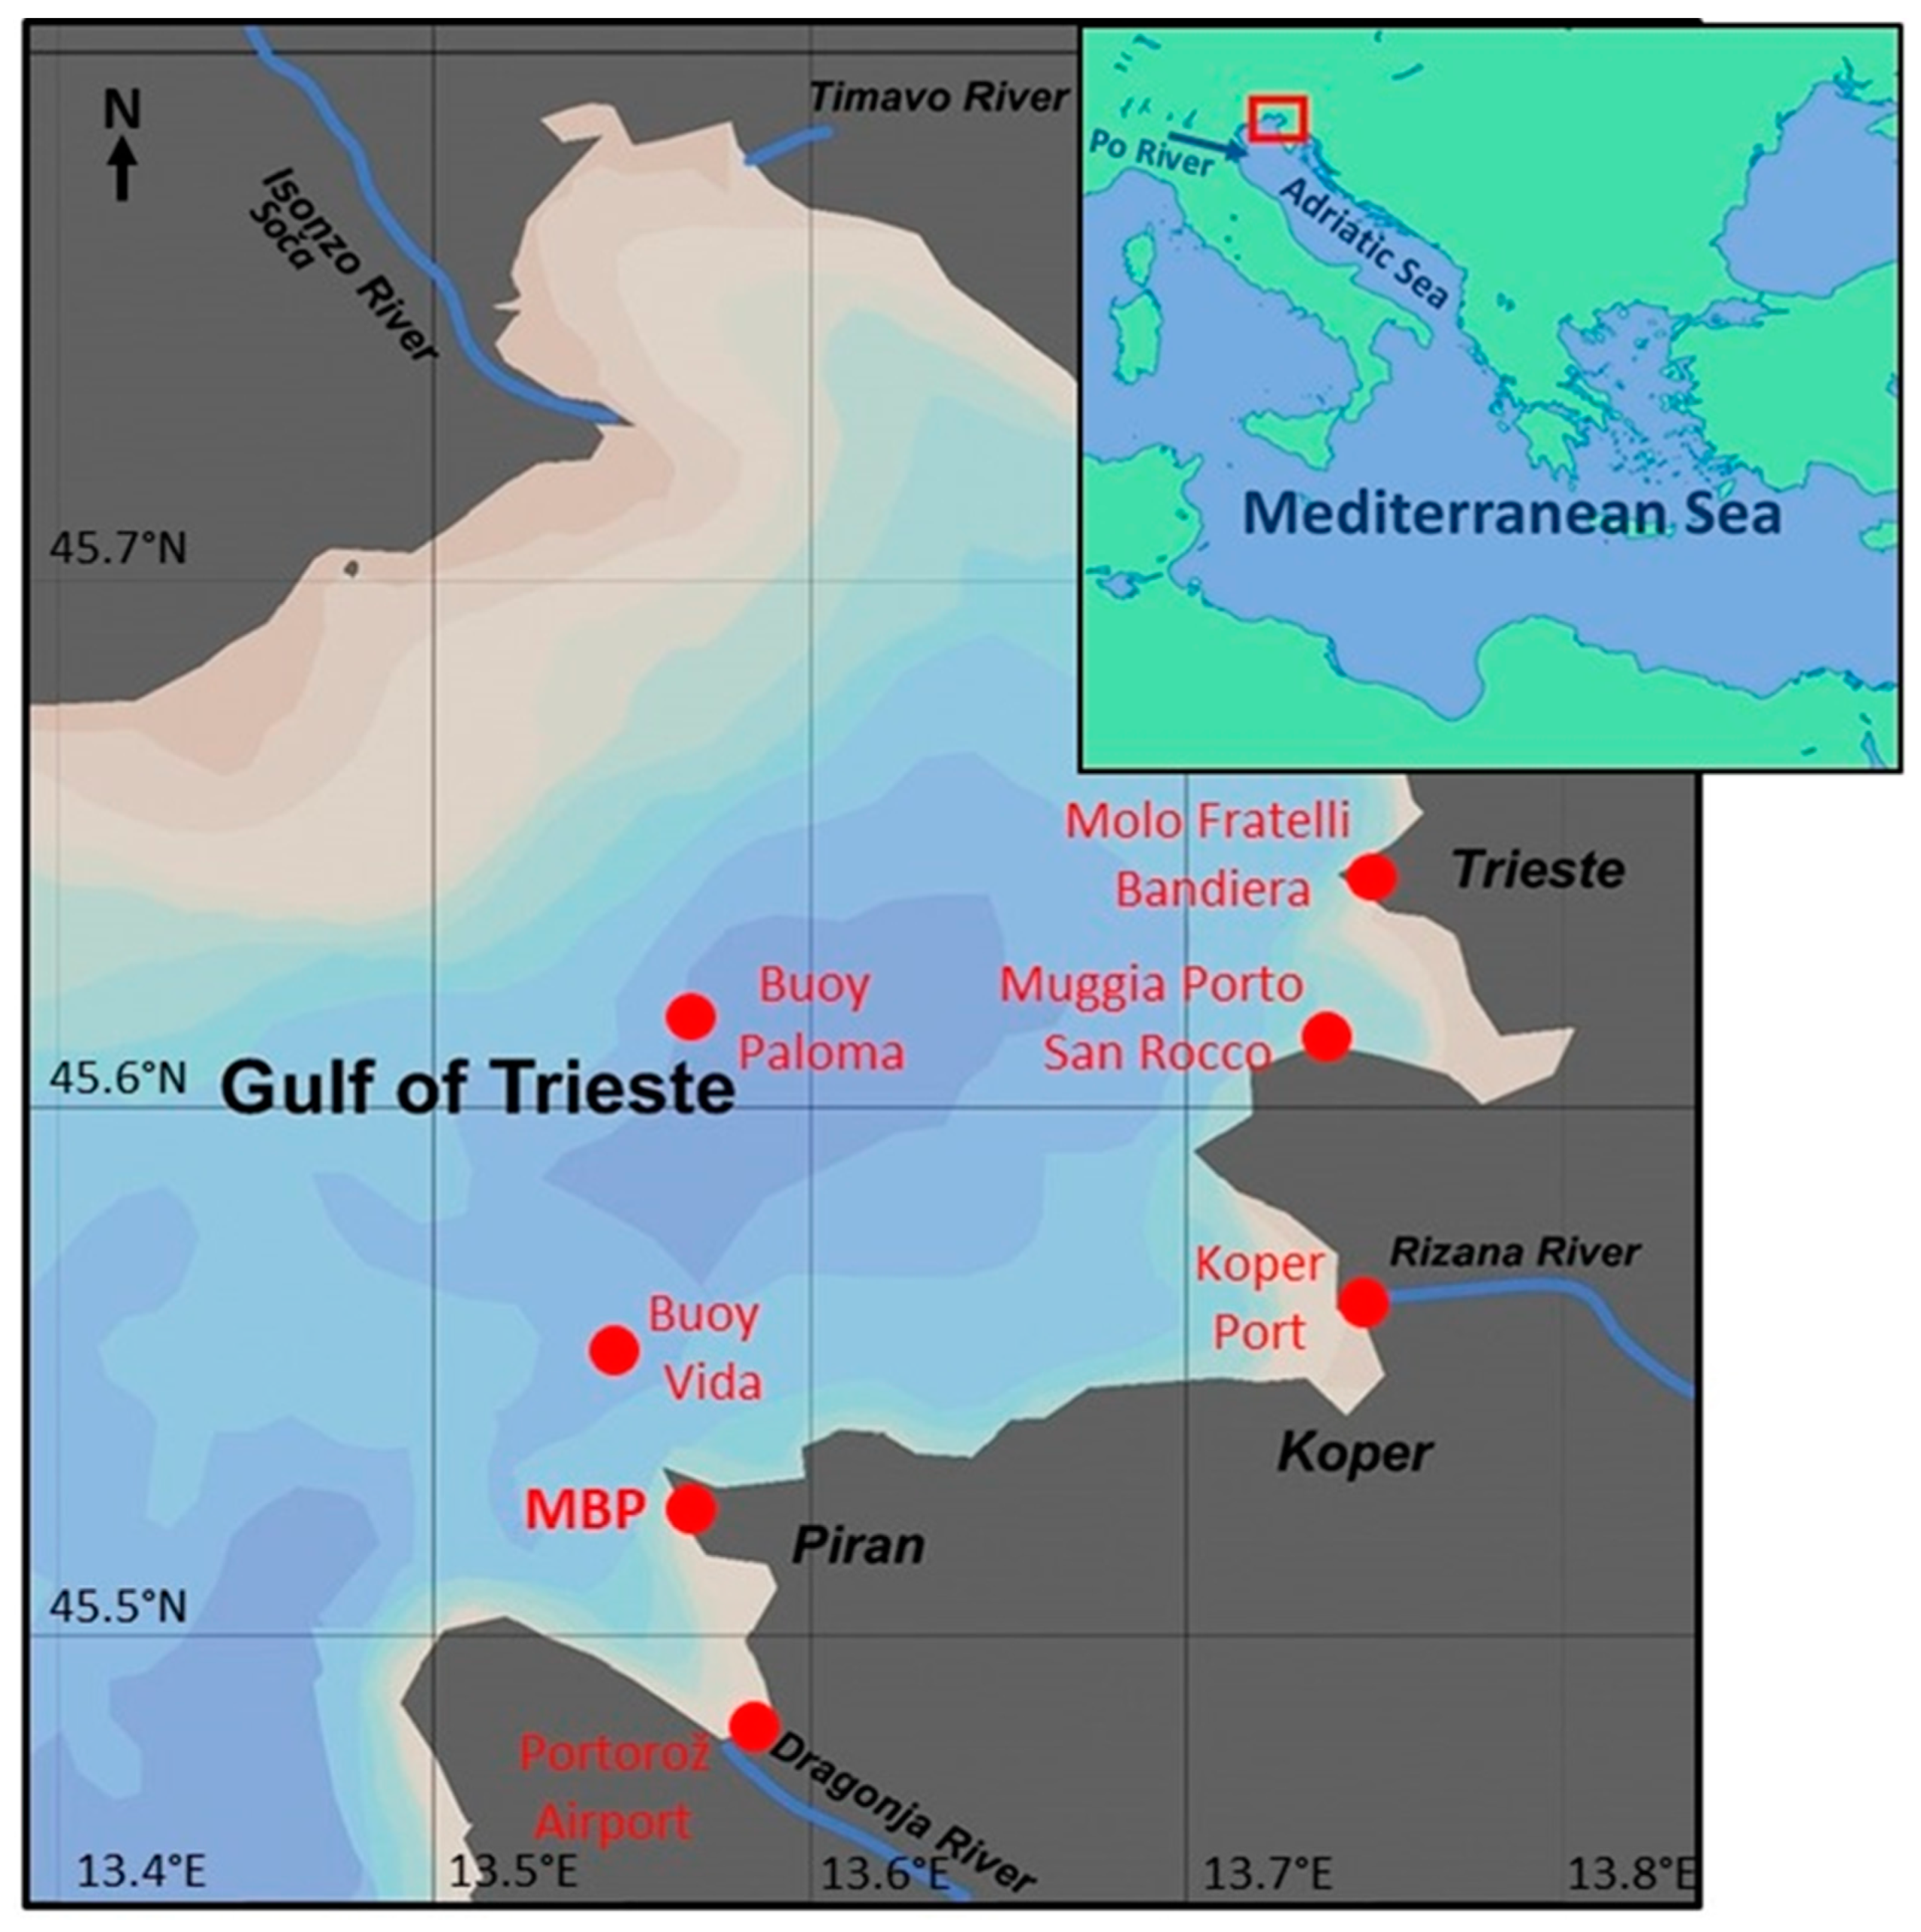
2.1. Site and Sampling Description

The Gulf of Trieste is the most northern part of the Adriatic and Mediterranean Seas. It is a shallow bay with an average depth of about 25 m. The general circulation in the Gulf is oriented counterclockwise, with an average speed of 1.5 km h−1 [55]. The currents can change to clockwise during strong and long-lasting “burja” or bora (E–NE) wind events [56]. The tides in the gulf are among the largest in the Adriatic Sea, but usually do not exceed 60 cm. The average salinity of 37–38 can fall below 35 in late spring and early summer due to enhanced riverine inflows, especially from the Soča/Isonzo River [57]. The Gulf has a Mediterranean climate with warm summers and cool, rainy winters.
Continuous DGM measurements were performed in coastal surface water in front of the Marine Biological Station (MBP; 45.5178° N, 13.5687° E) located in the Bay of Piran in the southern part of the Gulf of Trieste. The sample inlet was positioned about 20 m offshore at the depth of 3 m, 0.3 m above the bottom. Sample water was then pumped into laboratories of the MBP, where the sample outflow was connected to a continuous method inlet. Water temperature at the continuous method inlet was regularly checked.
Water samples for discrete measurements were taken at three locations, buoy Vida, in front of MBP, and from a continuous method inlet tube (Figure 1). At the MBP’s oceanographic buoy Vida (45.5488° N, 13.550525° E), surface water samples were taken manually and filled into 1 L glass bottles. In front of the MBP and from the continuous method inlet tube, samples were taken directly into a bubbler, preventing the rapid mixing of samples. Samples were analyzed immediately after sampling in the MBP laboratories.

2.2. DGM Measurements

To measure dissolved gaseous Hg species in sea water, discrete and continuous methods were used. Both methods have previously been used and tested on several Mediterranean [3,4,47,53] and Arctic [47,58,59] oceanographic cruises. All analytical methods have previously been validated and intercompared [3,4,38,47,54] within several EU research projects and on oceanographic cruises.
The DGM was measured in 10 min intervals between 23 May and 30 September 2019, with only a few gaps (30 h between 28 and 30 May; 20 h between 6 and 7 June; 56 h between 5 and 7 July; 52 h between 10 and 12 August; 56 h between 31 August and 2 September), resulting in over 15,000 measured values, and thus representing a unique high-resolution continuous dataset covering roughly one-third of a year.
As simultaneous total gaseous Hg (TGM) measurements were not performed, we adopted the seasonally averaged concentrations applied by Ramšak et al. [52] and obtained from a previous modelling study [43]. The adopted seasonal concentrations for the spring and the summer were 2.12 and 1.96 ng·m−3, respectively. These values are in good agreement with the recently measured concentrations depicted in Floreani et al. [44], who reported maximum values below 3 ng·m−3, and average values for the sampling sites in the Gulf of Trieste between 1.60 and 2.87 ng·m−3, as well as with the TGM reported in Barago et al. [60], where the average measured concentrations in Piran were 1.88 ± 1.07 ng·m−3.

2.2.1. Discrete DGM Measurements

Samples were analyzed immediately after collection into 0.25 L glass bubblers. The samples were purged for 10 min in Hg-free nitrogen and collected on a gold trap, which was then transferred to a double amalgamation CV AFS analyzer system. Subsequently, the Hg on the sampling gold trap was released by thermal desorption and detected by a CV AFS analyzer (Tekran 2500). The system was calibrated by gas-phase Hg (Hg(0)) kept at a defined temperature (Tekran, model 2505 mercury vapor calibration unit). The detection limit of the method was 5 ng·m−3, based on three standard deviations of the blank, and the repeatability was 4%. The method is described in detail in Horvat et al. [1,35] and Gardfeldt et al. [40]. It should be noted that the DGM concentrations reported correspond to all volatile Hg species present in sea water—elemental Hg (Hg(0)) and dimethyl Hg (DMeHg), but as confirmed in previous studies [3,4], dimethyl Hg is not present in surface waters of the northern Adriatic Sea in measurable amounts.

2.2.2. Continuous DGM Measurements

The DGM was measured by a continuous method developed by Andersson et al. [47]. The system was developed to continuously measure DGM in natural waters at a high temporal resolution. Such measurements are important for capturing the dynamic behavior of DGM in surface waters. The Hg-free ambient air was equilibrated with the seawater in a Plexiglas purging bottle with opposite air and water flow. The flow of Hg-free ambient air was introduced through a glass frit positioned at the bottom of the bottle. Released DGM was then detected by a Lumex RA 915+ AAS detector with Zeeman correction.
In the continuous DGM measurement setup, a continuous high water flow (~10 L min−1) enters the system, while a Hg-free air flow (~1 L min−1) enters in the opposite direction and purges the sample. This is based on the opposite flow extraction principle, which enables a longer contact time between aqueous and gaseous phases and thereby facilitates the exchange of mercury between the phases. This automated method uses an opposite flow bubbler (gas/liquid separator or extractor), and the system consists of a smaller Plexiglas cylinder attached inside a larger one. A constant flow of water enters at the top of the inner cylinder and exits at the top of the outer one. Through the glass frit in the bottom of the inner cylinder, a constant flow of Hg-free air is pumped into the system and purges the sample in the opposite direction [47]. The DGM in the outflowing gas was detected and recorded by a Lumex RA 915+ AAS detector with Zeeman correction, connected to a laptop computer and the Lumex-provided software Rapid. The resolution time of measurements was 10 min. To determine DGM, the system uses the measured equilibrium concentration of mercury established between the aqueous and gaseous phases, i.e., DGM = Hgextr/kH, where Hgextr is the measured mercury concentration in the outgoing gas phase and kH is the dimensionless Henry’s Law constant at the certain water temperature and salinity [47,61].

2.3. Weather, Seawater Condition, and River Inflow Data

Weather (air temperature, pressure, humidity, photosynthetic active radiation (PAR), wind speed, and direction) and water condition (temperature, salinity, currents, and wave parameters) were measured at the oceanographic buoy Vida, operated by MBP. The missing and other weather data (precipitation and total and diffusive solar radiation) were measured by the Slovenian Environmental Agency (ARSO) at the nearby European Monitoring and Evaluation Program (EMEP) observation station Letališče Portorož (Portorož Airport). UV radiation is not being measured in the vicinity of the gulf, and the correlation between the PAR at the buoy with the total radiation at the airport was high. Therefore, we adopted PAR for computations, assuming that both UV and PAR are proportional parts of the total solar radiation, with similar patterns. River inflows were measured at the ARSO observation locations for each river (source: www.arso.si or personal communication). Supplemental wind and water temperature data were provided by the Environmental Agency of Friuli-Venezia Giulia (ARPA FVG, Italy).
Wind speed and sea surface temperature (SST) in 15 and 30 min intervals were obtained from the buoy Vida (45.5488° N, 13.550525° E, approx. 2 km offshore from the sampling site, Figure 1). As the buoy was out of operation between July 30 and August 29 and for a few shorter intervals, several nearby meteorological stations were considered to replace the missing data. Malačič [62] determined a relatively strong correlation between wind data on the buoys Vida and Paloma (45.61828° N, 13.56521° E, 12 km offshore) as well as between the Vida and the station Molo Fratelli Bandiera in the Port of Trieste, Italy. Unfortunately, data from either of these stations were not available for August 2019. Furthermore, data from the stations Koper (Port), Portorož Airport, and Muggia Porto San Rocco (Italy) were obtained, and the wind speed correlation was computed for the available data in 2019. In the evasion computations, the missing wind speed data were filled with the data from the Muggia site, as they showed the highest correlation (R2 = 0.49) and good agreement with the Vida data. The SST data from the same station were applied as none of the other meteorological stations provided temperature data in at least hourly temporal resolution. Visual comparison with the Vida data showed higher diurnal variations and a few outbreaks of cold water due to upwelling events, as the Muggia station collects data closer to the coastline, whereas the general agreement was relatively good (R2 = 0.71).

2.4. Modelling and Calculations

2.4.1. Trajectory Modelling

To determine potential origins of the water masses during the high DGM events, Lagrangian particle tracking was employed. Ocean currents were obtained from CMEMS Copernicus reanalysis product MEDSEA_MULTIYEAR_PHY_006_004, using hourly reanalysis of zonal and meridional currents of the dataset med-cmcc-cur-rean-h at 3 m depth. Atmospheric wind data were not used, i.e., surface wind speed was set to zero.
Lagrangian simulations were performed using OceanDrift module of the OpenDrift modeling environment [63]. Simulations were initialized by seeding a total of 640 virtual particles as a radially symmetric Gaussian distribution with a 10 m variance and centered at Buoy Vida location. All particles were released at 3 m depth and were considered passive tracers throughout the simulation. Particle advection and diffusion were limited to the horizontal plane. Vertical mixing was not enforced, and vertical velocity was not provided. Stokes drift was not enforced. Initial value solver was a second-order Runge-Kutta with a computational time step of 30 min and output time step of 1 h. Particles were advected upstream backward in time for 7 days (168 h).

2.4.2. Gas Exchange Model

A 30 min time step was adopted for the computation of evasion. The DGM data were averaged over the time step, and uniform temperature was considered in two adjacent 30 min time steps. Furthermore, evasion was computed with both the actual wind speeds and by applying the lower limit of wind at 4 m·s−1, as in previous modelling studies [38,43,52], to account for evasion in calm wind conditions, when the water–air flux is underestimated without this assumption.
The upward flux of Hg(0) between the water and the air compartment was computed by using the GExM applied in numerous studies within the Mediterranean Sea [22,35,38,42,43]:
E = k w ( D G M T G M K H )
where E stands for Hg0 evasion (ng·m−2 h−1), kw is the water side transfer velocity (m·h−1), and DGM and TGM depict the Hg0 concentrations in the water and the air, respectively (ng·m−3). The dimensionless volatility constant from Henry’s law KH was calculated following Andersson et al. [61]:
K H = e x p ( 2404.3 T + 6.92 ) ,
where T (K) represents the surface water temperature. As suggested by Andersson et al. [22] and Mastomonaco et al. [38] for the Mediterranean Sea, the transfer velocity kw was computed following the parameterization by Nightingale et al. [48]:
k w = 0.01 ( 0.222 u 10 2 + 0.333 u 10 ) · ( S c H g 685 ) 0.5
where u10 is the wind speed at a height of 10 m (m·s−1), and ScHg and 685 are the Schmidt numbers of Hg and of CO2 (at 20 °C and salinity 38), respectively. The temperature-dependent ScHg was obtained from the diffusion coefficient determined by Kuss et al. [49]:
S c H g = ν D ,
where ν is kinematic viscosity (cm2·s−1), and D is the diffusion coefficient (cm2·s−1). Calculated discrete ScHg values were used in polynomial fitting, and the resulting equation (R2 = 0.9998) was applied:
S c H g = 0.0277 T w 3 + 2.7454 T w 2 108.78 T w + 1967.8
where Tw depicts the surface water temperature in degrees Centigrade (°C). With wind data measured on a different height, we applied the conversion [64] as follows:
u i = u r e f l n ( h i z 0 ) l n ( h r e f z 0 ) ,
where uref is wind speed (m·s−1) at the reference height href (m), hi is the height of interest (m), and z0 is the roughness coefficient length (2 × 10⁻⁴ m for water surface).

3. Results and Discussion

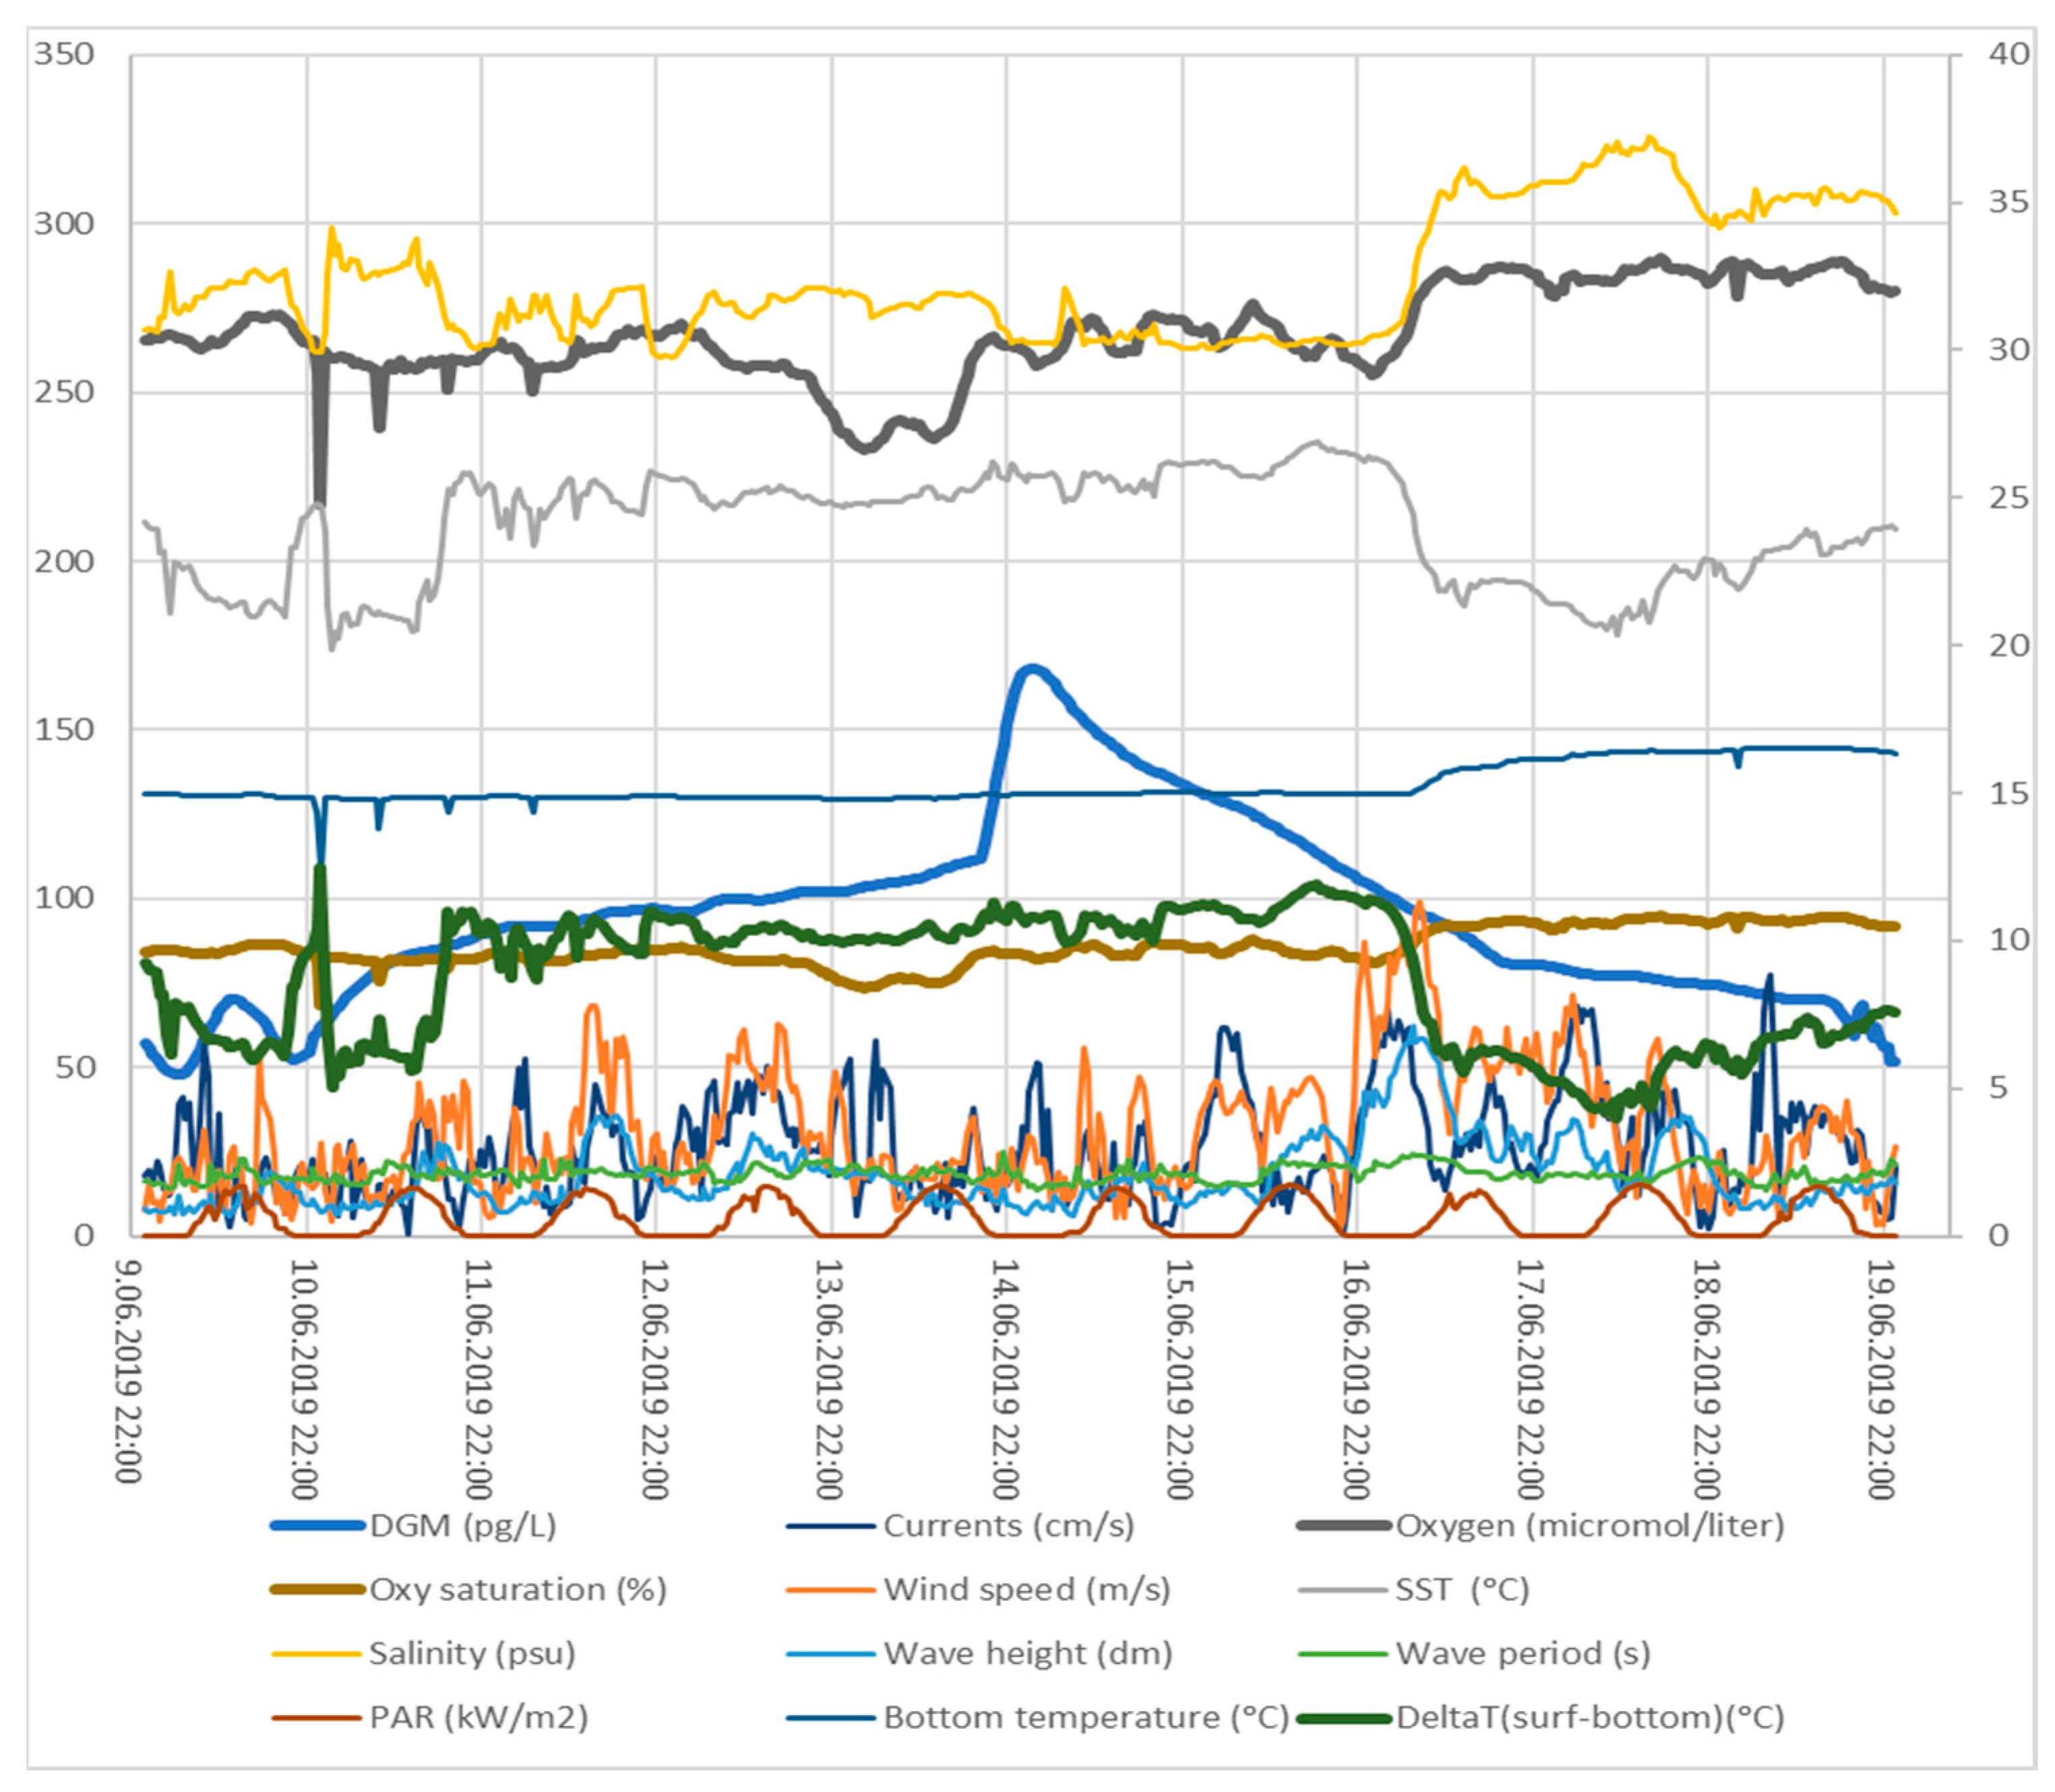
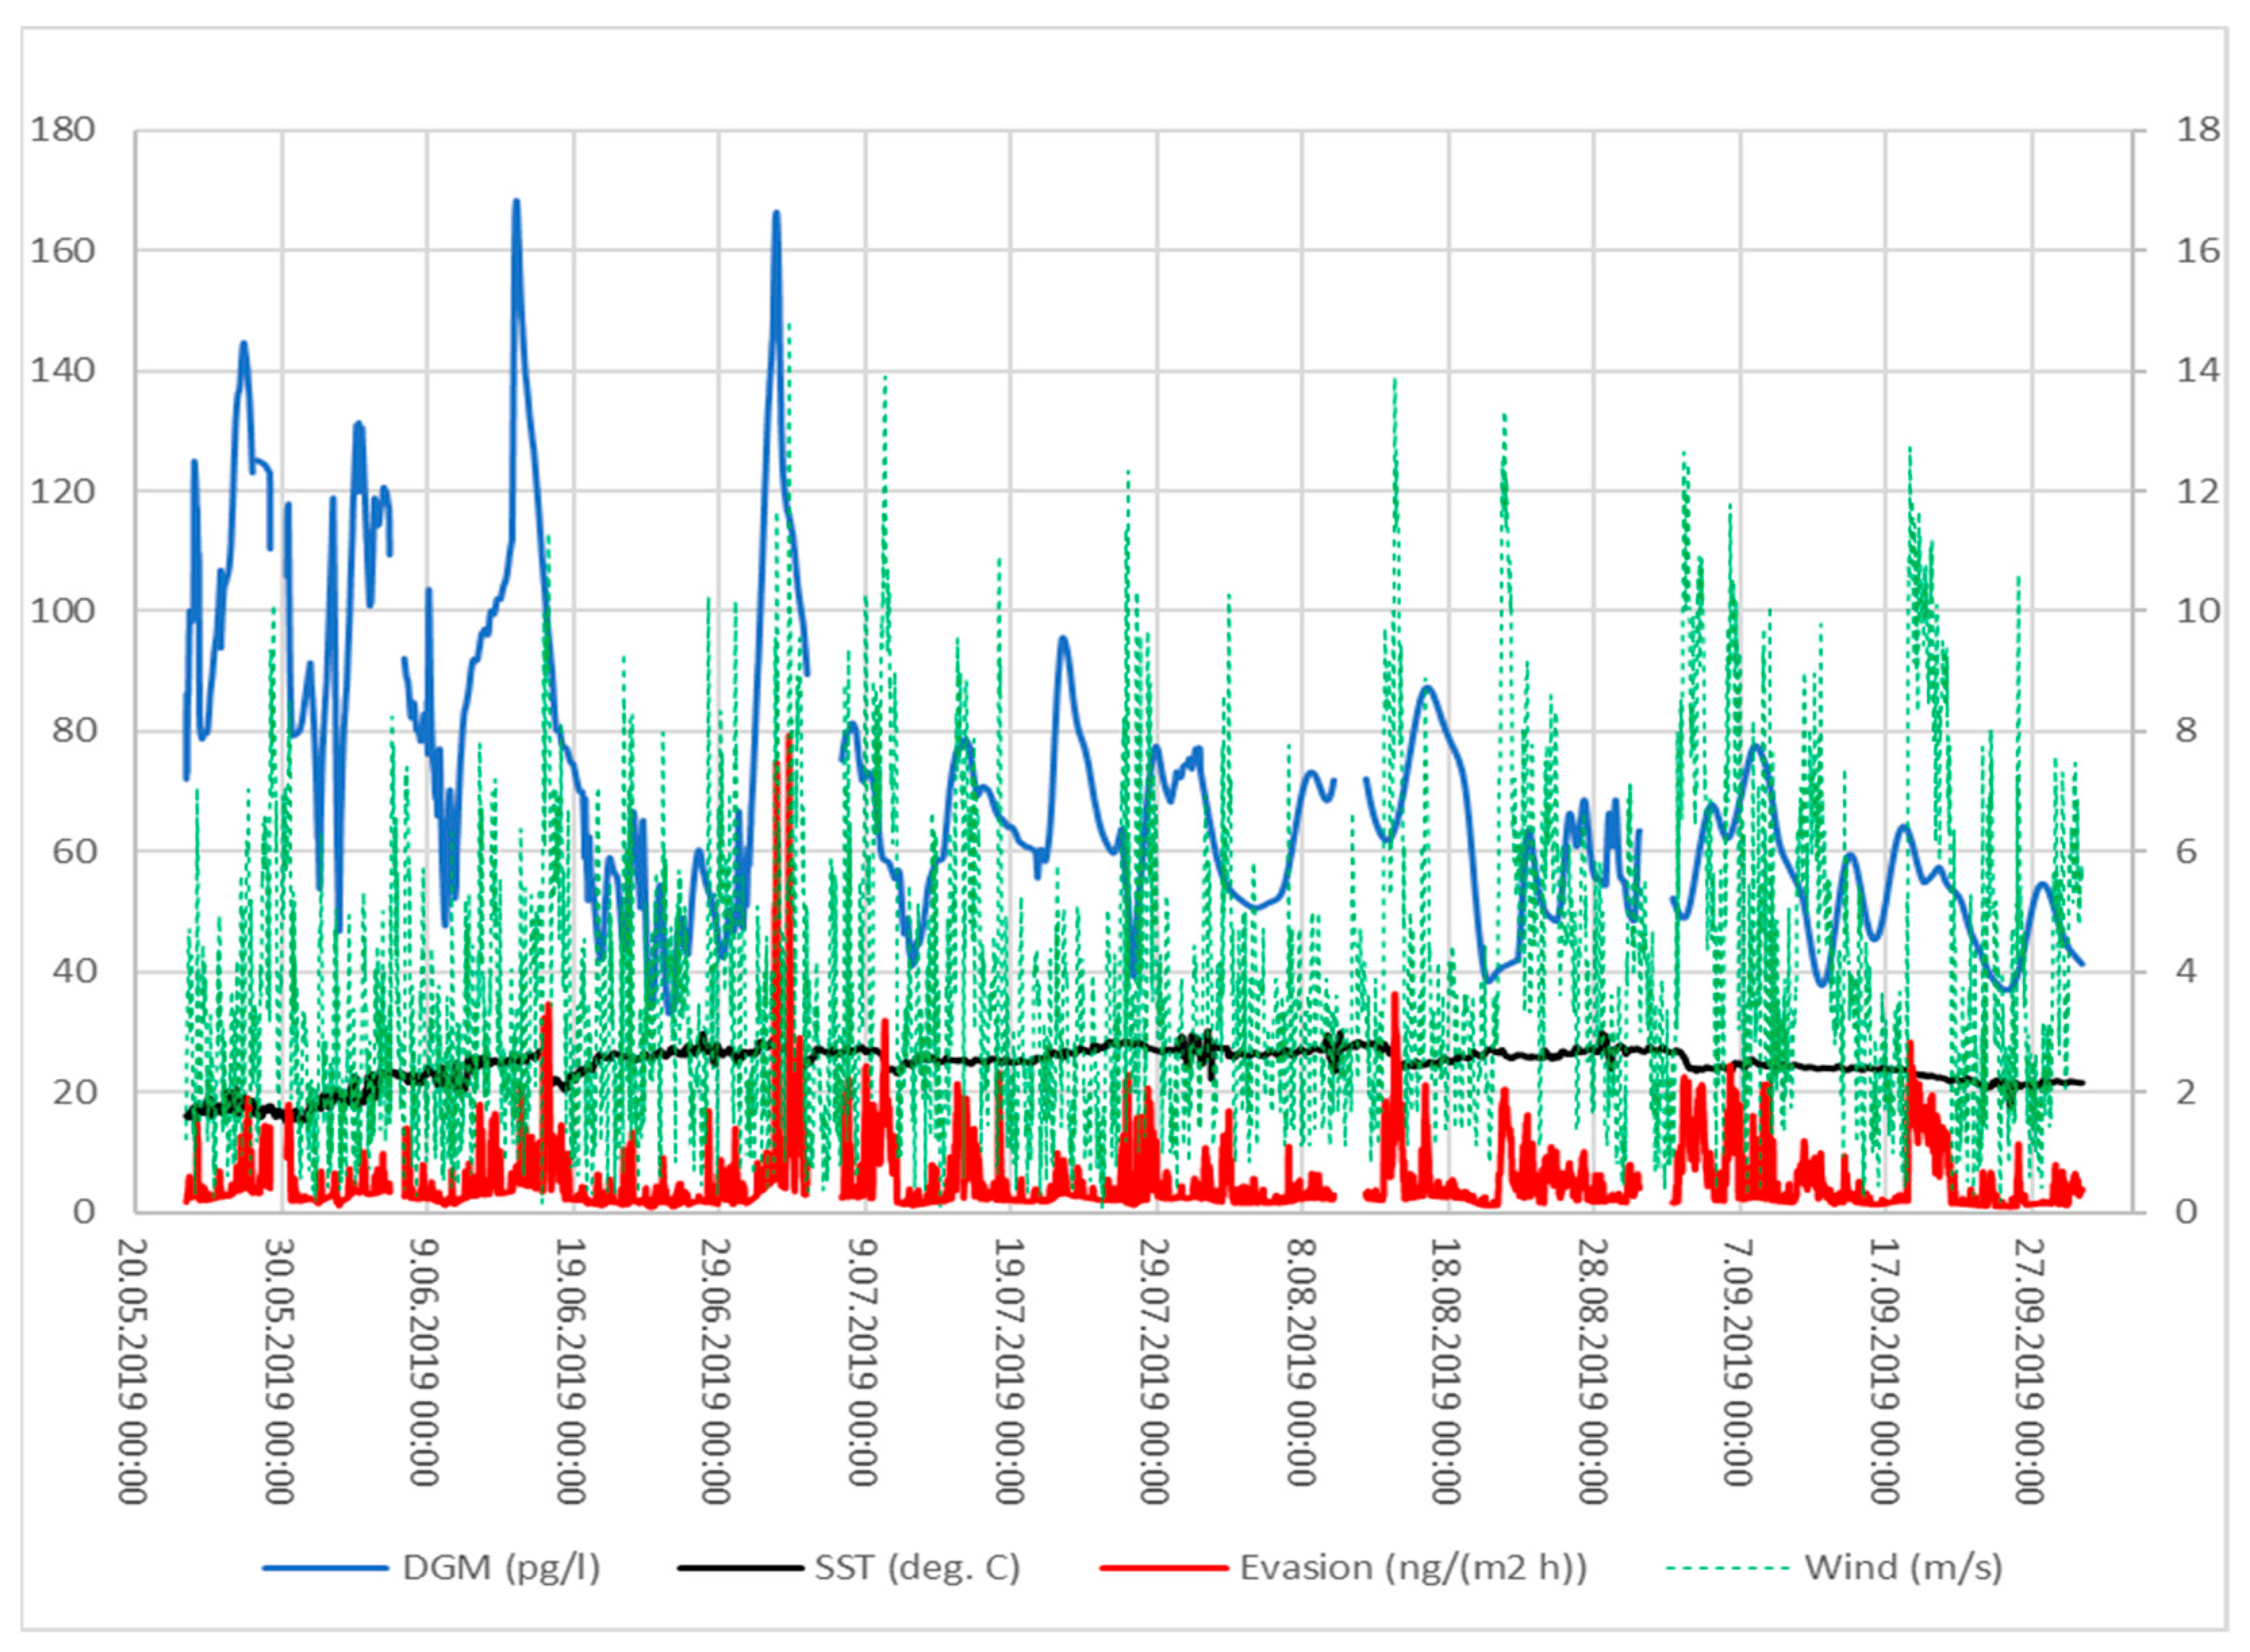
3.1. DGM Concentrations and Variability

Continuous DGM measurements started in May 2019 and lasted until the end of September 2019. Discrete measurements were performed 15 times during continuous measurements. Both methods were compared and showed excellent agreement (Figure 2), especially at the location in front of the MBP and from tube before continuous system. The DGM concentrations showed high variability, from 37.9 to 137 ng·m−3 (average: 73.5 ng·m−3, standard deviation: 29.6) measured by the discrete method and from 33.2 to 168 ng·m−3 (average: 68.7 ng·m−3, standard deviation: 23.8) measured by the continuous method. Discrete measurements of DGM at buoy Vida agreed well with those measured discrete and continuously at MBP, but had a lower variability, ranging from 40.8 to 121 ng·m−3 (average: 81.8 ng·m−3, standard deviation: 33.0). Higher concentrations at the buoy than at MBP, measured in the end of June and in the beginning of September, are probably due to slightly different geographical positions and environmental and hydrological conditions of both locations (Figure 1). However, similar values and good correlation between buoy Vida and MBP locations were found within previous studies [3]. The DGM concentrations measured in front of Soča/Isonzo River outflow and in the central part of the Gulf of Trieste [3] showed higher values on average (average: 157 ng·m−3, standard deviation: 42.9), ranging between 104 and 212 ng·m−3. Other sampling locations in the Adriatic Sea measured within the same study [3] showed several times lower concentrations, from 14.0 to 132 ng·m−3 (average: 40.6 ng·m−3, standard deviation: 15.2), respectively. Other Mediterranean Sea locations had DGM concentrations in the same range as the southern Adriatic, i.e., 12.0 to 106 ng·m−3 (average: 46 ng·m−3, standard deviation: 22) [13]. In general, DGM values measured in front of the MBP and at buoy Vida were lower than those measured at other, more severely Hg-contaminated locations in the Gulf of Trieste [3,20,34], but higher than those in other locations in the Adriatic and Mediterranean Seas [2,3].
During continuous measurements, two higher DGM peaks were observed in June and in the beginning of July, followed by several smaller peaks with a frequency of a few days. Variability and frequency were checked by simple statistical methods described below.
The diurnal DGM variability across the entire sampling period was examined by sorting the DGM concentrations in 24 1-hour intervals. The average values and standard deviation at each hourly interval and over the entire sampling period were calculated (columns “DGM” and “Diurnal variability” in Table 1). The calculation resulted in the maximum of 69.2 ng·m−3 between 21:00 and 22:00 UTC and the minimum of 68.3 ng·m−3 between 3:00 and 4:00 UTC, which reveals an extremely low diurnal variation. We repeated the calculation within the two subintervals with statistically significant difference in average DGM concentrations (p < 0.01). The results in both subintervals (23 May–4 July and 7 July–30 September) showed approximately the same extremely low diurnal variability (Table 1). This observation suggests that the DGM levels are more significantly influenced by processes occurring at the sediment–water interface and in the bottom water layer rather than by photoreduction in the water column. It is noteworthy to highlight the MeHg demethylation carried out by bacterial processes, particularly through expression of the mer operon [65]. The Mer-mediated bacterial reduction is catalyzed by the Hg(II) reductase (Mer A) enzyme present in the Hg-resistant bacteria and is mostly active in oxic environments. Dark abiotic reduction is mainly a consequence of Hg(II) interactions with dissolved organic matter (DOM) in the absence of light, although DOM could have been activated previously by photolysis. Dark biotic reduction is linked to microbially mediated processes occurring in the dark, including the production and excretion of reducing compounds [66], cellular responses to oxidative stress [67], DOM mineralization [68], and unspecific reduction processes [24].

3.2. Correlation between DGM and Environmental Parameters

Numerous environmental parameters were available throughout the sampling period, as described in the Methods Section. An attempt was made to determine the relationship between the DGM and each of the environmental parameters, measured at the oceanographic buoy Vida (wind speed and direction, current magnitude and direction, wave height, period and direction, surface and bottom sea temperature, salinity, solar radiation, and oxygen concentration and saturation) by performing linear regression analysis and calculating the coefficient of determination (R2). Investigation throughout the entire sampling period did not show any visible or statistically confirmed relationships. The R2 values between the DGM and the individual environmental parameters, calculated by linear regression, were below 0.26.
A more detailed investigation was performed in the periods (10–19 June and 1–4 July) of both DGM peaks (14–15 June and 2–3 July) with concentrations over 150 ng·m−3. The observed and compared parameters are presented in Figure 3; Figure 4 for the June and July peaks, respectively.
Based on both visual and linear regression analyses of the observed parameters during the July peak, DGM showed a relatively high negative correlation with oxygen concentration (R2 = 0.71, p < 0.05) and oxygen saturation (R2 = 0.70, p < 0.05) at the sea bottom. A somewhat lower positive correlation was determined between the DGM and the difference between the surface and the bottom water temperature, which may be considered as a simplified temperature-induced stratification index (R2 = 0.42, p < 0.05). A significantly lower correlation (R2 < 0.3) was determined for other observed parameters.
Analysis of the DGM peak occurring between 10 and 19 June resulted in a less distinctive correlation between both bottom oxygen variables and the DGM (R2 = 0.10, p < 0.05 and R2 = 0.12, p < 0.05 for concentrations and saturation, respectively). The correlation between DGM and the simplified stratification index remained approximately the same as that during the July peak (R2 = 0.43, p < 0.05). Although low bottom oxygen conditions often coincide with temperature stratification, we were not able to confirm the unambiguous connection with oxygen. It must be noted, however, that the wind speeds during the June peak rarely exceeded 5 m·s−1, whereas during the maximum of the July peak, wind speeds of 10 m·s−1 and above were observed for longer periods. A low correlation (R2 < 0.25) was determined for other observed parameters.
Although it seems unlikely that the bottom conditions at a depth over 20 m could influence the DGM concentrations at the sampling point relatively close to the sea surface and close to the coastline, we may assume that in such conditions, the increased DGM concentrations stem from either sediment–water flux or transformation processes at the sea bottom, regardless of the depth. Bottom fluxes have proven to be a significant source of Hg(0) in the study by Ramšak et al. [52]. The high correlation between the DGM concentrations at the buoy Vida and at the sampling station in front of the Marine Biology Station in Piran has also been confirmed previously [28,34]. A more in-depth analysis of the interrelation between DGM and environmental parameters, e.g., using multivariate statistical analyses and data-driven models, should be applied to reveal the other possible relations between the observed parameters.

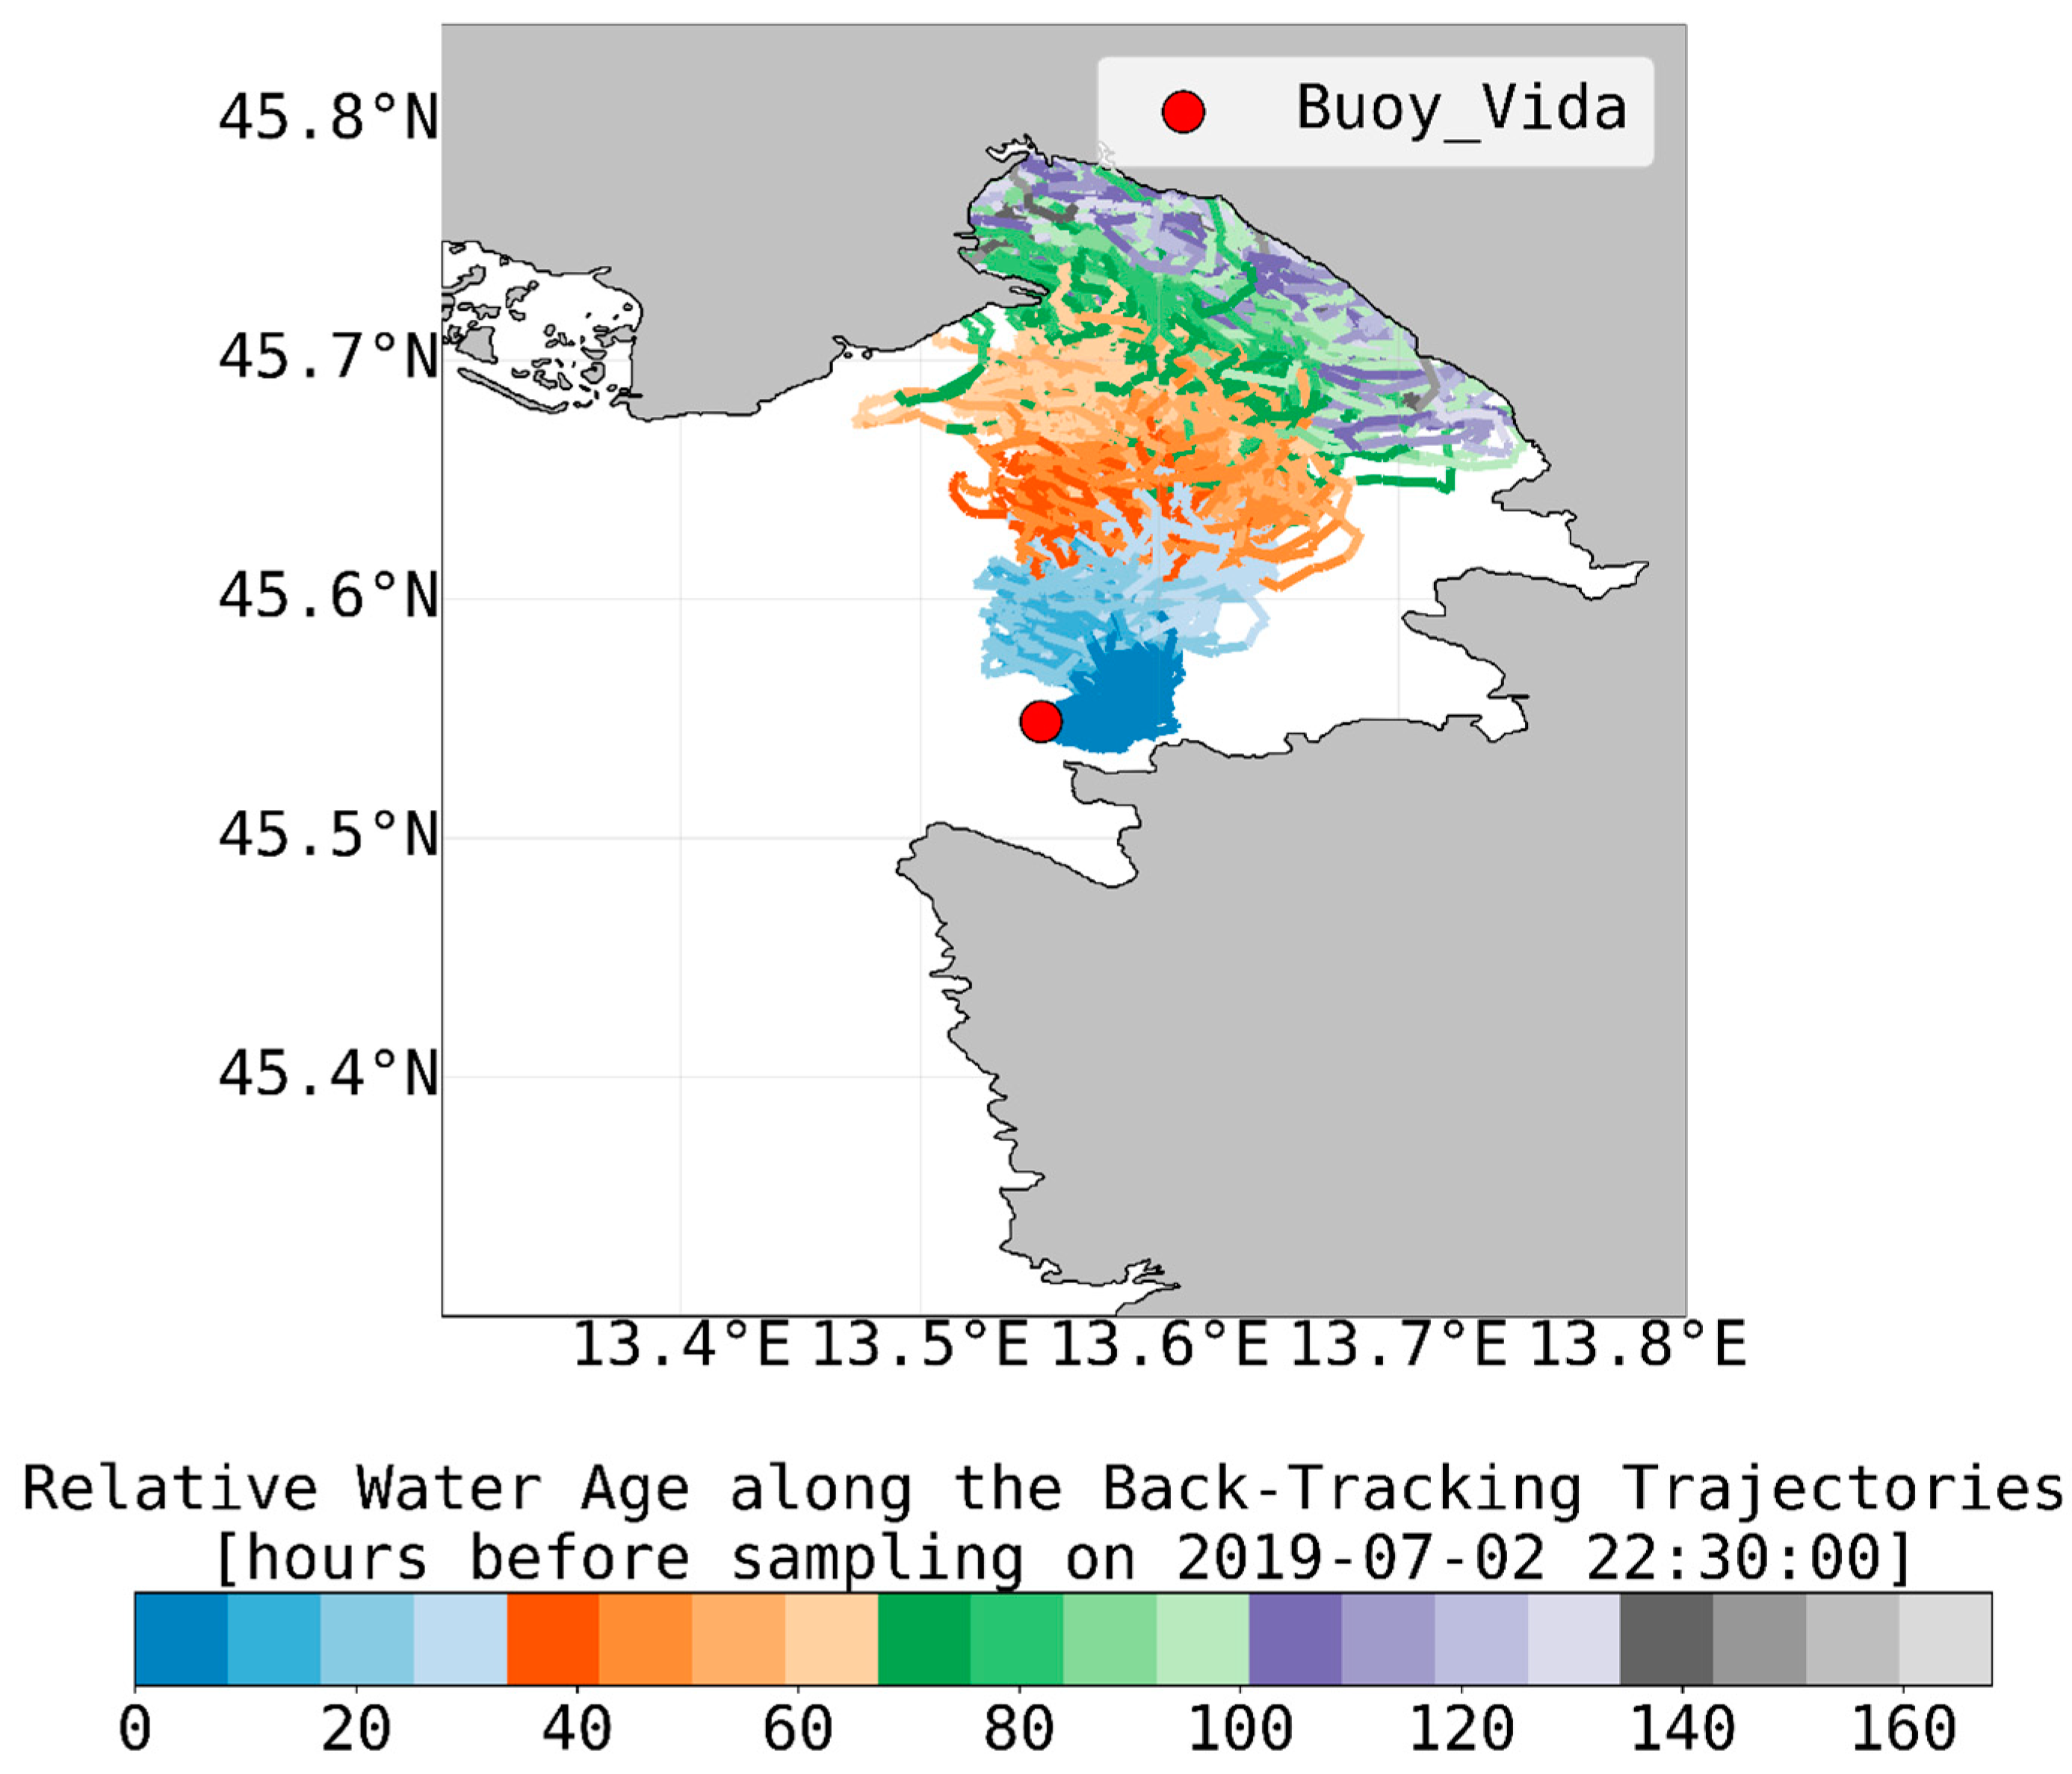
3.3. Deposition and Transport by Rivers and Currents

Beside the possible reasons of the two DGM peaks stemming from the water column and sediment that could be revealed by correlating DGM with environmental parameters, we also investigated fluxes from the atmosphere, freshwater inflows, and transport with sea currents. Precipitation (wet deposition), river inflows, and sea currents during the week preceding both DGM peaks (8–15 June, 25 June–2 July) were analyzed.
The two periods under investigation were without precipitation and therefore we can exclude the connection of (wet) deposition with the high DGM events. Similarly, the river inflows to the gulf were below the annual average during the observed intervals (Soča/Isonzo 70 and 40 m3 s−1, Rižana 1.34 and 0.54 m3 s−1, Badaševica 0.094 and 0.088 m3 s−1, and Dragonja 0.341 and 0.092 m3 s−1, respectively). It is not likely that such low discharges could influence the DGM concentrations at the distance of a few kilometers.
The results of the trajectory modelling (back-propagation) over the week preceding both DGM peaks on 15 June at 02:30 UTC and 2 July at 22:30 UTC are depicted as particle trajectories, with each trajectory being color-coded by the relative water age prior to reaching the buoy Vida location (Figure 5; Figure 6). It is evident that during both DGM events exceeding 150 ng·m−3, a vast majority of trajectories stems from the NE part of the gulf where significantly higher DGM was measured during previous sampling campaigns [3,4,13,22]. In the July event, all trajectories stem from the interior of the gulf and originate in the vicinity of the Soča/Isonzo River mouth. Similarly, in the June event, over 95% of trajectories stem from the gulf interior, while the origin points somewhat more to the south but still in the part of the gulf where DGM is higher than in the vicinity of the buoy Vida. Considering the transport-modelling results, the most probable reason of the increased concentrations during both DGM peaks is transport of DGM-rich seawater by the sea currents from the vicinity of the Isonzo/Soča River outflow.

3.4. Evasion and Annual Hg(0) Flux at the Water–Air Interface

In Figure 7, we present the computed evasion and the measured parameters applied in the equations (Equations (1)–(6)) in 30 min intervals over the entire sampling period. It is evident that the highest evasion occurs only during periods of strong wind. The evasion exceeded 70 ng·m−2·h−1 only in two intervals at the beginning of July, when the wind speed exceeded 10 m·s−1 and the DGM concentrations were higher than 100 ng·m−3. The other periods with either strong wind or high DGM resulted in lower evasion, which rarely exceeded 30 ng·m−2·h−1. The average computed evasion was 5.13 ng·m−2·h−1, with the minimum of 0.90 and the maximum of 78.62 ng·m−2·h−1. Applying a constant TGM of 2.0 ng·m−3 over the entire period or the real wind without the lower limit of 4 m·s−1 resulted in discrepancies lower than 0.5% and only decreased the minimum evasion to 0.012 ng·m−2·h−1. It must be noted that the applied methodology has a much stronger influence on the results, as the variation of evasion by applying various wind parameterizations can reach up to 40%, as described in Andersson et al. [22], Mastromonaco et al. [38], and Tomažič et al. [42]. Furthermore, applying the Wilke and Chang [69] instead of the Kuss [49] parameterization of the diffusion coefficient may increase the evasion results by another 10%.
Multiplying the evasion by the gulf area (approx. 600 km2) in each time step resulted in the Hg(0) mass flux, which was summarized over the entire period. The calculated quantity of Hg(0) crossing the water–air interface reached 8.9 kg, with the maximum and minimum mass fluxes being 23.59 and 0.27 g·h−1, respectively, with an average of 1.54 g·h−1. The calculated values cover 2897 h, roughly one-third of a year, and can be extrapolated to the entire year, considering that more high-wind events occur during the rest of the year, particularly during winter. Outbreaks of the burja wind may last even over 10 days, with wind speeds over 12 m·s−1 [42,70], when evasion would be significantly higher. The average wind speed across the simulation period was 3.94 ± 2.49 m·s−1, with a maximum of 14.78 m·s−1 and a minimum of 0.04 m·s−1. On average, it is expected the wind speeds in the autumn and winter periods to be approximately 20% higher. Although the relation between wind speed and evasion is not linear, we assumed the same proportion for the evasion and estimated that the annual mass of Hg(0) crossing the water–air interface was approximately 30 kg.
A comparison of the annual mass of evasion with the results of previous studies is given in Table 2. Computations by Andersson et al. [22] and Tomažič et al. [42] have been performed for the (northern) Adriatic Sea, and the quantities were reduced proportionally to the ratio between the surface areas of the Gulf of Trieste (600 km2), the northern Adriatic (72,000 km2), and the entire Adriatic Sea (167,700 km2).
The mass of the Hg(0) flux obtained in this study is directly comparable to the quantity reported in Tomažič et al. [42] in high wind conditions with lower DGM concentrations in the northern Adriatic Sea compared to the Gulf of Trieste. The evasion in Tomažič et al. [42] under normal wind conditions increased by a factor of 3 to compensate for higher DGM values would result in 48–63 kg·yr−1, which is approx. two-fold higher than in this study and relatively close to the quantity reported by Ramšak et al. [52], who applied the PCFLOW3D model [43].
The evasion reported in Ramšak et al. [52] and Andersson et al. [22] was two- to four-fold higher than that in the present study. These values are based on significantly higher DGM concentrations (150–250 ng·m−3), whereas in the present sampling, only the two highest DGM peaks exceeded 150 ng·m−3. The Piran sampling station (MBP) is undoubtedly positioned at a location with a relatively low influence of the Soča/Isonzo and the Po Rivers, and lower DGM concentrations can be expected compared both to the rest of the Gulf of Trieste and to the other sampling stations in the northern Adriatic with stronger influences of the Po River [17,22].
The recent study by Floreani et al. [44] is based on seasonal sampling performed by a floating gas flux chamber at four study sites, one of which was in Piran and coincided with the MBP sampling site. Mercury speciation was not performed, and no data on DGM are given. The study reports the fluxes for summer, autumn, and winter, whereas no data are available for spring. The annual mass flux of Hg(0) presented in Table 2 was computed in two ways: by accounting for the two stations within the Gulf of Trieste and by averaging the measured fluxes from all four stations. The missing spring data were replaced by the average between the winter and the summer values. The computed annual fluxes are comparable with those reported by Ramšak et al. [52]. It is, however, evident that the evasion measured by the floating gas chamber (30.87 ± 22.27 ng·m−2·h−1 all stations, 26.22 ± 26.21 ng·m−2·h−1 stations in the Gulf of Trieste, respectively) significantly exceeds the computed evasion in this study (average 5.13 ng·m−2·h−1). None of the measured values was below 13 ng·m−2·h−1, which is over two-fold the average computed evasion in this study. It should be noted, however, that measured fluxes generally exceed fluxes calculated by GExMs often by a factor of about 2 [22,38,43,51,52].

4. Conclusions

Continuous DGM measurements showed high concentration variability; however, the comparison of DGM concentrations obtained by continuous and discrete methods showed excellent agreement.
The diurnal variation of DGM examined over the entire sampling period did not reveal any patterns. Furthermore, the analyses of possible interrelations between the sampled DGM and various measured environmental parameters by linear regression showed neither visible nor statistically confirmed connections over the entire sampling period, probably because of the prevalence of the benthic processes producing DGM in the shallow Piran sampling location. During the high-DGM events in June and July, we determined a relatively high coefficient of determination between the DGM peaks and the simplified stratification index, which represents the difference between the seawater temperature at the surface and at the bottom. During the July peak, the correlation with the oxygen concentration and saturation was also pronounced, whereas in June, no such connection was evident, although the p-values were below 0.05 with all considered parameters. The other observed parameters showed no visible or statistically confirmed connections with DGM. Most probably, the interrelations are influenced by several parameters simultaneously; therefore, a more sophisticated analysis by applying data-driven models and multivariate statistical methods should be performed to reveal the relations between the observed parameters and the DGM. Although the bottom fluxes and processes in both the sediment and water column cannot be excluded as the source of DGM, the back-propagation modelling revealed the transport of DGM-rich water masses from the vicinity of the Soča/Isonzo River mouth as the most probable reason for increased DGM during the two pronounced peaks in June and July.
The computed annual Hg(0) flux across the water–air interface was lower than those reported in recent studies. We assume that the position of the Piran sampling station in a relatively less impacted part of the Gulf, far from the main Hg sources, was the main reason for this discrepancy.
We may assume that transport of water masses from more polluted parts of heterogeneously contaminated semi-enclosed bays such as the Gulf of Trieste significantly influences temporal variability of DGM in any selected sampling points. Therefore, in order to assess both the evasion and the DGM distribution, temporal and spatial coverage with sampling are required.

Author Contributions

Conceptualization, J.K. and M.H.; methodology, J.K., M.H., D.Ž., G.N. and M.L.; software, D.Ž., G.N. and M.L.; validation, J.K., D.Ž. and M.H.; formal analysis, J.K.; writing—original draft preparation, J.K., M.H., D.Ž., G.N. and M.L.; writing—review and editing, J.K., M.H., D.Ž., G.N. and M.L.; visualization, J.K., D.Ž., G.N. and M.L.; supervision, M.H. All authors have read and agreed to the published version of the manuscript.

Funding

This research was funded by Slovenian Research Agency Programs P2-0180 and P1-0143; research projects J1-1716, J1-3033, and N1-0100; and EU-funded project ERA-PLANET iGOSP.

Data Availability Statement

Supporting data are available by personal communication regarding Hg measurements. Weather and hydrology data can be found at: www.arso.si.

Acknowledgments

The authors would like to express their gratitude to Jadran Faganeli and Branko Čermelj from MBS NIB Piran for providing data from the oceanographic buoy Vida and organization of measurements at MBS NIB Piran, and Sergio Nordio at ARPA FVG for providing meteorological data from the station Muggia Porto San Rocco. The authors would like to thank Vesna Fajon for analysis of DGM in coastal waters and to Klaudija Lebar for help with statistical analyses.

Conflicts of Interest

The authors declare no conflict of interest. The funders had no role in the design of the study; in the collection, analyses, or interpretation of data; in the writing of the manuscript, or in the decision to publish the results.

References

  1. Horvat, M.; Kotnik, J.; Logar, M.; Fajon, V.; Zvonarić, T.; Pirrone, N. Speciation of Mercury in Surface and Deep-Sea Waters in the Mediterranean Sea. Atmos. Environ. 2003, 37, 93–108. [Google Scholar] [CrossRef]
  2. Kotnik, J.; Sprovieri, F.; Ogrinc, N.; Horvat, M.; Pirrone, N. Mercury in the Mediterranean, Part I: Spatial and Temporal Trends. Environ. Sci. Pollut. Res. 2014, 21, 4063–4080. [Google Scholar] [CrossRef] [PubMed]
  3. Kotnik, J.; Horvat, M.; Ogrinc, N.; Fajon, V.; Žagar, D.; Cossa, D.; Sprovieri, F.; Pirrone, N. Mercury Speciation in the Adriatic Sea. Mar. Pollut. Bull. 2015, 96, 136–148. [Google Scholar] [CrossRef] [PubMed]
  4. Kotnik, J.; Horvat, M.; Begu, E.; Shlyapnikov, Y.; Sprovieri, F.; Pirrone, N. Dissolved Gaseous Mercury (DGM) in the Mediterranean Sea: Spatial and Temporal Trends. Mar. Chem. 2017, 193, 8–19. [Google Scholar] [CrossRef]
  5. Žagar, D.; Sirnik, N.; Četina, M.; Horvat, M.; Kotnik, J.; Ogrinc, N.; Hedgecock, I.M.; Cinnirella, S.; De Simone, F.; Gencarelli, C.N. Mercury in the Mediterranean. Part 2: Processes and Mass Balance. Environ. Sci. Pollut. Res. 2014, 21, 4081–4094. [Google Scholar] [CrossRef] [PubMed]
  6. Mason, R.P.; Morel, F.; Hemond, H.F. The Role of Microorganisms in Elemental Mercury Formation in Natural Waters. Water Air Soil Pollut. 1995, 80, 775–787. [Google Scholar] [CrossRef]
  7. Costa, M.; Liss, P.S. Photoreduction of Mercury in Sea Water and Its Possible Implications for Hg0 Air–Sea Fluxes. Mar. Chem. 1999, 68, 87–95. [Google Scholar] [CrossRef]
  8. Costa, M.; Liss, P. Photoreduction and Evolution of Mercury from Seawater. Sci. Total Environ. 2000, 261, 125–135. [Google Scholar] [CrossRef]
  9. Amyot, M.; Gill, G.A.; Morel, F.M. Production and Loss of Dissolved Gaseous Mercury in Coastal Seawater. Environ. Sci. Technol. 1997, 31, 3606–3611. [Google Scholar] [CrossRef]
  10. Mason, R.P.; Fitzgerald, W.F. The Distribution and Biogeochemical Cycling of Mercury in the Equatorial Pacific Ocean. Deep Sea Res. Part I Oceanogr. Res. Pap. 1993, 40, 1897–1924. [Google Scholar] [CrossRef]
  11. Mason, R.; Sullivan, K.A. The Distribution and Speciation of Mercury in the South and Equatorial Atlantic. Deep Sea Res. Part II Top. Stud. Oceanogr. 1999, 46, 937–956. [Google Scholar] [CrossRef]
  12. Ferrara, R.; Ceccarini, C.; Lanzillotta, E.; Gårdfeldt, K.; Sommar, J.; Horvat, M.; Logar, M.; Fajon, V.; Kotnik, J. Profiles of Dissolved Gaseous Mercury Concentration in the Mediterranean Seawater. Atmos. Environ. 2003, 37, 85–92. [Google Scholar] [CrossRef]
  13. Kotnik, J.; Horvat, M.; Tessier, E.; Ogrinc, N.; Monperrus, M.; Amouroux, D.; Fajon, V.; Gibičar, D.; Žižek, S.; Sprovieri, F. Mercury Speciation in Surface and Deep Waters of the Mediterranean Sea. Mar. Chem. 2007, 107, 13–30. [Google Scholar] [CrossRef]
  14. Širca, A.; Rajar, R.; Harris, R.C.; Horvat, M. Mercury Transport and Fate in the Gulf of Trieste (Northern Adriatic)—a Two-Dimensional Modelling Approach. Environ. Model. Softw. 1999, 14, 645–655. [Google Scholar] [CrossRef]
  15. Covelli, S.; Piani, R.; Acquavita, A.; Predonzani, S.; Faganeli, J. Transport and Dispersion of Particulate Hg Associated with a River Plume in Coastal Northern Adriatic Environments. Mar. Pollut. Bull. 2007, 55, 436–450. [Google Scholar] [CrossRef] [PubMed]
  16. Žagar, D.; Knap, A.; Warwick, J.J.; Rajar, R.; Horvat, M.; Četina, M. Modelling of Mercury Transport and Transformation Processes in the Idrijca and Soča River System. Sci. Total Environ. 2006, 368, 149–163. [Google Scholar] [CrossRef]
  17. Horvat, M.; Covelli, S.; Faganeli, J.; Logar, M.; Mandić, V.; Rajar, R.; Širca, A.; Žagar, D. Mercury in Contaminated Coastal Environments; a Case Study: The Gulf of Trieste. Sci. Total Environ. 1999, 237, 43–56. [Google Scholar] [CrossRef]
  18. Horvat, M.; Jereb, V.; Fajon, V.; Logar, M.; Kotnik, J.; Faganeli, J.; Hines, M.E.; Bonzongo, J.-C. Mercury Distribution in Water, Sediment and Soil in the Idrijca and SoĉAhca River Systems. Geochem. Explor. Environ. Anal. 2002, 2, 287–296. [Google Scholar] [CrossRef]
  19. Faganeli, J.; Horvat, M.; Covelli, S.; Fajon, V.; Logar, M.; Lipej, L.; Cermelj, B. Mercury and Methylmercury in the Gulf of Trieste (Northern Adriatic Sea). Sci. Total Environ. 2003, 304, 315–326. [Google Scholar] [CrossRef]
  20. Covelli, S.; Piani, R.; Kotnik, J.; Horvat, M.; Faganeli, J.; Brambati, A. Behaviour of Hg Species in a Microtidal Deltaic System: The Isonzo River Mouth (Northern Adriatic Sea). Sci. Total Environ. 2006, 368, 210–223. [Google Scholar] [CrossRef]
  21. Mason, R.P. Mercury Emissions from Natural Processes and Their Importance in the Global Mercury Cycle. In Mercury Fate and Transport in the Global Atmosphere; Springer: Boston, MA, USA, 2009; pp. 173–191. [Google Scholar]
  22. Andersson, M.E.; Gårdfeldt, K.; Wängberg, I.; Sprovieri, F.; Pirrone, N.; Lindqvist, O. Seasonal and Daily Variation of Mercury Evasion at Coastal and off Shore Sites from the Mediterranean Sea. Mar. Chem. 2007, 104, 214–226. [Google Scholar] [CrossRef]
  23. Fantozzi, L.; Ferrara, R.; Frontini, F.P.; Dini, F. Factors Influencing the Daily Behaviour of Dissolved Gaseous Mercury Concentration in the Mediterranean Sea. Mar. Chem. 2007, 107, 4–12. [Google Scholar] [CrossRef]
  24. Fantozzi, L.; Ferrara, R.; Frontini, F.P.; Dini, F. Dissolved Gaseous Mercury Production in the Dark: Evidence for the Fundamental Role of Bacteria in Different Types of Mediterranean Water Bodies. Sci. Total Environ. 2009, 407, 917–924. [Google Scholar] [CrossRef] [PubMed]
  25. Fantozzi, L.; Manca, G.; Ammoscato, I.; Pirrone, N.; Sprovieri, F. The Cycling and Sea–Air Exchange of Mercury in the Waters of the Eastern Mediterranean during the 2010 MED-OCEANOR Cruise Campaign. Sci. Total Environ. 2013, 448, 151–162. [Google Scholar] [CrossRef]
  26. Kuss, J.; Wasmund, N.; Nausch, G.; Labrenz, M. Mercury Emission by the Baltic Sea: A Consequence of Cyanobacterial Activity, Photochemistry, and Low-Light Mercury Transformation. Environ. Sci. Technol. 2015, 49, 11449–11457. [Google Scholar] [CrossRef]
  27. Qureshi, A.; O’Driscoll, N.J.; MacLeod, M.; Neuhold, Y.-M.; Hungerbühler, K. Photoreactions of Mercury in Surface Ocean Water: Gross Reaction Kinetics and Possible Pathways. Environ. Sci. Technol. 2010, 44, 644–649. [Google Scholar] [CrossRef]
  28. Bratkič, A.; Tinta, T.; Koron, N.; Guevara, S.R.; Begu, E.; Barkay, T.; Horvat, M.; Falnoga, I.; Faganeli, J. Mercury Transformations in a Coastal Water Column (Gulf of Trieste, Northern Adriatic Sea). Mar. Chem. 2018, 200, 57–67. [Google Scholar] [CrossRef]
  29. Hines, M.E.; Horvat, M.; Faganeli, J.; Bonzongo, J.-C.J.; Barkay, T.; Major, E.B.; Scott, K.J.; Bailey, E.A.; Warwick, J.J.; Lyons, W.B. Mercury Biogeochemistry in the Idrija River, Slovenia, from above the Mine into the Gulf of Trieste. Environ. Res. 2000, 83, 129–139. [Google Scholar] [CrossRef]
  30. Horvat, M.; Degenek, N.; Lipej, L.; Snoj Tratnik, J.; Faganeli, J. Trophic Transfer and Accumulation of Mercury in Ray Species in Coastal Waters Affected by Historic Mercury Mining (Gulf of Trieste, Northern Adriatic Sea). Environ. Sci. Pollut. Res. 2014, 21, 4163–4176. [Google Scholar] [CrossRef]
  31. Hines, M.E.; Faganeli, J.; Adatto, I.; Horvat, M. Microbial Mercury Transformations in Marine, Estuarine and Freshwater Sediment Downstream of the Idrija Mercury Mine, Slovenia. Appl. Geochem. 2006, 21, 1924–1939. [Google Scholar] [CrossRef]
  32. Cossa, D.; Coquery, M.; Gobeil, C.; Martin, J.-M. Mercury Fluxes at the Ocean Margins. In Global and Regional Mercury Cycles: Sources, Fluxes and Mass Balances; Springer: Dordrecht, The Netherlands, 1996; pp. 229–247. [Google Scholar]
  33. Fitzgerald, W.F.; Lamborg, C.H.; Hammerschmidt, C.R. Marine Biogeochemical Cycling of Mercury. Chem. Rev. 2007, 107, 641–662. [Google Scholar] [CrossRef] [PubMed]
  34. Bratkič, A.; Ogrinc, N.; Kotnik, J.; Faganeli, J.; Žagar, D.; Yano, S.; Tada, A.; Horvat, M. Mercury Speciation Driven by Seasonal Changes in a Contaminated Estuarine Environment. Environ. Res. 2013, 125, 171–178. [Google Scholar] [CrossRef] [PubMed]
  35. Gårdfeldt, K.; Sommar, J.; Ferrara, R.; Ceccarini, C.; Lanzillotta, E.; Munthe, J.; Wängberg, I.; Lindqvist, O.; Pirrone, N.; Sprovieri, F. Evasion of Mercury from Coastal and Open Waters of the Atlantic Ocean and the Mediterranean Sea. Atmos. Environ. 2003, 37, 73–84. [Google Scholar] [CrossRef]
  36. Pirrone, N.; Costa, P.; Pacyna, J.M.; Ferrara, R. Mercury Emissions to the Atmosphere from Natural and Anthropogenic Sources in the Mediterranean Region. Atmos. Environ. 2001, 35, 2997–3006. [Google Scholar] [CrossRef]
  37. Koron, N.; Bratkič, A.; Guevara, S.R.; Tinta, T.; Klun, K.; Faganeli, J.; Horvat, M. Seasonal Dynamics of Microbial Mercury Transformations in Sediments and Water Column of Gulf of Trieste (Northern Adriatic Sea). E3S Web Conf. 2013, 1, 10001. [Google Scholar] [CrossRef] [Green Version]
  38. Mastromonaco, M.G.N.; Gårdfeldt, K.; Wängberg, I. Seasonal and Spatial Evasion of Mercury from the Western Mediterranean Sea. Mar. Chem. 2017, 193, 34–43. [Google Scholar] [CrossRef]
  39. De Simone, F.; Gencarelli, C.N.; Hedgecock, I.M.; Pirrone, N. Global Atmospheric Cycle of Mercury: A Model Study on the Impact of Oxidation Mechanisms. Environ. Sci. Pollut. Res. 2014, 21, 4110–4123. [Google Scholar] [CrossRef]
  40. Gencarelli, C.N.; De Simone, F.; Hedgecock, I.M.; Sprovieri, F.; Pirrone, N. Development and Application of a Regional-Scale Atmospheric Mercury Model Based on WRF/Chem: A Mediterranean Area Investigation. Environ. Sci. Pollut. Res. 2014, 21, 4095–4109. [Google Scholar] [CrossRef]
  41. Hedgecock, I.M.; Pirrone, N.; Trunfio, G.A.; Sprovieri, F. Integrated Mercury Cycling, Transport, and Air-water Exchange (MECAWEx) Model. J. Geophys. Res. Atmos. 2006, 111, D20302. [Google Scholar] [CrossRef]
  42. Tomažič, Š.; Ličer, M.; Žagar, D. Numerical Modelling of Mercury Evasion in a Two-Layered Adriatic Sea Using a Coupled Atmosphere-Ocean Model. Mar. Pollut. Bull. 2018, 135, 1164–1173. [Google Scholar] [CrossRef]
  43. Žagar, D.; Petkovšek, G.; Rajar, R.; Sirnik, N.; Horvat, M.; Voudouri, A.; Kallos, G.; Četina, M. Modelling of Mercury Transport and Transformations in the Water Compartment of the Mediterranean Sea. Mar. Chem. 2007, 107, 64–88. [Google Scholar] [CrossRef]
  44. Floreani, F.; Acquavita, A.; Petranich, E.; Covelli, S. Diurnal Fluxes of Gaseous Elemental Mercury from the Water-Air Interface in Coastal Environments of the Northern Adriatic Sea. Sci. Total Environ. 2019, 668, 925–935. [Google Scholar] [CrossRef] [PubMed]
  45. Gustin, M.S.; Bank, M.S.; Bishop, K.; Bowman, K.; Branfireun, B.; Chételat, J.; Eckley, C.S.; Hammerschmidt, C.R.; Lamborg, C.; Lyman, S. Mercury Biogeochemical Cycling: A Synthesis of Recent Scientific Advances. Sci. Total Environ. 2020, 737, 139619. [Google Scholar] [CrossRef]
  46. Sommar, J.; Osterwalder, S.; Zhu, W. Recent Advances in Understanding and Measurement of Hg in the Environment: Surface-Atmosphere Exchange of Gaseous Elemental Mercury (Hg0). Sci. Total Environ. 2020, 721, 137648. [Google Scholar] [CrossRef]
  47. Andersson, M.E.; Sommar, J.; Gårdfeldt, K.; Lindqvist, O. Enhanced Concentrations of Dissolved Gaseous Mercury in the Surface Waters of the Arctic Ocean. Mar. Chem. 2008, 110, 190–194. [Google Scholar] [CrossRef]
  48. Nightingale, P.D.; Malin, G.; Law, C.S.; Watson, A.J.; Liss, P.S.; Liddicoat, M.I.; Boutin, J.; Upstill-Goddard, R.C. In Situ Evaluation of Air-sea Gas Exchange Parameterizations Using Novel Conservative and Volatile Tracers. Glob. Biogeochem. Cycles 2000, 14, 373–387. [Google Scholar] [CrossRef]
  49. Kuss, J.; Holzmann, J.; Ludwig, R. An Elemental Mercury Diffusion Coefficient for Natural Waters Determined by Molecular Dynamics Simulation. Environ. Sci. Technol. 2009, 43, 3183–3186. [Google Scholar] [CrossRef]
  50. Kuss, J. Water—Air Gas Exchange of Elemental Mercury: An Experimentally Determined Mercury Diffusion Coefficient for Hg0 Water—Air Flux Calculations. Limnol. Oceanogr. 2014, 59, 1461–1467. [Google Scholar] [CrossRef]
  51. Rajar, R.; Četina, M.; Horvat, M.; Žagar, D. Mass Balance of Mercury in the Mediterranean Sea. Mar. Chem. 2007, 107, 89–102. [Google Scholar] [CrossRef]
  52. Ramšak, V.; Malačič, V.; Ličer, M.; Kotnik, J.; Horvat, M.; Žagar, D. High-Resolution Pollutant Dispersion Modelling in Contaminated Coastal Sites. Environ. Res. 2013, 125, 103–112. [Google Scholar] [CrossRef]
  53. Gårdfeldt, K.; Horvat, M.; Sommar, J.; Kotnik, J.; Fajon, V.; Wängberg, I.; Lindqvist, O. Comparison of Procedures for Measurements of Dissolved Gaseous Mercury in Seawater Performed on a Mediterranean Cruise. Anal. Bioanal. Chem. 2002, 374, 1002–1008. [Google Scholar] [CrossRef] [PubMed]
  54. Nerentorp Mastromonaco, M.G.; Gardfeldt, K.; Wangberg, I.; Jourdain, B.; Dommergue, A.; Kuronen, P.; Pirrone, N.; Jacobi, H. Mercury Depletion Events over Antarctic and Arctic Oceans. 2013, Volume 2013, p. C12A-08. Available online: https://ui.adsabs.harvard.edu/abs/2013AGUFM.C12A..08N/abstract (accessed on 20 February 2022).
  55. Malačič, V.; Petelin, B. Climatic Circulation in the Gulf of Trieste (Northern Adriatic). J. Geophys. Res. Ocean. 2009, 114, C07002. [Google Scholar] [CrossRef]
  56. Rajar, R.; Žagar, D.; Četina, M.; Akagi, H.; Yano, S.; Tomiyasu, T.; Horvat, M. Application of Three-Dimensional Mercury Cycling Model to Coastal Seas. Ecol. Model. 2004, 171, 139–155. [Google Scholar] [CrossRef]
  57. Cozzi, S.; Falconi, C.; Comici, C.; Čermelj, B.; Kovac, N.; Turk, V.; Giani, M. Recent Evolution of River Discharges in the Gulf of Trieste and Their Potential Response to Climate Changes and Anthropogenic Pressure. Estuar. Coast. Shelf Sci. 2012, 115, 14–24. [Google Scholar] [CrossRef]
  58. Andersson, M.; Sommar, J.; Gårdfeldt, K. Continuous Dissolved Elemental Mercury Measurements in the Arctic Ocean. 2006, Volume 8, p. 07745. Available online: https://www.researchgate.net/profile/Jonas-Sommar/publication/267799208_Continuous_Dissolved_Elemental_Mercury_Measurements_in_the_Arctic_Ocean/links/54b50ad00cf28ebe92e4b3d0/Continuous-Dissolved-Elemental-Mercury-Measurements-in-the-Arctic-Ocean.pdf (accessed on 20 February 2022).
  59. Andersson, M.E.; Sommar, J.; Gårdfeldt, K.; Jutterström, S. Air–Sea Exchange of Volatile Mercury in the North Atlantic Ocean. Mar. Chem. 2011, 125, 1–7. [Google Scholar] [CrossRef]
  60. Barago, N.; Floreani, F.; Acquavita, A.; Esbrí, J.M.; Covelli, S.; Higueras, P. Spatial and Temporal Trends of Gaseous Elemental Mercury over a Highly Impacted Coastal Environment (Northern Adriatic, Italy). Atmosphere 2020, 11, 935. [Google Scholar] [CrossRef]
  61. Andersson, M.E.; Gårdfeldt, K.; Wängberg, I.; Strömberg, D. Determination of Henry’s Law Constant for Elemental Mercury. Chemosphere 2008, 73, 587–592. [Google Scholar] [CrossRef]
  62. Malačič, V. Wind Direction Measurements on Moored Coastal Buoys. J. Atmos. Ocean. Technol. 2019, 36, 1401–1418. [Google Scholar] [CrossRef]
  63. Dagestad, K.-F.; Röhrs, J.; Breivik, Ø.; Ådlandsvik, B. OpenDrift v1. 0: A Generic Framework for Trajectory Modelling. Geosci. Model Dev. 2018, 11, 1405–1420. [Google Scholar] [CrossRef] [Green Version]
  64. Bañuelos-Ruedas, F.; Camacho, C.Á.; Rios-Marcuello, S. Methodologies Used in the Extrapolation of Wind Speed Data at Different Heights and Its Impact in the Wind Energy Resource Assessment in a Region. In Wind Farm—Technical Regulations, Potential Estimation and Siting Assessment; Suvire, G.O., Ed.; InTech: Rijeka, Croatia, 2011; pp. 97–114. [Google Scholar]
  65. Barkay, T.; Miller, S.M.; Summers, A.O. Bacterial Mercury Resistance from Atoms to Ecosystems. FEMS Microbiol. Rev. 2003, 27, 355–384. [Google Scholar] [CrossRef] [Green Version]
  66. Lanzillotta, E.; Ceccarini, C.; Ferrara, R.; Dini, F.; Frontini, F.P.; Banchetti, R. Importance of the Biogenic Organic Matter in Photo-Formation of Dissolved Gaseous Mercury in a Culture of the Marine Diatom Chaetoceros Sp. Sci. Total Environ. 2004, 318, 211–221. [Google Scholar] [CrossRef]
  67. Barkay, T.; Wagner-Döbler, I. Microbial Transformations of Mercury: Potentials, Challenges, and Achievements in Controlling Mercury Toxicity in the Environment. Adv. Appl. Microbiol. 2005, 57, 1–52. [Google Scholar] [PubMed]
  68. Lin, C.-C.; Yee, N.; Barkay, T. Microbial Transformations in the Mercury Cycle. In Environmental Chemistry and Toxicology of Mercury; John Wiley & Sons, Inc.: Hoboken, NJ, USA, 2012; pp. 155–191. [Google Scholar]
  69. Wilke, C.R.; Chang, P. Correlation of Diffusion Coefficients in Dilute Solutions. AIChE J. 1955, 1, 264–270. [Google Scholar] [CrossRef]
  70. Ličer, M.; Smerkol, P.; Fettich, A.; Ravdas, M.; Papapostolou, A.; Mantziafou, A.; Strajnar, B.; Cedilnik, J.; Jeromel, M.; Jerman, J. Modeling the Ocean and Atmosphere during an Extreme Bora Event in Northern Adriatic Using One-Way and Two-Way Atmosphere–Ocean Coupling. Ocean Sci. 2016, 12, 71–86. [Google Scholar] [CrossRef] [Green Version]
Figure 1. Gulf of Trieste with sampling and measurement locations.
Jmse 10 00587 g001
Figure 2. Comparison of continuous DGM measurements to discrete measurements at locations in front of the MBP, buoy Vida, and from pipe to continuous DGM measurement system.
Jmse 10 00587 g002
Figure 3. Time series of the observed parameters in the period 10–19 June. The following variables are depicted on the secondary axis: wind and current speed, surface and bottom temperature and the difference between them, wave height and wave period, and PAR and salinity.
Jmse 10 00587 g003
Figure 4. Time series of the observed parameters in the period 1–4 July. The following variables are depicted on the secondary axis: wind and current speed, surface and bottom temperature and the difference between them, wave height and wave period, and PAR and salinity.
Jmse 10 00587 g004
Figure 5. Trajectories (back-propagation) of water particles prior to reaching the buoy Vida location on 15 June at 02:30 UTC, color-coded by the relative water age.
Jmse 10 00587 g005
Figure 6. Trajectories (back-propagation) of water particles prior to reaching the buoy Vida location on 2 July at 22:30 UTC, color-coded by the relative water age.
Jmse 10 00587 g006
Figure 7. Hg0 evasion and the measured input parameters over the period 23 May–30 September 2019. Secondary axis depicts the wind speed.
Jmse 10 00587 g007
Table 1. Diurnal DGM variation across the entire sampling period and the two subintervals with statistically significant difference (p < 0.01) in concentrations.
Sampling PeriodDGM
(ng·m−3)
Diurnal Variation
(ng·m−3)
Diurnal Max
(@ UTC)
(ng·m−3)
Diurnal Min
(@ UTC)
(ng·m−3)
23 May–30 September68.7 ± 23.868.7 ± 0.2669.2 (21:00–22:00)68.3 (03:00–04:00)
23 May–4 July85.8 ± 31.085.8 ± 0.6587.1 (23:00–24:00)84.8 (12:00–13:00)
7 July–30 September60.1 ± 12.460.2 ± 0.1360.4 (08:00–09:00)59.9 (15:00–16:00)
Table 2. Mass of Hg(0) evasion in the Gulf of Trieste reported in recent studies. Measured parameters are marked in bold.
Method
(Numerical Model)
Variables (Seasonal)Variables (Real Time, Measured)Wind
Model
Diffusion ModelMass of Evasion (kg·yr−1)
Širca et al., 1999 [14]estimation----10 (1)
Andersson et al., 2007 [22]; Kotnik et al., 2015 [3]Andersson et al., 2007 [22], measurements-TGM, DGM, SST, wind[48][69]100 (2)
Ramšak et al., 2013 (1) [52]Gårdfeldt et al., 2003 [35]DGM, TGM, SST, depositionWind[48][69]133
Ramšak et al., 2013 (2) [52]Gårdfeldt et al., 2003 [35] (PCFLOW3D)TGM, SST, depositionDGM, wind, bottom flux[48][69]78
Tomažič et al., 2018 [42]
(extreme wind)
Andersson et al., 2007 [22] (AdriHg)TGM, depositionDGM, wind, SST[48][49]26.4–34.0 (3)
Tomažič et al., 2018 [42]
(decresed wind)
Andersson et al., 2007 [22] (AdriHg)TGM, depositionDGM, wind, SST[48][49]16.1–21.1 (3)
Floreani et al., 2019 [44]Measurements-flux--163 (4)
137 (5)
This researchAndersson et al., 2007 [22]TGMDGM, wind, SST[48][49]30
(1) estimation to the order of magnitude; (2) computation in the northern Adriatic Sea; (3) computation in the Adriatic Sea; (4) sum of seasonal quantities computed by fluxes measured at all stations; (5) sum of seasonal quantities computed by fluxes measured at the stations in the Gulf of Trieste.
Publisher’s Note: MDPI stays neutral with regard to jurisdictional claims in published maps and institutional affiliations.

