
A Simplified Approach to Modeling the Dispersion of Mercury from Precipitation to Surface Waters—The Bay of Kaštela Case Study

 , , and
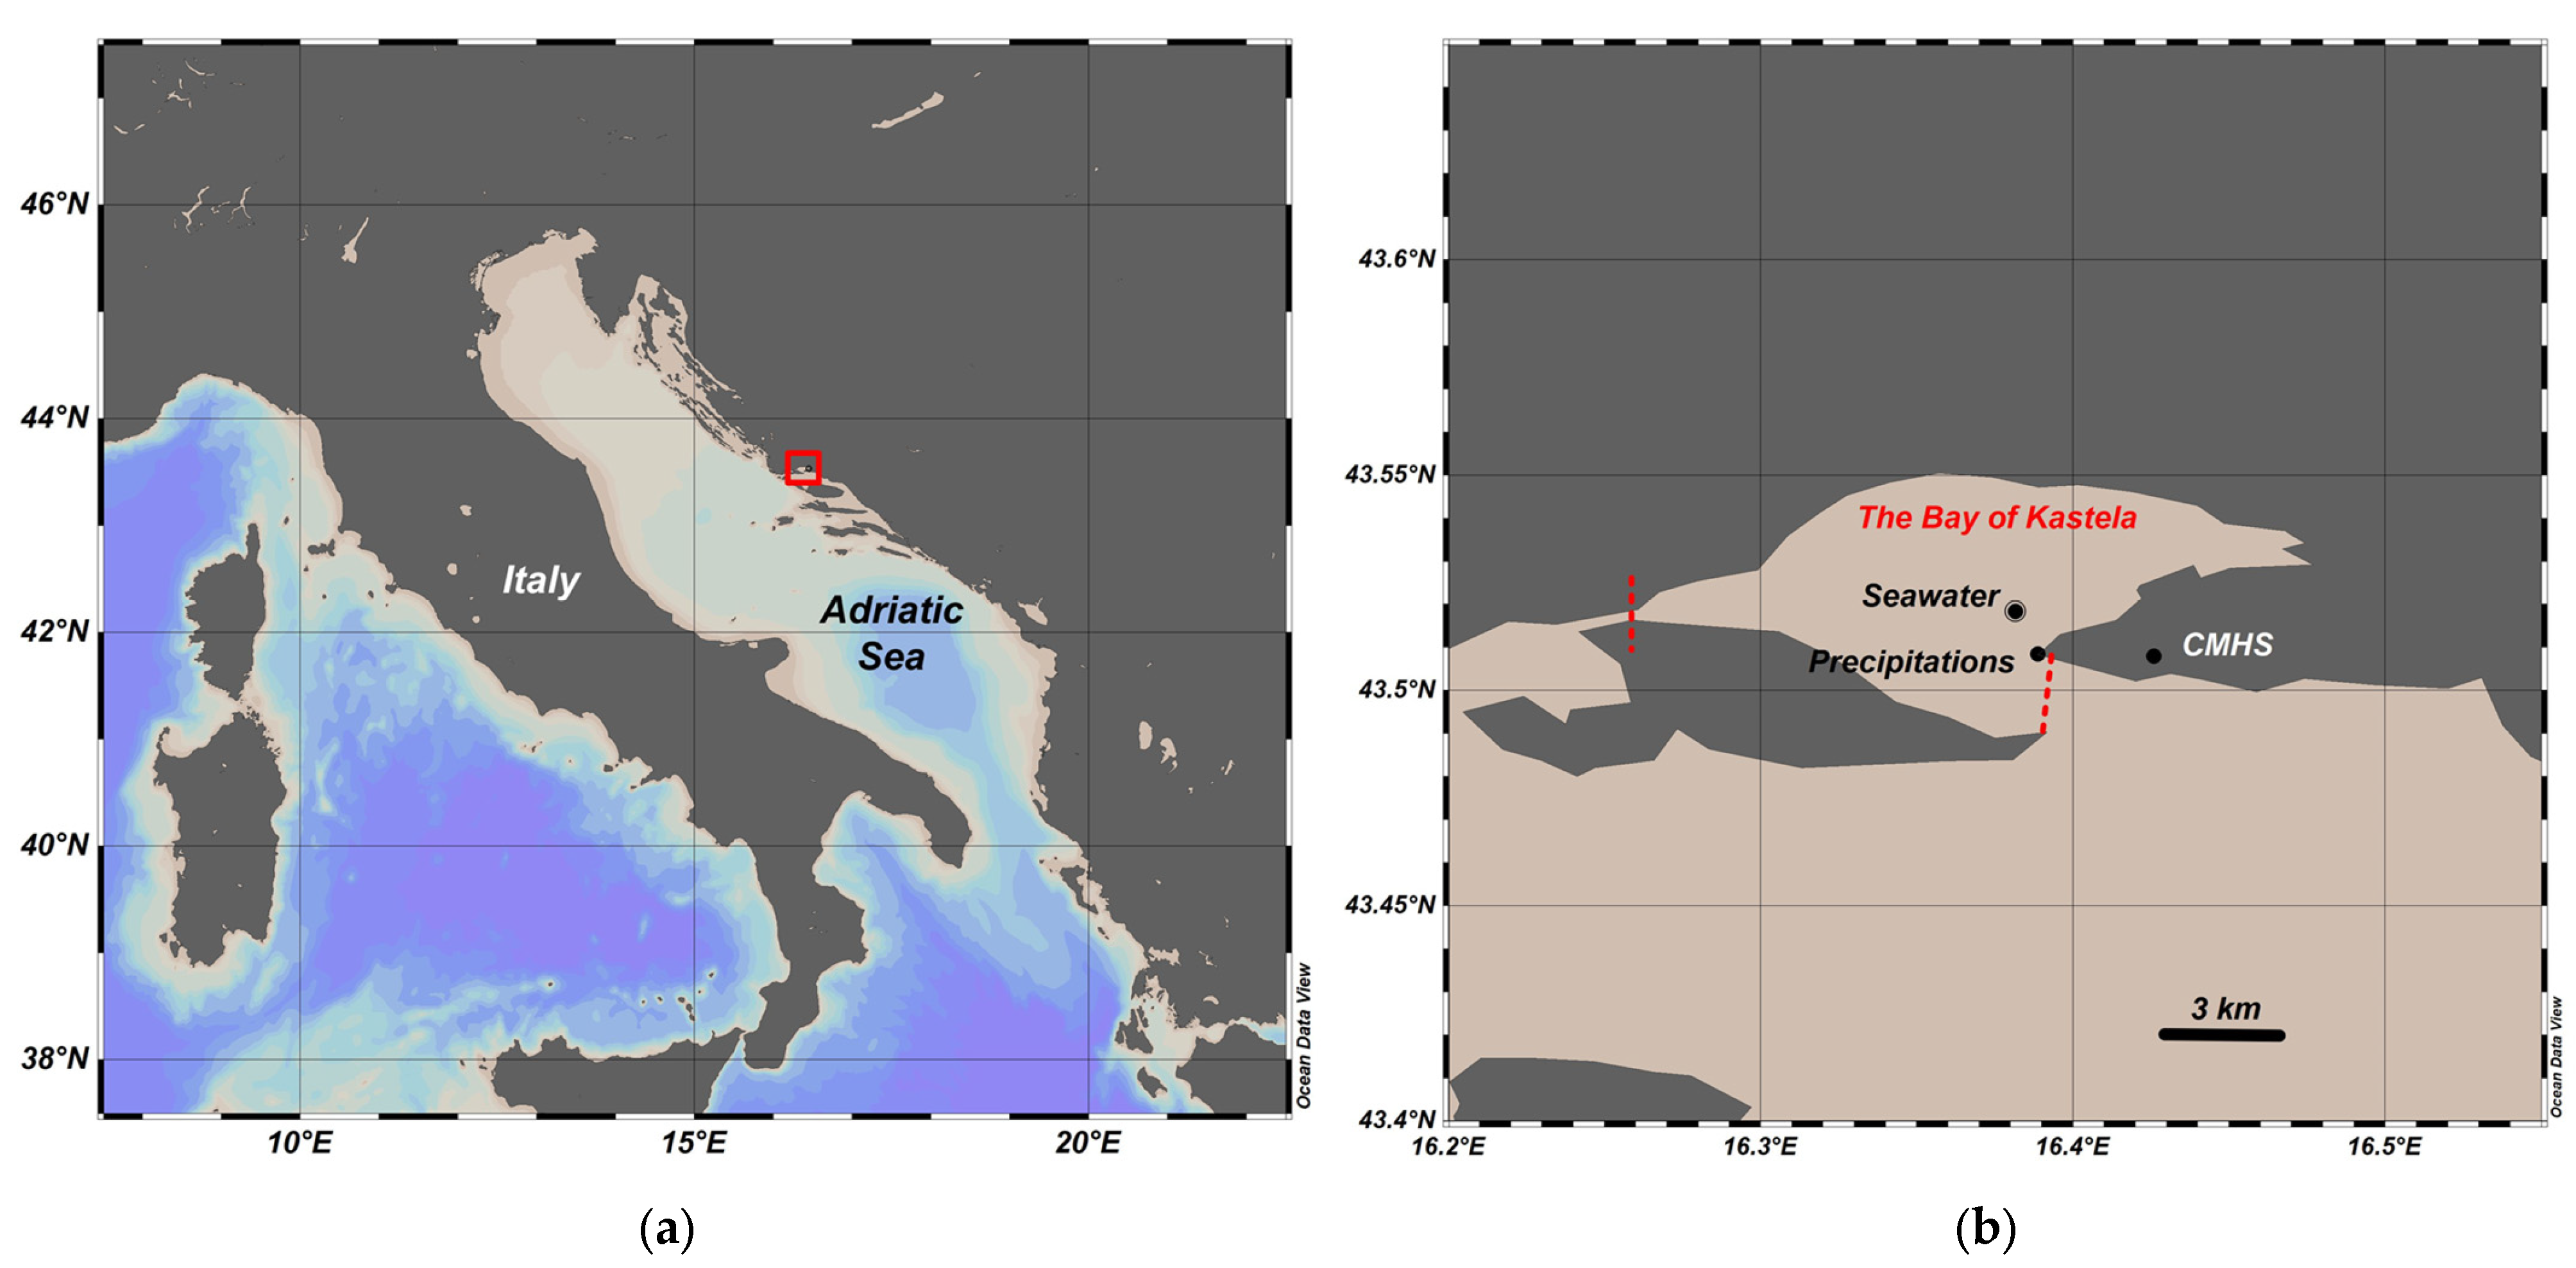
Abstract
:1. Introduction
2. Materials and Methods
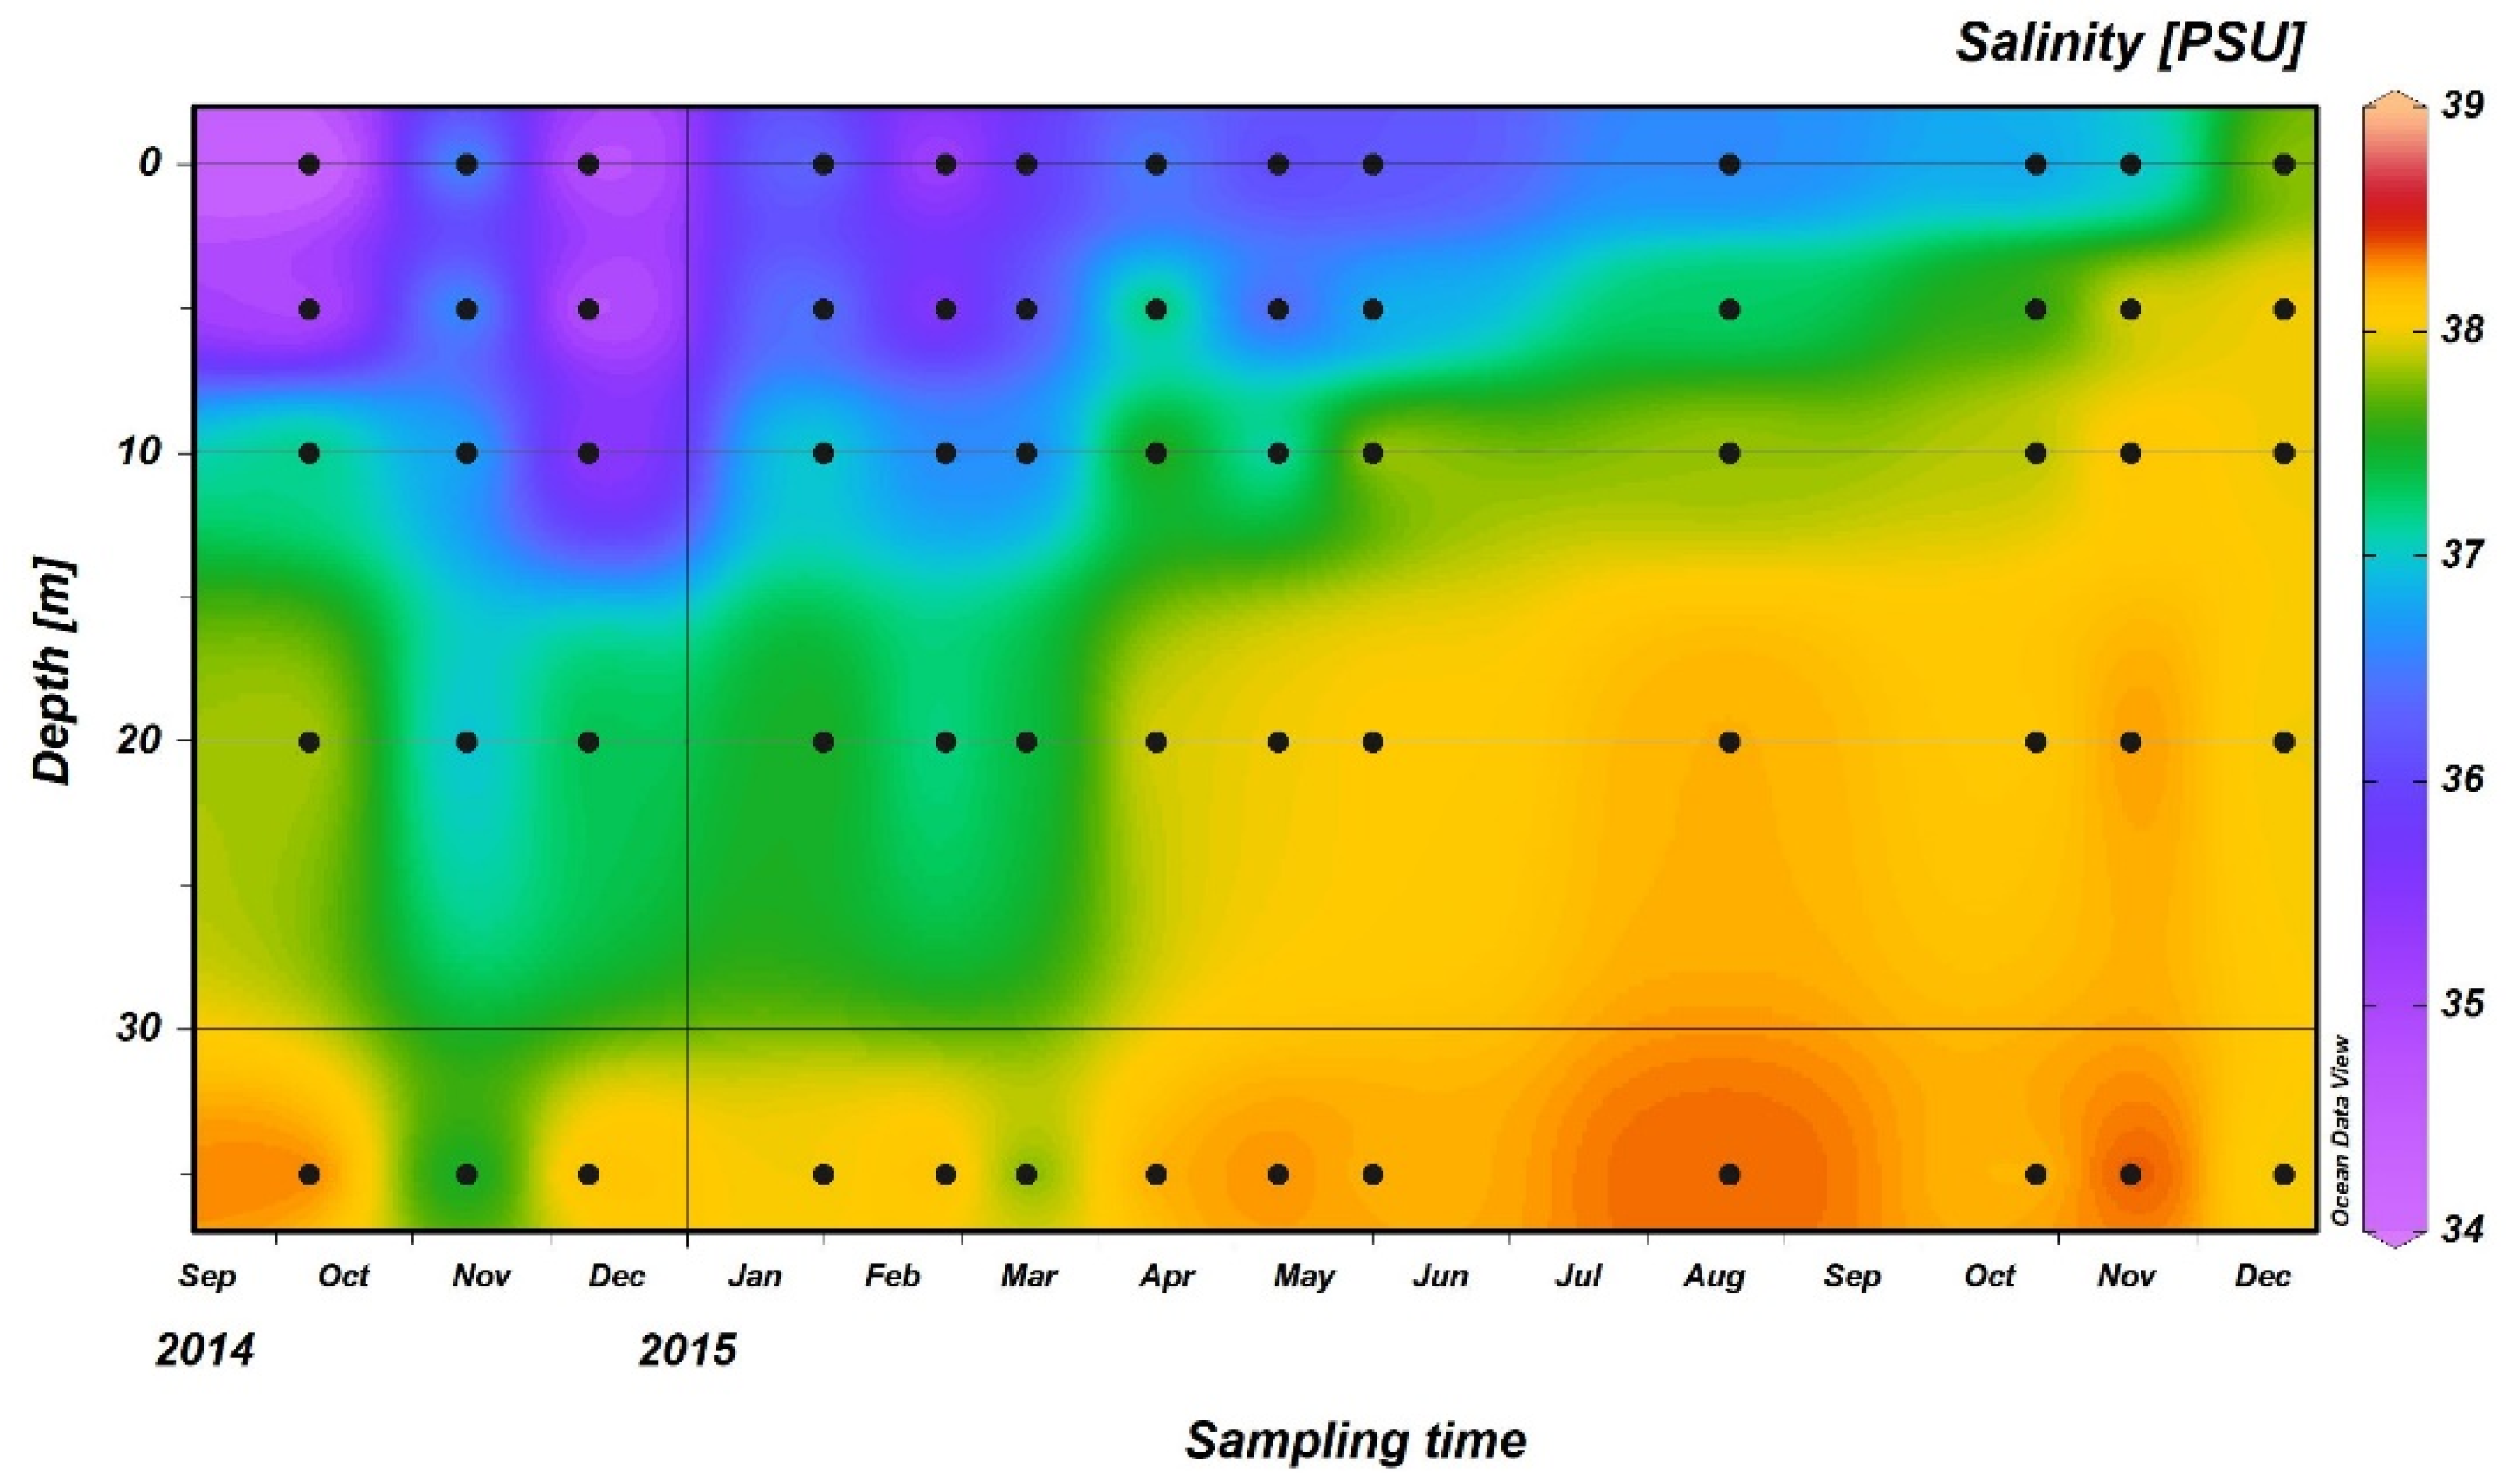
2.1. Study Area
2.2. Sampling
2.3. THg Determination in Seawater and Precipitation
2.4. THg Gradient in Seawater
2.5. Normalization of Wet Deposition
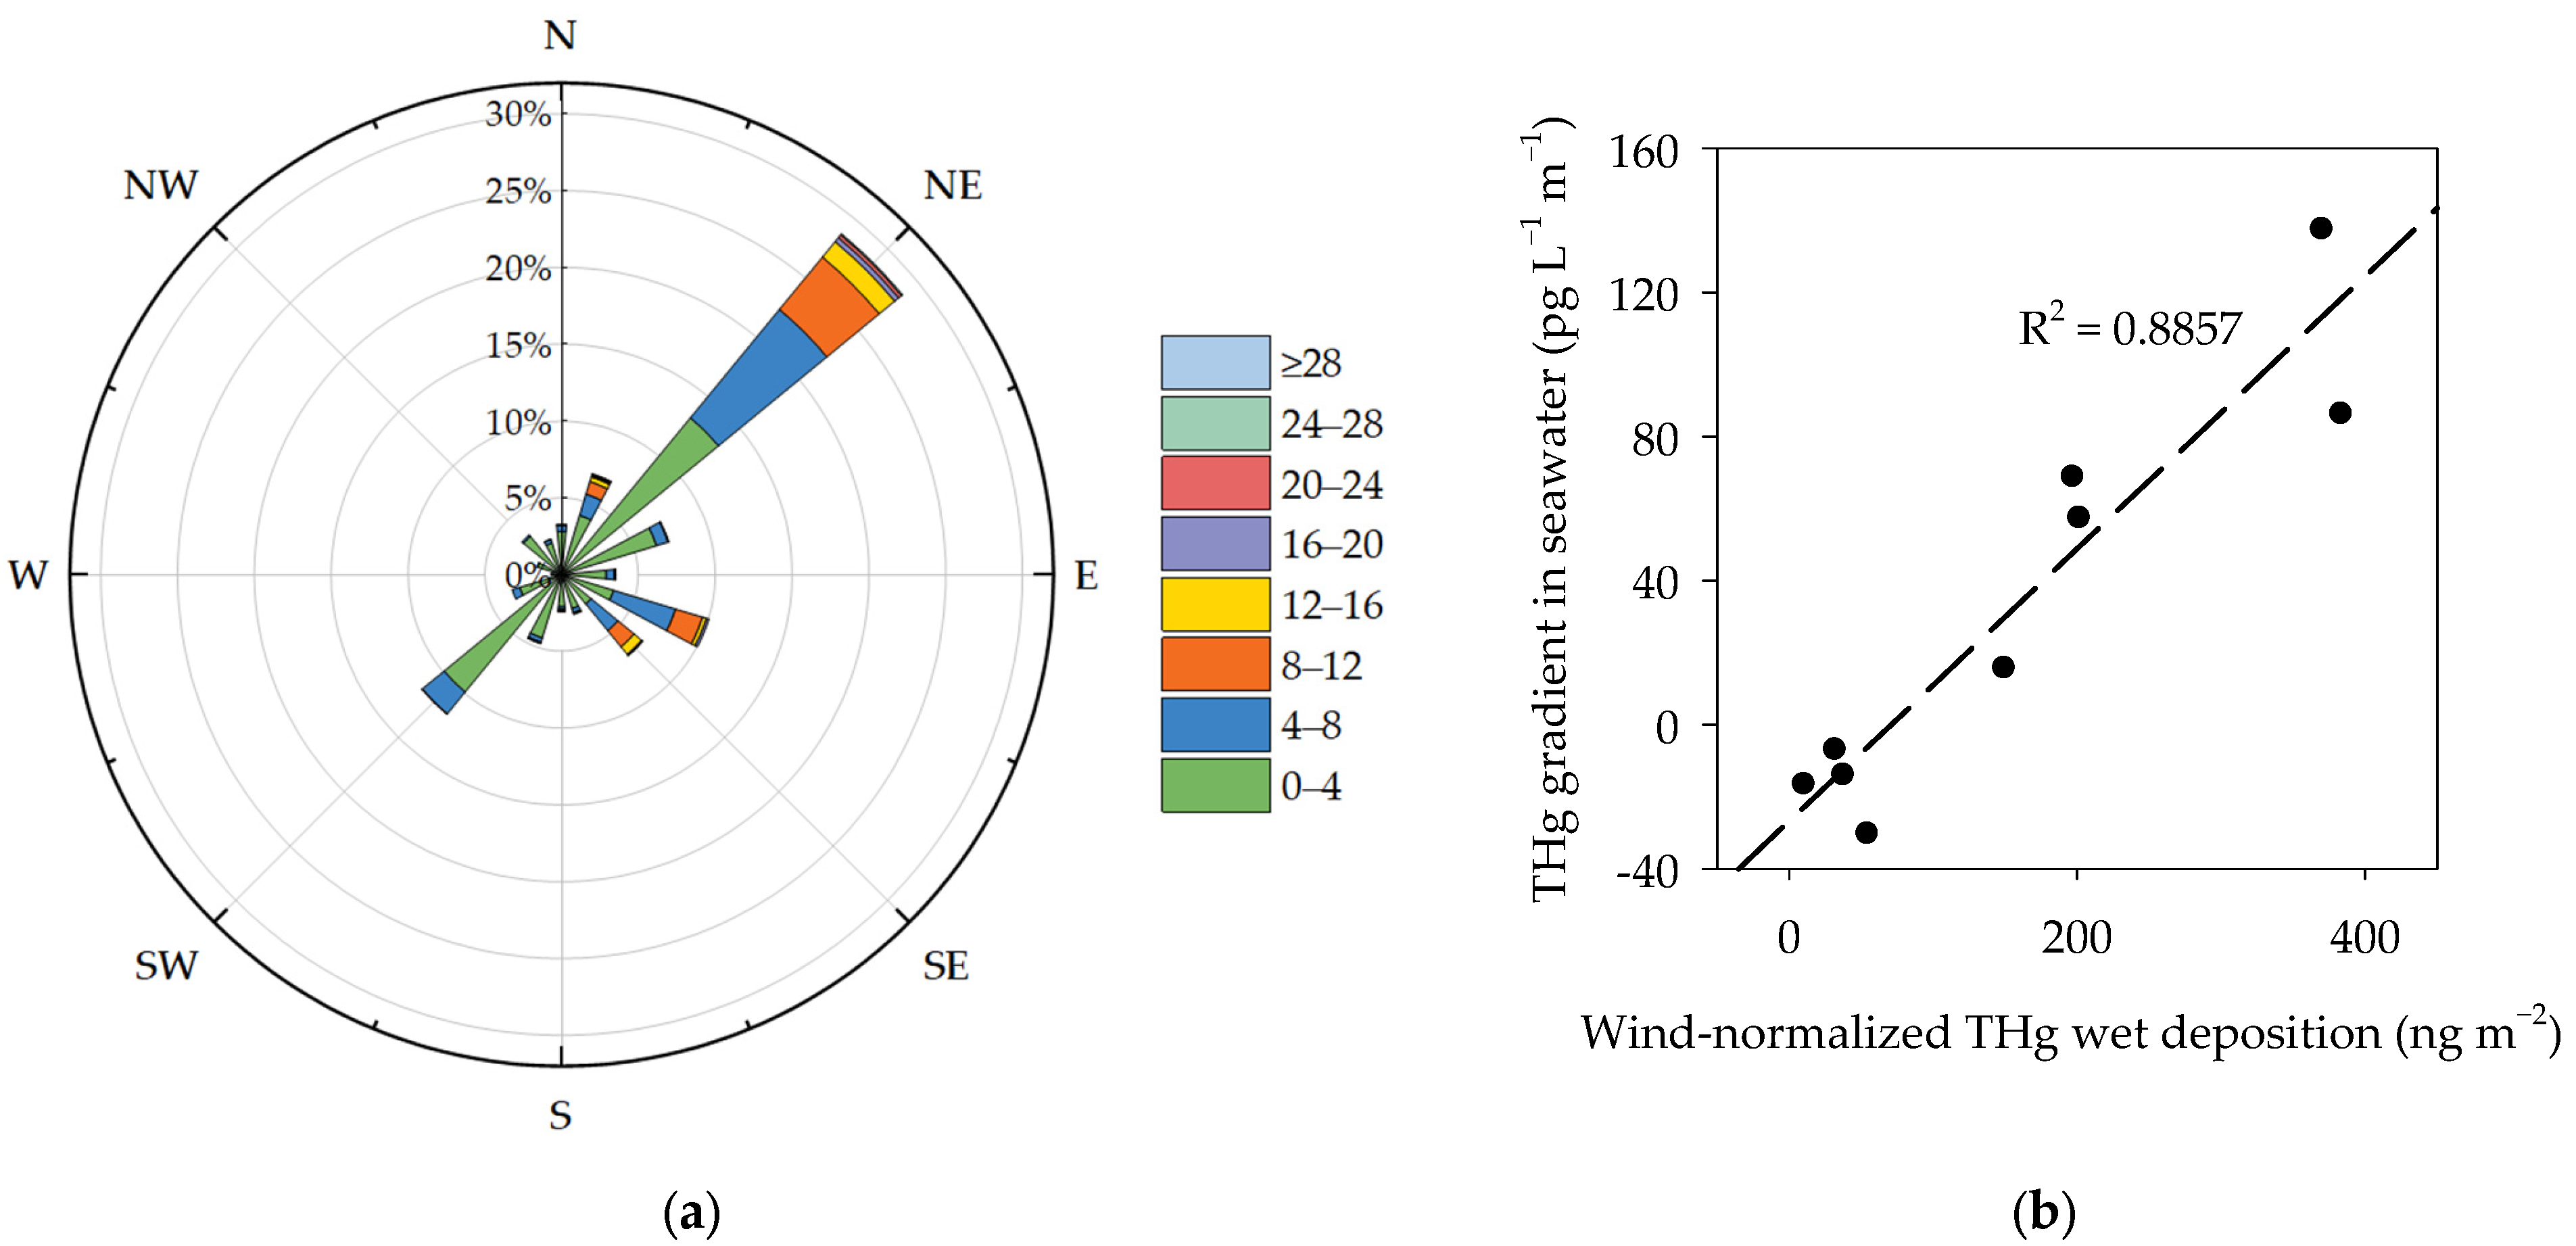
2.6. Wind Data and Normalization of Wet Deposition
3. Results and Discussion
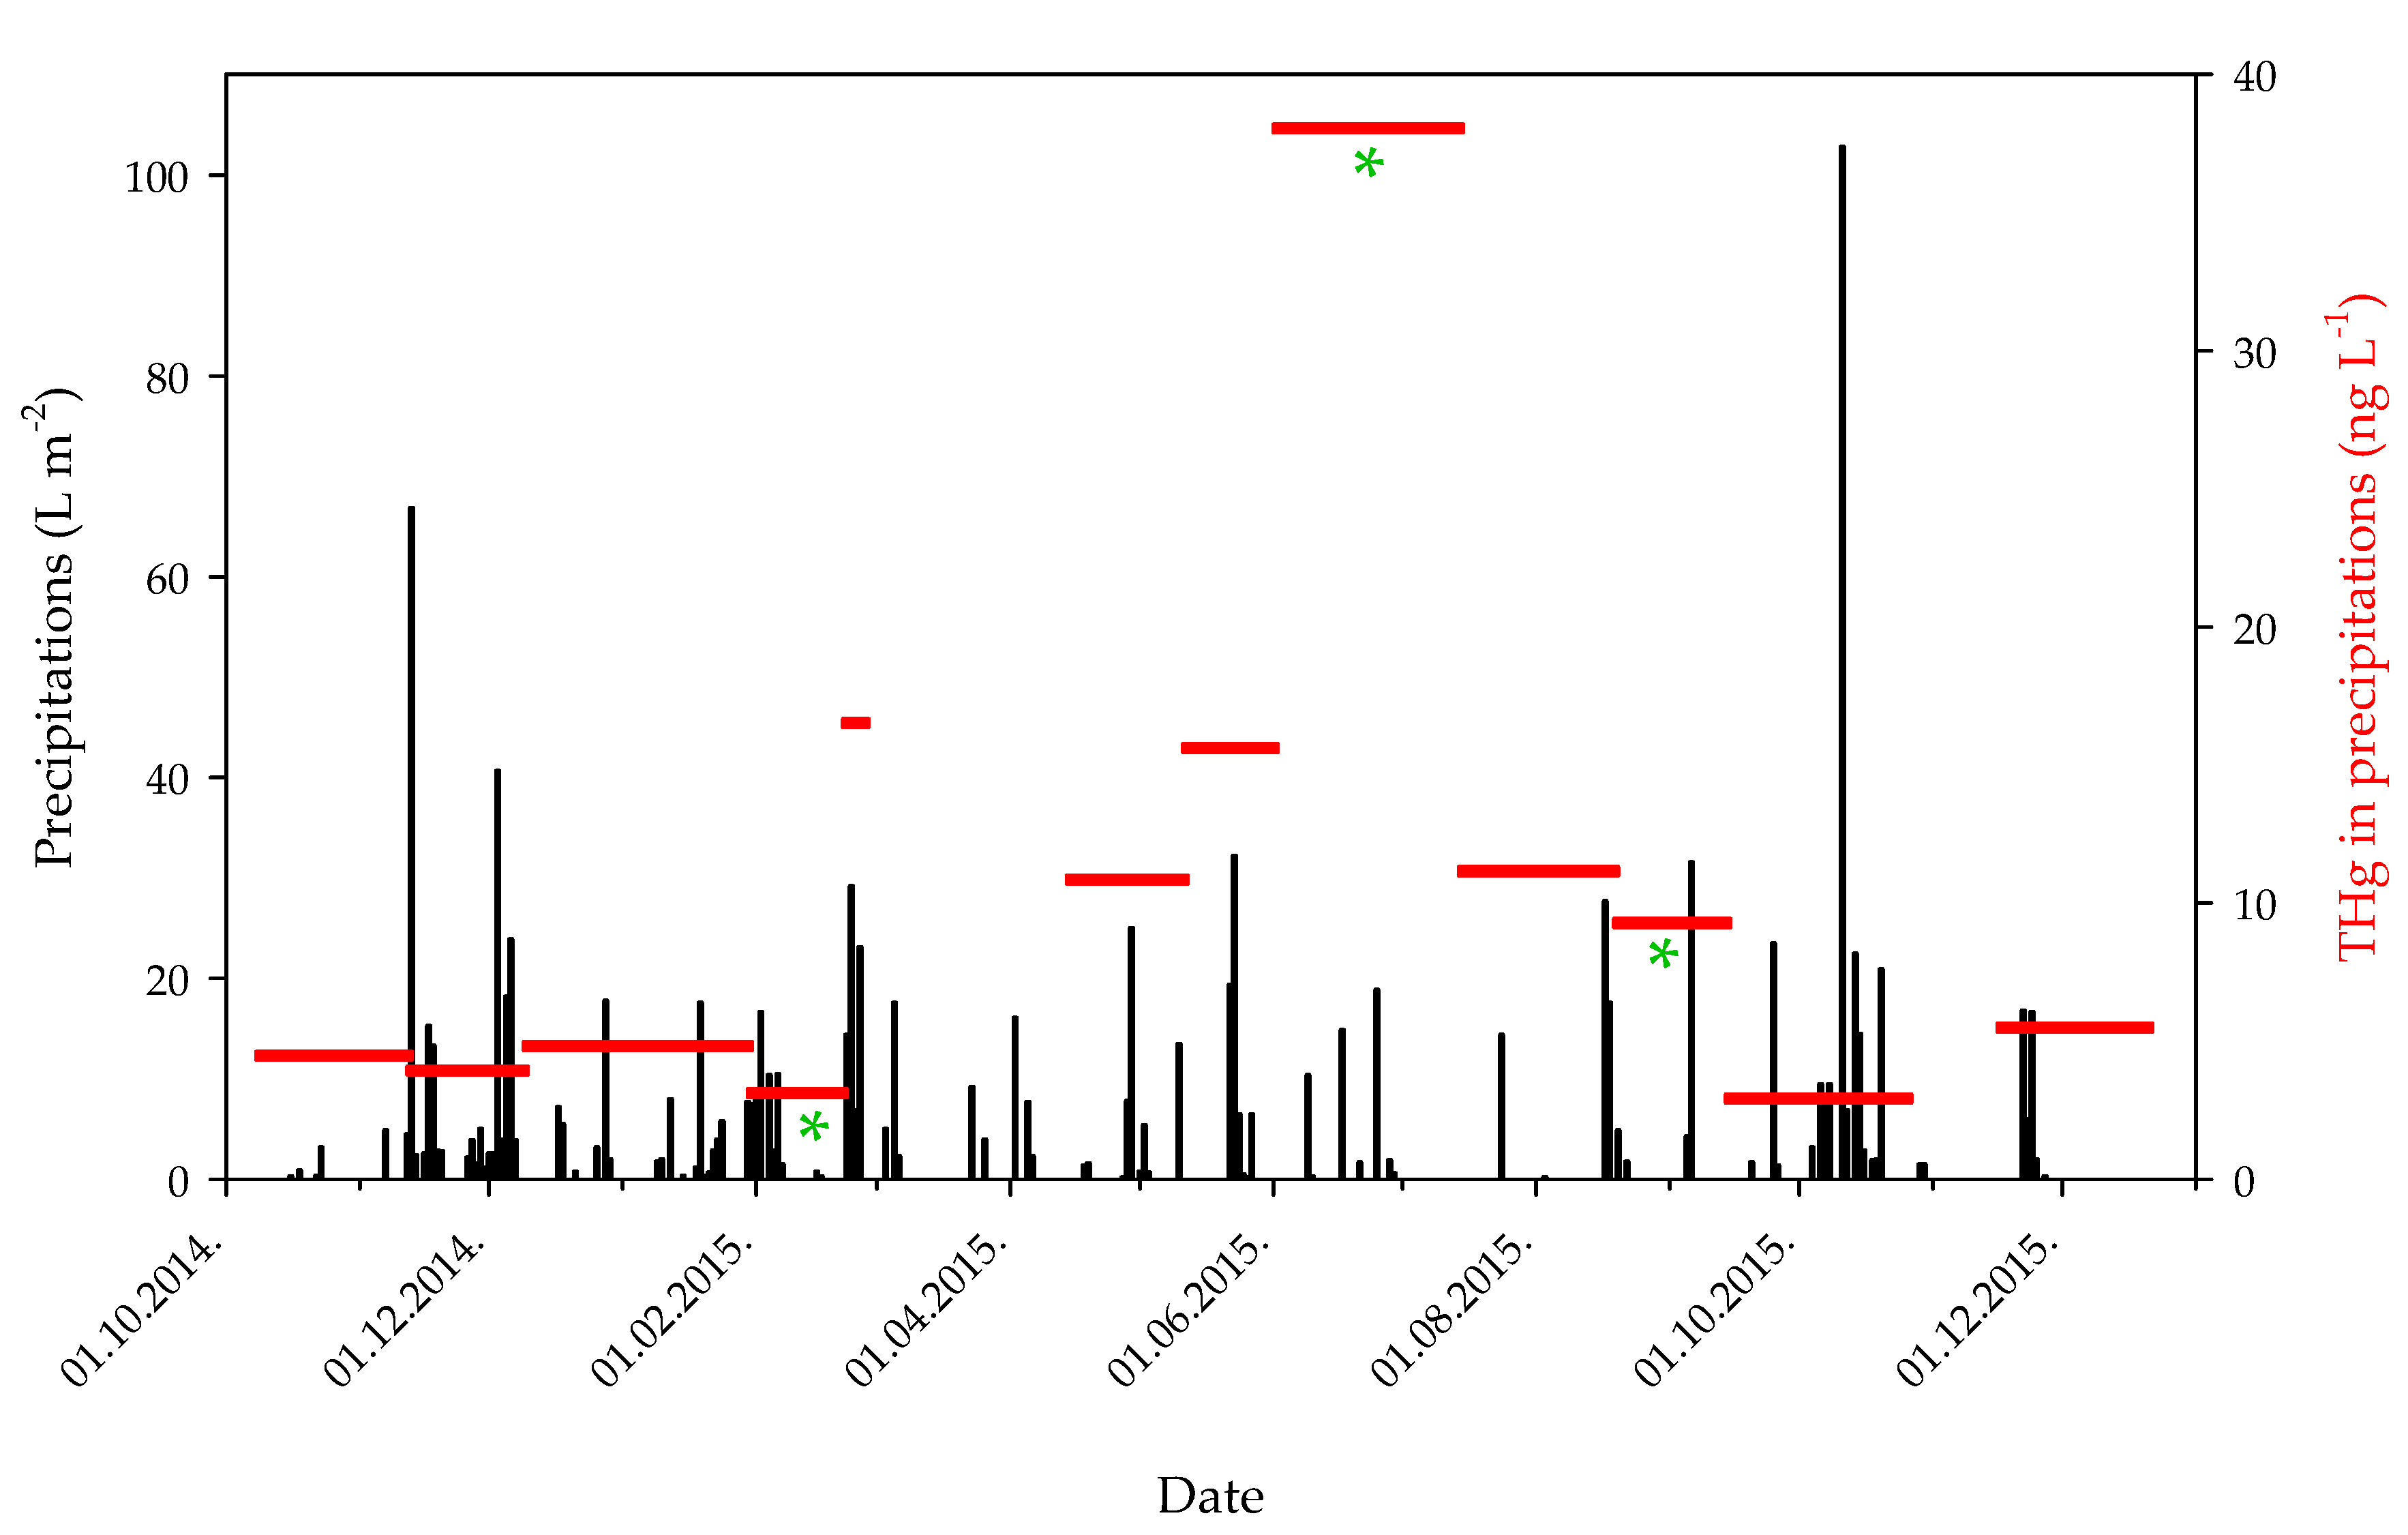
3.1. THg Concentrations in Precipitation
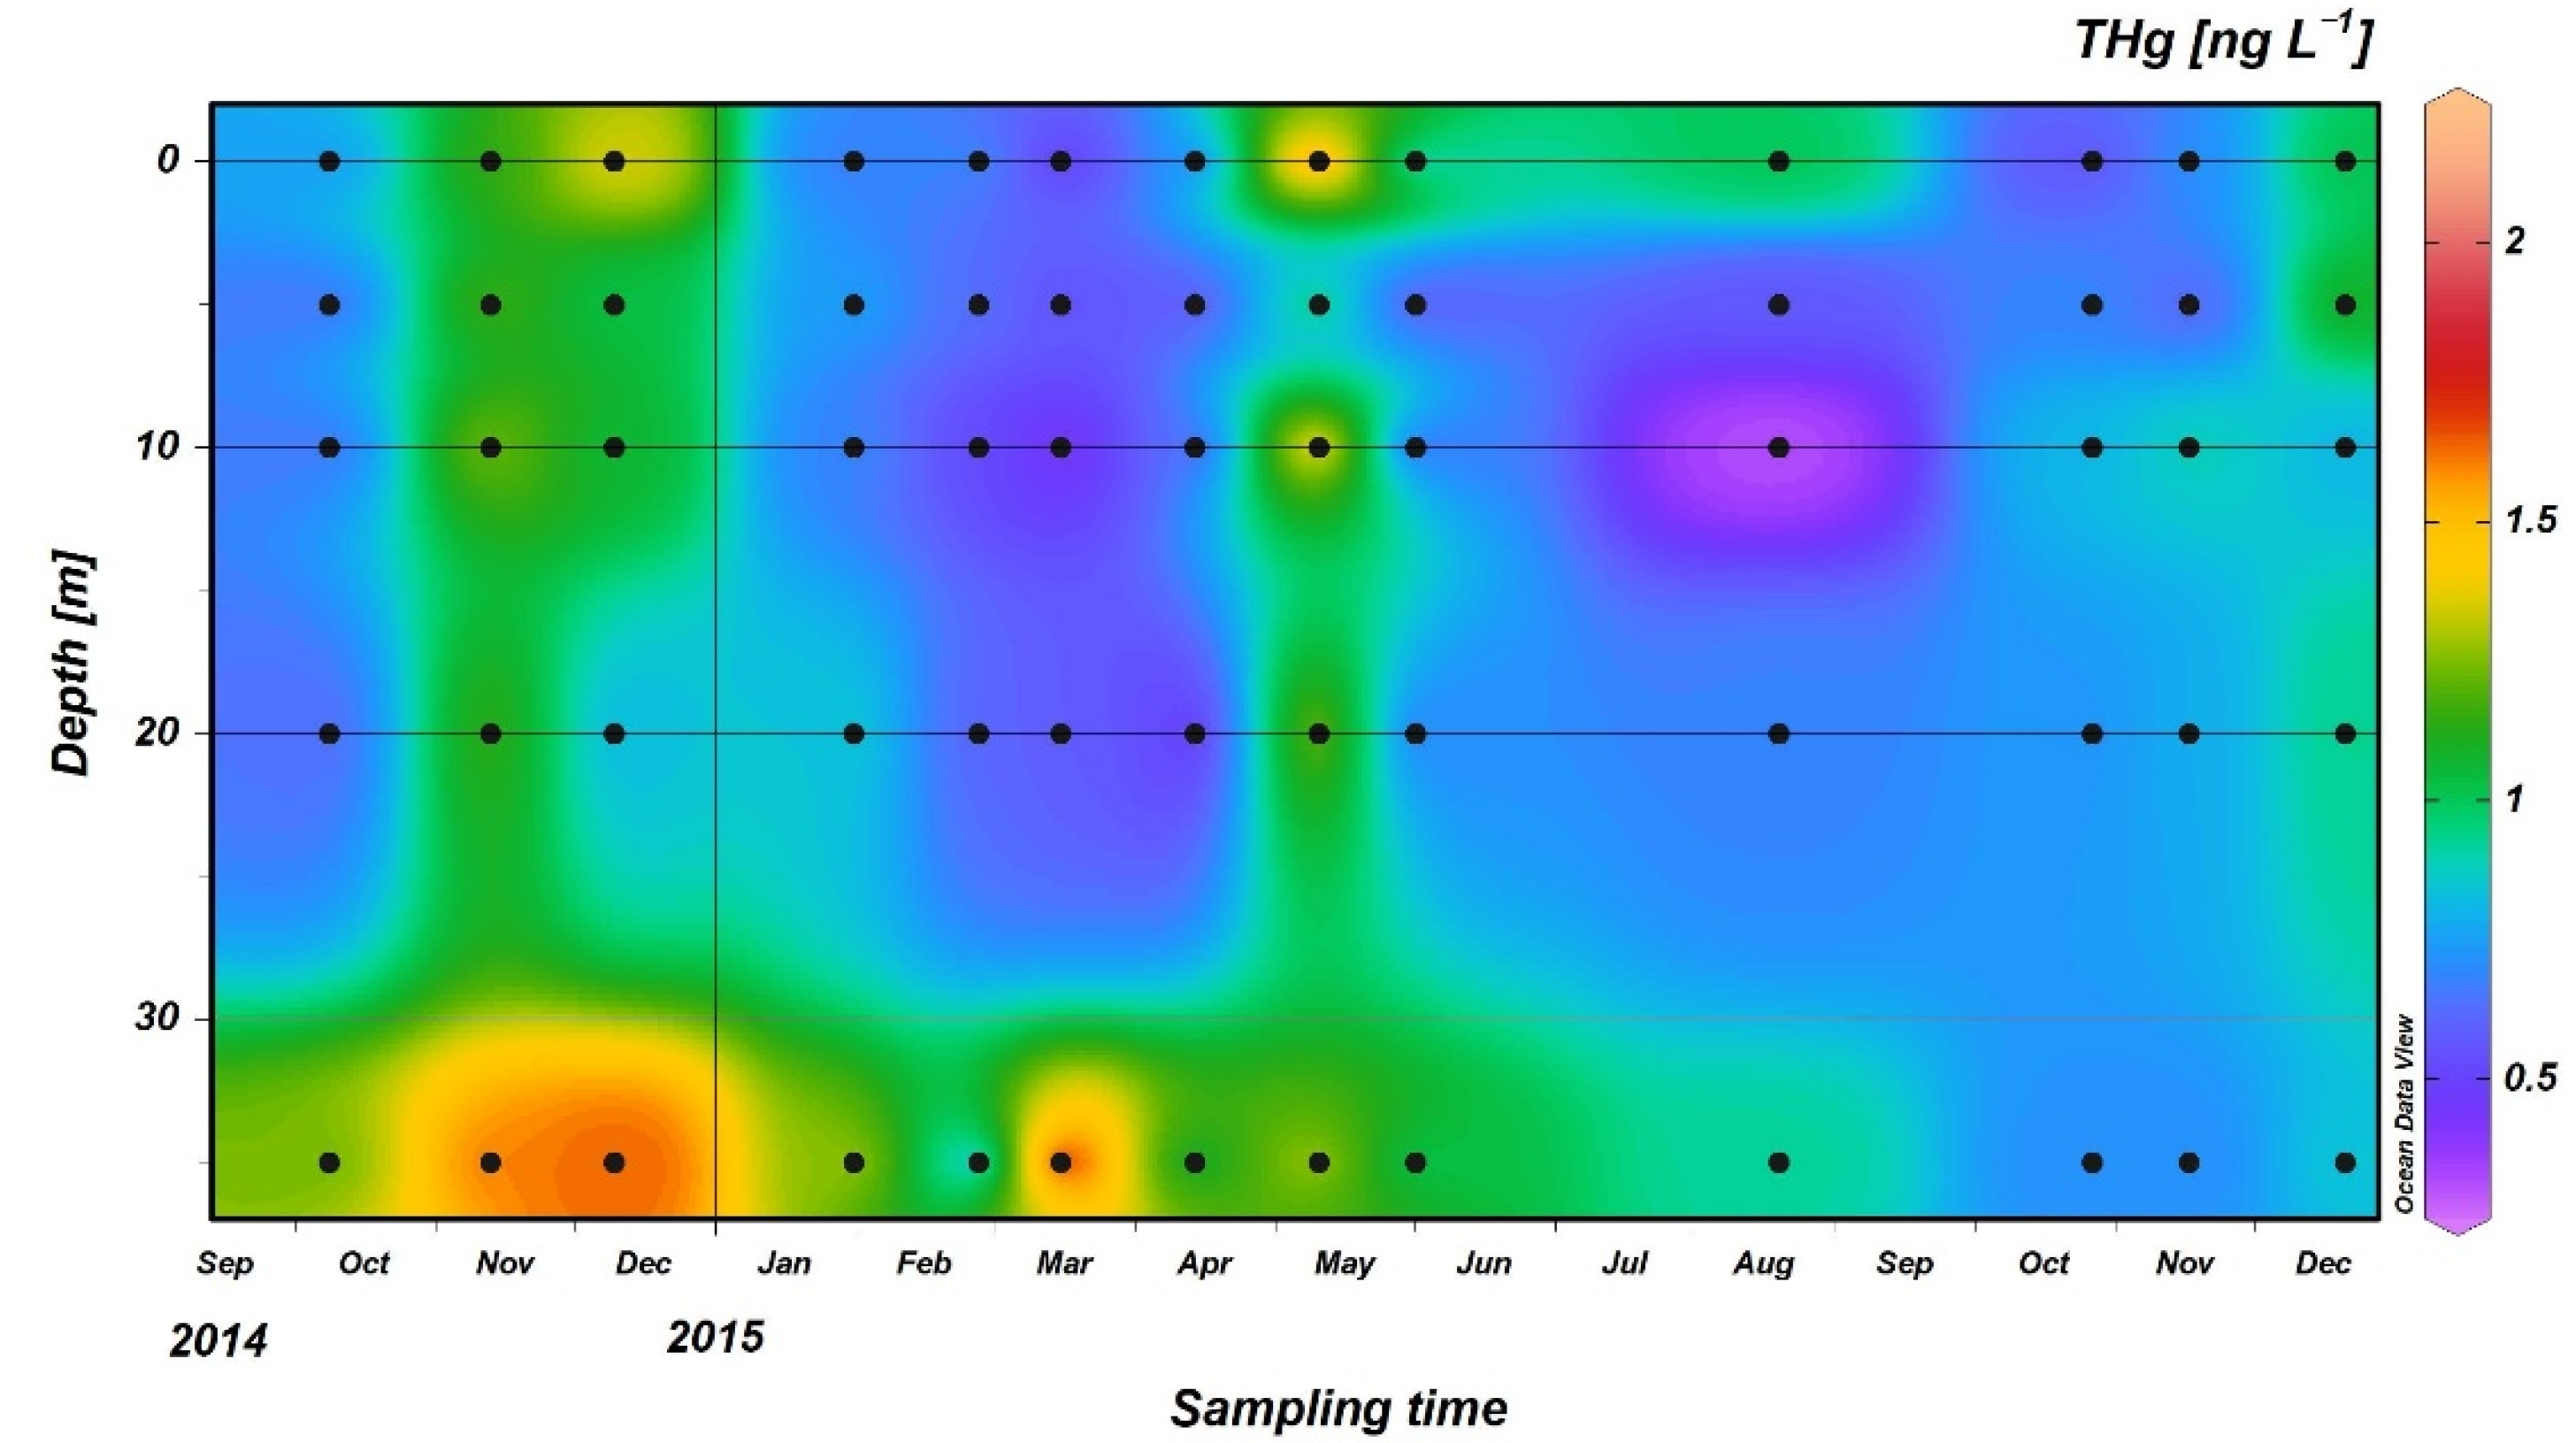
3.2. THg Concentrations in Seawater
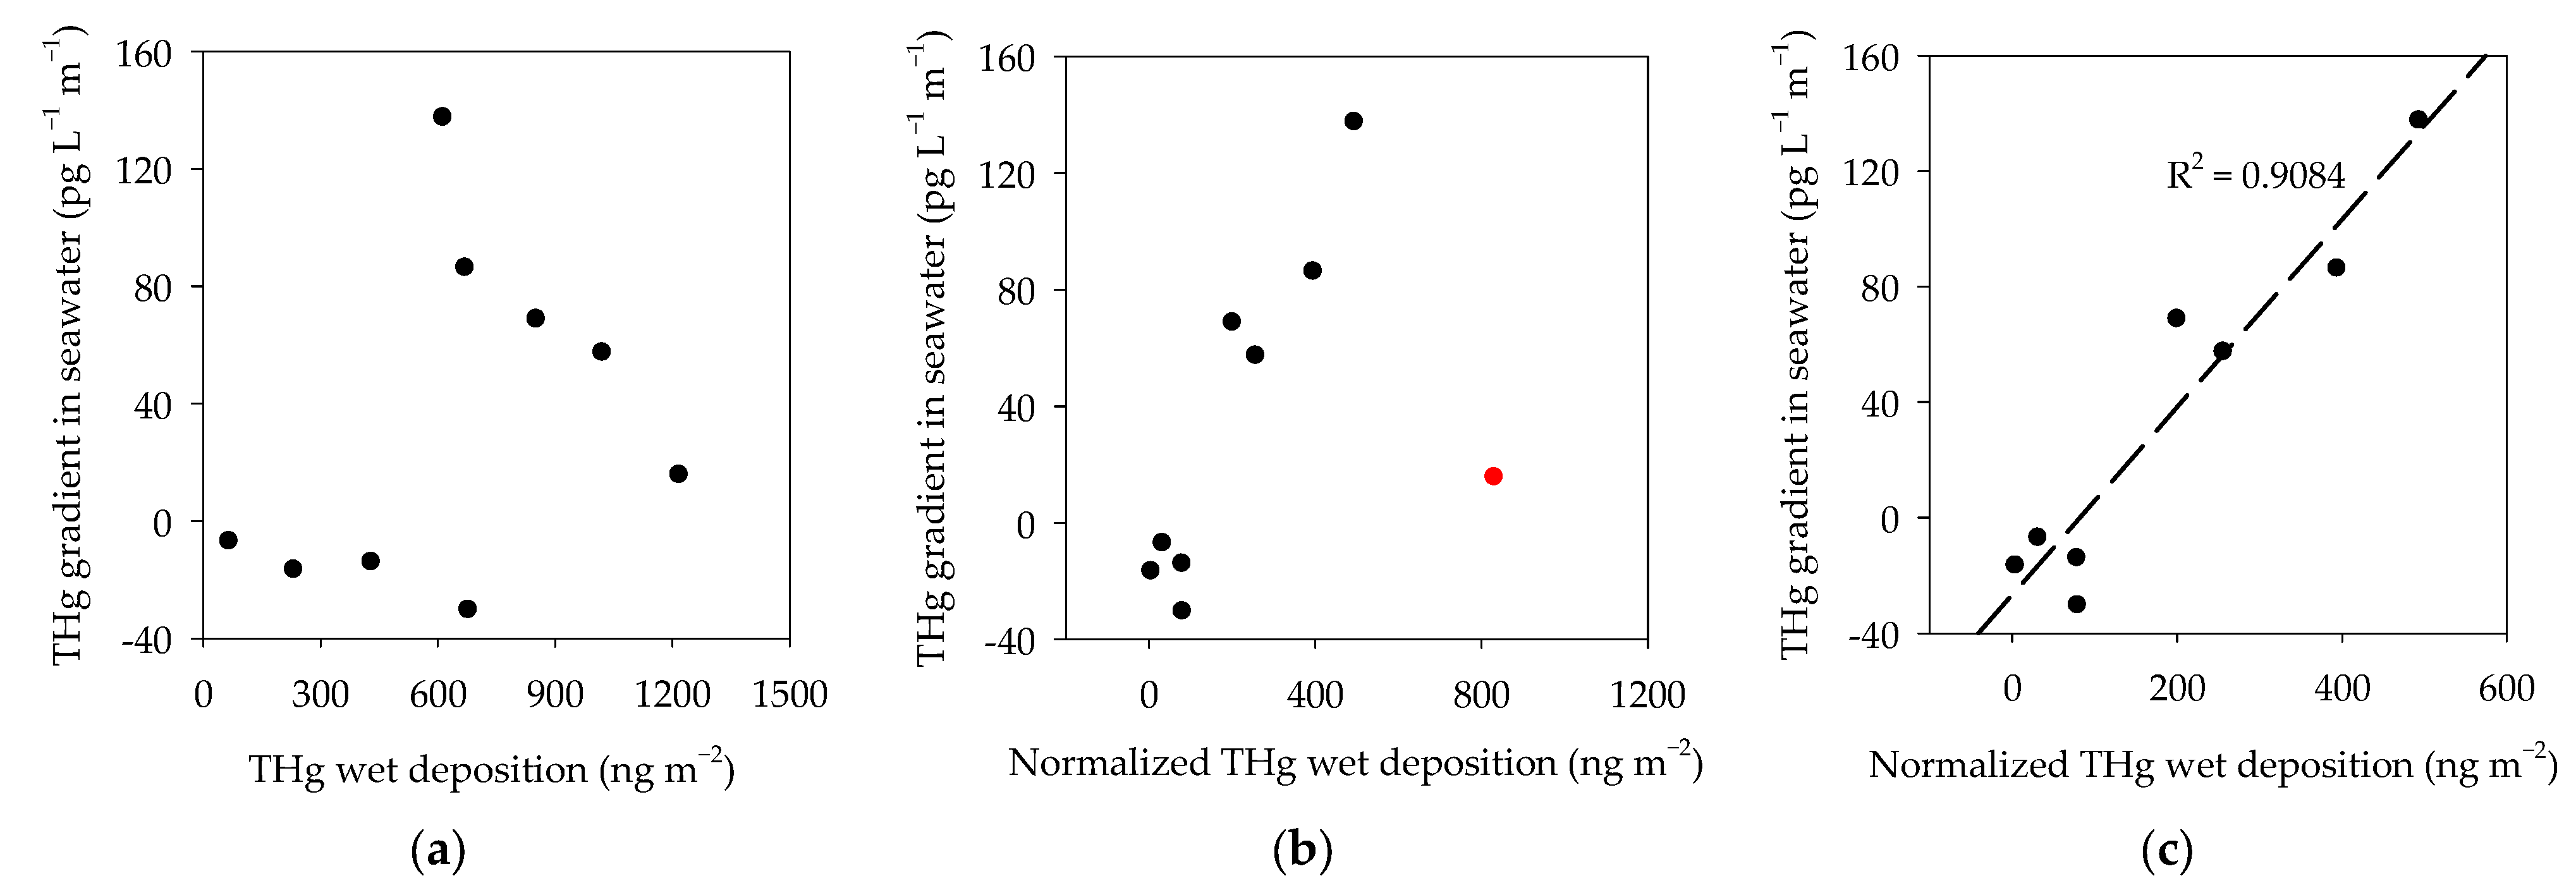
3.3. Relations between THg in Precipitation and Seawater
3.4. Relation between Wind-Normalized Deposition and THg Concentration Gradient
3.5. Known Study Limitations
4. Conclusions
Author Contributions
Funding
Institutional Review Board Statement
Informed Consent Statement
Data Availability Statement
Acknowledgments
Conflicts of Interest
References
- Baumann, Z.; Jonsson, S.; Mason, R.P. Geochemistry of mercury in the marine environment. In Encyclopedia of Ocean Sciences; Cochran, J.K., Bokuniewicz, H., Yager, P., Eds.; Elsevier: Amsterdam, The Netherlands, 2019; pp. 301–308. ISBN 9780080983004. [Google Scholar]
- UNEP. Global Mercury Assessment 2018; UN Environment Programme, Chemicals and Health Branch: Geneva, Switzerland, 2018. [Google Scholar]
- Zhu, S.; Zhang, Z.; Žagar, D. Mercury transport and fate models in aquatic systems: A review and synthesis. Sci. Total Environ. 2018, 639, 538–549. [Google Scholar] [CrossRef] [PubMed]
- Obrist, D.; Kirk, J.L.; Zhang, L.; Sunderland, E.M.; Jiskra, M.; Selin, N.E. A review of global environmental mercury processes in response to human and natural perturbations: Changes of emissions, climate, and land use. Ambio 2018, 47, 116–140. [Google Scholar] [CrossRef] [PubMed] [Green Version]
- Regnell, O.; Watras, C.J. Microbial mercury methylation in aquatic environments: A critical review of published field and laboratory studies. Environ. Sci. Technol. 2019, 53, 4–19. [Google Scholar] [CrossRef]
- Parks, J.M.; Johs, A.; Podar, M.; Bridou, R.; Hurt, R.A.; Smith, S.D.; Tomanicek, S.J.; Qian, Y.; Brown, S.D.; Brandt, C.C.; et al. The genetic basis for bacterial mercury methylation. Science 2013, 339, 1332–1335. [Google Scholar] [CrossRef] [PubMed] [Green Version]
- Munson, K.M.; Lamborg, C.H.; Boiteau, R.M.; Saito, M.A. Dynamic mercury methylation and demethylation in oligotrophic marine water. Biogeosciences 2018, 15, 6451–6460. [Google Scholar] [CrossRef] [Green Version]
- Tamele, I.J.; Vázquez Loureiro, P. Lead, mercury and cadmium in fish and shellfish from the Indian Ocean and Red Sea (African Countries): Public health challenges. J. Mar. Sci. Eng. 2020, 8, 344. [Google Scholar] [CrossRef]
- Vieira, H.C.; Rodrigues, A.C.M.; Soares, A.M.V.M.; Abreu, S.; Morgado, F. Mercury accumulation and elimination in different tissues of zebrafish (Danio rerio) exposed to a mercury-supplemented diet. J. Mar. Sci. Eng. 2021, 9, 882. [Google Scholar] [CrossRef]
- Lyman, S.N.; Cheng, I.; Gratz, L.E.; Weiss-Penzias, P.; Zhang, L. An updated review of atmospheric mercury. Sci. Total Environ. 2020, 707, 135575. [Google Scholar] [CrossRef]
- Enrico, M.; Le Roux, G.; Marusczak, N.; Heimbürger, L.-E.; Claustres, A.; Fu, X.; Sun, R.; Sonke, J.E. Atmospheric mercury transfer to peat bogs dominated by gaseous elemental mercury dry deposition. Environ. Sci. Technol. 2016, 50, 2405–2412. [Google Scholar] [CrossRef] [Green Version]
- Wright, L.P.; Zhang, L.; Marsik, F.J. Overview of mercury dry deposition, litterfall, and throughfall studies. Atmos. Chem. Phys. 2016, 16, 13399–13416. [Google Scholar] [CrossRef]
- Sprovieri, F.; Pirrone, N.; Bencardino, M.; D’Amore, F.; Carbone, F.; Cinnirella, S.; Mannarino, V.; Landis, M.; Ebinghaus, R.; Weigelt, A.; et al. Atmospheric mercury concentrations observed at ground-based monitoring sites globally distributed in the framework of the GMOS network. Atmos. Chem. Phys. 2016, 16, 11915–11935. [Google Scholar] [CrossRef] [PubMed] [Green Version]
- Fu, X.W.; Zhang, H.; Yu, B.; Wang, X.; Lin, C.-J.; Feng, X.B. Observations of atmospheric mercury in China: A critical review. Atmos. Chem. Phys. 2015, 15, 9455–9476. [Google Scholar] [CrossRef] [Green Version]
- Gustin, M.S. Exchange of Mercury between the Atmosphere and Terrestrial Ecosystems. In Environmental Chemistry and Toxicology of Mercury; John Wiley & Sons, Inc.: Hoboken, NJ, USA, 2011; pp. 423–451. [Google Scholar]
- Sprovieri, F.; Pirrone, N.; Bencardino, M.; D’Amore, F.; Angot, H.; Barbante, C.; Brunke, E.G.; Arcega-Cabrera, F.; Cairns, W.; Comero, S.; et al. Five-year records of mercury wet deposition flux at GMOS sites in the Northern and Southern hemispheres. Atmos. Chem. Phys. 2017, 17, 2689–2708. [Google Scholar] [CrossRef] [Green Version]
- Weiss-Penzias, P.S.; Gay, D.A.; Brigham, M.E.; Parsons, M.T.; Gustin, M.S.; ter Schure, A. Trends in mercury wet deposition and mercury air concentrations across the U.S. and Canada. Sci. Total Environ. 2016, 568, 546–556. [Google Scholar] [CrossRef]
- Zhou, H.; Zhou, C.; Hopke, P.K.; Holsen, T.M. Mercury wet deposition and speciated mercury air concentrations at rural and urban sites across New York state: Temporal patterns, sources and scavenging coefficients. Sci. Total Environ. 2018, 637–638, 943–953. [Google Scholar] [CrossRef]
- Lynam, M.M.; Dvonch, J.T.; Barres, J.A.; Landis, M.S.; Kamal, A.S. Investigating the impact of local urban sources on total atmospheric mercury wet deposition in Cleveland, Ohio, USA. Atmos. Environ. 2016, 127, 262–271. [Google Scholar] [CrossRef]
- Holmes, C.D.; Krishnamurthy, N.P.; Caffrey, J.M.; Landing, W.M.; Edgerton, E.S.; Knapp, K.R.; Nair, U.S. Thunderstorms increase mercury wet deposition. Environ. Sci. Technol. 2016, 50, 9343–9350. [Google Scholar] [CrossRef]
- Kaulfus, A.S.; Nair, U.; Holmes, C.D.; Landing, W.M. Mercury wet scavenging and deposition differences by precipitation type. Environ. Sci. Technol. 2017, 51, 2628–2634. [Google Scholar] [CrossRef]
- Selin, N.E.; Jacob, D.J. Seasonal and spatial patterns of mercury wet deposition in the United States: Constraints on the contribution from North American anthropogenic sources. Atmos. Environ. 2008, 42, 5193–5204. [Google Scholar] [CrossRef] [Green Version]
- Cossa, D.; Heimbürger, L.E.; Lannuzel, D.; Rintoul, S.R.; Butler, E.C.V.; Bowie, A.R.; Averty, B.; Watson, R.J.; Remenyi, T. Mercury in the Southern Ocean. Geochim. Cosmochim. Acta 2011, 75, 4037–4052. [Google Scholar] [CrossRef] [Green Version]
- Agather, A.M.; Bowman, K.L.; Lamborg, C.H.; Hammerschmidt, C.R. Distribution of mercury species in the Western Arctic Ocean (U.S. GEOTRACES GN01). Mar. Chem. 2019, 216, 103686. [Google Scholar] [CrossRef]
- Šolić, M.; Krstulović, N.; Šantić, D.; Šestanović, S.; Ordulj, M.; Bojanić, N.; Kušpilić, G. Structure of microbial communities in phosphorus-limited estuaries along the eastern Adriatic coast. J. Mar. Biol. Assoc. United Kingd. 2015, 95, 1565–1578. [Google Scholar] [CrossRef]
- Živković, I.; Kotnik, J.; Šolić, M.; Horvat, M. The abundance, distribution and speciation of mercury in waters and sediments of the Adriatic Sea. Acta Adriat. 2017, 58, 165–186. [Google Scholar] [CrossRef]
- Zvonarić, T. The cycling of Mercury through the marine environment of Kaštela Bay. In Proceedings of the FAO/UNEP/IAEA Consultation Meeting on the Accumulation and Transformation of Chemical Contaminants by Biotic and Abiotic Processes in the Marine Environment, La Spezia, Italy, 24–28 September 1990; Gabrielides, G.P., Ed.; UNEP/FAO/IAEA: Athens, Greece, 1991; pp. 369–381. [Google Scholar]
- Kwokal, Ž.; Frančišković-Bilinski, S.; Bilinski, H.; Branica, M. A comparison of anthropogenic mercury pollution in Kaštela Bay (Croatia) with pristine estuaries in Öre (Sweden) and Krka (Croatia). Mar. Pollut. Bull. 2002, 44, 1152–1157. [Google Scholar] [CrossRef]
- Zore-Armanda, M. Some dynamic and hydrographic properties of the Kastela Bay. Acta Adriat. 1980, 21, 55–74. [Google Scholar]
- Coale, K.H.; Heim, W.A.; Negrey, J.; Weiss-Penzias, P.; Fernandez, D.; Olson, A.; Chiswell, H.; Byington, A.; Bonnema, A.; Martenuk, S.; et al. The distribution and speciation of mercury in the California current: Implications for mercury transport via fog to land. Deep Sea Res. Part. II Top. Stud. Oceanogr. 2018, 151, 77–88. [Google Scholar] [CrossRef]
- Penezić, A.; Milinković, A.; Bakija Alempijević, S.; Žužul, S.; Frka, S. Atmospheric deposition of biologically relevant trace metals in the eastern Adriatic coastal area. Chemosphere 2021, 283, 131178. [Google Scholar] [CrossRef]
- Schlitzer, R. Ocean Data View. Available online: https://odv.awi.de (accessed on 15 July 2019).
- Živković, I.; Fajon, V.; Kotnik, J.; Shlyapnikov, Y.; Obu Vazner, K.; Begu, E.; Šestanović, S.; Šantić, D.; Vrdoljak, A.; Jozić, S.; et al. Relations between mercury fractions and microbial community components in seawater under the presence and absence of probable phosphorus limitation conditions. J. Environ. Sci. 2019, 75, 145–162. [Google Scholar] [CrossRef]
- US EPA. Method 1631. Revision E: Mercury in Water by Oxidation, Purge and Trap, and Cold Vapor Atomic Fluorescence Spectrometry; US EPA: Washington, DC, USA, 2002. [Google Scholar]
- Bryant, K.; Akbar, M. An exploration of wind stress calculation techniques in hurricane storm surge modeling. J. Mar. Sci. Eng. 2016, 4, 58. [Google Scholar] [CrossRef]
- Siudek, P.; Kurzyca, I.; Siepak, J. Atmospheric deposition of mercury in central Poland: Sources and seasonal trends. Atmos. Res. 2016, 170, 14–22. [Google Scholar] [CrossRef]
- Yuan, S.; Chen, J.; Cai, H.; Yuan, W.; Wang, Z.; Huang, Q.; Liu, Y.; Wu, X. Sequential samples reveal significant variation of mercury isotope ratios during single rainfall events. Sci. Total Environ. 2018, 624, 133–144. [Google Scholar] [CrossRef] [PubMed]
- Kotnik, J.; Horvat, M.; Ogrinc, N.; Fajon, V.; Žagar, D.; Cossa, D.; Sprovieri, F.; Pirrone, N. Mercury speciation in the Adriatic Sea. Mar. Pollut. Bull. 2015, 96, 136–148. [Google Scholar] [CrossRef] [PubMed]
- Zhang, L.; Blanchard, P.; Gay, D.A.; Prestbo, E.M.; Risch, M.R.; Johnson, D.; Narayan, J.; Zsolway, R.; Holsen, T.M.; Miller, E.K.; et al. Estimation of speciated and total mercury dry deposition at monitoring locations in eastern and central North America. Atmos. Chem. Phys. 2012, 12, 4327–4340. [Google Scholar] [CrossRef] [Green Version]
- Engle, M.A.; Tate, M.T.; Krabbenhoft, D.P.; Schauer, J.J.; Kolker, A.; Shanley, J.B.; Bothner, M.H. Comparison of atmospheric mercury speciation and deposition at nine sites across central and eastern North America. J. Geophys. Res. 2010, 115, D18306. [Google Scholar] [CrossRef]
- Brown, R.J.C.; Pirrone, N.; van Hoek, C.; Horvat, M.; Kotnik, J.; Wangberg, I.; Corns, W.T.; Bieber, E.; Sprovieri, F. Standardisation of a European measurement method for the determination of mercury in deposition: Results of the field trial campaign and determination of a measurement uncertainty and working range. Accredit. Qual. Assur. 2010, 15, 359–366. [Google Scholar] [CrossRef]
- Monperrus, M.; Tessier, E.; Amouroux, D.; Leynaert, A.; Huonnic, P.; Donard, O.F.X. Mercury methylation, demethylation and reduction rates in coastal and marine surface waters of the Mediterranean Sea. Mar. Chem. 2007, 107, 49–63. [Google Scholar] [CrossRef]
- Dill, C.; Kuiken, T.; Zhang, H.; Ensor, M. Diurnal variation of dissolved gaseous mercury (DGM) levels in a southern reservoir lake (Tennessee, USA) in relation to solar radiation. Sci. Total Environ. 2006, 357, 176–193. [Google Scholar] [CrossRef]
- Crocker, W.C.; Zhang, H. Seasonal and diurnal variation of air/water exchange of gaseous mercury in a Southern Reservoir Lake (Cane Creek Lake, Tennessee, USA). Water 2020, 12, 2102. [Google Scholar] [CrossRef]
- Andersson, M.E.; Gårdfeldt, K.; Wängberg, I.; Sprovieri, F.; Pirrone, N.; Lindqvist, O. Seasonal and daily variation of mercury evasion at coastal and off shore sites from the Mediterranean Sea. Mar. Chem. 2007, 104, 214–226. [Google Scholar] [CrossRef]


Publisher’s Note: MDPI stays neutral with regard to jurisdictional claims in published maps and institutional affiliations. |
© 2022 by the authors. Licensee MDPI, Basel, Switzerland. This article is an open access article distributed under the terms and conditions of the Creative Commons Attribution (CC BY) license (https://creativecommons.org/licenses/by/4.0/).
Share and Cite
Živković, I.; Gačnik, J.; Jozić, S.; Kotnik, J.; Šolić, M.; Horvat, M. A Simplified Approach to Modeling the Dispersion of Mercury from Precipitation to Surface Waters—The Bay of Kaštela Case Study. J. Mar. Sci. Eng. 2022, 10, 539. https://doi.org/10.3390/jmse10040539
Živković I, Gačnik J, Jozić S, Kotnik J, Šolić M, Horvat M. A Simplified Approach to Modeling the Dispersion of Mercury from Precipitation to Surface Waters—The Bay of Kaštela Case Study. Journal of Marine Science and Engineering. 2022; 10(4):539. https://doi.org/10.3390/jmse10040539
Chicago/Turabian StyleŽivković, Igor, Jan Gačnik, Slaven Jozić, Jože Kotnik, Mladen Šolić, and Milena Horvat. 2022. "A Simplified Approach to Modeling the Dispersion of Mercury from Precipitation to Surface Waters—The Bay of Kaštela Case Study" Journal of Marine Science and Engineering 10, no. 4: 539. https://doi.org/10.3390/jmse10040539
APA StyleŽivković, I., Gačnik, J., Jozić, S., Kotnik, J., Šolić, M., & Horvat, M. (2022). A Simplified Approach to Modeling the Dispersion of Mercury from Precipitation to Surface Waters—The Bay of Kaštela Case Study. Journal of Marine Science and Engineering, 10(4), 539. https://doi.org/10.3390/jmse10040539