Abstract
Recently, the demand for floating solar power farms in lakes and coasts (rather than on land) has been increasing rapidly. It is important to develop a numerical analysis technique that considers environmental conditions to predict structural stability and accurate motion response while designing a floating solar power farm. In this study, we performed a comparison under conditions similar to those of the Inha University towing tank (IUTT) model test to verify the numerical analysis method. The results revealed that heave and pitch movements were dominant under head sea conditions. Relative behavior occurred because of the hinge connection of each unit, and complex motion characteristics appeared depending on the wave conditions. The numerical method was verified based on the motion response and load of the floating solar farm. The validity of the results was also confirmed.
1. Introduction
With a new climate system that replaces the Kyoto Protocol, which expired in 2020, the Paris Climate Agreement has been applied since January 2021, which includes strengthening global warming control targets and reducing greenhouse gas emissions. As follow, various policies have been enacted to encourage the development of new renewable energy sources to reduce greenhouse gas emissions.
In addition to international treaties, South Korea is promoting a “Renewable Energy 3020” policy to increase the ratio of renewable-energy power generation by 2030. The goal of the policy is to increase the renewable energy power generation ratio by 20% or more, and to supply over 95% of the capacity of the newly installed platform with clean energy such as solar and wind power [1]. Since 2012, the Renewable Portfolio Standard (RPS), which mandates a certain percentage of power generation as new renewable energy for industrialization such as solar power, wind power, and hydrogen, has also been enforced [2].
Recently, in the case of solar power generation, the demand for installation on water (e.g., lakes, coasts, and on the sea) is increasing rapidly due to the lack of installation area on land. It is more convenient to secure space on water and in the sea than on land, minimizes the effect of natural disasters, and eases the development large-scale power generation complexes [3].A floating solar power farm system is frequently used as a unified platform considering its installation convenience, expandability, and mobility.
On the other hand, since the coast and sea are exposed directly to natural disturbance (e.g., seawater, wind, and waves), technologies that can minimize the effects of waves and actively reduce fluctuations are needed [4,5,6]. Owing to the periodic motion of waves, fatigue loads are generated on structures (e.g., floating bodies, supporting frames, panels, and coupling devices), and a design is needed for supporting structures considering structural stability. To consider the stability of a floating solar power generation system, experiments and numerical studies on the motion performance and connections between adjacent platforms are still underway.
Oliveira-Pinto et al. [7] provided a literature review on the applicability of floating solar power farms and introduced the technologies currently available, as well as the technical challenges and risk factors when designing studies in the marine environment.
Sahu et al. [8] illustrated the concept and advantages of floating solar power systems and studied each component of solar power systems. The environmental loads can cause deformation and stress in the module, causing microcracks and reducing productivity and durability. The technology of thin-film research was proposed to withstand harsh environmental conditions. It was noted that remote sensing and GIS (geographic information system)-based technologies can be utilized to determine the potential of solar panels.
The floating structure uses individual HDPE (high-density polyethylene), and the floating bodies were connected to a pin. It was said that the connection part was weak due to environmental factors. When this connector is exposed to high wave heights, stress concentration could occur and cause system problems. It was shown that the behavior of floating systems is complex [9,10].
Shi et al. [11] introduced a network modeling method for the dynamic prediction of multi-module floating structures and conducted it experimentally in the wave. The connector was made on three-axis motion, and RAOs (response amplitude operator) were compared at various frequencies through the experiment. Recently, the SCOTRA company developed a connector system that allows floating bodies to have their own motility in all directions.
When waves interact with a floating solar power farm (FSP), the motions of the FSP generate inertial forces and dynamic loads on the structures. Non-linear effects make it difficult to predict what will happen on the platforms. It could increase the motion response complexity exponentially of floating bodies. Therefore, recent studies are trying to predict the motion of the system using the using the computational fluid dynamics (CFD) [12,13].
All previous studies have stated that it is important to predict the load at the design stage due to the non-linear environmental factors that affect the FSP depending on the wave conditions. Also, it is necessary to consider motion response with different FSP components (e.g., connecting method, the type of mooring system, the array of floating bodies, and the position and angle of the solar panel).
In this study, we focused on the motion response and tried to understand the relative motion that may occur in a unit platform. Owing to the establishment of numerical techniques, the simulations were performed for a floating solar power farm in the form of a unit under wave conditions. Uniaxial hinge and catenary techniques were applied to the connector and mooring system to determine the motion performance of the floating solar power farm for six degrees of freedom (6DOF). This was verified by an experiment conducted in the Inha University towing tank (IUTT). It investigated fluid forces such as load and pressure distribution, which are difficult to determine using the experiment.
2. Experimental Method
CFD is essential for evaluating the wave load and motion performance of an FSP in a real sea area. In addition, a model test is performed to verify the numerical analysis method.
2.1. Geometry of a Floating Solar Power Farm
In general, an FSP consists of a floating body, a frame bar that supports the floating body, and a solar panel. In this study, the FSP components for the model test were designed as shown in Figure 1. The floating body has a length, breadth, and depth of 0.12 m, 0.105 m, and 0.12 m, respectively.

Figure 1.
Geometry of a floating solar power farm used in the experiment: (a) floating body; (b) unit; (c) block.
The unit consists of nine floating bodies. These were designed as cuboids for convenient production. To understand the relative behavior between units under wave conditions, two-row and two-column matrix forms were combined and called a block. Table 1 lists the specifications of the FSP components. In addition, a uniaxial hinge system with a length of 50 mm was constructed so that relative behavior between units could be investigated. The position of the connector was installed on the parallel line where the frame bars were located. Figure 2 shows the overall geometry of the model tested in this study.

Table 1.
Main particulars of a floating solar power farm.
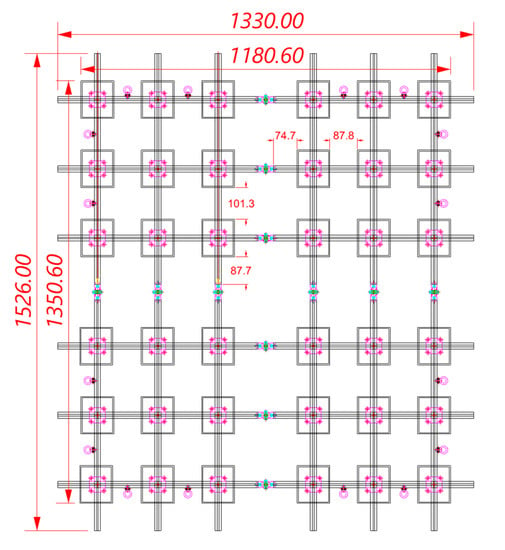
Figure 2.
Schematic of the floating solar power farm in the experiment.
2.2. Experimental Setup and Procedure
The experiment in this study was conducted in the IUTT (see Figure 3). The IUTT consists of a wave maker that can generate a maximum wavelength of 2.0 m and wave height of 0.2 m; a wave absorber; and a concrete tank that has a length, breadth, and depth of 50 m, 3.5 m, and 1.5 m, respectively. The breadth of the FSP at the waterline is about 1.1806 m (see Figure 2). The model size was selected to minimize the effect of blockage.
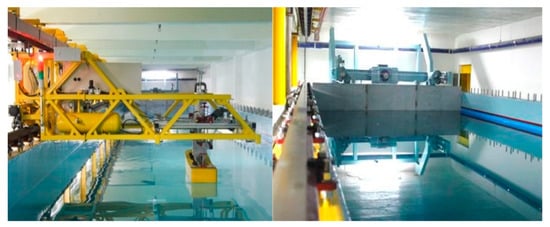
Figure 3.
The towing tank in Inha University.
The movement of the FSP was extracted as time-series data using a camera (OptiTrack Prime X13, Motion Technologies, Inc., Seoul, Republic of Korea) considering its high frequency, accuracy, and convenient installation. Four cameras were used in this study to capture motion based on the principle that infrared light emitted from a camera is reflected by a marker and sensed by the camera. The camera tracks the marker with positional errors less than ± 0.2 mm and rotational errors less than 0.5°. To keep the position of the FSP, weights and wires were used as anchors and mooring lines. The 7 × 7 stainless-steel wires had a diameter of 1.2 mm, an axial stiffness of 565.2 N/m, and a weight of 0.0063 kg/m. The mooring line connection in the FSP was placed in the center of the frame bar connection the floating bodies. The anchor was fixed at a parallel position 1.5 m away from those positions, and the length of the mooring line was set to 1.9 m.
In general, the mooring system of the FSP is a taut spread to restrain its motion. However, since the water depth could be changed according to the tide condition, the mooring system in this study was assumed to be a catenary mooring considering a loosened state at low tide.
A one-component force meter has been manufactured to measure tension up to 50 N with a linearity, hysteresis, and reproducibility of 0.7%, −0.4%, and 0.6%, respectively. A tension gauge was installed on the upstream mooring lines of the FSP.
As shown in Table 2, the experimental conditions were selected within the range that can be experimented with using the IUTT. refers to the waterline length of a unit in the x-direction. Two incident wave angles (139°, 180°), two wave steepnesses ( = 0.03, 0.05), and wavelength ratios ( = 1.6–3.2) were considered in the experiment. Here, is the wavelength and is the wave height. Only regular waves were used.

Table 2.
Test conditions of the experiment.
Schematic diagrams of the model test of the FSP under wave conditions are shown in Figure 4 and Figure 5. The direction of wave travel, direction from the FSP toward its right, and direction opposite to that of gravity were set as the positive x-, y-, and z-directions. An ultrasonic wave height meter was installed 2.0 in front of the FSP to ensure the reliability of the waves generated by real-time wave height information. The first and second rows were defined as the first and second groups, respectively. The experimental setup of the test model of the FSP under wave conditions is shown in Figure 6.
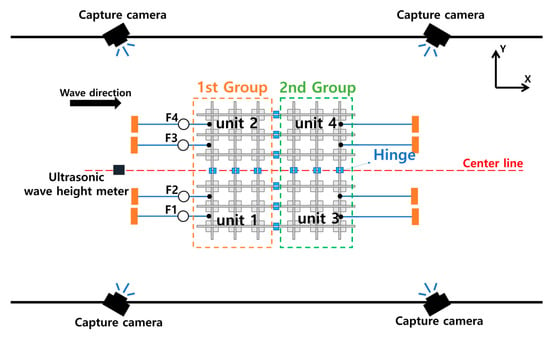
Figure 4.
Diagram of the experimental setup for head sea conditions.
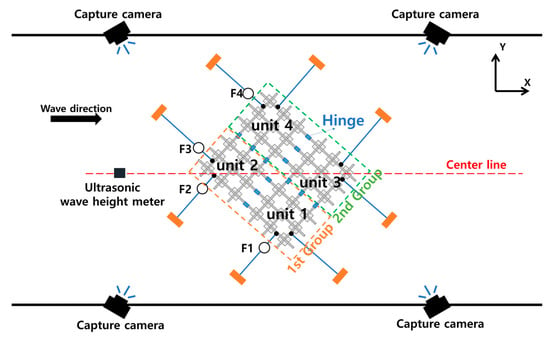
Figure 5.
Diagram of the experimental setup for oblique sea conditions.
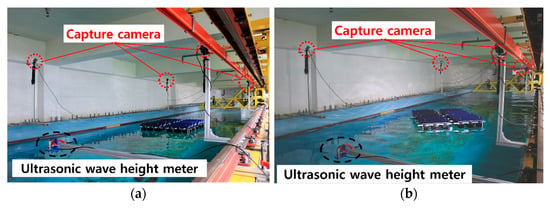
Figure 6.
Experimental setup: (a) head sea conditions; (b) oblique sea condition.
3. Numerical Modeling
3.1. Governing Equations
In this study, the flow around the FPS was assumed to be an incompressible turbulent flow. The continuity equation and Reynolds average Navier–Stokes (RANS) equations were used as the governing equations. These can be expressed as shown in Equations (1) and (2):
where is the three-dimensional velocity vector in the x, y, and z directions. is the mean component and , , , and are the pressure, density, dynamic viscosity, and body-force per mass, respectively. The left-hand side of this equation represents the variation in the mean momentum of a fluid element owing to the unsteadiness in the mean flow and convection by the mean flow owing to the fluctuating velocity field. It is generally referred to as the Reynolds stress. The nonlinear Reynolds stress term requires additional modeling to close the RANS equation for solving. In this study, the turbulence model was used.
3.2. Numerical Method and Setup
The commercial CFD program STAR-CCM + v15.06 [14] was used to determine the motion and load characteristics of the FSP under wave conditions. The Dynamic fluid–body interaction (DFBI) model was used for the movement of the FSP. Furthermore, an overset mesh was used considering the deformation of the grid system owing to the wave, which leads to larger movement of the FSP. Six-DOF analyses were performed, and the free surface was generated by a volume-of-fluid (VOF) model showing non-mixed fluid. The wave was generated as the fifth-order Stokes waves [15].
The domain and boundary conditions used in the computation under head sea and oblique sea conditions are shown in Figure 7 and Figure 8, respectively. The boundary conditions were set to a velocity inlet, and the forcing method supported by STAR-CCM + was utilized to minimize the dissipation of generated waves. The size of the forcing zone is shown in the red area.
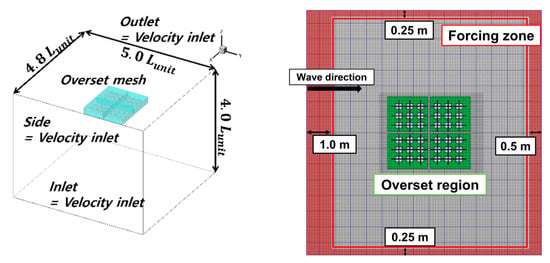
Figure 7.
Computation domain and boundary conditions for head sea conditions.
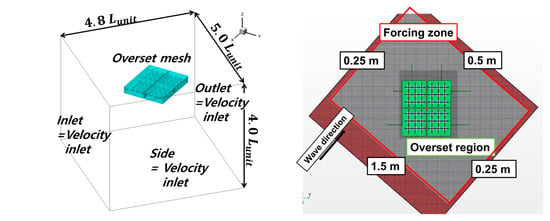
Figure 8.
Computation domain and boundary conditions for oblique sea conditions.
In a previous study, the effects of the wave (e.g., wave run-up, reflections, and diffractions) occurred owing to the blunt geometry and spacing of the floating bodies [16,17]. Due to the forcing boundary absorbed the effects of the wave, the domain size was set as shown in Figure 7 and Figure 8, respectively. The computation was an implicit unsteady condition, and the time step was set approximately /250 s. Here, is the wave period. Approximately 5 million and 6 million grids were used in the computations for the head sea and oblique sea conditions, respectively.
A catenary coupling system was used to express a mooring line in the computation. Catenary coupling models an elastic, quasi-stationary catenary such as a chain or towing rope, which hangs between two endpoints and is subject to its weight in the gravity field. In the local cartesian coordinate system, the catenary shape is given by Equations (3) and (4):
where the curve parameter is related to the inclination angle of the catenary curve by Equation (4). is the gravitational acceleration. and are the mass per unit length and relaxation length, respectively, of the catenary under force-free conditions. is the stiffness of the catenary, and and are integration constants that depend on the positions of the two endpoints and the total mass of the catenary.
Also, a revolute joint coupling system was applied to express a hinge system in the computation. A revolute joint connects two 6-DOF bodies, each of which has its own local-body coordinate system. The position and axis direction of each body must coincide. However, the position and axis of the revolute joint can vary over time.
The overall forms in which the mooring lines and hinges were applied to the FSP are shown in Figure 9. The same geometry and physical property values of the model used in the experiment were applied in the computation simulations. The test conditions used to verify the numerical method are listed in Table 3.
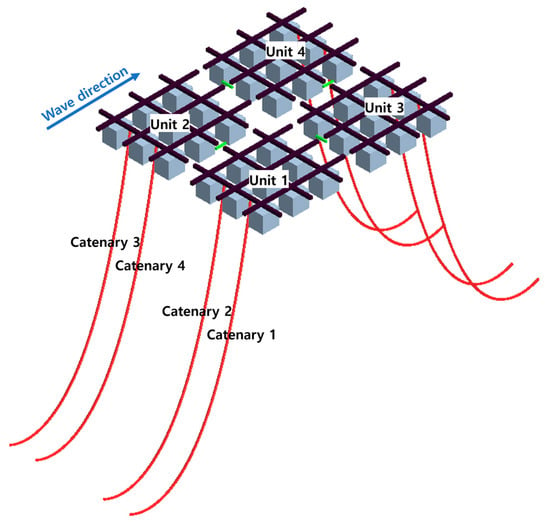
Figure 9.
Computation setup of mooring lines (catenary) and the hinge system.

Table 3.
Test conditions of computation.
4. Validation and Verification
The accuracy of the free surface is an important factor that needs to be considered before the CFD interpretation of the motion properties and flow of an FSP subjected to waves.
Previously, it was found that the importance of the variables such as time step, damping, and forcing constants can prevent wave reflection under boundary conditions, and can minimize waves [18,19]. In general, the computations that apply to the wave take a long computational time. Kim et al. [20] performed a numerical sensitivity simulation for two-dimensional waves and completed a numerical error distribution map based on the grid and CFL (Courant–Friedrichs–Lewy) conditions. Through those results obtained from the two-dimensional problem, a FPSO (floating production storage and offloading) motion simulation was conducted under wave conditions. The tested two-dimensional wave conditions showed a relatively good agreement compared to potential results, which shows that the verification of the waves through the two-dimensional test is valid. In this study, two-dimensional sensitivity analysis for waves was performed, and this was applied to the FSP to perform grid convergence analysis.
4.1. Two-Dimensional Wave Generation Sensitivity
This section presents the results of an examination of the computational conditions to accurately simulate waves under the conditions given in the experiment. Considered as a 2D problem, the target waves are two types of stokes waves ( = 1.35 m, = 0.0405 m; and = 1.80 m, = 0.054 m). The total simulation time corresponded to eight cycles of the wave. The data were extracted at three points (x = +1.650 m, +0.675 m, and −0.675 m from the origin) to verify the correctness of the implementation for the target wave (see Figure 10).

Figure 10.
Computation domain in waves through grid sensitivity analysis.
The medium grid was set to approximately 135 cells per wavelength and 20 cells per wave height with = 1.35 m and = 0.0405 m. The basic grid size was varied by times. In total, three types of grid systems were constructed with coarse and fine grids. The coarse grid was set to approximately 95 cells per wavelength and 12 cells per wave height. Meanwhile, the fine grid was set to approximately 190 cells per wavelength and 26 cells per wave height. In all the grid systems, the time step was set to a value at which the CFL was lower than one.
The wave profiles of the numerical and theoretical solutions obtained at each point by the grid systems were compared as shown in Figure 11 and Figure 12, where the black solid line is the theoretical solution. The coarse, medium, and fine grids are the green-triangle, blue-square, and red-circle symbols, respectively.

Figure 11.
Comparison of wave profiles at = 1.350 m: (a) from the origin; (b) from the origin; (c) from the origin.

Figure 12.
Comparison of wave profiles at = 1.800 m: (a) from the origin; (b) from the origin; (c) from the origin.
Table 4 shows the wave amplitude difference between the theoretical and numerical solutions according to the variation in the grid system at each position. The fine grid shows the best results. However, it requires an excessively long calculation time because of the number of grids and time steps. The medium grid appears to be suitable considering efficiency. In this study, we selected a medium-grid system to express the free surface.

Table 4.
Comparison of wave amplitude for each position according to the grid system.
4.2. Grid Convergence Test for the Floating Solar Power Farm under Wave Conditions
In this section, the grid convergence tests for the FSP computation are presented. The test subject was set to one unit, and the free surface was set to three stages, as described in Section 4.1. The grid convergence index (GCI) [21,22,23] of the test conditions are listed in Table 5. The GCI in this study represents the difference in the result value due to the grid variation represented by Grid-1, Grid-2, and Grid-3. The grid numbers of Grid-1, Grid-2, and Grid-3 were 0.96 million, 1.36 million, and 1.92 million, respectively. The number of grids was changed by changing the basic grid. In the grid convergence test, the difference of motion RAOs was reduced with the increase of grid size. The heave RAO GCI is 0.00048, 0.00031, and 0.00055 at wavelength ratios of 1.6, 2.4, and 3.2, and the pitch RAO GCI is 0.00057, 0.00183, and 0.00180 at the same wavelength ratios.

Table 5.
Comparison of the motions under the wave conditions ( = 0.03).
The results of FSP RAOs according to the variation in the grid systems are shown in Figure 13. The coarse, medium, and fine grids and experiment results are the green-triangle, blue-square, red-circular, and black-circular symbols, respectively. Unlike other grid systems, Grid-1 indicates lower RAOs in heave and pitch motions. At short wavelengths, the number of grids was insufficient for the wave height to express the free surface. Even when Grid-3 was expressed effectively for motion RAOs of the FSP and free surface, it required a computation-time approximately two times that for Grid-2. In addition, Grid-2 indicated that the accuracy of the free surface and the results of motion RAOs did not differ significantly from those for Grid-3. The heave and pitch RAOs show GCI values below 1.0% for Grid-3 and Grid-2. In addition, the motion RAOs for Grid-2 show satisfactory agreement with the experiment results with an error of about 3.0%. The computations in this study were performed using Grid-2.
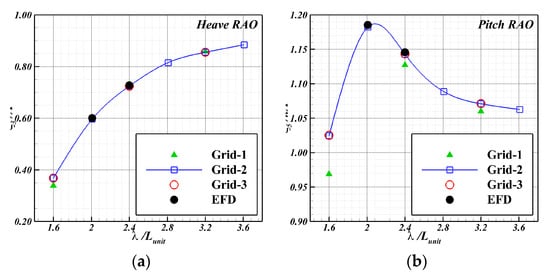
Figure 13.
Comparison of motion RAOs according to grid conditions: (a) heave; (b) pitch.
5. Results
A model test was conducted using the IUTT to investigate the motion and load characteristics of the FSP under wave conditions. The results were compared with the computation results obtained with identical conditions. It was attempted to ensure the reliability and validity of the calculation based on the motions generated in each unit by the connection and the load applied to the mooring lines.
5.1. Head Sea Conditions at = 0.03
The experimental results of the motion RAOs of each unit of the FSP under waves at = 0.03 according to the wavelength are shown in Figure 14. Here, the circular and square symbols represent an odd-numbered and even-numbered unit, respectively. Black and blue denote the first and second groups, respectively.
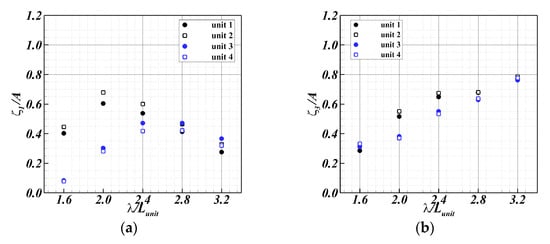
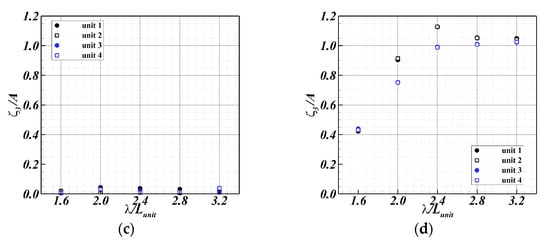
Figure 14.
Motion RAOs of the experiment according to the wavelength at = 0.03: (a) surge; (b) heave; (c) roll; (d) pitch.
In the case of surge motion, the surge motion generated in the wave direction in each unit was expressed. The difference between the groups was large at = 2.0. Subsequently, the units tended to converge as the wavelength increased.
In the case of heave motion, the heave RAO increased linearly with the increase in wavelength, and relative behavior occurred between the first and second groups at = 2.0 and 2.4. It appeared that when the incident wave lost energy while contacting the first group, this effect was reduced by the motion of RAOs of the second group. In addition, it was considered that a similar heave RAO occurred at = 1.6 owing to a small wave height and short period.
In the case of roll motion, the hinge motion parallel to the wave travel direction was predominant because of the head sea conditions, the FSP was bilaterally symmetric, and almost no roll RAO was generated.
In the case of pitch motion, because the wavelength was longer than the FSP length for , a motion that rides on a wave appeared. Furthermore, the pitch RAO tended to converge as the wavelength increased. In addition, at , the length of the FSP became equal to the wavelength, and the maximum pitch RAO occurred.
The experimental and computation results were compared to verify the wave pattern around the FSP according to the wavelength (see Figure 15). Here, the images on the left and right represent the experiment and computation, respectively. It was observed that the waves were diffracted and reflected by floating bodies, and wave run-up was also observed. When the waves passed through the floating bodies, the bodies were significantly affected by the periodic variation in the incident wave, which especially appeared at a relatively short period condition ( = 1.6). Then, the nonlinear wave profile reveled a non-uniform load on the support structure coupled to the suspended bodies [24]. At = 2.4, the deformation of the first and second groups were similar to the experiment. Also, the motions of riding on the wave were observed at long wavelengths.


Figure 15.
Wave pattern of experiment (left) and computation (right) according to the wavelength for = 0.03 under head sea: (a) = 1.6; (b) = 2.0; (c) = 2.4; (d) = 2.8; (e) = 3.2.
The computation results of motion RAOs according to wavelength were compared with the experimental results (see Figure 16 and Figure 17). Here, the black-square and red-circular symbols represent the experimental and computation results, respectively. The heave RAOs are shown in Figure 16. Similar results were observed overall. The heave RAOs increased linearly with the wavelength. The pitch RAOs are shown in Figure 17. The computation results matched a maximum value at = 2.4, which is the same as the experiment, which was influenced by the wave conditions. However, the heave and pitch RAOs showed a difference from motion RAOs.
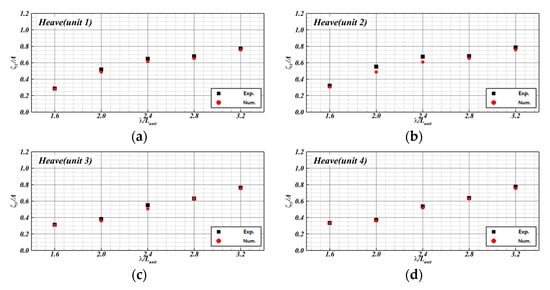
Figure 16.
Heave RAOs for = 0.03 under head sea: (a) Unit 1; (b) Unit 2; (c) Unit 3; (d) Unit 4.
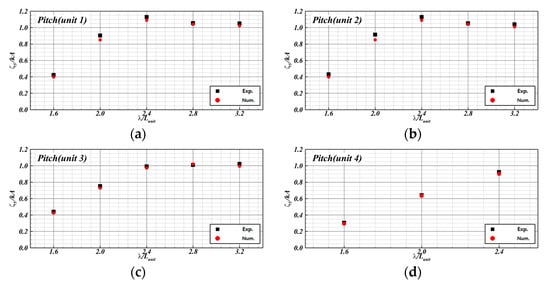
Figure 17.
Pitch RAOs for = 0.03 under head sea: (a) Unit 1; (b) Unit 2; (c) Unit 3; (d) Unit 4.
At = 0.03, = 2.4, the time series data of the total tension was measured on the mooring lines connected to the FSP (see Figure 18). Here, the black-solid and red-dotted lines represent the experimental and computation results, respectively. The tension time series shows two points. One is the maximum load point where the FSP was farthest from the initial position. The second point is the average load point where the position of the FSP converged owing to the restoration of the mooring lines. Compared to the experiment, it showed a similar trend that the period in which the load was generated and the two tension change points. The total tension of the mooring lines is expressed as the maximum and average loads (see Table 6). The maximum tension was observed at = 2.0, where the difference of surge RAO between the units was large. We observed a tendency to converge even at tensions with 2.4.
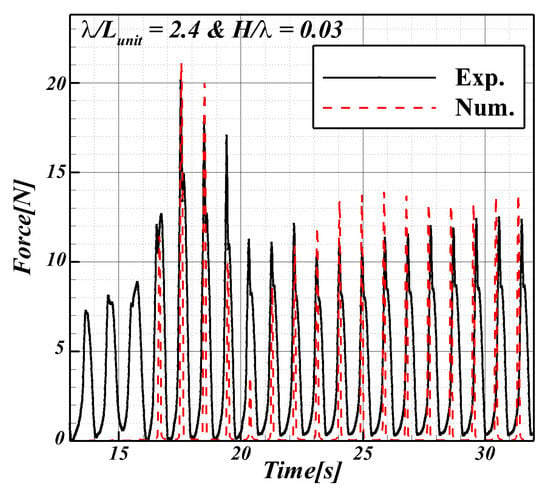
Figure 18.
Time series data of total tension at = 2.4 and = 0.03.

Table 6.
Comparison of total tension determined by experiment and computation at = 0.03.
5.2. Head Sea Condition at Different Wave Steepness
The time series motion data for the heave and pitch of Unit 1 in the experiment according to the wave steepness for = 1.6 and 2.4 are shown in Figure 19. Here, the pink and blue colors represent = 1.6 and 2.4, respectively. The solid and dotted lines represent = 0.03 and 0.05, respectively. When the wave steepness is constant, the variation at = 2.4 is larger than that for 1.6, because the height of the wave varies significantly.
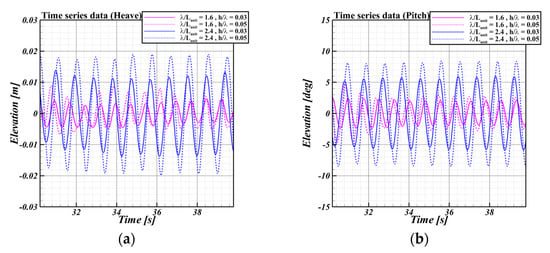
Figure 19.
Time series motion data according to wave steepness at Unit 1: (a) heave; (b) pitch.
The experimental results of the motion RAOs of each unit of the FSP under waves according to wave steepness are shown in Figure 20. In the motion RAOs, the results for = 0.03 were higher than those for 0.05. This tendency was converse to that of the time series motion data. It was thought that the nonlinearity of the motion increased with respect to the rate of increase in wave steepens. In addition, the difference appeared to be smaller in the second group than in the first. The wave lost energy while contacting the first group, and the second group in contact with the losing wave had reduced motion.
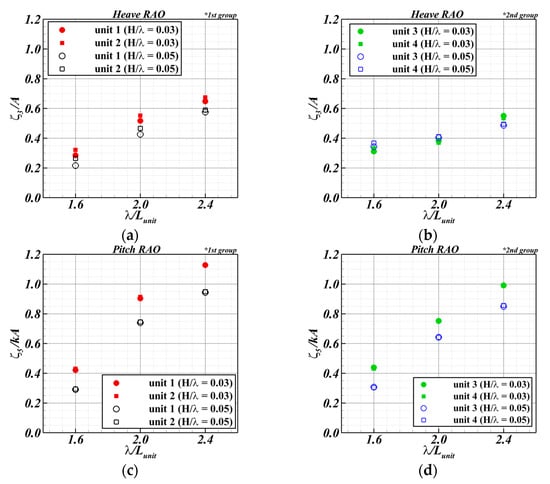
Figure 20.
Motion RAOs of the experiment according to wave steepness: (a) heave (first group); (b) heave (second group); (c) pitch (first group); (d) pitch (second group).
The experiment and computation results were compared to verify the wave pattern around the FSP according to the wavelength (see Figure 21). In = 0.03, a large motion characteristic appeared at the center of the hinge. The bigger wave run-up and diffraction were observed, which showed similar results in computation. Also, the green water observed at = 2.4 in the experiment was also observed in the computation results.

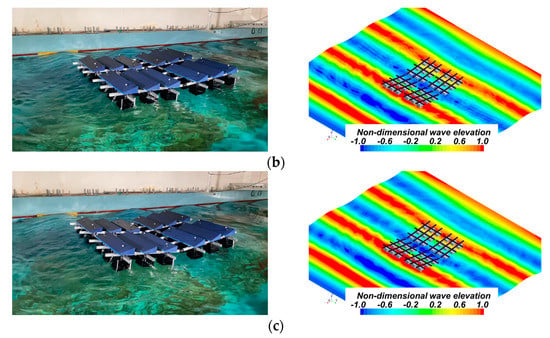
Figure 21.
Wave pattern of experiment (left) and computation (right) according to the wavelength for = 0.05 under head sea: (a) = 1.6; (b) = 2.0; (c) = 2.4.
The computation results of motion RAOs according to the wavelength at = 0.03 were compared with the experimental results (see Figure 22 and Figure 23). Similarly, as in the previous section, the amplitude of the RAOs increased as the wavelength increased. The total tension of the mooring lines is expressed as the maximum and average loads (see Table 7).
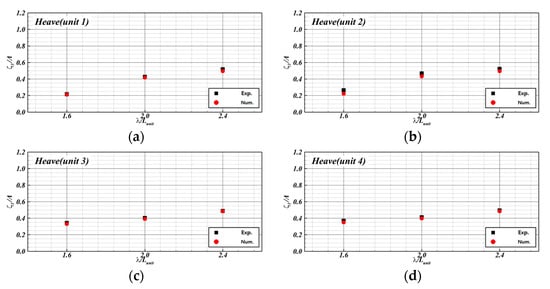
Figure 22.
Heave RAOs for = 0.05 under head sea: (a) Unit 1; (b) Unit 2; (c) Unit 3; (d) Unit 4.


Figure 23.
Pitch RAOs for = 0.05 under head sea: (a) Unit 1; (b) Unit 2; (c) Unit 3; (d) Unit 4.

Table 7.
Comparison of total tension determined by experiment and computation at = 0.05.
The tension was larger at = 2.0, and the maximum load occurred at a wavelength ratio equal to that mentioned in Section 5.2. In addition, as the wave height increased, the wave energy increased with the load. It is expressed non-dimensionally to analyze the tension by excluding the wave conditions (see Figure 24). The tension coefficient () is identical to that in Equation (5):
where is the density, is the gravitational acceleration, is the wave amplitude, and is the total breadth of the floating bodies at one unit. Regarding the tension coefficient, = 0.03 appeared to be larger than 0.05. This was because the tension increased with the increase in wave height. However, the non-dimensional tension coefficient tended to decrease because of the nonlinear decrease in the pitch RAO.
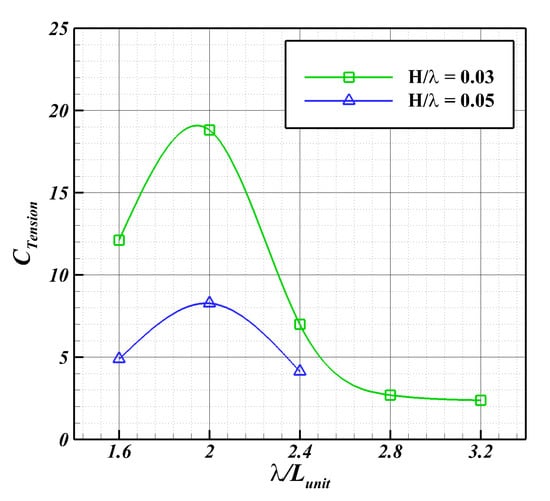
Figure 24.
Comparison of tension coefficient according to wave steepness.
5.3. Oblique Sea Conditions at = 0.03
In this study, we conducted a model test under oblique wave conditions by rotating the FSP, which leads the waves to enter diagonally. Units 2 and 4 of the FSP were arranged in a straight line, and the FSP was rotated by 41°. The experimental results of the motion RAOs of each unit of the FSP under oblique waves are shown in Figure 25.

Figure 25.
Motion RAOs of the experiement according to wavelength under oblique sea: (a) heave; (b) roll; (c) pitch.
In the case of heave motion, similar motion characteristics occurred between units (Units 1 and 4, and Units 2 and 3) located at the same position. In Unit 3, the waves that passed between Units 1 and 4 overlapped, thereby causing excessive motion.
Roll motion varies significantly depending on the wave direction, and this increases gradually according to the wavelength. In the uniaxial hinge system, the units in a column exhibited similar movements. In the case of pitch motion, the motion was lower than that under head sea conditions. When the wavelength was increased, the relative movements between the units were getting bigger. On the other hand, in the experiment, it was observed that the diffracted waves spread widely, and the waves would re-enter the FSP through the walls. In addition, the overlapping and dissipation of waves between floating bodies (which were difficult to observe in the experiment) were inspected.
The computation under oblique sea conditions was performed using the numerical method verified for head sea conditions. The results were compared with the experimental results for = 2.4 and 2.8. The experimental and computation results were compared to verify the wave pattern around the FSP according to the wavelength (see Figure 26). The generated wave encountered the floating body at the front of Unit 2. The effect of wave (e.g., diffraction, upwelling, run-up, and reflection) appeared to be larger than those under the head sea conditions because the geometry of the FSP.


Figure 26.
Wave pattern of experiment (left) and computation (right) according to the wavelength under oblique sea: (a) = 2.4; (b) = 2.8.
The computation results of the motion RAOs according to wavelength were compared with the experimental results (see Figure 27). The oblique sea conditions showed similarities to head sea conditions. The translational heave motion showed a tendency to match. However, the roll and pitch motions differed, and it is thought that the difference of the hinge causes errors between experiments and simulations. This was determined to be an error that occurred in the hinge gap, as mentioned in the previous section. Theoretically, the uniaxial hinge does not cause simultaneous rotational motion of the horizontal and vertical axes. However, in the experiment, it was determined that the rotational motion occurred simultaneously owing to the hinge gap and that additional rotational motion was generated during overlapping rotation. However, the motion occurred only in the axial direction in the computation. This was observed a difference in the rotational components.
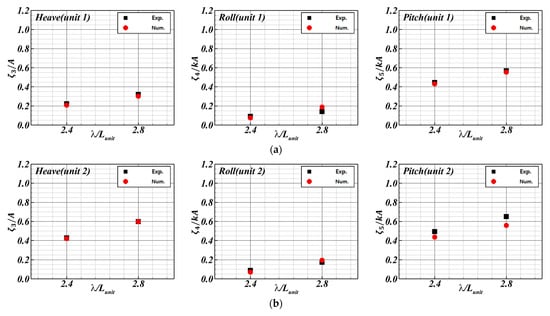
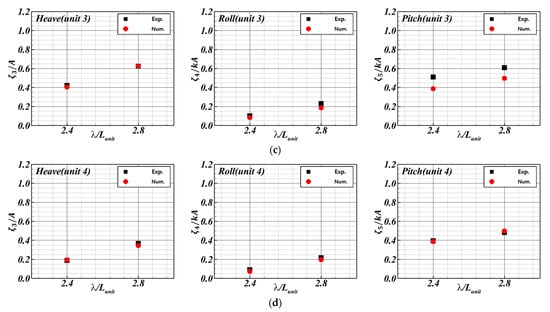
Figure 27.
Motion RAOs of heave (left), roll (center) and pitch (right) under oblique sea: (a) Unit 1; (b) Unit 2; (c) Unit 3; (d) Unit 4.
The time series data of the total tension measured on the mooring lines connected to the FSP under oblique sea are shown in Figure 28. The total tension of the mooring lines is expressed as the maximum and average loads in the oblique sea (see Table 8). The periods in which the load was generated, and the load exhibited similar tendencies. There was a difference in the load pattern after the maximum tension. This is unlike the head sea condition. Furthermore, it was determined that the oblique sea condition did not achieve precise geometrical similarity for the mooring line system. It was then determined that the external force applied to the FSP appeared to be relatively low tension because the waves were dispersed and escaped from the configuration of FSP and the movements were smaller than those under the head sea.
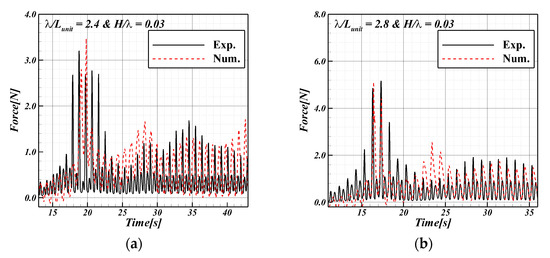
Figure 28.
Time series data of total tension under oblique sea: (a) = 2.4; (b) = 2.8.

Table 8.
Comparison of total tension determined by experiment and computation under oblique sea.
According to these results, it is necessary to develop an accurate computational technique for a connection similar to that in the experiment. When applying multi-directional articulations to the FSP, substantial research needs to be carried out on articulations for a more accurate interpretation.
6. Conclusions
In this study, a physical method (experiment) and numerical method (CFD) were used to observe an accurate motion response of an FSP. The validity and reliability of the numerical method was confirmed through a validation process. Both results were compared, and these showed good agreement.
- For the experiment, a model of a two-row and two-column unit matrix-type floating solar power farm was manufactured. The connecting part was composed of uniaxial hinges. Motion capture cameras and tension meters were used to measure the motion characteristics and tension, respectively. We established experimental techniques, e.g., the construction of a measurement platform for 3D object motion and the construction of a floating solar power farm (FSP) experiment under wave conditions. The results were used to verify the numerical analysis.
- The conditions of the three waves were calculated and compared with the experimental results to verify the numerical technique. The wave generated in the computation was identical to that generated in the experiment. Although there were differences in the tension and mechanical error generated in the experiment, similar trend of results was obtained for the wave pattern generated around the floating solar power farm and the motion responses to each motion component. The tension also verified the similarity.
- Through the experiment and CFD, each unit group of the FSP showed identical motion under head sea conditions. The longitudinal motion appeared to be larger than the other motion responses. As the wavelength increased, the heave and pitch RAOs increased linearly, and the pitch RAOs tended to converge after a wavelength ratio of 2.4. The largest total load applied to the mooring lines was generated at a wavelength ratio of 2.0, which yielded a large difference in surge motion for each unit.
- The motion response of the floating solar power farm was compared according to the wave height in the head sea condition. Although the motion increased when the wave height increases, the motion RAOs showed the converse tendency. This showed that the motions are proportional to the wave height. On the other hand, the non-dimensional tension with a wave steepness of 0.03 was larger than that for 0.05. It was thought that although the tension increased, the tension coefficient tended to decrease owing to the nonlinear decrease in pitch RAOs.
- The waves approached the floating solar power farm at an angle (oblique waves, 41 degrees). This revealed various motion characteristics. One of these was roll motion, which was not observed in the head sea conditions. It had a highly complex motion response. In addition, the waves dispersed due the configuration of the FSP. The motion appeared to be smaller than that under the head sea condition. The load applied to the tension also appeared to be low.
The verified numerical technique can become the basis for research on developing a mooring system that can determine various environmental conditions and motion responses and maximize the efficiency of solar panels and floating solar power farms considering the wave load. The design can be achieved by considering the load distribution of the support structure. In a future study, various floating solar farms with over two rows and columns would be simulated to investigate the complex interactions among floating units in detail.
Author Contributions
Conceptualization, computation, data analysis, post processing, and writing—original draft preparation, review and editing, J.-H.L.; conceptualization, data analysis, writing—review and editing, funding, and supervision, K.-J.P.; conceptualization and data analysis and review, S.-H.L.; conceptualization and data analysis, J.H.; visualization and investigation, T.-H.H. All authors have read and agreed to the published version of the manuscript.
Funding
The Evaluation of Wave Load and Motion Performance of the Support Structure for the Floating Solar Power Plant (2021X009), by POSCO, Republic of Korea, and the Competency Development Program for Industry Specialists of the Korean Ministry of Trade, Industry and Energy (MOTIE), operated by the Korean Institute for Advancement of Technology (KIAT). (No. P0012646, HRD program for Global Advanced Engineer Education Program for Future Ocean Structures).
Institutional Review Board Statement
Not applicable.
Informed Consent Statement
Not applicable.
Data Availability Statement
Not applicable.
Acknowledgments
This research was supported by the Evaluation of Wave Load and Motion Performance of the Support Structure for the Floating Solar Power Plant (2021X009), by POSCO, Republic of Korea, and was funded and conducted under the Competency Development Program for Industry Specialists of the Korean Ministry of Trade, Industry and Energy (MOTIE), operated by Korean Institute for Advancement of Technology (KIAT). (No. P0012646, HRD program for Global Advanced Engineer Education Program for Future Ocean Structures).
Conflicts of Interest
The authors declare no conflict of interest.
References
- Renewable Energy 3020 Implementation Plan (Ministry of Trade, Industry and Energy, Republic of Korea). Available online: http://www.motie.go.kr/motie/ne/presse/press2/bbs/bbsView.do?bbs_cd_n=81&bbs_seq_n=159996 (accessed on 20 March 2021).
- Alsharif, M.H.; Kim, J.; Kim, J.H. Opportunities and Challenges of Solar and Wind Energy in South Korea: A Review. Sustainability 2018, 10, 1822. [Google Scholar] [CrossRef]
- Park, M.; Park, S.; Seong, B.; Choi, Y.; Jung, S.P. Current Status and Prospective of Offshore Wind Power to Achieve Korean Renewable Energy 3020 Plan. J. Korean Soc. Environ. Eng. 2021, 43, 195–205. [Google Scholar] [CrossRef]
- Hu, C.; Sueyoshi, M.; Liu, C.; Kyozuka, Y.; Ohya, Y. Numerical and experimental study on a floating platform for offshore renewable energy. In Proceedings of the International Conference on Ocean, Offshore and Arctic Engineering, Nantes, France, 9–14 June 2013. [Google Scholar]
- Kim, K.H.; Hong, J.P.; Park, S.; Lee, K.; Hong, K. An Experimental Study on Dynamic Performance of Large Floating Wave-Offshore Hybrid Power Generation Platform in Extreme Conditions. J. Korean Soc. Mar. Environ. Energy 2016, 19, 7–17. [Google Scholar] [CrossRef]
- Kwon, Y.J.; Nam, B.W.; Kim, N.; Jung, D.H.; Hong, S.Y.; Kim, H.J. Numerical and Experimental Study on Motion Response of 1MW OTEC Platform. J. Ocean Eng. Technol. 2017, 31, 81–90. [Google Scholar] [CrossRef]
- Oliveira-Pinto, S.; Stokkermans, J. Marine floating solar plants: An overview of potential, challenges and feasibility. Proc. Inst. Civ. Eng. Marit. Eng. 2020, 173, 120–135. [Google Scholar] [CrossRef]
- Sahu, A.; Yadav, N.; Sudhakar, K. Floating photovoltaic power plant: A review. Renew. Sustain. Energy Rev. 2016, 66, 815–824. [Google Scholar] [CrossRef]
- Terre, C. Hydrelio® Technolo. 2018. Available online: https://issuu.com/cieletterre/docs/c_t_catalog_hydrelio__technology_20 (accessed on 13 November 2021).
- Abyn, H.; Maimun, A.; Koto, J.; Rafiqul Islam, M.; Magee, A.; Bodaghi, B.; Pauzi, M.; Siow, C.L.; Mobassher Tofa, M. Hydrodynamic interaction of floating structure in regular waves. J. Teknol. Sci. Eng. 2014, 66, 91–96. [Google Scholar] [CrossRef][Green Version]
- Shi, Q.J.; Zhang, H.C.; Xu, D.L.; Qi, E.R.; Tian, G.; Ding, J.; Wu, Y.S.; Lu, Y.; Li, Z.W. Experimental validation of network modeling method on a three-modular floating platform model. Coast. Eng. 2018, 137, 92–102. [Google Scholar] [CrossRef]
- Li, P.; Faltinsen, O.M.; Lugni, C. Nonlinear vertical accelerations of a floating torus in regular waves. J. Fluids Struct. 2016, 66, 589–608. [Google Scholar] [CrossRef]
- Al-Yacouby, A.M.; Halim, E.R.B.A.; Liew, M.S. Hydrodynamic analysis of floating offshore solar farms subjected to regular waves. Lect. Notes Mech. Eng. 2020, 20, 375–390. [Google Scholar]
- Siemens. Simcenter STAR-CCM+ User Guide, Version 2020.2. Available online: https://support.sw.siemens.com/ 2020 (accessed on 1 January 2020).
- Fenton, J.D. A Fifth-Order Stokes Theory for Steady Waves. J. Waterw. Port Coast. Ocean Eng. 1985, 111, 216–234. [Google Scholar] [CrossRef]
- Lee, S.B.; Han, S.Y.; Choi, Y.M.; Kwon, S.H.; Jung, D.W.; Park, J.S. Study on wave run-up phenomenon over vertical cylinder. J. Ocean Eng. Technol. 2013, 27, 62–67. [Google Scholar] [CrossRef]
- Cheng, L.; Lin, P. The Numerical Modeling of Coupled Motions of a Moored Floating Body in Waves. Water 2018, 10, 1748. [Google Scholar] [CrossRef]
- Perić, R.; Abdel-Maksoud, M. Reliable damping of free-surface waves in numerical simulations. Ship Technol. Res. 2016, 63, 1–13. [Google Scholar] [CrossRef]
- Perić, R.; Abdel-Maksoud, M. Analytical prediction of reflection coefficients for wave absorbing layers in flow simulations of regular free-surface waves. Ocean Eng. 2018, 147, 132–147. [Google Scholar] [CrossRef]
- Kim, J.; Park, I.R.; Suh, S.B.; Kang, Y.D.; Hong, S.Y.; Nam, B.W. Motion Simulation of FPSO in Waves through Numerical Sensitivity Analysis. J. Ocean Eng. Technol. 2018, 32, 166–176. [Google Scholar] [CrossRef]
- Celik, I.B.; Ghia, U.; Roache, R.J.; Freitas, C.J.; Coleman, H.; Raad, P.E. Procedure for estimation and reporting of uncertainty due to discretization in CFD applications. J. Fluids Eng. Trans. 2008, 130, 0780011–0780014. [Google Scholar]
- Kim, S.J.; Choi, Y.S.; Cho, Y.; Choi, J.W.; Hyun, J.J.; Joo, W.G.; Kim, J.H. Analysis of the Numerical Grids of a Francis Turbine Model through Grid Convergence Index Method. KSFM J. Fluid Mach. 2020, 23, 16–22. [Google Scholar] [CrossRef]
- Tezdogan, T.; Demirel, Y.K.; Kellett, P.; Khorasanchi, M.; Incecik, A.; Turan, O. Full-scale unsteady RANS CFD simulations of ship behaviour and performance in head seas due to slow steaming. Ocean Eng. 2015, 97, 186–206. [Google Scholar] [CrossRef]
- Chen, W.; Gao, Y.; Wang, L.; Guo, Z.; Wang, B. Numerical simulation of wave run-up on four cylinders in a square configuration. Appl. Ocean Res. 2021, 108, 102519. [Google Scholar] [CrossRef]
Publisher’s Note: MDPI stays neutral with regard to jurisdictional claims in published maps and institutional affiliations. |
© 2022 by the authors. Licensee MDPI, Basel, Switzerland. This article is an open access article distributed under the terms and conditions of the Creative Commons Attribution (CC BY) license (https://creativecommons.org/licenses/by/4.0/).