
On the Response of Zhejiang Coastal Waters to 12 Typhoons from 2011 to 2015


Abstract
:1. Introduction
2. Data and Methods
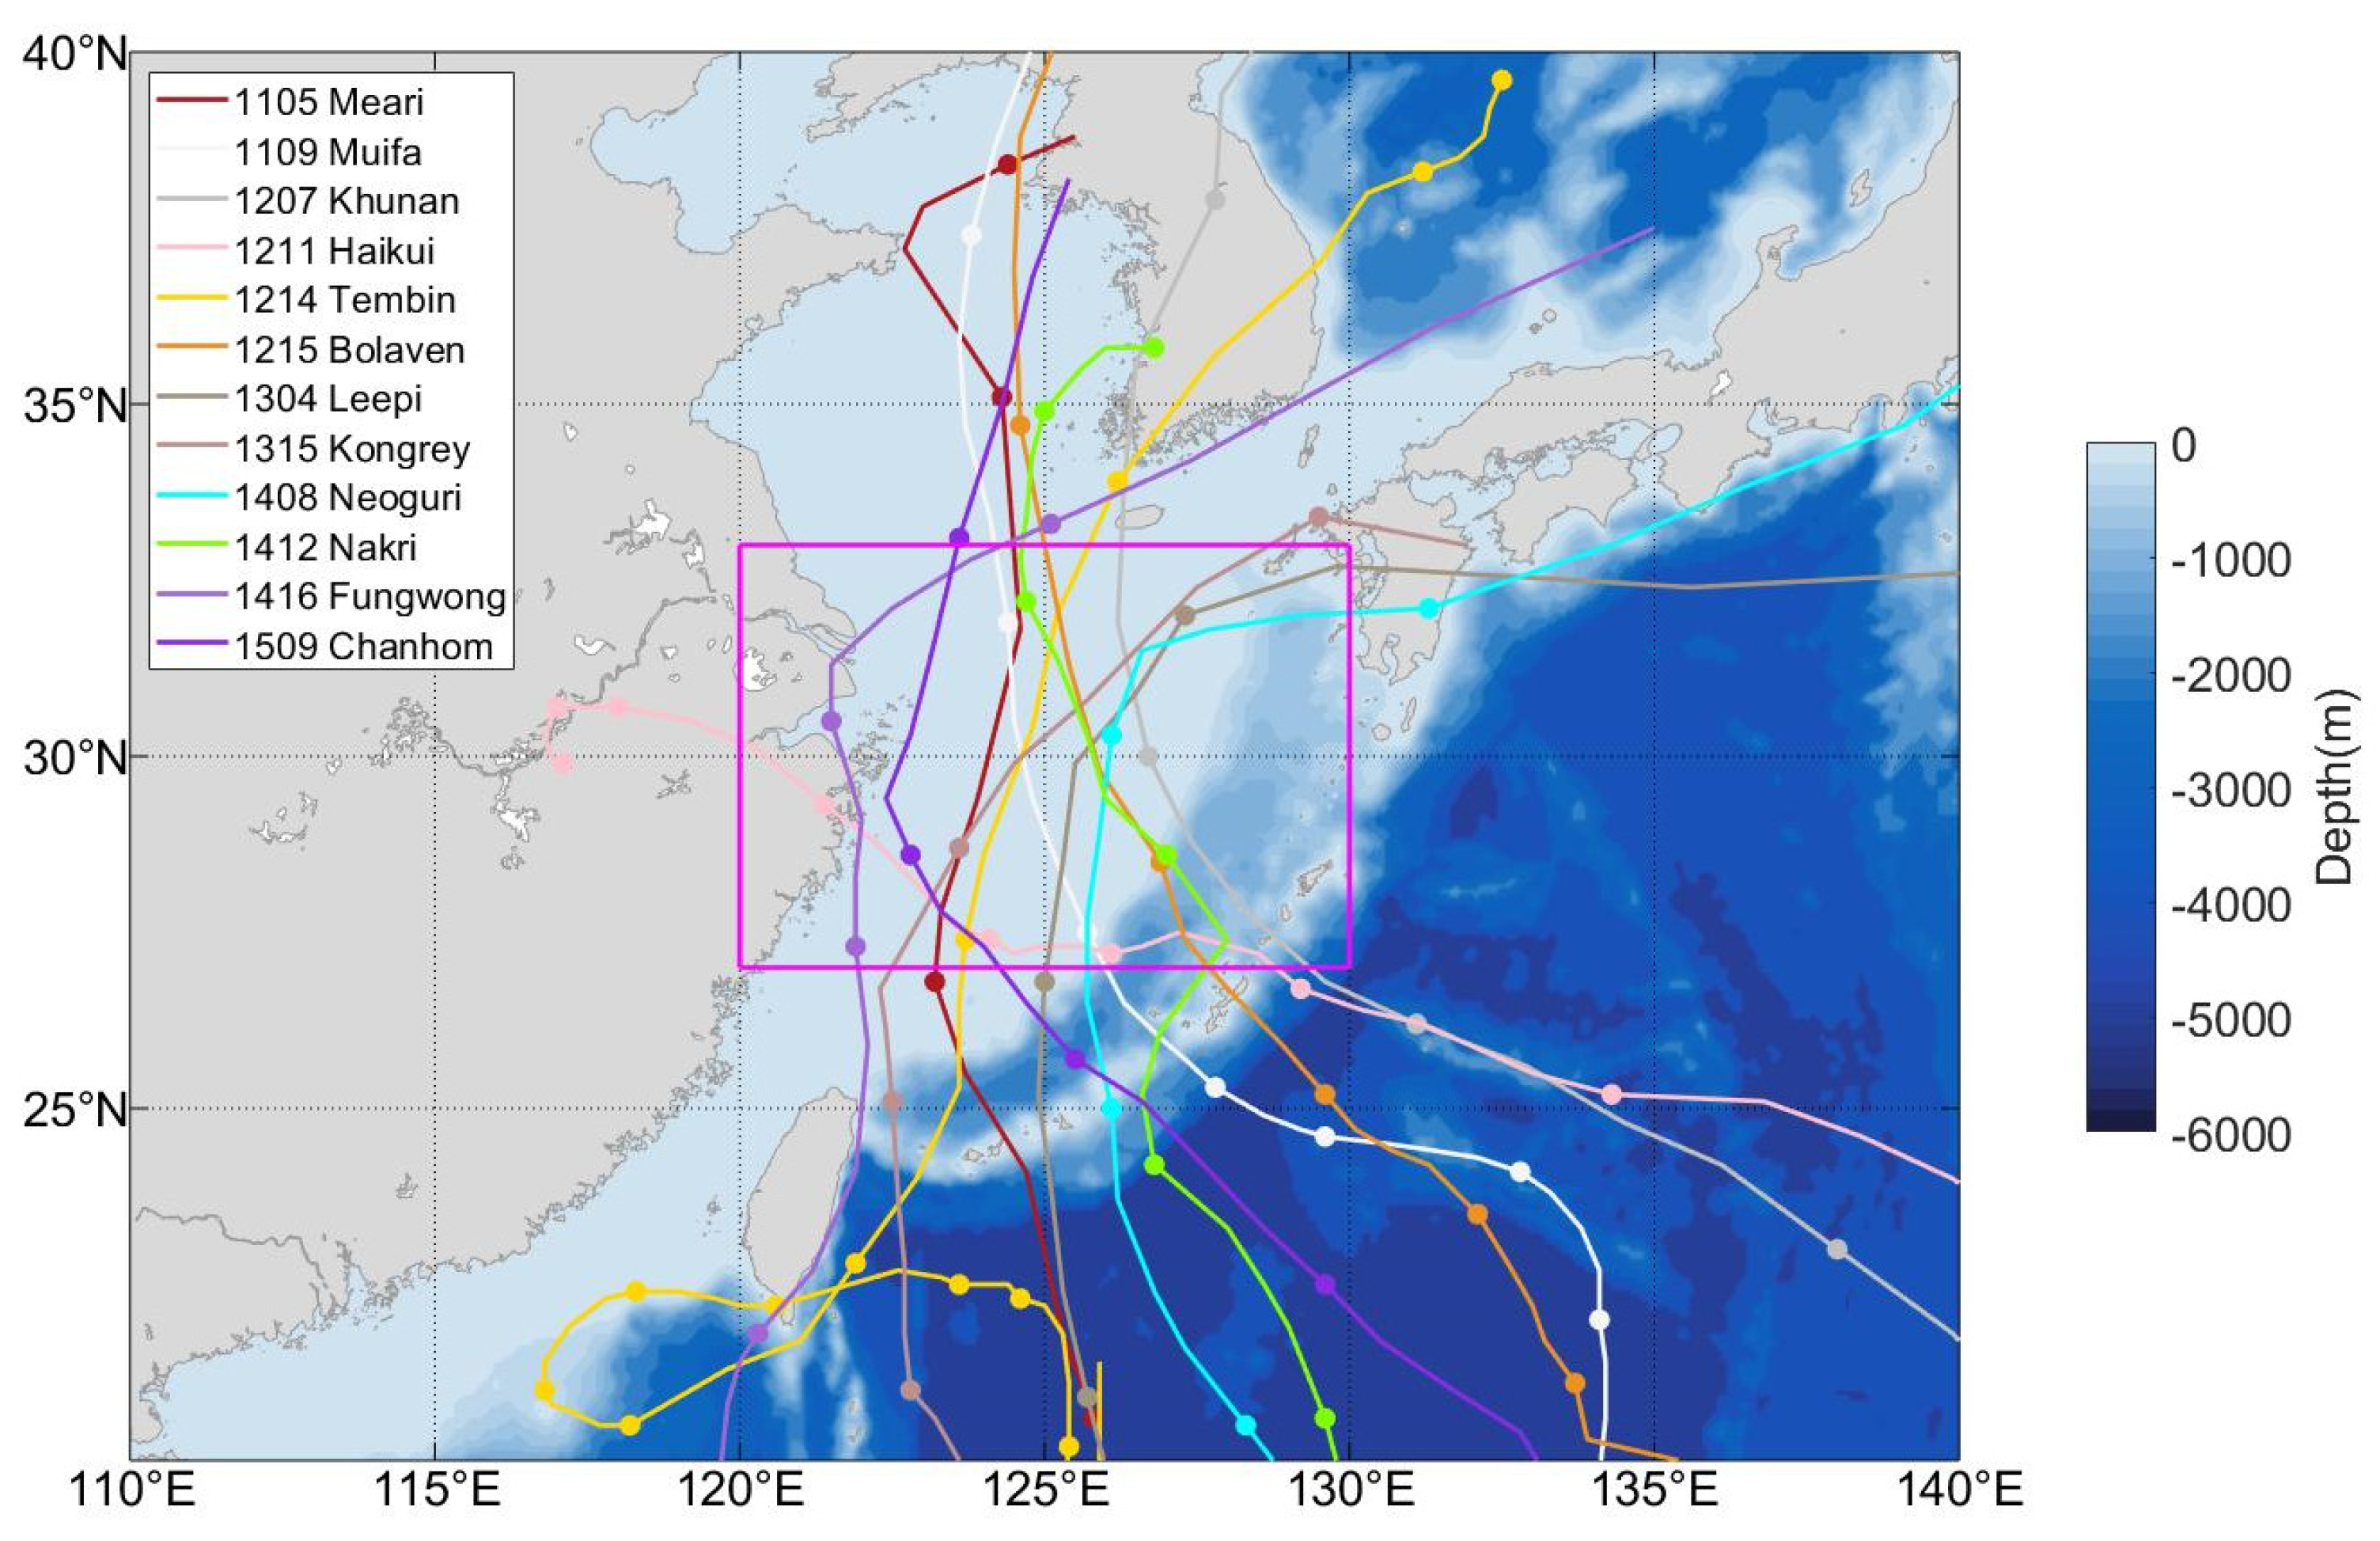
2.1. Typhoons
2.2. HYCOM Reanalysis Data
2.3. Satellite-Observed SST Data
2.4. Methodology
3. Results
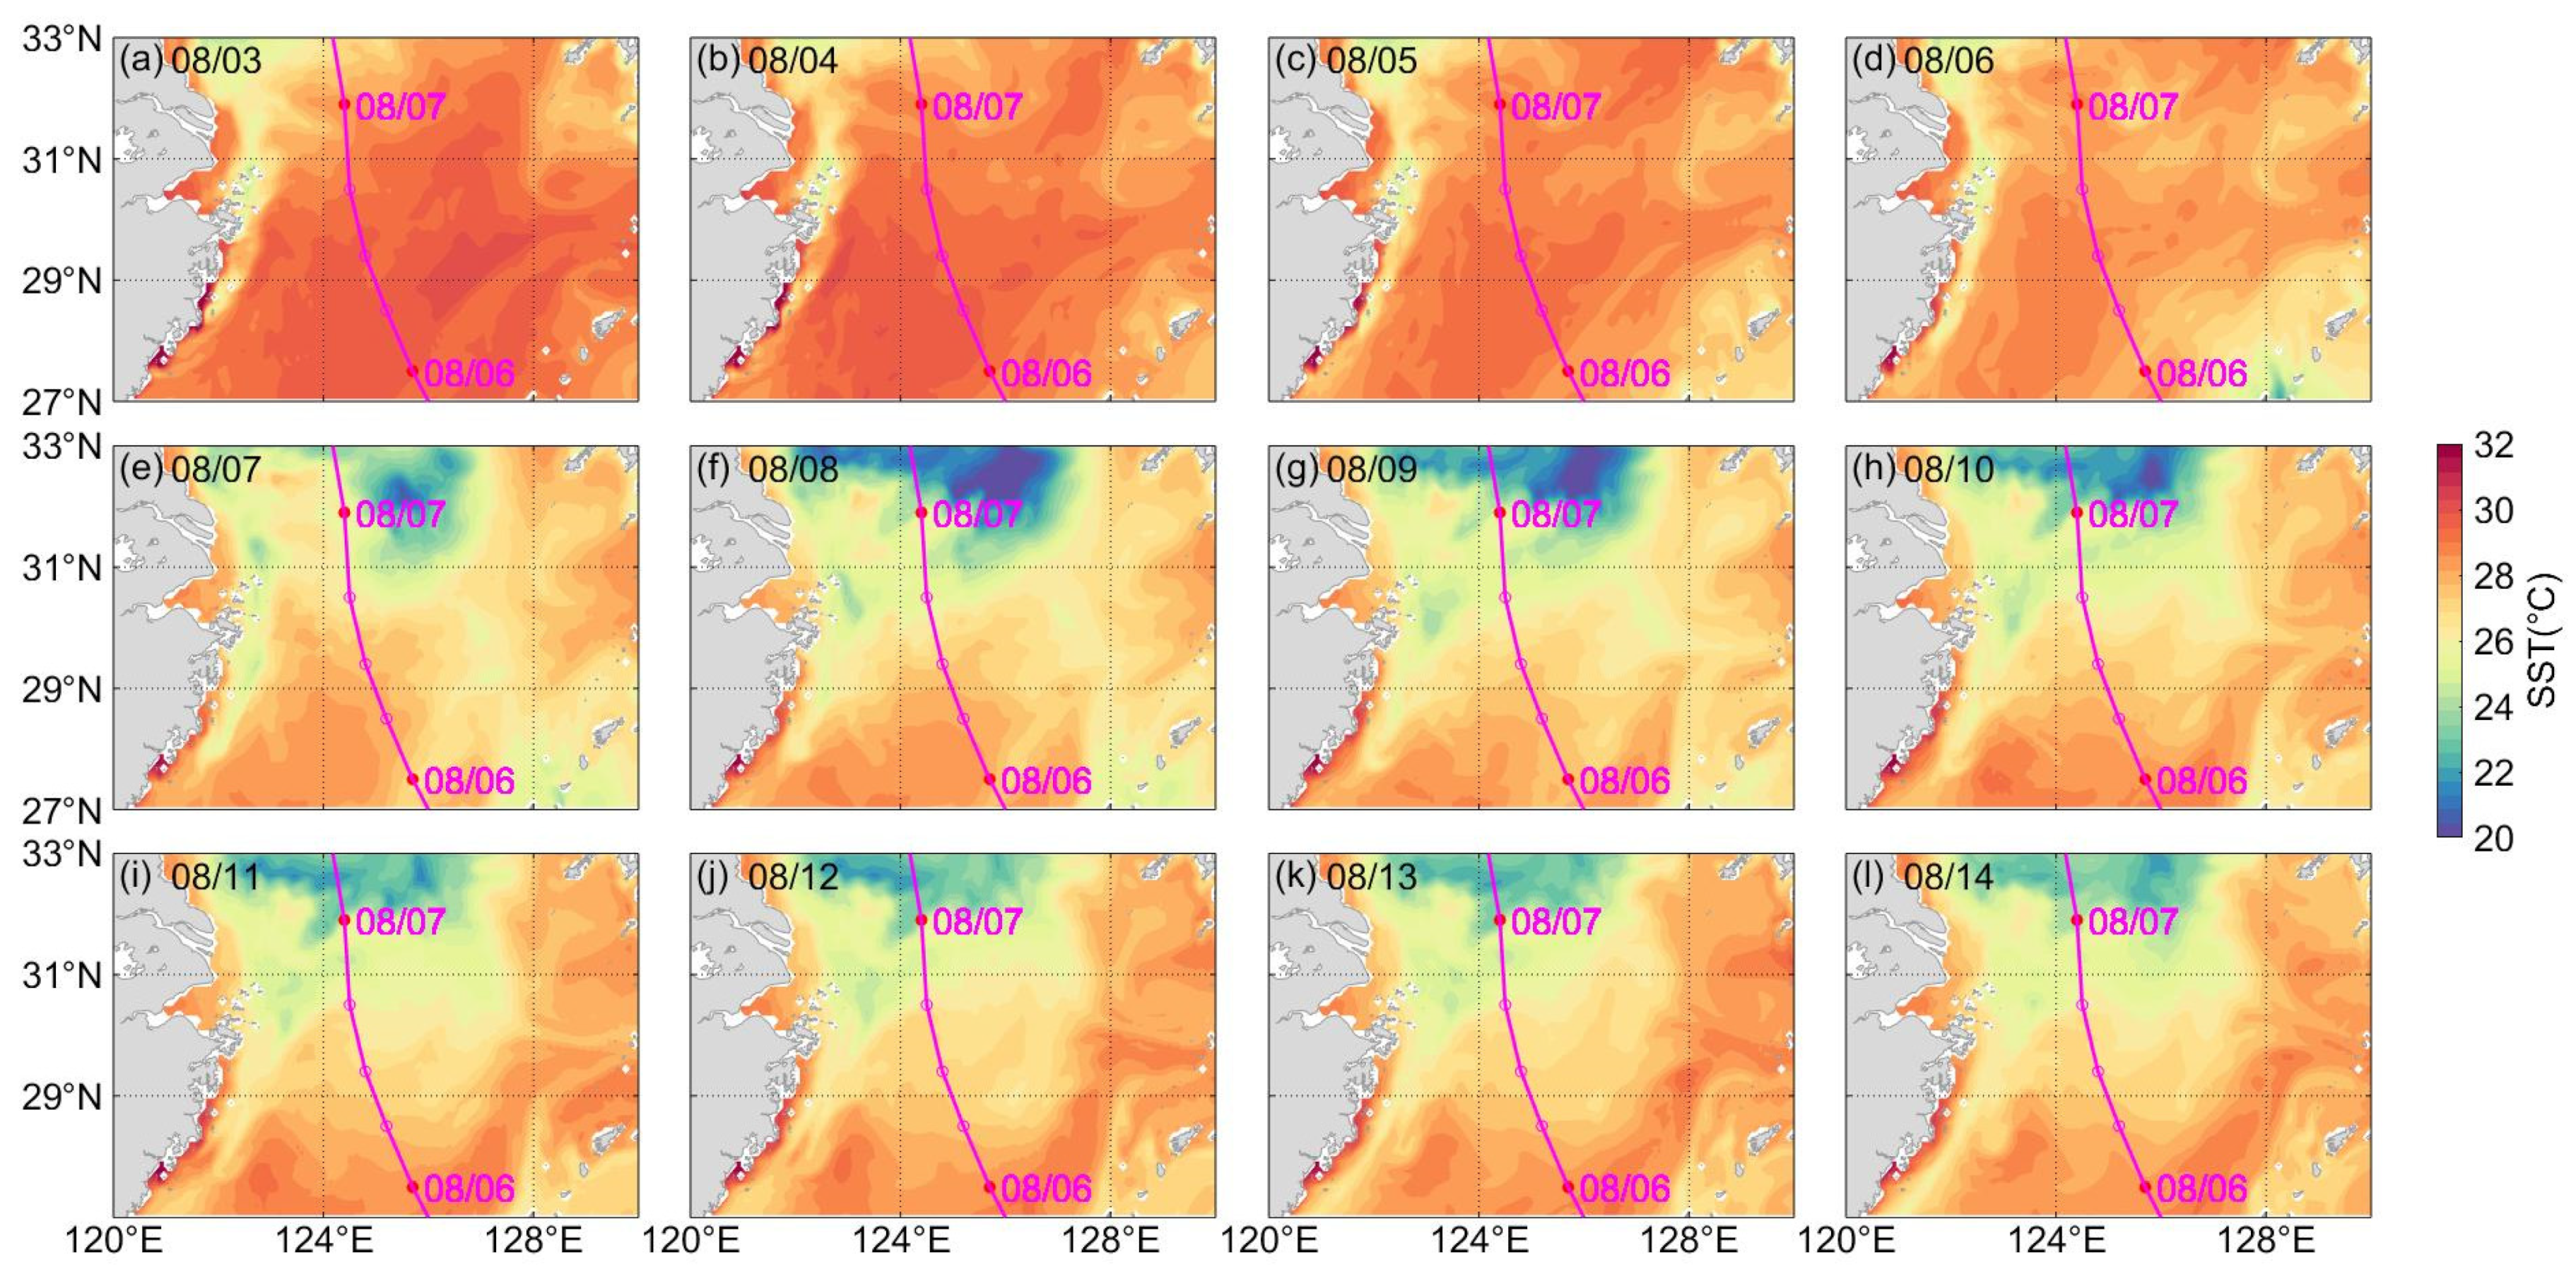
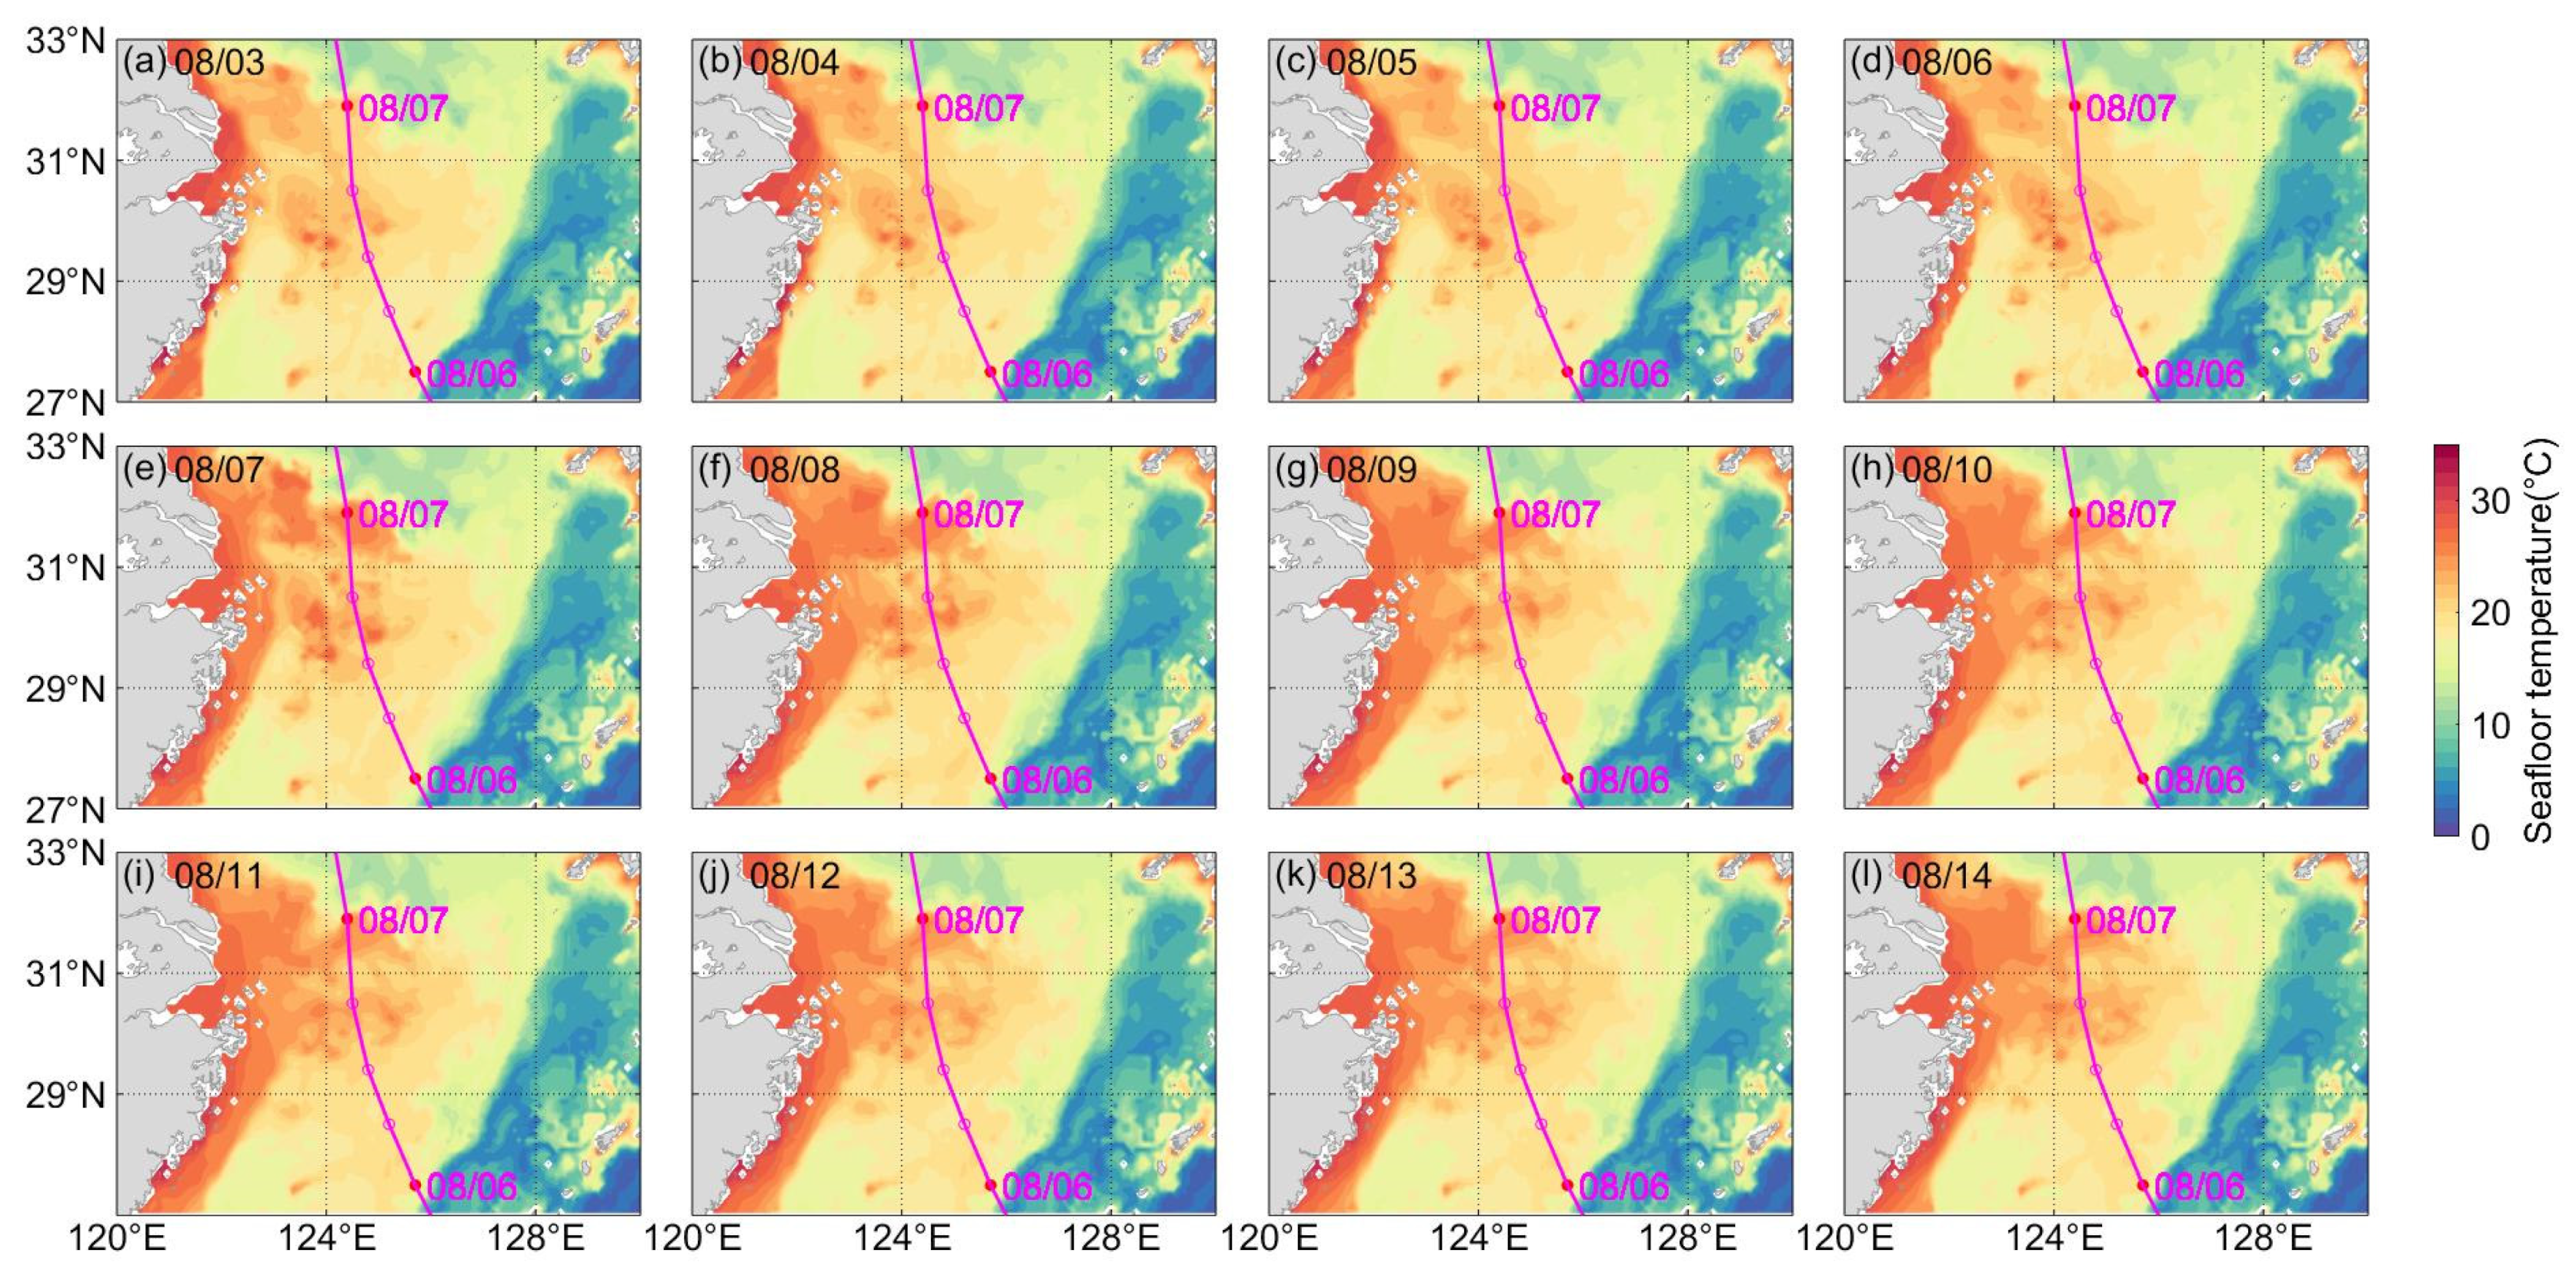
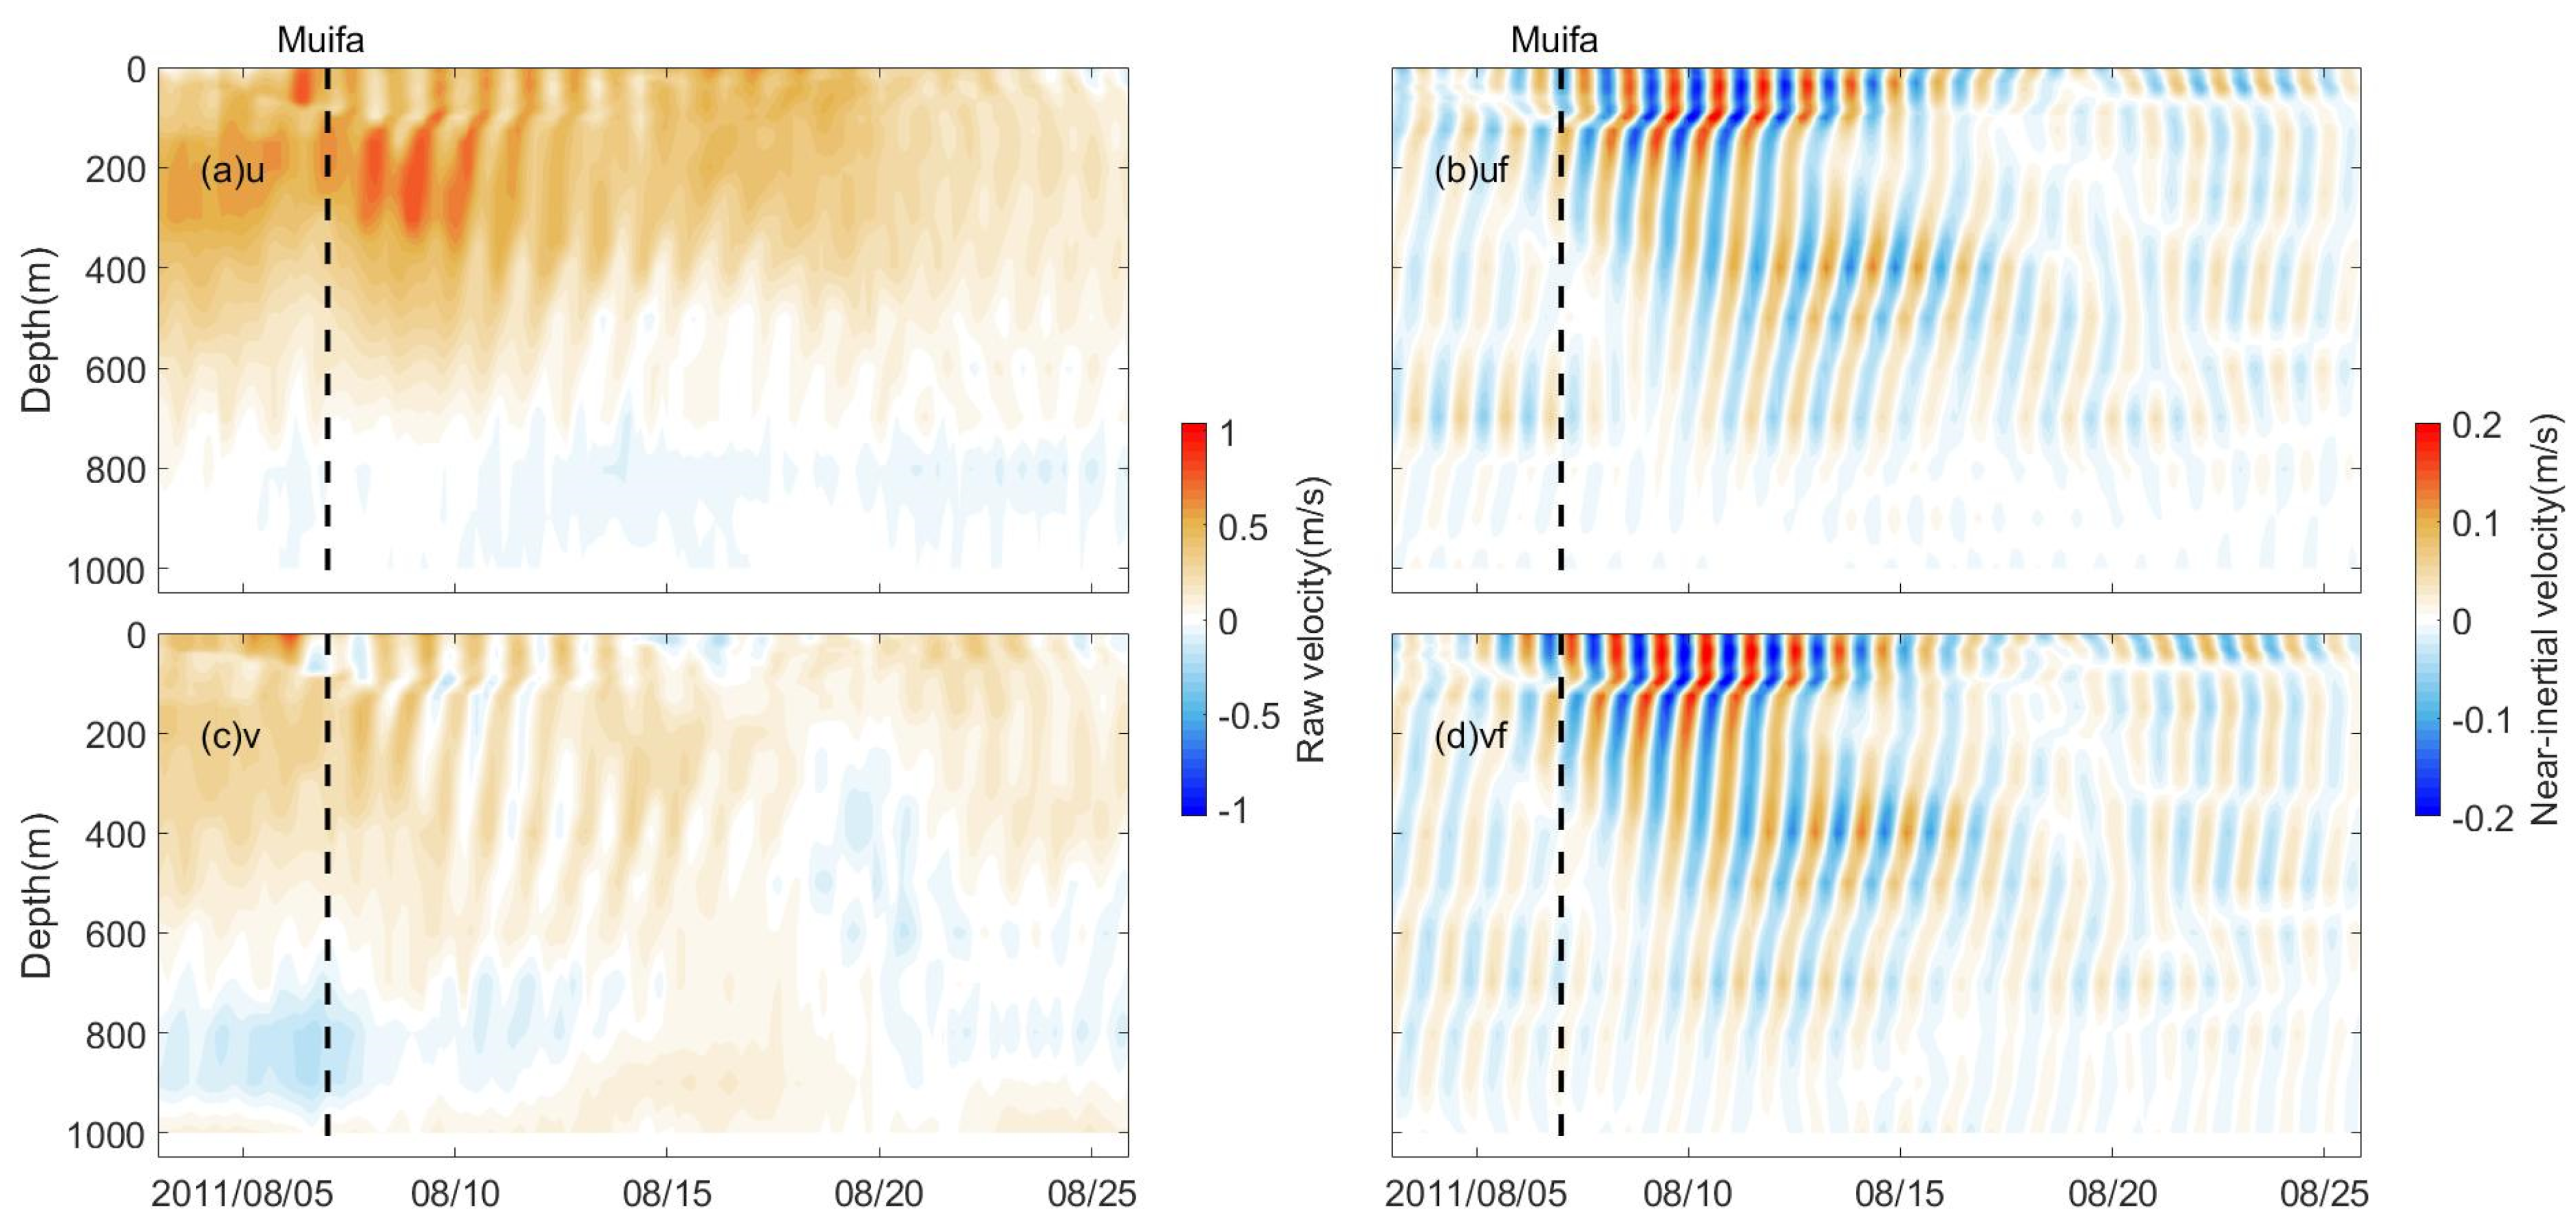
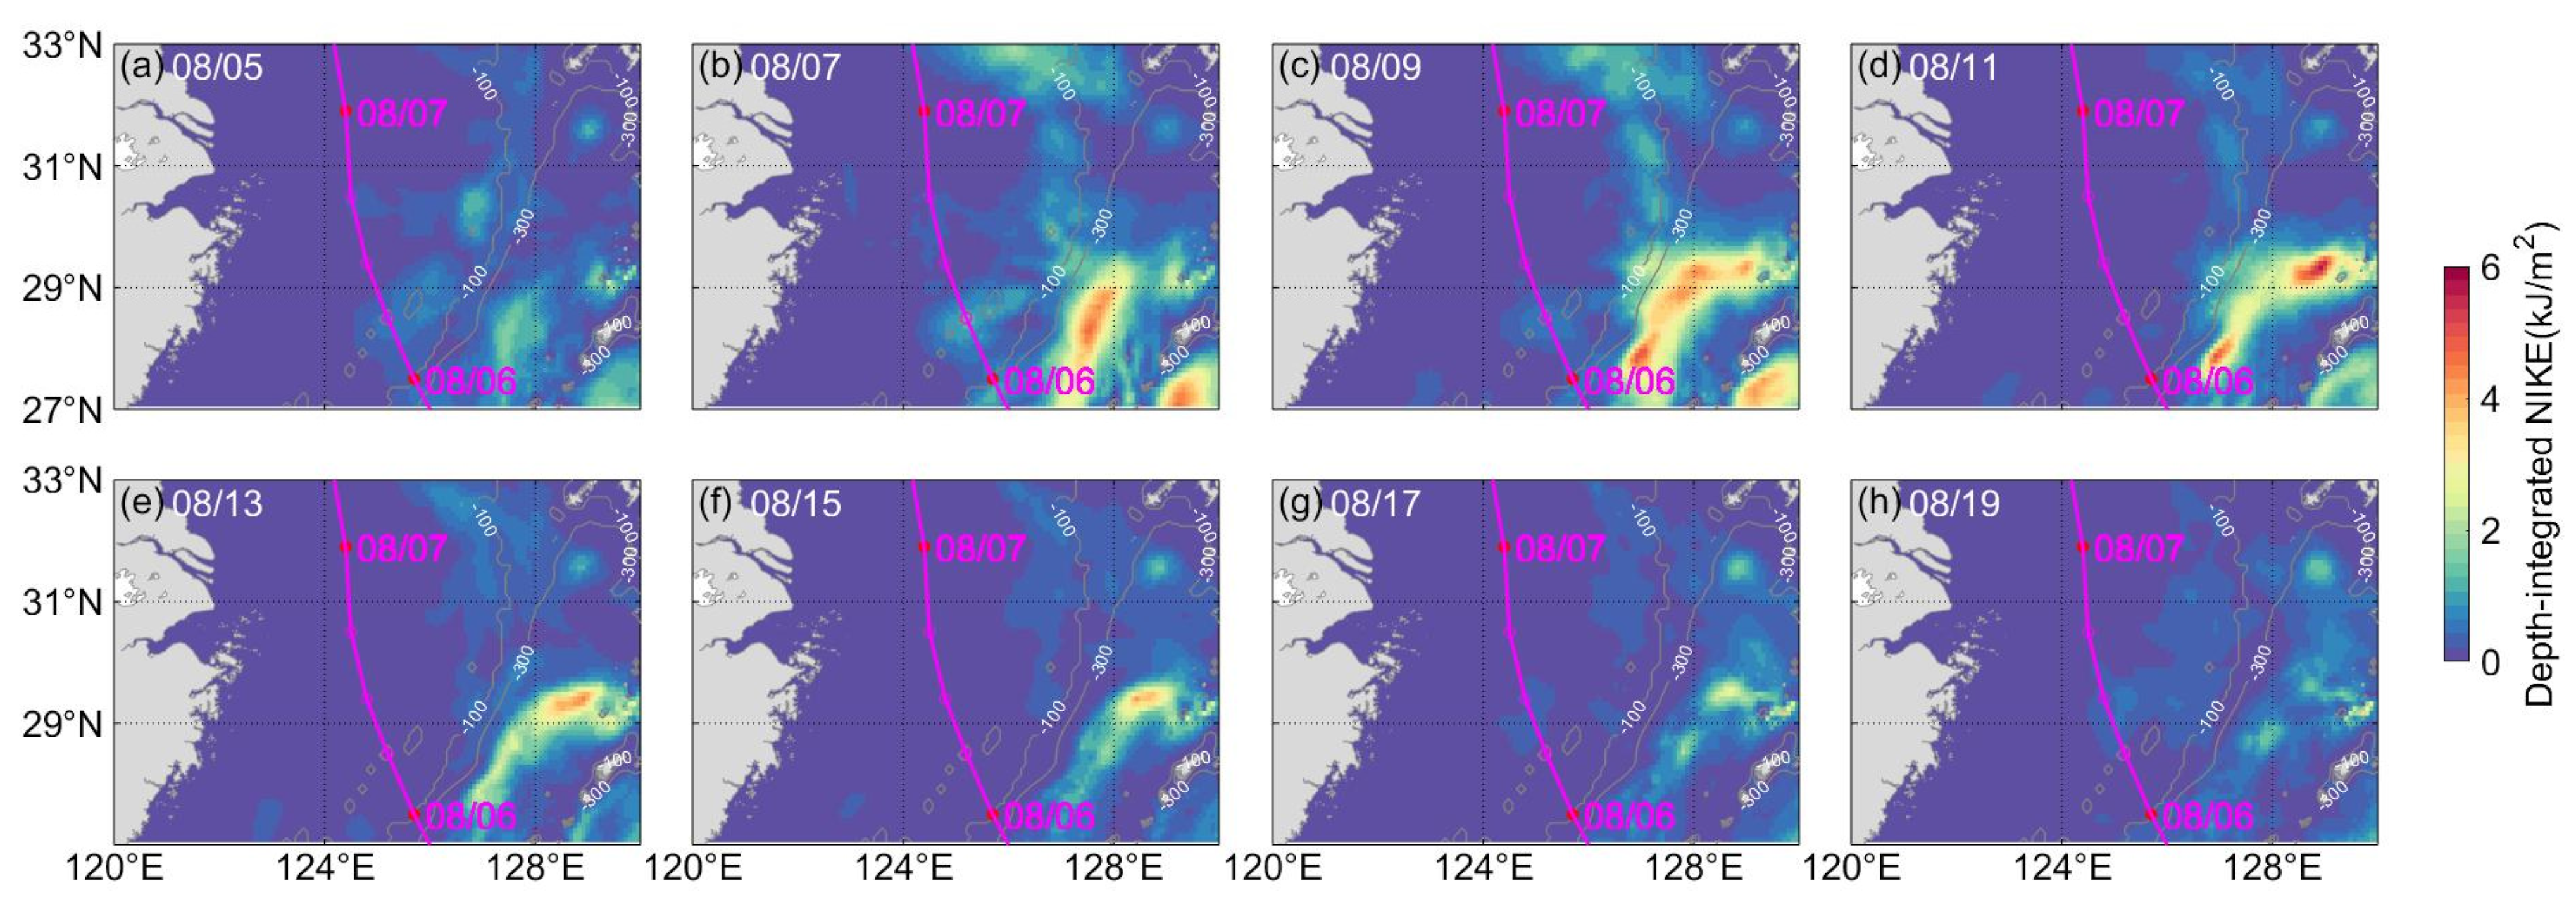
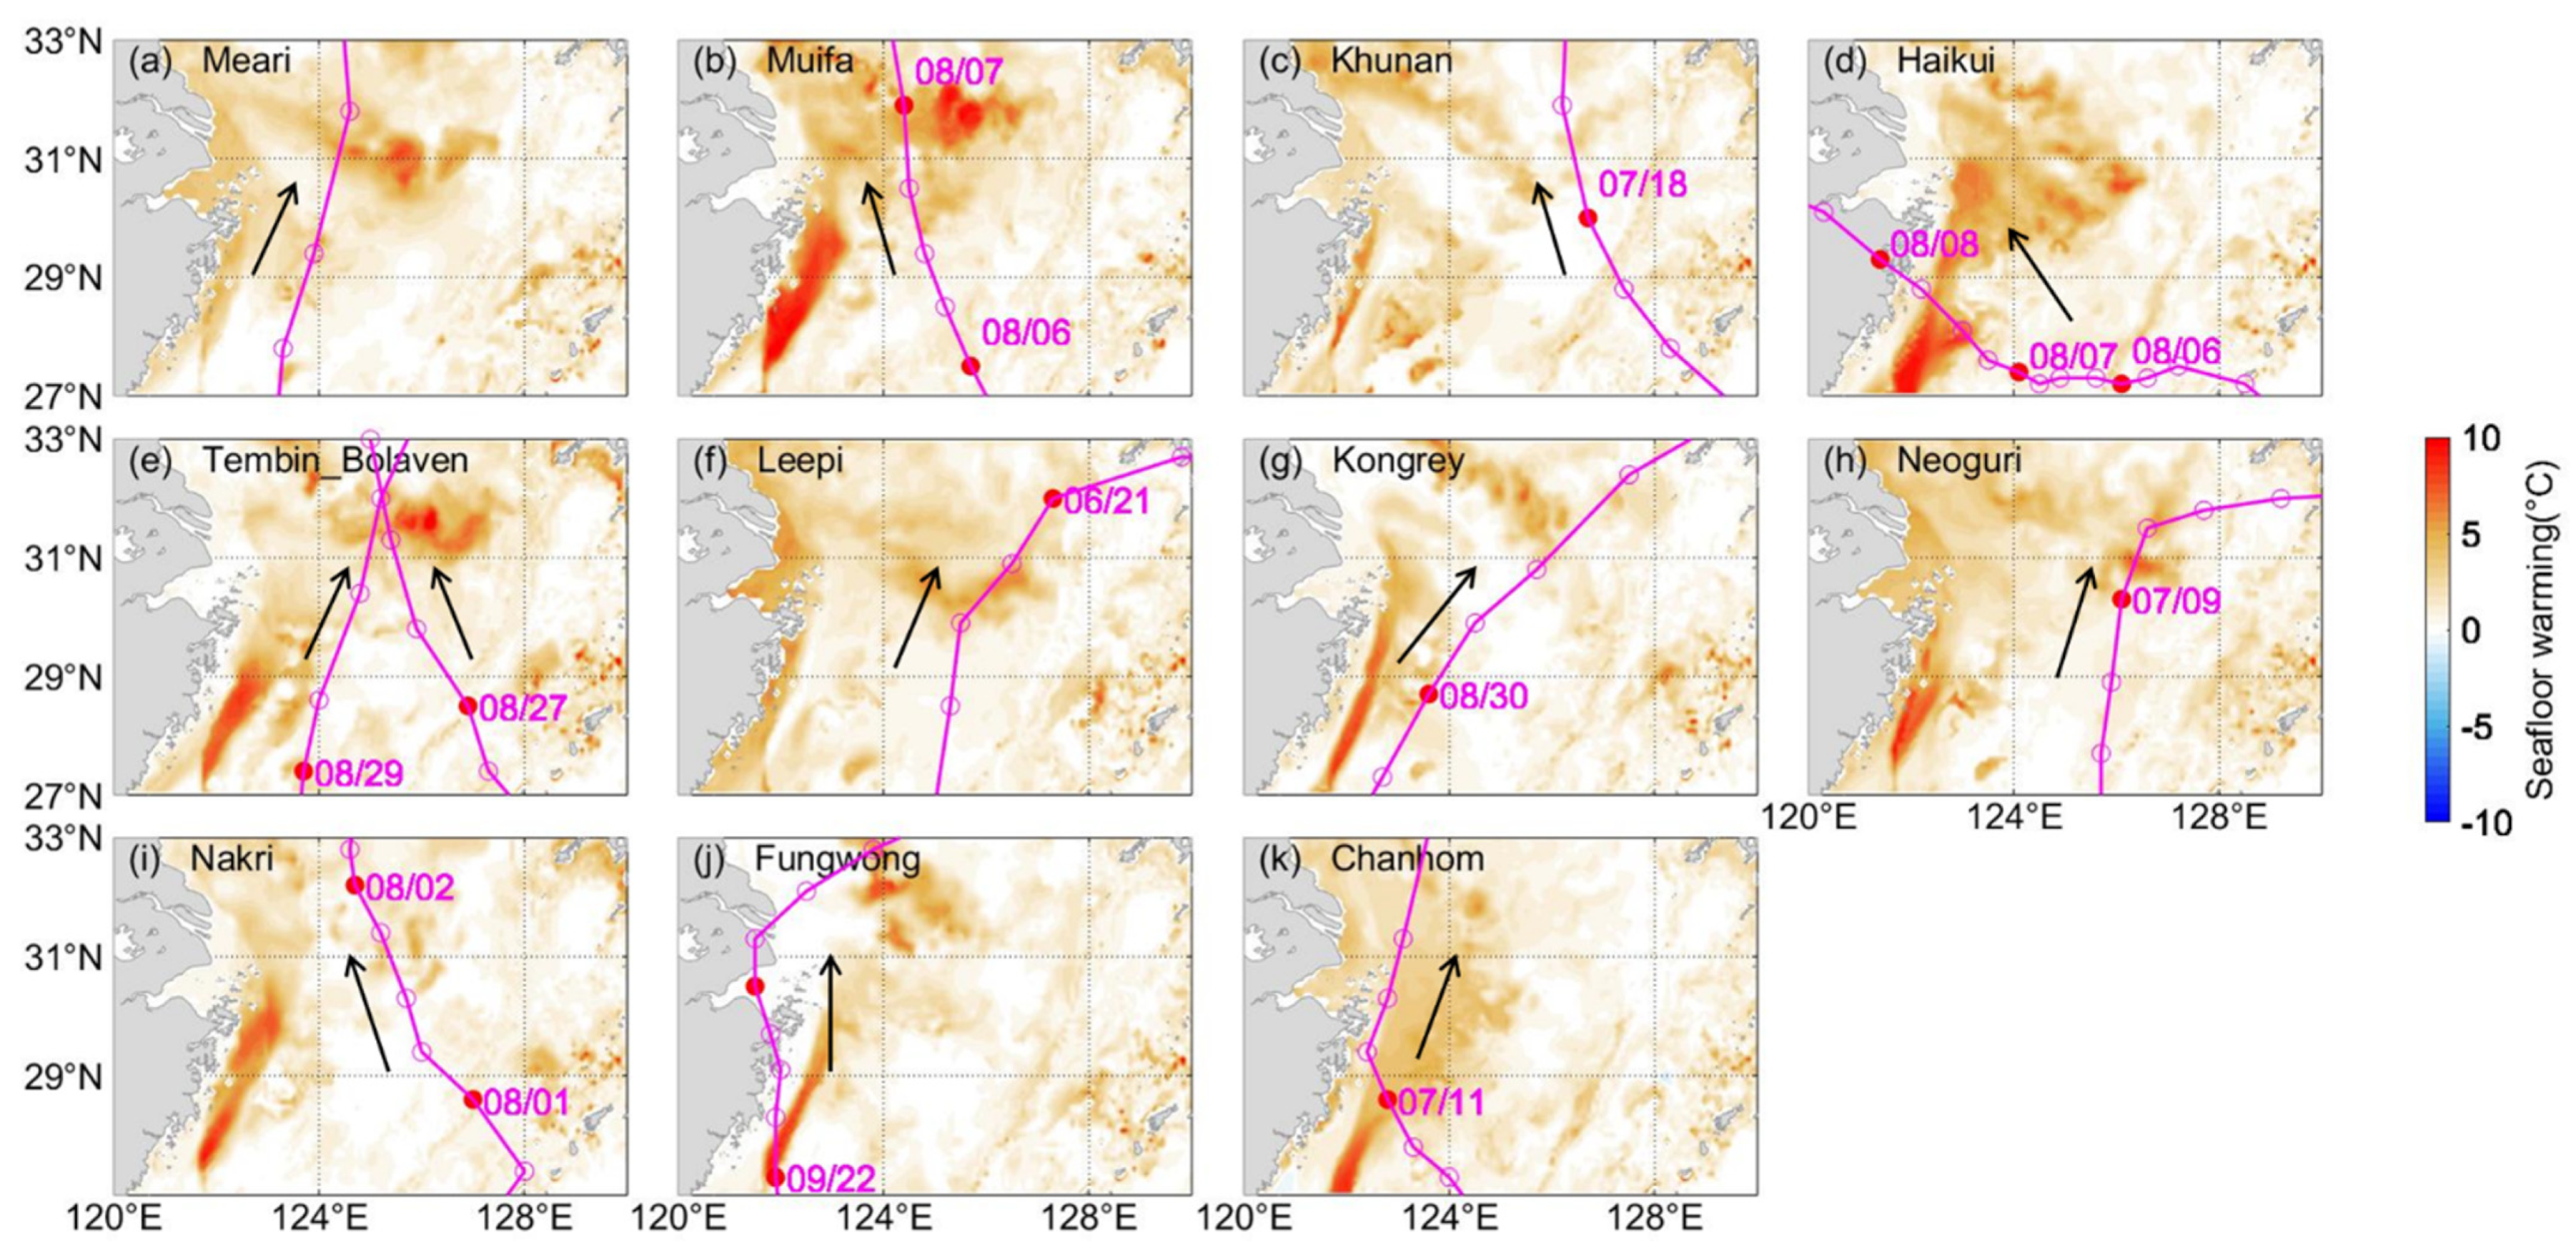
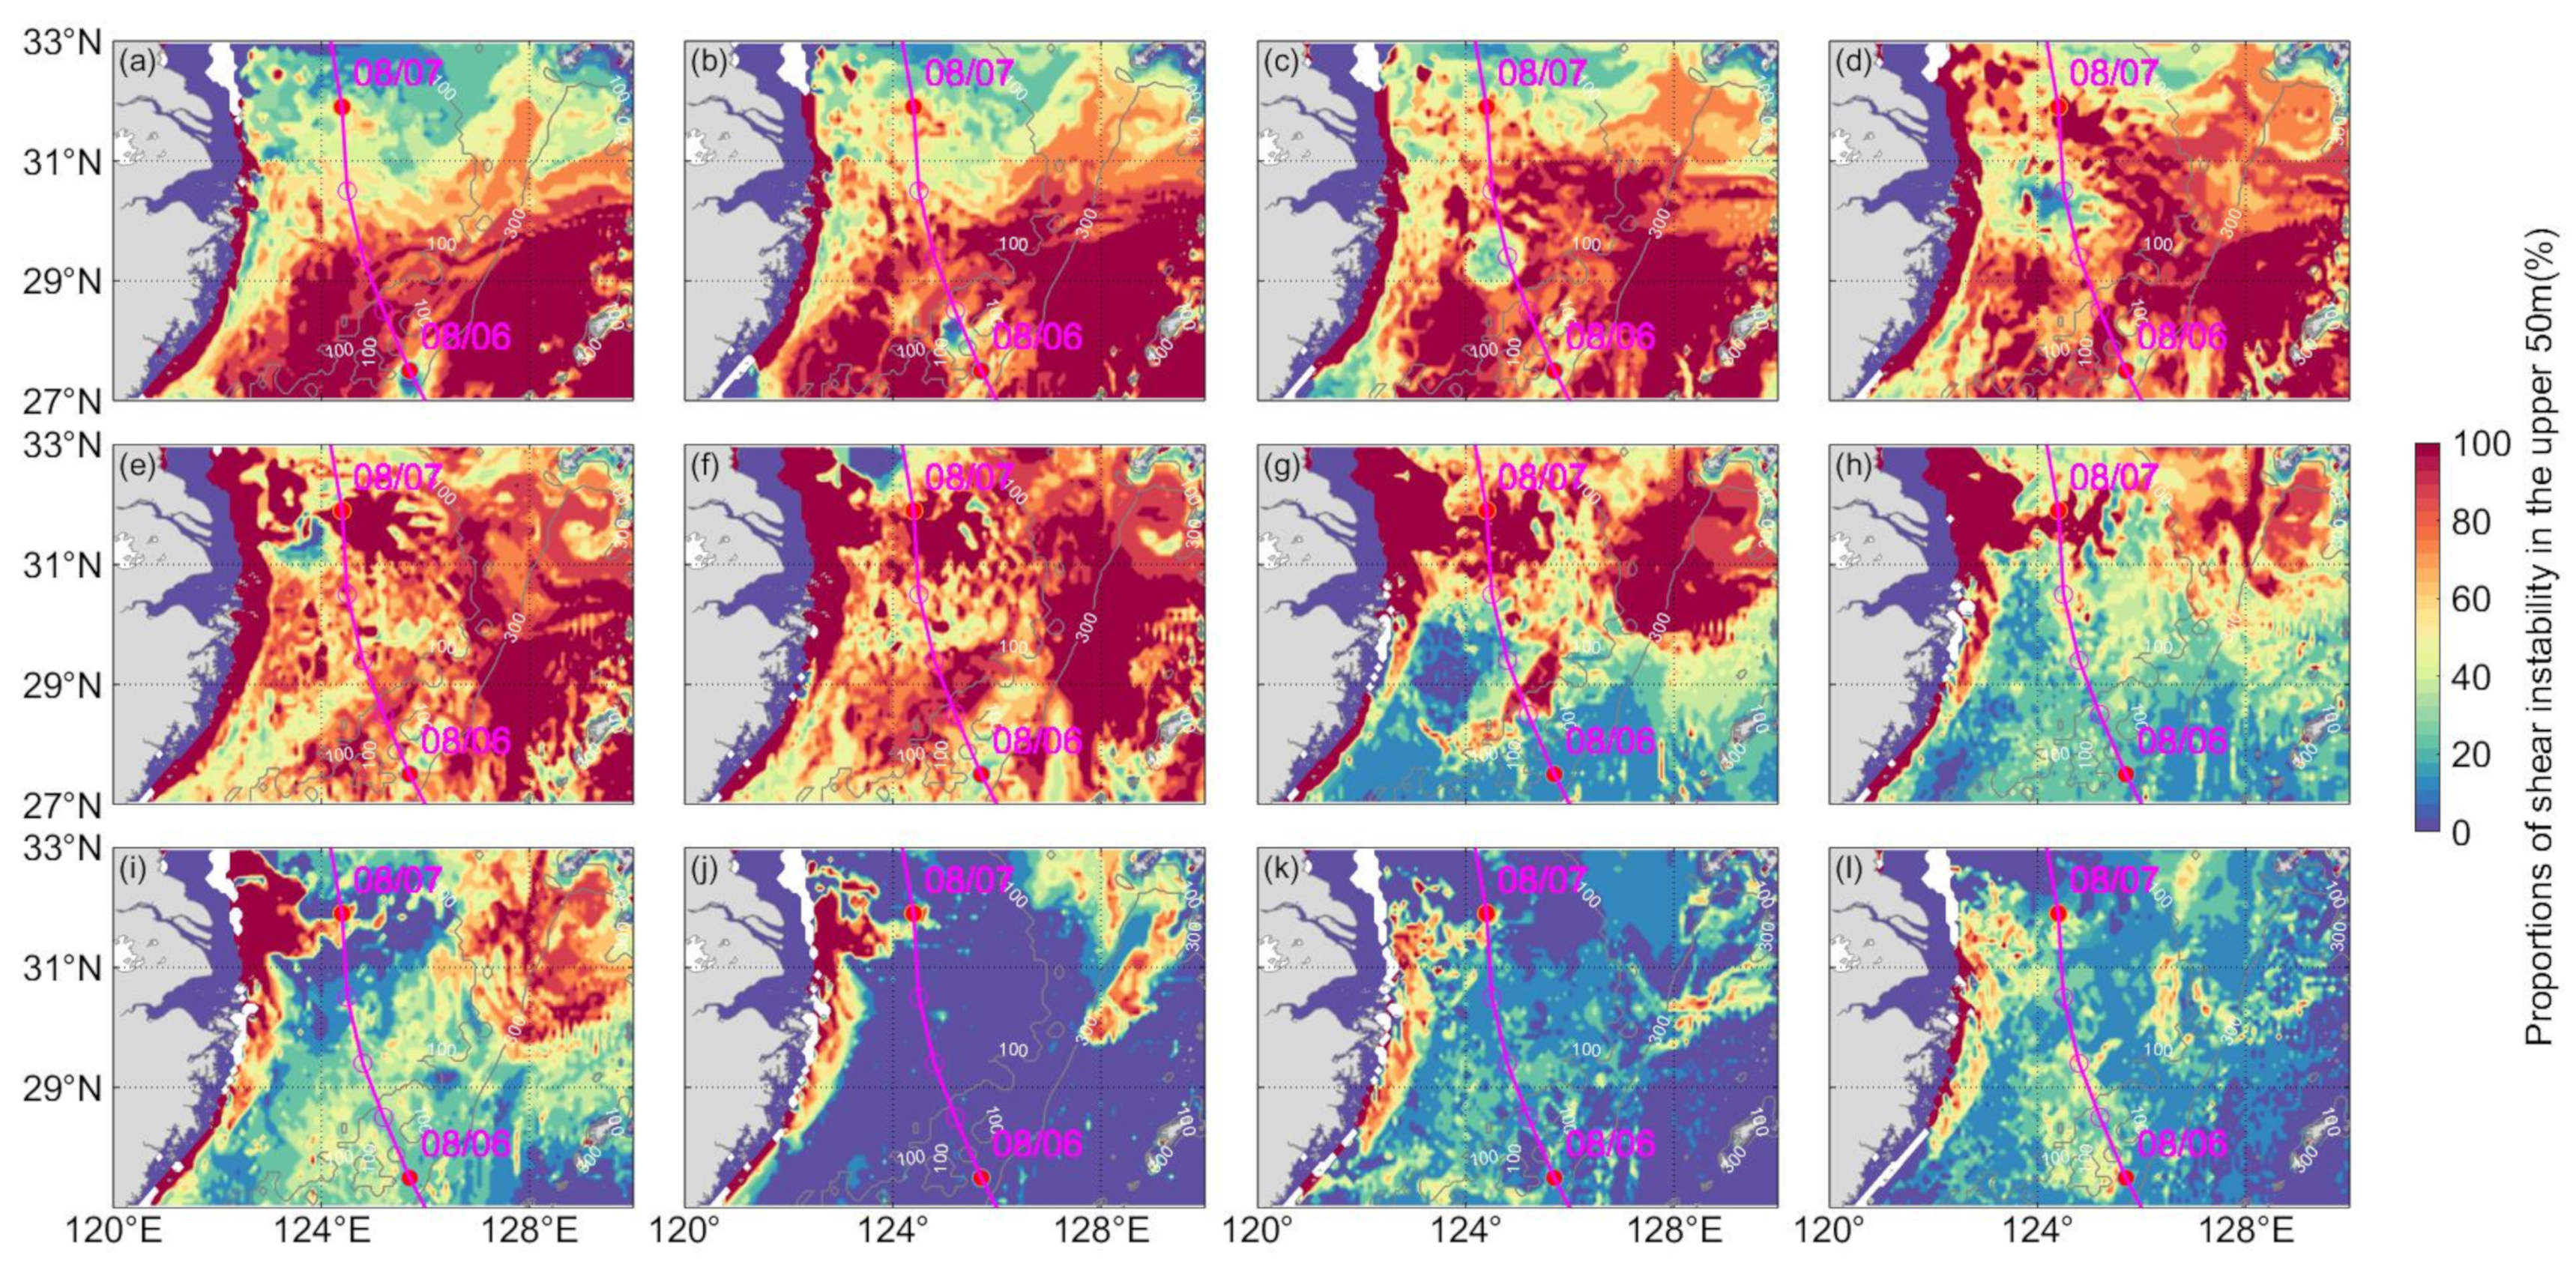
3.1. Dynamical and Thermal Response of Zhejiang Coastal Waters to Typhoon Muifa in 2011
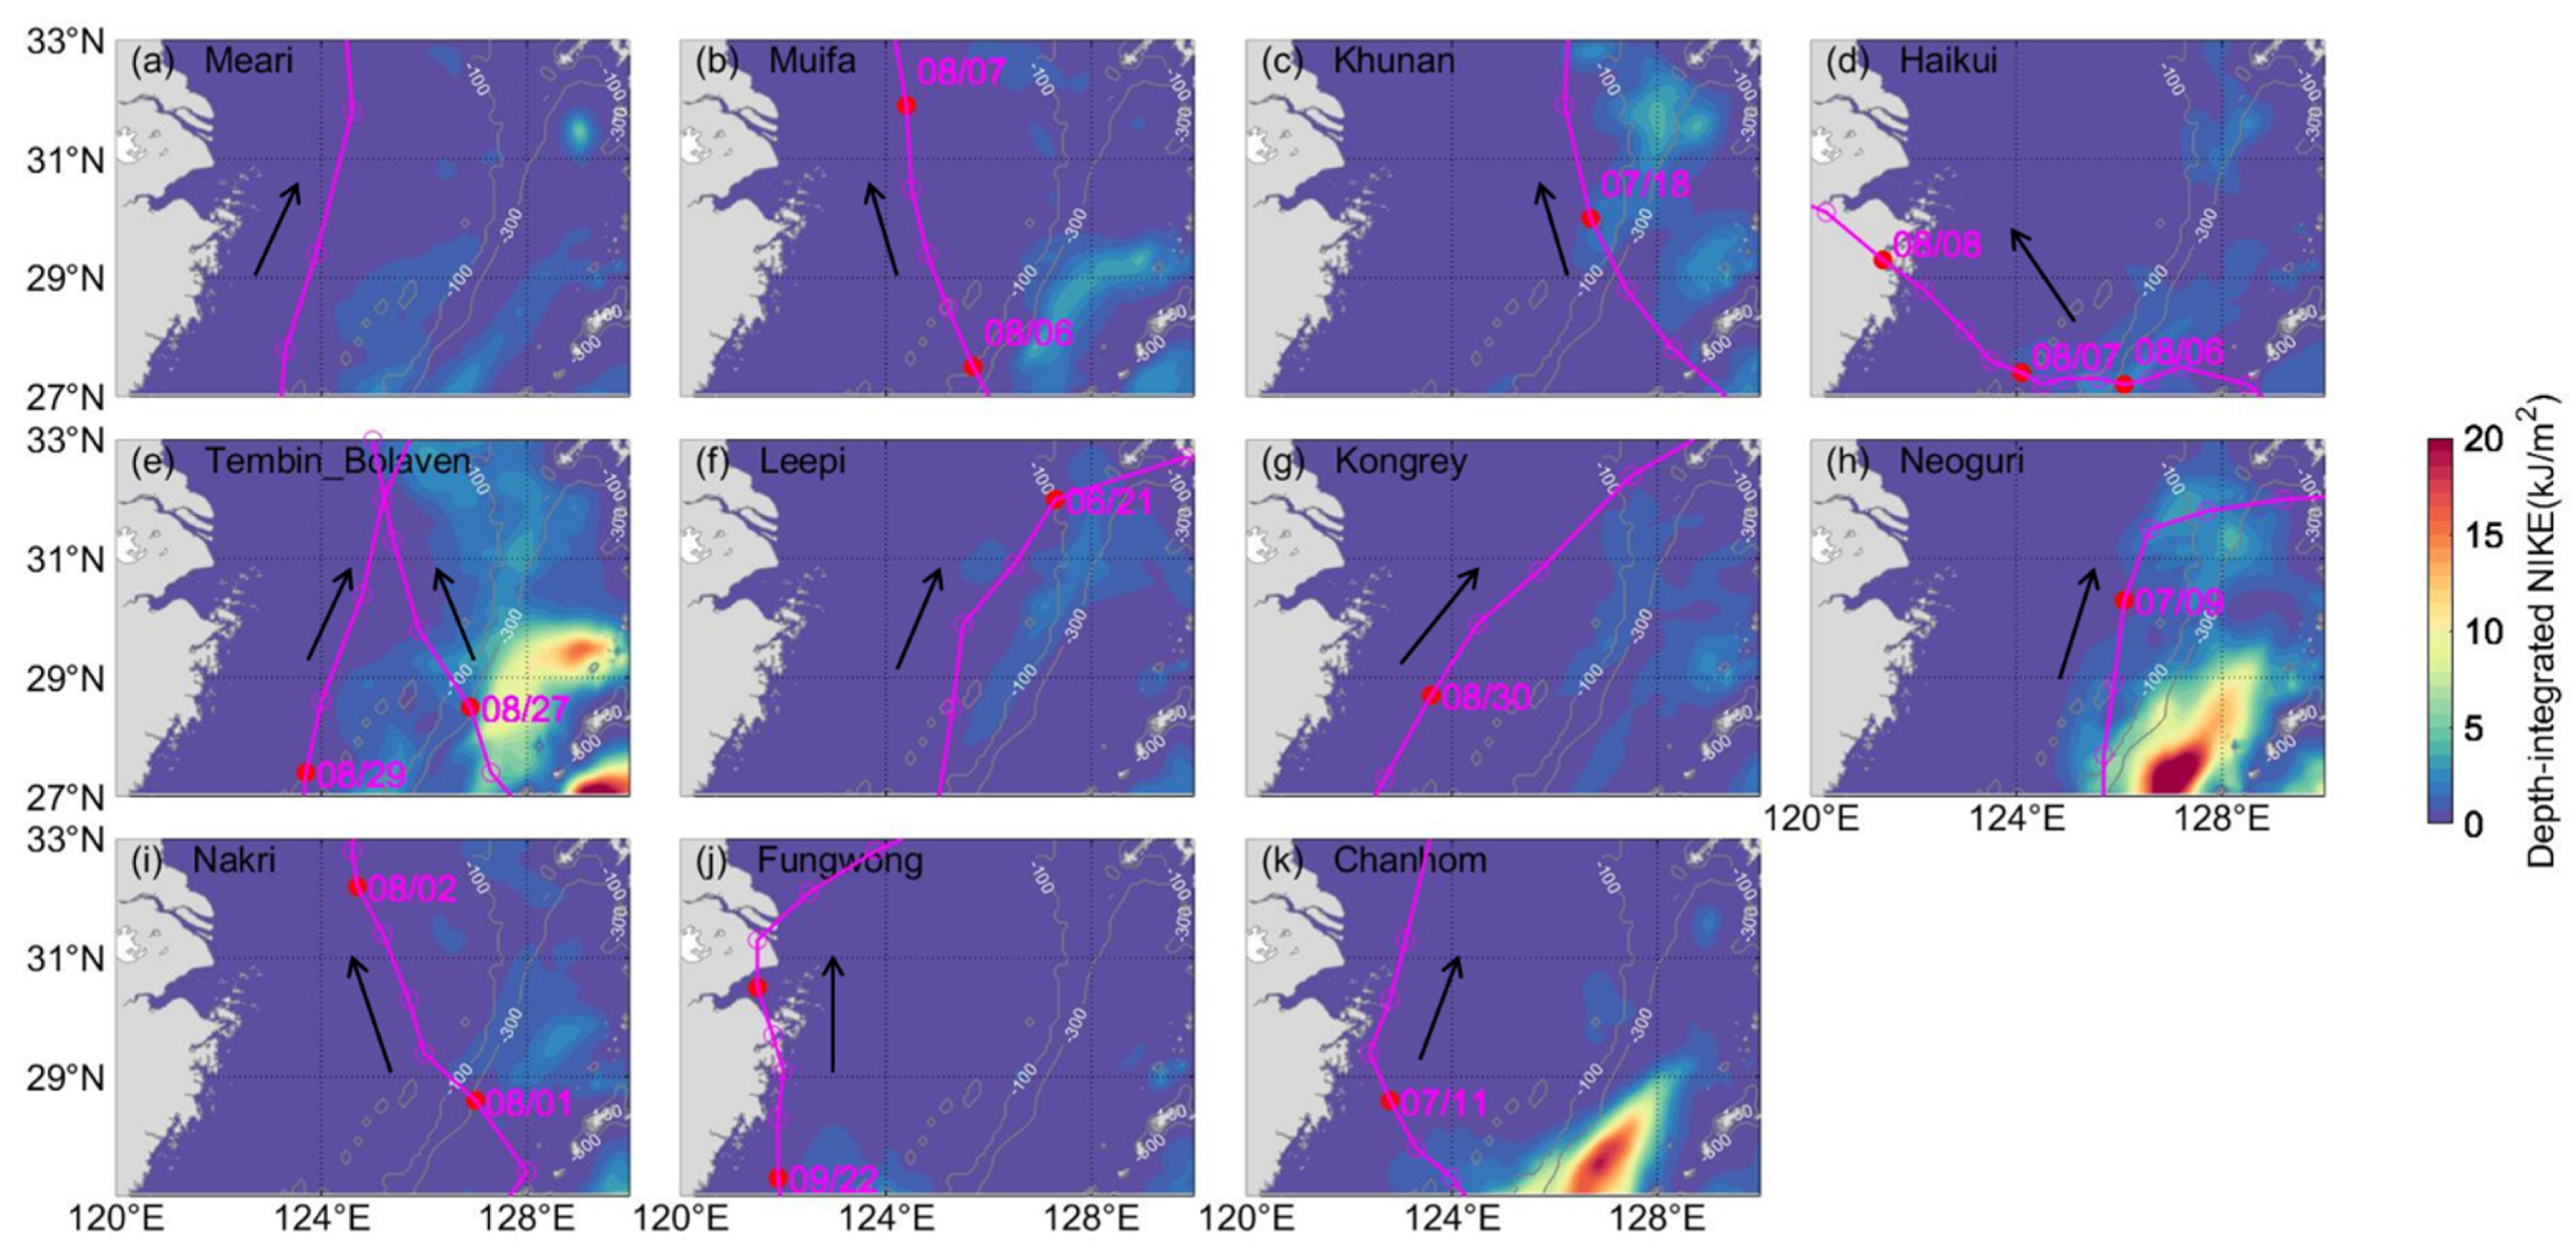
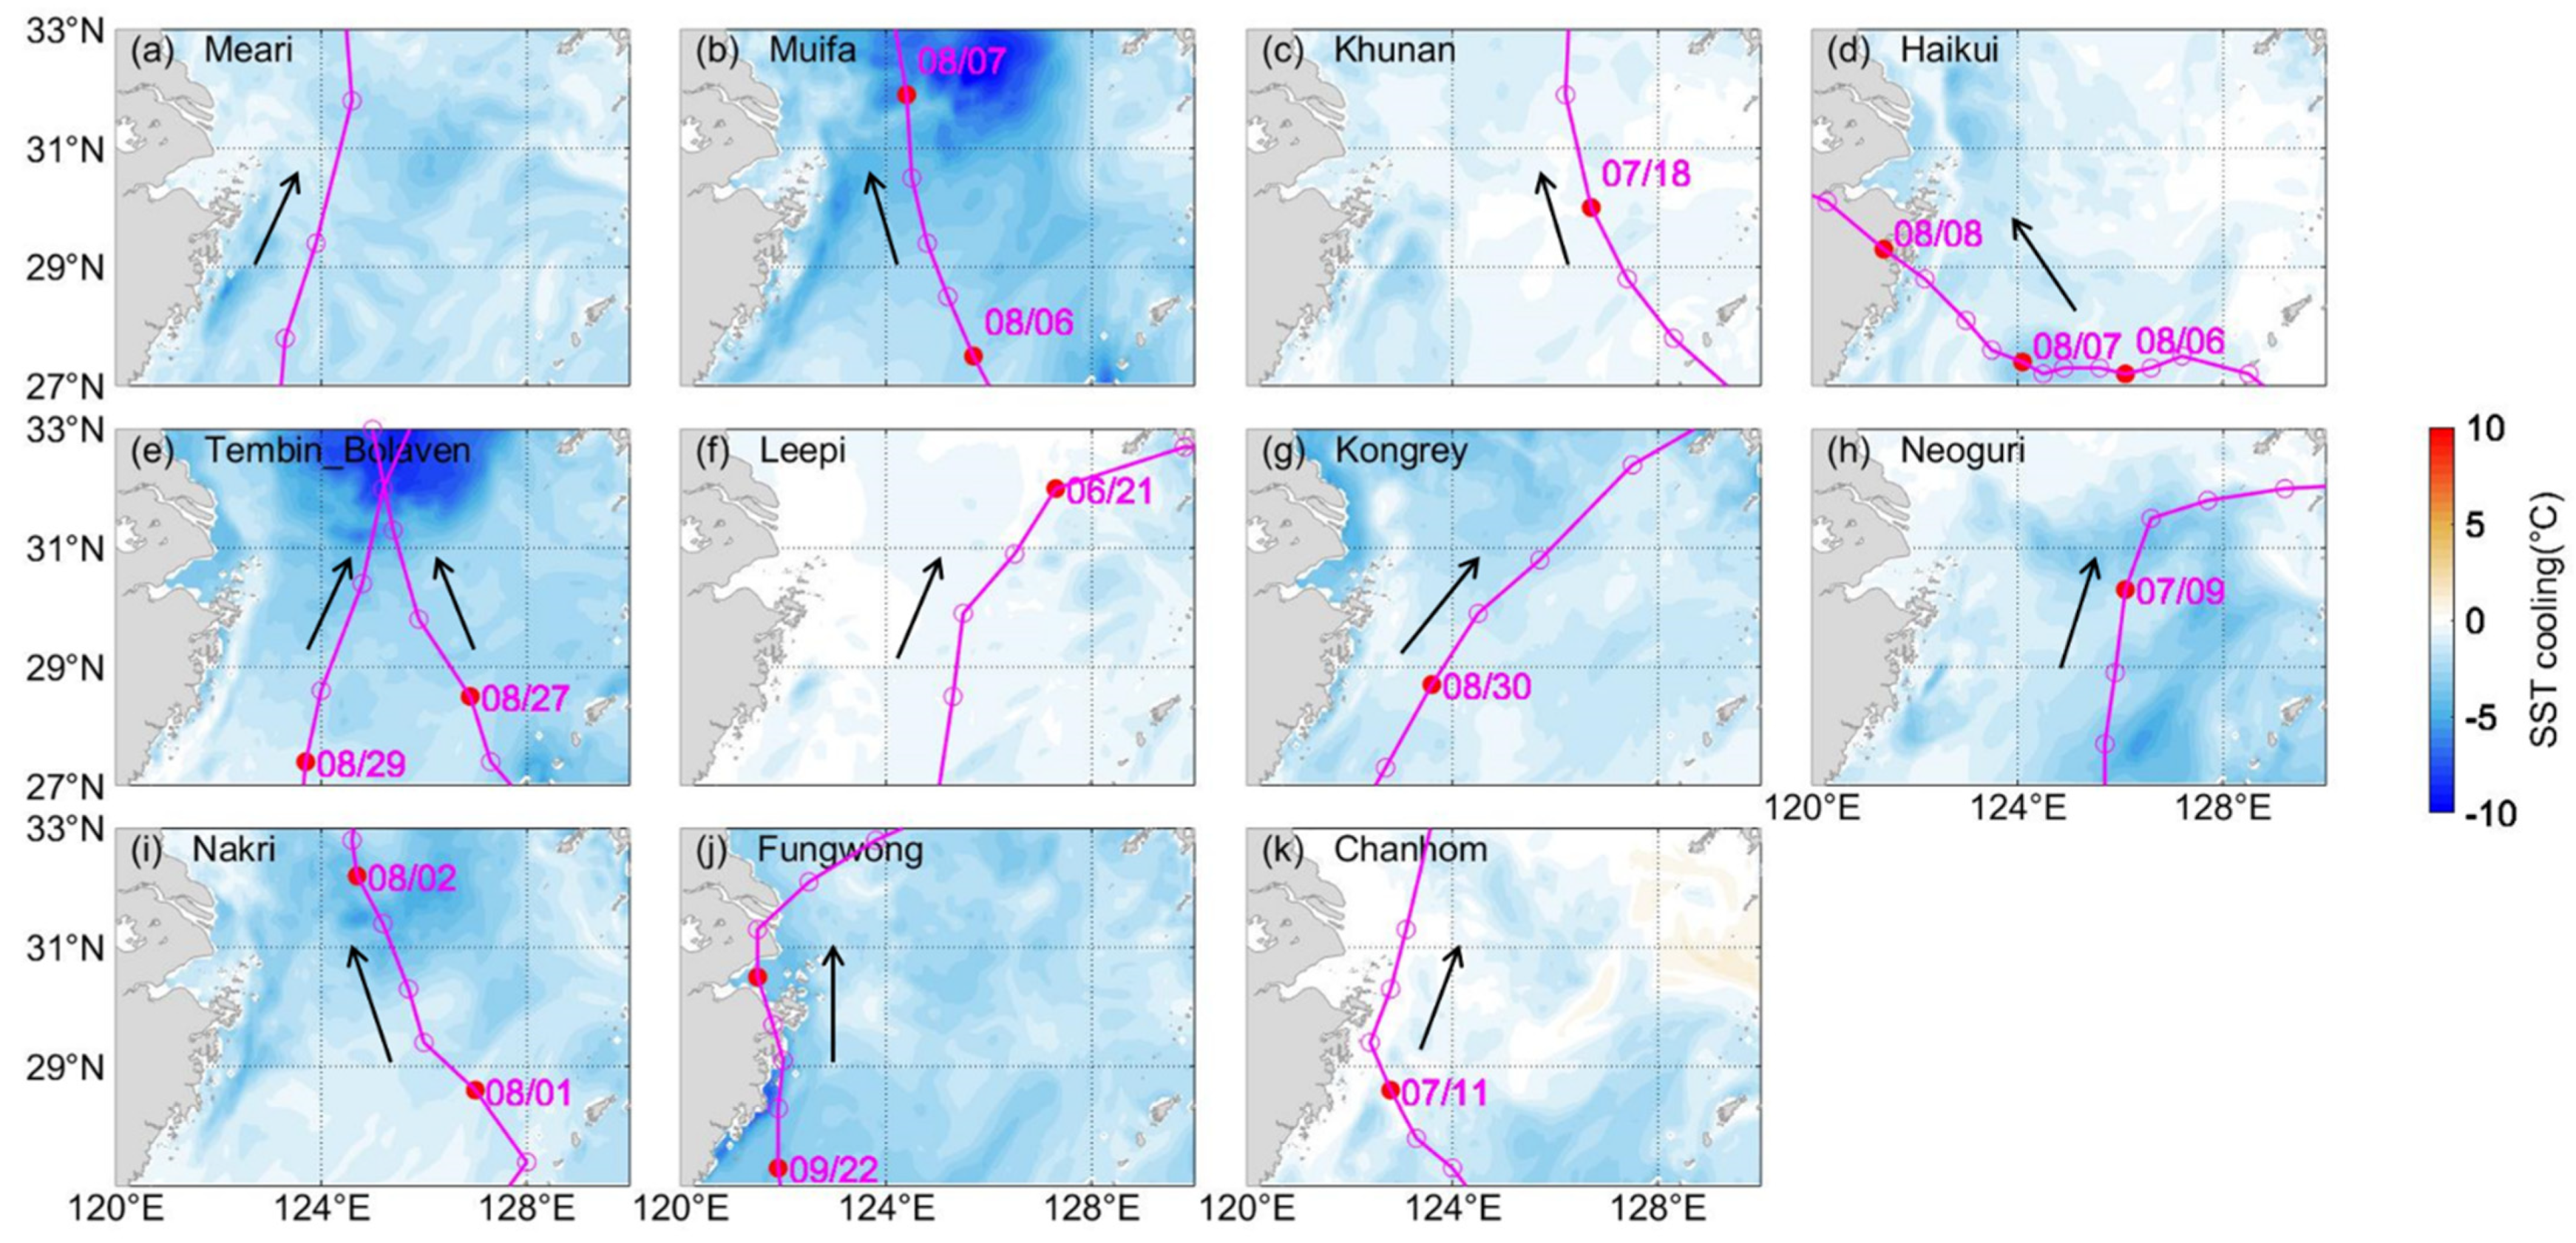
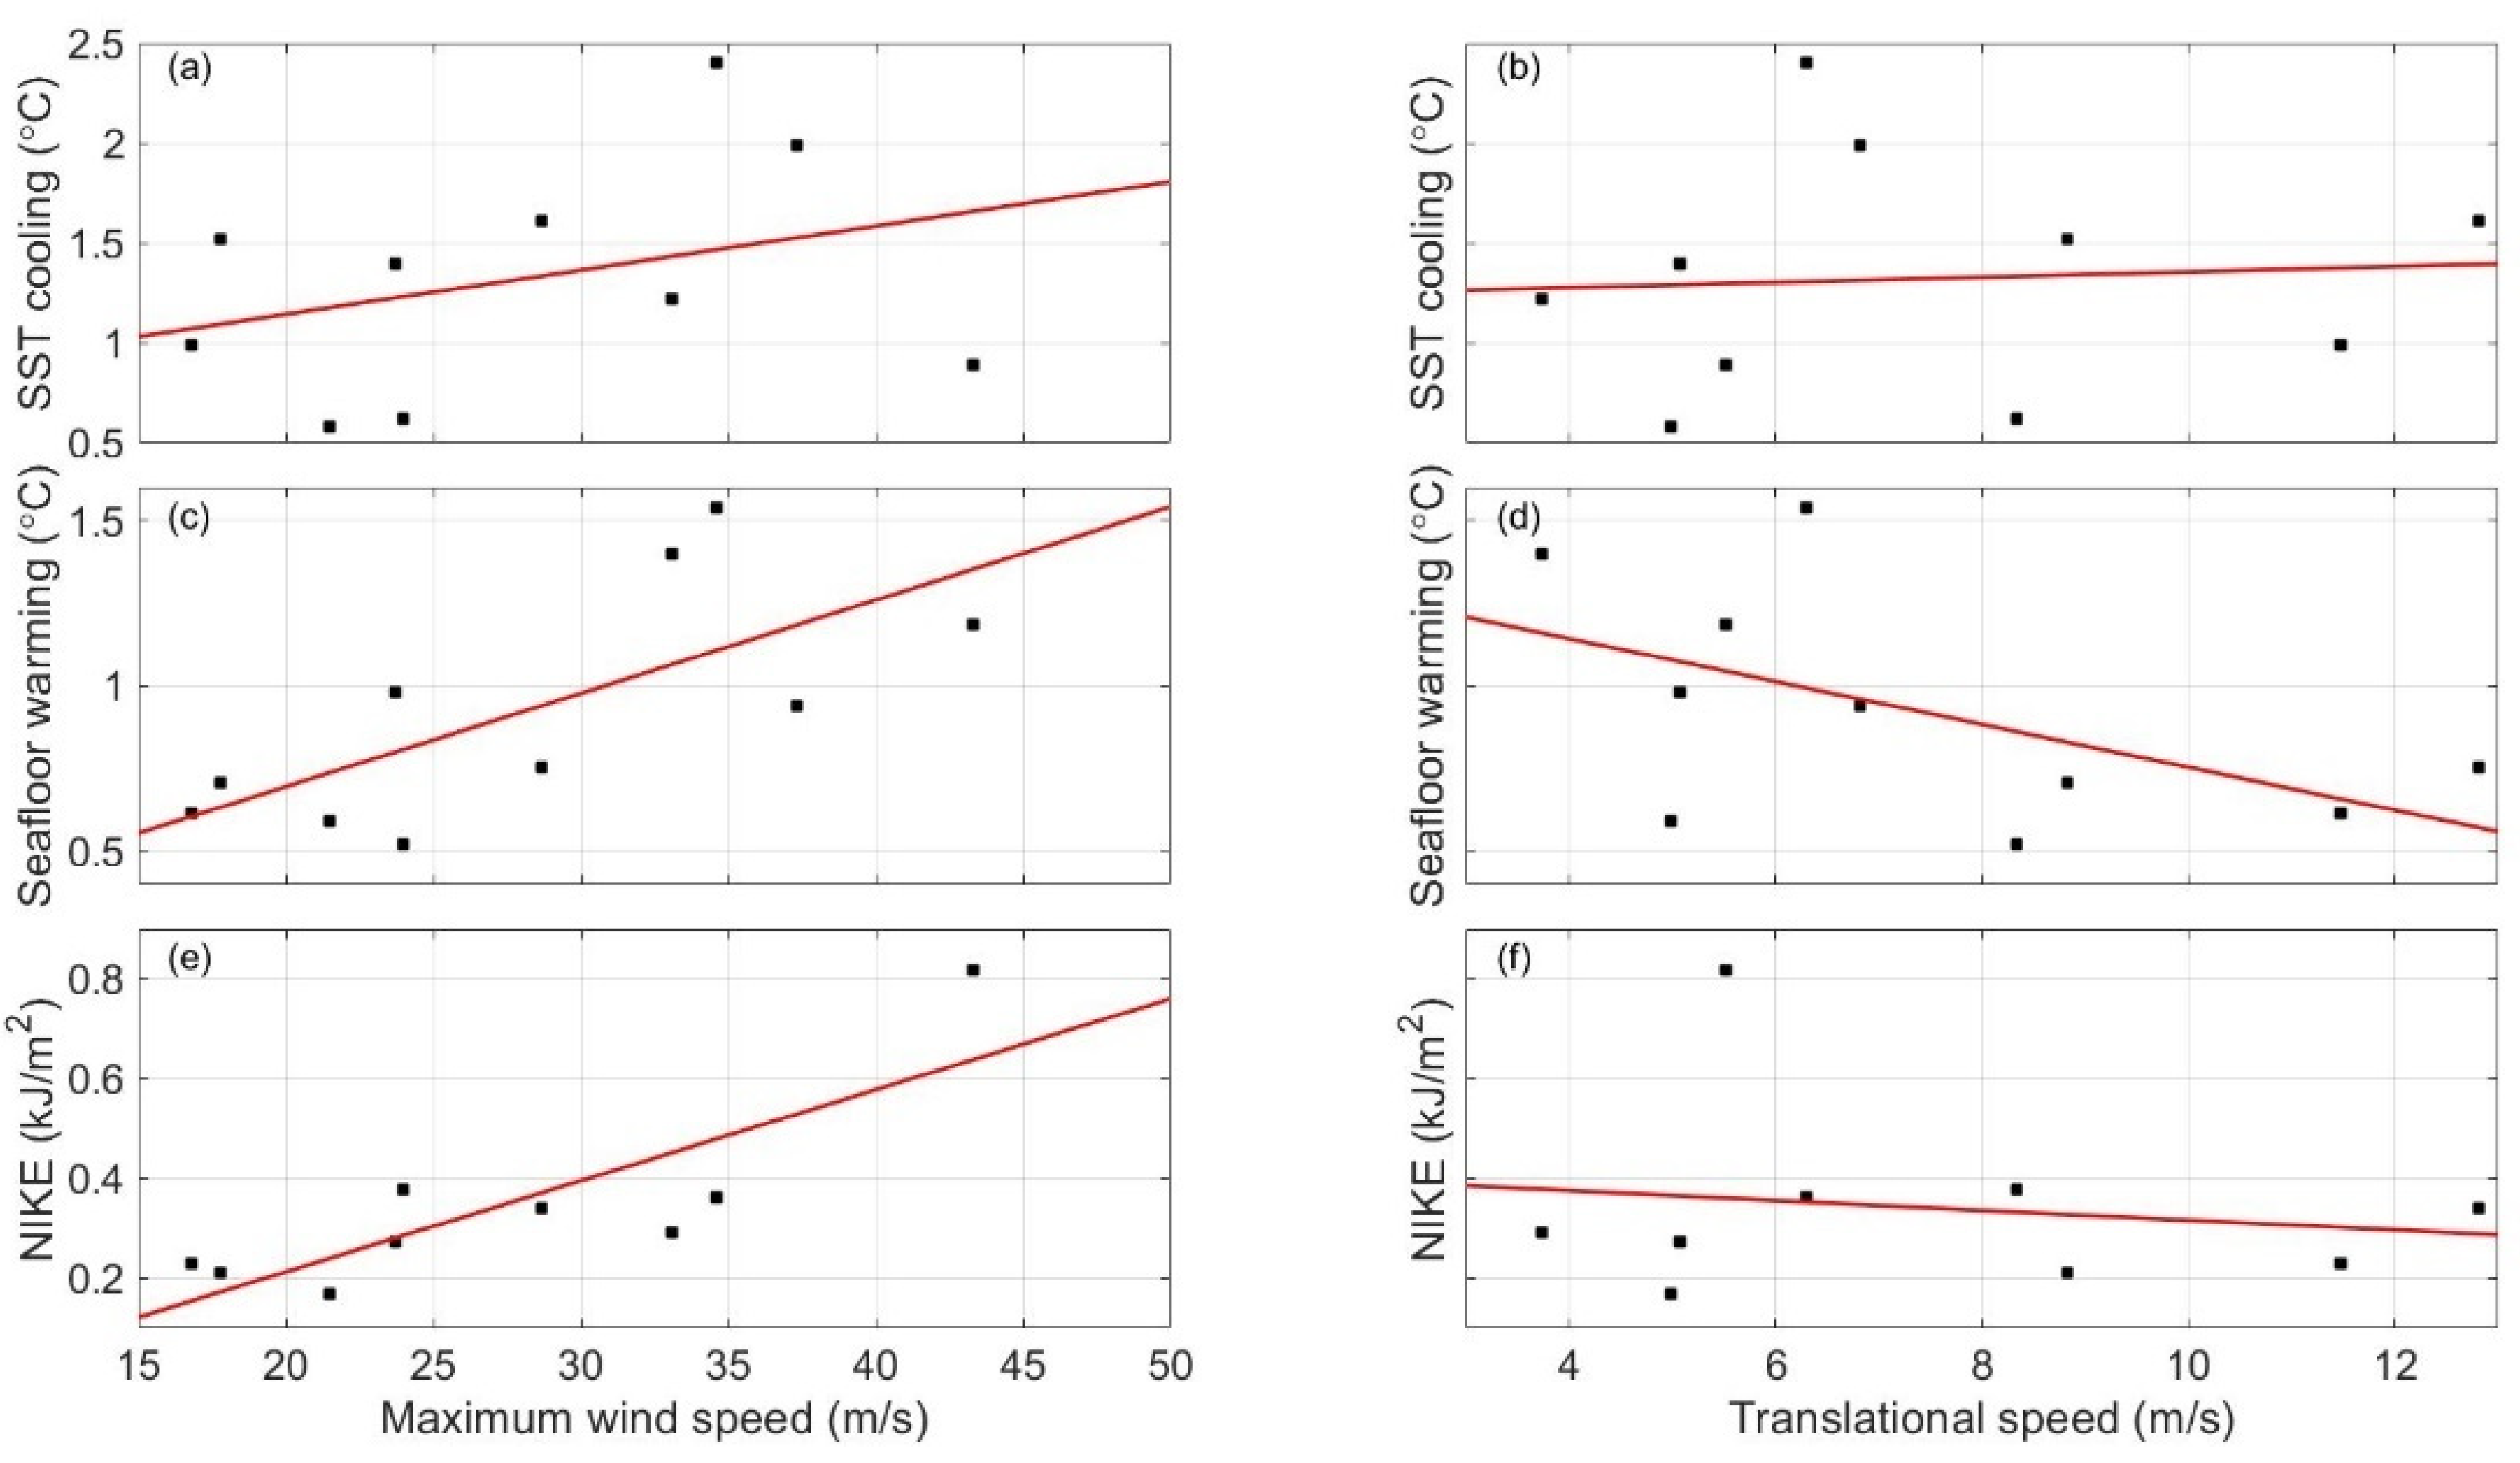
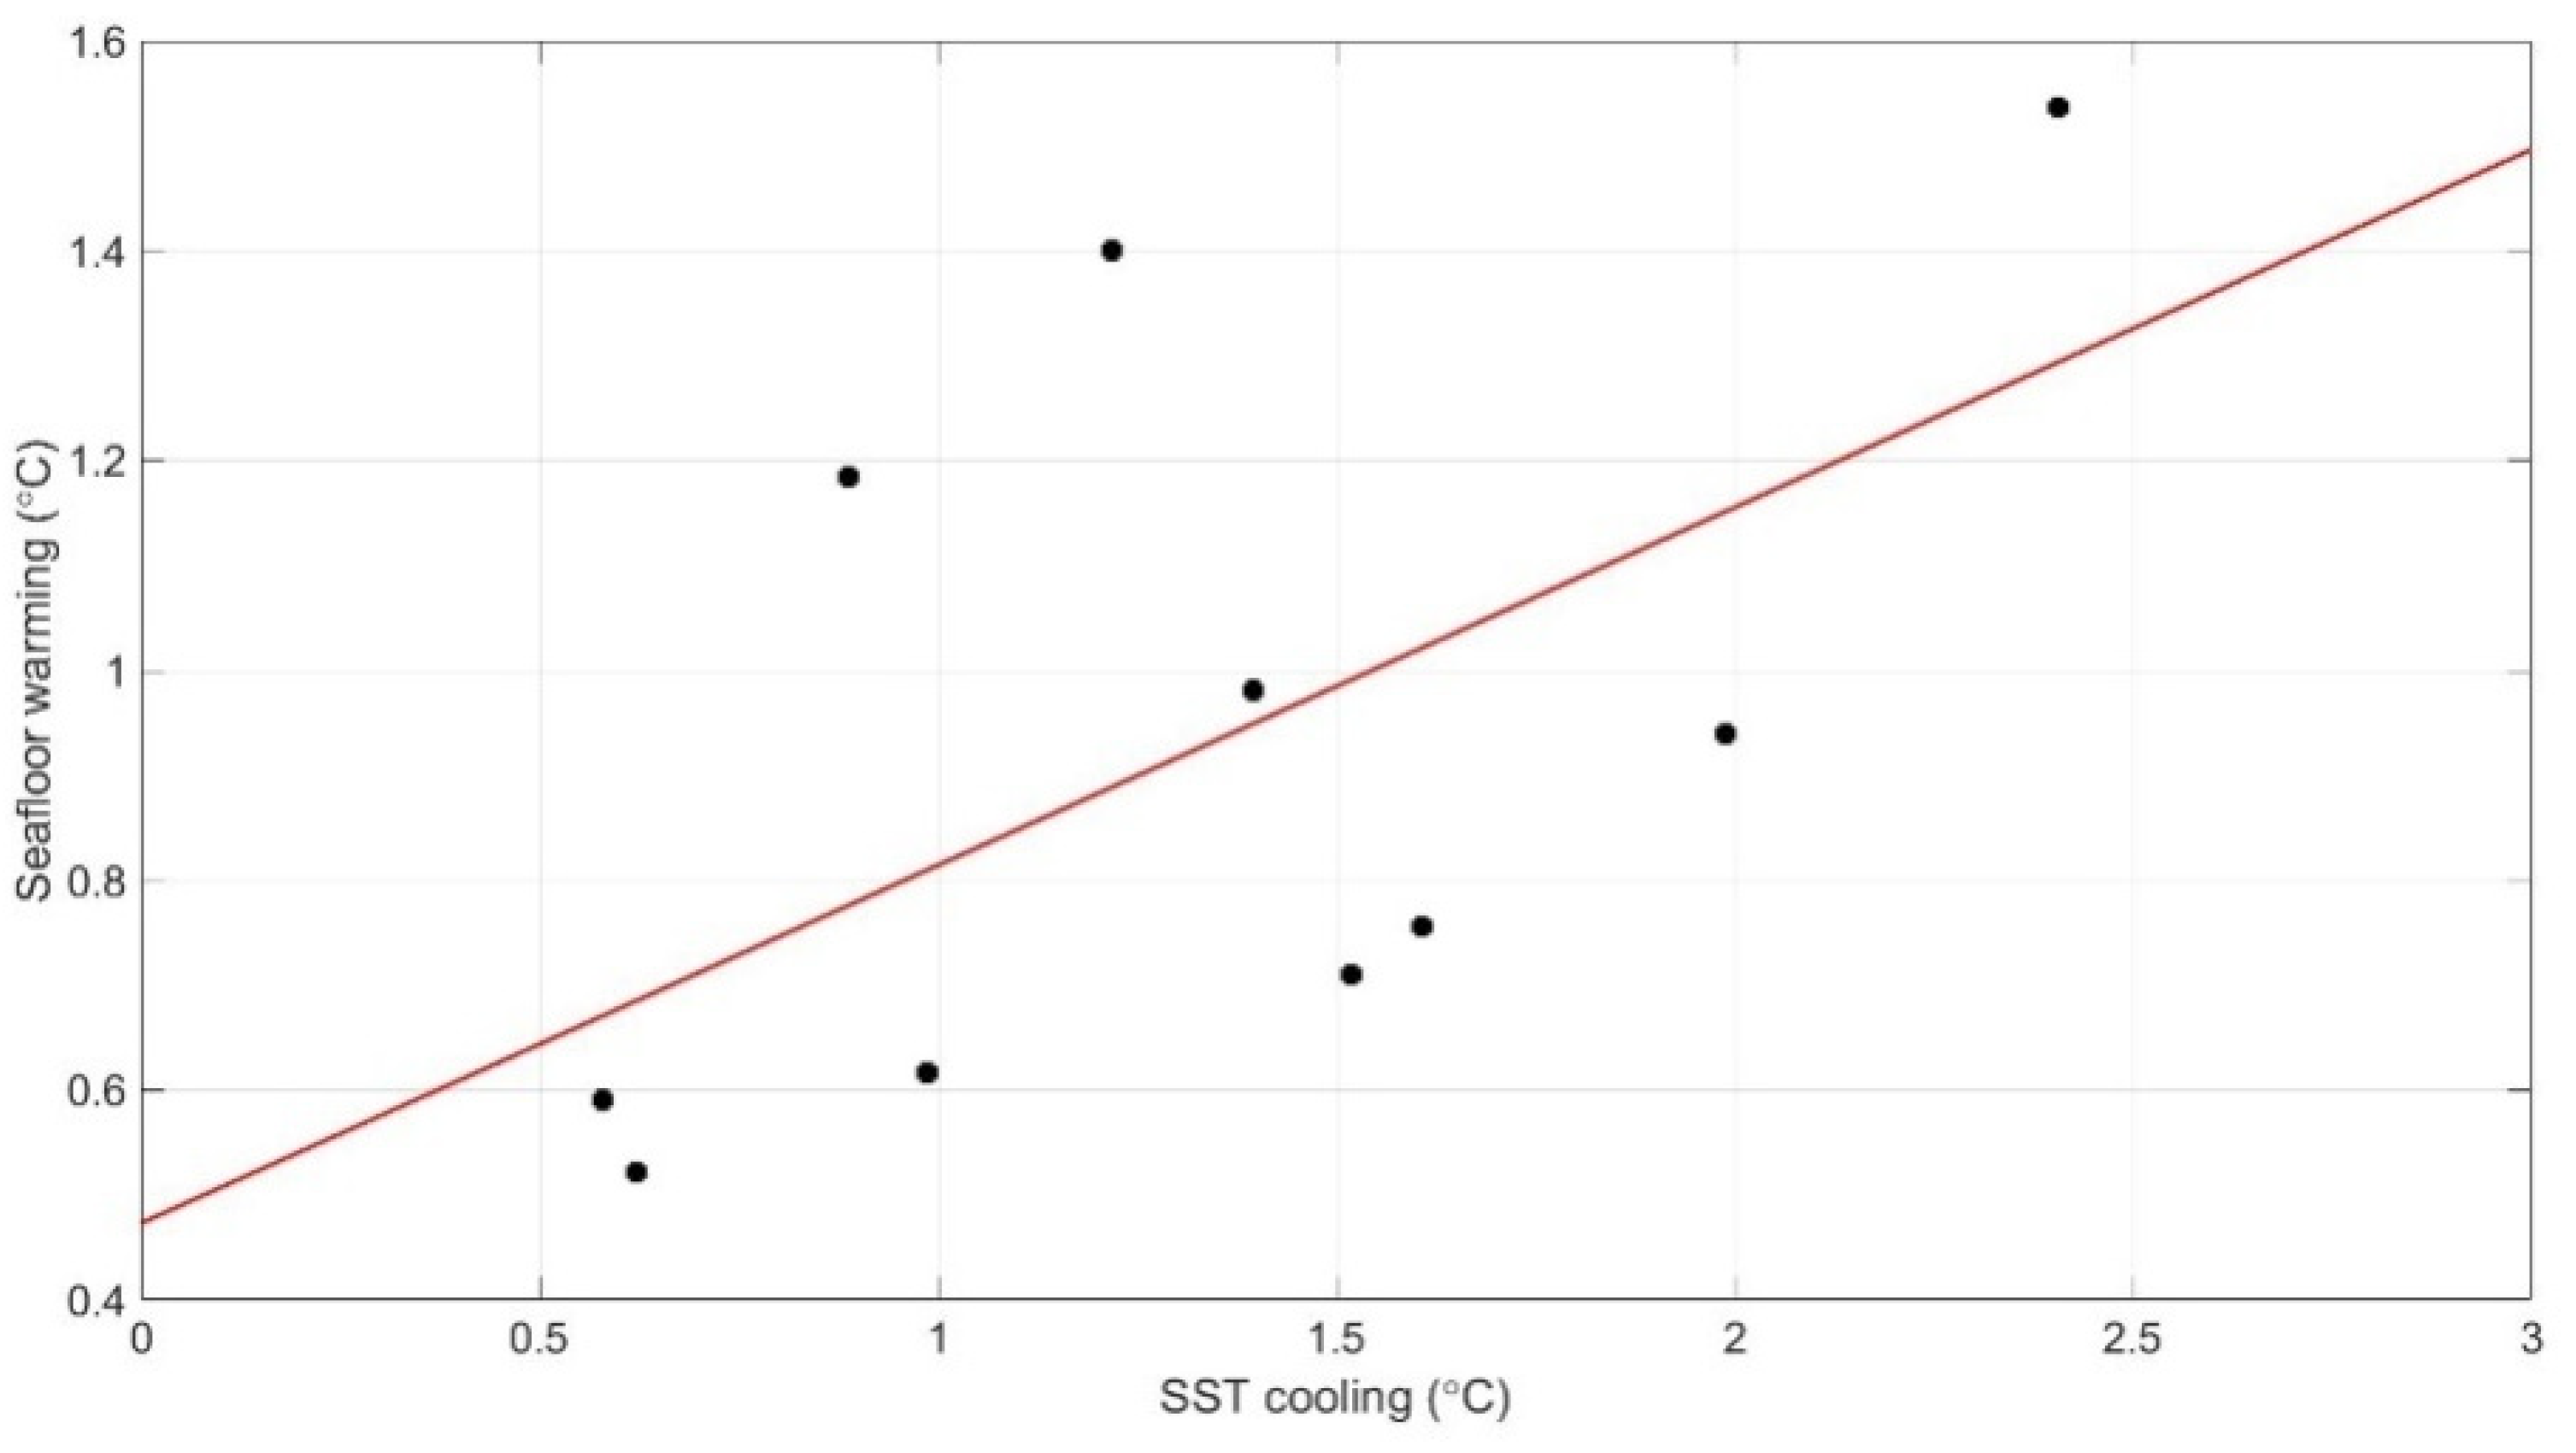
3.2. Correlation between the Oceanic Response of Zhejiang Coastal Waters and Typhoon Characteristics
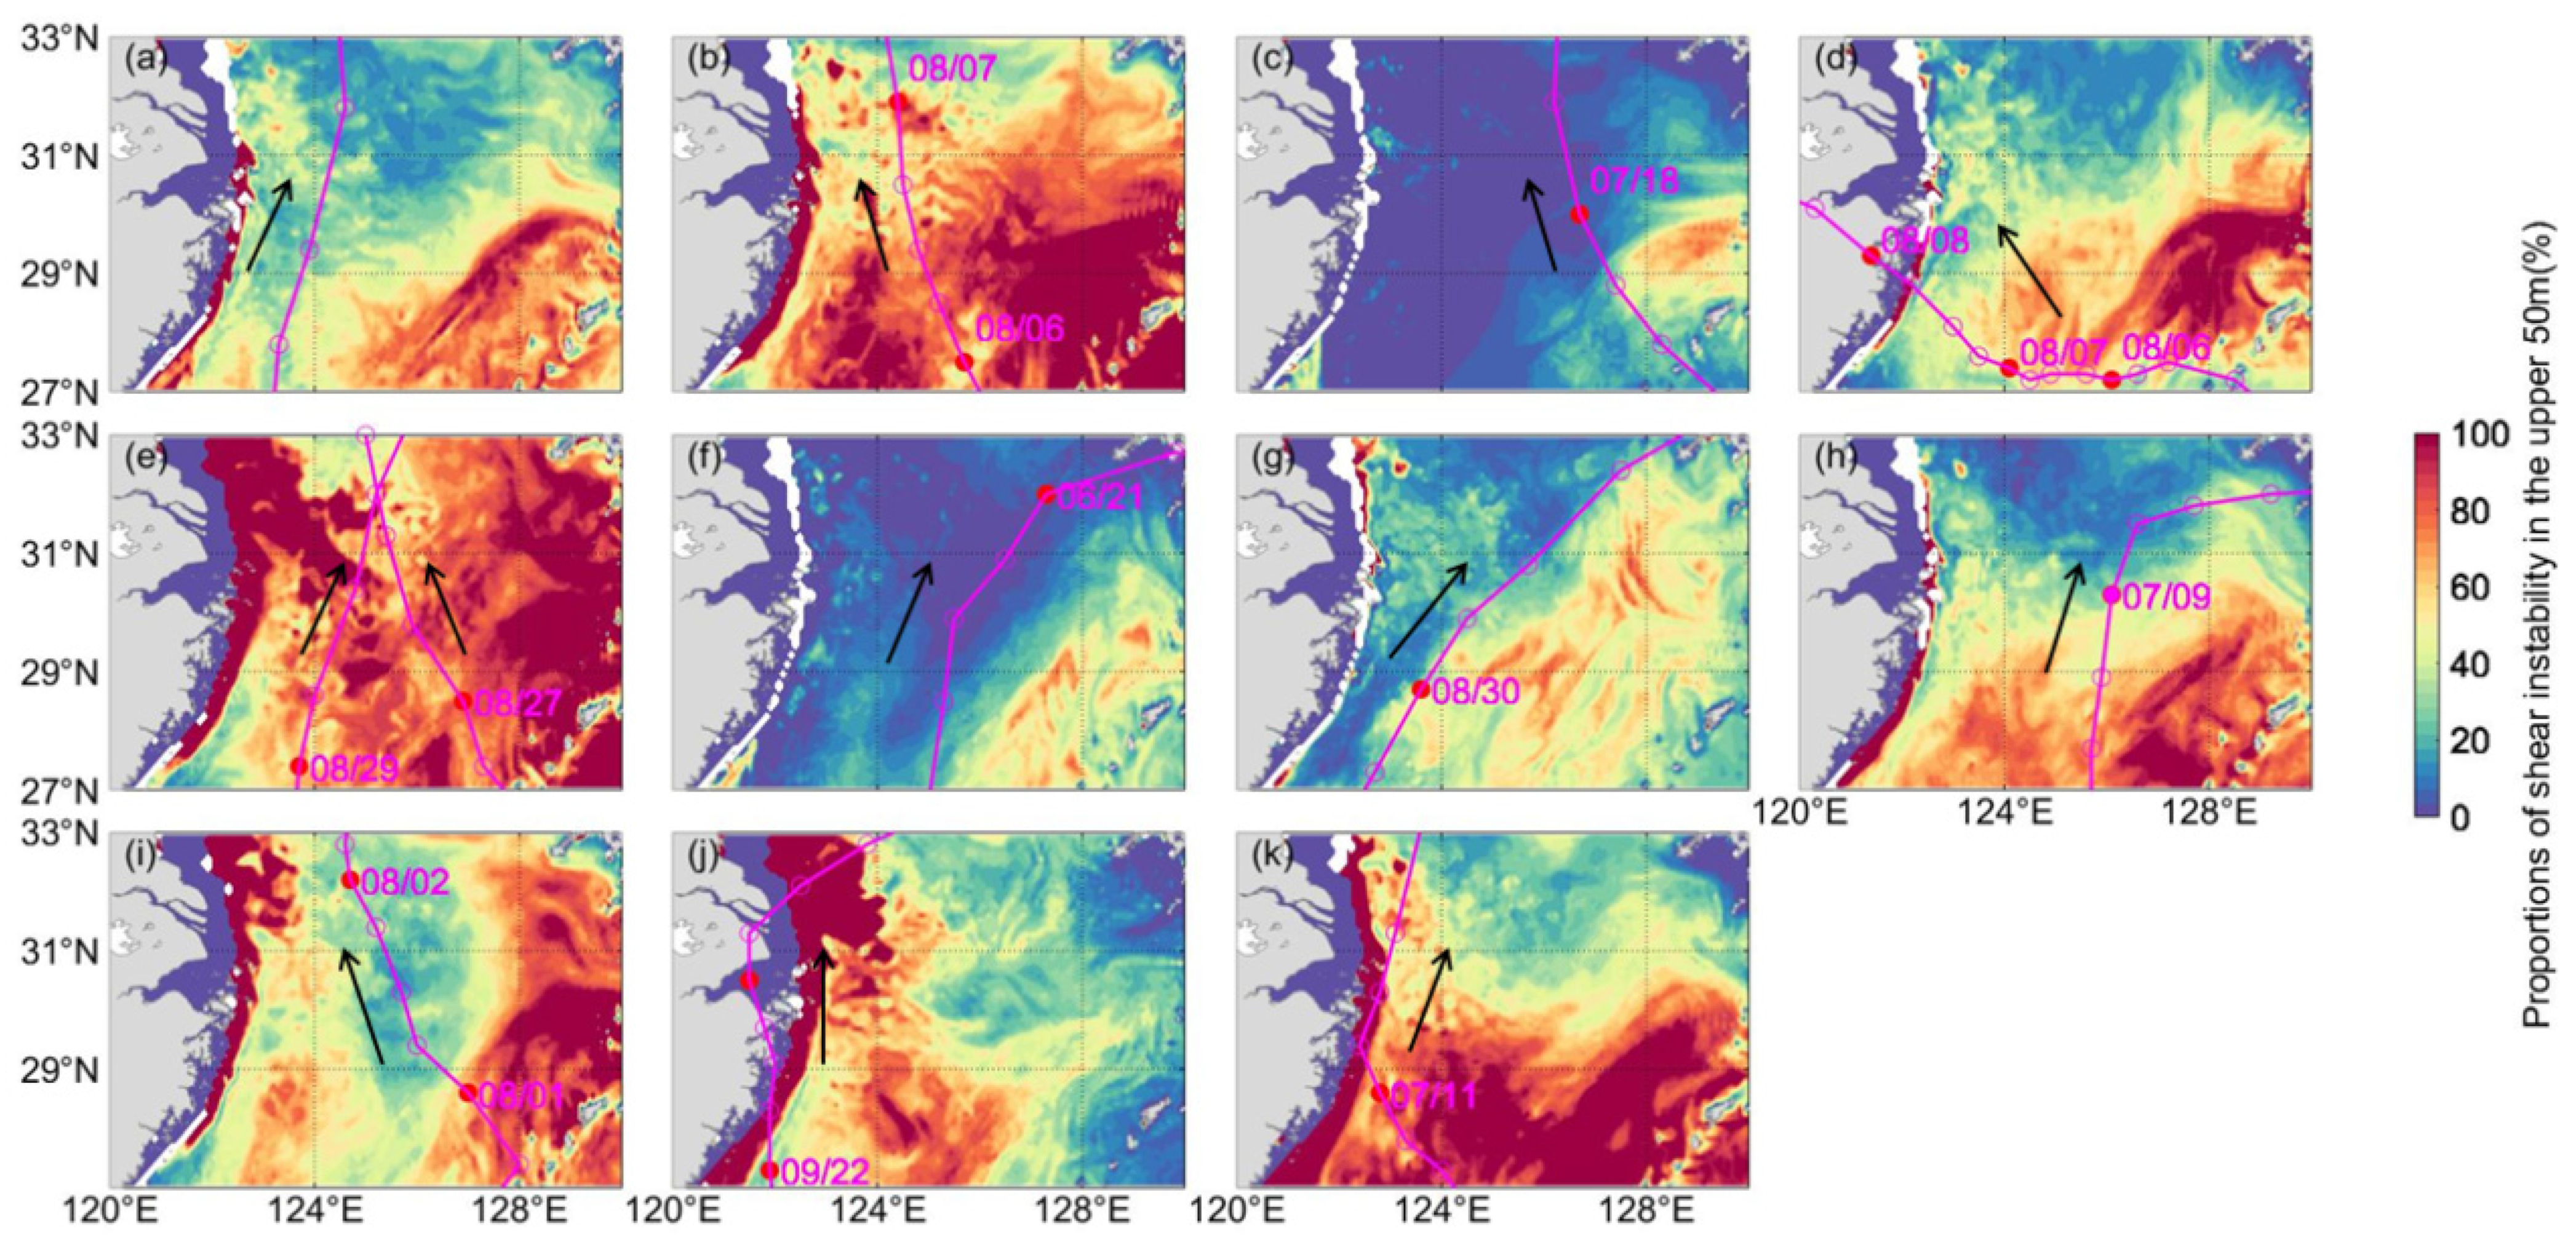
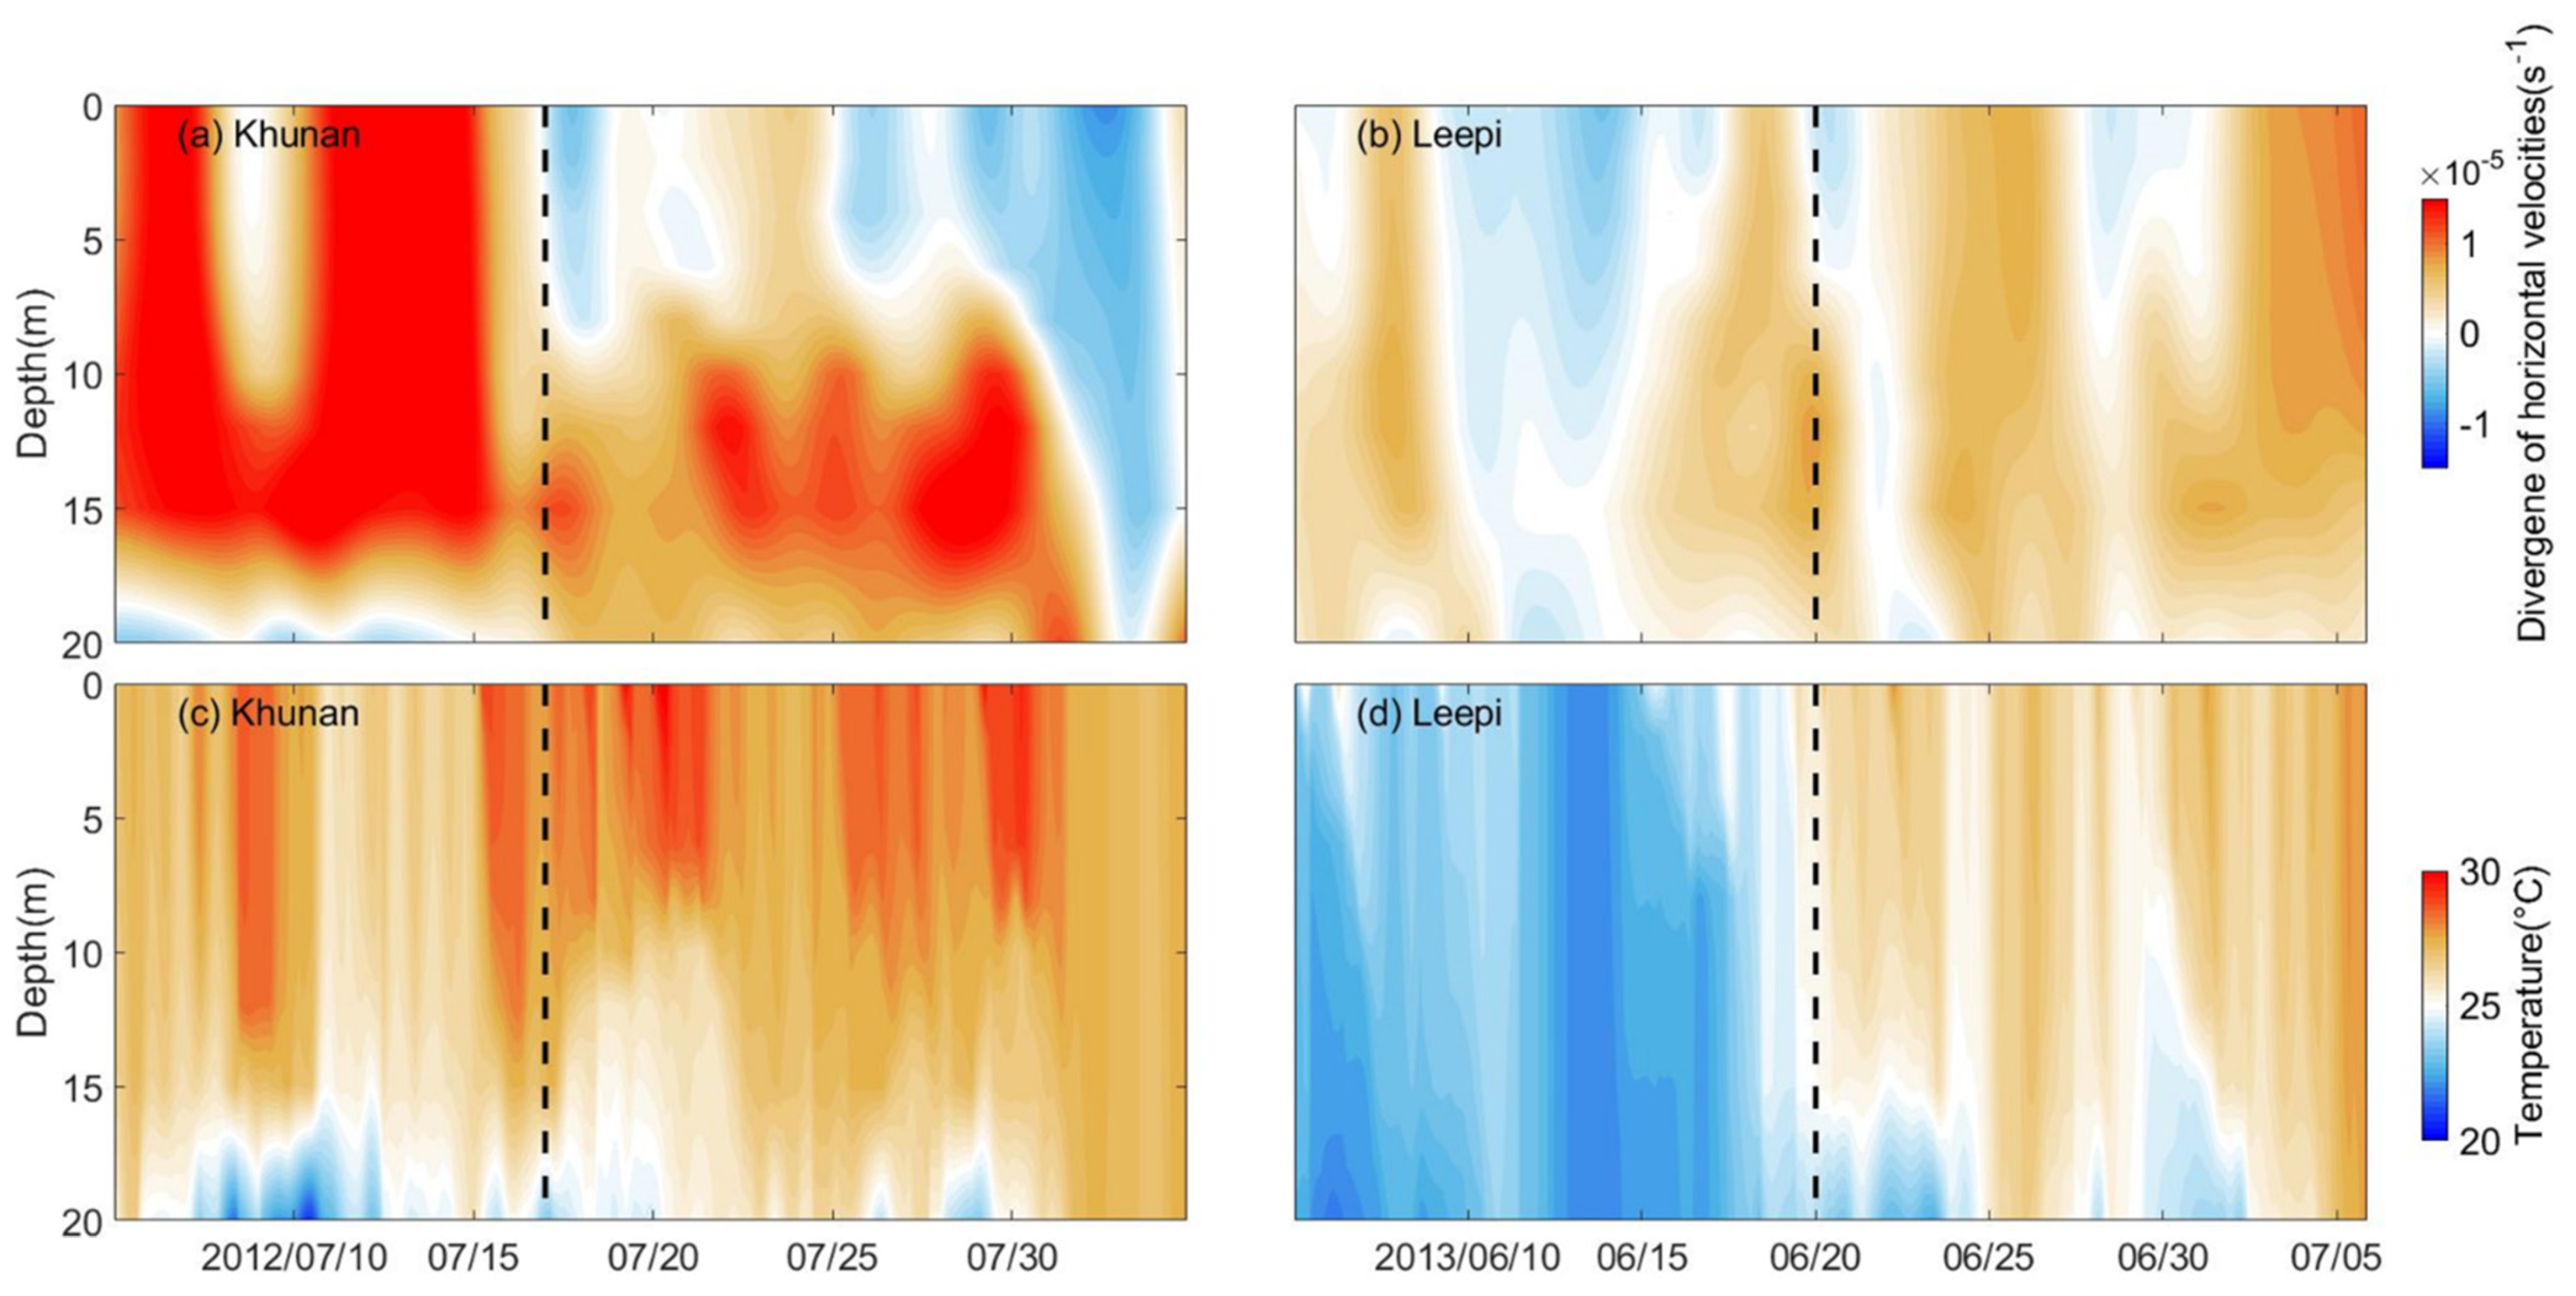
3.3. Mechanisms of the Seafloor Warming in the Shallow Waters near the Zhejiang Coast
4. Summary
Author Contributions
Funding
Conflicts of Interest
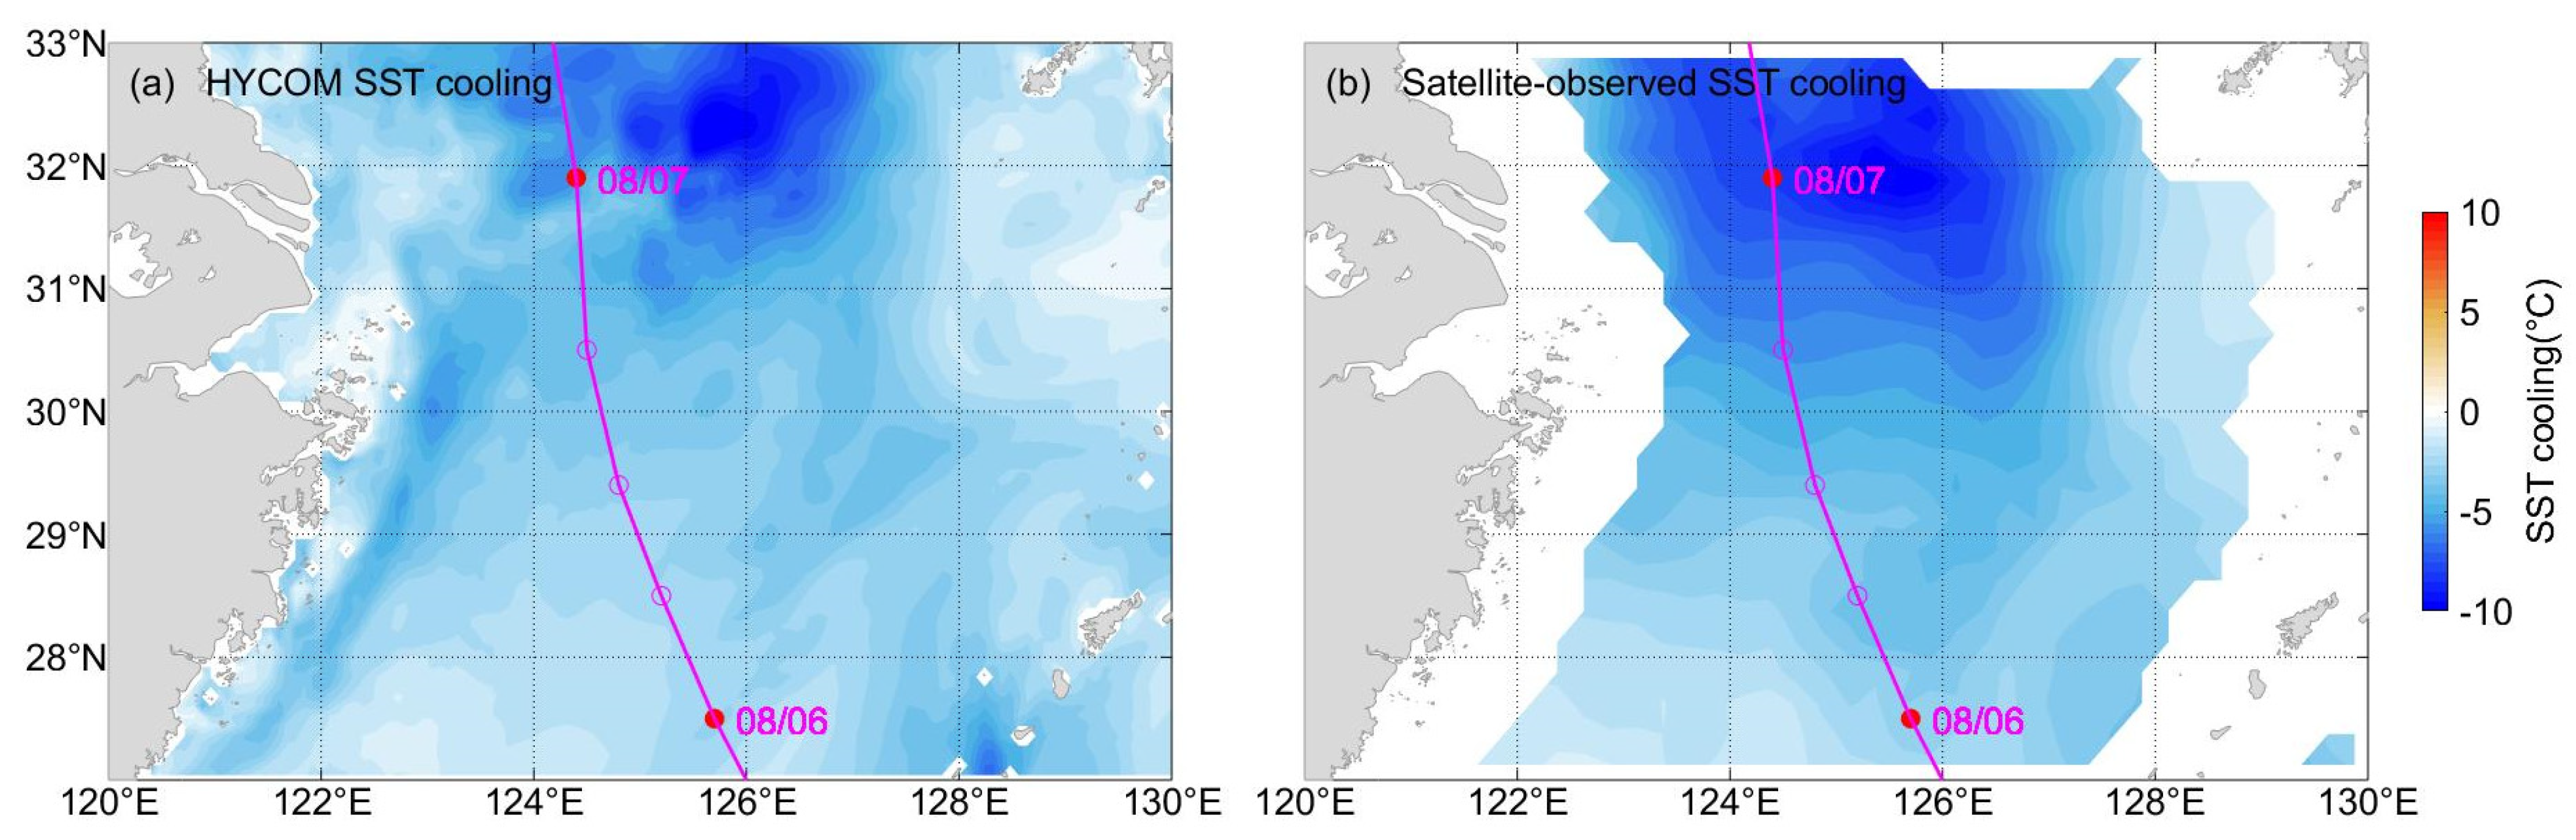
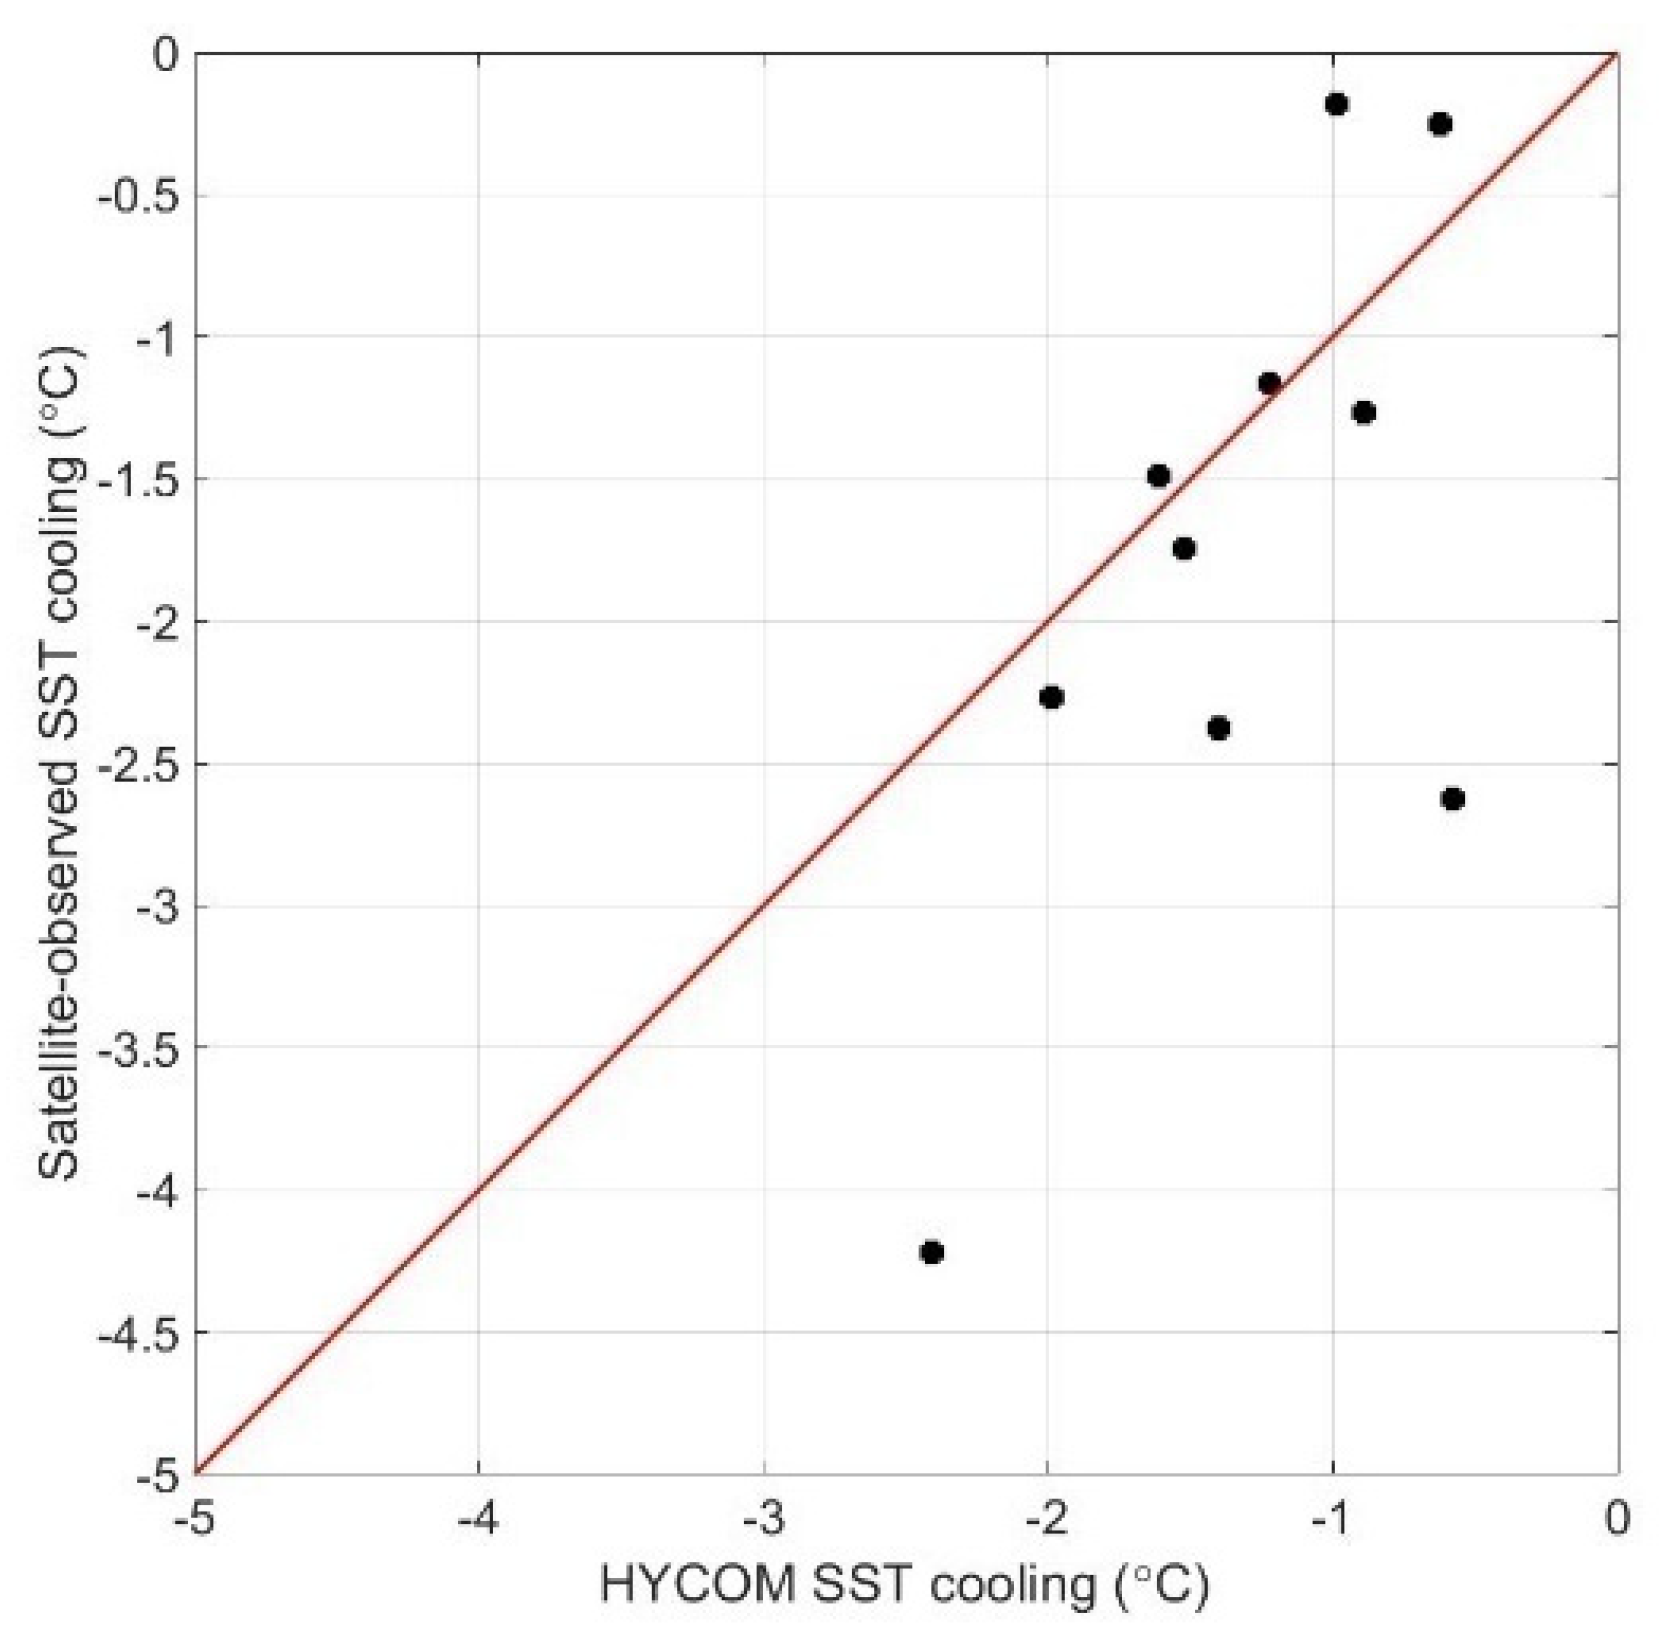
Appendix A. Comparison between the Satellite-Observed and HYCOM SST
References
- D’Asaro, E.; Black, P.; Centurioni, L.; Harr, P.; Jayne, S.; Lin, I.; Lee, C.; Morzel, J.; Mrvaljevic, R.; Niiler, P.P.; et al. Typhoon-Ocean Interaction in the Western North Pacific: Part 1. Oceanography 2011, 24, 24–31. [Google Scholar] [CrossRef] [Green Version]
- Sanford, T.B.; Black, P.G.; Haustein, J.R.; Feeney, J.W.; Forristall, G.Z.; Price, J.F. Ocean Response to a Hurricane. Part 1: Observations. J. Phys. Oceanogr. 1987, 17, 2065–2083. [Google Scholar] [CrossRef]
- Sanford, T.B.; Price, J.F.; Girton, J.B. Upper-Ocean Response to Hurricane Frances (2004) Observed by Profiling Em-Apex Floats. J. Phys. Oceanogr. 2011, 41, 1041–1056. [Google Scholar] [CrossRef]
- Sanford, T.B.; Price, J.F.; Girton, J.B.; Webb, D.C. Highly Resolved Observations and Simulations of the Ocean Response to a Hurricane. Geophys. Res. Lett. 2007, 34, 5. [Google Scholar] [CrossRef] [Green Version]
- Shay, L.K.; Mariano, A.J.; Jacob, S.D.; Ryan, E.H. Mean and near-Inertial Ocean Current Response to Hurricane Gilbert. J. Phys. Oceanogr. 1998, 28, 858–889. [Google Scholar] [CrossRef]
- Brooks, D.A. The Wake of Hurricane Allen in the Western Gulf of Mexico. J. Phys. Oceanogr. 1983, 13, 117–129. [Google Scholar] [CrossRef] [Green Version]
- Dasaro, E.A. Upper-Ocean Inertial Currents Forced by a Strong Storm.2. Modeling. J. Phys. Oceanogr. 1995, 25, 2937–2952. [Google Scholar] [CrossRef] [Green Version]
- Dasaro, E.A. Upper-Ocean Inertial Currents Forced by a Strong Storm.3. Interaction of Inertial Currents and Mesoscale Eddies. J. Phys. Oceanogr. 1995, 25, 2953–2958. [Google Scholar] [CrossRef] [Green Version]
- Shay, L.K.; Elsberry, R.L. Near-Inertial Ocean Current Response to Hurricane Frederic. J. Phys. Oceanogr. 1987, 17, 1249–1269. [Google Scholar] [CrossRef]
- Zhang, H.; He, H.L.; Zhang, W.Z.; Tian, D. Upper Ocean Response to Tropical Cyclones: A Review. Geosci. Lett. 2021, 8, 1–12. [Google Scholar] [CrossRef]
- Price, J.F. Upper Ocean Response to a Hurricane. J. Phys. Oceanogr. 1981, 11, 153–175. [Google Scholar] [CrossRef] [Green Version]
- Guan, D.S.; Zhao, W.; Sun, L.; Zhou, C.; Liu, Z.; Hong, X.; Zhang, Y.H.; Tian, J.W.; Hou, Y.J. Tropical Cyclone-Induced Sea Surface Cooling over the Yellow Sea and Bohai Sea in the 2019 Pacific Typhoon Season. J. Mar. Syst. 2021, 217, 103509. [Google Scholar] [CrossRef]
- Cao, Z.A.; Guo, Z.; Pan, Y.H.; Song, J.B.; He, H.L.; Li, P.L. Near-Inertial Waves Induced by Typhoon Megi (2010) in the South China Sea. J. Mar. Sci. Eng. 2021, 9, 440. [Google Scholar] [CrossRef]
- Li, J.; Xu, J.X.; Liu, J.L.; He, Y.H.; Chen, Z.W.; Cai, S.Q. Correlation of near-Inertial Wind Stress in Typhoon and Typhoon-Induced Oceanic near-Inertial Kinetic Energy in the Upper South China Sea. Atmosphere 2019, 10, 17. [Google Scholar] [CrossRef] [Green Version]
- Yang, B.; Hu, P.; Hou, Y.J. Observed near-Inertial Waves in the Northern South China Sea. Remote Sens. 2021, 13, 3223. [Google Scholar] [CrossRef]
- Lu, X.; Yu, H.; Ying, M.; Zhao, B.K.; Zhang, S.; Lin, L.M.; Bai, L.N.; Wan, R.J. Western North Pacific Tropical Cyclone Database Created by the China Meteorological Administration. Adv. Atmos. Sci. 2021, 38, 690–699. [Google Scholar] [CrossRef]
- Ying, M.; Zhang, W.; Yu, H.; Lu, X.Q.; Feng, J.X.; Fan, Y.X.; Zhu, Y.T.; Chen, D.Q. An Overview of the China Meteorological Administration Tropical Cyclone Database. J. Atmos. Ocean. Technol. 2014, 31, 287–301. [Google Scholar] [CrossRef] [Green Version]
- Howard, L.N. Note on a Paper of John W. Miles. J. Fluid Mech. 1961, 10, 509–512. [Google Scholar] [CrossRef]
- Miles, J.W. On the Stability of Heterogeneous Shear Flows. J. Fluid Mech. 1961, 10, 496–508. [Google Scholar] [CrossRef] [Green Version]
- Pedlosky, J. Geophysical Fluid Dynamics, 2nd ed.; Springer: Berlin/Heidelberg, Germany, 1987. [Google Scholar]
- Yang, B.G.; Lu, L.G.; Zhuang, Z.P.; Xiong, X.J.; Wang, G.S.; Guo, Y.L.; Yu, L.; Ma, D.J. Cruise Observation of Shallow Water Response to Typhoon Damrey 2012 in the Yellow Sea. Cont. Shelf Res. 2017, 148, 1–8. [Google Scholar] [CrossRef]
- Zhao, H.; Tang, D.; Wang, Y. Comparison of phytoplankton blooms triggered by two typhoons with different intensities and translation speeds in the South China Sea. Mar. Ecol. Prog. Ser. 2008, 365, 57–65. [Google Scholar] [CrossRef] [Green Version]
- Chen, S.; Polton, J.A.; Hu, J.; Xing, J. Local inertial oscillations in the surface ocean generated by time-varying winds. Ocean. Dyn. 2015, 65, 1633–1641. [Google Scholar] [CrossRef]


| Number | Name | Entry Time to the Study Domain | Maximum Wind Speed (m/s) | Translation Speed (m/s) |
|---|---|---|---|---|
| 1105 | Meari | 25/06/2011 | 28.67 | 12.82 |
| 1109 | Muifa | 06/08/2011 | 34.6 | 6.29 |
| 1207 | Khunan | 17/07/2012 | 24 | 8.33 |
| 1211 | Haikui | 05/08/2012 | 33.08 | 3.74 |
| 1214 | Tembin | 29/08/2012 | 29.5 | 8.84 |
| 1215 | Bolaven | 27/08/2012 | 42 | 7.74 |
| 1304 | Leepi | 20/06/2013 | 16.8 | 11.48 |
| 1315 | Kongrey | 30/08/2013 | 17.8 | 8.83 |
| 1408 | Neoguri | 08/07/2014 | 37.33 | 6.82 |
| 1412 | Nakri | 01/08/2014 | 23.71 | 5.08 |
| 1416 | Fungwong | 22/09/2014 | 21.5 | 4.98 |
| 1509 | Chanhom | 10/07/2015 | 43.33 | 5.52 |
| SST Cooling (°C) | Seafloor Warming (°C) | NIKE (kJ/m2) | |
|---|---|---|---|
| Maximum wind speed (m/s) | 0.33 (0.35) | 0.70 (0.02) | 0.83 (0.01) |
| Translational speed (m/s) | 0.07 (0.85) | −0.54 (0.10) | −0.16 (0.68) |
| Seafloor warming (°C) | 0.57 (0.08) | - | - |
Publisher’s Note: MDPI stays neutral with regard to jurisdictional claims in published maps and institutional affiliations. |
© 2022 by the authors. Licensee MDPI, Basel, Switzerland. This article is an open access article distributed under the terms and conditions of the Creative Commons Attribution (CC BY) license (https://creativecommons.org/licenses/by/4.0/).
Share and Cite
Pan, Y.; Cao, A.; Wu, Y.; Lu, S.; Fan, L.; Li, P. On the Response of Zhejiang Coastal Waters to 12 Typhoons from 2011 to 2015. J. Mar. Sci. Eng. 2022, 10, 543. https://doi.org/10.3390/jmse10040543
Pan Y, Cao A, Wu Y, Lu S, Fan L, Li P. On the Response of Zhejiang Coastal Waters to 12 Typhoons from 2011 to 2015. Journal of Marine Science and Engineering. 2022; 10(4):543. https://doi.org/10.3390/jmse10040543
Chicago/Turabian StylePan, Yunhe, Anzhou Cao, Yuqian Wu, Shiming Lu, Luteng Fan, and Peiliang Li. 2022. "On the Response of Zhejiang Coastal Waters to 12 Typhoons from 2011 to 2015" Journal of Marine Science and Engineering 10, no. 4: 543. https://doi.org/10.3390/jmse10040543
APA StylePan, Y., Cao, A., Wu, Y., Lu, S., Fan, L., & Li, P. (2022). On the Response of Zhejiang Coastal Waters to 12 Typhoons from 2011 to 2015. Journal of Marine Science and Engineering, 10(4), 543. https://doi.org/10.3390/jmse10040543