Abstract
Internal solitary waves (ISWs) near the Dongsha Atoll in the northern South China Sea (SCS) can be divided into incident, reflected, and refracted waves. Compared with the incident and refracted ISWs, the reflected ISWs are less likely to appear, but their impact on the ecological environment and marine activity should not be underestimated. In this work, field experiments were performed and moderate-resolution imaging spectroradiometer (MODIS) images were collected to analyze the reflected ISWs. Satellite observations showed that they were excited by the collision between the incident ISWs and the Dongsha Atoll and are often in the form of a wave packet composed of 2 to 5 solitons. During propagation, its spatial range gradually increases and interacts with the incoming waves generated by the next tidal cycle until it dissipates at approximately 117.5° E. Eighty percent of the reflected ISWs occur from April to June. The length of the crest line is mainly between 50 and 150 km, and the average propagation speed is approximately 1.57 m/s, which is smaller than that of the incident ISWs. In situ observations showed that the amplitudes of the reflected ISWs were between 10 and 20 m, accounting for only 40% of the incident ISWs. Compared with the incident ISWs, the vertical, velocity, and zonal velocities of the reflected ISWs were all attenuated. The results of the depth-integrated horizontal energy flux calculation showed that the energy of the reflected ISWs was only 61% of that of the incident ISWs. The reflected ISWs accelerated the velocity of the surface flow field during propagation, and the maximum velocity on the sea surface was approximately 0.60 m/s. Strong tides are beneficial for the generation of reflected ISWs near the Dongsha Atoll. Incident and reflected ISWs are all first-mode ISWs.
1. Introduction
Internal solitary waves (ISWs) are oceanic sub-mesoscale phenomena that are usually generated by the interaction between internal tides and topography, such as submarine sills, and gradually dissipate after undergoing nonlinear evolution [1]. ISWs propagate along the oceanic pycnocline and have a large amplitude, short period, and strong flow velocity, which have important impacts on the distribution of nutrients and biological activities [2,3] and the safety of submarine navigation. For example, the sinking of an Indonesian submarine near the Lombok Strait on 21 April 2021 was associated with ISWs [4]. Therefore, studying and analyzing the characteristics of ISWs in certain sea zones for oceanographic research and marine safety is of great significance.
ISWs modulate the redistribution of sea surface microscale waves during propagation, thereby changing the sea surface roughness distribution [5]; thus, they can be observed with the naked eye or imagery. The methods commonly used for studying ISWs include in situ, remote sensing, and numerical simulations. The effective combination of different methods can be used to obtain the characteristics of ISWs [6,7,8]. Remote sensing can also be used to analyze the sea surface characteristics of ISWs on a larger spatial scale and over a longer time range [9,10,11,12,13,14]. In addition, the generation and propagation of ISWs can be reproduced using laboratory and numerical simulations [15,16,17,18,19].
The South China Sea (SCS), known as an experimental field for internal wave research, has extremely strong ISWs [20,21] that reach amplitudes of 240 m [7]. The northern part of the SCS has the most frequent occurrence of ISWs, which are of different types with different characteristics [6,22,23,24] as well as ISWs of various modes [25,26,27]. Simultaneously, ISWs often interact with other oceanic phenomena, such as mesoscale eddies [28] and the Kuroshio current [29].
Using a variety of methods, researchers have learned the spatiotemporal distribution characteristics of ISWs in the northern SCS [30], the generation source, and the propagation process [11,31]. In addition, ISWs that originate in the Luzon Strait are mainly generated by the interaction between tides and submarine ridges [32,33,34]. They experience nonlinear evolution in the central deep-sea basin and finally dissipate on the western continental shelf [35]. During their propagation, ISWs undergo multiple refractions and reflections near the Dongsha Atoll, resulting in a unique wave-packet variation.
However, relatively few studies focus on the reflected ISWs near the Dongsha Atoll, whereas more attention is given to the refracted waves that form on its western side [36,37]. At present, although some literature discusses the generation characteristics of the reflected ISWs, Bai et al. simulated their generation based on remote-sensing images and numerical models and then discussed their propagation speed and energy changes [13]. However, considering the frequent military activities and engineering construction near the Dongsha Atoll, analyzing the evolutionary characteristics of the reflected ISWs is not only of great scientific significance, but it is also beneficial for marine safety.
To reveal the evolution of the reflected ISWs, an in situ experiment was conducted near the Dongsha Atoll in May 2021. In addition, 720 moderate-resolution imaging spectroradiometer (MODIS) images from May 2015 to May 2021 were matched and processed. The remaining sections of this paper are arranged as follows: Section 1 describes the research background; Section 2 introduces the research area; Section 3 analyzes the interpreted results of the remote sensing images; and Section 4 analyzes the reflected ISWs based on in situ observations. The properties of the waves are discussed in Section 5, and Section 6 concludes the work.
2. Study Area
Figure 1a shows the spatial distribution of ISWs in the northern SCS: the red stripes are the leading wave crest lines manually extracted from MODIS images. The figure also shows different types of ISWs on both sides of the Dongsha Atoll. The eastern side mainly contains the incident ISWs that extend north to south for hundreds of kilometers, as well as the arc-shaped reflected ISWs; the western side contains many the refracted ISWs, which appear as two branches and can propagate to the near-shore continental shelf. The black box in Figure 1a, the area delineated in this paper, is where reflected ISWs often appear and reach as far east as 117.5° E. Figure 1b shows a MODIS image, in which the incident, refracted, and reflected ISWs exist simultaneously. The reflected ISWs are in a semicircular arc and are composed of 3 to 5 solitons. The length of the crest line of the leading wave is approximately 150 km.
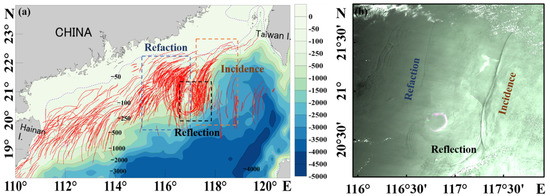
Figure 1.
Characteristics of ISWs near the Dongsha Atoll in the northern SCS. (a) Spatial distribution of ISWs, the red curves are the crest lines of ISWs manually extracted from the MODIS images; (b) MODIS image acquired on 7 May 2020.
3. Results of Remote Sensing Images
To analyze the morphological and spatiotemporal distribution of the reflected ISWs further, information on ISWs was extracted from MODIS images. MODIS is an optical sensor onboard the Terra and Aqua satellites, which have a total of 36 channels; a swath width of 2330 km; spatial resolutions of 1000, 500, and 250 m; and a transit time interval of 3 h. This work downloaded and processed 720 MODIS images covering the continental shelf near the Dongsha Atoll from May 2015 to May 2021 with a resolution of 250 m. The channel locations for images were 0.62–0.67 µm and 0.841–0.876 µm. After geometric and radiometric corrections, 70 groups of reflected ISWs were obtained. Image information is shown in Appendix A.
3.1. Spatiotemporal Distribution
Using the crest lines of leading waves, the spatial distribution of the reflected ISWs is shown in Figure 2a. They mainly exist in the form of wave packets, which partially surround the Dongsha Atoll. Compared with the incident and refracted ISWs, the spatial range of the reflected ISWs is more concentrated, mainly from 116.5° E to 117.5° E and from 20° N to 21° N. The results of Sun et al. showed that ISWs in the northern SCS mainly occurred from April to September [29]. Consistent with their results, the time distribution map of reflected ISWs in Figure 2b shows that the reflected ISWs occurred mostly in May and accounted for 35% of the total number, and the total proportion from April to June reached up to 80%. Due to the relatively weak energy of the reflected waves, the features caused by the sea surface are not obvious, so they may not be detected by satellite imagery. However, according to the overall temporal distribution of ISWs in the northern SCS and the fact that the seawater stratification phenomenon is significant in summer, it can be inferred that April to June is a high-frequency period of the reflected ISWs.
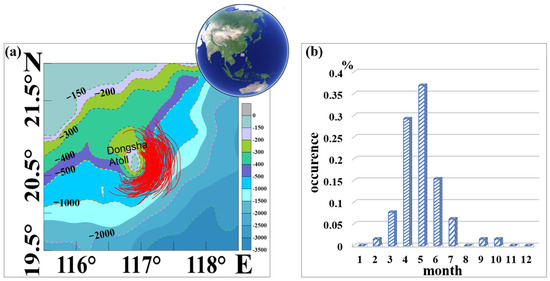
Figure 2.
Spatial and temporal distribution of the reflected ISWs. (a) Spatial distribution, in which the red solid lines are the crest lines of leading waves; (b) temporal distribution.
3.2. Morphology
Figure 3 shows the generation and evolution of the reflected ISWs near the Dongsha Atoll using 8 MODIS images. Initially, the incident ISWs propagated westward in the form of a single soliton extending north to south for hundreds of kilometers (Figure 3a). After encountering the Dongsha Atoll, the reflected ISWs were generated, which initially appeared as a small wave packet with a small spatial extent and closely adjacent solitons in the packet (Figure 3b). Subsequently, as the ISW continued to propagate eastward, the soliton spacing in the packet gradually elongated, and the spatial range was further enlarged (Figure 3c). Figure 3d–g show that during the eastward propagation, the reflected ISWs may interact with incident ISWs generated in the next tidal cycle, producing a unique feature of arc-shaped reflected ISWs superimposed on straight-shaped incident ISWs. However, the collision of the incident ISWs did not change the shape of the reflected ISWs, which continued to propagate eastward in the form of wave packets (Figure 3h) and finally disappear near 117.5° E. This work suggests that the reason the reflected ISWs gradually dissipated is that they had less energy, and the continuous westward-propagating tides hindered the reflected waves and further consumed their energy.
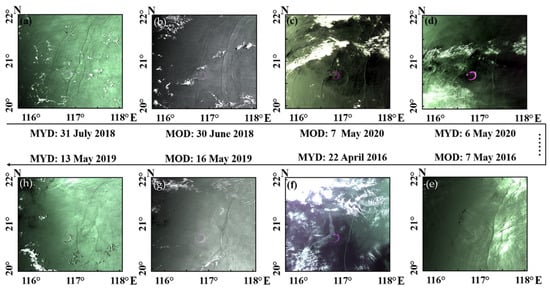
Figure 3.
Evolution process of the reflected ISWs obtained from MODIS images. (a–h) are images acquired at different times, MOD and MYD refer to MODIS sensors mounted on the Terra and Aqua satellites, respectively.
Based on the preprocessed MODIS images, we extracted and calculated the characteristics of ISWs: position, number of solitons, and propagation speed. In addition to the 70 groups of reflected ISWs mentioned above, 100 groups of incident ISWs were processed. Figure 4 shows the characteristic parameter distribution of the incident and reflected ISWs. As shown in the figure, reflected ISWs often exist in the form of wave packets. The number of solitons in a packet is usually between 2 and 5, but packets with more than 8 can appear, while the number of solitons in the incident ISWs mainly ranges from 1 to 3. The lengths of the crest lines of the reflected ISWs were mainly between 50 and 150 km, accounting for more than 80% of the total, whereas the crest lines of the incident ISWs were longer, reaching 250 km. The number of solitons exceeding 100 km accounts for approximately 90%. Figure 4c shows that the propagation direction of the reflected ISWs centered at 90° was northeast and southeast. The proportion of reflected ISWs propagating to the southeast accounted for 70%. The incident ISWs propagate westward, ranging from 240° to 300° E, and more than 80% propagated to the northwest. Figure 4d shows an example calculation of the speed of an ISW based on the multiphase method (MPI) [31,38]. MPI is based on satellite images of the same ISWs acquired at different times, which means the propagation speed of ISW can be calculated according to the propagation distance and the time difference between the satellite images. In this work, 3 groups of reflected ISWs and 5 groups of incident ISWs were matched and processed. The average speed of the incident ISWs was 2.57 m/s, while that of the reflected ISWs was 1.57 m/s, accounting for only 60% of the incident ISWs.
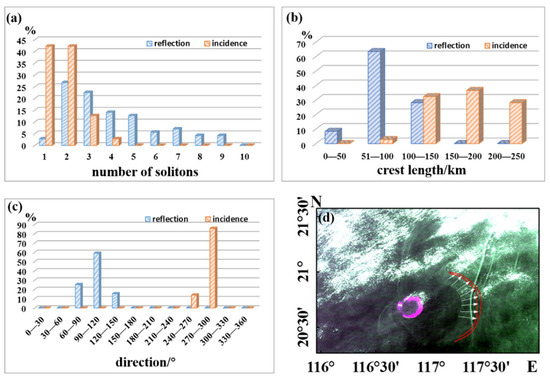
Figure 4.
Characteristic parameter distributions of the reflected ISWs and incident ISWs. (a) Number of solitons; (b) length of crest lines; (c) propagation direction; (d) multiphase method (MPI) to calculate the speed.
4. In Situ Observations
From 18 to 28 May 2021, an in situ observation experiment was carried out near the Dongsha Atoll. A total of 3 sites were selected, of which site S1 was located on the eastern side of the Dongsha Atoll (117.385° E, 21.246° N), with a water depth of approximately 560 m. During the observation, 27 temperature probes and 2 temperature–salinity–depth profilers (CTDs) were used to form a temperature chain to obtain seawater temperature and salinity. The sampling interval of the instrument was set to 5 s; the deployment interval was 5 to 10 m; and the vertical spatial resolution was interpolated to 1 m during data processing. The underwater current velocity was measured using a 150 kHz acoustic doppler current profiler (ADCP) with a sampling time resolution of 1 min and a layer thickness set to 4 m. An AAnderaa current-meter, operating at a frequency of 20 Hz, was used to record the surface sea current.
As mentioned above, some incident ISWs collide with the Dongsha Atoll and then refract and continue to propagate westward, while the rest are reflected and propagate eastward. Figure 5 shows a set of measured data and two remote sensing images, of which Figure 5c is a MODIS image acquired at 02:55 UTC on 21 May; Figure 5d is a FengYun-3D image acquired on 21 May at 05:25 UTC. FengYun 3D is China’s polar-orbiting meteorological satellite having a resolution of 250 m and a swath width of 2800 km. As shown in Figure 5c,d, there was a large refracting ISW packet (ISW-1, blue) with a crest line up to 105 km propagating westward from the western side of the Dongsha Atoll, while there was an arc-shaped reflected ISW packet (ISW-2, red) on the northeast side of the Dongsha Atoll. The propagation speeds of the refracted and reflected ISWs calculated from the images were approximately 1.45 and 1.6 m/s, respectively. Combined with the speed and the distance between them, this work suggests that the two wave packets originated from the same incident ISW, which was recorded by in situ observations. It passed site S1 at 16:00 on 20 May, after which some of it propagated westward and evolved into ISW-1, as shown in Figure 5c,d; the rest of the ISW propagated eastward after reflecting off the Dongsha Atoll, evolving into ISW-2 and passing through site S1 again at 03:00 on 21 May.
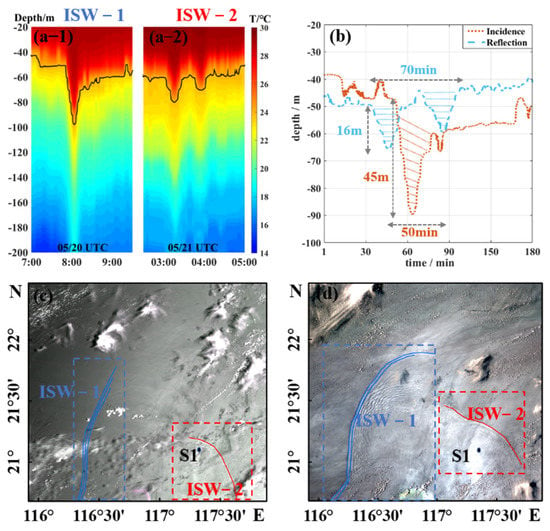
Figure 5.
ISWs acquired at S1. (a-1) Incident ISW obtained on May 20; (a-2) reflected ISW obtained on 21 May; (b) comparison of waveforms; (c) MODIS imagery, 21 May 2021 02:55; (d) FengYun-3D imagery, 21 May 2021 05:25. The blue crest line is the refracted wave (ISW-1), and the red crest line is the reflected wave (ISW-2).
Figure 5(a-1,a-2,b) depict the temperature profile and waveforms of the incident and the reflected ISWs. The incident ISW is a single soliton with a duration of approximately 50 min and an amplitude of approximately 45 m; the reflected ISW is in the form of a wave packet composed of 2 small solitons, which is consistent with the number of solitons in the remote sensing image. The entire wave packet existed for approximately 70 min. Compared with the incident ISW, the amplitude of the reflected ISW (approximately 16 m) was attenuated by 65%, indicating the energy loss.
Figure 6 shows the current velocity when the incident and reflected ISWs passed through. The vertical current velocity of the two ISWs first decreased and then increased along the propagation direction, indicating that they were all evaluating waves and without polarity conversion. The vertical velocity of the reflected ISWs was only 40% of the incident ISWs, which was approximately 4 cm/s. The horizontal current velocity profiles (Figure 6(a-1–a-3,b-2,b-3)) show that both the incident and reflected ISWs were first-mode ISWs, showing a two-layer structure. The boundary between the two layers was the maximum amplitude of the ISW, where the horizontal velocity was zero, but the shear force was at maximum. For the incident ISWs, the maximum radial and zonal current velocities in the upper layer were 50 and 80 cm/s, respectively; the maximum current velocities in the lower layer were 30 cm/s (radial) and 100 cm/s (zonal), respectively. For the reflected ISWs, the maximum radial velocity and zonal velocity of the upper layer were 40 and 20 cm/s, respectively, which were attenuated by 20 and 75%, respectively, relative to the incident ISWs. The maximum radial and zonal velocities of the lower layer were 90 and 30 cm/s, respectively. In general, the velocity of the reflected ISWs was smaller than that of the incident ISWs, indicating that some of kinetic energy was lost after collision with the Dongsha Atoll. In addition, upon careful examination, Figure 6(a-3,b-3) reveal that the zonal flow of both incident and reflected waves had a 180° inversion phenomenon in the upper and lower layers, which was reasonable in that the incident ISWs mainly propagated westward, while the reflected ISWs mainly propagated eastward.
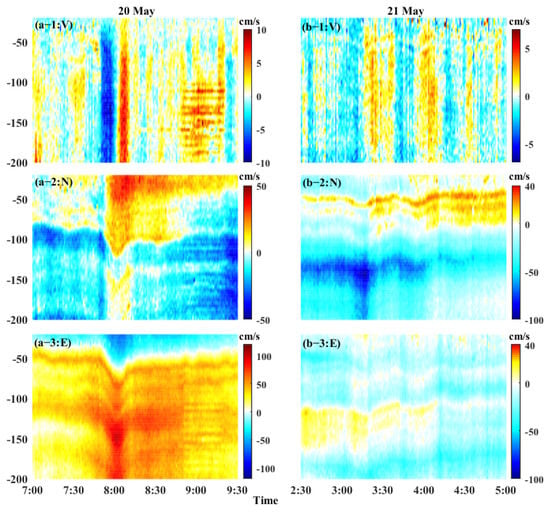
Figure 6.
Current velocity profiles measured by ADCP (a-1–a-3) the incident ISWs on 20 May; (b-1–b-3) the reflected ISWs on 21 May. Panels 1 to 3 show the vertical, radial and zonal currents, respectively.
Figure 7 shows the result of the change in sea surface current caused by the reflected ISWs measured by the AAnderaa current meter. Figure 7a shows that ISWs accelerate the velocity of the surface current, and the amplitude of the maximum velocity was approximately 0.60 m/s, accounting for 30% of the propagation speed, which doubled when there was no ISW disturbance. Figure 7b shows that ISWs did not cause a significant change in the direction of the surface current, which may have been due to the greater influence of surface waves and wind. Images of the sea surface when the ISWs arrived and after their passage were captured by the camera. As shown in Figure 7c,d, when the ISWs arrived, the wave-breaking phenomenon of the sea surface intensified due to convergence; then, due to divergence, the sea surface became smooth. Osborne and Burch described the phenomenon of current divergence after ISW passage as the “mill-pond effect” [8], and Craig et al. proposed an alternative explanation of radiative absorption into the bound states of the Schrödinger equation [39].
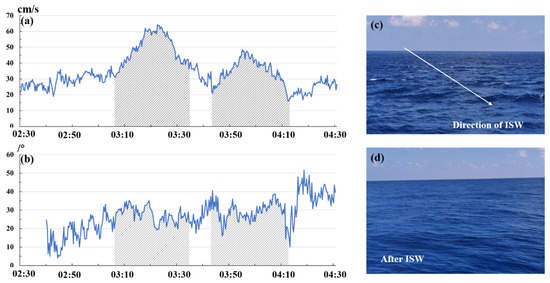
Figure 7.
Variation in the surface sea current during the passage of reflected ISWs, 21 May 2021 UTC. (a) Change in the amplitude of the surface sea current; (b) directional change in the surface sea current. Shadings represent the passage time of the ISW. (c) Surface sea image during the passage of ISWs, acquired on 21 May at 3:16. (d) Surface sea image after the passage of ISWs, acquired on 21 May at 5:02.
5. Discussion
5.1. Tides
As mentioned above, ISWs near the Dongsha Atoll are generated in the Luzon Strait, and studies by Bai et al. [40] and Jackson [41] showed that their propagation from the Luzon Strait (122° E, 20.5° N) to the Dongsha Atoll takes approximately 2 0.5 days. In this section, we explored whether the tidal changes at the incident ISW generation point in the Luzon Strait (122° E, 20.5° N) affect the probability of generating the reflected ISWs near the Dongsha Atoll. Therefore, the generation time of all observed ISWs in the Luzon Strait was first determined; that is, it was estimated to be 2 0.5 days ahead from the time when the satellite captured the reflected ISWs. The barotropic tidal energy (u2 + v2) at the generation point was obtained according to TMD software [42], where u and v are the radial and zonal barotropic tides, respectively. Tides contain eight principal components (M2, S2, N2, K2, K1, O1, P1, and Q1).
Figure 8 shows the tidal energy distributions at the generation points in May 2016 and May 2019, which were chosen because more reflected ISWs were detected during these two months. The barotropic tide at the generation site is a typical semilunar period, there are two spring tides and two neap tides per month. The shading in Figure 8 represents the ISW generation time with an uncertainty of 0.5 days. In the figure, there are 7 ISWs generated during strong tides and 6 during weak tides. Similar statistics were performed on all reflected ISWs observed in this work, and 55% of the observed waves were generated during strong tides; 45% during weak tides. Therefore, this work believes that tidal energy at the generation point was not the decisive factor affecting the generation of reflected ISWs, but strong tides were slightly beneficial for generating the reflected ISWs near the Dongsha Atoll because the initial energy of the incident waves was stronger, which was consistent with the conclusion of Bai et al. [13].
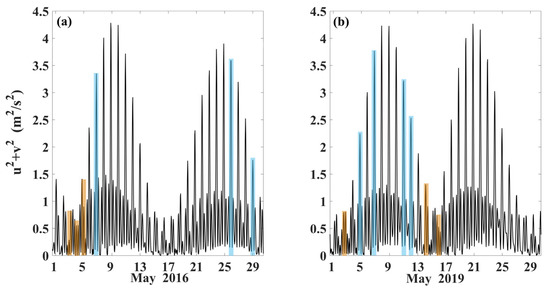
Figure 8.
Tidal energy at the wave generation point (122° E, 20.5° N) in the Luzon Strait. (a) May 2016; (b) May 2019.
5.2. Mode
The mode is one of the main characteristics of oceanic ISWs. According to their vertical structure, they can be divided into first, second, and higher-order modes. The incident ISWs on the eastern side of the Dongsha Atoll were often in the first mode, but the mode of the reflected ISWs needs to be analyzed further. Cui et al. showed that the mode of adjacent ISWs can be accessed from remote sensing images according to light and dark changes and water depth conditions. That is, when viewed along the propagation direction, if the bright and dark characteristics of adjacent ISWs change and the seawater stratification is consistent, the mode changes [43,44]. In this section, the changes in the modes of the reflected and incident ISWs are analyzed. Figure 9 shows two MODIS images containing both ISWs. The dotted red lines are drawn along the propagation direction of the ISW, and the subgraphs in Figure 9 represent the gray value profiles of the images extracted along the lines. The blue boxes in the subplots show the changes in grayscale values where ISWs were present. The grayscale value curves in the blue boxes show a trend of first decreasing (dark) and then increasing (bright) from left to right, which is a typical characteristic of ISWs in the first-mode. Therefore, the reflected ISWs are consistent with the incident ISWs, and both are first-mode with no mode change. The cross-sectional analysis of 70 groups of the reflected ISWs in this work showed that they were classified as the first mode, and there was no mode change compared with the incident ISWs.
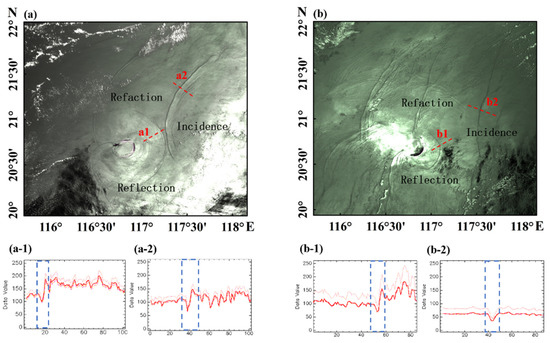
Figure 9.
ISW mode changes. (a) MODIS image acquired on 29 May 2018; (b) MODIS image acquired on 9 May 2020. The red dashed cross-sections in panels (a) and (b) are ISWs of interest, which are shown as (a-1,a-2) and (b-1,b-2) in the subfigures, respectively; the blue boxes in the subfigures are ISW cross-sections.
However, this conclusion seems to be inconsistent with that of Bai et al. [13]. In Section 3.2 of Bai’s study, they obtained the vertical velocity field of the reflected ISWs based on a fully nonlinear nonhydrostatic gravity wave model, and pointed out that the reflected ISW was second mode. Our explanation for this is that, relative to the research method of Bai et al., we conducted a modal analysis of the reflected ISWs based on measured data and remote-sensing images. These analyses were objective and no other assumptions were made. In addition, in the study on second-mode ISWs in the northern South China Sea by Cui et al. [43], second-mode ISWs were not detected in the area where reflected ISWs frequently occur, which was consistent with the conclusion of this work. We do not rule out the possibility of missing some high-mode ISWs due to the small amount of data in this work, which would require more field measurements and remote sensing images and the reproduction of reflected ISW generation near the Dongsha Atoll in combination with numerical simulation.
5.3. Energy
Through satellite and in situ observations, this work revealed some of the kinematic characteristics of reflected ISWs. To further understand the interrelationship between reflected and incident ISWs, this section analyzes their energy changes according to the depth-integrated horizontal energy flux F [13,33,45].
F is defined as , and c is the phase speed of the ISW. The average propagation speeds of the incident ISWs and the reflected ISWs calculated in Section 3.2 are 2.57 and 1.57 m/s, respectively. KE is the depth-integrated kinetic energy and APE is the depth-integrated potential energy:
where is the average background density; (u, v, w) corresponds to the current velocity of the three components; H is the depth-integration range; and L represents the horizontal range of the ISW. Based on the temperature and current profiles in Figure 5 and Figure 6, the KE and APE of the ISWs can be calculated by two-dimensional integration using formulas (1) and (2).
Figure 10 shows the density profiles obtained from the CTDs on 19 May 2021, with a calculated background mean density of 1024.237 kg/m3. is substituted into the formula, and the energy is calculated according to the temperature and current velocity profiles of the ISWs in Figure 5 and Figure 6. The KE and APE of the incident ISWs were obtained as 1.44 and 1.018 MJ/m2, respectively, so F was approximately 2.461 MJ/m2. The KE and APE of the reflected ISWs were 0.807 and 0.69 MJ/m2, respectively, so the depth-integrated horizontal energy flux was approximately 1.497 MJ/m2, accounting for only 61% of the incident ISWs. The above analysis shows that the reflected ISWs had less energy and thus were easily dissipated and could not travel further distances. Where does the remaining energy of the incident ISWs go? Our hypothesis is that this part of the energy is dissipated near the Dongsha Atoll, which promotes the resuspension of local nutrients and is beneficial to the growth of ecological environments such as coral reefs.
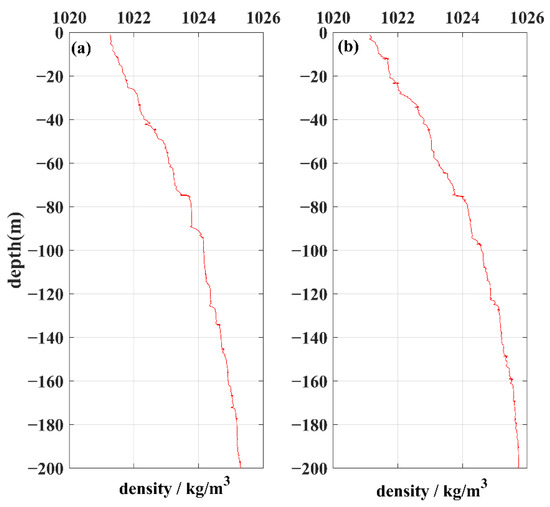
Figure 10.
The density profile of the observation point without ISW disturbance. (a) 19 May 2021 10:00 UTC; (b) 19 May 2021 14:00 UTC.
6. Conclusions
Based on in situ experiments and remote sensing images, this work studied the characteristics of ISWs near the Dongsha Atoll in the northern SCS, and revealed the regular characteristics of the reflected ISWs. The results showed that the reflected ISWs were mainly concentrated from 116.5° E to 117.5° E and from 20° N to 21° N, and 80% of the reflected ISWs occur from April to June.
The reflected ISWs originated from the collision between the incident ISWs and the Dongsha Atoll. The morphology initially appeared as a small wave packet with a small spatial range and closely adjacent solitons. Then, the reflected ISWs propagated eastward and evolved, the spatial range increased; they interact with the incident ISWs generated by the next tidal cycle during propagation; and finally dissipated at approximately 117.5° E. The number of solitons of the incident ISWs were mainly between 1 and 3, while the reflected ISWs often existed in the form of a wave packet composed of 2 to 5 solitons, and the waveform changed significantly. The crest lengths of the reflected ISWs were mainly between 50 and 150 km. The average propagation speed of the reflected ISWs was approximately 1.57 m/s, accounting for only 60% of incident ISWs and 70% of the reflected wave propagation to the southeast.
A group of incident ISWs was observed in the field and lasted for 50 min as a soliton with an amplitude of approximately 50 m, while the reflected ISWs existed for 70 min in the form of a wave packet composed of 2 solitons. Compared with the incident ISW, the amplitude of the reflected ISW was attenuated by 60%, between only 10 and 20 m. Compared with incident ISWs, the vertical velocity of reflected ISWs is approximately 4 cm/s, accounting for only 40%. ISWs can accelerate the velocity of the surface current, and the maximum velocity of the sea surface caused by the reflected ISWs was approximately 0.60 m/s.
Strong tides are beneficial to the generation of reflected ISWs near the Dongsha Atoll because the energy of the incident ISWs generated during that time could be higher. The energy change between the reflected ISWs and the incident ISWs was calculated according to the depth-integrated horizontal energy flux. The results showed that the energy of the reflected waves accounted for only 61% of the incident waves, indicating that some of the energy was lost after the collision of the ISWs with the Dongsha Atoll. The mode of the reflected ISWs was analyzed using remote-sensing images, and the results showed that it was consistent with the incident ISWs, both of which were first mode.
In this work, based on remote-sensing and in situ measurements, the characteristics of reflected ISWs near the Dongsha Atoll were analyzed, but the physical mechanism of the reflected waves and the wave–wave interactions were not further revealed. We obtained more data on the incident waves and the reflected waves by placing long-term observation arrays on the eastern side of the Dongsha Atoll and then analyzed the mechanism of the reflected ISWs. In addition, through high-resolution numerical simulations such as MITgcms, it was also possible to reproduce reflected ISW generation on the computer and to further analyze the wave–wave interaction between the reflected and incident waves. Of course, marine AI technology is on the rise, and AI algorithms that fully combine remote sensing images, in situ data, and physical models are key for us to study submesoscale marine phenomena, such as internal solitary waves.
Author Contributions
J.M. provided the conceptualization and revised the manuscript. H.Z. developed the methodology, performed the experiments and analysis, and wrote the manuscript. S.L. discussed the analysis and revised the manuscript. L.S. revised the manuscript. All authors have read and agreed to the published version of the manuscript.
Funding
This research was funded by the National Natural Science Foundation of China (no. U2006207) and the National Natural Science Foundation of China (No. 42006164).
Institutional Review Board Statement
The study did not involve humans or animals.
Informed Consent Statement
The study did not involve humans or animals.
Data Availability Statement
Regarding the application and sharing of the data used in this article, please contact Hao Zhang (zhanghao@fio.org.cn).
Acknowledgments
The authors thank NASA for providing the MODIS images (https://ladsweb.modaps.eosdis.nasa.gov/search/, accessed on 15 July 2021).
Conflicts of Interest
The authors declare that they have no conflict of interest.
Appendix A
Appendix A lists the MODIS image information used in this paper containing reflected internal solitary waves.

Table A1.
The MODIS image information used in this paper containing reflected internal solitary waves.
Table A1.
The MODIS image information used in this paper containing reflected internal solitary waves.
| The MODIS Image Information | |
|---|---|
| MOD02QKM.A2015210.0315.006.2015210134246 | MOD02QKM.A2019120.0255.006.2019120131518 |
| MOD02QKM.A2016101.0315.006.2016104192540 | MOD02QKM.A2019134.0310.006.2019134134851 |
| MOD02QKM.A2016112.0255.006.2016112134539 | MOD02QKM.A2019136.0255.006.2019136130917 |
| MOD02QKM.A2016119.0300.006.2016119135647 | MOD02QKM.A2019138.0245.006.2019138131141 |
| MOD02QKM.A2016126.0310.005.2016126134210 | MOD02QKM.A2020112.0315.061.2020112132006 |
| MOD02QKM.A2016128.0255.006.2016128134800 | MOD02QKM.A2020123.0255.061.2020123131040 |
| MOD02QKM.A2016130.0245.006.2016130140621 | MOD02QKM.A2020126.0325.061.2020126131416 |
| MOD02QKM.A2016155.0240.006.2016155212324 | MOD02QKM.A2020128.0315.061.2020128131829 |
| MOD02QKM.A2017105.0300.061.2017314005750 | MOD02QKM.A2020130.0300.061.2020130131719 |
| MOD02QKM.A2017142.0320.061.2017314140232 | MOD02QKM.A2020139.0255.061.2020139130347 |
| MOD02QKM.A2017144.0310.061.2017314162342 | MOD02QKM.A2021141.0255.061.202114116279 |
| MOD02QKM.A2017157.0235.061.2017315000911 | MYD02QKM.A2016099.0455.006.2016102085019 |
| MOD02QKM.A2017194.0255.061.2017315120040 | MYD02QKM.A2016113.0510.005.2016113155230 |
| MOD02QKM.A2018078.0250.061.2018078133604 | MYD02QKM.A2016127.0520.006.2016127154416 |
| MOD02QKM.A2018092.0300.061.2018092134259 | MYD02QKM.A2016152.0515.006.2016152155911 |
| MOD02QKM.A2018094.0250.061.2018094134309 | MYD02QKM.A2016166.0525.005.2016166191738 |
| MOD02QKM.A2018117.0255.061.2018117132326 | MYD02QKM.A2016296.0515.005.2016296154456 |
| MOD02QKM.A2018119.0245.061.2018119133111 | MYD02QKM.A2017099.0510.061.2018031035113 |
| MOD02QKM.A2018122.0315.061.2018122133212 | MYD02QKM.A2017156.0500.061.2018033001811 |
| MOD02QKM.A2018133.0255.061.2018133133024 | MYD02QKM.A2017157.0545.061.2018033002536 |
| MOD02QKM.A2018147.0310.061.2018147134550 | MYD02QKM.A2018075.0525.061.2018075161358 |
| MOD02QKM.A2018149.0255.061.2018149134056 | MYD02QKM.A2018077.0515.061.2018077155249 |
| MOD02QKM.A2018176.0240.061.2018176132832 | MYD02QKM.A2018091.0525.061.2018091162422 |
| MOD02QKM.A2018177.0320.061.2018177133002 | MYD02QKM.A2018123.0525.061.2018123155127 |
| MOD02QKM.A2018181.0255.061.2018181133528 | MYD02QKM.A2018146.0535.061.2018146181151 |
| MOD02QKM.A2018211.0310.061.2018211133457 | MYD02QKM.A2018148.0520.061.2018148172943 |
| MOD02QKM.A2018213.0255.061.2018215195133 | MYD02QKM.A2018262.0510.061.2018263153716 |
| MOD02QKM.A2019049.0250.006.2019049130734 | MYD02QKM.A2019133.0535.006.2019133161427 |
| MOD02QKM.A2019081.0250.006.2019081131937 | MYD02QKM.A2020104.0535.061.2020104153353 |
| MOD02QKM.A2019095.0300.006.2019095132307 | MYD02QKM.A2020126.0455.061.2020126153240 |
| MOD02QKM.A2019097.0250.006.2019097131759 | MYD02QKM.A2020127.0540.061.2020127154913 |
| MOD02QKM.A2019111.0300.006.2019111130434 | MYD02QKM.A2020131.0515.061.2020131152236 |
| MOD02QKM.A2019113.0250.006.2019113130918 | |
References
- Cai, S.Q.; He, J.L.; Xie, J.S. Recent decadal progress of the study on internal solitons in the South China Sea. Adv. Earth Sci. 2011, 26, 703–710. [Google Scholar] [CrossRef]
- Moore, S.E.; Lien, R.-C. Pilot Whales Follow Internal Solitary Waves in the South China Sea. Mar. Mammal Sci. 2007, 23, 193–196. [Google Scholar] [CrossRef]
- Jia, Y.; Tian, Z.; Shi, X.; Liu, J.P.; Chen, J.; Liu, X.; Ye, R.; Ren, Z.; Tian, J. Deep-sea Sediment Resuspension by Internal Solitary Waves in the Northern South China Sea. Sci. Rep. 2019, 9, 128. [Google Scholar] [CrossRef]
- Gong, Y.; Xie, J.; Xu, J.; Chen, Z.; He, Y.; Cai, S. Oceanic internal solitary waves at the Indonesian submarine wreckage site. Acta Oceanol. Sin. 2021, 41, 109–113. [Google Scholar] [CrossRef]
- Craig, W.; Guyenne, P.; Sulem, C. The surface signature of internal waves. J. Fluid Mech. 2012, 710, 277–303. [Google Scholar] [CrossRef]
- Ramp, S.R.; Tang, T.Y.; Duda, T.F.; Lynch, J.F.; Liu, A.K.; Chiu, C.-S.; Bahr, F.L.; Kim, H.-R.; Yang, Y.-J. Internal Solitons in the Northeastern South China Sea Part I: Sources and Deep Water Propagation. IEEE J. Ocean. Eng. 2004, 29, 1157–1181. [Google Scholar] [CrossRef]
- Huang, X.; Chen, Z.; Zhao, W.; Zhang, Z.; Zhou, C.; Yang, Q.; Tian, J. An extreme internal solitary wave event observed in the northern South China Sea. Sci. Rep. 2016, 6, 30041. [Google Scholar] [CrossRef]
- Osborne, A.R.; Burch, T.L. Internal Solitons in the Andaman Sea. Science 1980, 208, 451–460. [Google Scholar] [CrossRef]
- Alpers, W.; Heng, W.-C.; Hock, L. Observation of internal waves in the Andaman Sea by ERS SAR. In Proceedings of the 1997 IEEE International Geoscience and Remote Sensing Symposium Proceedings, Singapore, 3–8 August 1997; pp. 1518–1520. [Google Scholar] [CrossRef]
- Jackson, C. Internal wave detection using the Moderate Resolution Imaging Spectroradiometer (MODIS). J. Geophys. Res. Earth Surf. 2007, 112, C11012. [Google Scholar] [CrossRef]
- Zheng, Q.; Susanto, R.D.; Ho, C.-R.; Song, Y.T.; Xu, Q. Statistical and dynamical analyses of generation mechanisms of solitary internal waves in the northern South China Sea. J. Geophys. Res. Earth Surf. 2007, 112, C03021. [Google Scholar] [CrossRef]
- Kozlov, I.E.; Kudryavtsev, V.N.; Zubkova, E.V.; Zimin, A.V.; Chapron, B. Characteristics of short-period internal waves in the Kara Sea inferred from satellite SAR data. Izv. Atmos. Ocean. Phys. 2015, 51, 1073–1087. [Google Scholar] [CrossRef]
- Bai, X.; Li, X.; Lamb, K.G.; Hu, J. Internal Solitary Wave Reflection Near Dongsha Atoll, the South China Sea. J. Geophys. Res. Oceans 2017, 122, 7978–7991. [Google Scholar] [CrossRef]
- Sun, L.; Zhang, J.; Meng, J. A study of the spatial-temporal distribution and propagation characteristics of internal waves in the Andaman Sea using MODIS. Acta Oceanol. Sin. 2019, 38, 121–128. [Google Scholar] [CrossRef]
- Liu, A.K.; Holbrook, J.R.; Apel, J.R. Nonlinear internal wave evolution in the Sulu Sea. J. Phys. Oceanogr. 1985, 15, 1613–1624. [Google Scholar] [CrossRef]
- Benjamin, T.B. Internal waves of finite amplitude and permanent form. J. Fluid Mech. 1966, 25, 241–270. [Google Scholar] [CrossRef]
- Benjamin, T.B. Internal waves of permanent form in fluids of great depth. J. Fluid Mech. 1967, 29, 559–592. [Google Scholar] [CrossRef]
- Shen, H.; Perrie, W.; Johnson, C.L. Predicting Internal Solitary Waves in the Gulf of Maine. J. Geophys. Res. Oceans 2020, 125, C15941. [Google Scholar] [CrossRef]
- Wang, J.; Zhang, M.; Mei, Y.; Lu, K.; Chen, X. Study on Inversion Amplitude of Internal Solitary Waves Applied to Shallow Sea in the Laboratory. IEEE Geosci. Remote Sens. Lett. 2020, 18, 577–581. [Google Scholar] [CrossRef]
- Alford, M.H.; Peacock, T.; MacKinnon, J.A.; Nash, J.; Buijsman, M.C.; Centurioni, L.R.; Chao, S.-Y.; Chang, M.-H.; Farmer, D.M.; Fringer, O.; et al. The formation and fate of internal waves in the South China Sea. Nature 2015, 521, 65–69. [Google Scholar] [CrossRef]
- Zhao, Z.; Liu, B.; Li, X. Internal solitary waves in the China seas observed using satellite remote-sensing techniques: A review and perspectives. Int. J. Remote Sens. 2014, 35, 3926–3946. [Google Scholar] [CrossRef]
- Ramp, S.R.; Yang, Y.-J.; Bahr, F.L. Characterizing the nonlinear internal wave climate in the northeastern South China Sea. Nonlinear Process. Geophys. 2010, 17, 481–498. [Google Scholar] [CrossRef]
- Alford, M.H.; Lien, R.-C.; Simmons, H.; Klymak, J.; Ramp, S.; Yang, Y.-J.; Tang, D.; Chang, M.-H. Speed and Evolution of Nonlinear Internal Waves Transiting the South China Sea. J. Phys. Oceanogr. 2010, 40, 1338–1355. [Google Scholar] [CrossRef]
- Chen, L.; Zheng, Q.; Xiong, X.; Yuan, Y.; Xie, H. A new type of internal solitary waves with a re-appearance period of 23 h observed in the South China Sea. Acta Oceanol. Sin. 2018, 37, 116–118. [Google Scholar] [CrossRef]
- Yang, Y.J.; Fang, Y.C.; Chang, M.-H.; Ramp, S.R.; Kao, C.-C.; Tang, T.Y. Observations of second baroclinic mode internal solitary waves on the continental slope of the northern South China Sea. J. Geophys. Res. Earth Surf. 2009, 114, C10003. [Google Scholar] [CrossRef]
- Ramp, S.R.; Yang, Y.-J.; Reeder, D.B.; Bahr, F.L. Observations of a mode-2 nonlinear internal wave on the northern Heng-Chun Ridge south of Taiwan. J. Geophys. Res. Earth Surf. 2012, 117, C03043. [Google Scholar] [CrossRef]
- Chen, L.; Xiong, X.; Zheng, Q.; Yuan, Y.; Yu, L.; Guo, Y.; Yang, G.; Ju, X.; Sun, J.; Hui, Z. Mooring observed mode-2 internal solitary waves in the northern South China Sea. Acta Oceanol. Sin. 2020, 39, 44–51. [Google Scholar] [CrossRef]
- Huang, X.; Zhang, Z.; Zhang, X.; Qian, H.; Zhao, W.; Tian, J. Impacts of a Mesoscale Eddy Pair on Internal Solitary Waves in the Northern South China Sea revealed by Mooring Array Observations. J. Phys. Oceanogr. 2017, 47, 1539–1554. [Google Scholar] [CrossRef]
- Xie, J.; Fang, W.; He, Y.; Chen, Z.; Liu, G.; Gong, Y.; Cai, S. Variation of Internal Solitary Wave Propagation Induced by the Typical Oceanic Circulation Patterns in the Northern South China Sea Deep Basin. Geophys. Res. Lett. 2021, 48, L93969. [Google Scholar] [CrossRef]
- Sun, L.N.; Zhang, J.; Meng, J.M. Analysis of spatio-temporal distribution of internal solitary waves in the South China Sea and Sulu Sea (2010–2015). Adv. Mar. Sci. 2019, 37, 398–408. [Google Scholar] [CrossRef]
- Liu, B.; Yang, H.; Ding, X.; Li, X. Tracking the internal waves in the South China Sea with environmental satellite sun glint images. Remote Sens. Lett. 2014, 5, 609–618. [Google Scholar] [CrossRef][Green Version]
- Cai, S. Some characteristics and evolution of the internal soliton in the northern South China Sea. Chin. Sci. Bull. 2002, 47, 21. [Google Scholar] [CrossRef]
- Klymak, J.M.; Pinkel, R.; Liu, C.; Liu, A.K.; David, L. Prototypical solitons in the South China Sea. Geophys. Res. Lett. 2006, 33, L11607. [Google Scholar] [CrossRef]
- Farmer, D.; Alford, M.; Lien, R.-C.; Yang, Y.J.; Chang, M.-H.; Li, Q. From Luzon Strait to Dongsha Plateau: Stages in the Life of an Internal Wave. Oceanography 2011, 24, 64–77. [Google Scholar] [CrossRef]
- Chang, M.; Lien, R.; Lamb, K.G.; Diamessis, P.J. Long-Term Observations of Shoaling Internal Solitary Waves in the Northern South China Sea. J. Geophys. Res. Oceans 2021, 126, C17129. [Google Scholar] [CrossRef]
- Zhao, Y.; Liu, A.K.; Hsu, M. Internal wave refraction observed from sequential satellite images. Int. J. Remote Sens. 2008, 29, 6381–6390. [Google Scholar] [CrossRef]
- Li, X.F.; Jackson, C.R.; Pichel, W.G. Internal solitary wave refraction at Dongsha Atoll, South China Sea. Geophys. Res. Lett. 2013, 40, 3128–3132. [Google Scholar] [CrossRef]
- Yang, H.; Liu, B.Q.; Zhao, Z.X.; Li, X.F. Inferring internal wave phase speed from multi-satellite observations. In Proceedings of the IEEE Geoscience and Remote Sensing Symposium, Quebec City, QC, Canada, 13–18 July 2014; pp. 4768–4771. [Google Scholar] [CrossRef]
- Jackson, C.R. An Empirical Model for Estimating the Geographic Location of Nonlinear Internal Solitary Waves. J. Atmos. Ocean. Technol. 2009, 26, 2243–2255. [Google Scholar] [CrossRef]
- Bai, X.; Liu, Z.; Li, X.; Hu, J. Generation sites of internal solitary waves in the southern Taiwan Strait revealed by MODIS true-colour image observations. Int. J. Remote Sens. 2014, 35, 4086–4098. [Google Scholar] [CrossRef]
- Craig, W.; Guyenne, P.; Sulem, C. Hamiltonian higher-order nonlinear Schrödinger equations for broader-banded waves on deep water. Eur. J. Mech. B/Fluids 2012, 32, 22–31. [Google Scholar] [CrossRef]
- Egbert, G.D.; Erofeeva, S.Y. Efficient inverse modeling of barotropic ocean tides. J. Atmos. Ocean. Tech. 2002, 19, 183–204. [Google Scholar] [CrossRef]
- Cui, H.J.; Li, Z.X.; Zhang, M.; Huang, S.S.; Liang, K.D.; Wang, J. Study on the characteristics of the second mode internal solitary wave in the north of Dongsha Island of the South China Sea. Period Ocean Univ. China 2021, 51, 16–21. [Google Scholar] [CrossRef]
- Magalhaes, J.M.; Da Silva, J.C.B.; Buijsman, M.C. Long lived second mode internal solitary waves in the Andaman Sea. Sci. Rep. 2020, 10, 10234. [Google Scholar] [CrossRef] [PubMed]
- Fu, K.-H.; Wang, Y.-H.; Laurent, L.S.; Simmons, H.; Wang, D.-P. Shoaling of large-amplitude nonlinear internal waves at Dongsha Atoll in the northern South China Sea. Cont. Shelf Res. 2012, 37, 1–7. [Google Scholar] [CrossRef]
Publisher’s Note: MDPI stays neutral with regard to jurisdictional claims in published maps and institutional affiliations. |
© 2022 by the authors. Licensee MDPI, Basel, Switzerland. This article is an open access article distributed under the terms and conditions of the Creative Commons Attribution (CC BY) license (https://creativecommons.org/licenses/by/4.0/).