
A Response Guide for Sunken Oil Mats (SOMs): Formation, Behavior, Detection, and Recovery

Abstract
:1. Introduction
- Submerged oil. Spilled oil that is in the water column, below the water surface, including oil that is in temporary suspension due to turbulence and will refloat or sink in the absence of that turbulence.
- Sunken oil. Spilled oil that is on the bottom of the water body. Oil can sink because:
- -
- The initial density of the oil is greater than that of the receiving water body (this process is more common in freshwater);
- -
- The initial density of the oil is lower than that of the receiving water body but the density of the oil increases as the floating oil weathers; or
- -
- Interaction with sediment (mostly sand) that causes the oil-sediment mixture to become heavier than the receiving water body.
2. Methods
2.1. Case Histories and Literature Review
- All of the spills were of a heavy crude or heavy fuel oil, with two exceptions:
- ○
- The Ixtoc-1 blowout and spill: The medium crude oil emulsified and weathered at sea as it was transported hundreds of kilometers (km) along the coast. The oil observed off the coast of Texas was in the form of floating tarballs and large mats that were extremely viscous [4].
- ○
- The Deepwater Horizon blowout and spill: The medium crude oil traveled through 1500 m (m) of water to reach the surface as an emulsion. The viscosities of two surface slicks collected from offshore barges in July 2010 ranged from 6500–90,000 centistokes [5].
- Often, the oil had weathered (and/or emulsified) at sea for days to weeks before stranding on the shoreline, increasing the oil’s viscosity.
- SOMs formed off exposed sand beaches, indicating the requirement of enough wave action that could suspend sand in the surf zone and/or erode the oiled sand that had stranded on the beach.
- At most of the spills where oil mixed with sand suspended in the surf zone, the tidal range was less than 2 m, and often less than 1 m.
- SOMs were deposited in the trough between the beach and the first offshore bar (e.g., Alvenus, Nissos Amorgos, SE Florida Mystery Spill, Deepwater Horizon). They were also transported by longshore currents and deposited in sheltered lagoons, estuaries, or in the deeper portions of channels (e.g., Venoil/Venpet, Kuroshima, Erika).
- SOMs were patchy in size and distribution, making them difficult to locate and remove.
- SOMs can become a source of chronic re-oiling of the adjacent beach (e.g., Alvenus, Volgonef 248, Morris J. Berman, Deepwater Horizon).

| Spill Name/ Location/Date | Oil Type/ Volume Spilled/Density | SOM Formation | Removal Method |
|---|---|---|---|
| T/V Venoil/Venpet, South Africa December 1977 | Heavy Iranian crude/21,285 to 30,000 t/ 0.87 g/cm3 Bunker fuel/3000 t/ density not reported | Oil came ashore in patches and was lying in pools in depressed portions of the reef as a sand/oil mixture up to 10 cm thick. Some oil was deposited in an estuary where it moved as far as 2 km upstream and formed a layer on the bottom to a depth up to 1.5 m, with 75/15/10% water/oil/sand [4]. | The river mouth was closed by a manmade sand bar to prevent oil redistribution and suction pumps removed the accessible sunken oil mats [6]. |
| T/V Eleni V, Norfolk Coast, Eastern England, northern entrance to the English Channel May 1978 | Heavy fuel oil, 5000 t/ 0.94–0.97 g/cm3 | The oil quickly emulsified into large rafts that barely floated. Sand adhered to the mousse both offshore on sand banks and onshore after rolling in the surf. The oil fouled fishing nets trawled in the water column 2.4–13 km offshore and was found on the seafloor 0.5 km offshore. No reports of fouled gear after 1 year [7,8]. | Stranded oil on sand and gravel beaches was mechanically removed. No mention is made of efforts to remove the tar-like oil deposits just offshore [7,8]. |
| Ixtoc I/Bay of Campeche, Gulf of Mexico June 1979 | Light crude/475,000 t/density not reported | After the passage of a tropical storm in mid-September, 36 mats were found at the toe of the beaches along Padre Island, Texas. The mats contained 8% oil, 15% water, and 77% sand. One year later, 19 mats were still visible. They likely formed as thick oil masses that mixed with sand during the storm. As of 2011, small mats were still located in the region [4,9]. | No mention was made of efforts to remove the mats resulting from the spill [4,10]. |
| T/V Alvenus, Galveston Island, Texas July 1984 | Merey and Pilon crude/~10,000 t/ 0.95 and 0.96 g/cm3 | Release occurred after grounding in the Calcasieu Ship Channel. The viscous oil mixed with sand in the surf zone and sank no further than 30 m from the shoreline along 12 km. 160 t of sunken oil with a high sand content [11]. | Multiple efforts to remove the sunken oil using vacuum, pumps, heavy machinery and manual methods were not effective. The oil was recovered as it broke up and deposited on the beach over a 2-week period [11]. |
| T/B Bouchard 155, Tampa Bay, Florida August 1993 | No. 6 fuel oil/1380 t/ 0.99 g/cm3 | The oil weathered offshore for 7 days then stranded during a storm event. The oil mixed with 7–15% sand by weight in the surf zone and sank in isolated troughs offshore and on an island inside Johns Pass. Over 5440 m2 of oil mats and patties were identified [12]. | Manual removal and vacuuming at very low tide. During dredging of Blind Pass 7 years later, oil fingerprinted as the 1993 spill was found. Oil mats up to 7.6 cm thick, covered by up to 1.2 m of sand, were segregated from the clean sand and removed during dredging [12]. |
| T/B Morris J. Berman, San Juan, Puerto Rico January 1994 | No. 6 fuel oil/32,800 t/ 1.00 g/cm3 | Oil picked up ~2% sand in the surf zone and sank in protected areas ~140 km E/W of the grounding site. Large amounts of oil/sand sank in a lagoon closed off by booms. During the day, as the water warmed and wave energy increased, some of the oil would break off, refloat to the surface and re-oil the adjacent shoreline [13]. | Heavier oil accumulations were removed by diver-assisted vacuum systems, Archimedes screw pumps, and positive displacement piston pumps. Small dredges using centrifugal vane pumps and rotating dredge cutter heads were used to remove sunken oil from two sheltered lagoons. 600 t were recovered [14,15]. |
| T/V Nissos Amorgos, Maracaibo, Venezuela February 1997 | Bachaquero crude/3600 t/ 0.98 g/cm3 | Oil stranded on the shoreline and also mixed with entrained sand in the surf zone that extended >300 m from the shore. ~5% of the oil sank in nearshore troughs. The troughs shifted position over time, remobilizing the sunken oil. The sunken oil contained 30% oil [16]. | Cores were used to delineate locations of sunken oil. Sunken oil was removed using tracked excavating machines working close to shore in water depths of 1 m, over 2.5 to 6 months post spill [16]. |
| M/V Kuroshima/ Dutch Harbor, Alaska November 1997 | Bunker C/150 t/density not reported | Oil was released from a freighter grounded on the shore during a large storm. The oil mixed with sand in the surf zone and, due to hurricane force winds, was forced into Summer Bay Lake. The sunken oil ranged in size from 2.5 cm tar balls to mats up to 1.2 m in diameter in water up to 9 m deep. The mats contained >25% oil [17,18]. | Divers removed the sunken oil by hand, placing it in mesh bags that were then lifted to the surface. Larger mats were cut into pieces then removed. 8.5 tons of oil were removed in 2 weeks [17,18]. |
| T/V Erika, France December 1999 | Heavy fuel oil/20,000 t/ 1.00 g/cm3 | Initial spill occurred ~100 km off the coast of Brittany. After several weeks at sea the oil stranded along 400 km of shoreline. Due to the long time at sea and continued exposure to wave action (storm conditions), viscosity and volume increased (emulsion with 30–50% water). Six months after the spill, sunken oil was found near the Pen Bron Channel, with 10,000 m2 of patches up to 0.15 m and tarballs, including an area of ~700 m2 with heavily contaminated sand [19,20]. | Barge-mounted excavators with screened buckets removed 800 tons of the heavily oiled sand over a 10-day period for disposal. Suction dredgers with blade cutters recovered the less-oiled sand. The dredged material was pumped to onshore separation lagoons where the oil separated from the coarse sand and floated, allowing for recovery via skimming. The sand was tested for oil content: if <1000 ppm, the sand was stockpiled on the beach for surf washing; if >1000 ppm, it was put back through the settling tanks. 5500 tons of material were excavated in 1 month and 85% of the sand was returned to the site [19]. |
| T/V Volgonef 248, Turkey December 1999 | Heavy fuel oil/1578 t/ 0.99 g/cm3 | The vessel grounded during a storm; oil stranded on 5 km of sand beach. The oil mixed with sand, mussels, and other debris and sank in depths 1–14 m and was up to 0.3 m thick, with ~25% oil content. The oil was extremely viscous and a source of chronic shoreline reoiling after storms [21]. | Oil mats in shallow water were removed manually with spades and front-end loaders. In deeper water, divers cut the oil into pieces, placed them in bags, and lifted them to the surface. In 275 days 654 t of oil were recovered, 23% of the spilled volume [21]. |
| SE Florida Mystery Spill August 2000 | Heavy fuel oil/80 t/density not reported | Oil stranded along 40 km of beach. Mats and patties up to 10 cm thick were found mixed with seagrass and sand in the first nearshore trough. Tarballs on the shore were coated with sand. | Divers manually removed the oiled mat material [22]. |
| Lake Wabamun, Canada August 2005 | No. 6 fuel oil/850 t/ 0.99 g/cm3 | Oil from a train derailment flowed over land and into a freshwater lake where oil both floated and sank. Some of the sediment was picked up by the oil as it flowed over land before entering the lake. The sunken oil mixed with vegetation and coarse sediment. More sediment mixed with the oil when it was driven onto beaches by strong winds. Sand content ranged from 3.0 to 18.7% by weight. The sunken oil formed tar balls as well as logs up to 0.3 m in width and 4.5 m in length and in some locations tar mats just offshore. Some oil refloated when separated from sand or vegetation, and during daytime [23]. | The sunken oil was mapped in part using viewing tubes from small boats in shallow water. Other methods used during the recovery effort included bottom grab samples, weighted snares, and trawl nets [23,24]. |
| Lebanon July 2006 | Intermediate fuel oil/10,000 to 15,000 t/ 0.98 g/cm3 | Most of the oil from a bombed powerplant floated but some sank as it picked up sand after being stranded onshore (contained 20% oil) then eroded. Underwater video detected oil mats (10–20 cm thick and several meters wide) and oil “ropes” [25,26]. | The cohesive oil mat was lifted from the sand by hand-generated currents, then rolled like a carpet, cut into pieces and placed in bags [25,26]. |
| Deepwater Horizon, Gulf of Mexico April–July 2010 | Medium crude/460,000 t/ 0.84 g/cm3 | Oiled sand on the shoreline was eroded by wave action and deposited in the nearshore and/or by mixing of floating oil approaching the shoreline with sediment suspended by wave action. Located between the beach and first offshore bar along Gulf-facing beaches from LA to FL. Ranged in size from tarballs few cm to mats up to 3 m wide and 30–60 m long containing 10–20% oil [27,28]. | Mechanical removal using long-reach backhoes, sometimes with sieves [26]. |
| Ras Al Zour, Kuwait August 2017 | Heavy crude/6000 t/density not reported | Oil came ashore and deposited as SOMs in the lower intertidal zone near the sand beaches of Ras Al Zour (S. Zengel, 2017, pers. comm.) | Light mechanical equipment was proposed to remove the lower intertidal mats. |
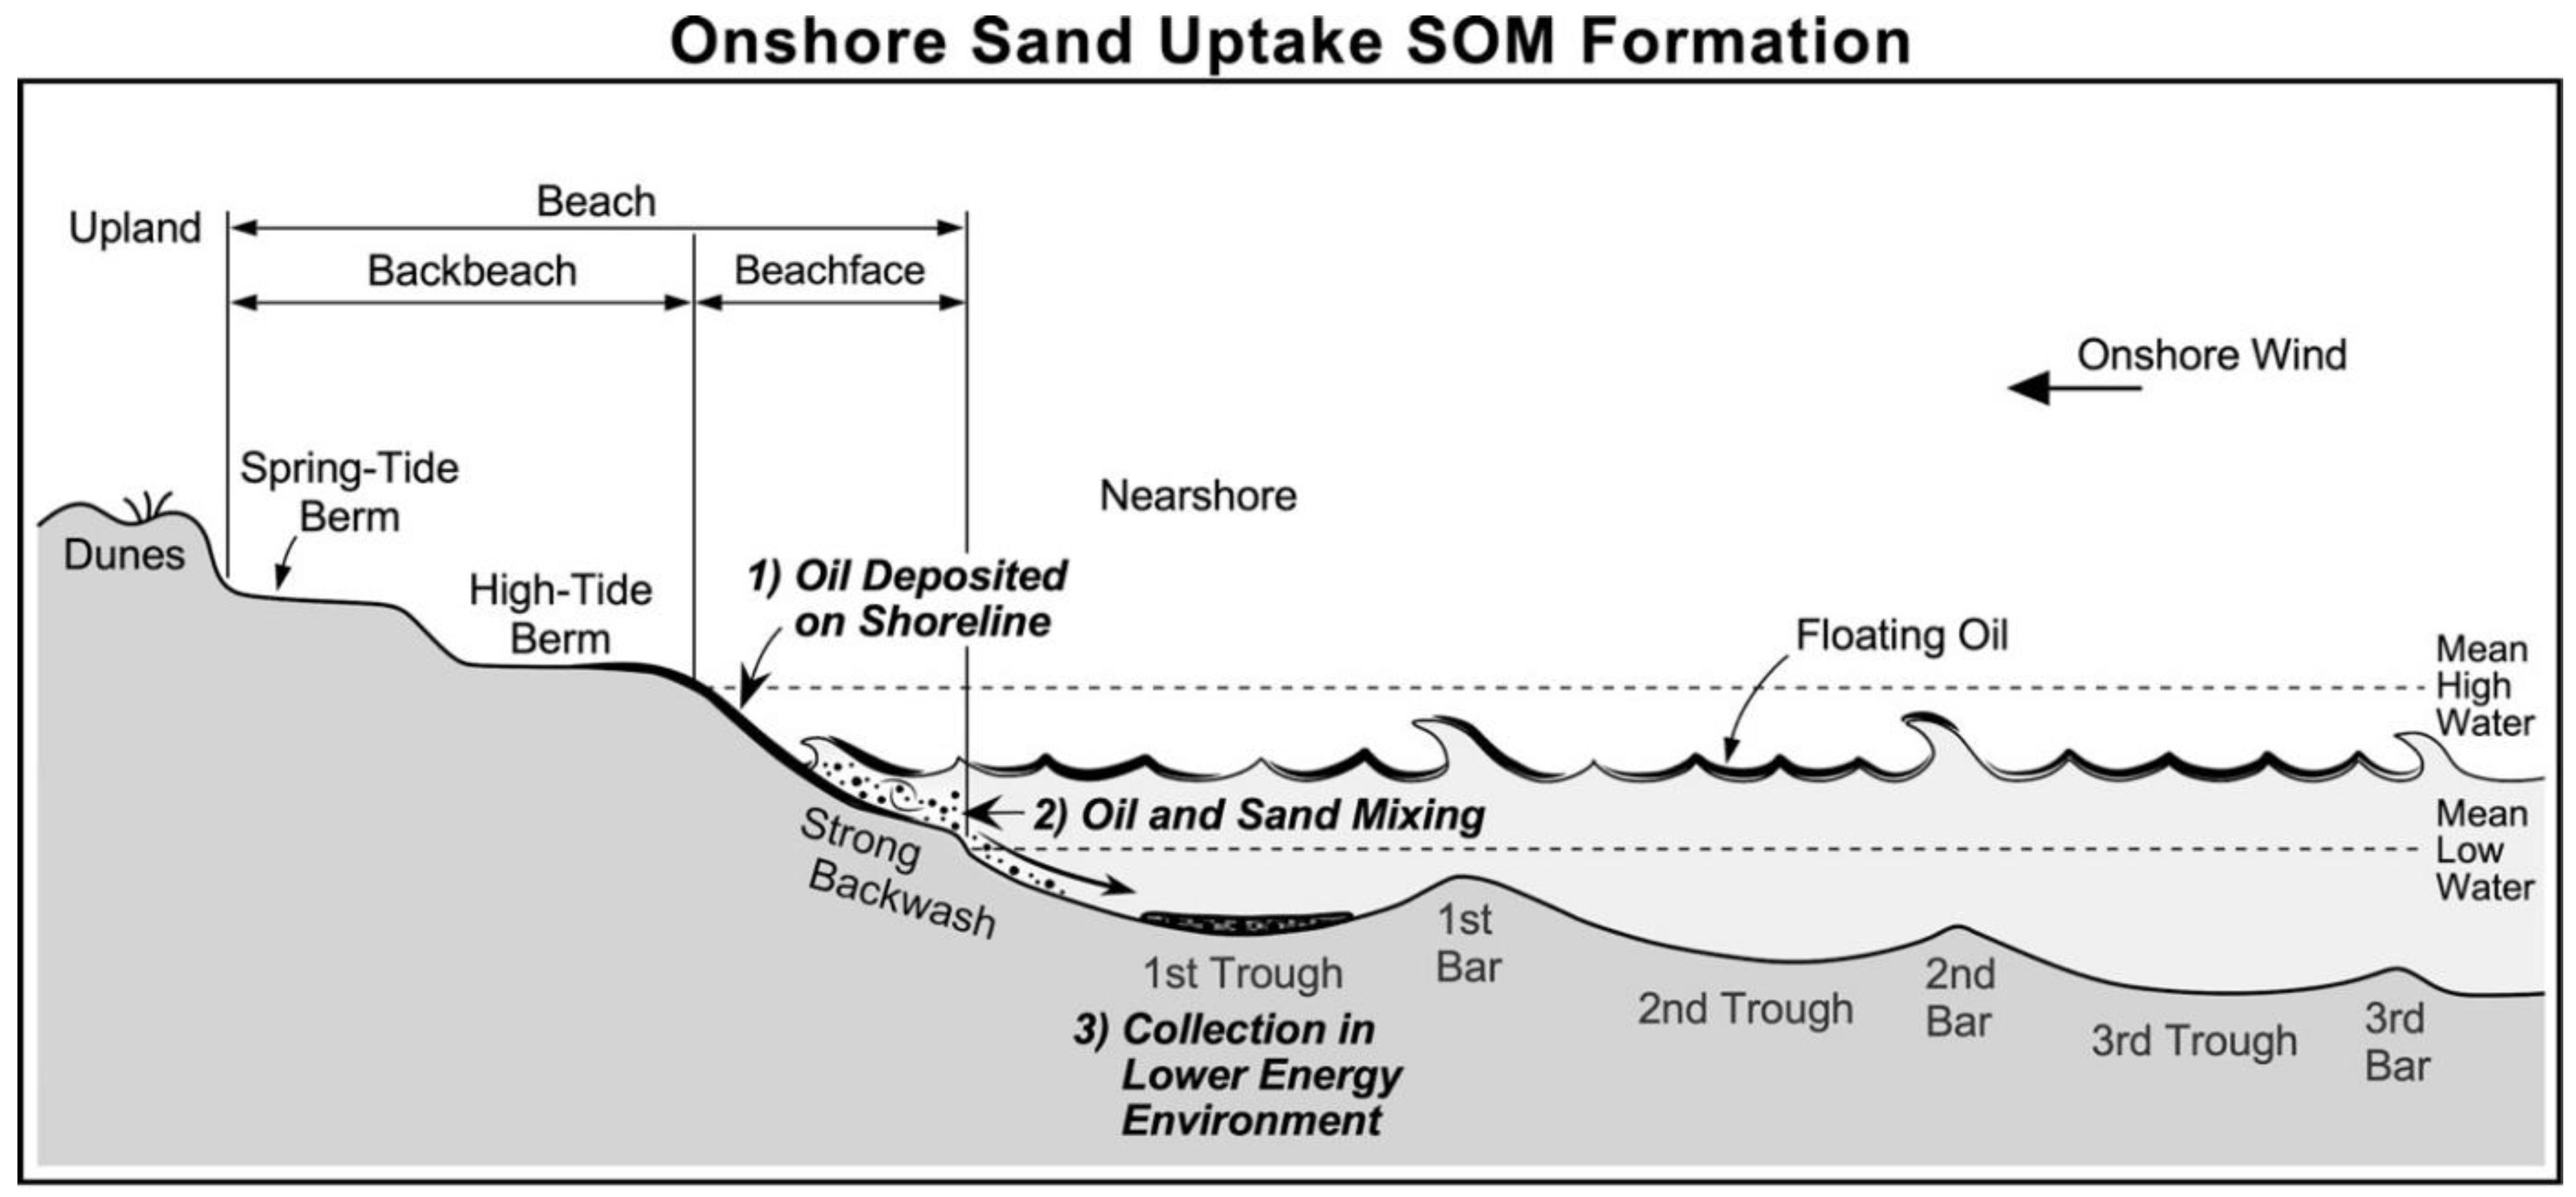
- All evidence supports the premise that SOMs accumulated landward of the first sand bar. Hydrodynamic models were used to show that it “is not likely that enough sand reaches the surface of the water column to mix with oil except in the zone of active wave breaking/runup (where sand and floating oil mix).”
- Heavy shoreline oiling does not equate to SOM formation.
2.2. Factors for Formation of SOMs
2.2.1. Oil Properties
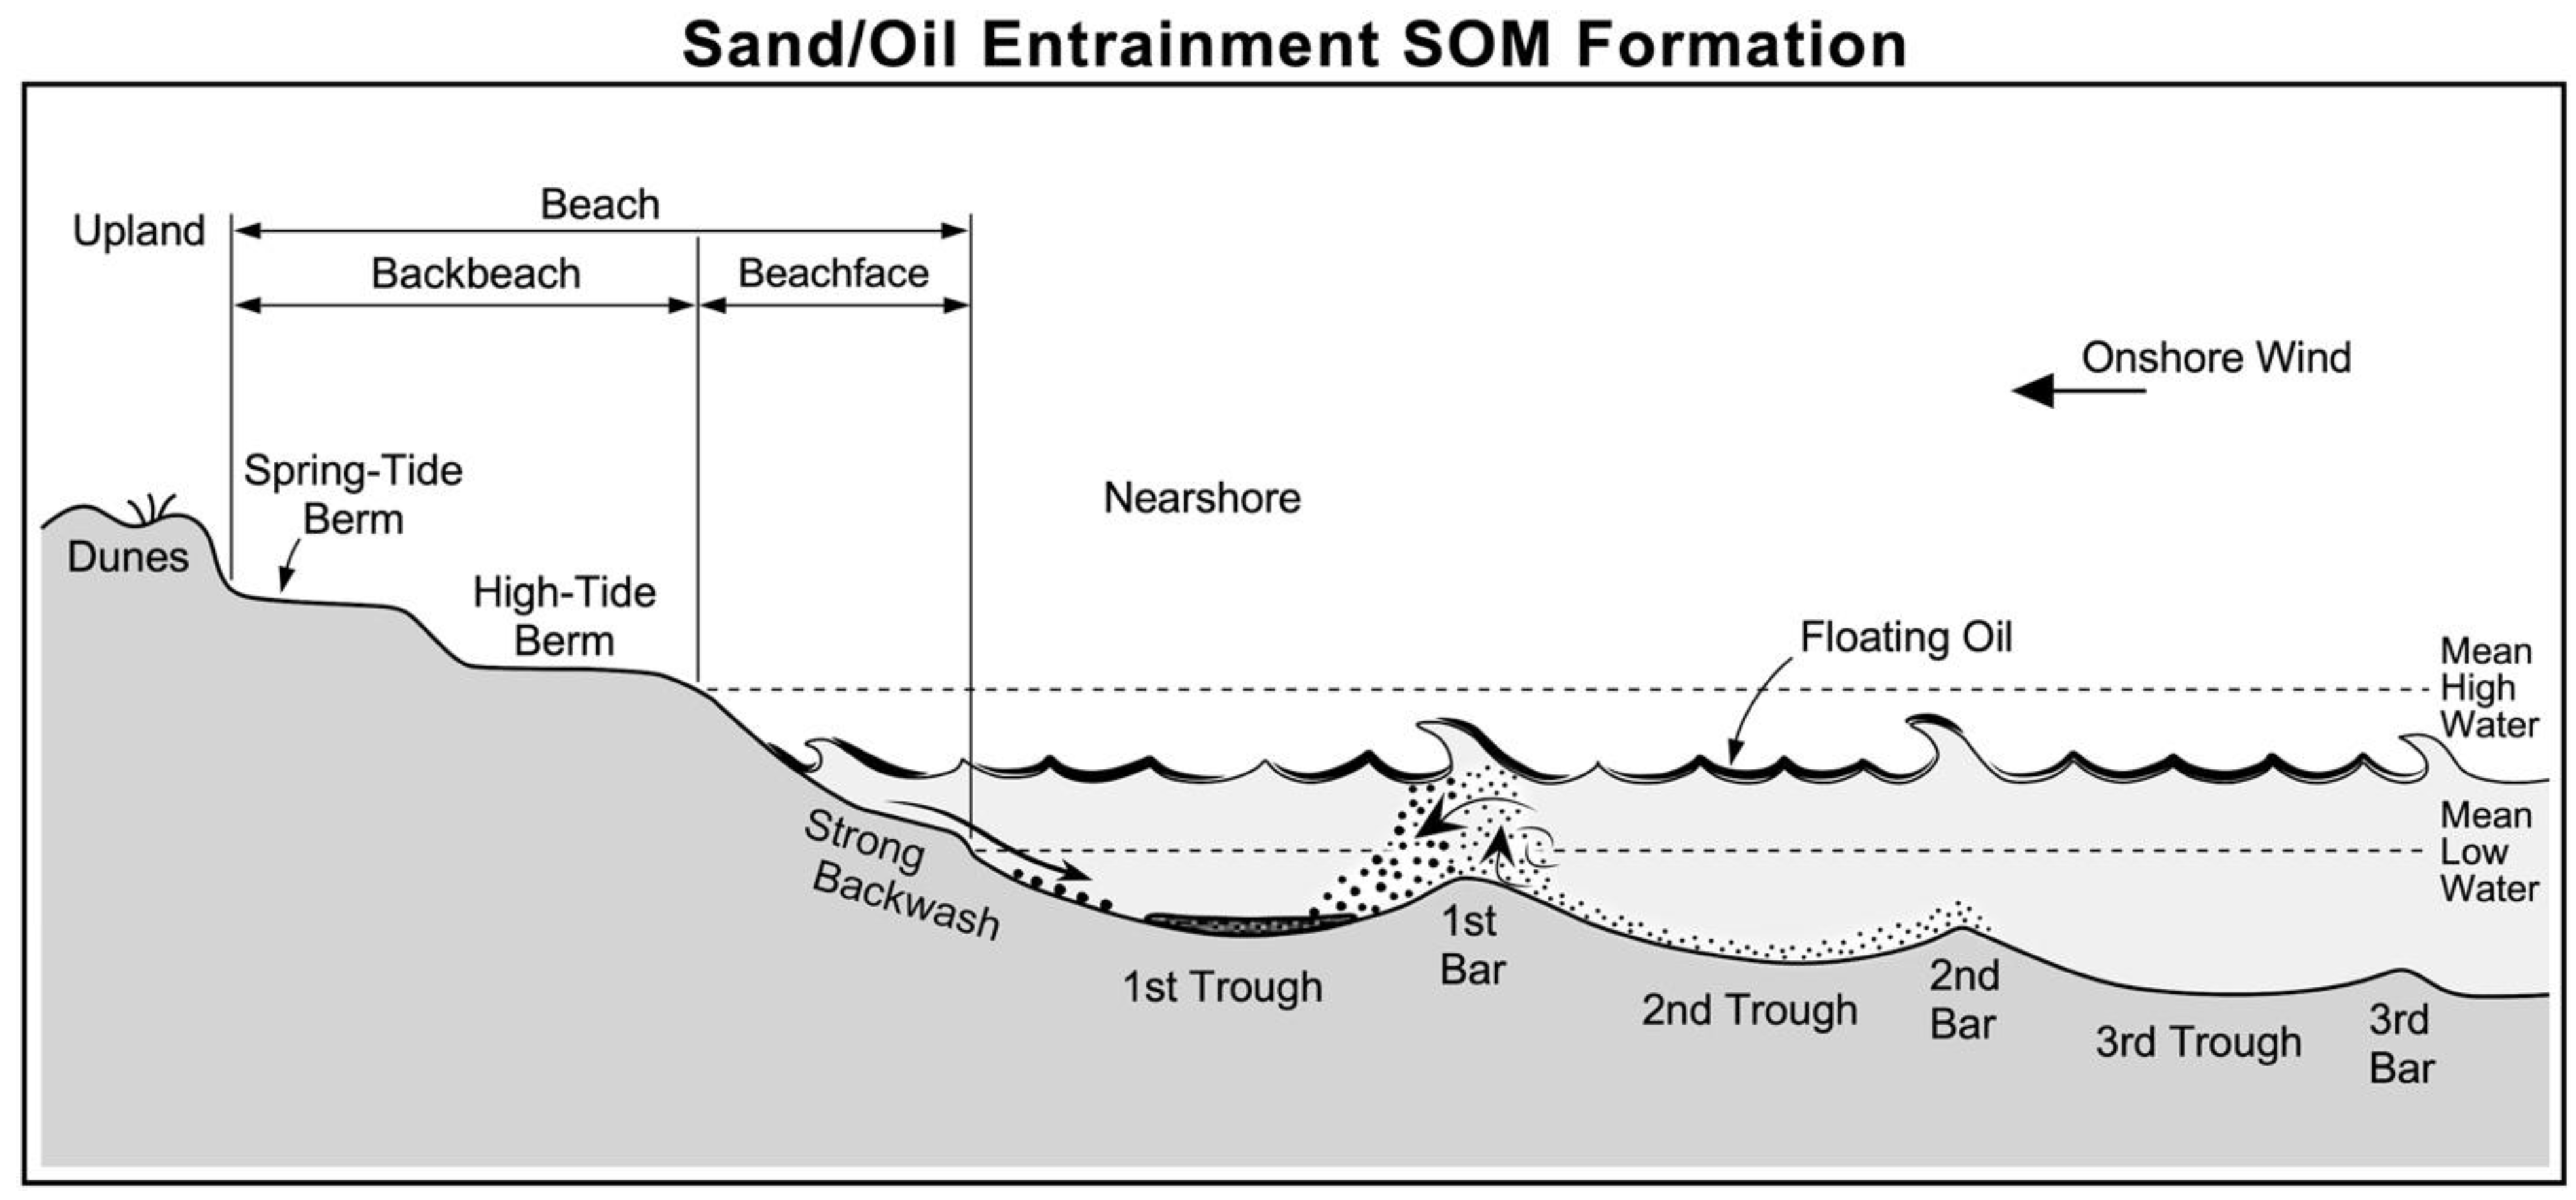
2.2.2. Sand Beach and Nearshore Morphology
2.2.3. Sediment Dynamics
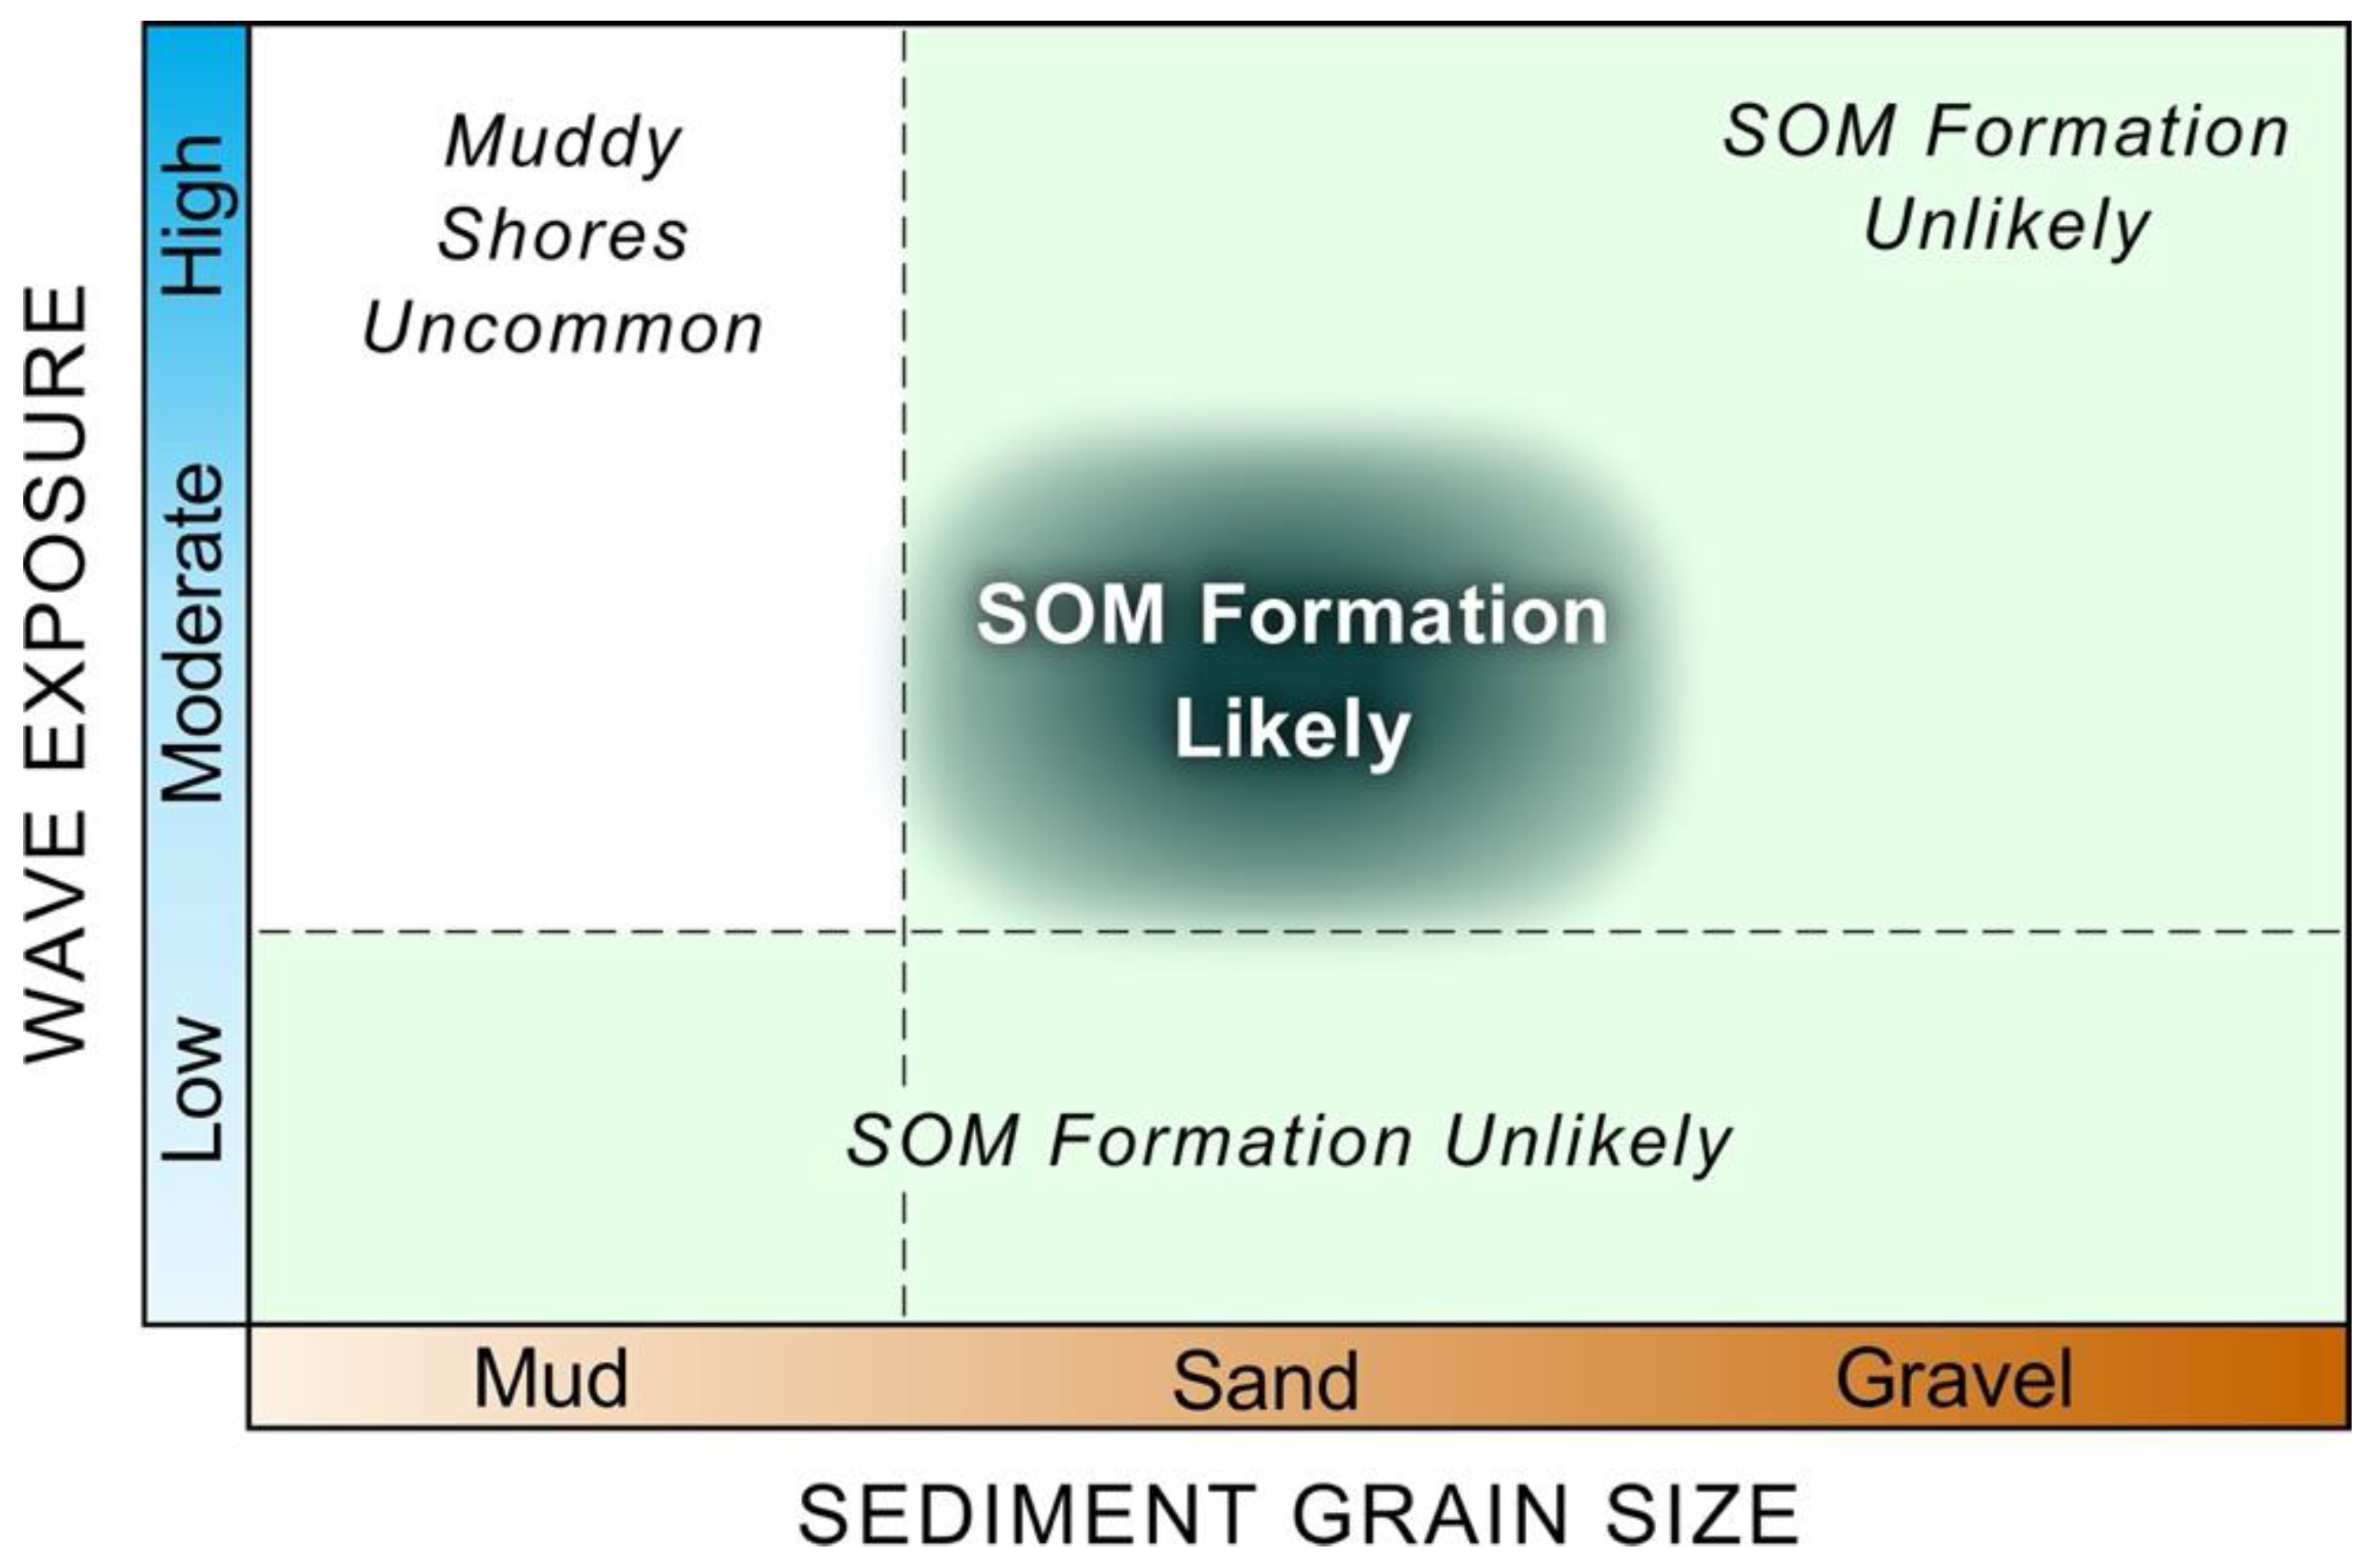
- (1)
- Wave Exposure: Waves are the primary mechanism for suspension of sand in the water column adjacent to sandy shorelines. Along coastal areas with low wave exposure, there would not be enough energy to suspend sand except during storm events. Along coastal areas with high wave exposure, the waves would be energetic enough to disperse the oil into small droplets that would not likely recoalesce into mats on the seafloor.
- (2)
- Presence of Offshore Bar(s): Sand suspended in the surf zone off sand beaches is rare above 0.75 m from the bottom [36], meaning that oil must reach this depth or less before the entrainment process can begin. This depth most often occurs as waves approach and break on the offshore bar(s).
- (3)
- Breaker Type: Plunging waves produce higher concentrations of suspended sand, compared to spilling waves [37].
- (4)
- Distance Relative to Breaker Point: In plunging waves, suspended sand concentration peaks within the first meter of the breakpoint then decreases gradually toward the shore [36].
- (5)
- Slope: Increased slope increases entrainment on 1 to 3% grade beaches, meaning steeper-sloped beaches produced more entrainment and a greater chance for SOMs to form [36].
- (6)
3. Results
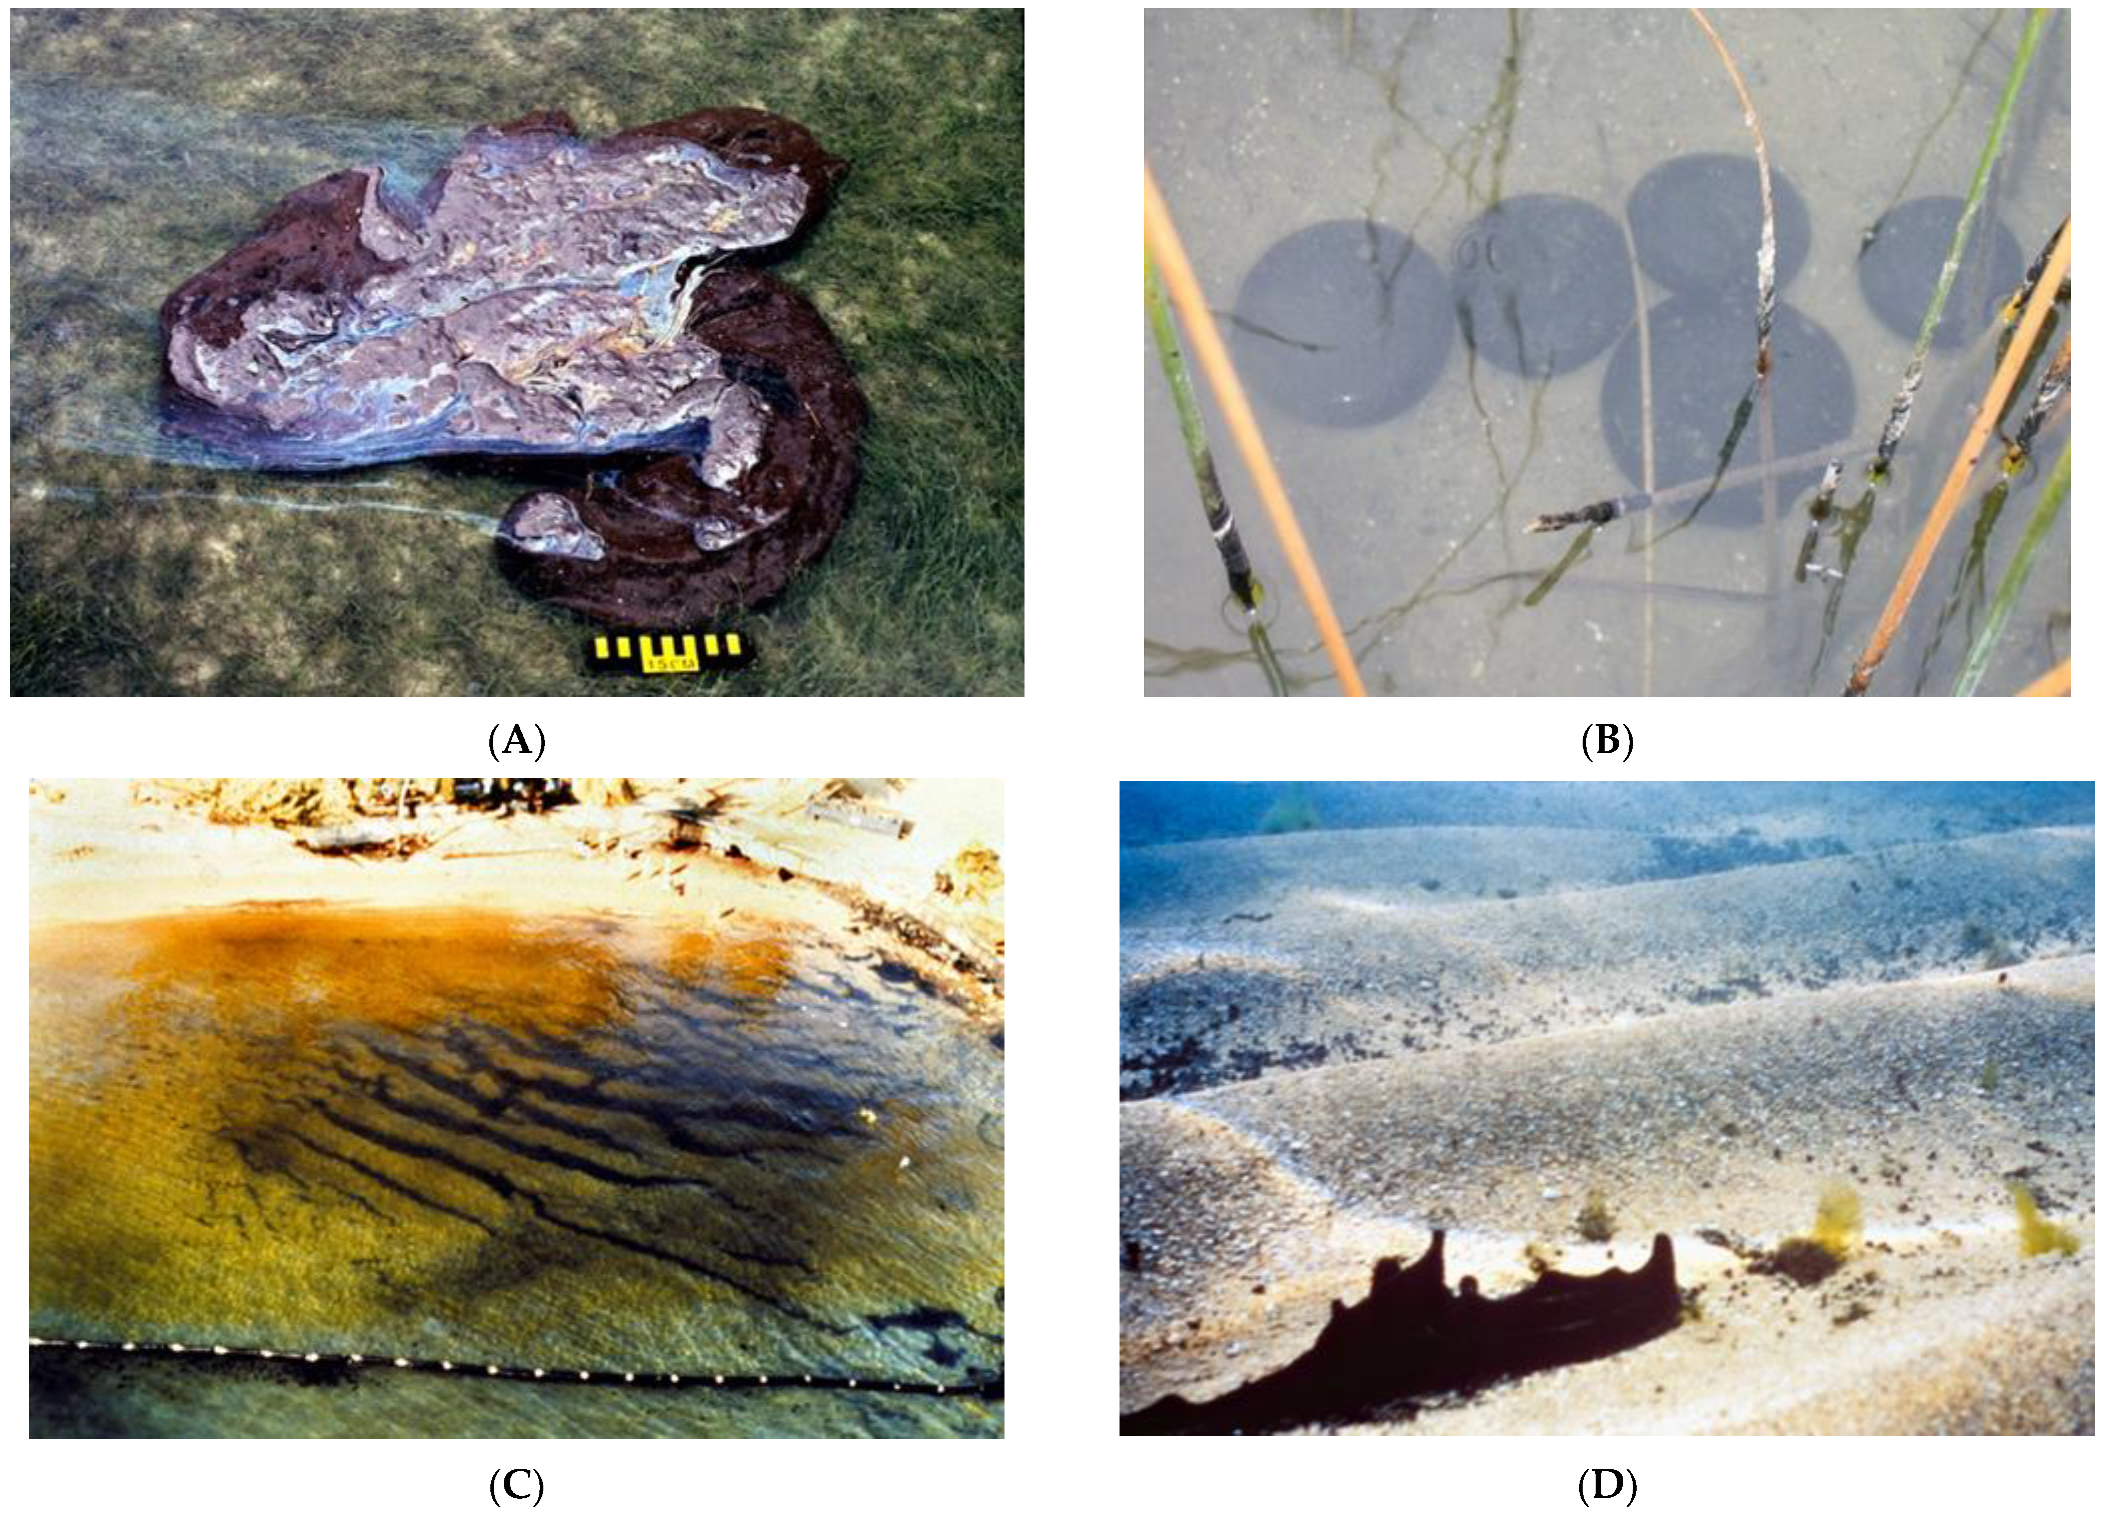
3.1. Oily SOMs vs. Sandy SOMs
3.2. Survey Methods to Detect SOMs
- Open-water environments that are seaward of the surf zone: Mainly offshore of beaches beyond the surf zone and inside of lagoons, estuaries, and lakes, and rivers; and
- Surf zone environments: Mainly in the surf zone offshore of beaches, where shallow water and breaking waves limit the use of vessels.
3.2.1. Acoustic Methods for Open-Water Environments Seaward of the Surf Zone
3.2.2. Visual Methods for Open-Water Environments Seaward of the Surf Zone
3.2.3. Sampling Methods for Open-Water Environments Seaward of the Surf Zone
3.2.4. Sampling Methods for Surf Zone Environments
3.2.5. Effective Methods to Recover SOMs
3.2.6. Selection of SOMs Removal Methods
4. Summary
Author Contributions
Funding
Institutional Review Board Statement
Informed Consent Statement
Acknowledgments
Conflicts of Interest
References
- American Petroleum Institute. Sunken Oil Detection and Recovery, 1st ed.; API Technical Report 1154-1; American Petroleum Institute: Washington, DC, USA, 2016; Available online: http://www.oilspillprevention.org/oil-spill-research-and-development-cente (accessed on 2 March 2022).
- Michel, J.; Hansen, K.A. Chapter 13: Sunken and submerged oil. In Oil Spill Science and Technology; Fingas, M., Ed.; Elsevier: Amsterdam, The Netherlands, 2017; pp. 731–758. [Google Scholar] [CrossRef]
- National Research Council. Nonfloating Oil Spills: Risk and Response; National Academy Press: Washington, DC, USA, 1999; 75p. [Google Scholar]
- Gundlach, E.R.; Finkelstein, K.; Sadd, J.L. Impact and persistence of Ixtoc I oil on the south Texas coast. In Proceedings of the 1987 International Oil Spill Conference, Atlanta, GA, USA, 2–5 March 1981; pp. 477–488. [Google Scholar]
- Forth, H.P.; Morris, J.M.; Lay, C.R.; Lipton, J.; Mitchelmore, C.L.; Suttles, S.E. Characterization of Oil and Water Accommodated Fractions Used to Conduct Toxicity Texting in Support of the Deepwater Horizon Natural Resource Damage Assessment; Technical Report Prepared for NOAA; NOAA: Seattle, WA, USA, 2015; DWH-AR0155415-0049; 48p.
- Moldan, A.; Chapman, P.; Fourie, H.O. Some ecological effects of the Venpet-Venoil collision. Mar. Pollut. Bull. 1979, 10, 60–63. [Google Scholar] [CrossRef]
- Blackman, R.A.A.; Law, J. The ELENI V oil spill: Fate and effects of the oil over the first twelve months. Part I: Oil in waters and sediments. Mar. Pollut. Bull. 1980, 11, 199–204. [Google Scholar] [CrossRef]
- Kaperick, J.A. Oil Beneath the Water Surface and Review of Current Available Literature on Group V Oils: An Annotated Bibliography; Report HMRAD 95-8; National Oceanic and Atmospheric Administration, Hazardous Materials Response and Assessment Division: Seattle, WA, USA, 1995; 34p.
- Tunnell, J.W. Ixtoc I oil spill impacts, short-term and long-term. In Gulf of Mexico Oil Disaster Symposium; National Council for Science and the Environment: Washington, DC, USA, 2011. [Google Scholar]
- Hooper, C.H. (Ed.) The IXTOC I Oil Spill: The Federal Scientific Response; NOAA Hazardous Materials Response Project: Boulder, CO, USA, 1981; 208p.
- Alejandro, A.C.; Buri, J.L. M/V Alvenus: Anatomy of a major oil spill. In Proceedings of the 1987 International Oil Spill Conference, Baltimore, MD, USA, 6–9 April 1987; pp. 27–32. [Google Scholar]
- Michel, J.; Galt, J.A. Conditions under which floating slicks can sink in marine settings. In Proceedings of the 1995 International Oil Spill Conference, Long Beach, CA, USA, 27 February–2 March 1995; pp. 573–576. [Google Scholar]
- U.S. Coast Guard. Tank Barge Morris J. Berman Spill, Submerged Oil Recovery Operations; San Juan, PR, USA, 1994; 104p. [Google Scholar]
- Ploen, M. Submerged oil recovery. In Second International Oil Spill Research and Development Forum; International Maritime Organization: London, UK, 1995; pp. 165–173. [Google Scholar]
- Burns, G.H.; Kelly, S.; Benson, C.A.; Eason, T.; Benggio, B.; Michel, J.; Ploen, M. Recovery of submerged oil at San Juan, Puerto Rico 1994. In Proceedings of the 1995 International Oil Spill Conference, Long Beach, CA, USA, 27 February–2 March 1995; pp. 551–557. [Google Scholar]
- Moller, T.H. Summary of the T/V Nissos Amorgos oil spill. In Unpublished Document Distributed at the NRC Workshop on Nonfloating Oil Spills, on 20 August 1998; International Tanker Owners Pollution Federation Limited: London, UK, 1998; p. 1. [Google Scholar]
- Kane, D.A. Recovery of submerged oil from an Alaska lake. In Proceedings of the 2003 International Oil Spill Conference, Vancouver, BC, Canada, 6–11 April 2003; pp. 713–718. [Google Scholar]
- Martin, C.A.; Mauseth, G.S.; Suggs, R.D. Underwater cleanup assessment program during the M/V Kuroshima incident, April 1998. In Proceedings of the 2003 International Oil Spill Conference, Vancouver, BC, Canada, 6–11 April 2003; pp. 1275–1278. [Google Scholar]
- Le Guerroue, P.; Poupon, E.; Merlin, F.X.; Cariou, G. Recovery of sunken and buried oil in coastal water during the Erika spill. In Proceedings of the 2003 International Oil Spill Conference, Vancouver, BC, Canada, 6–11 April 2003; pp. 551–558. [Google Scholar]
- Čović, I.; Šimunac, A.; Veža, J.; Slišković, M.; Jelić-Mrčelić, G. Methods of pollution removal after Tanker Erika Accident. Trans. Marit. Sci. 2013, 2, 41–48. [Google Scholar] [CrossRef] [Green Version]
- Moller, T.H. Recovery of sunken oil in the Sea of Marmara. In Proceedings of the Third Research and Development Forum on High-Density Oil Spill Response, Brest, France, 11–13 March 2002; International Maritime Organization: London, UK, 2002; pp. 337–345. [Google Scholar]
- National Oceanic and Atmospheric Administration. Incident News Reports for Golden Beach Mystery Spill. 2000. Available online: https://incidentnews.noaa.gov/incident/9962#! (accessed on 3 March 2022).
- Fingas, M.; Hollebone, B.; Fieldhouse, B. The density behaviour of heavy oils in freshwater: The example of Lake Wabamun spill. In Presentation and Paper for the 2006 Freshwater Spill Symposium; U.S. Environmental Protection Agency: Washington, DC, USA, 2006. [Google Scholar]
- Sergy, G.A.; Lamarche, A.; Owens, E.H.; Reimer, P.D.; Zrum, L. Nearshore surveys following the Lake Wabamun Oil Spill. In Proceedings of the 34th Arctic and Marine Oilspill Program Technical Seminar, Banff, AB, Canada, 4–6 October 2011; pp. 19–34. [Google Scholar]
- Elsarji, M. How a local NGO succeeded in cleaning up the Lebanon oil spill, 2006. In Proceedings of the 2008 International Oil Spill Conference, Savannah, GA, USA, 4–8 May 2008; pp. 327–330. [Google Scholar]
- Fichaut, B. Massive use of berm relocation and surf washing during the 2006 Jyeh oil spill (Lebanon): The accurate response for beaches cleanup. In Proceedings of the 2008 International Oil Spill Conference, Savannah, GA, USA, 4–8 May 2008; pp. 331–338. [Google Scholar]
- Operational Science Advisory Team (OSAT-3). Summary Technical Report for Submerged Oil Mat Tactical Plan, Phase 1 Execution; Deepwater Horizon Unified Command: New Orleans, LA, USA, 2011; 77p. [Google Scholar]
- Dalyander, P.S.; Long, J.W.; Plant, N.G.; Thompson, D.M. Assessing mobility and redistribution patterns of sand and oil agglomerates in the surf zone. Mar. Poll. Bull. 2014, 80, 200–209. [Google Scholar] [CrossRef] [PubMed]
- Operational Science Advisory Team (OSAT-3). Summary Report: Investigation of Recurring Residual Oil in Discrete Shoreline Areas and Other Indicators in the Eastern Area of Responsibility; Deepwater Horizon Unified Command: New Orleans, LA, USA, 2013; 54p. + Appendices A to F. [Google Scholar]
- Plant, N.G.; Long, J.W.; Dalyander, P.S.; Thompson, D.M.; Raabe, E.A. Application of a Hydrodynamic and Sediment Transport Model for Guidance of Response Efforts Related to the Deepwater Horizon Oil Spill in the Northern Gulf of Mexico along the Coast of Alabama and Florida: U.S. Geological Survey Open-File Report 2012–1234. 2013; 48p. Available online: http://pubs.usgs.gov/of/2012/1234/ (accessed on 3 March 2022).
- Gustitus, S.A.; Clement, T.P. Formation, fate, and impacts of microscopic and macroscopic oil-sediment residues in nearshore marine environments: A critical review. Rev. Geophys. 2017, 55, 1130–1157. [Google Scholar] [CrossRef]
- National Academies of Sciences, Engineering, and Medicine. Spills of Diluted Bitumen from Pipelines: A Comparative Study of Environmental Fate, Effects, and Response; The National Academies Press: Washington, DC, USA, 2016; 144p. [Google Scholar] [CrossRef]
- Wang, Z.; Hollebone, B.P.; Fingas, M.; Sigouin, L.; Landriault, M.; Smith, P.; Noonan, J.; Thouin, G.; Weaver, J.W. Characteristics of Spilled Oils, Fuels, and Petroleum Products: 1. Composition and Properties of Selected Oils; U.S. Environmental Protection Agency: Washington, DC, USA, 2003; EPA/600/R-03/072.
- Ward, C.P.; Armstrong, C.J.; Conmy, R.N.; French-McCay, D.P.; Reddy, C.M. Photochemical oxidation of oil reduced the effectiveness of aerial dispersants applied in response to the Deepwater Horizon spill. Environ. Sci. Technol. 2018, 5, 226–231. [Google Scholar] [CrossRef] [Green Version]
- Dalyander, P.S.; Plant, N.G.; Long, J.W.; McLaughlin, M. Nearshore dynamics of artificial sand and oil agglomerates. Mar. Poll. Bull. 2011, 96, 344–355. [Google Scholar] [CrossRef]
- Kana, T.W. Suspended Sediment in Breaking Waves. Unpublished Ph.D. Dissertation, Geology Department, University of South Carolina, Columbia, SC, USA, 1979; 153p. [Google Scholar]
- Román-Sierra, J.; Muñoz-Perez, J.J.; Navarro-Pons, M. Beach nourishment effects on sand porosity variability. Coast. Eng. 2014, 83, 221–232. [Google Scholar] [CrossRef] [Green Version]
- Michel, J. Spills of nonfloating oil: Evaluation of response technologies. In Proceedings of the 2008 International Oil Spill Conference, Savannah, GA, USA, 4–8 May 2008; pp. 261–267. [Google Scholar]
- Parthiot, F.; de Nanteuil, E.; Merlin, F.X.; Zerr, B.; Guedes, Y.; Lurton, X.; Augustin, J.M.; Cervenka, P.; Marchal, J.; Sessarego, J.P. Sonar detection and monitoring of sunken heavy fuel oil on the seafloor. In Proceedings of the Interspill 2004, Trondheim, Norway, 14–17 June 2004; Available online: https://www.interspill.org/wp-content/uploads/2021/11/465_PARTHIOT.pdf (accessed on 3 March 2022).
- Hansen, K.A.; Fitzpatrick, M.; Herring, P.R.; VanHaverbeke, M. Heavy Oil Detection (Prototypes); Report CG-D-08-09; U.S. Coast Guard Research and Development Center: Groton, CT, USA, 2009; 42p. + Appendices.
- Wynn, J.; Williamson, M.; Frank, J. Sequestered oil pollution mapping, and tracking active oil breakouts in sensitive rivers, bays, and estuaries by induced polarization. In Proceedings of the 2017 International Oil Spill Conference, Long Beach, CA, USA, 15–18 May 2017. [Google Scholar]
- Fitzpatrick, M.; Tebeau, P.A.; Hanson, K.A. Development of Bottom Oil Recovery Systems-Final Project Report; Report No. CG-D-09-13; U.S. Coast Guard Research and Development Center: Groton, CT, USA, 2013; 35p. + Appendices.
- Arekhi, M.; Terry, L.G.; John, G.F.; Clement, T.P. Environmental fate of petroleum biomarkers in Deepwater Horizon oil spill residues over the past 10 years. Sci. Total Environ. 2021, 791, 148056. [Google Scholar] [CrossRef]


| Method | Operation | Advantages for SOM Detection | Considerations for SOM Detection | Prior Use | |
|---|---|---|---|---|---|
| Acoustic Methods | Side Scan Sonar | Sonar (>350 kHz) towed by a vessel. Shows seabed texture, and backscatter anomalies can be viewed in real time to ID potential targets. | Rapid area coverage. Readily available. Software improvements allow real-time visualization and output as georeferenced map. Able to detect oil patch >1 m2. | Minimum water depth is approximately 1 m. Likely difficult to detect SOMs in the backscatter from muddy sediments. Requires ground truth for validation of sonar data. Not able to detect buried oil. | Promising results from a field test at Deepwater Horizon (Florida and Alabama); Large tank studies with patches of sunken oil on sand substrate [38,39] |
| Single beam and Multibeam Echo Sounder | Sonar (>350 kHz) pole-mounted on vessel. | Provides bathymetry maps showing low spots where SOMs could collect. Bathymetric data may be needed to support recovery operations. | Resolution of bottom features is ~0.5–1 m. Detection of SOMs difficult unless they are thick enough to show as a bathymetric anomaly. | Promising results from a field test at Deepwater Horizon | |
| Sub Bottom Profiler | Vessel-mounted or towed, with sonar designed to penetrate strata below the surface in a narrow swath. | Potential for detection of buried SOMs, when used in conjunction with other sonars. | Poor data in organic-rich muds because of entrained gas. No experience in if/how SOM anomaly might appear. | Promising results from a field test at Deepwater Horizon | |
| 3D Scanning Sonar | Towed by a vessel. Multiple beams both horizontally and vertically ensonify the bottom and water column. | Creates 3D images from the backscatter at varying intensities. | Resolution of bottom features is ~0.6–1 m. Detection of SOMs on the bottom may be difficult unless they are thick enough to show as an anomaly or in high backscatter contrast with the substrate. | Promising results from a field test at Deepwater Horizon; Large tank study with patches of sunken oil on sand substrate [40] | |
| Acoustic Camera | Very high-frequency (>1500 kHz) and high-resolution imaging sonar deployed by diver, on ROV, or mounted on the bottom. | Creates 3D monotone images from the backscatter that are very optical like in water of low visibility. Could be deployed at a fixed location to monitor SOMs remobilization. | Resolution is <0.3 m. Narrow field of view so best used under low visibility settings to create images of SOMs distribution. | No |
| Method | Operation | Advantages for SOM Detection | Considerations for SOM Detection | Prior Use | |
|---|---|---|---|---|---|
| Visual Methods | Digital Still Camera | Deployed by divers, on a ROV, or dropped from a vessel to take pictures at specific locations. Images can be georeferenced. | Very high-resolution images that can be georeferenced. | Discrete images do not provide continuous images of the water bottom. Water turbidity limits effectiveness. Can get fouled by oil because it must be operated close to the bottom. | Lebanon |
| Video Camera | Deployed by divers or on a ROV. Images can be georeferenced. | High-resolution images that can be georeferenced. Can show behavior of SOMs in currents, presence of biota, etc. | Turbidity limits the effectiveness. Can get fouled by oil because it is operated close to the bottom. | Deepwater Horizon, Lake Wabamun, Kuroshima, Lebanon | |
| Aerial Observation | Trained individuals search for SOMs by aerial observation using the flight path and GPS to collect data points. | Large areas can be searched in a short period of time. | Buried oil cannot be detected by aerial observation. Only feasible in very clear water. Seaweed, seagrass, and schools of fish can look like SOMs. | Morris J. Berman, Lake Wabamun | |
| Diver Observation | Commercial divers search for SOMs visually or in no visibility conditions can detect SOMs by feel. Position of the diver can be georeferenced. | Divers can measure SOM thickness and extent as well as provide direct feedback regarding bottom conditions. Divers can collect samples and describe/photograph what the samples represent and the bottom conditions. | The amount of time the diver can spend at the bottom is based on depth. The divers umbilical cord may force the support vessel to reposition, and high winds/waves may prevent safe dive operations. Water visibility is a key factor. It is difficult to get an accurate position of a diver on the bottom, so may not be able to relocate the SOM for subsequent removal. | Alvenus, Kuroshima, Erika, Volgoneft 248, Lebanon, Morris J. Berman, Deepwater Horizon | |
| Surface Viewing | Observers inspect the bottom directly or using underwater viewers, collecting data along pre-determined transects using GPS to collect data points. | Limited equipment and resources needed; observers can quickly determine if SOMs are present. | Method is only effective in clear, shallow water and during daylight hours. Not effective for buried SOMs. | Lake Wabamun, Bouchard 155 |
| Method | Operation | Advantages for SOM Detection | Considerations for SOM Detection | Prior Use | |
|---|---|---|---|---|---|
| Sampling Methods | Grab Sampler | Set of jaws is shut when sampler reaches the bottom or bucket rotates into the sediment when it reaches the bottom. Location can be georeferenced. | Relatively easy to handle and operate, readily available, and versatile in terms of substrate type. Manual recovery limits amount of sediment and water removed from the environment. | Not effective for SOMs buried below ~8 inches. May be difficult to collect sediments in hard-packed sand, thus requiring a heavier sampler and winch for deployment and retrieval. Sediment structure and oiled layers may not be preserved. | Volgonef 248, SE Florida Mystery Spill, Kuroshima |
| Core Sampler | A core tube or box core is driven into the sediment by gravity, pistons, or vibration and recovered using a winch or crane from a vessel. Location can be georeferenced. | Box cores can collect sediments 0.3–1 m deep, gravity cores up to 0.3–1.3 m, and vibracores 0.3–6 m. Thus, they are the best way to detect buried SOMs. | Method has limited spatial detail. Very slow and labor intensive. Cores have to be split open or extruded for observation, which delays data turnaround. | Nissos Amorgos | |
| Towed Sorbents (V-SORS) | Sorbents are attached to chains and dragged along the bottom then brought to the surface for visual analysis. Transects can be georeferenced. | Able to cover a large distance. Can be used in vessel traffic lanes. High confidence the sorbent maintains bottom contact. | Requires a large vessel with a crane. Highly dependent on wave conditions. Cannot determine where along the trawl the SOM occurred, or the distribution/thickness of the SOM. Cannot detect buried SOMs. | Deepwater Horizon; has been successful for heavy oils that sank to the seafloor [2,38] | |
| Other Methods | Induced Polarization | A controlled electrical current is introduced into the water using transmit electrodes; the induced voltage is measured with non-polarizing receiver electrodes. Deployed from a vessel and towed close to the seabed. The distance between transmit and receiver electrode pairs determines penetration depth. Transects can be georeferenced. | Can detect hydrocarbons in the water column, on the bottom, and buried below the surface. Operators can perform on-the-fly interpretation with real-time displays. | Operator training standards are currently more rigorous than other systems. Aerially range limited to 40 feet in the current configuration, but good subsurface penetrations. Only one system currently available. There are no field data showing ability to detect SOMs. | Field trials at Superfund site with creosote/tar showed promise [41]. |
| Method | Operation | Advantages for SOM Detection | Considerations for SOM Detection | Prior Use | |
|---|---|---|---|---|---|
| Visual Methods | Aerial Observation | Trained individuals search for SOMs by aerial observation using the flight path and GPS to collect data points. | Large areas can be searched in a short period of time. | Water visibility is a limiting factor. Most effective under low wave conditions. Buried oil cannot be detected. Seaweed, seagrass and schools of fish can be false positives. Needs ground truthing. | Bouchard 65, Morris J. Berman, Deepwater Horizon |
| Surface Viewing | Viewing tubes are hand-held in shallow water from boats to observe the seabed. Each location or transect can be georeferenced. | Can improve visual observations of any surface oil and bottom features. Data can be collected at point locations or along transects. | Not able to detect buried oil. May be difficult to maintain steady views in wave action. Resuspension of oily SOMs in the surf may contaminate workers and equipment. | Lake Wabamun | |
| Sampling Methods | Core/Box/Grab Sampler | A core tube or box/grab sampler is driven into the sediment and retrieved by hand. Core tubes are 2–10 cm in diameter; box samplers collect a square or rectangle ~700 cm2. Each location can be georeferenced. | Hand-deployed box cores can collect a sample up to ~0.3 m thick, core tubes ~1 m. However, deep core tubes may be difficult to retrieve and may require a tripod to extract the core. | Very slow and labor intensive, with limited spatial detail. Box/grab samplers may be difficult to penetrate into compact sand. The material in the samplers may have to be dumped into a container so may not be able to describe oil distribution with depth. Core tubes can have poor recovery in sand and some compaction may occur. Core tubes have to be returned to shore and extruded/cut open to observe oil distribution. | Deepwater Horizon |
| Shovel Sample | Referred to as “Snorkel SCAT” during Deepwater Horizon, survey teams use a narrow blade shovel to dig into the sand to 45 cm depths and bring the material to surface to visually detect the presence of SOMs. Each location can be georeferenced. | Team can work in unison with removal operations to quickly remove identified SOMs, which is very important off exposed sand beaches because of rapid burial by sand bar and shoreline migration. | Method has limited spatial detail (only the width of the shovel blade); though once a SOM is found, can be readily delineated. Very slow and labor intensive. Can provide information on oil distribution with depth. | Deepwater Horizon, Southeast Florida Mystery Spill |
| Method | Operation | Advantages for SOM Removal | Considerations for SOM Removal | Prior Use | |
|---|---|---|---|---|---|
| Vessel-Orientated Operations | Hydraulic Suction Dredging | Cutter/auger head is lowered into the sediment and dragged along the seabed. The collected SOM and sediments are pumped into a recovery tank on a barge or onshore for separation and treatment. | May be effective for thick SOMs in a well-defined area, thereby reducing the potential for generating large amounts of contaminated sediments. Effective for buried SOMs. | Generates large amounts of contaminated water and sediment for decanting, and dewatering and handling of solids. May be difficult to find waste-handling sites close to the dredged location. | Erika, Morris J. Berman |
| Diver-Directed Pumping and Vacuuming | Centrifugal or positive-displacement pumps are located at or below the water surface and are attached to a diver-directed suction hose. Vacuum transfer unit on a barge or shoreline and divers direct nozzle to recover each SOM. | Divers can selectively recover SOM material, reducing the amount of waste generated. Hot water can be introduced to reduce viscosity. Likely most effective on Oily SOMs that are less viscous. Effective for buried SOMs. | Generates large amounts of water and sediment that require treatment. Only positive displacement pumps can handle high viscosity material. Not effective for buried SOMs. Special requirements for oiled water diving. | Venoil/Venpet, Bouchard 155, Morris J. Berman | |
| Barge- Mounted Excavator/Clamshell Dredge | Consists of an excavator or clamshell dredge removing SOMs and dumping them into a recovery tank on a barge. | Effective for solid or semi-solid material. Much lower waste generation compared to dredge/pump. Can track progress with geo-referenced locational data. Effective for buried SOMs. | This method requires a large vessel or barge if in unprotected water. Has a small coverage area for each scoop. Limited to ~12 m water depth. | Erika, Volgonef 248 | |
| Airlift Pneumatic Dredge | Compressed air is transferred via a hose down to a tube extending from the vessel to the seafloor. A diver directs the air flow up the tube. The rising air expands and creates a strong current in the tube, which lifts the SOMs to the surface where they are transferred to containers on the vessel. | In good visibility, the diver can selectively remove individual patches or larger accumulations. The diver can adjust the air flow and reduce it when re-positioning. Can be used to selectively remove overburden prior to removing SOMs. The deeper the water, the greater the airlift current. | May be hard for divers in full protective gear to handle the tube in water greater than 15 m. Generates moderate amounts of contaminated water. Requires compressed air at increasing pressures and volume at increased depth. Solid pieces of debris can block the flow in the tube, which can result in sudden buoyancy that can suddenly lift the diver upwards. |
| Method | Operation | Advantages for SOM Removal | Considerations for SOM Removal | Prior Use | |
|---|---|---|---|---|---|
| Mechanical | Excavator | Mechanical removal consists of an excavator scooping up the SOM material in the nearshore zone and placing it on a temporary mat for disposal. | This method is effective for recovery of solid or semi-solid material because it can be removed with little associated water. | Has a small coverage area. The excavator reach is limited to the length of the arm, so it is highly likely that some SOMs cannot be reached by an excavator on the beach. | Deepwater Horizon |
| Submersible dredge | Remote-controlled vehicle that crawls along the bottom, pumping material via a hose to separator tank. Operator uses cameras and acoustical imaging to direct the pump. | This method could potentially be effective in the surf zone where excavators cannot reach. | Current designs have a large cutterhead | Prototype tested by USCG R&DC and showed promise [42] | |
| Manual | Physical Removal | Involves two methods: (1) use of workers at wading depths in the water to remove SOMs by hand or using hand tools such as shovels, rakes, pitch forks or hand nets; and (2) use of divers in deeper water to collect SOMs and place them in bags that are lifted to the surface for handling by a boat crew. | This method requires a labor force and hand tools. Very selective recovery, limiting the amount of unnecessary water and sand. | The method is slow and labor intensive. It is restricted to shallow water and waves and current limit operations. This method also requires good water visibility. | Deepwater Horizon, Lebanon, Volgonef 248, Southeast Florida Mystery Spill, Kuroshima |
| Passive | Come Ashore/Natural Erosion | Involves letting natural processes break down the SOMs over time and deposit them on the adjacent shoreline. | Minimizes waste generation and habitat disturbance. | SOMs may remain in the environment for an unknown period of time, causing chronic re-oiling of adjacent shorelines. | Most every spill to a certain extent. |
| Factors | Vessel-Oriented Recovery Methods for Open Water Environments Seaward of the Surf Zone | Recovery Methods for Surf Zone Environments | ||||||||
|---|---|---|---|---|---|---|---|---|---|---|
| Hydraulic Suction Dredge | Diver-Directed Pump/Vacuum | Barge-Mounted Excavator/Clamshell Dredge | Pneumatic Airlift Dredge | Towed Sorbents | Trawls and Nets | Excavator | Submersible Dredge | Physical Removal | Come Ashore/Natural Removal | |
| Water Depth (m) | ||||||||||
| - <1.5 m | ||||||||||
| - 1.5–12 m | ||||||||||
| - 12–25 m | - | - | - | - | ||||||
| - >25 m | - | - | - | - | ||||||
| Water Current | ||||||||||
| - <2 knots | ||||||||||
| - >2 knots | ||||||||||
| Water Visibility | ||||||||||
| - <1.5 m | ||||||||||
| - >1.5 m | ||||||||||
| Availability | ||||||||||
| Bottom Obstruction | ||||||||||
| SOM Patch Size | ||||||||||
| - <0.1 m2 | ||||||||||
| - >0.1–1 m2 | ||||||||||
| - >1 m2 | ||||||||||
| Oily SOMs | ||||||||||
| Sandy SOMs | ||||||||||
| Buried SOMs | ||||||||||
| Sensitive Habitat | ||||||||||
| Removal Rate | ||||||||||
| Waste Generation | ||||||||||
Publisher’s Note: MDPI stays neutral with regard to jurisdictional claims in published maps and institutional affiliations. |
© 2022 by the authors. Licensee MDPI, Basel, Switzerland. This article is an open access article distributed under the terms and conditions of the Creative Commons Attribution (CC BY) license (https://creativecommons.org/licenses/by/4.0/).
Share and Cite
Michel, J.; Bambach, P. A Response Guide for Sunken Oil Mats (SOMs): Formation, Behavior, Detection, and Recovery. J. Mar. Sci. Eng. 2022, 10, 368. https://doi.org/10.3390/jmse10030368
Michel J, Bambach P. A Response Guide for Sunken Oil Mats (SOMs): Formation, Behavior, Detection, and Recovery. Journal of Marine Science and Engineering. 2022; 10(3):368. https://doi.org/10.3390/jmse10030368
Chicago/Turabian StyleMichel, Jacqueline, and Philip Bambach. 2022. "A Response Guide for Sunken Oil Mats (SOMs): Formation, Behavior, Detection, and Recovery" Journal of Marine Science and Engineering 10, no. 3: 368. https://doi.org/10.3390/jmse10030368
APA StyleMichel, J., & Bambach, P. (2022). A Response Guide for Sunken Oil Mats (SOMs): Formation, Behavior, Detection, and Recovery. Journal of Marine Science and Engineering, 10(3), 368. https://doi.org/10.3390/jmse10030368