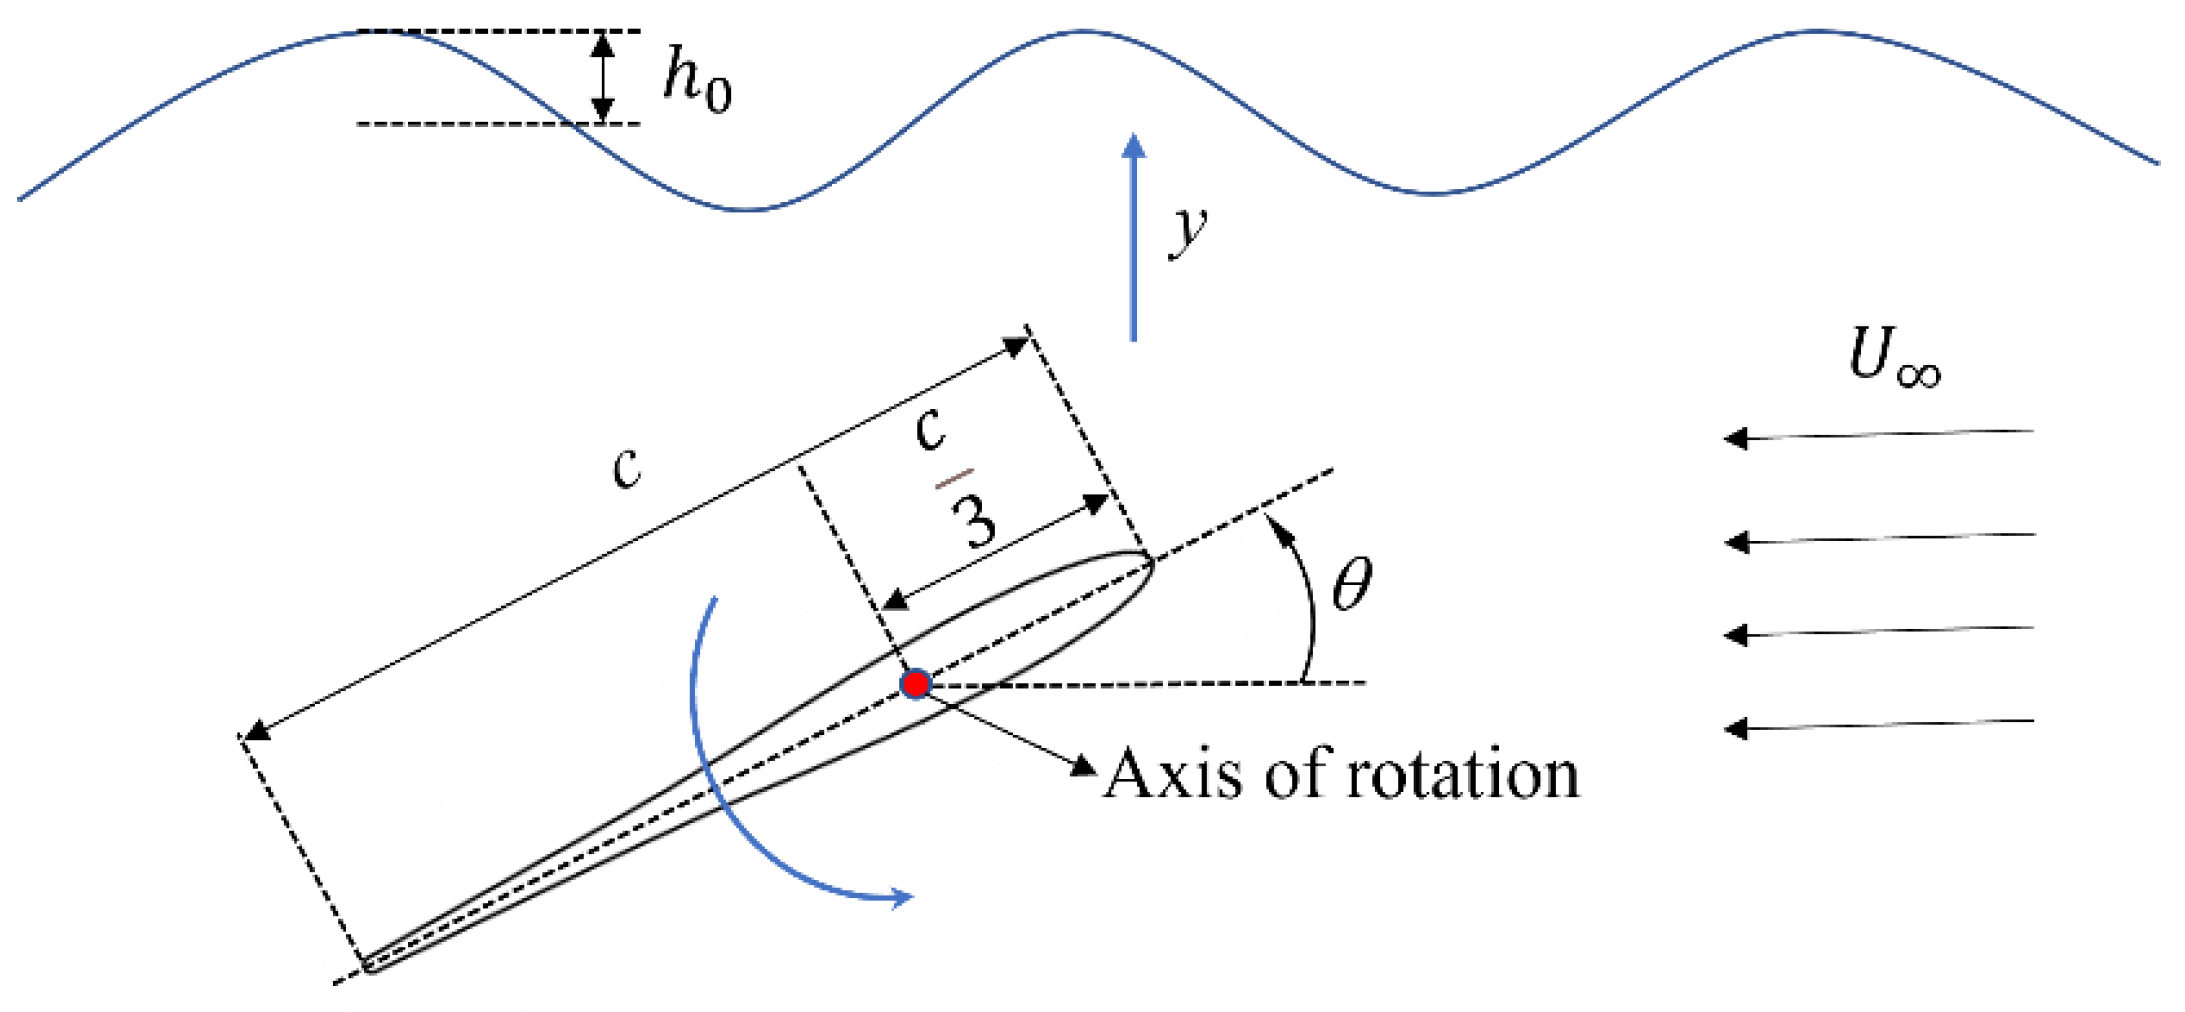
Figure 1.
Umbilical cable inclination angle of the wave glider.
Figure 1.
Umbilical cable inclination angle of the wave glider.
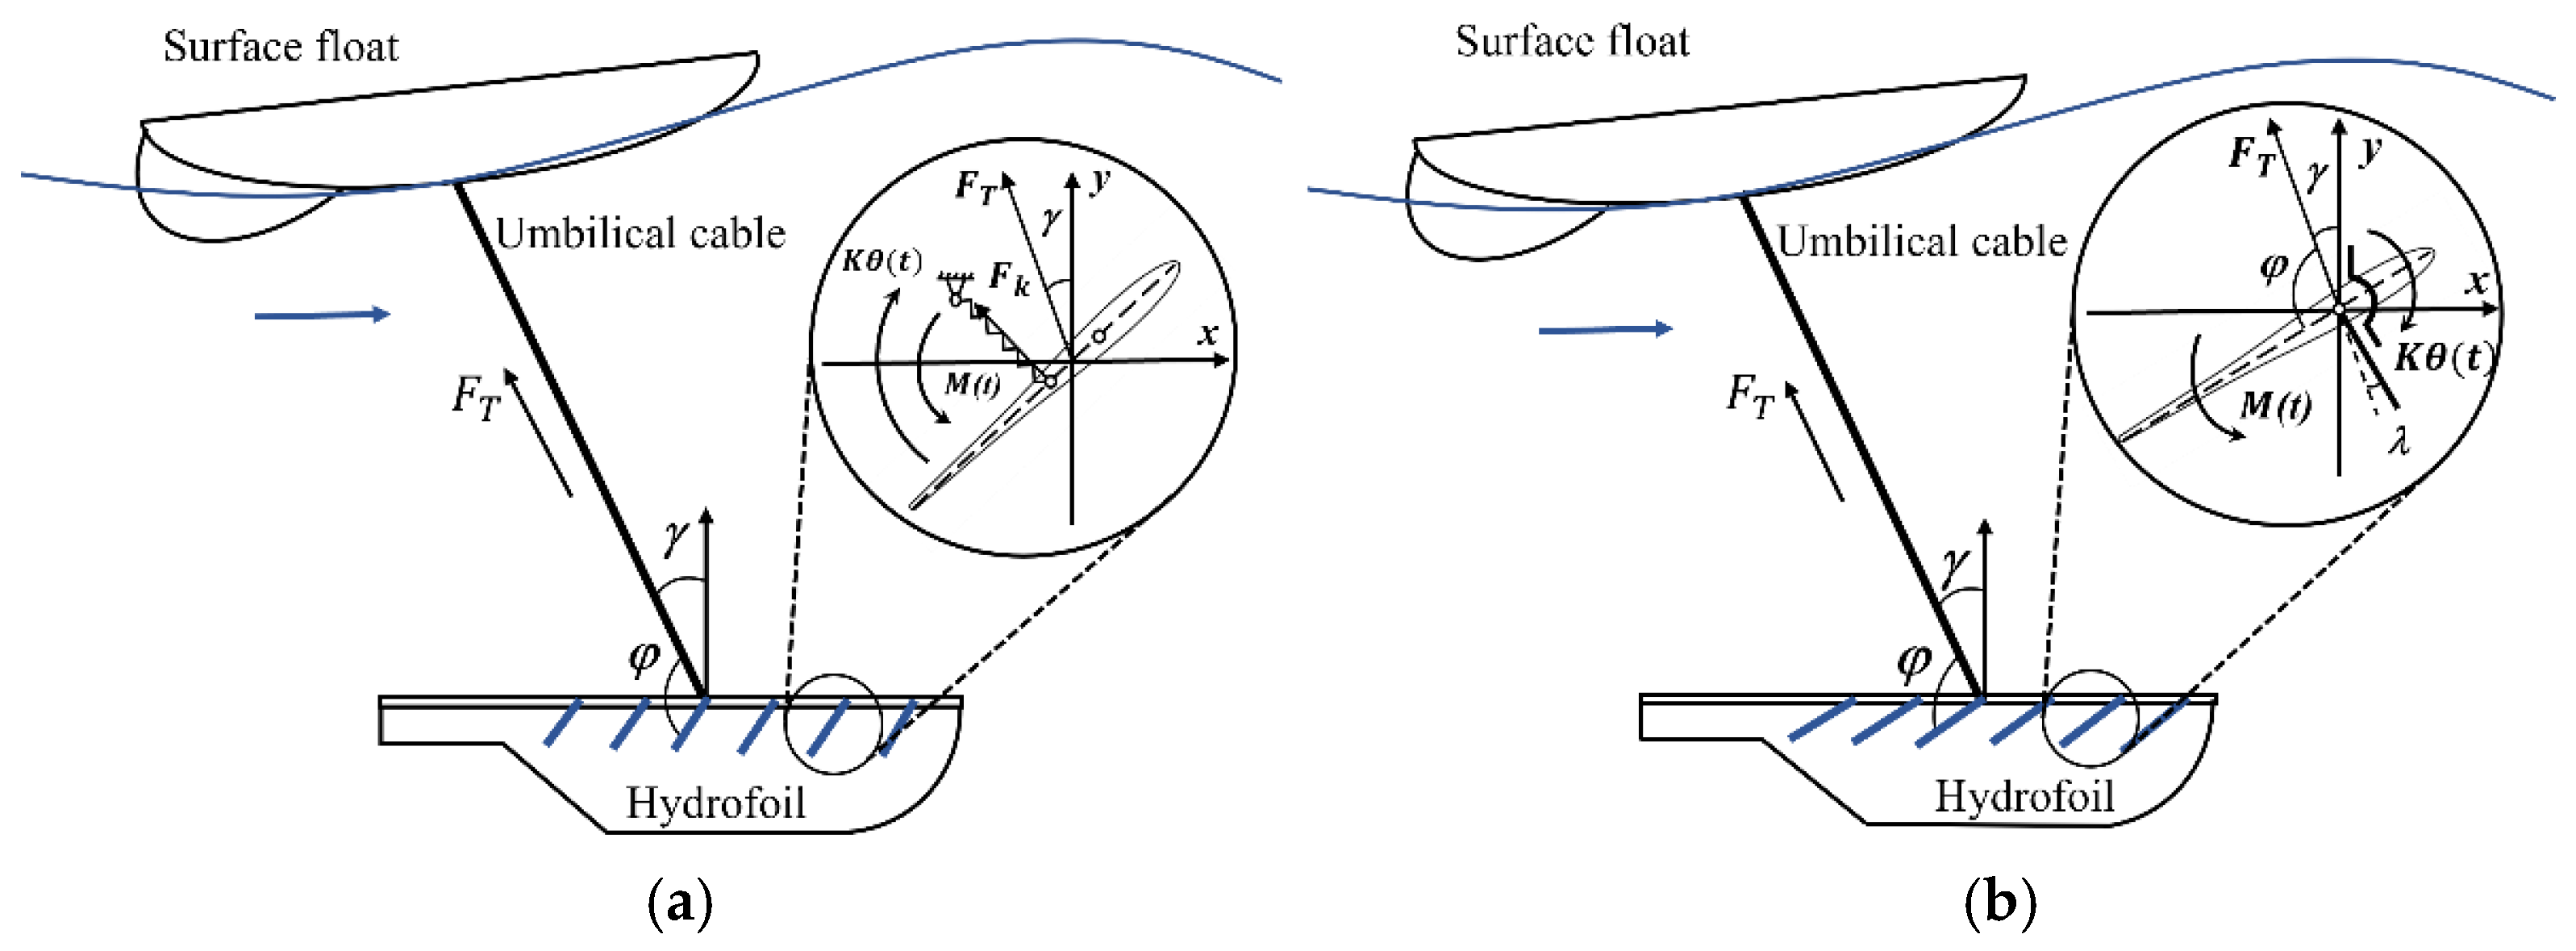
Figure 2.
Schematic illustration of the coupled motion of the hydrofoil.
Figure 2.
Schematic illustration of the coupled motion of the hydrofoil.
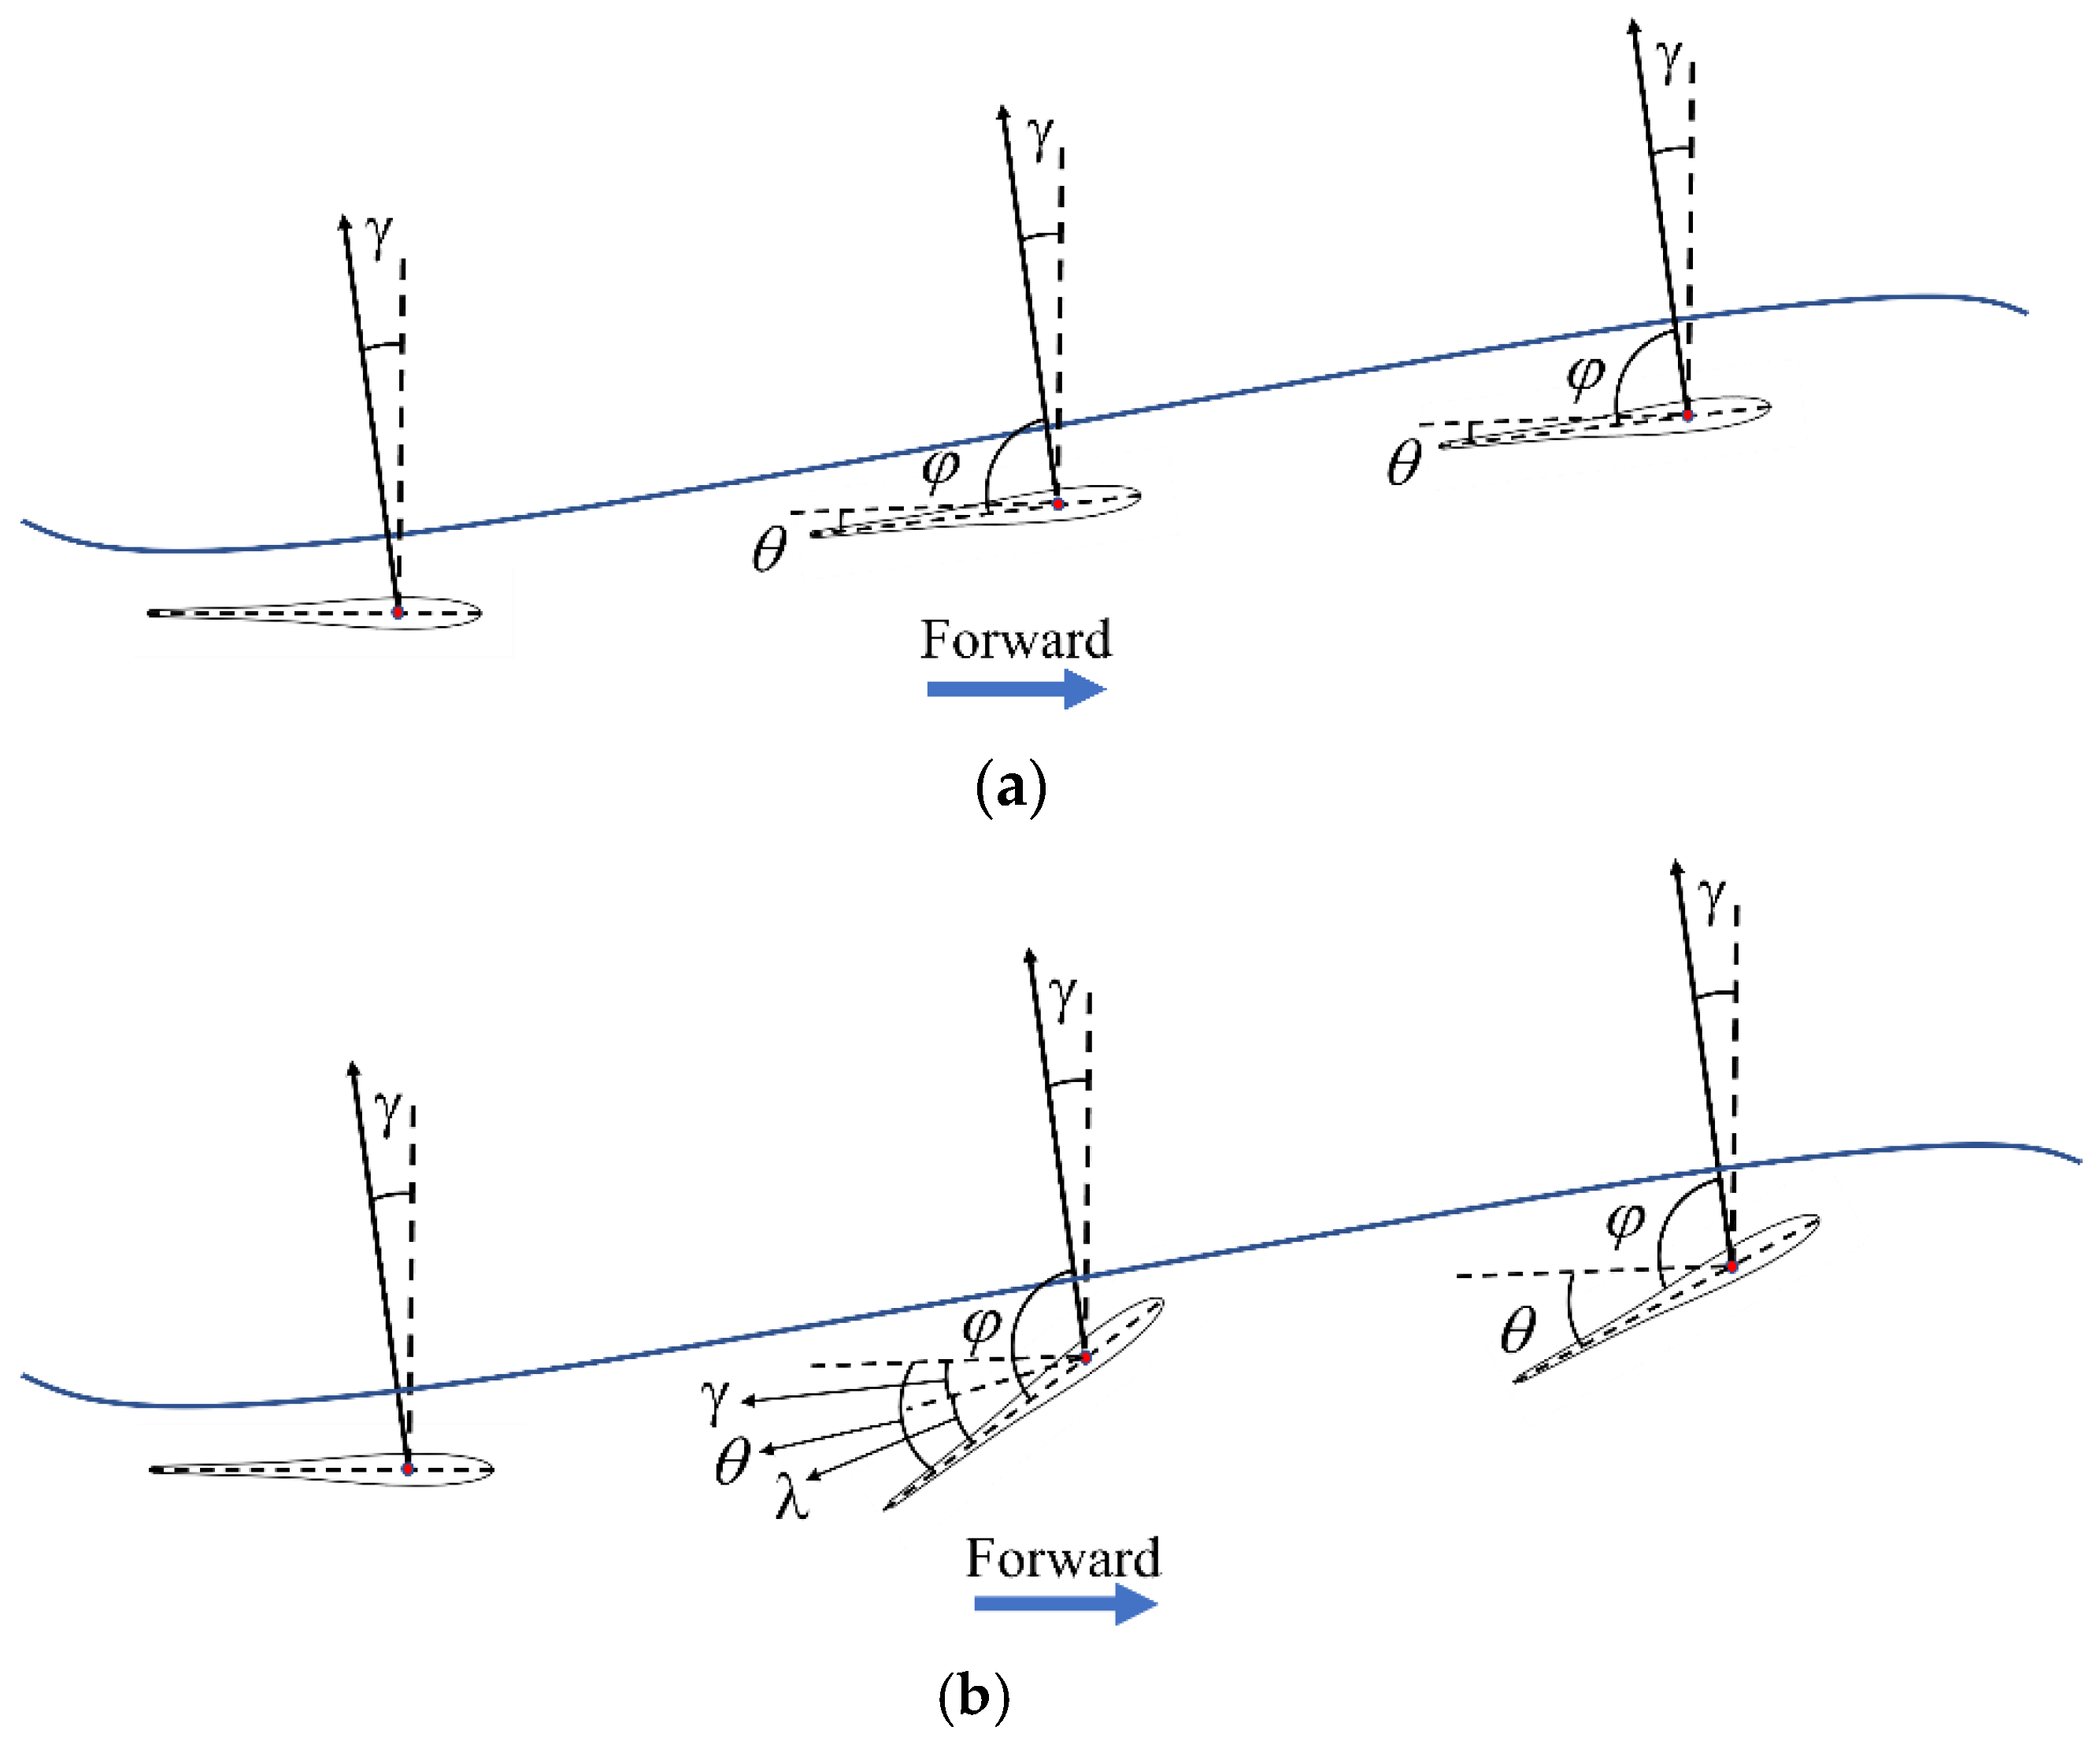
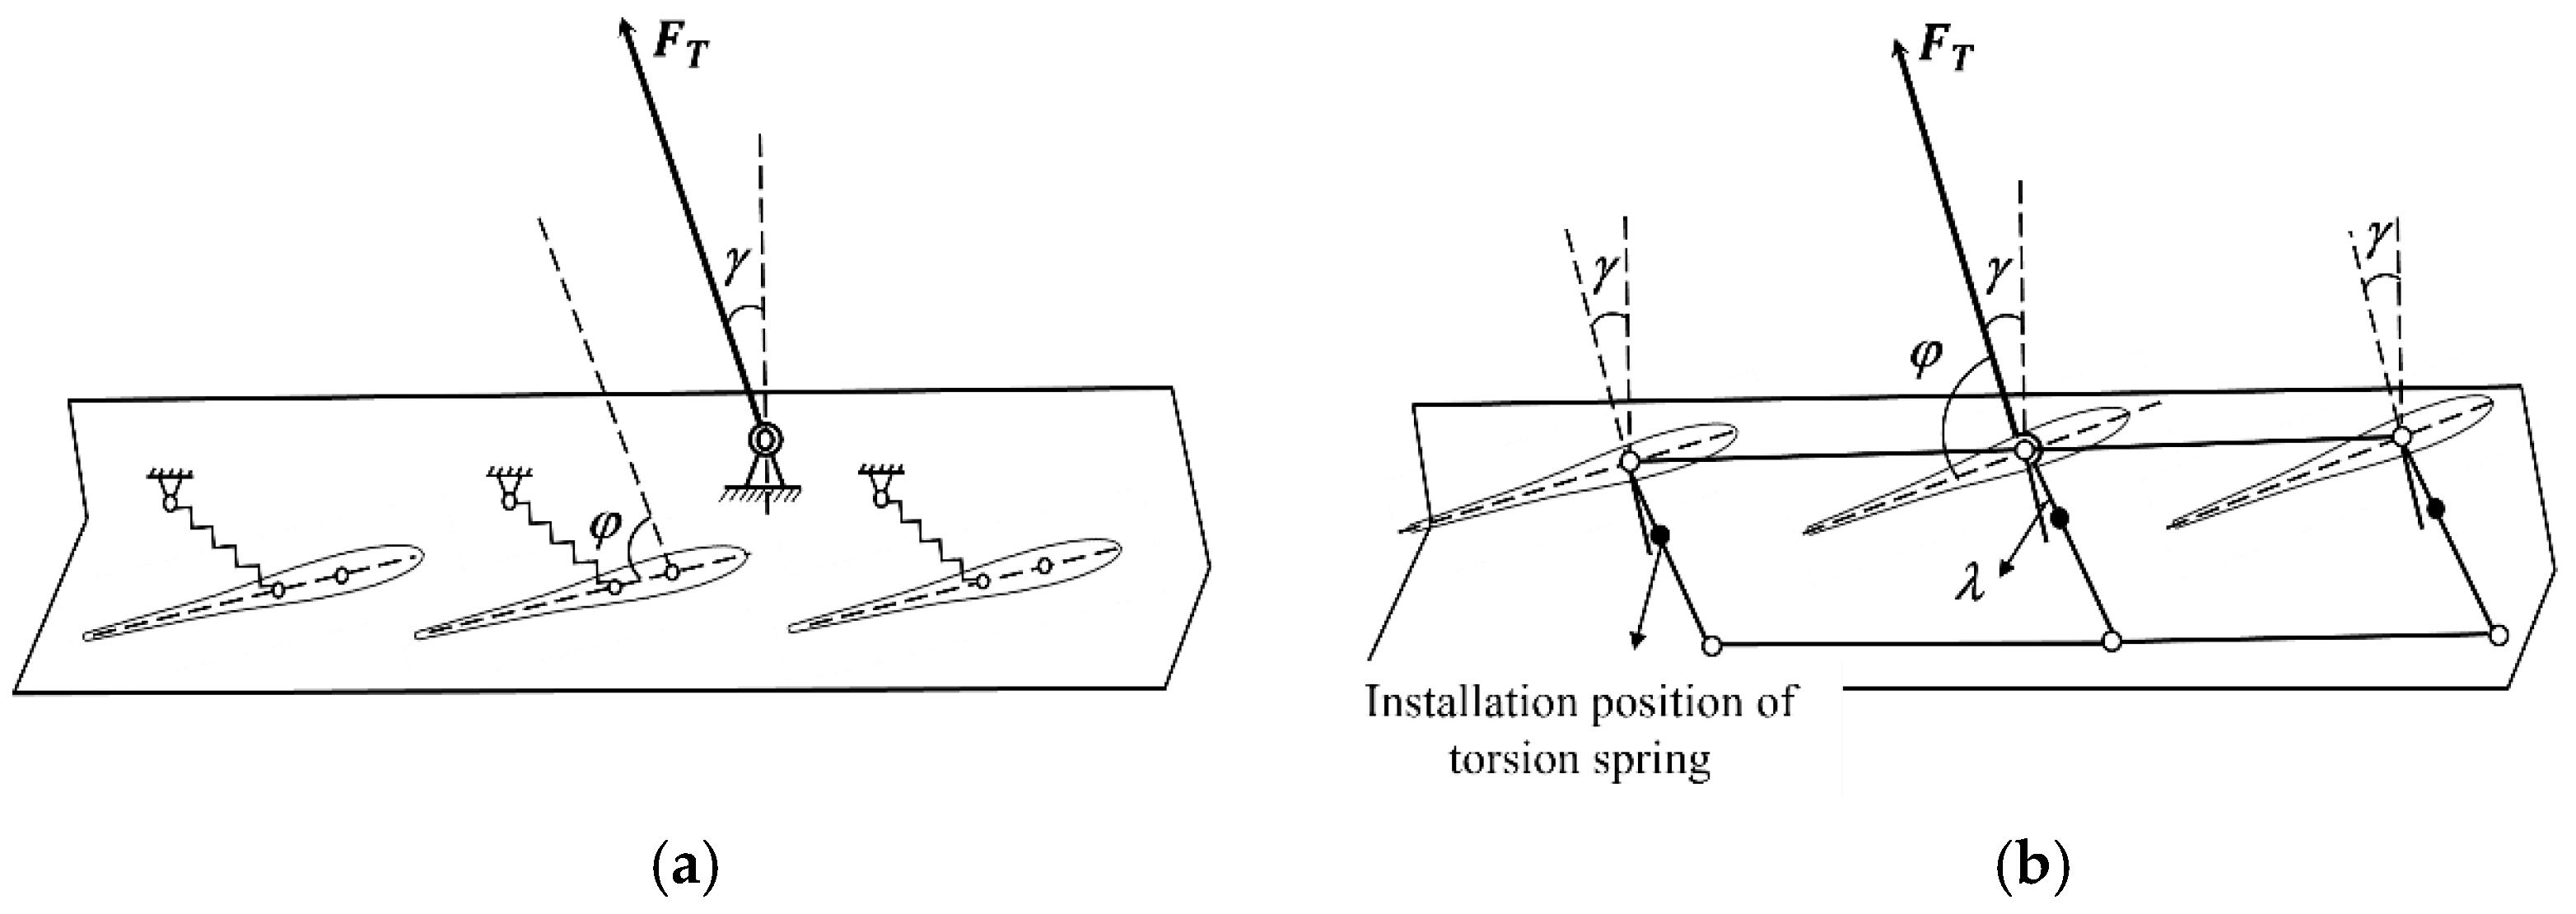
Figure 3.
The hydrofoil comparison of the SALL submerged glider and the conventional submerged glider during ascent phase. (a) Conventional submerged glider; and (b) self-adjusting lower-limit submerged glider.
Figure 3.
The hydrofoil comparison of the SALL submerged glider and the conventional submerged glider during ascent phase. (a) Conventional submerged glider; and (b) self-adjusting lower-limit submerged glider.
Figure 4.
The structure comparison of the SALL submerged glider and the conventional submerged glider. (a) Conventional submerged glider; and (b) self-adjusting lower-limit submerged glider.
Figure 4.
The structure comparison of the SALL submerged glider and the conventional submerged glider. (a) Conventional submerged glider; and (b) self-adjusting lower-limit submerged glider.
Figure 5.
The wave glider moves from trough to crest with the small wave height. (a) Conventional submerged glider; and (b) self-adjusting lower-limit submerged glider.
Figure 5.
The wave glider moves from trough to crest with the small wave height. (a) Conventional submerged glider; and (b) self-adjusting lower-limit submerged glider.
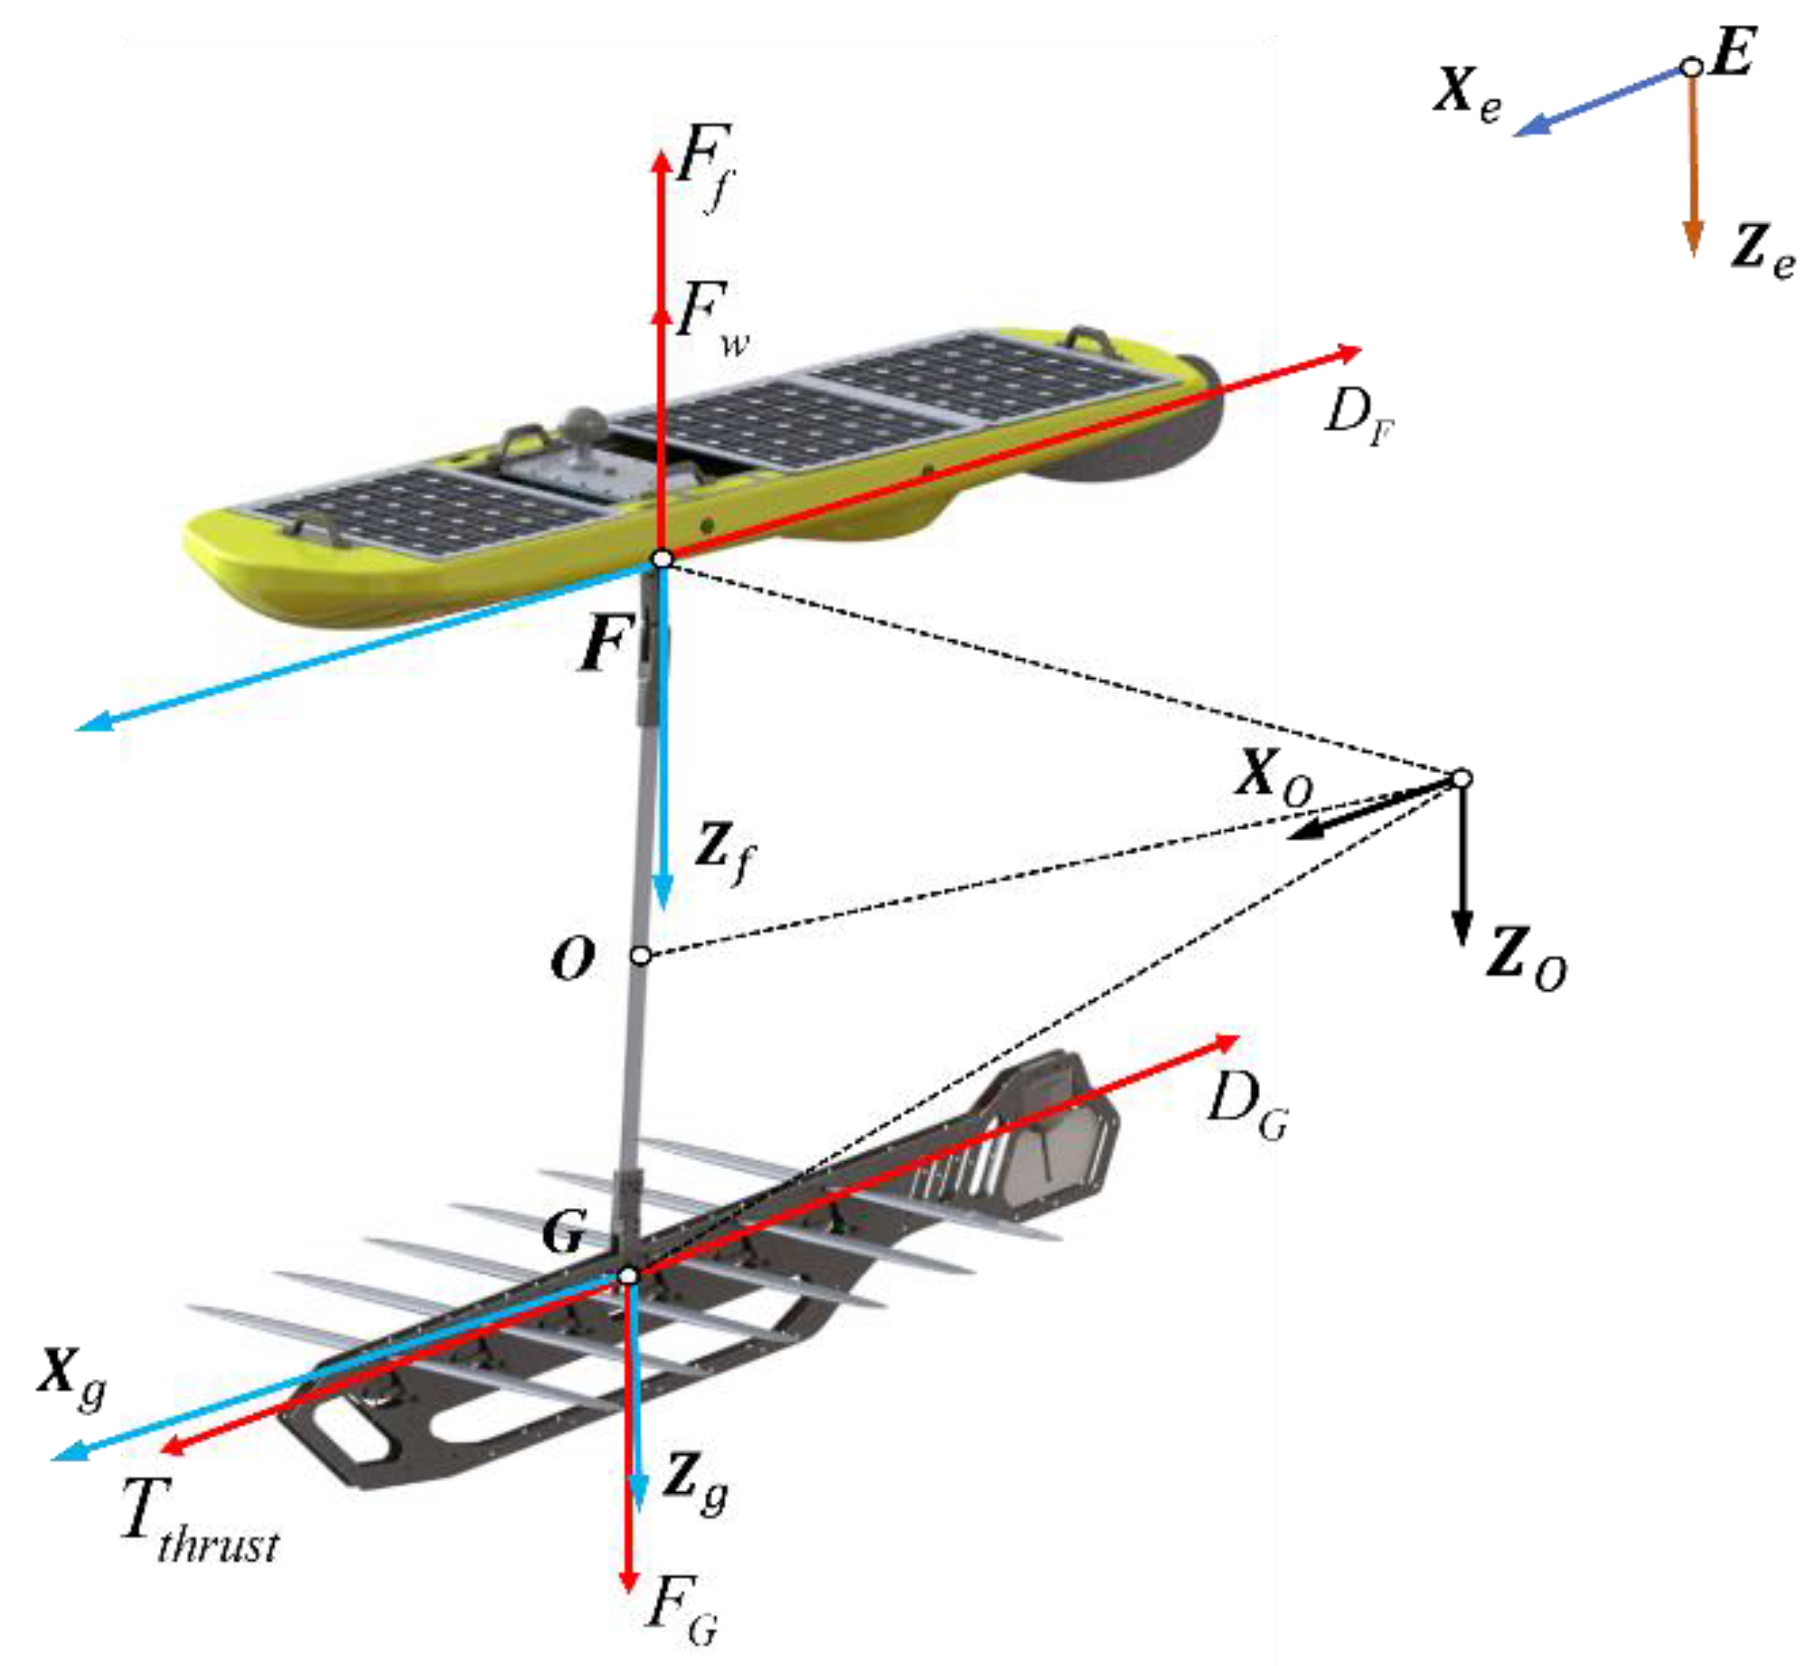
Figure 6.
The coordinate system definition and overall force analysis of the wave glider.
Figure 6.
The coordinate system definition and overall force analysis of the wave glider.
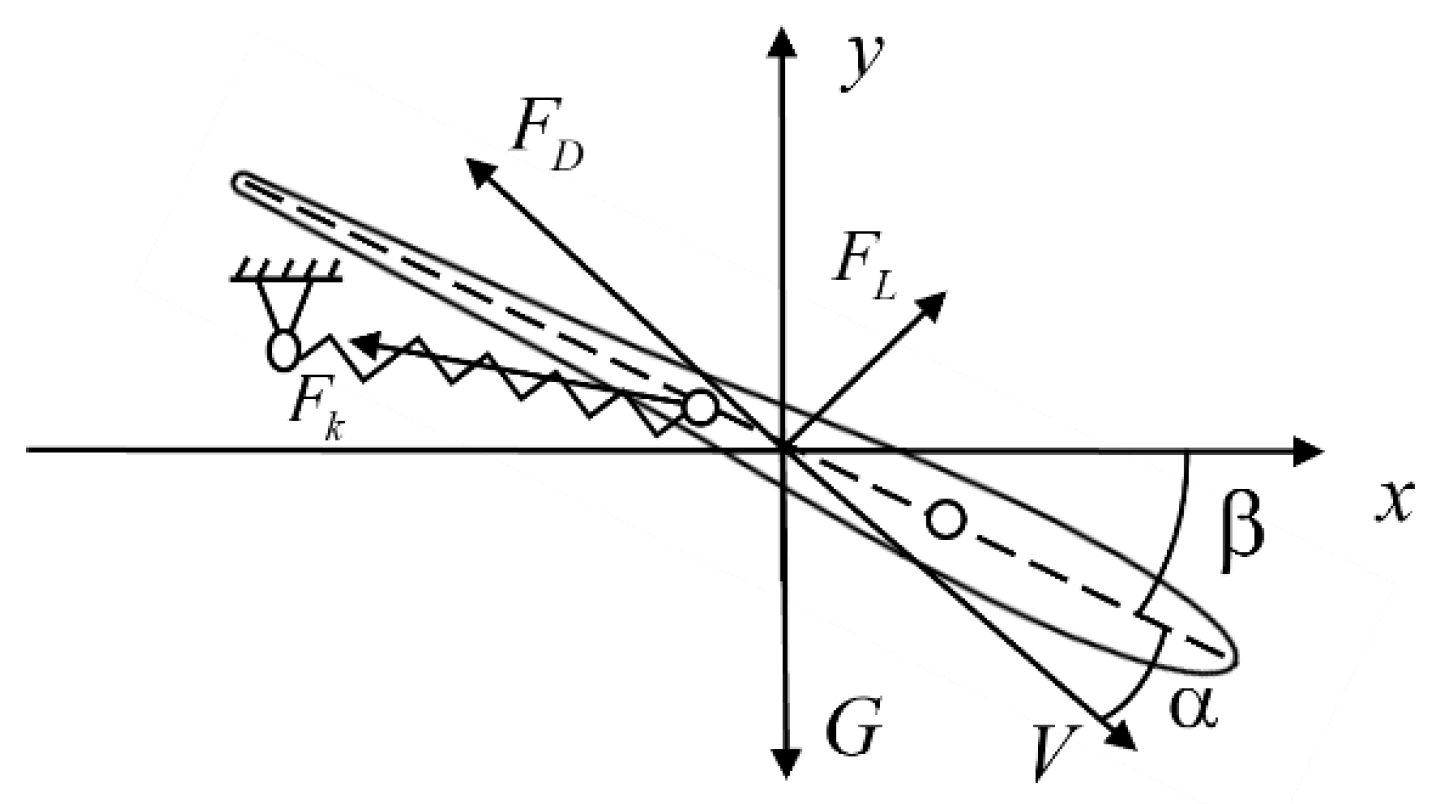
Figure 7.
The force analysis of the hydrofoil during the gliding phase.
Figure 7.
The force analysis of the hydrofoil during the gliding phase.
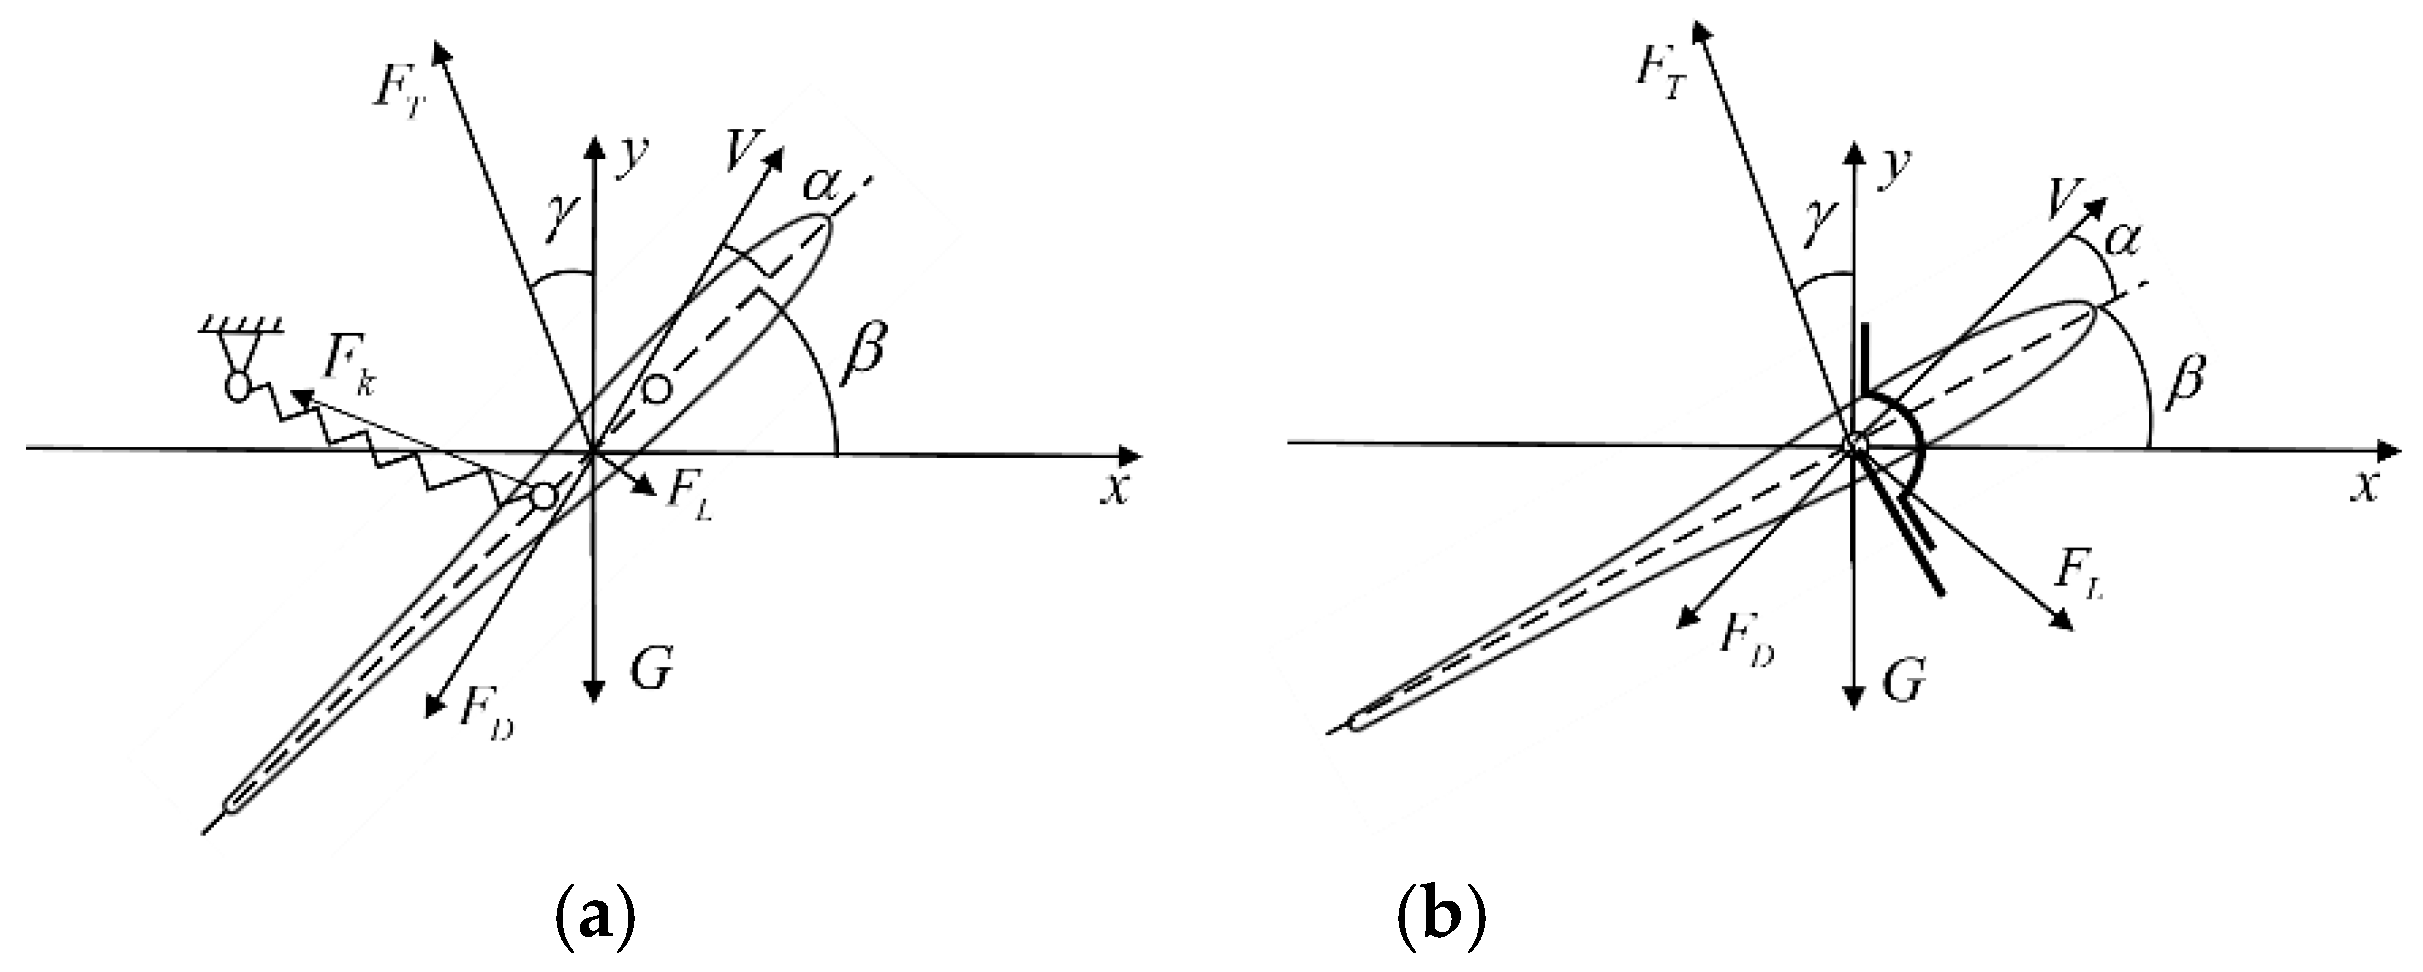
Figure 8.
The force analysis of the hydrofoil during the ascent phase. (a) Conventional submerged glider; and (b) self-adjusting lower-limit submerged glider.
Figure 8.
The force analysis of the hydrofoil during the ascent phase. (a) Conventional submerged glider; and (b) self-adjusting lower-limit submerged glider.
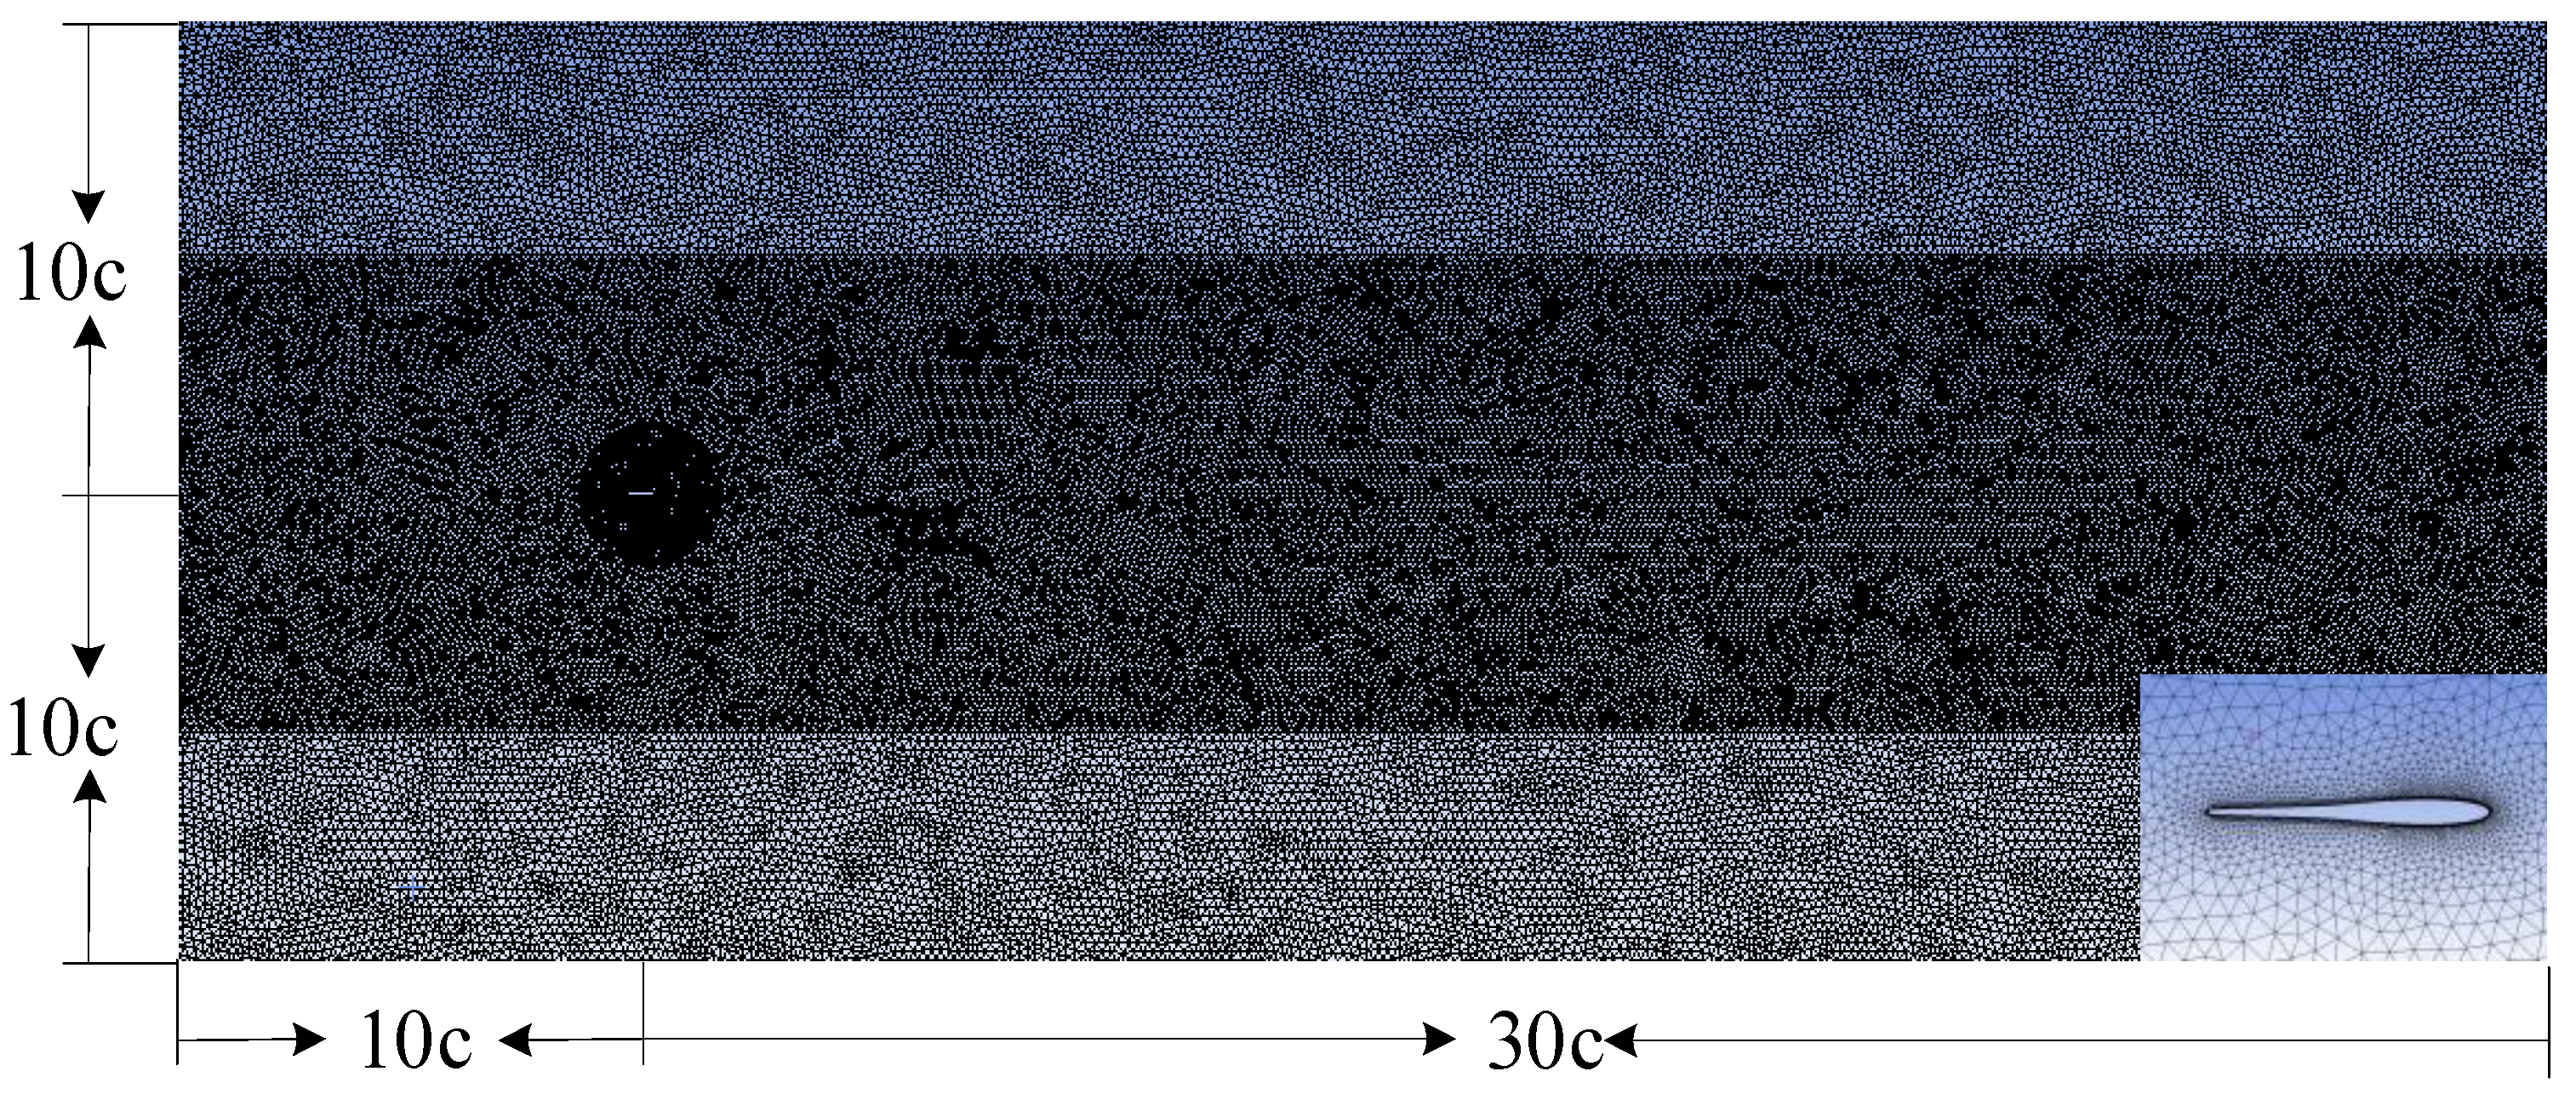
Figure 9.
The definition of the boundary conditions.
Figure 9.
The definition of the boundary conditions.
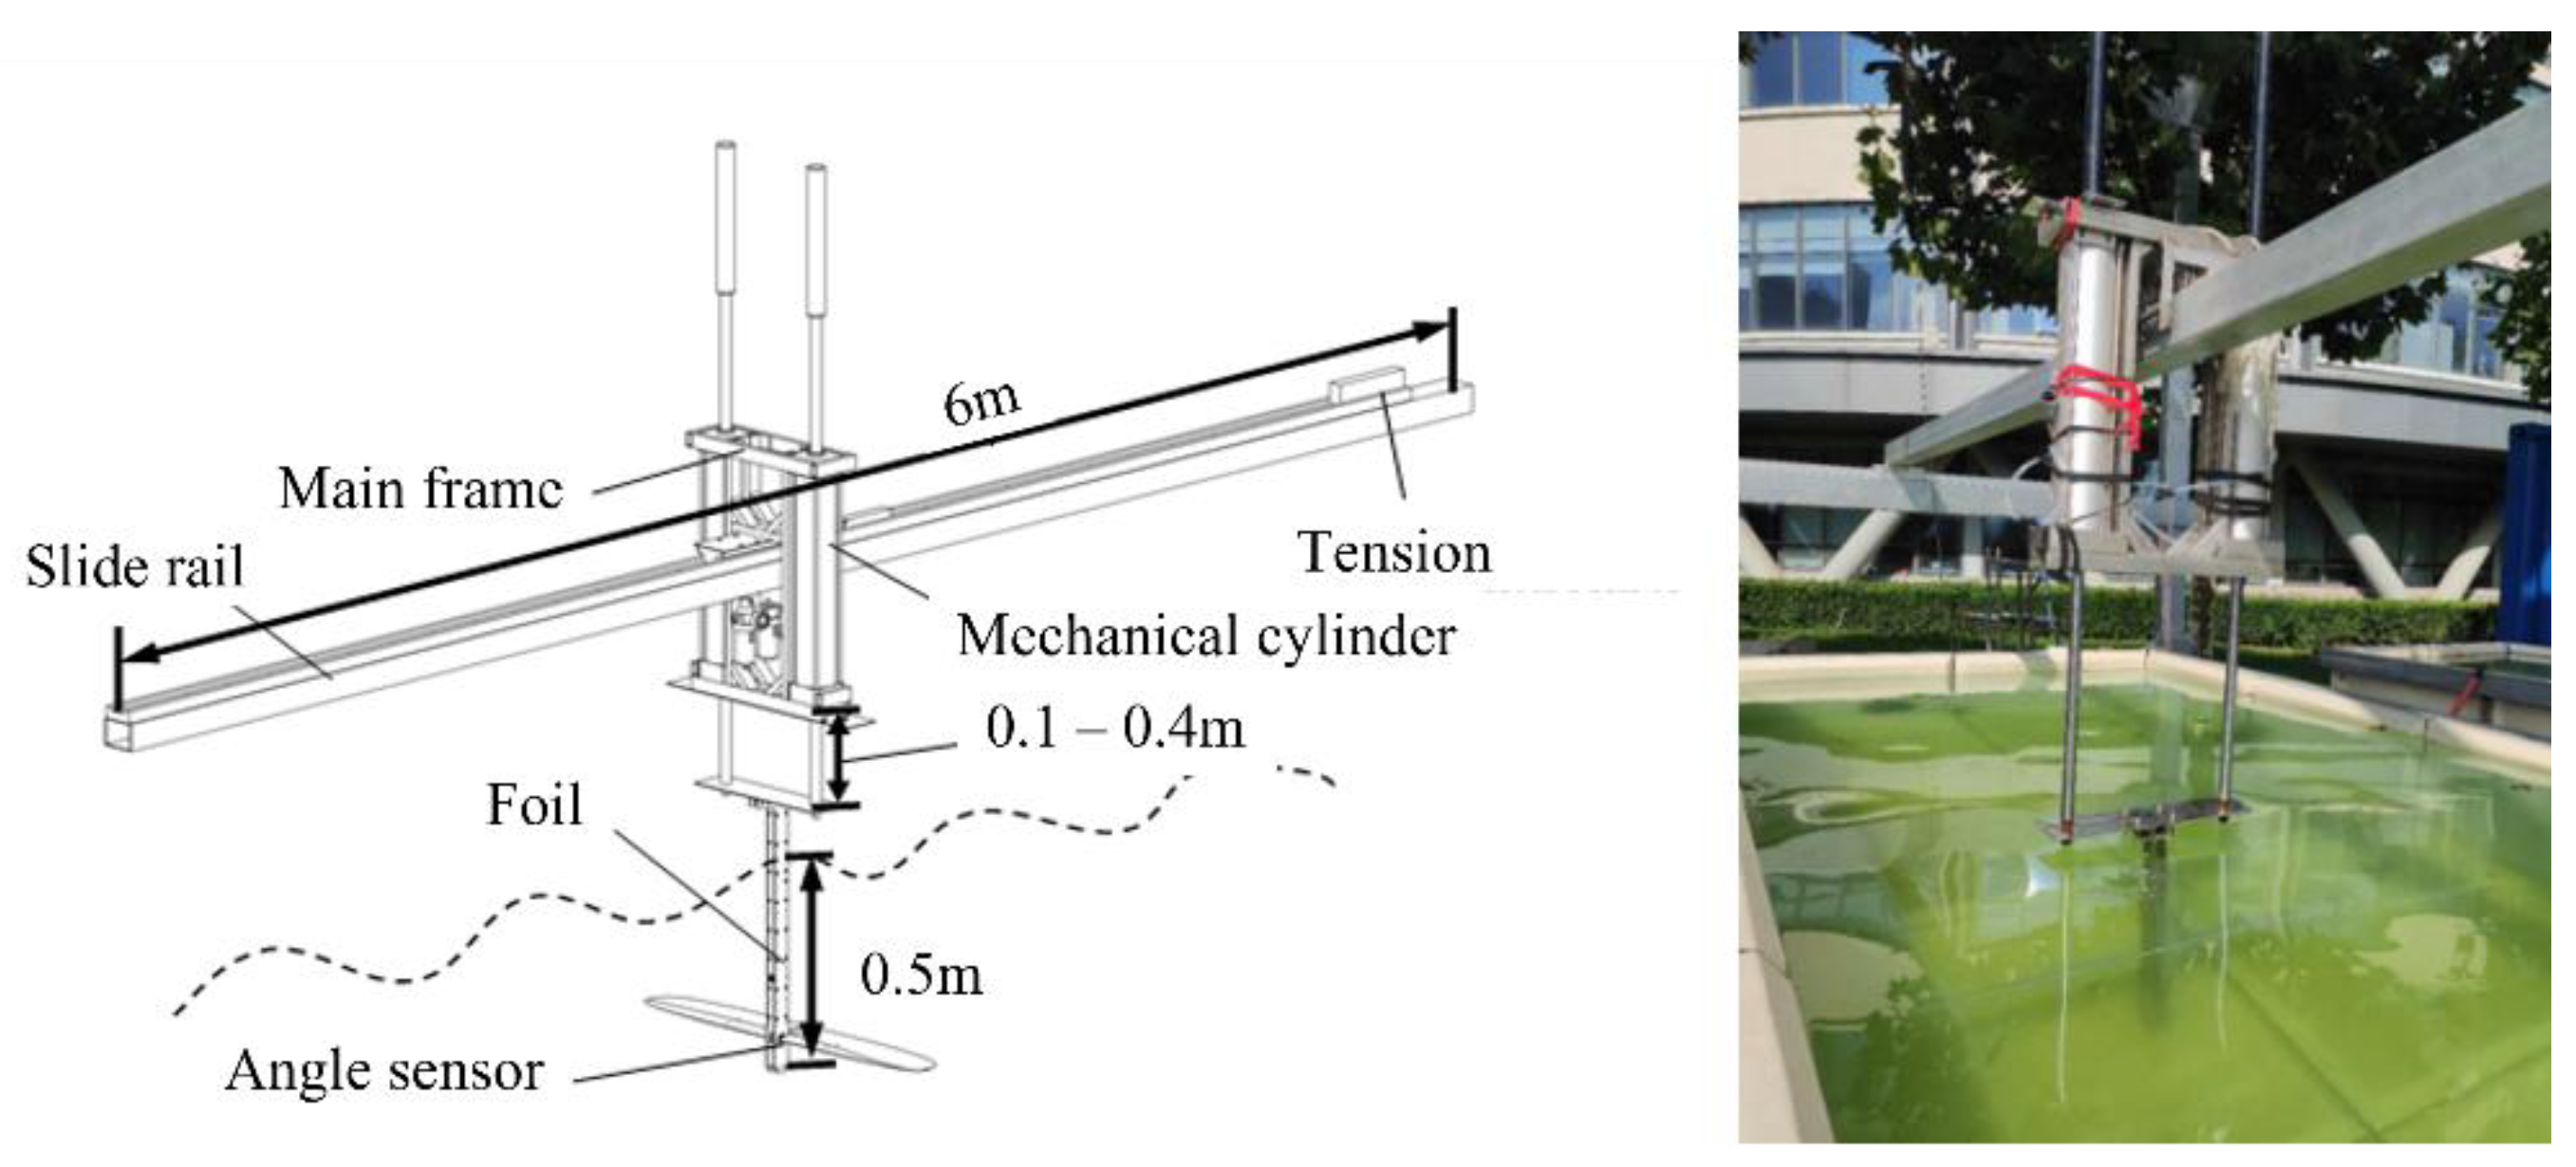
Figure 10.
The experimental device.
Figure 10.
The experimental device.
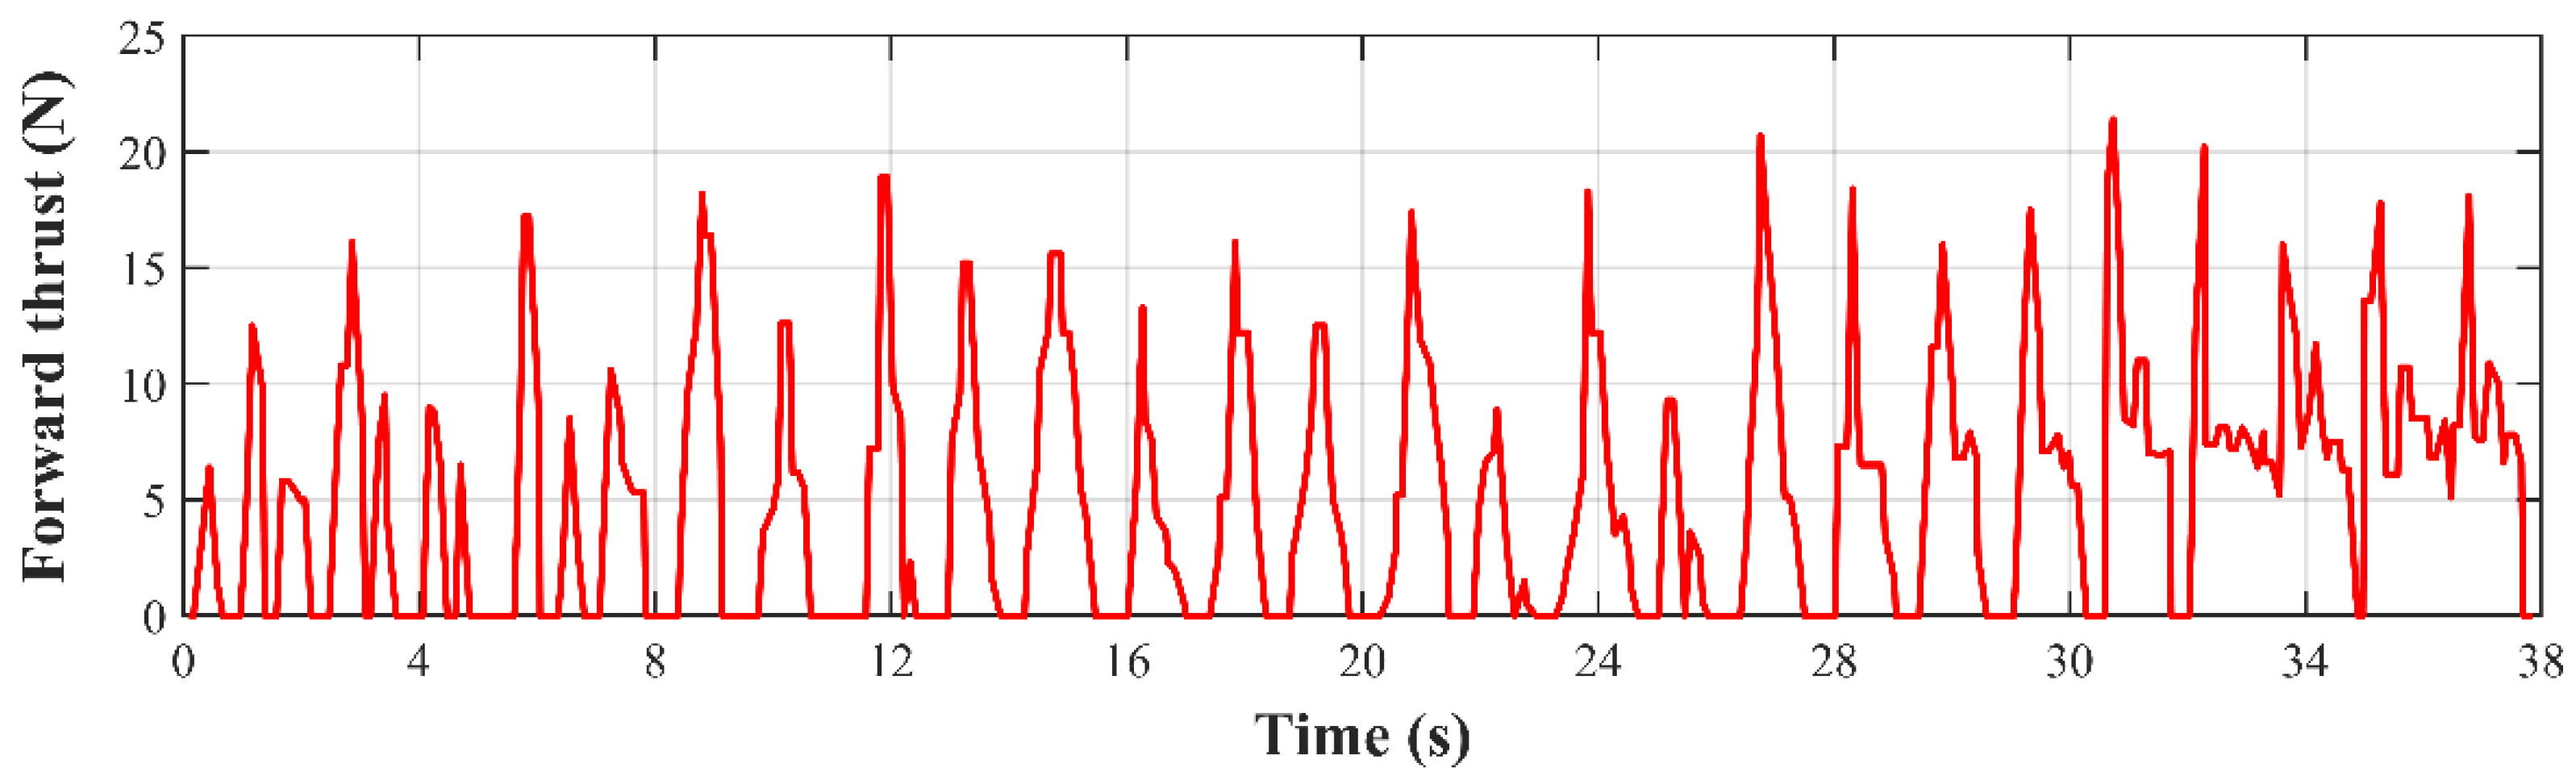
Figure 11.
The forward thrust of the pair of hydrofoils obtained by the experiment.
Figure 11.
The forward thrust of the pair of hydrofoils obtained by the experiment.
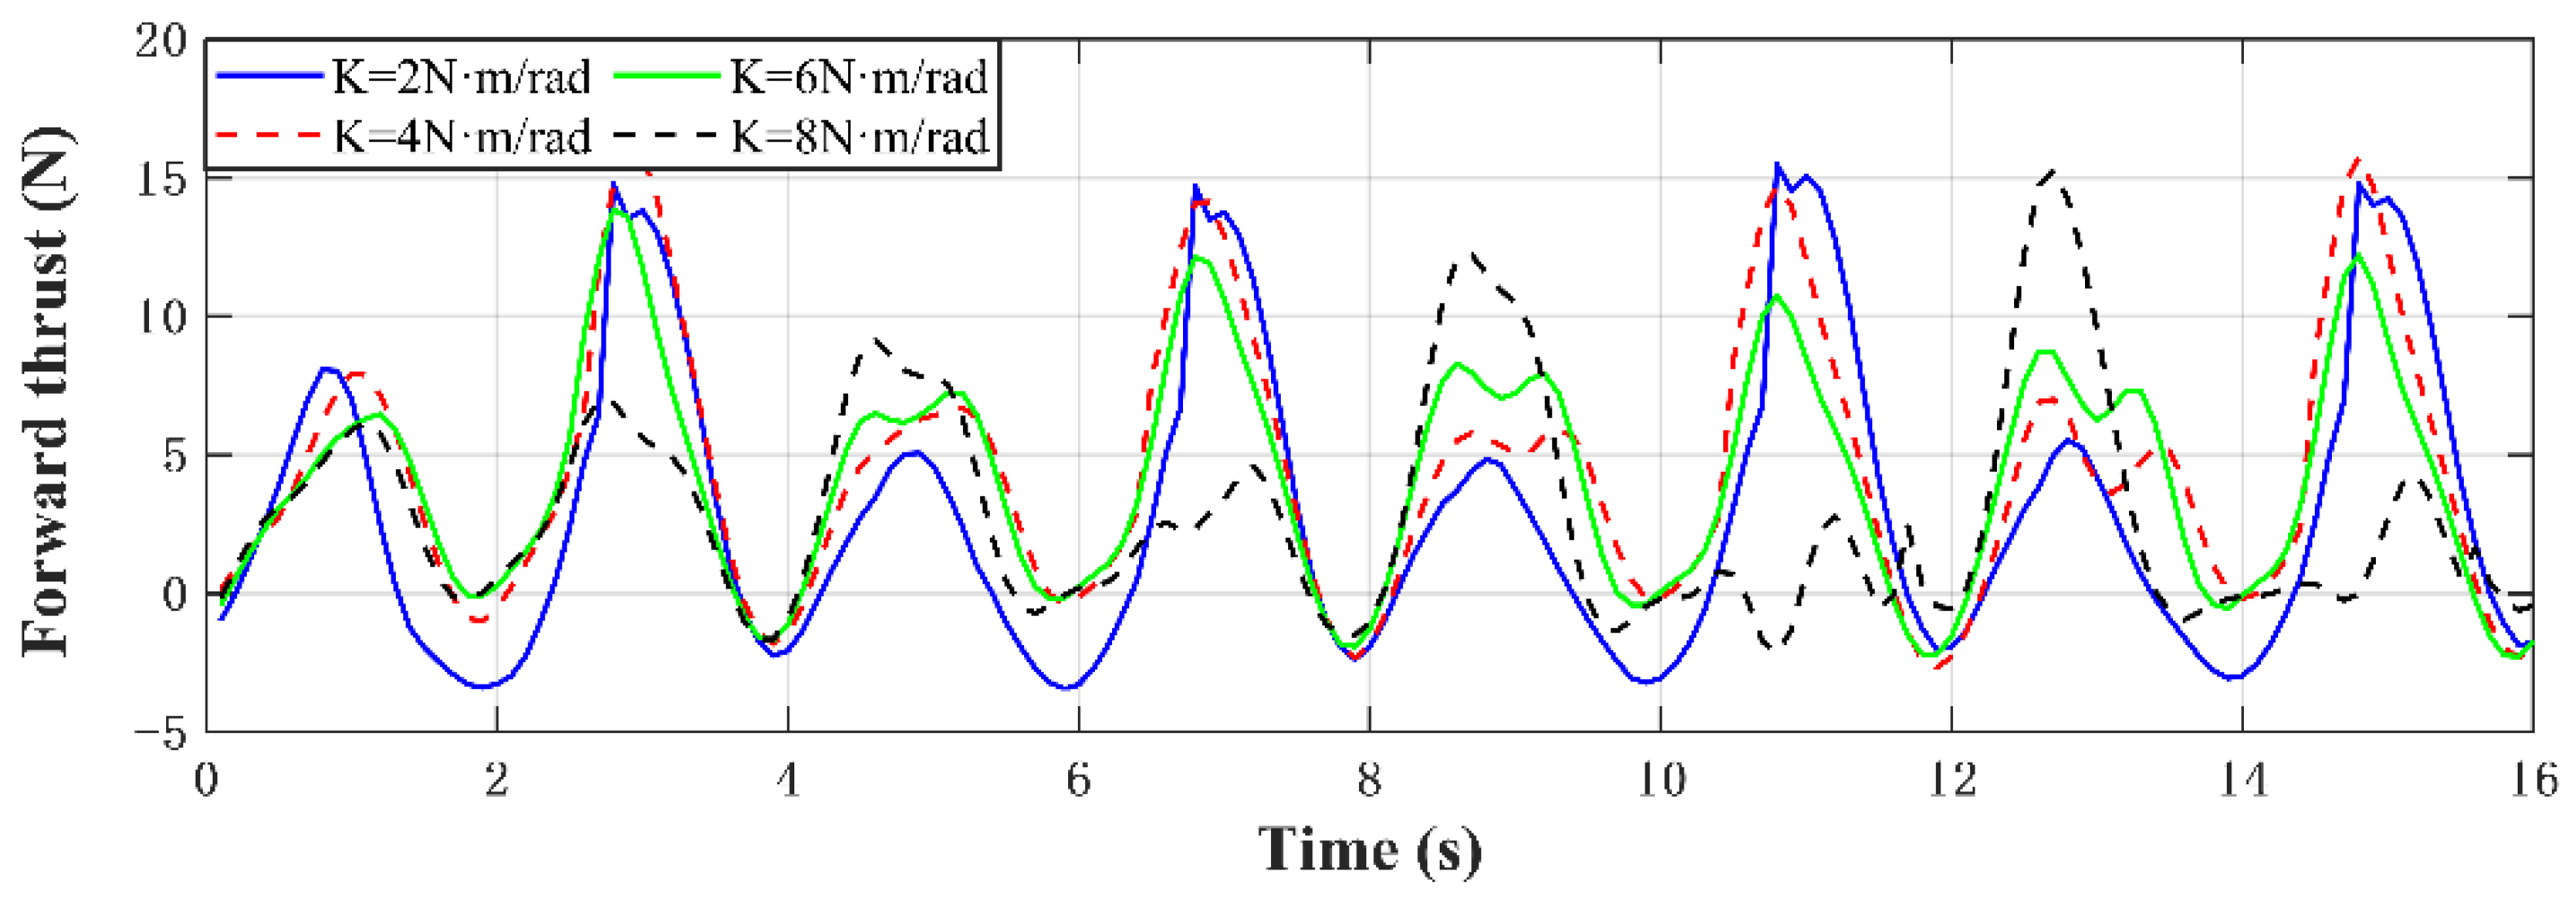
Figure 12.
The forward thrusts of the conventional submerged glider under the different K.
Figure 12.
The forward thrusts of the conventional submerged glider under the different K.
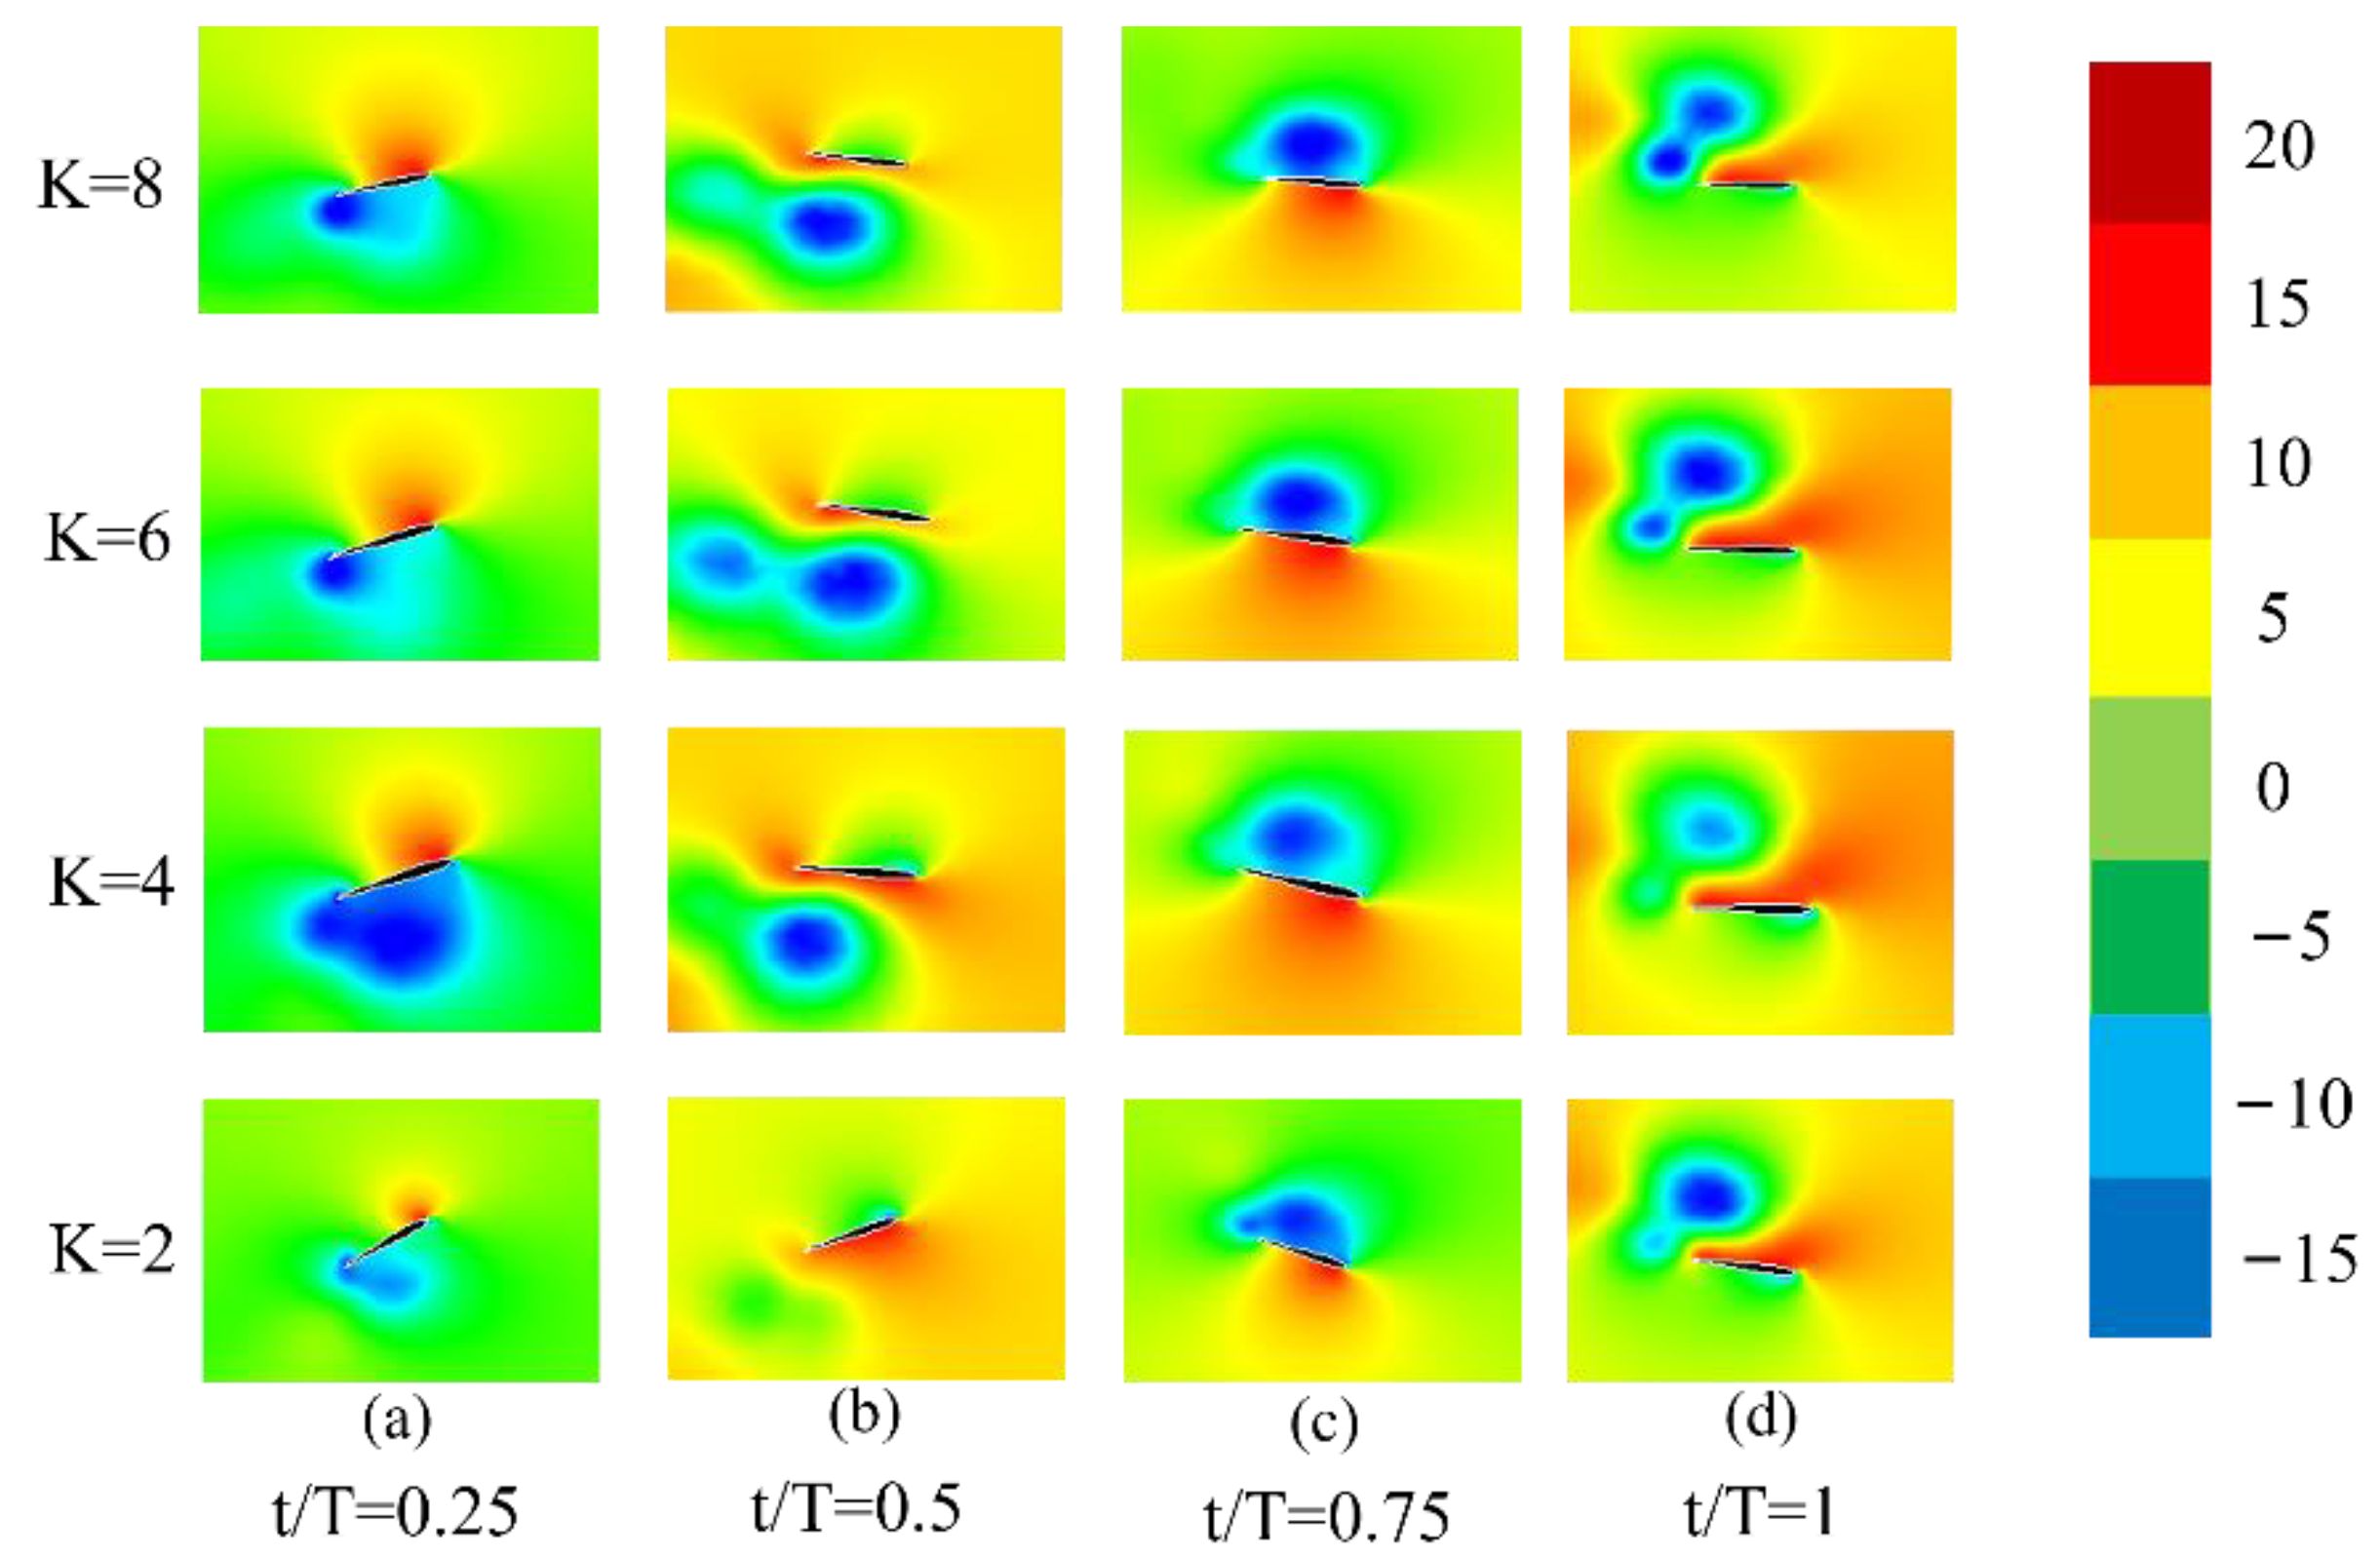
Figure 13.
The pressure nephogram of the conventional submerged glider under the different K in a single cycle. (a) t/T = 0.25; (b) t/T = 0.5; (c) t/T = 0.75; and (d) t/T = 1.
Figure 13.
The pressure nephogram of the conventional submerged glider under the different K in a single cycle. (a) t/T = 0.25; (b) t/T = 0.5; (c) t/T = 0.75; and (d) t/T = 1.
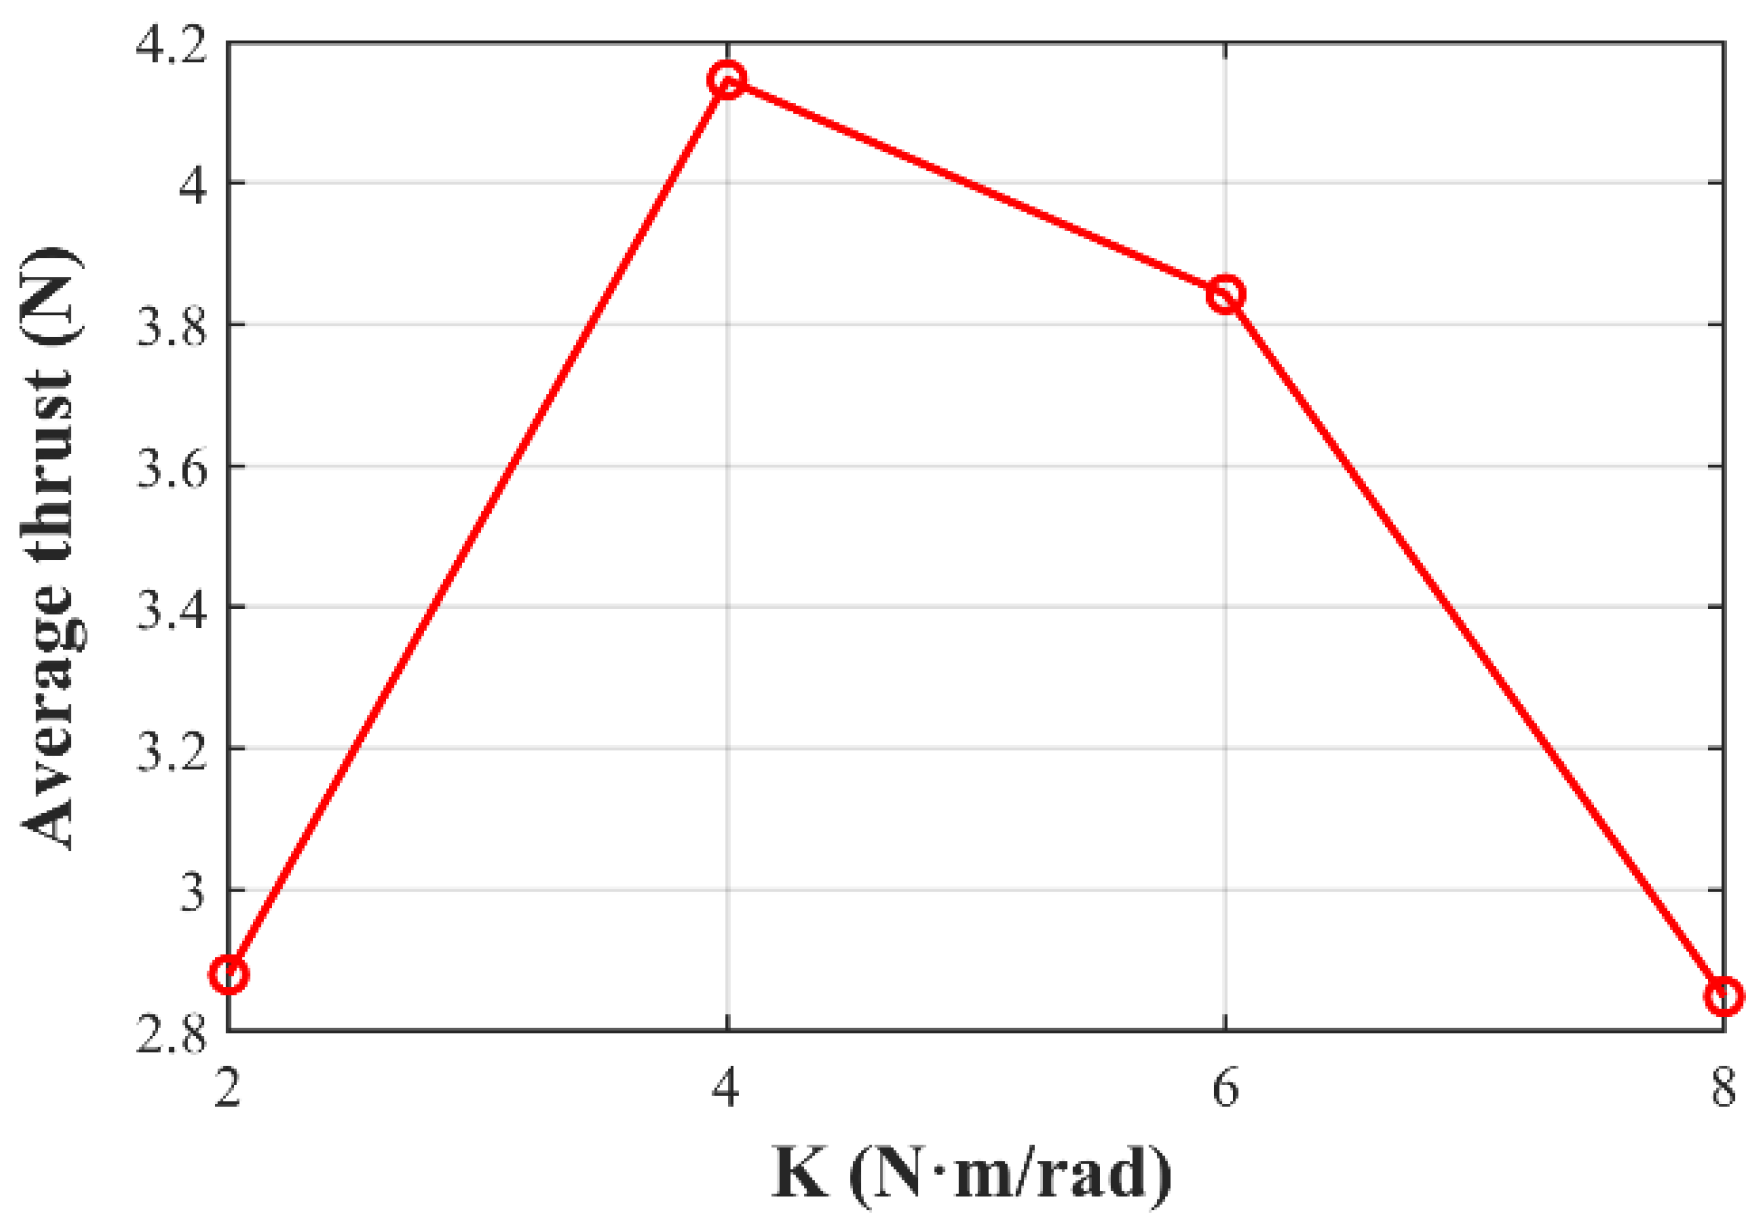
Figure 14.
The average forward thrust of the conventional submerged glider under the different K.
Figure 14.
The average forward thrust of the conventional submerged glider under the different K.
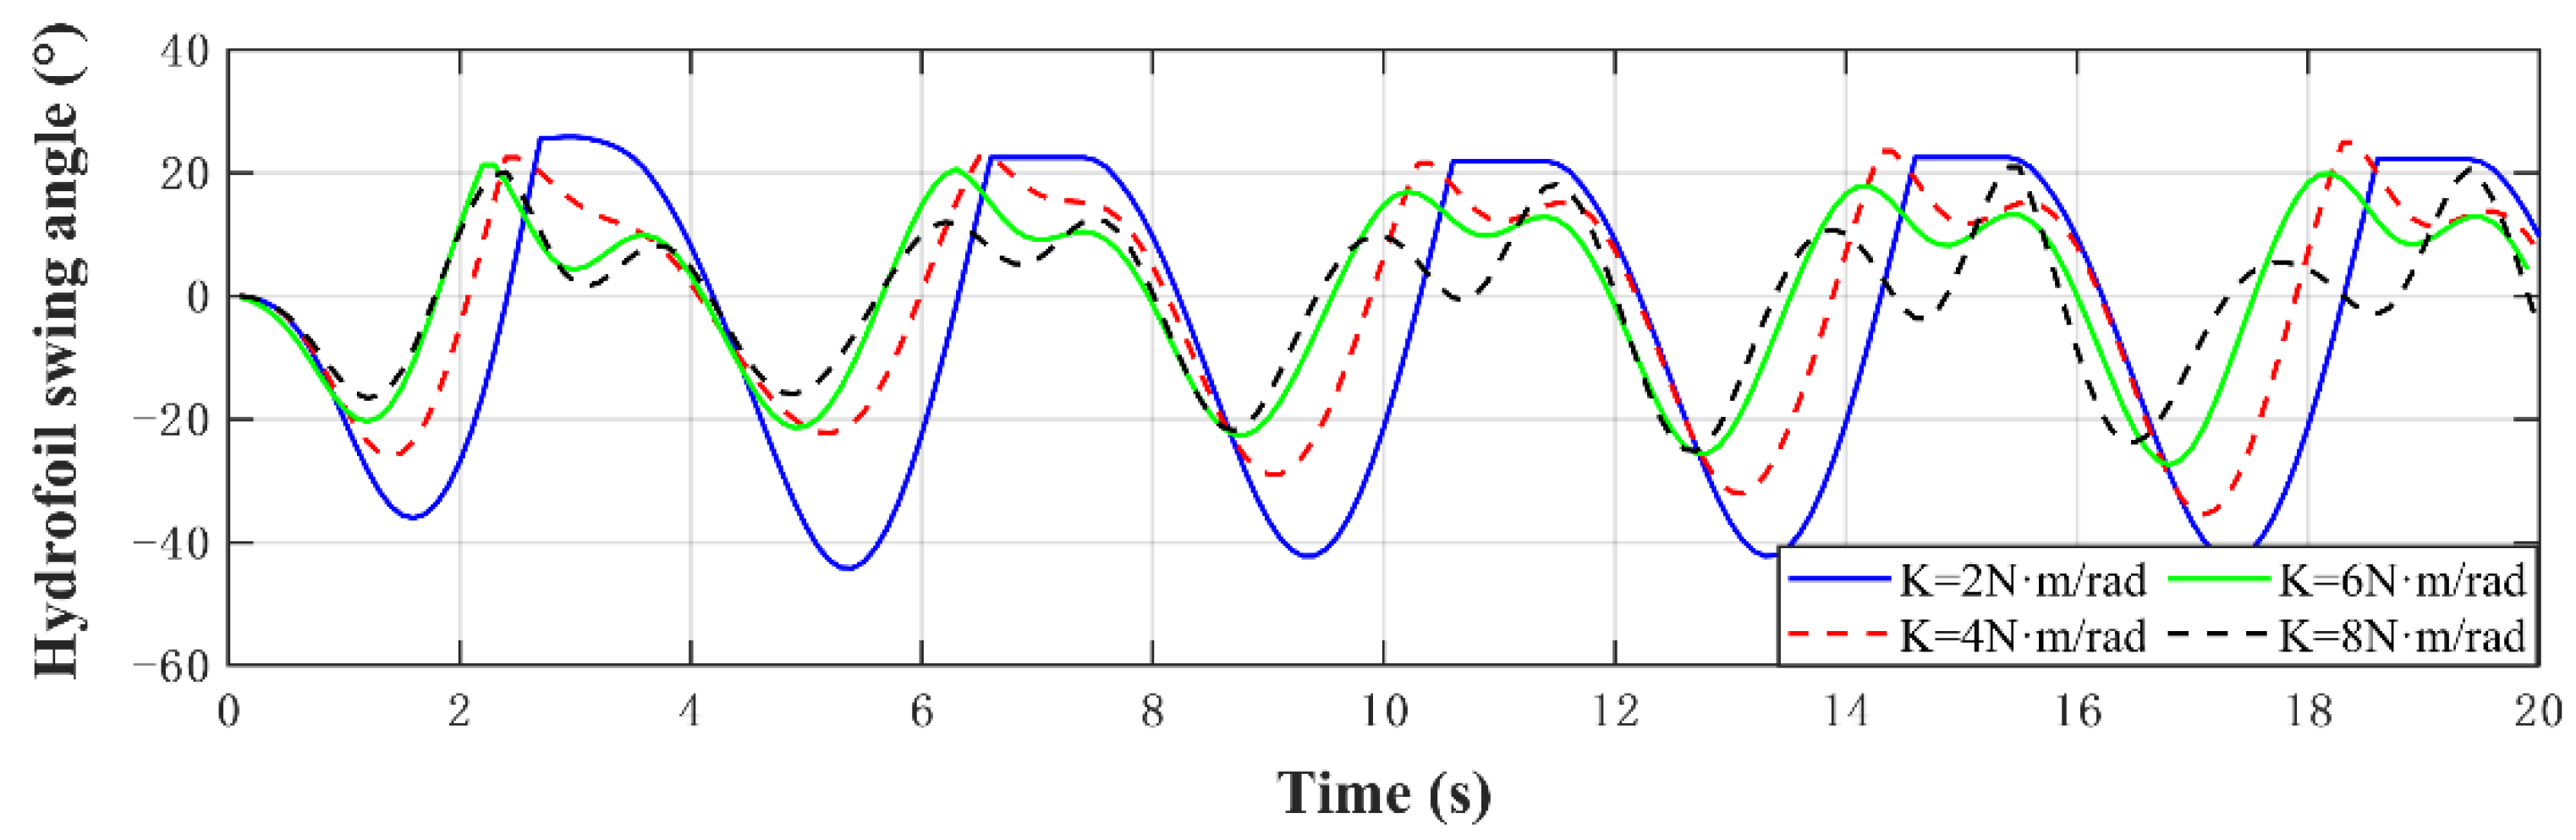
Figure 15.
The swing angles of the hydrofoil for the conventional submerged glider under the different K.
Figure 15.
The swing angles of the hydrofoil for the conventional submerged glider under the different K.
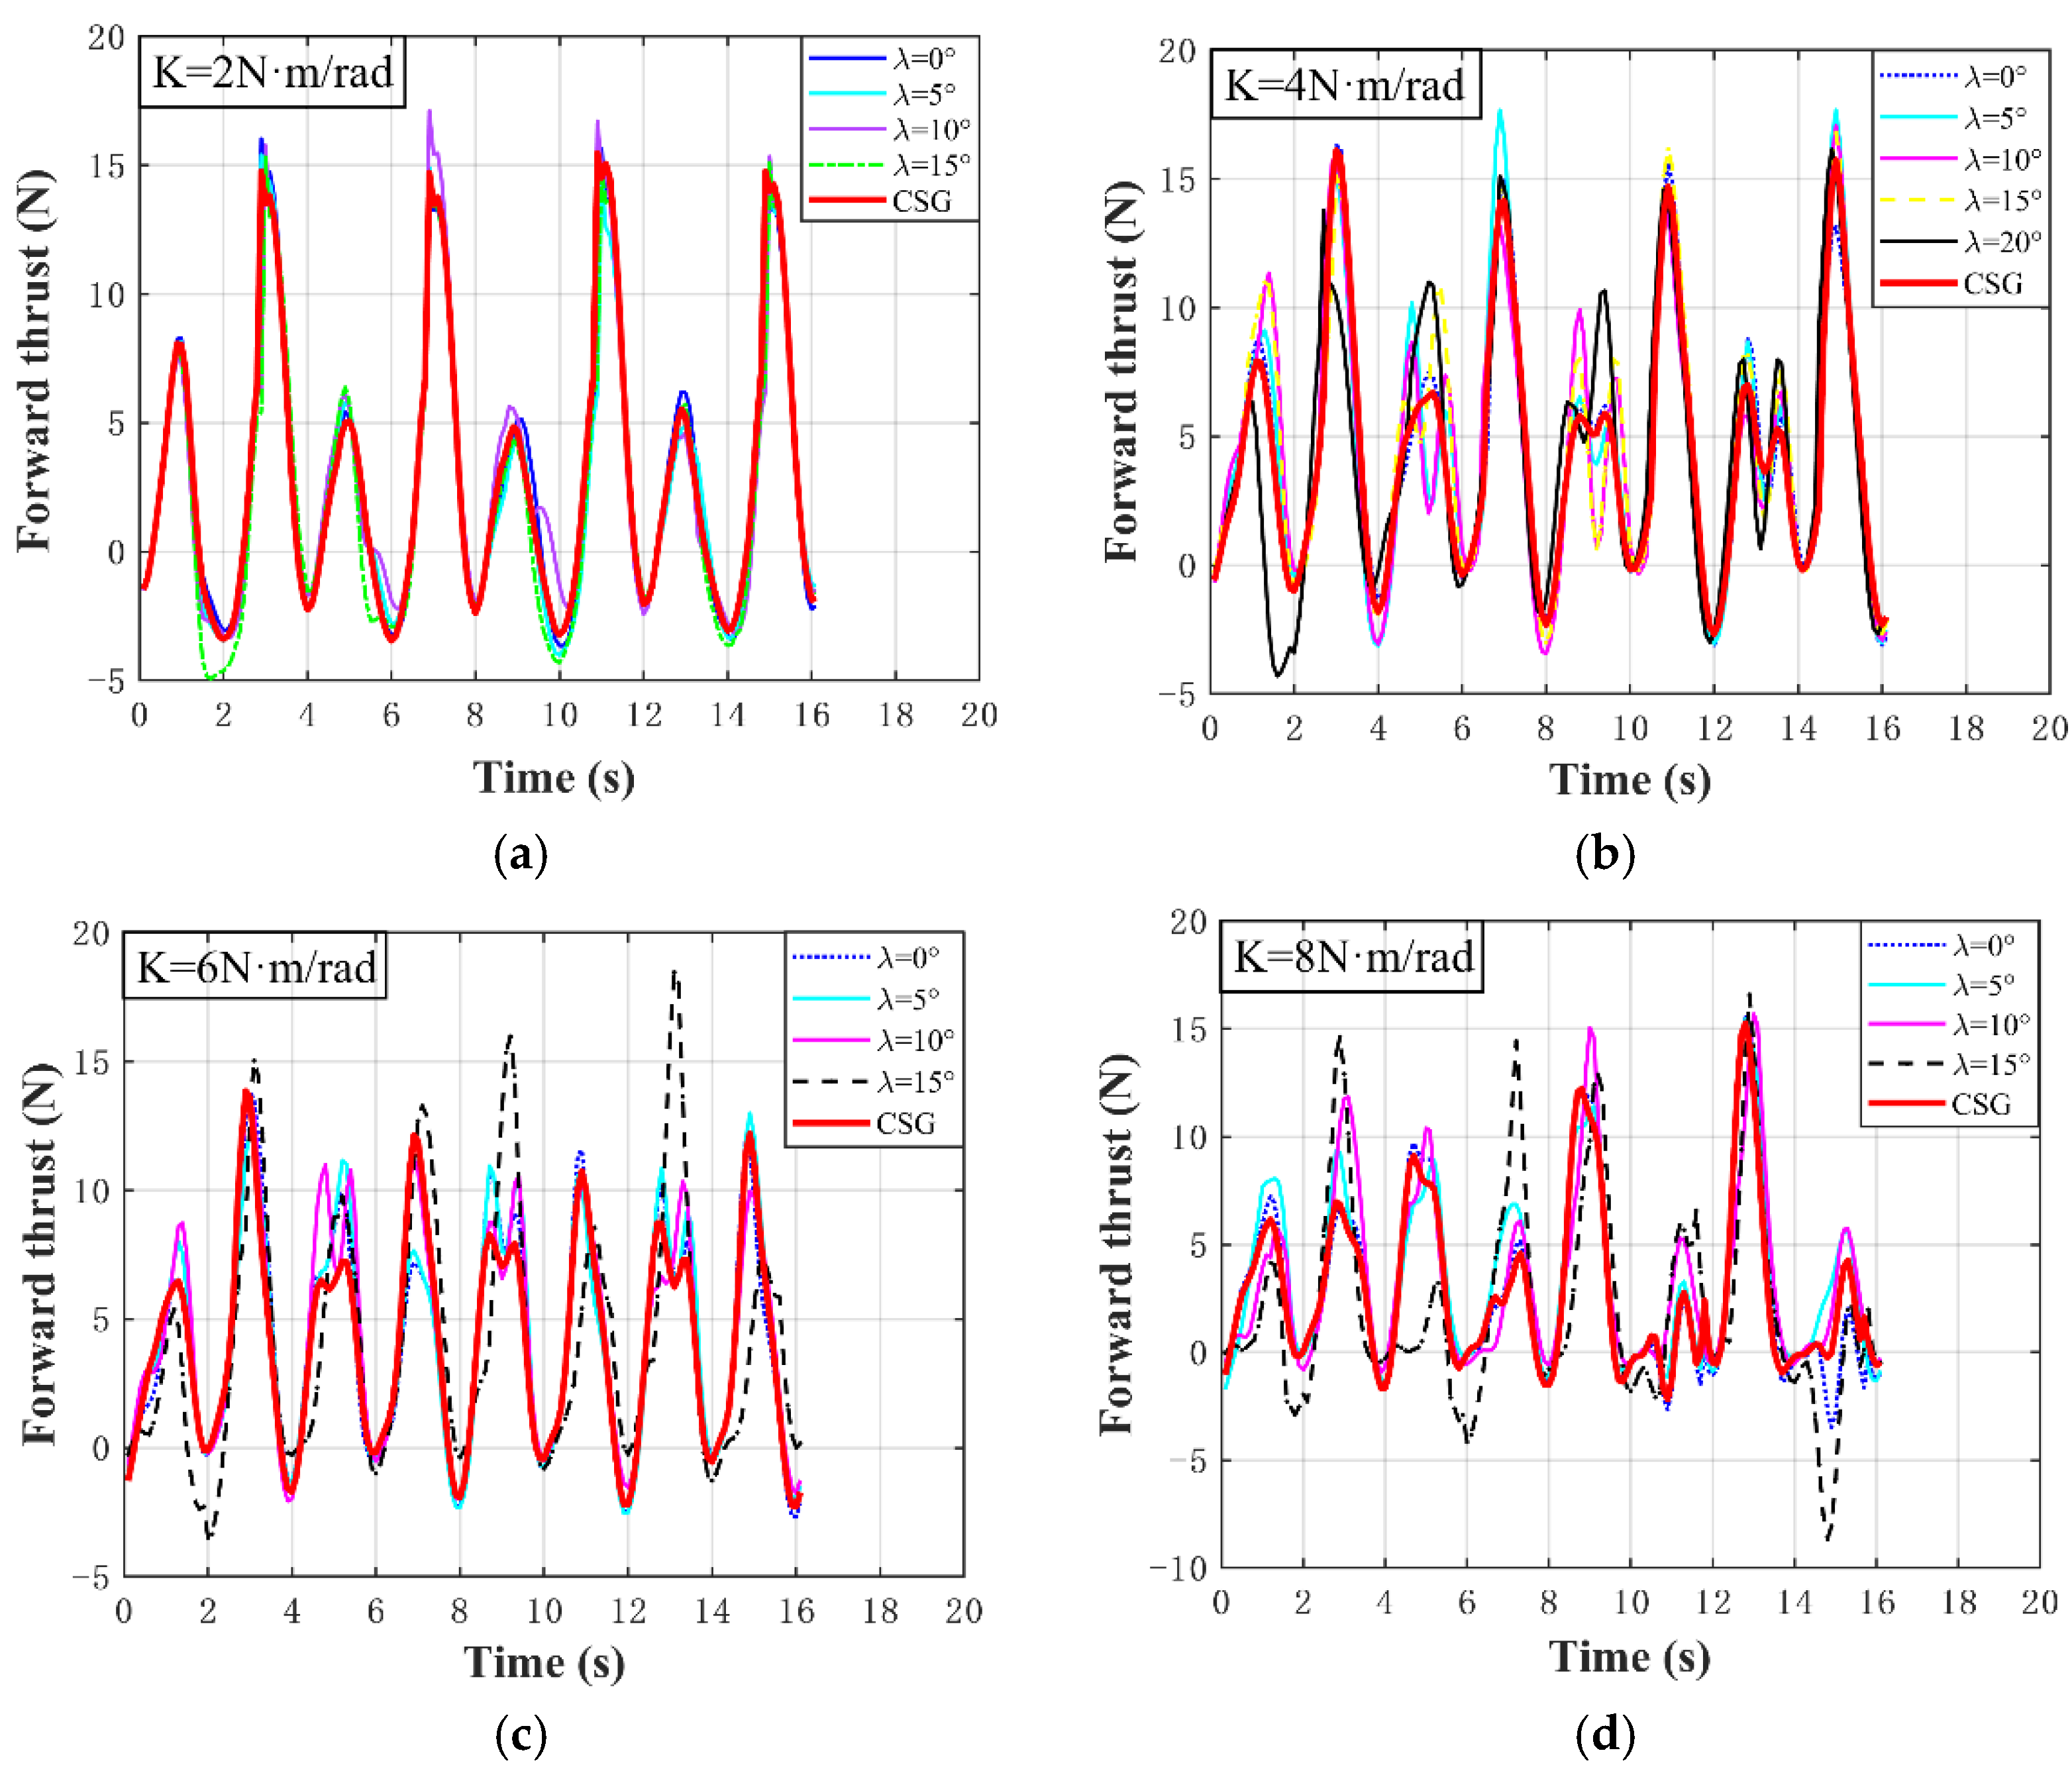
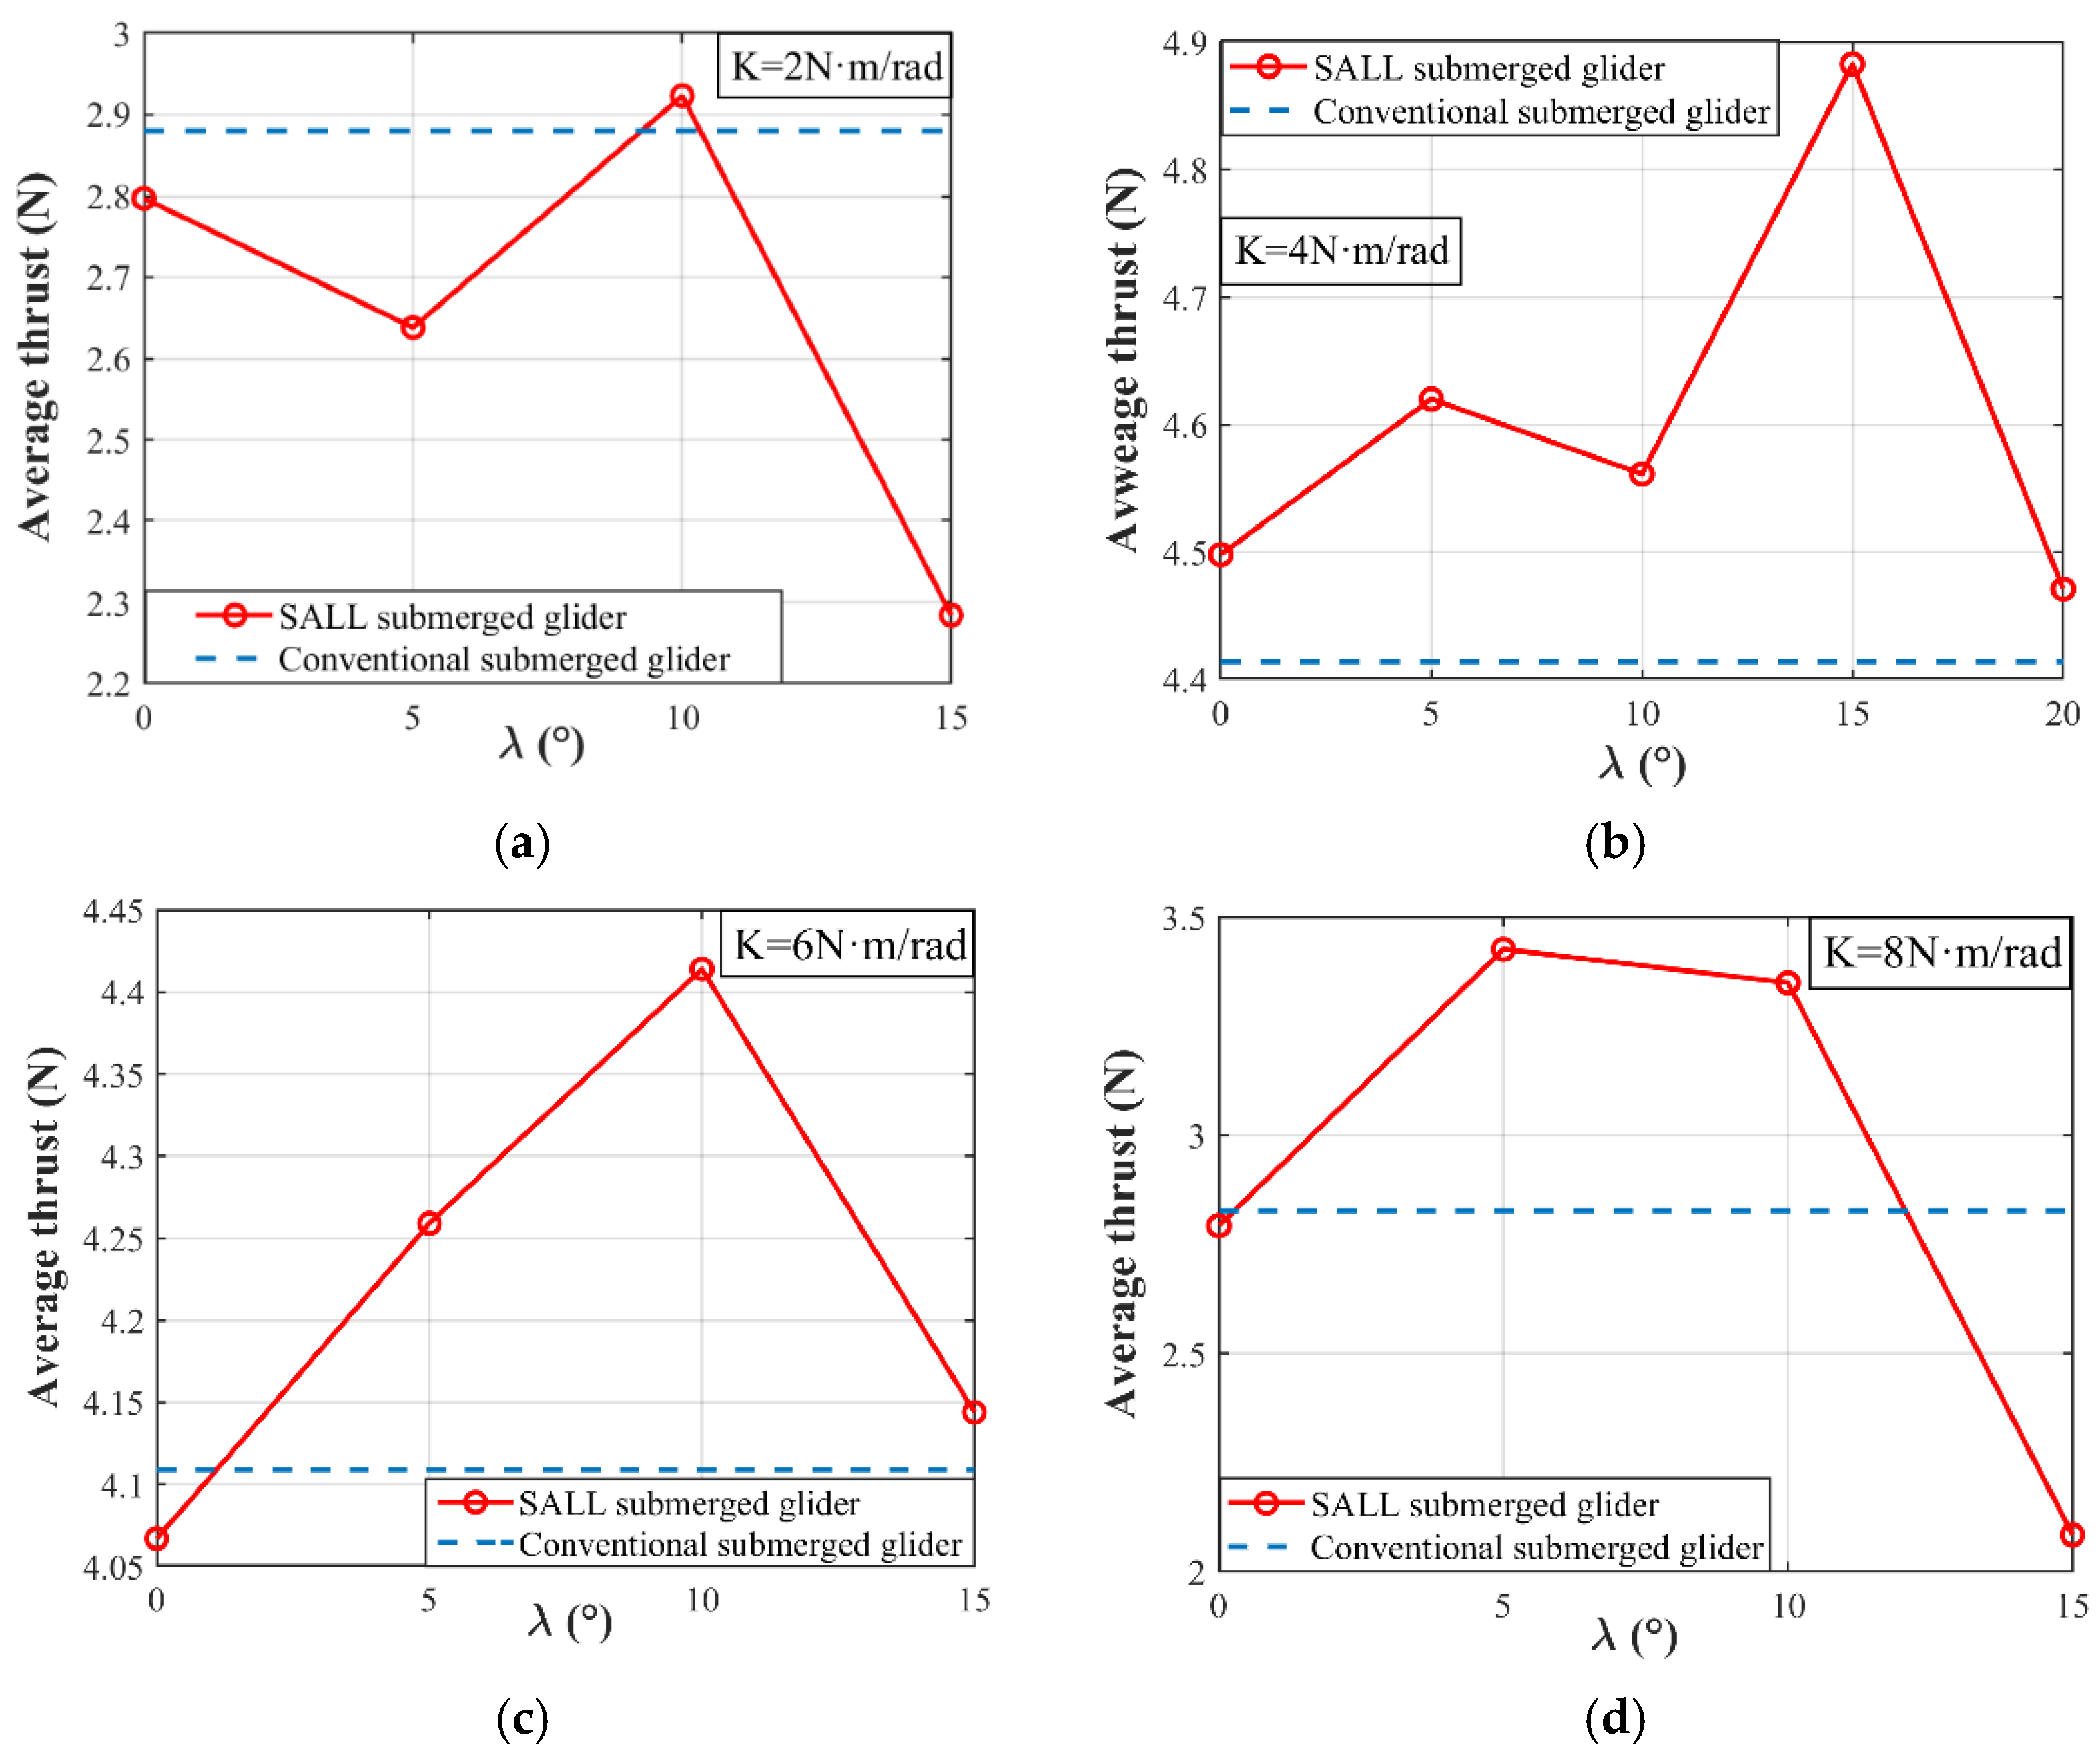
Figure 16.
The forward thrusts of the SALL submerged glider under the different K and λ. (a) Forward thrust under k = 2; (b) forward thrust under k = 4; (c) forward thrust under k = 6; and (d) forward thrust under k = 8.
Figure 16.
The forward thrusts of the SALL submerged glider under the different K and λ. (a) Forward thrust under k = 2; (b) forward thrust under k = 4; (c) forward thrust under k = 6; and (d) forward thrust under k = 8.
Figure 17.
The average thrusts of the SALL submerged glider and the conventional submerged glider under the different K. (a) Average forward thrust under k = 2; (b) average forward thrust under k = 4; (c) average forward thrust under k = 6; and (d) average forward thrust under k = 8.
Figure 17.
The average thrusts of the SALL submerged glider and the conventional submerged glider under the different K. (a) Average forward thrust under k = 2; (b) average forward thrust under k = 4; (c) average forward thrust under k = 6; and (d) average forward thrust under k = 8.
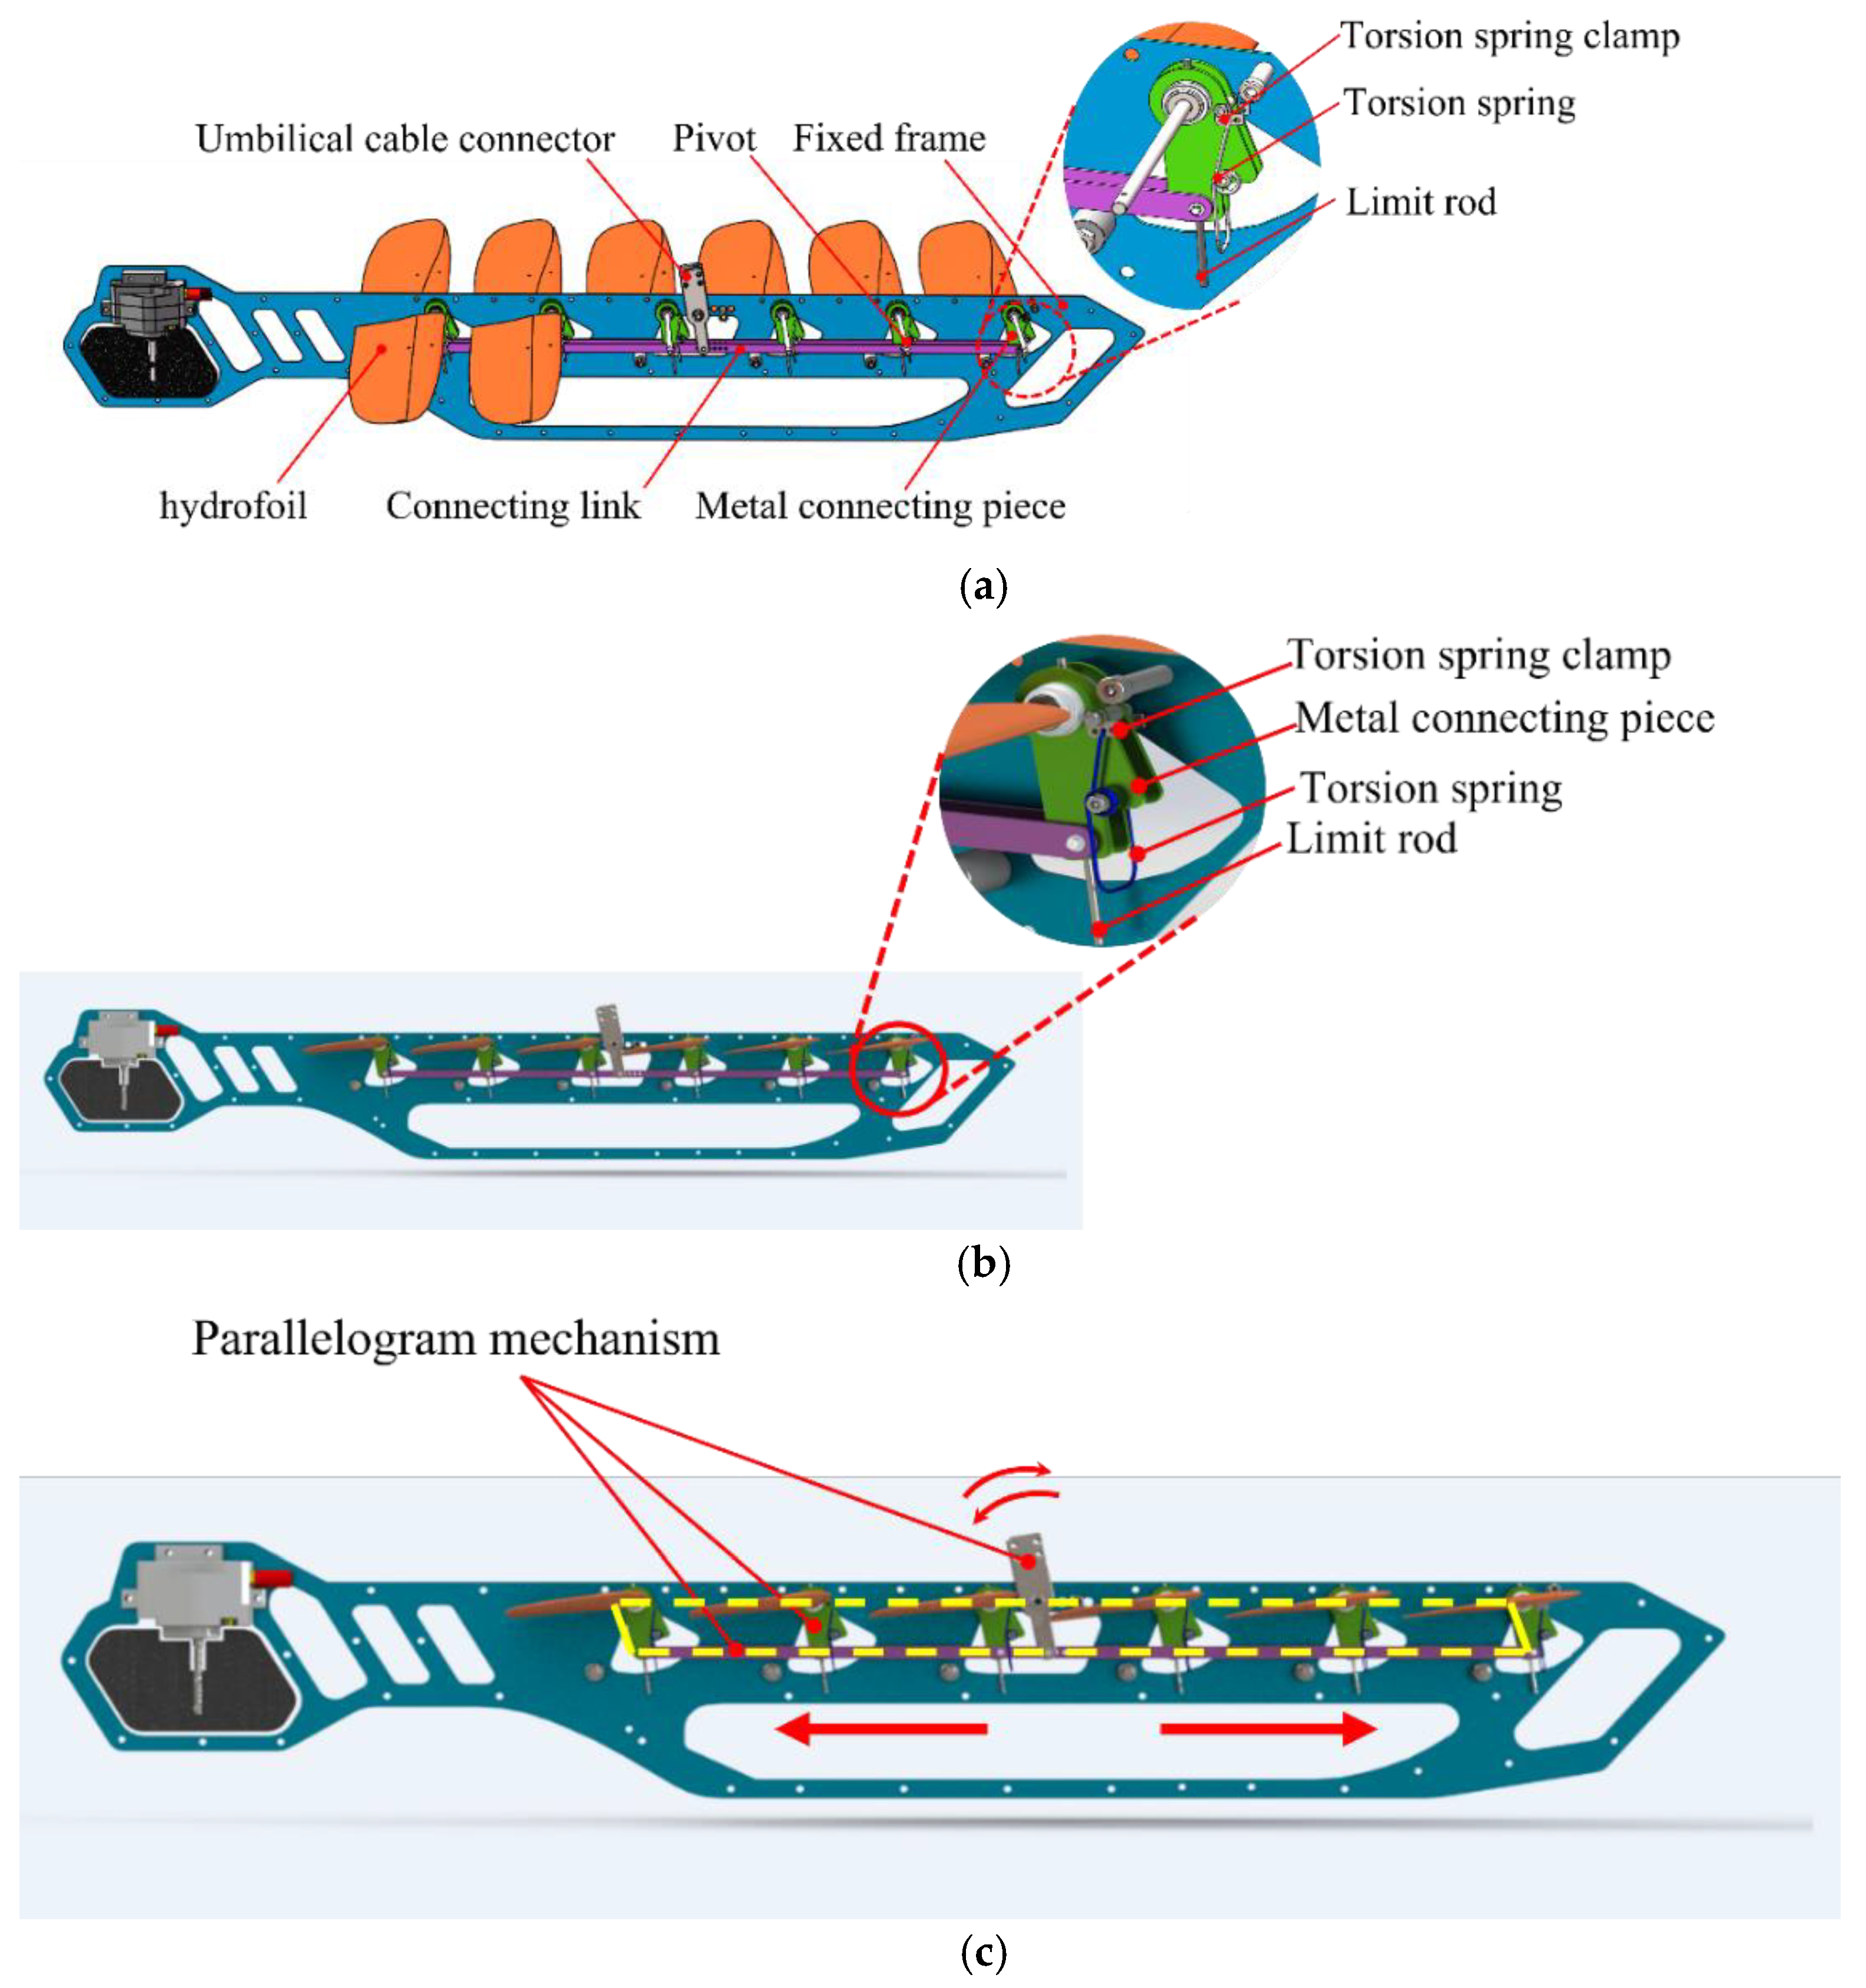
Figure 18.
The structure of the SALL submerged glider. (a) The installation diagram of the torsion spring; (b) the internal structure diagram; and (c) the parallelogram mechanism.
Figure 18.
The structure of the SALL submerged glider. (a) The installation diagram of the torsion spring; (b) the internal structure diagram; and (c) the parallelogram mechanism.
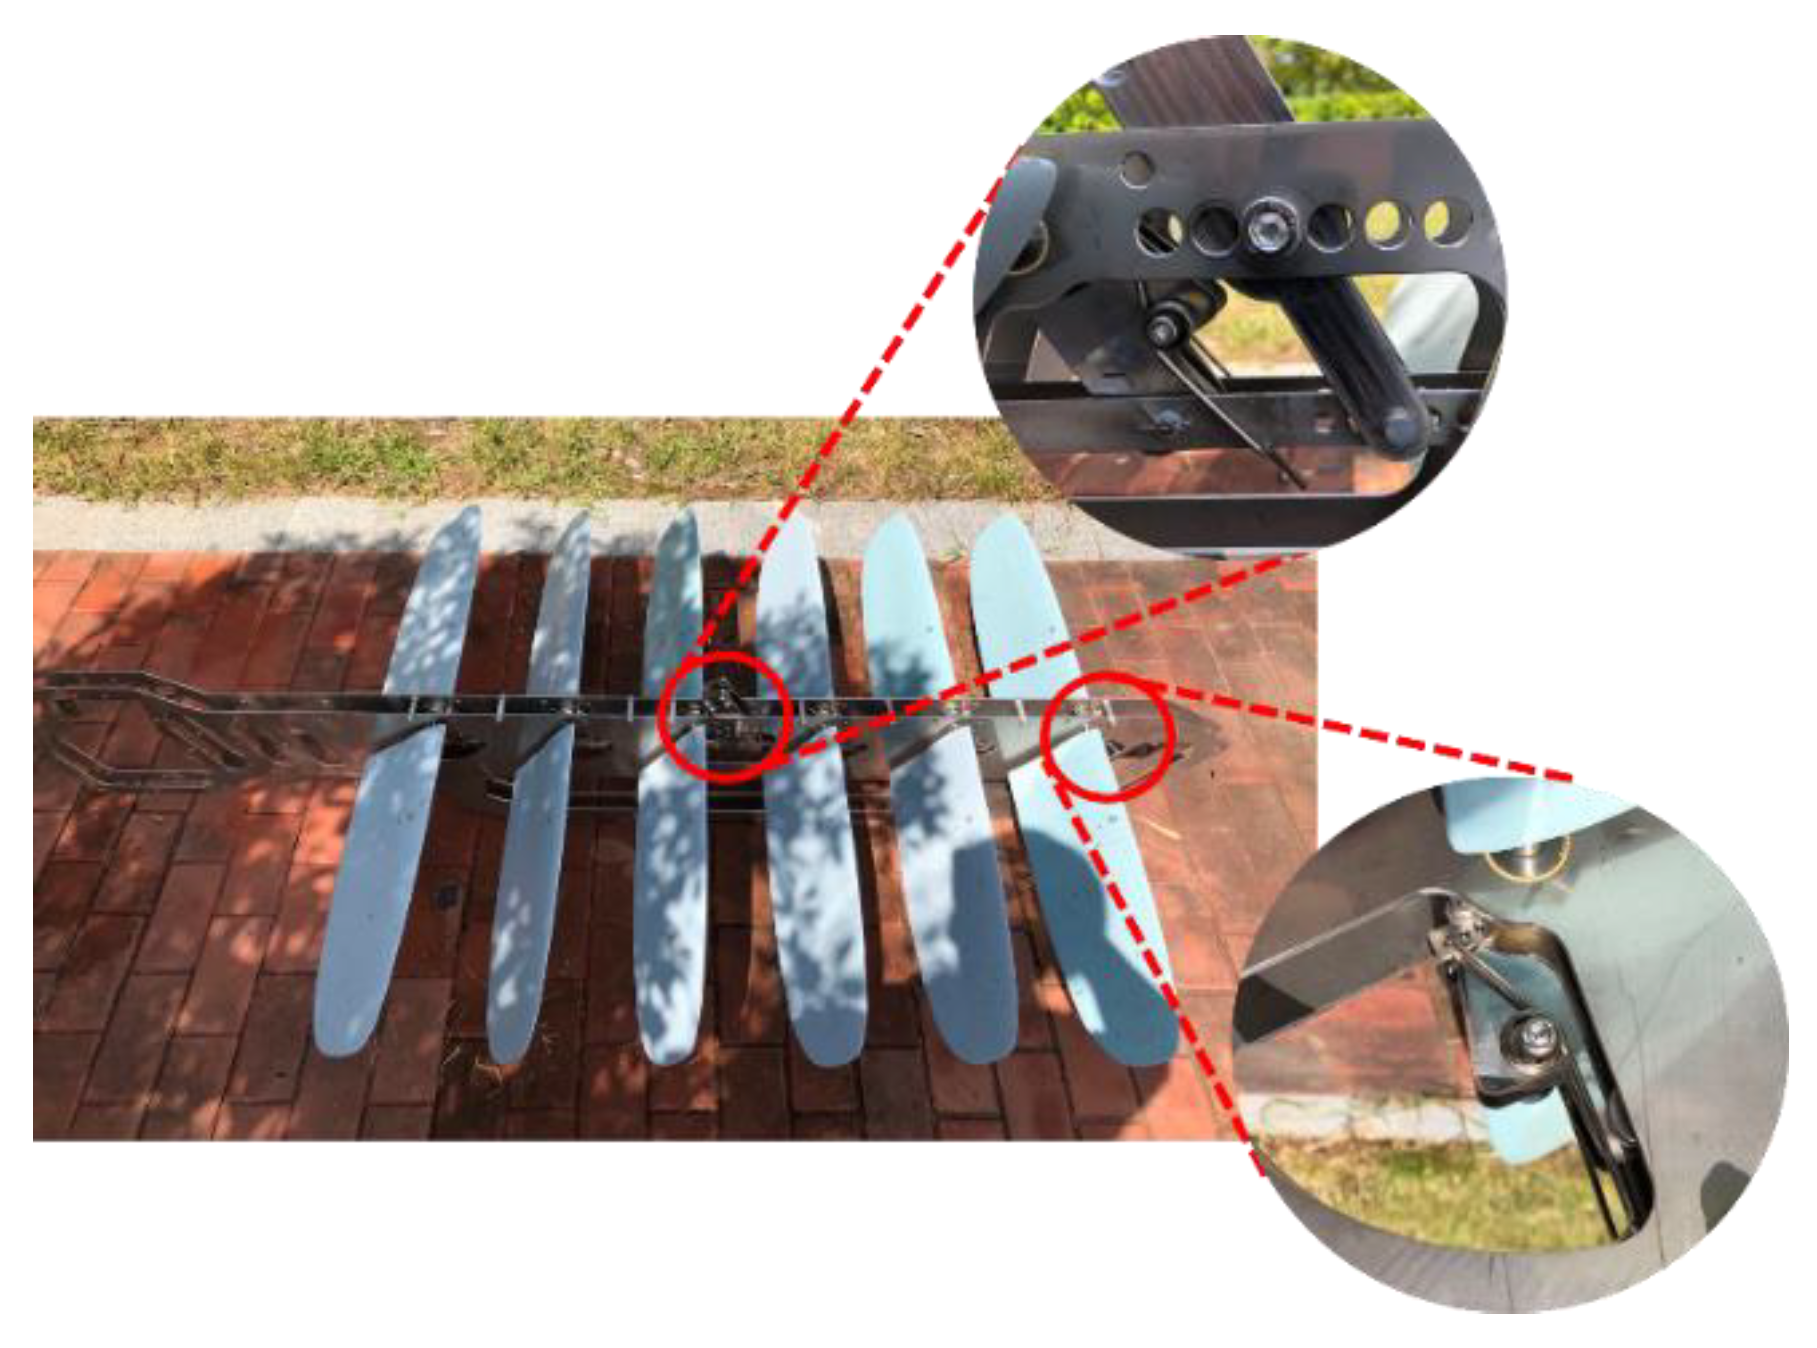
Figure 19.
The physical prototype of the SALL submerged glider.
Figure 19.
The physical prototype of the SALL submerged glider.
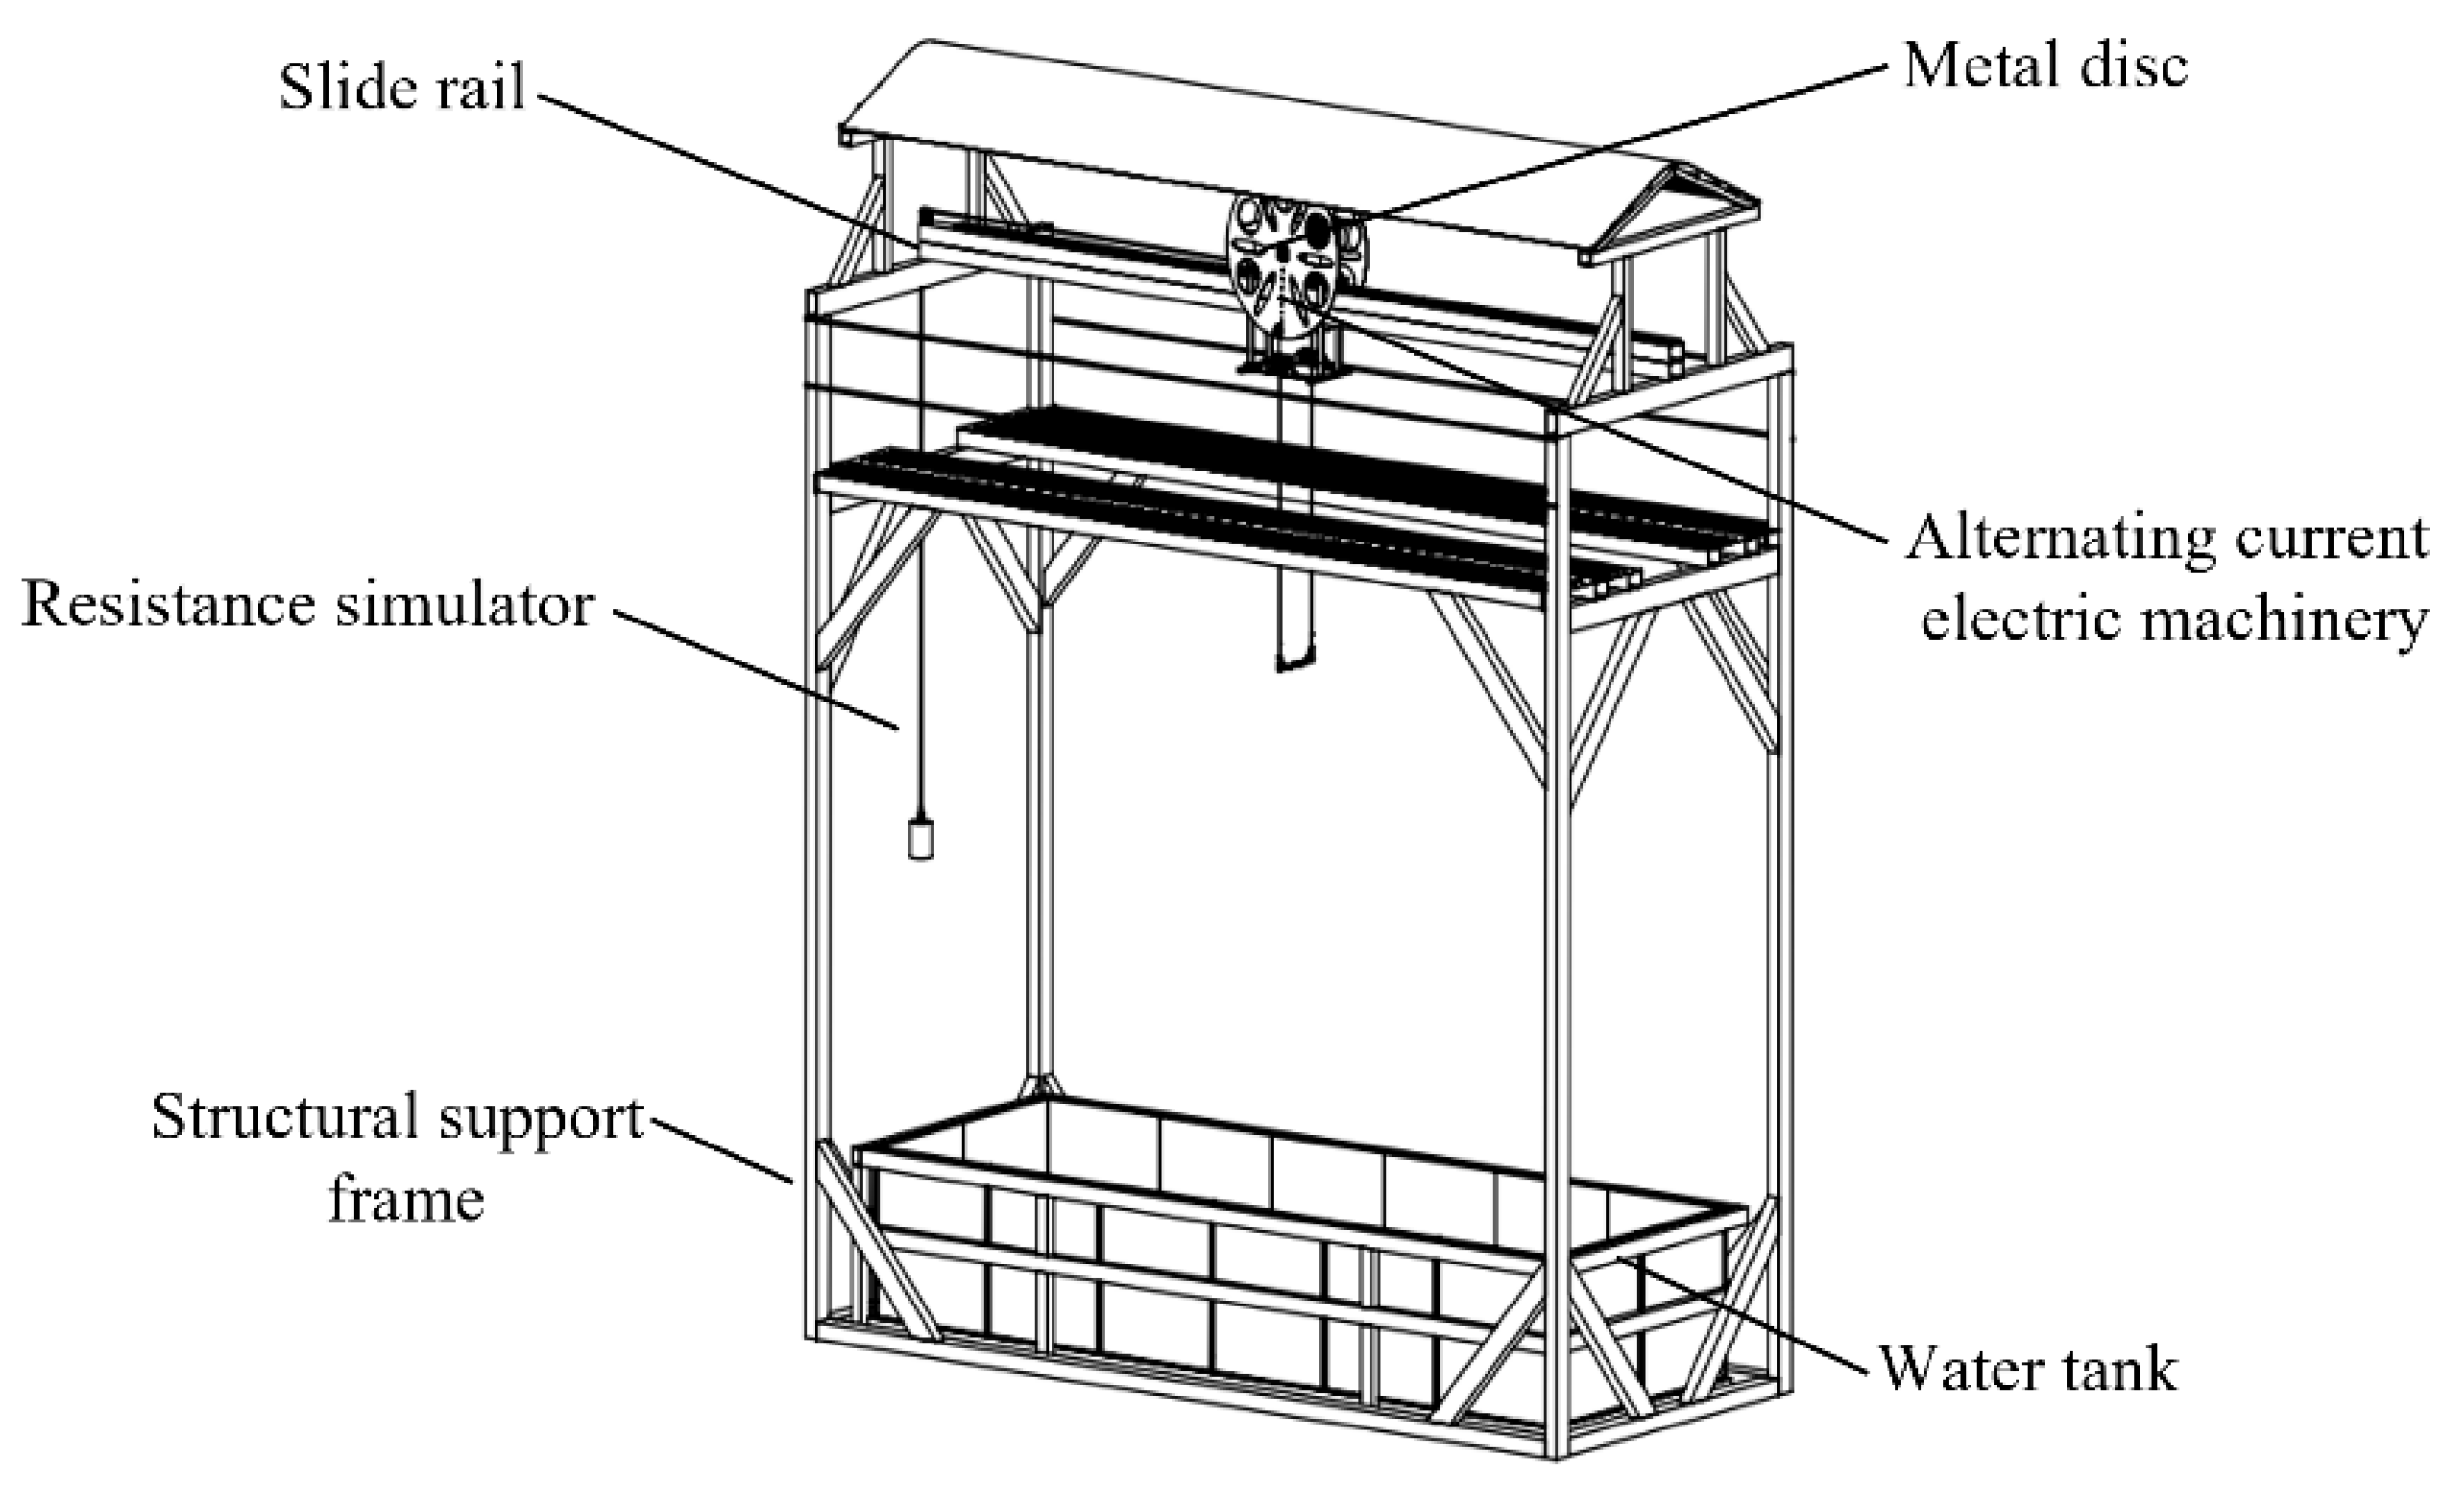
Figure 20.
The large-scale wave simulation experiment platform.
Figure 20.
The large-scale wave simulation experiment platform.
Figure 21.
The SALL submerged glider in the tank experiment.
Figure 21.
The SALL submerged glider in the tank experiment.
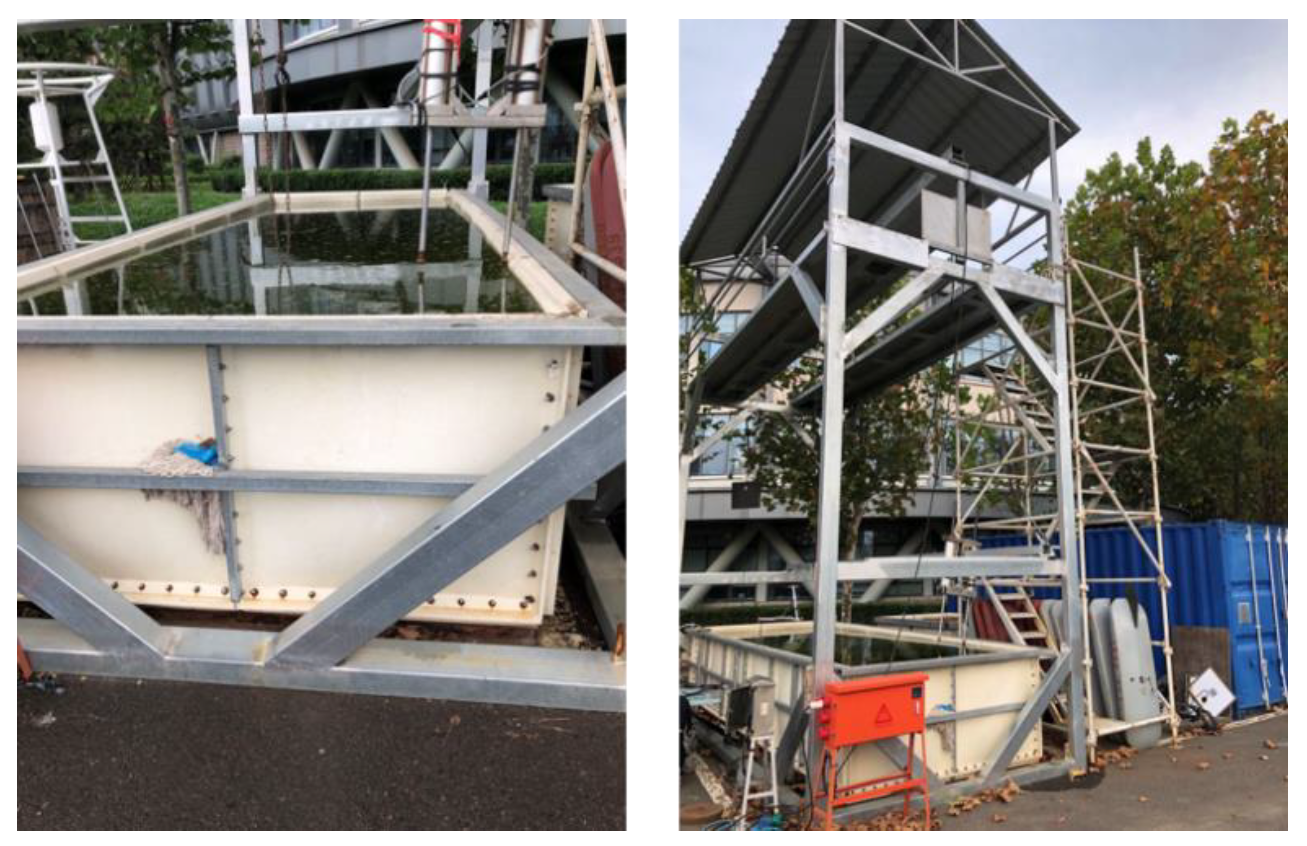
Figure 22.
The photos of the tank and experimental platform.
Figure 22.
The photos of the tank and experimental platform.
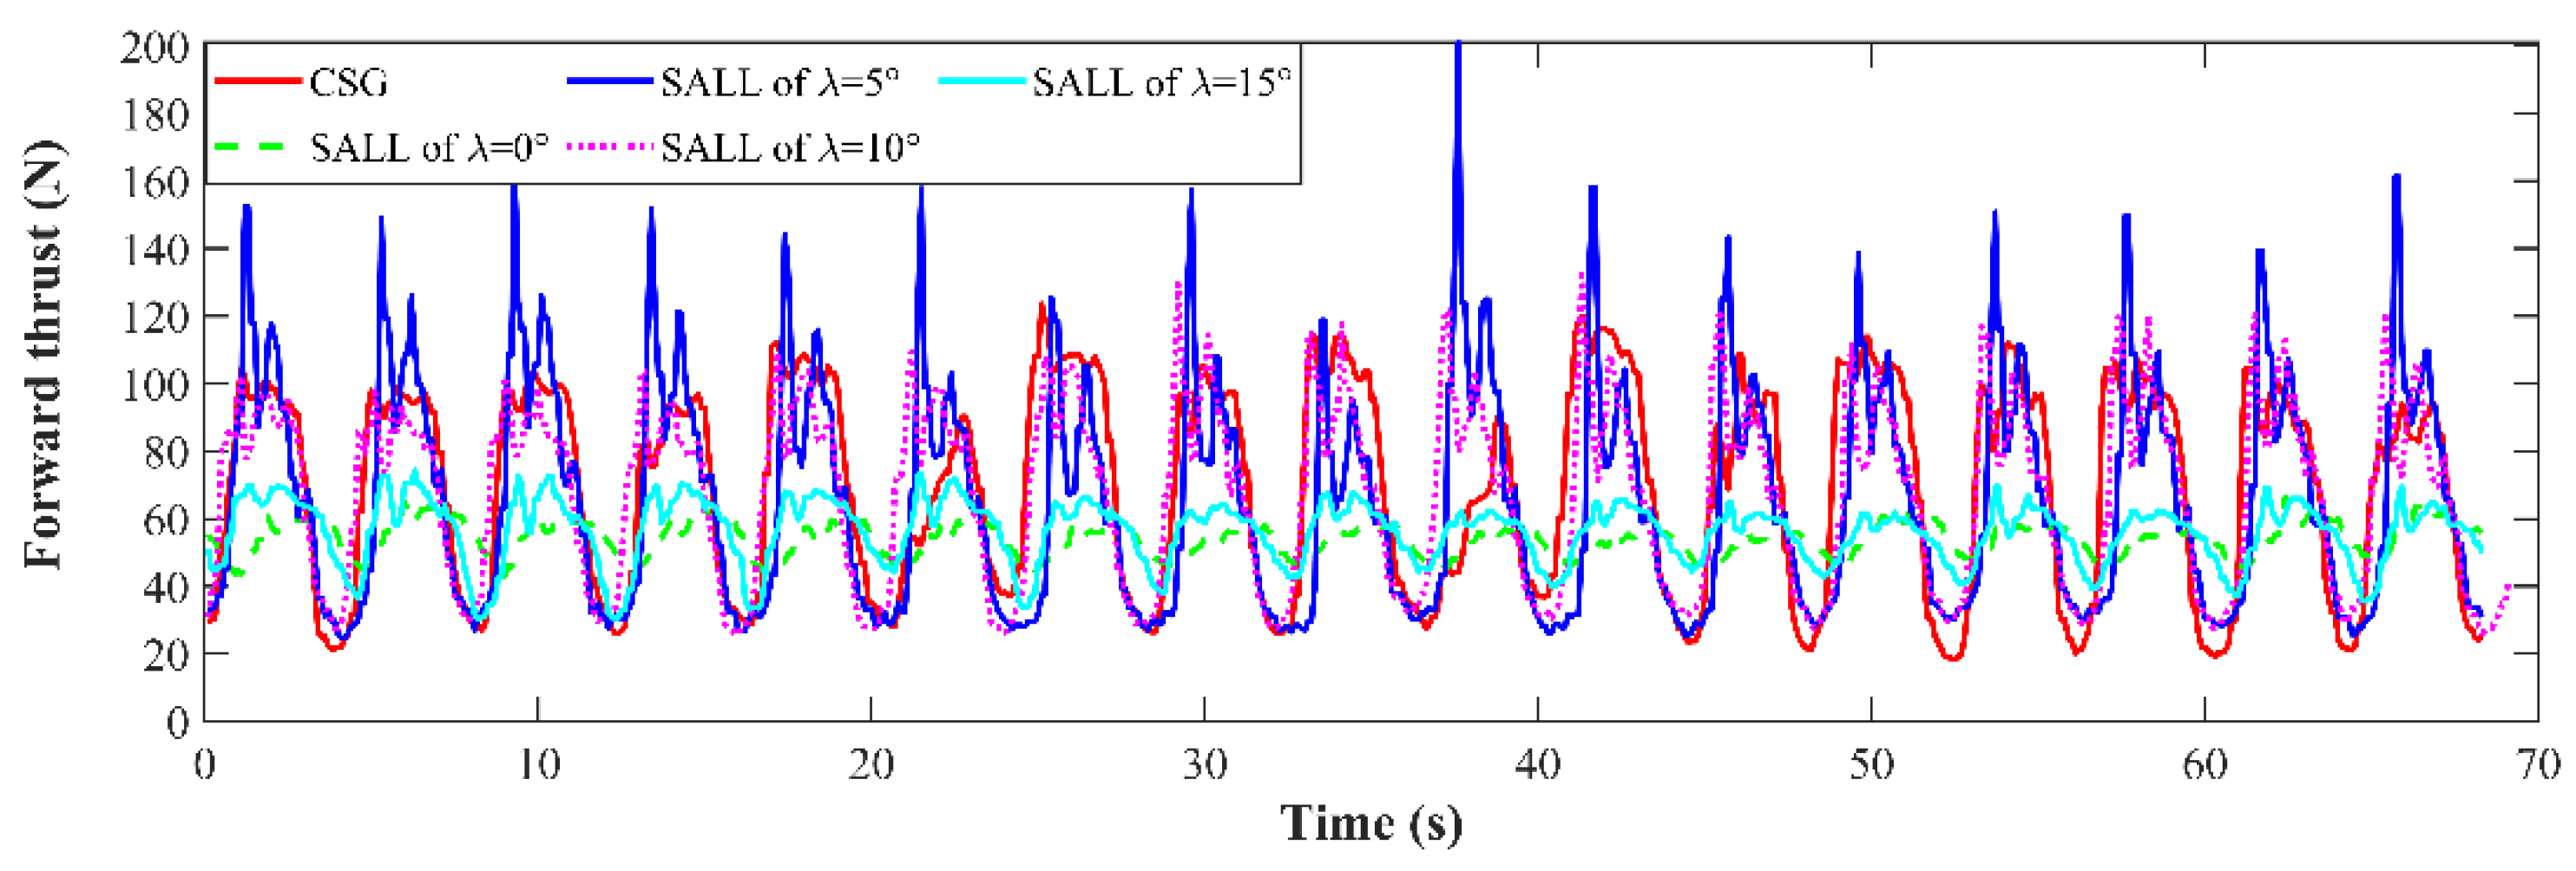
Figure 23.
The forward thrusts of the conventional submerged glider and SALL submerged glider under tank experiments.
Figure 23.
The forward thrusts of the conventional submerged glider and SALL submerged glider under tank experiments.
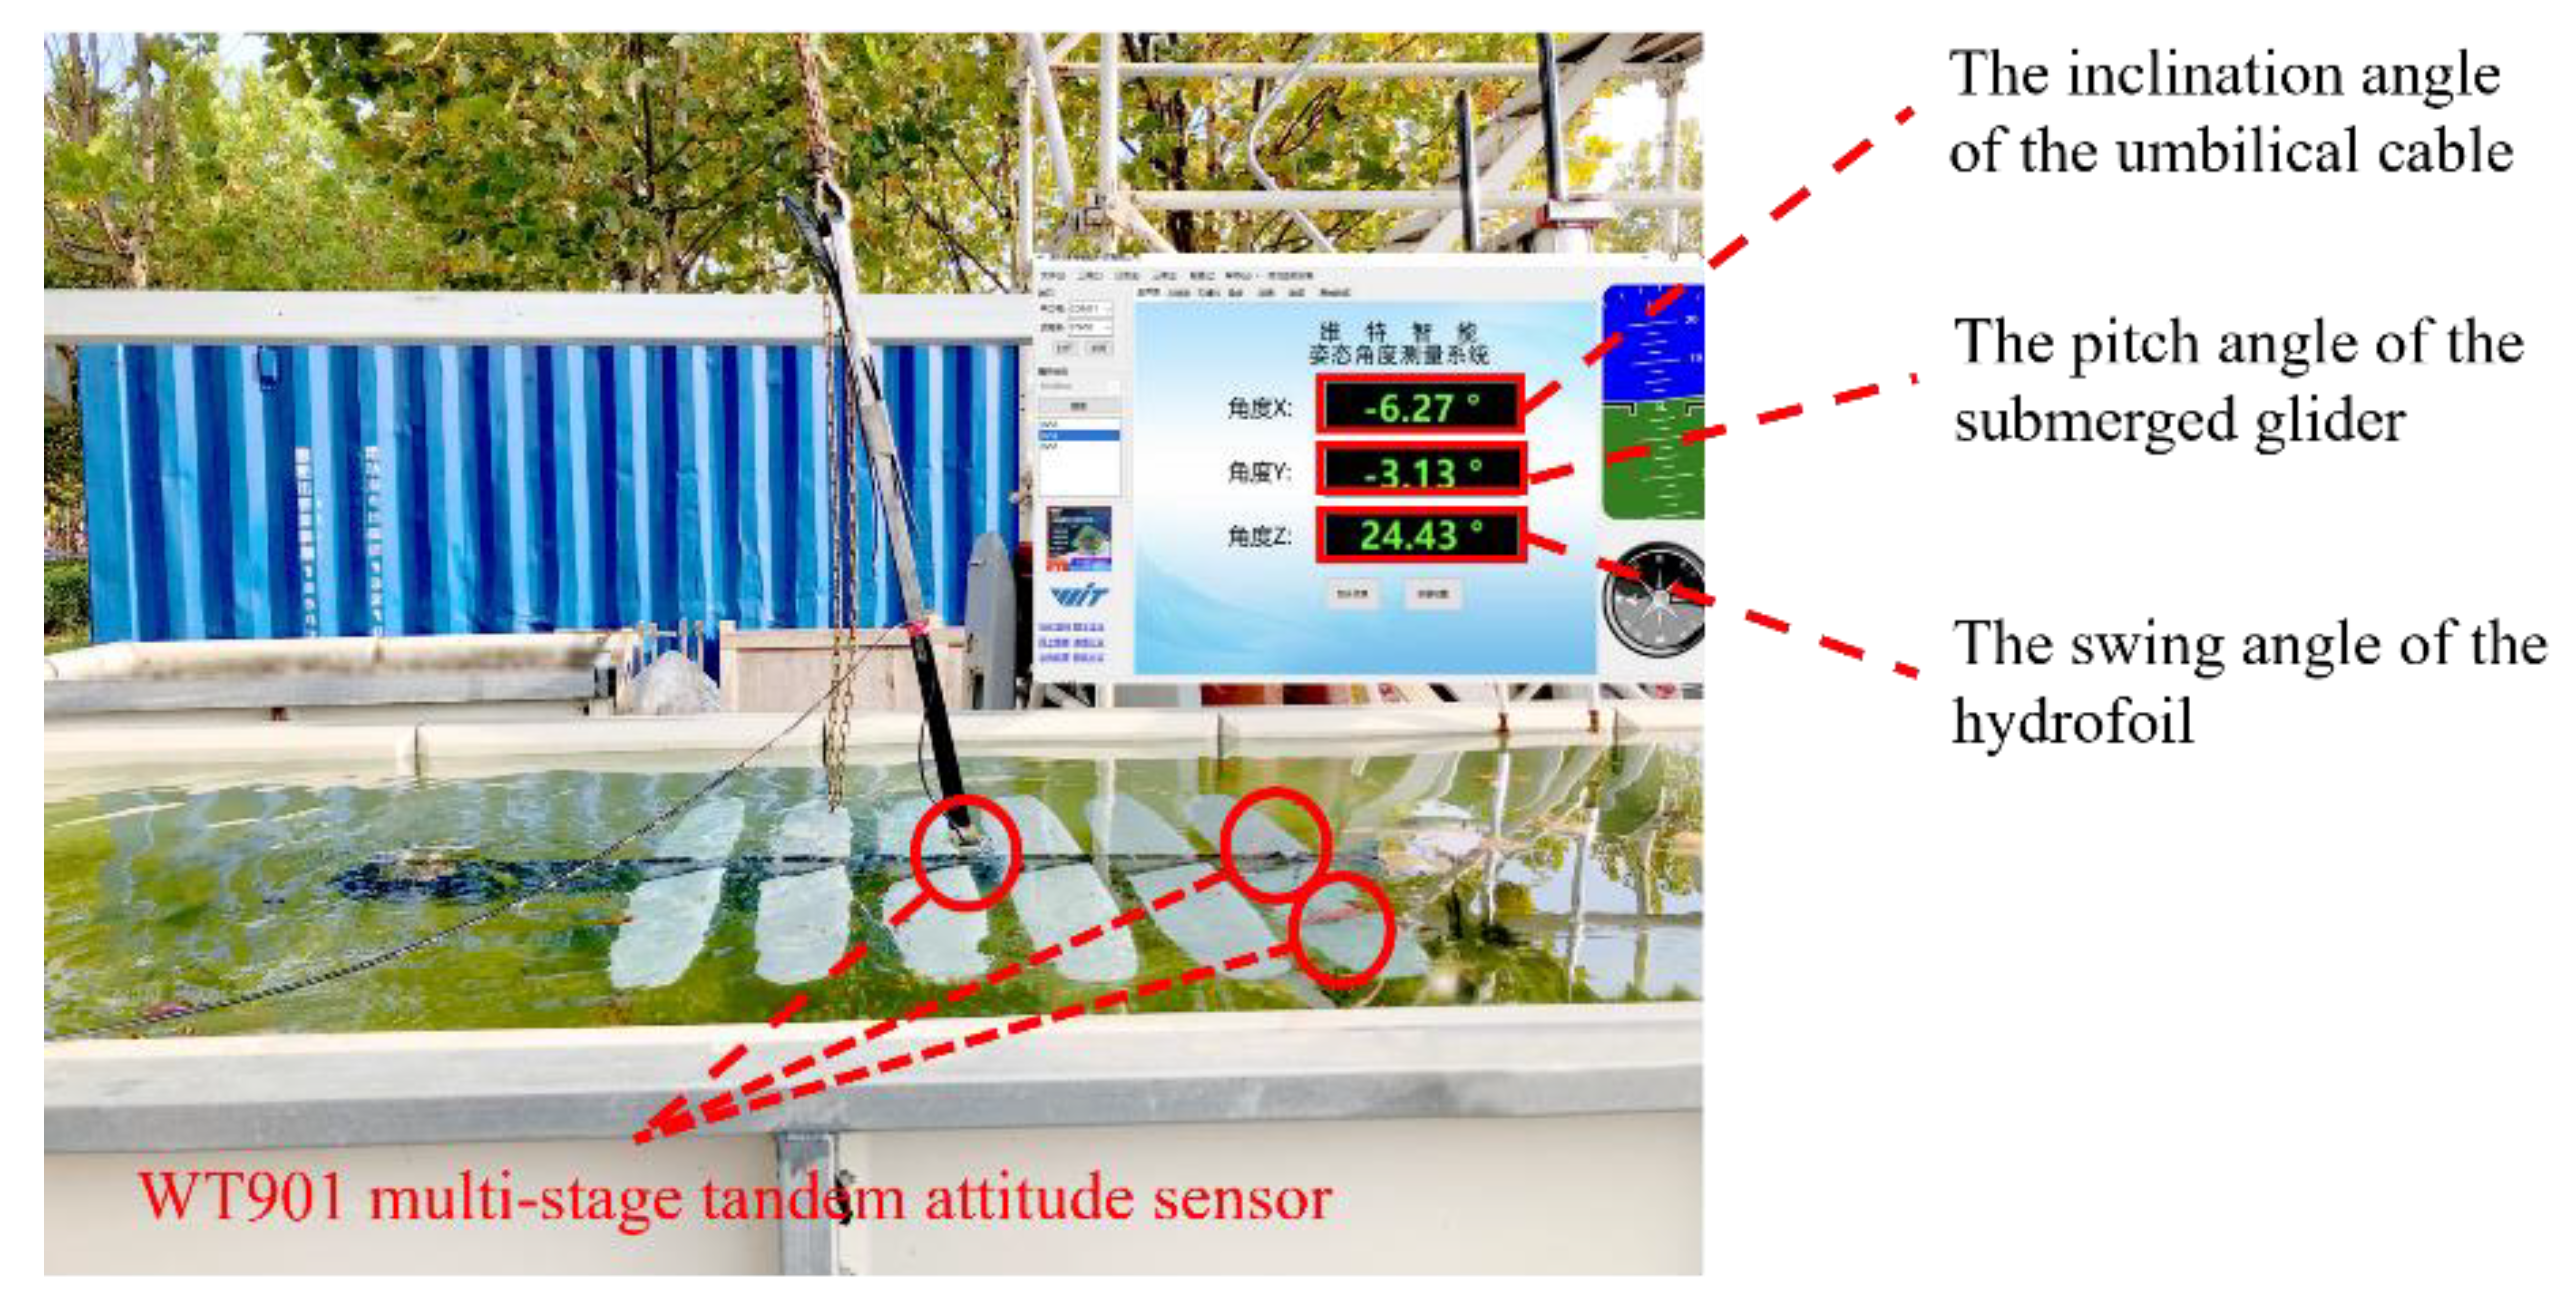
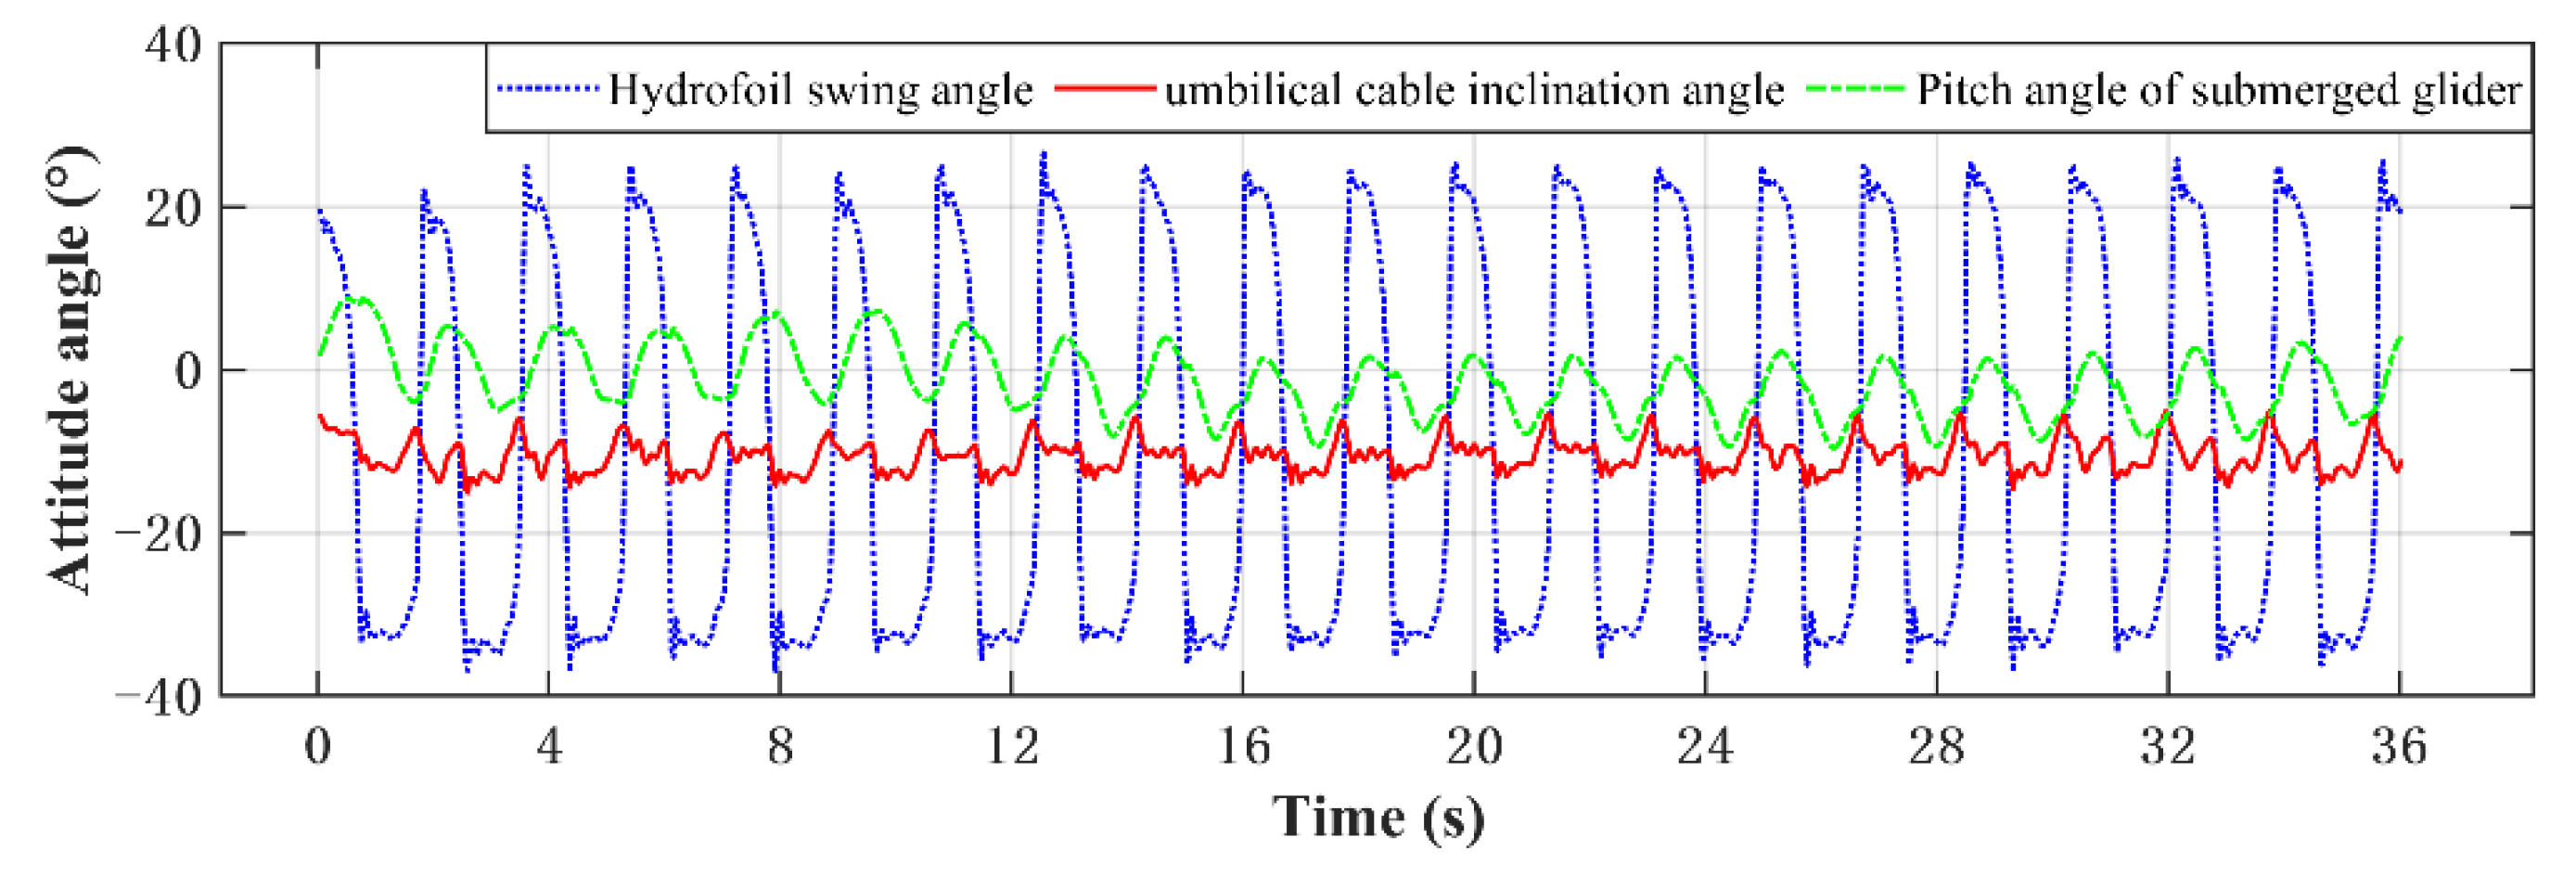
Figure 24.
The attitude angle comparative experiment of the SALL submerged glider.
Figure 24.
The attitude angle comparative experiment of the SALL submerged glider.
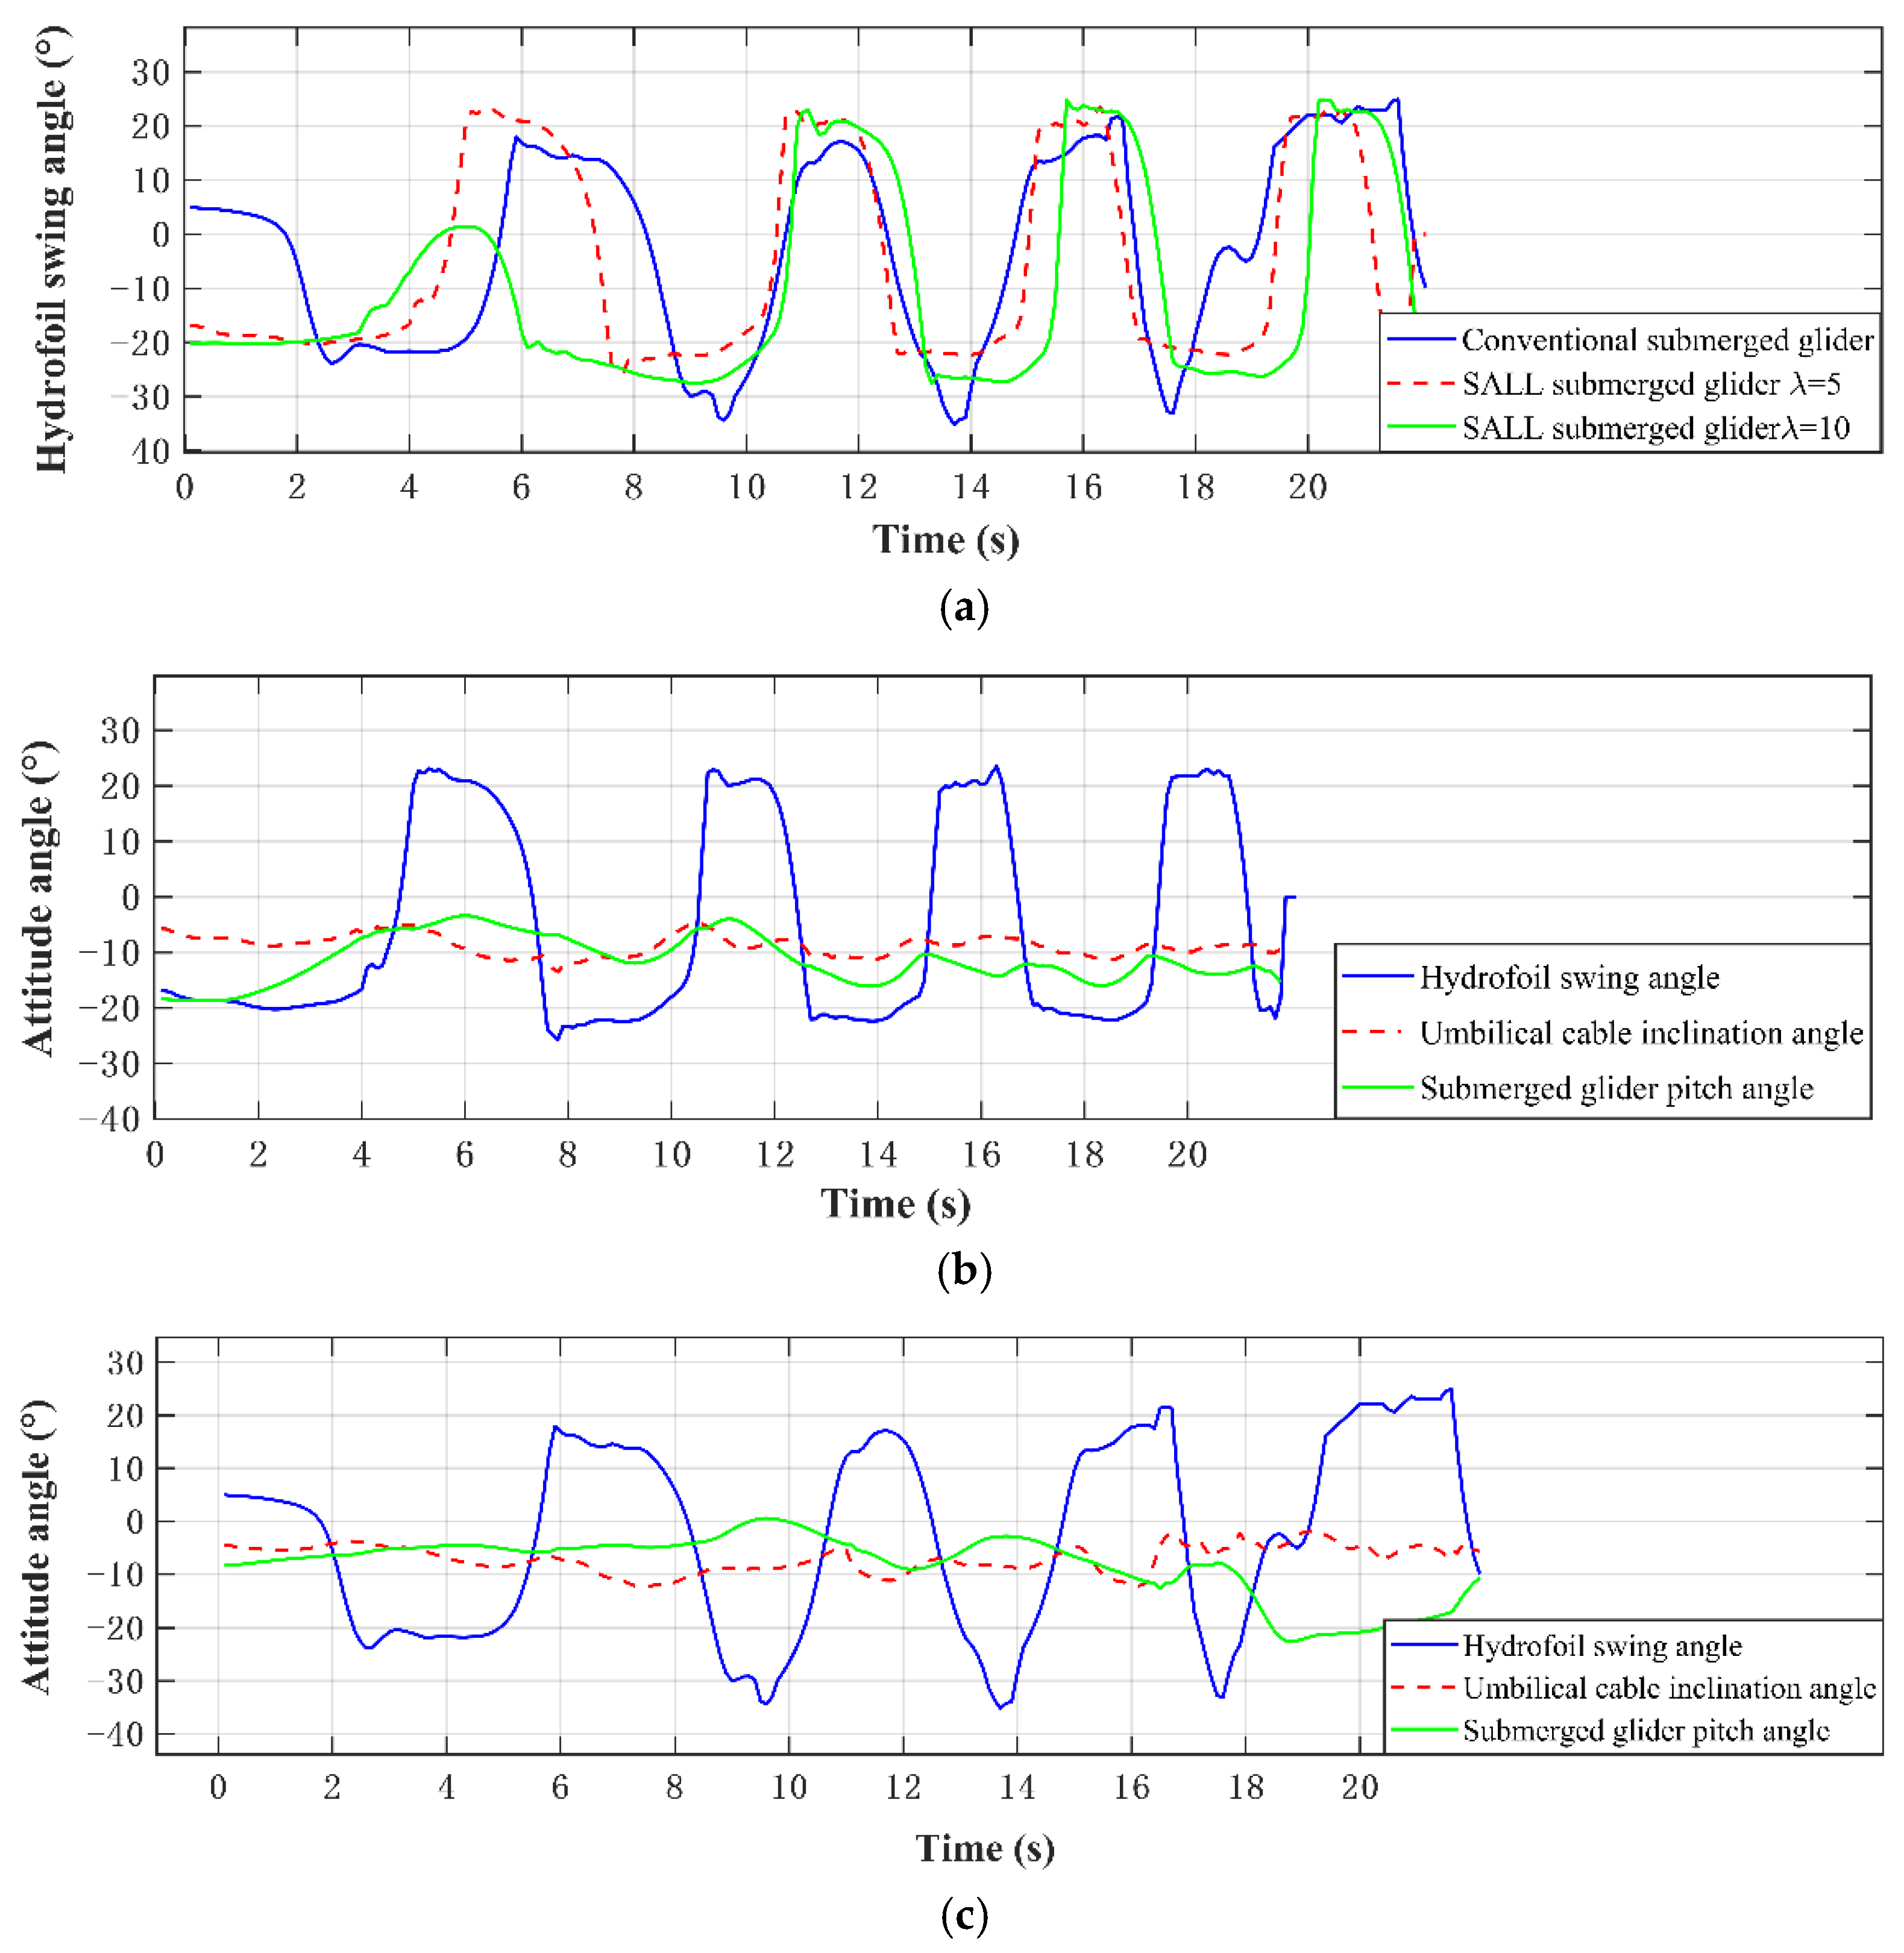
Figure 25.
Tank experiments under the conventional submerged glider and the SALL submerged glider. (a) The swing angle comparisons of the conventional and the SALL submerged gliders; (b) the attitude angle of the SALL submerged glider; and (c) the attitude angle of the conventional submerged glider.
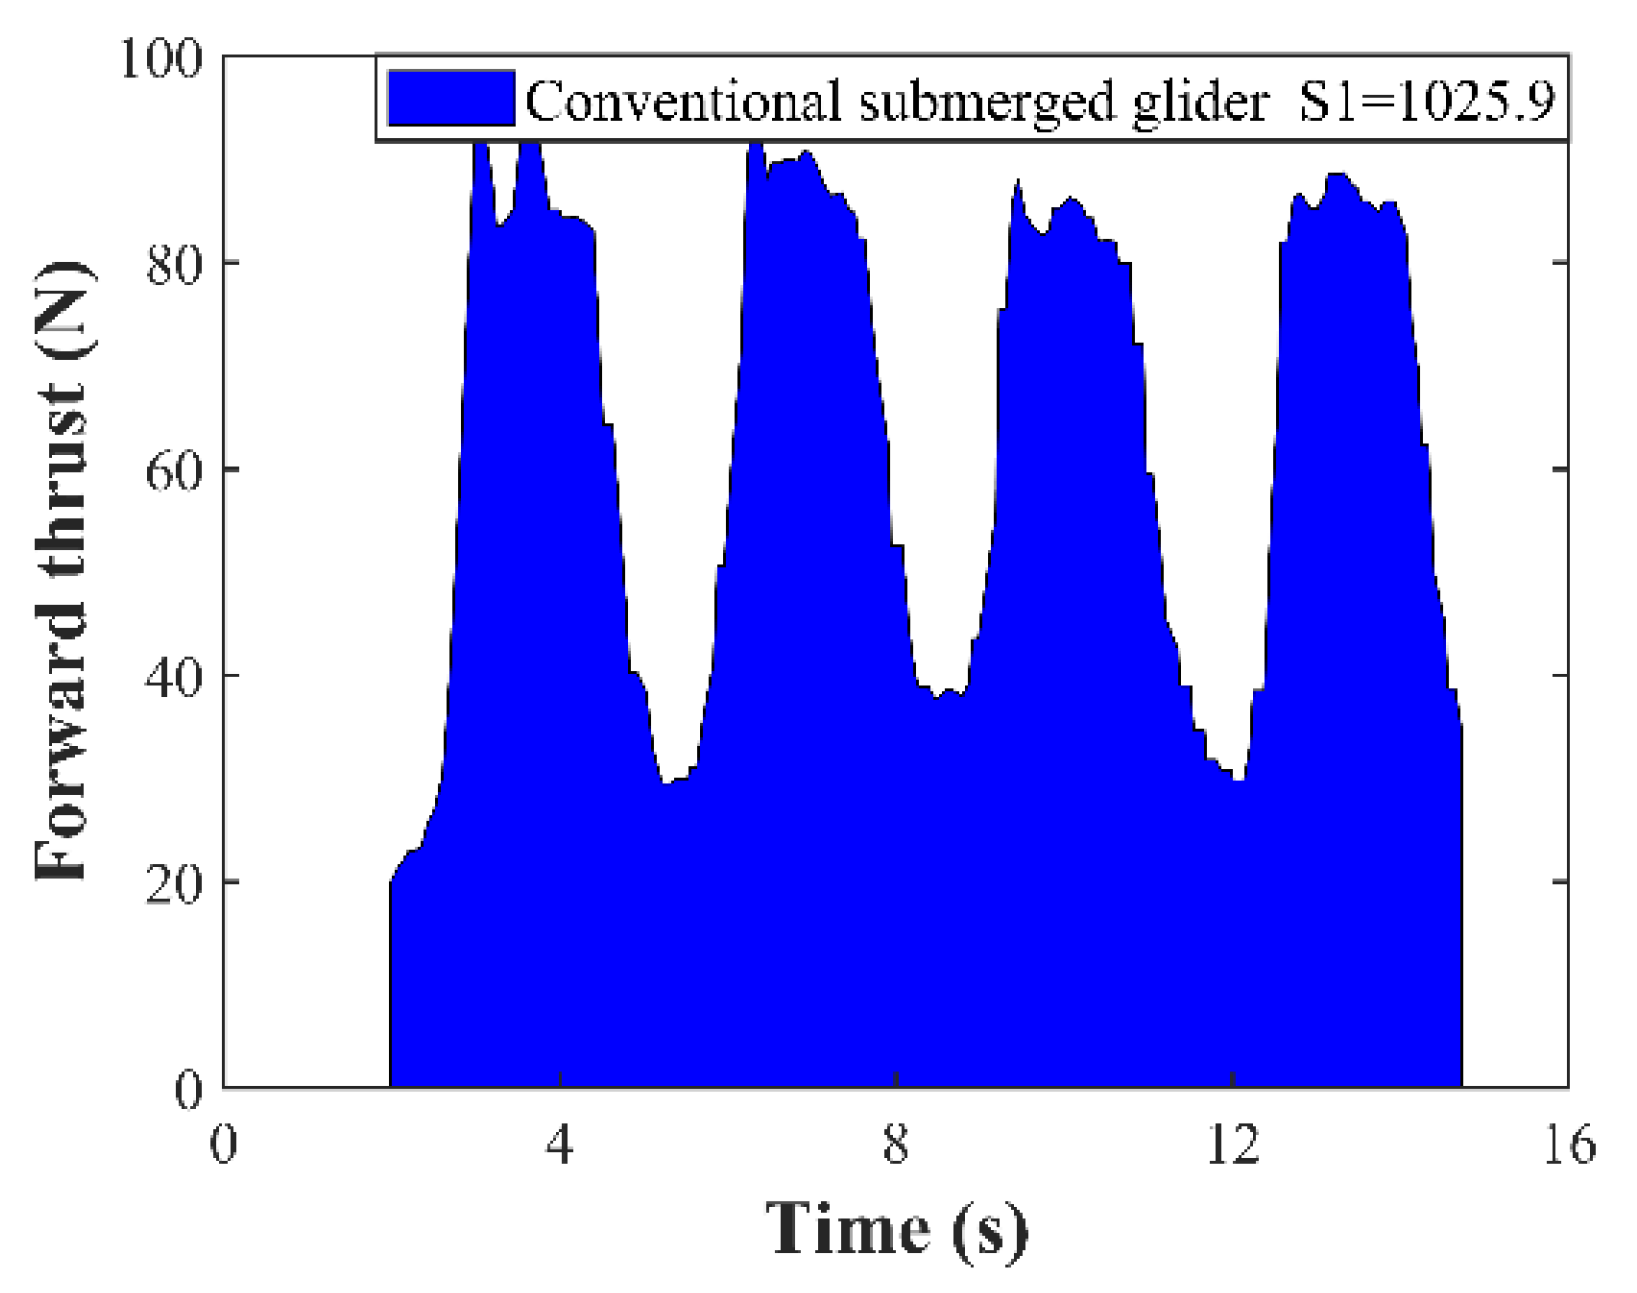
Figure 26.
The integral area of the forward thrust of the conventional submerged glider in four random cycles.
Figure 26.
The integral area of the forward thrust of the conventional submerged glider in four random cycles.
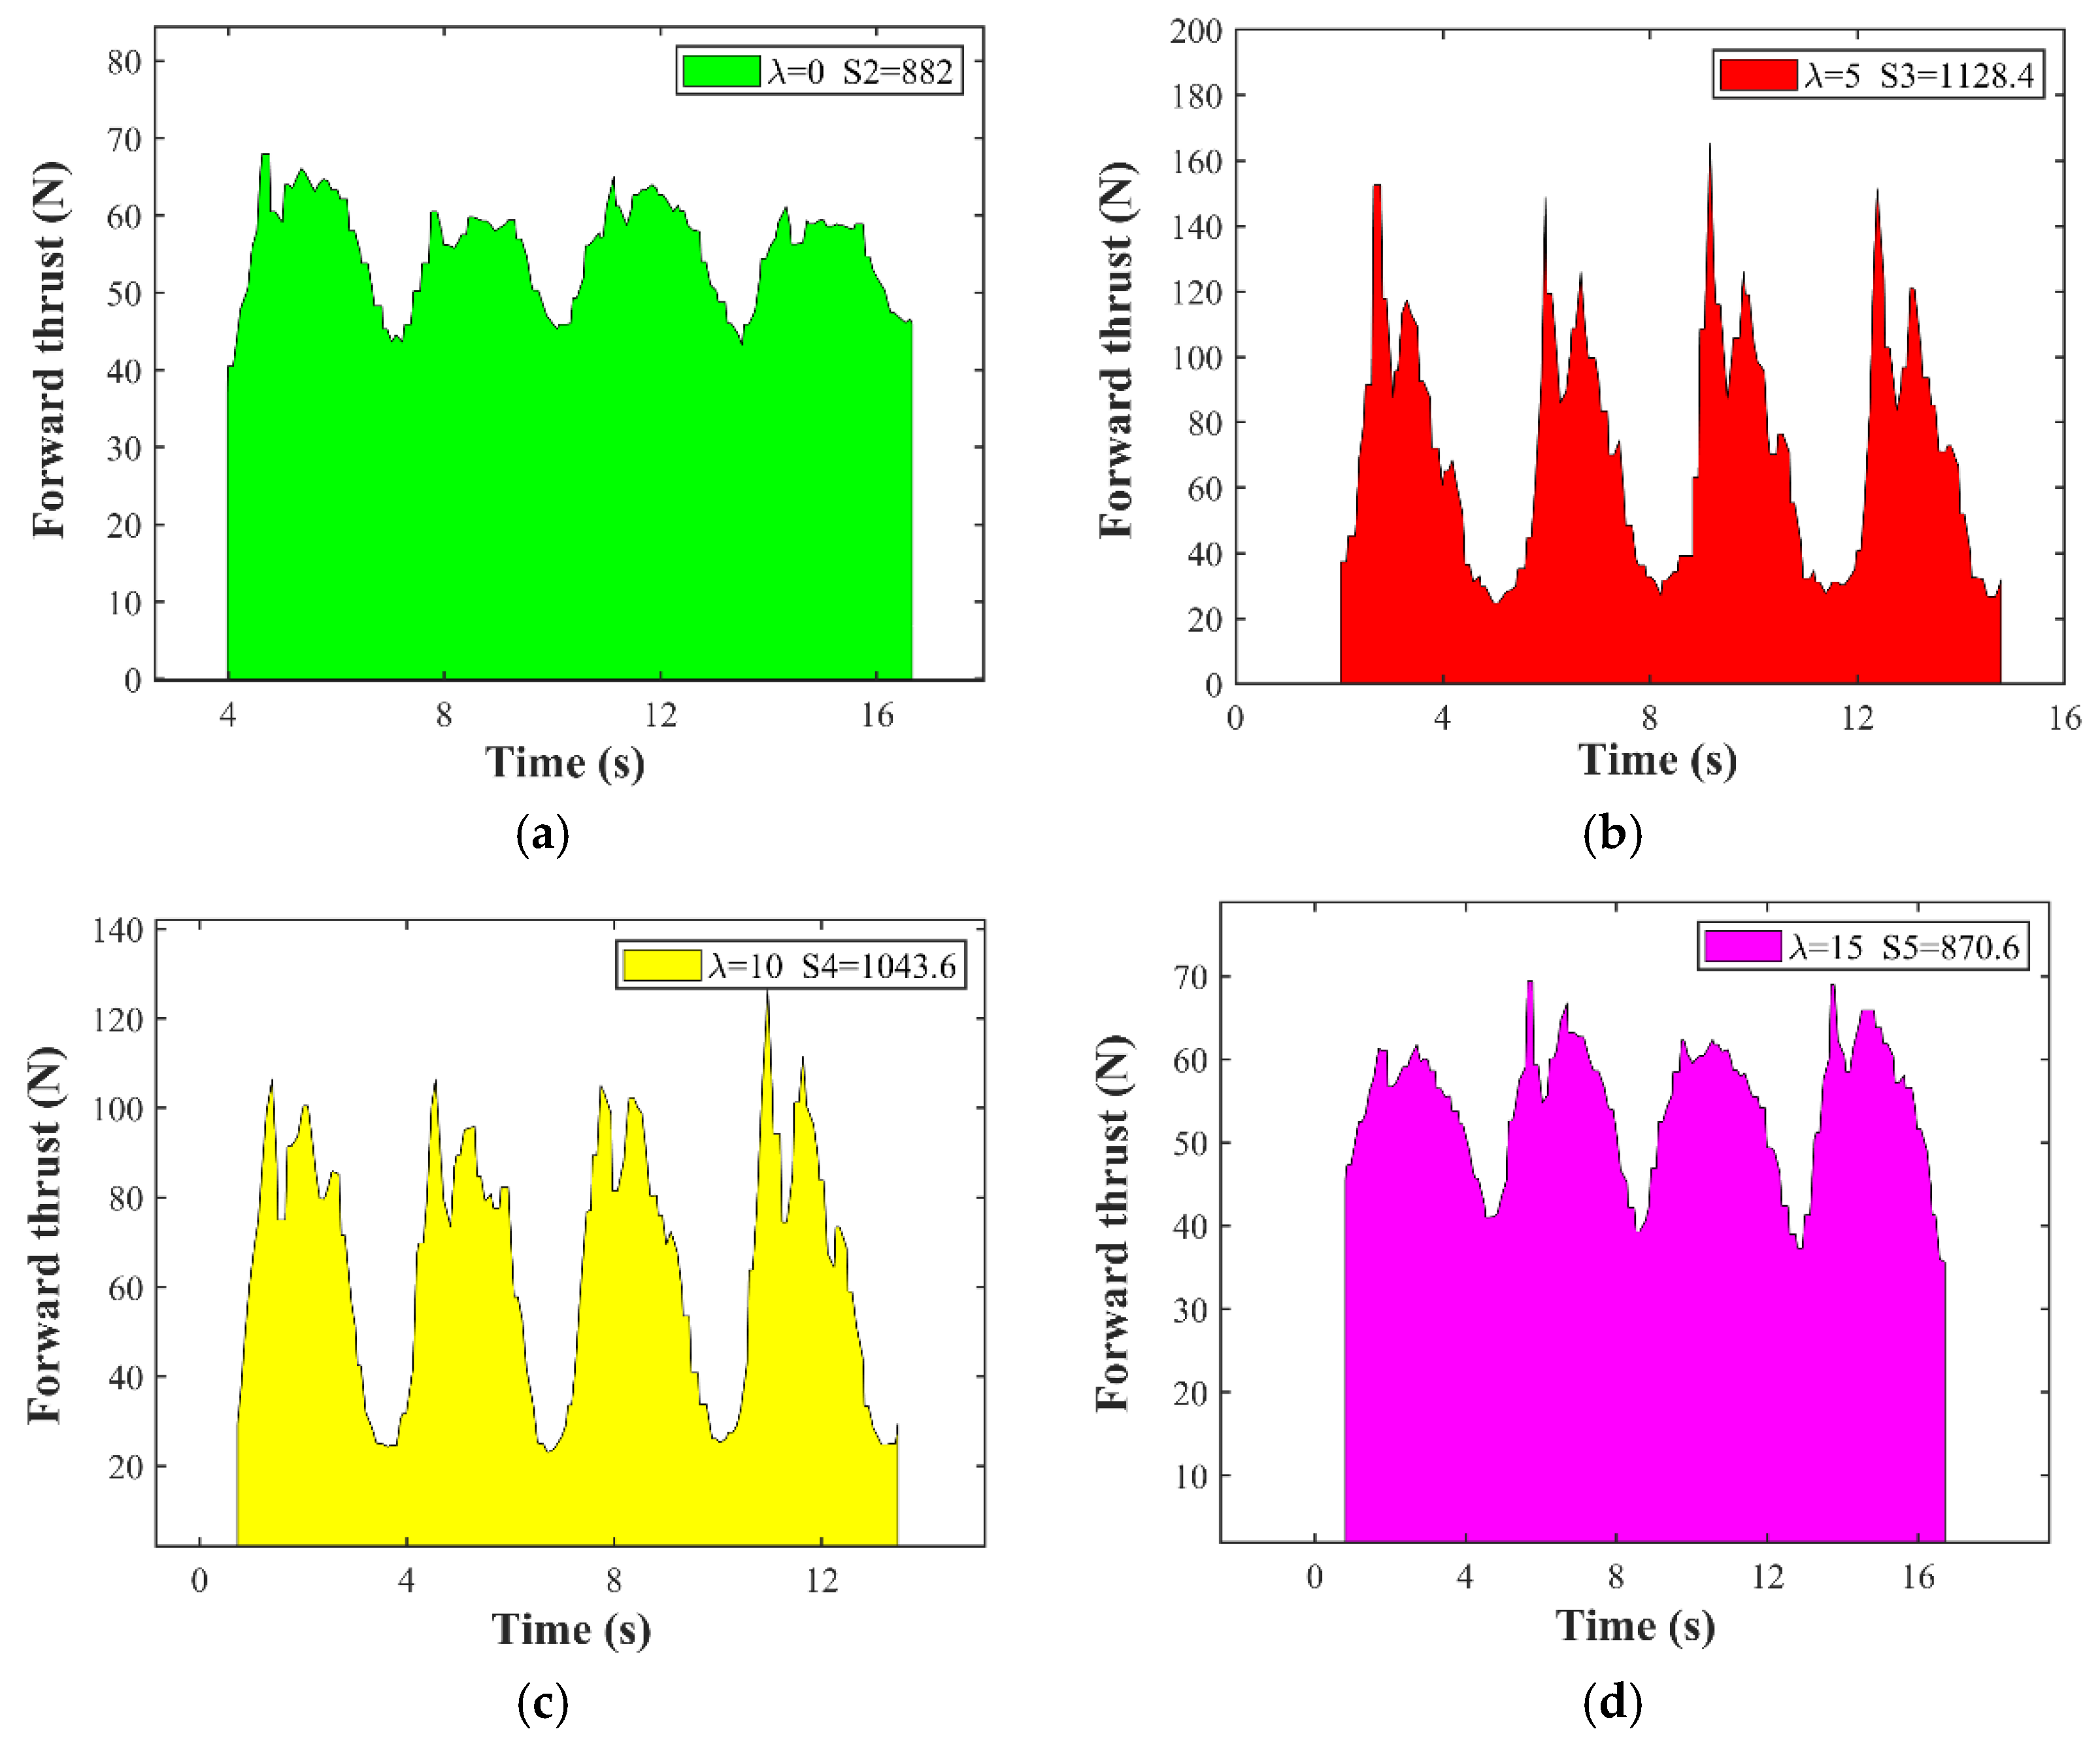
Figure 27.
The integral area of the thrust of the SALL submerged glider in four random cycles. (a) The integral area at λ = 0°; (b) the integral area at λ = 5°; (c) the integral area at λ = 10°; and (d) the integral area at λ = 15°.
Figure 27.
The integral area of the thrust of the SALL submerged glider in four random cycles. (a) The integral area at λ = 0°; (b) the integral area at λ = 5°; (c) the integral area at λ = 10°; and (d) the integral area at λ = 15°.
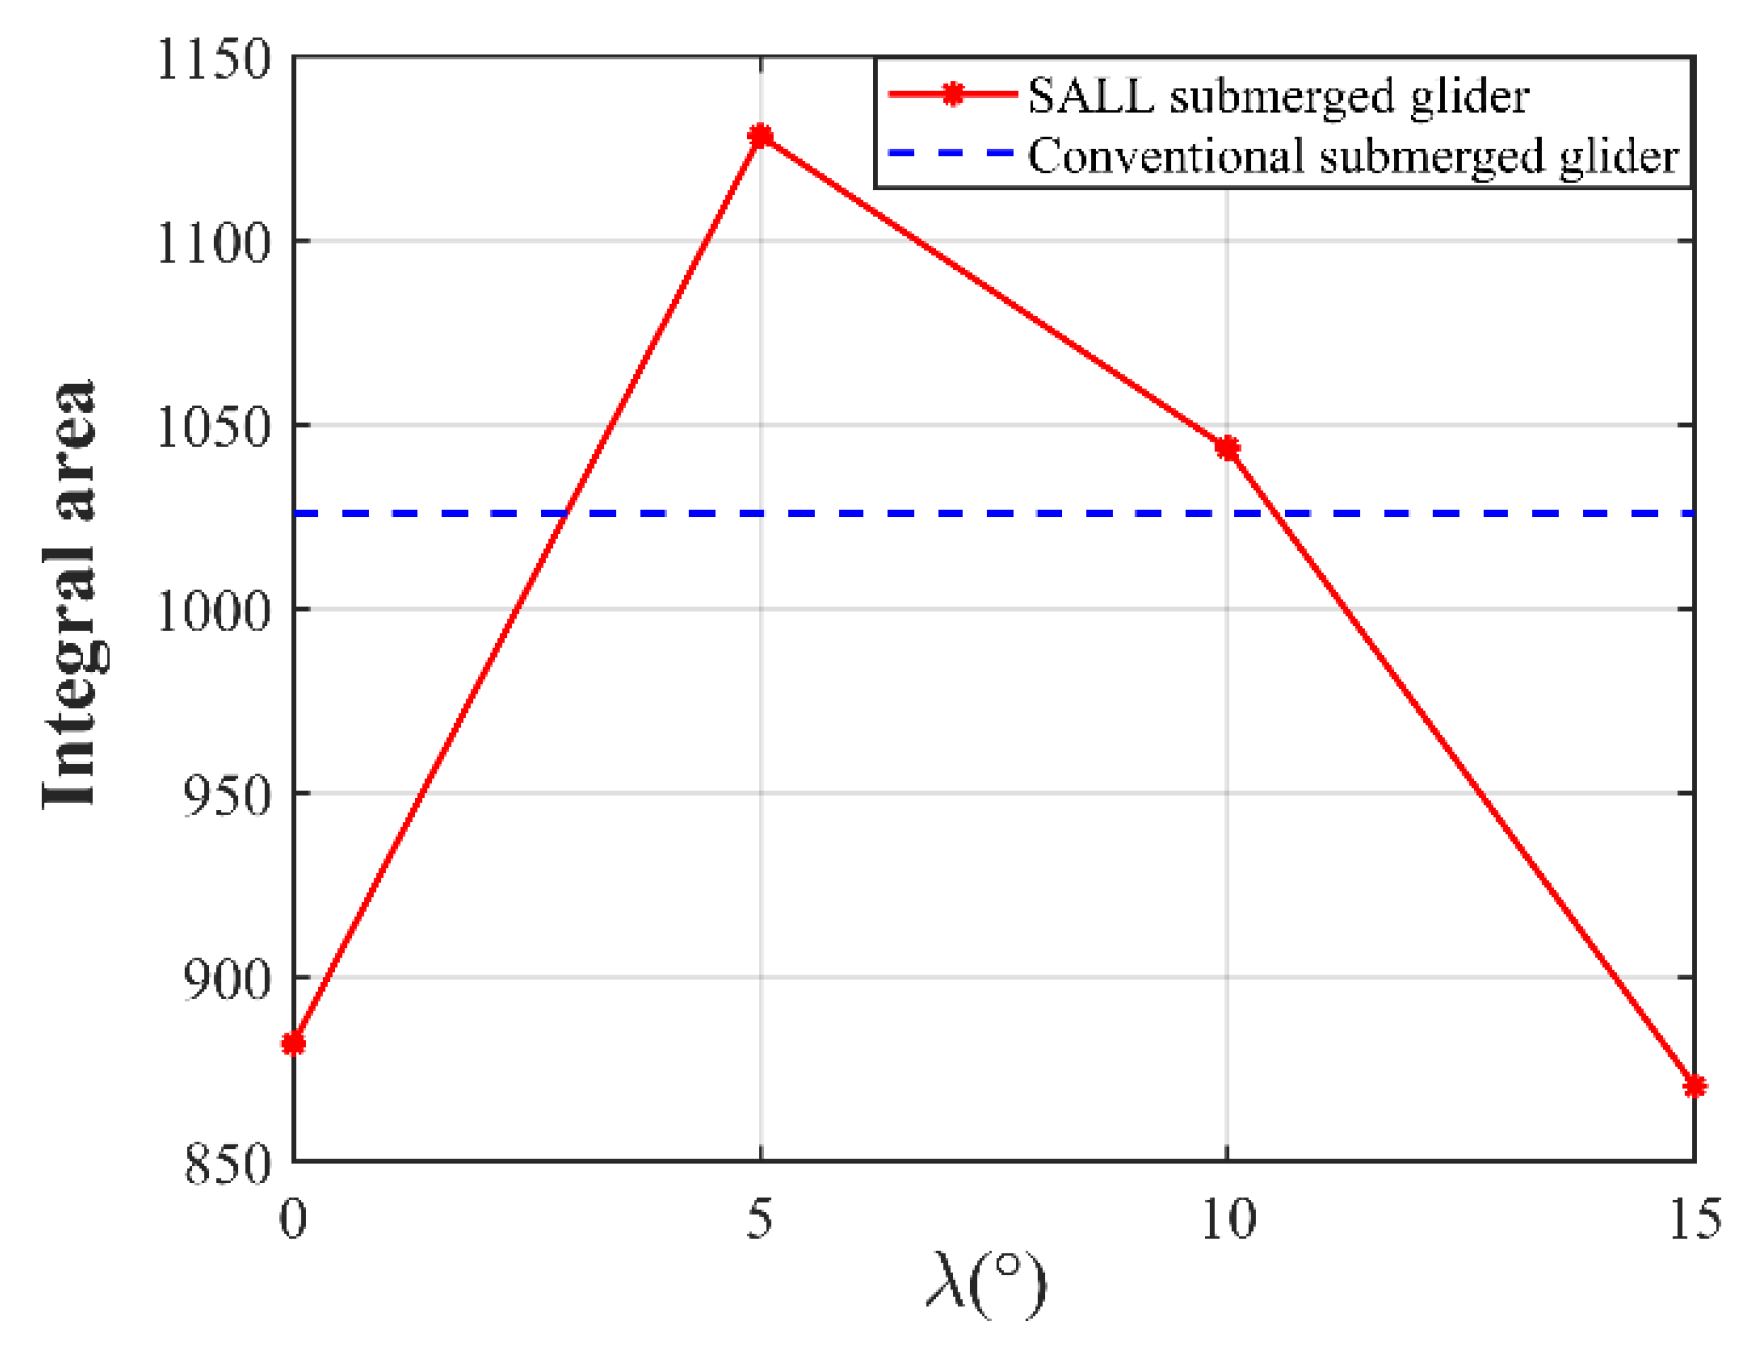
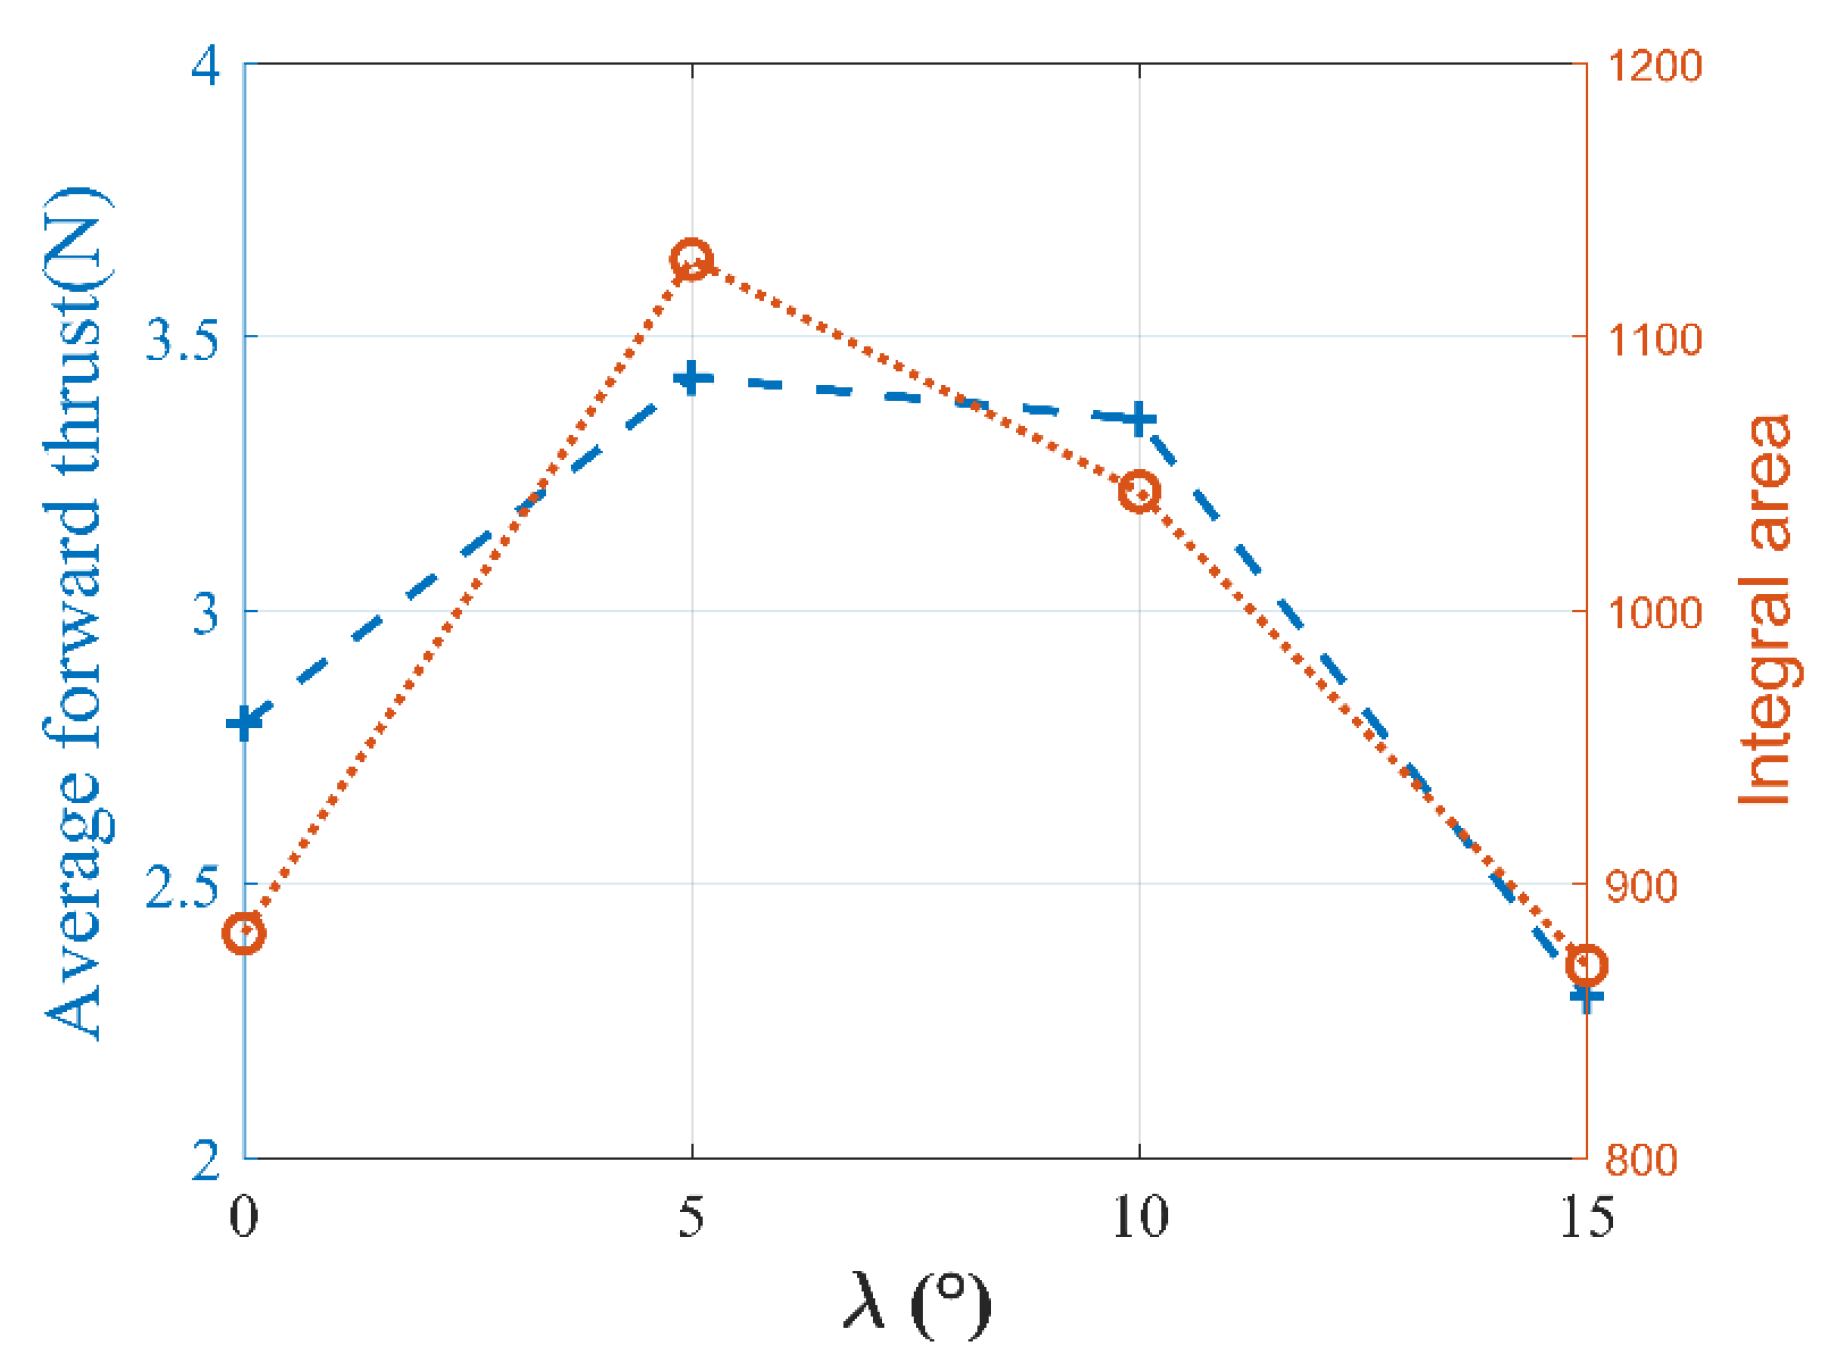
Figure 28.
Comparison of integral area under tank experiment.
Figure 28.
Comparison of integral area under tank experiment.
Figure 29.
Comparison results of simulation experiment and tank experiment (K = 8).
Figure 29.
Comparison results of simulation experiment and tank experiment (K = 8).
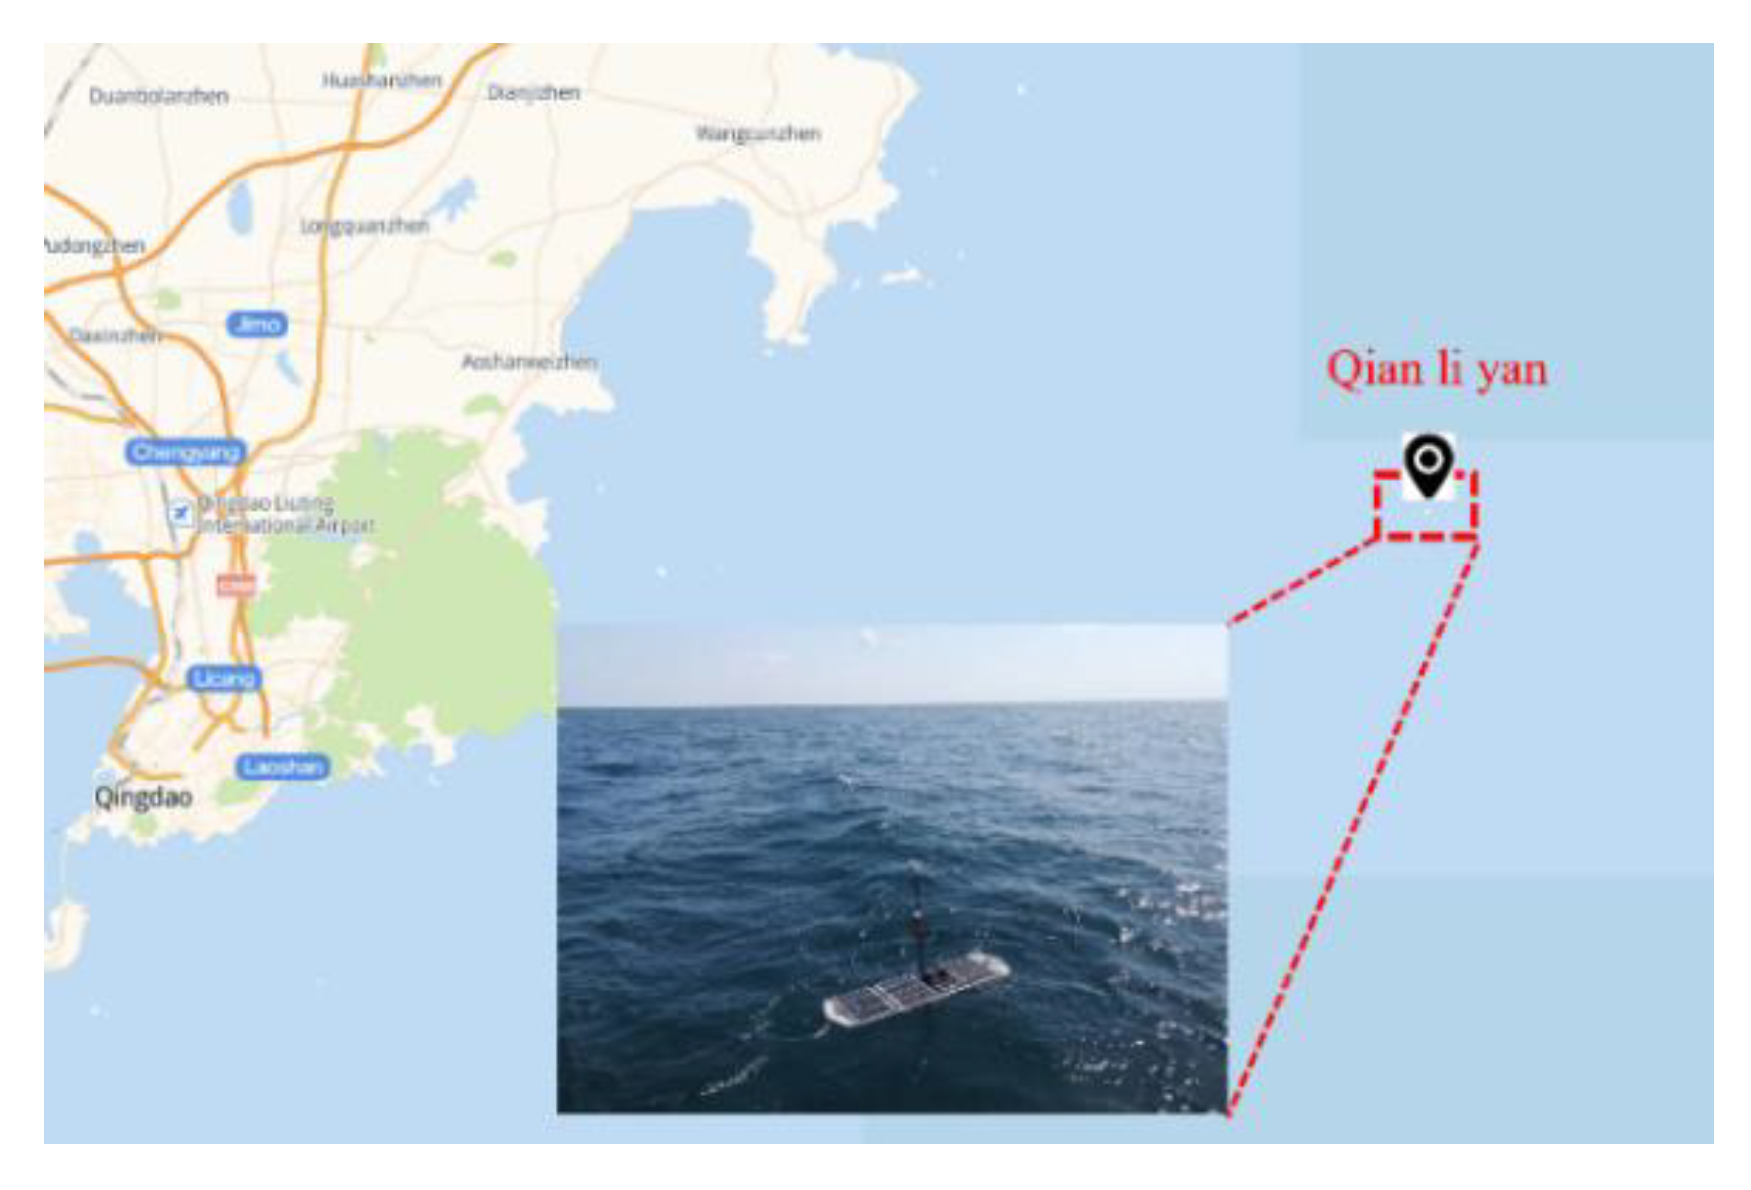
Figure 30.
The “Black Pearl” wave glider in the sea trial.
Figure 30.
The “Black Pearl” wave glider in the sea trial.
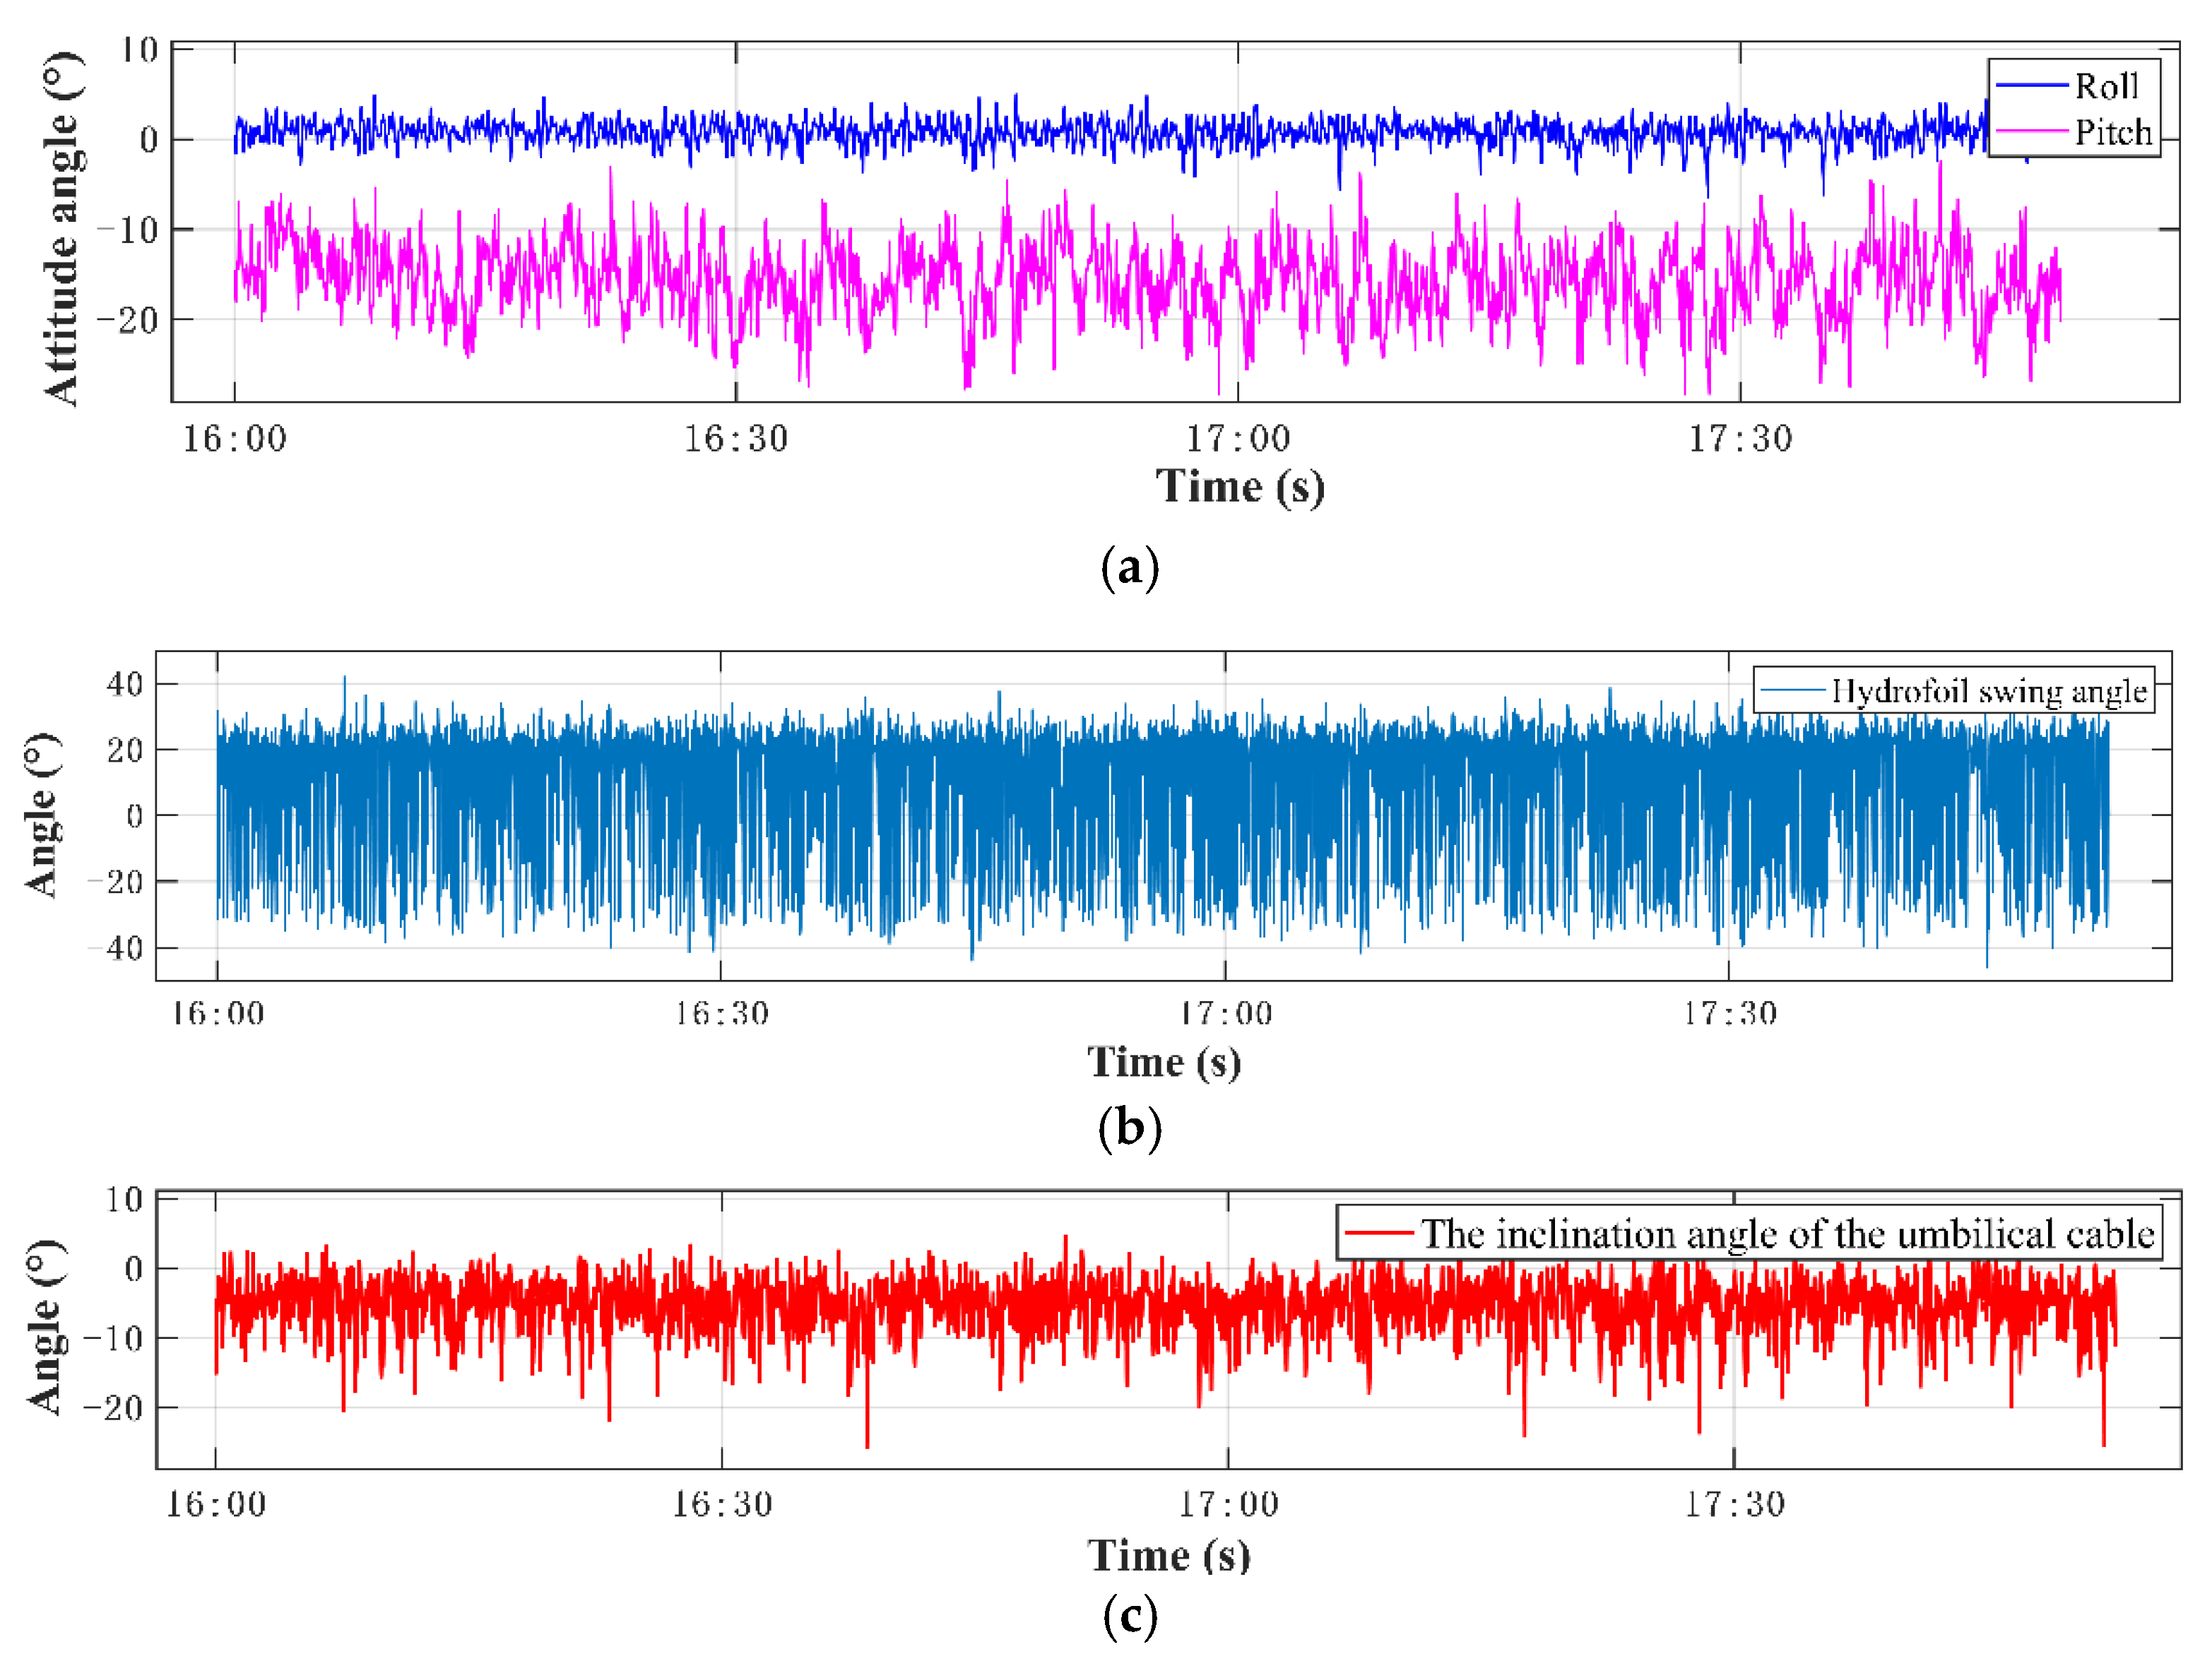
Figure 31.
The attitude angle of the “Black Pearl” wave glider in the sea trial. (a) The pitch and the roll angles; (b) the swing angle of the hydrofoil; and (c) the inclination angle of the umbilical cable.
Figure 31.
The attitude angle of the “Black Pearl” wave glider in the sea trial. (a) The pitch and the roll angles; (b) the swing angle of the hydrofoil; and (c) the inclination angle of the umbilical cable.
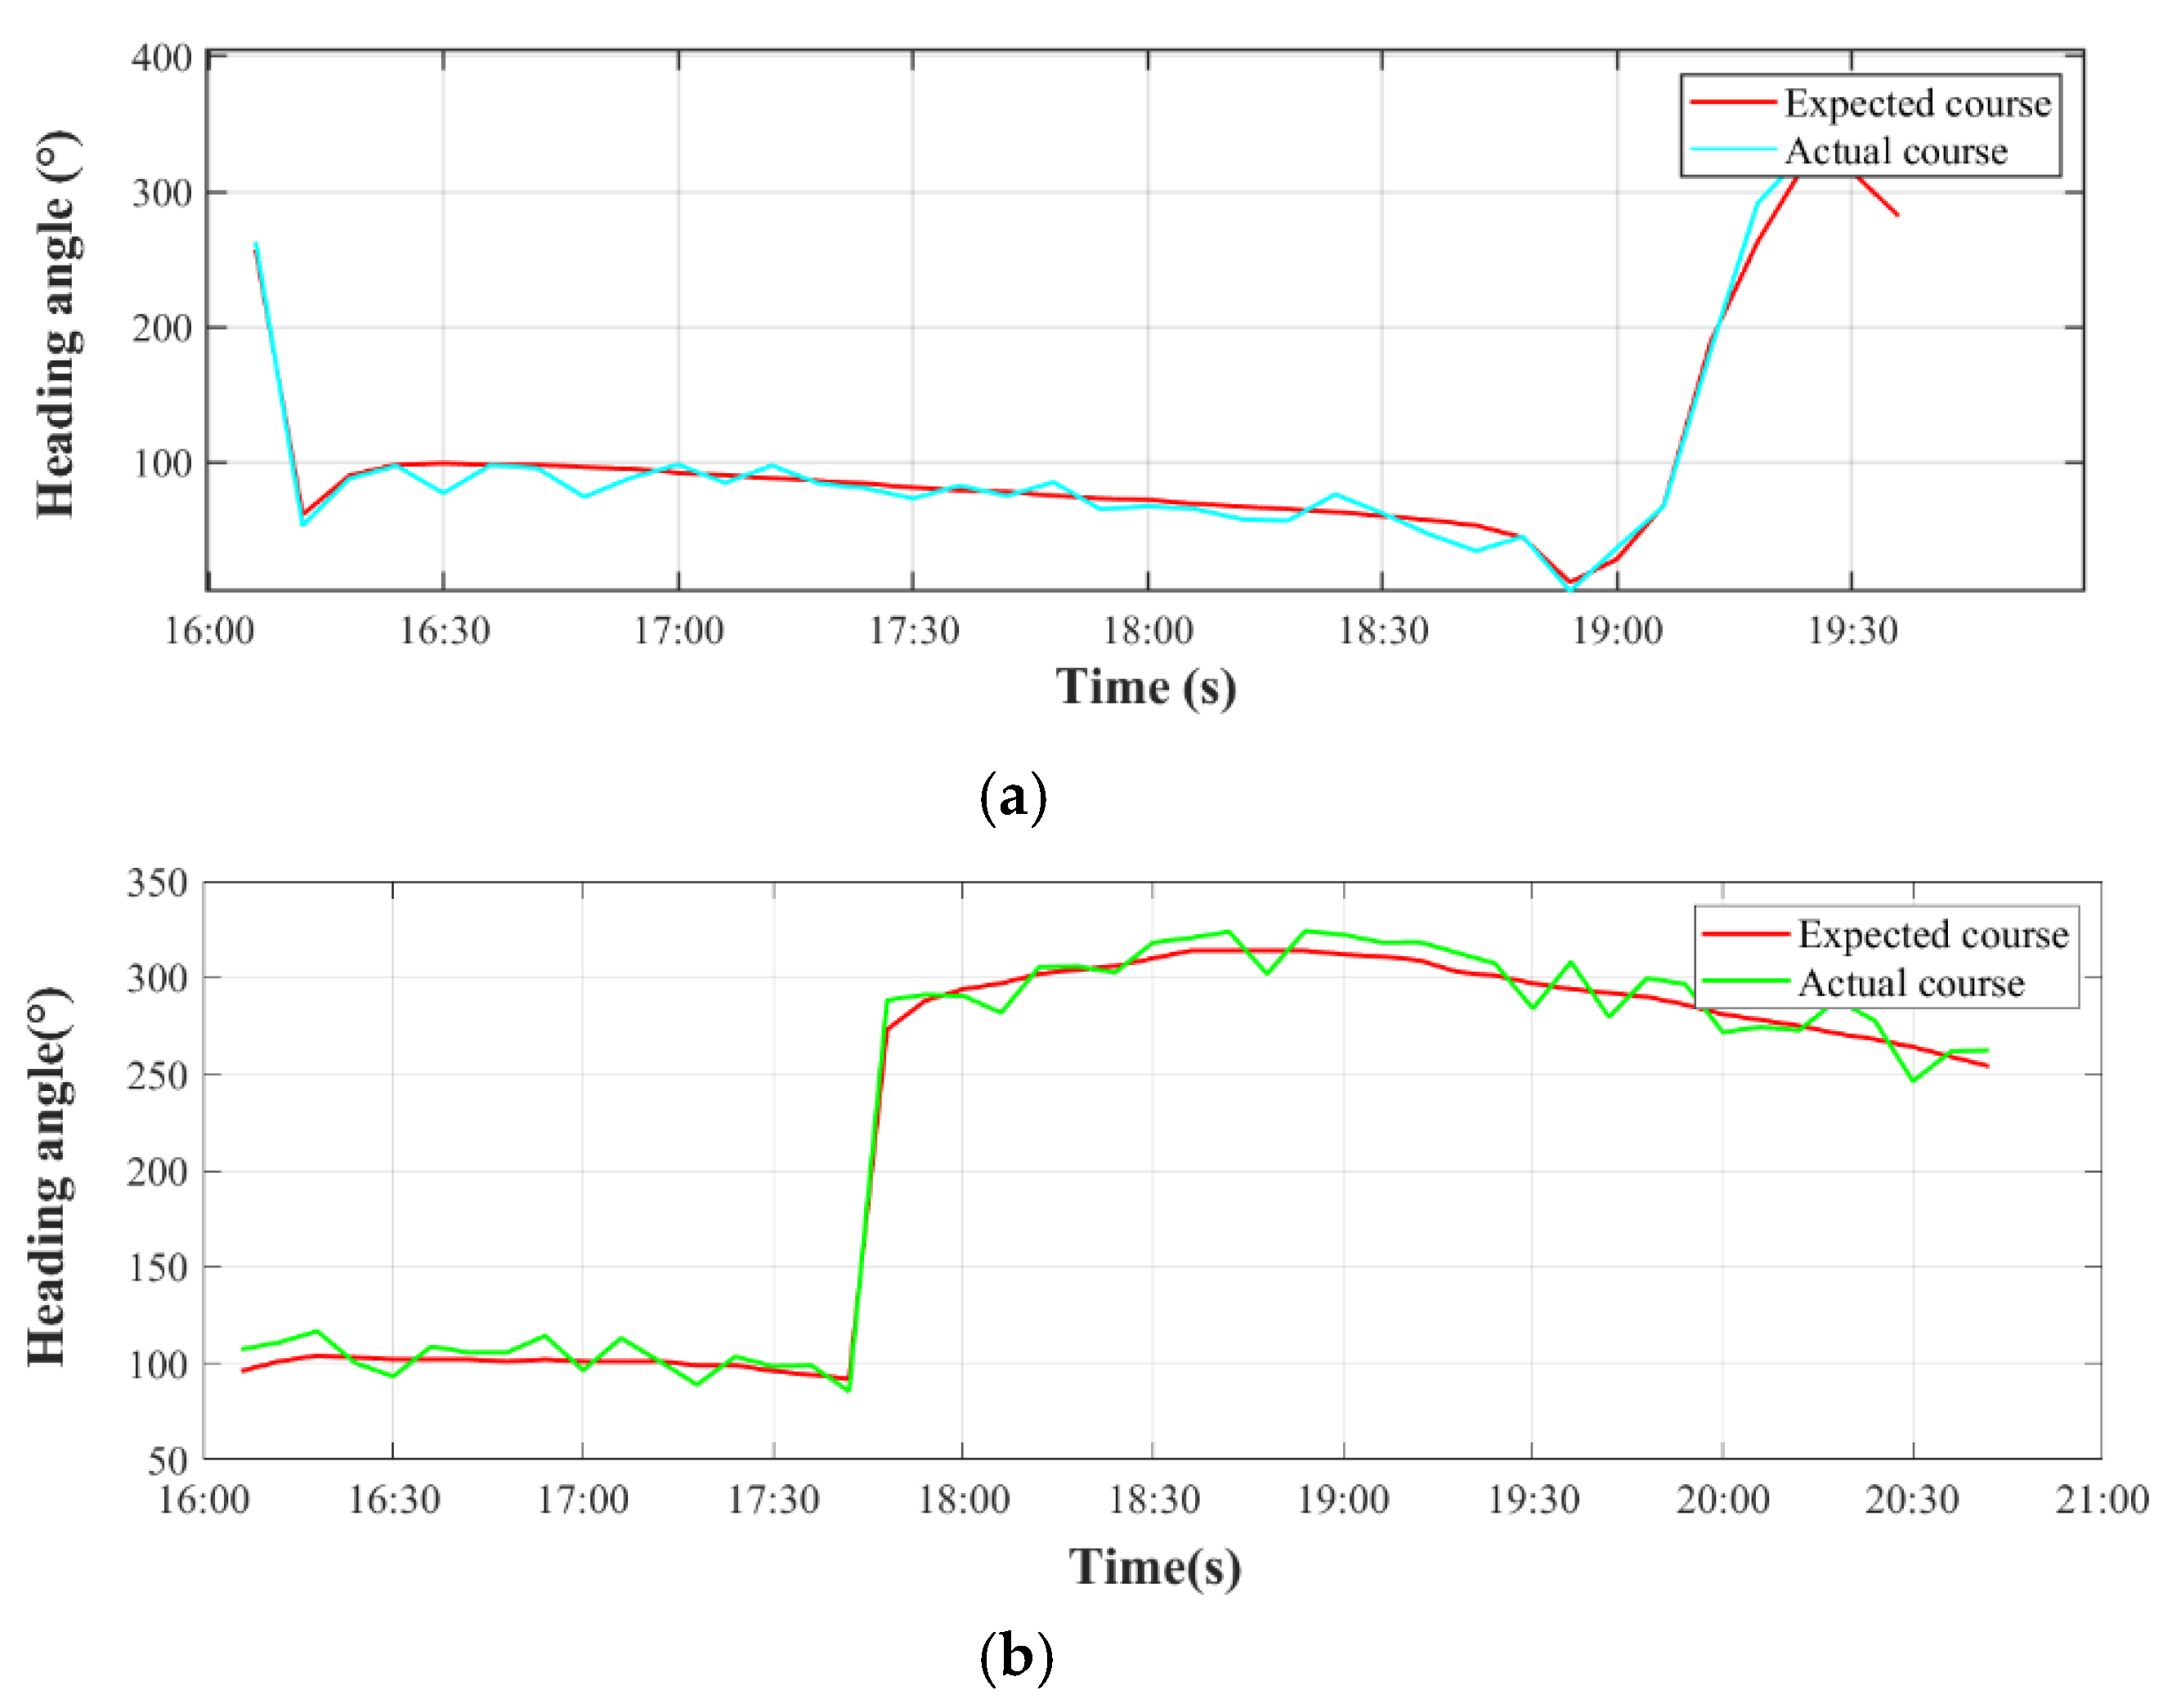
Figure 32.
Comparison of actual course and expected course of the “Black Pearl” wave gliders. (a) The heading angle of the SALL submerged glider; and (b) the heading angle of the conventional submerged glider.
Figure 32.
Comparison of actual course and expected course of the “Black Pearl” wave gliders. (a) The heading angle of the SALL submerged glider; and (b) the heading angle of the conventional submerged glider.
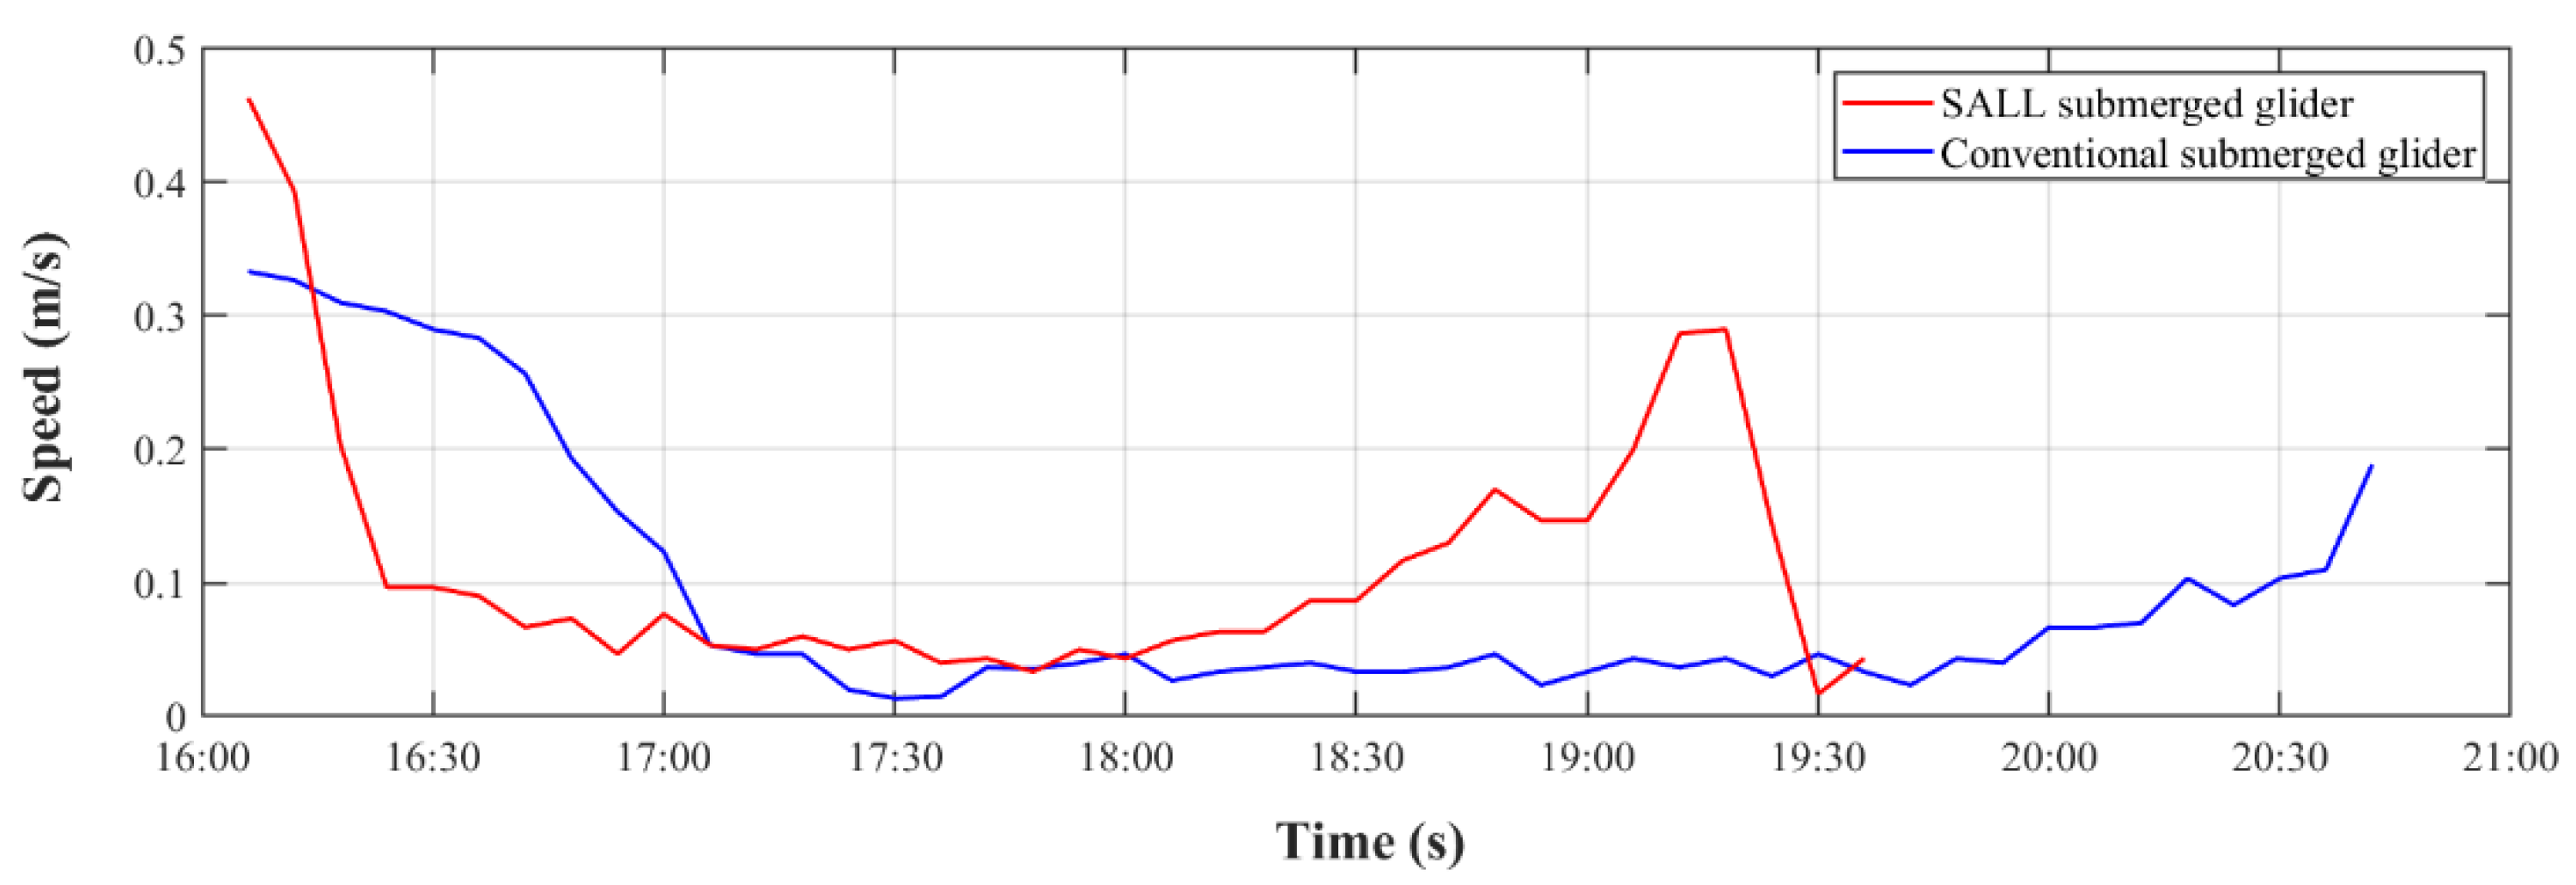
Figure 33.
The mooring speed of the “Black Pearl” wave glider.
Figure 33.
The mooring speed of the “Black Pearl” wave glider.
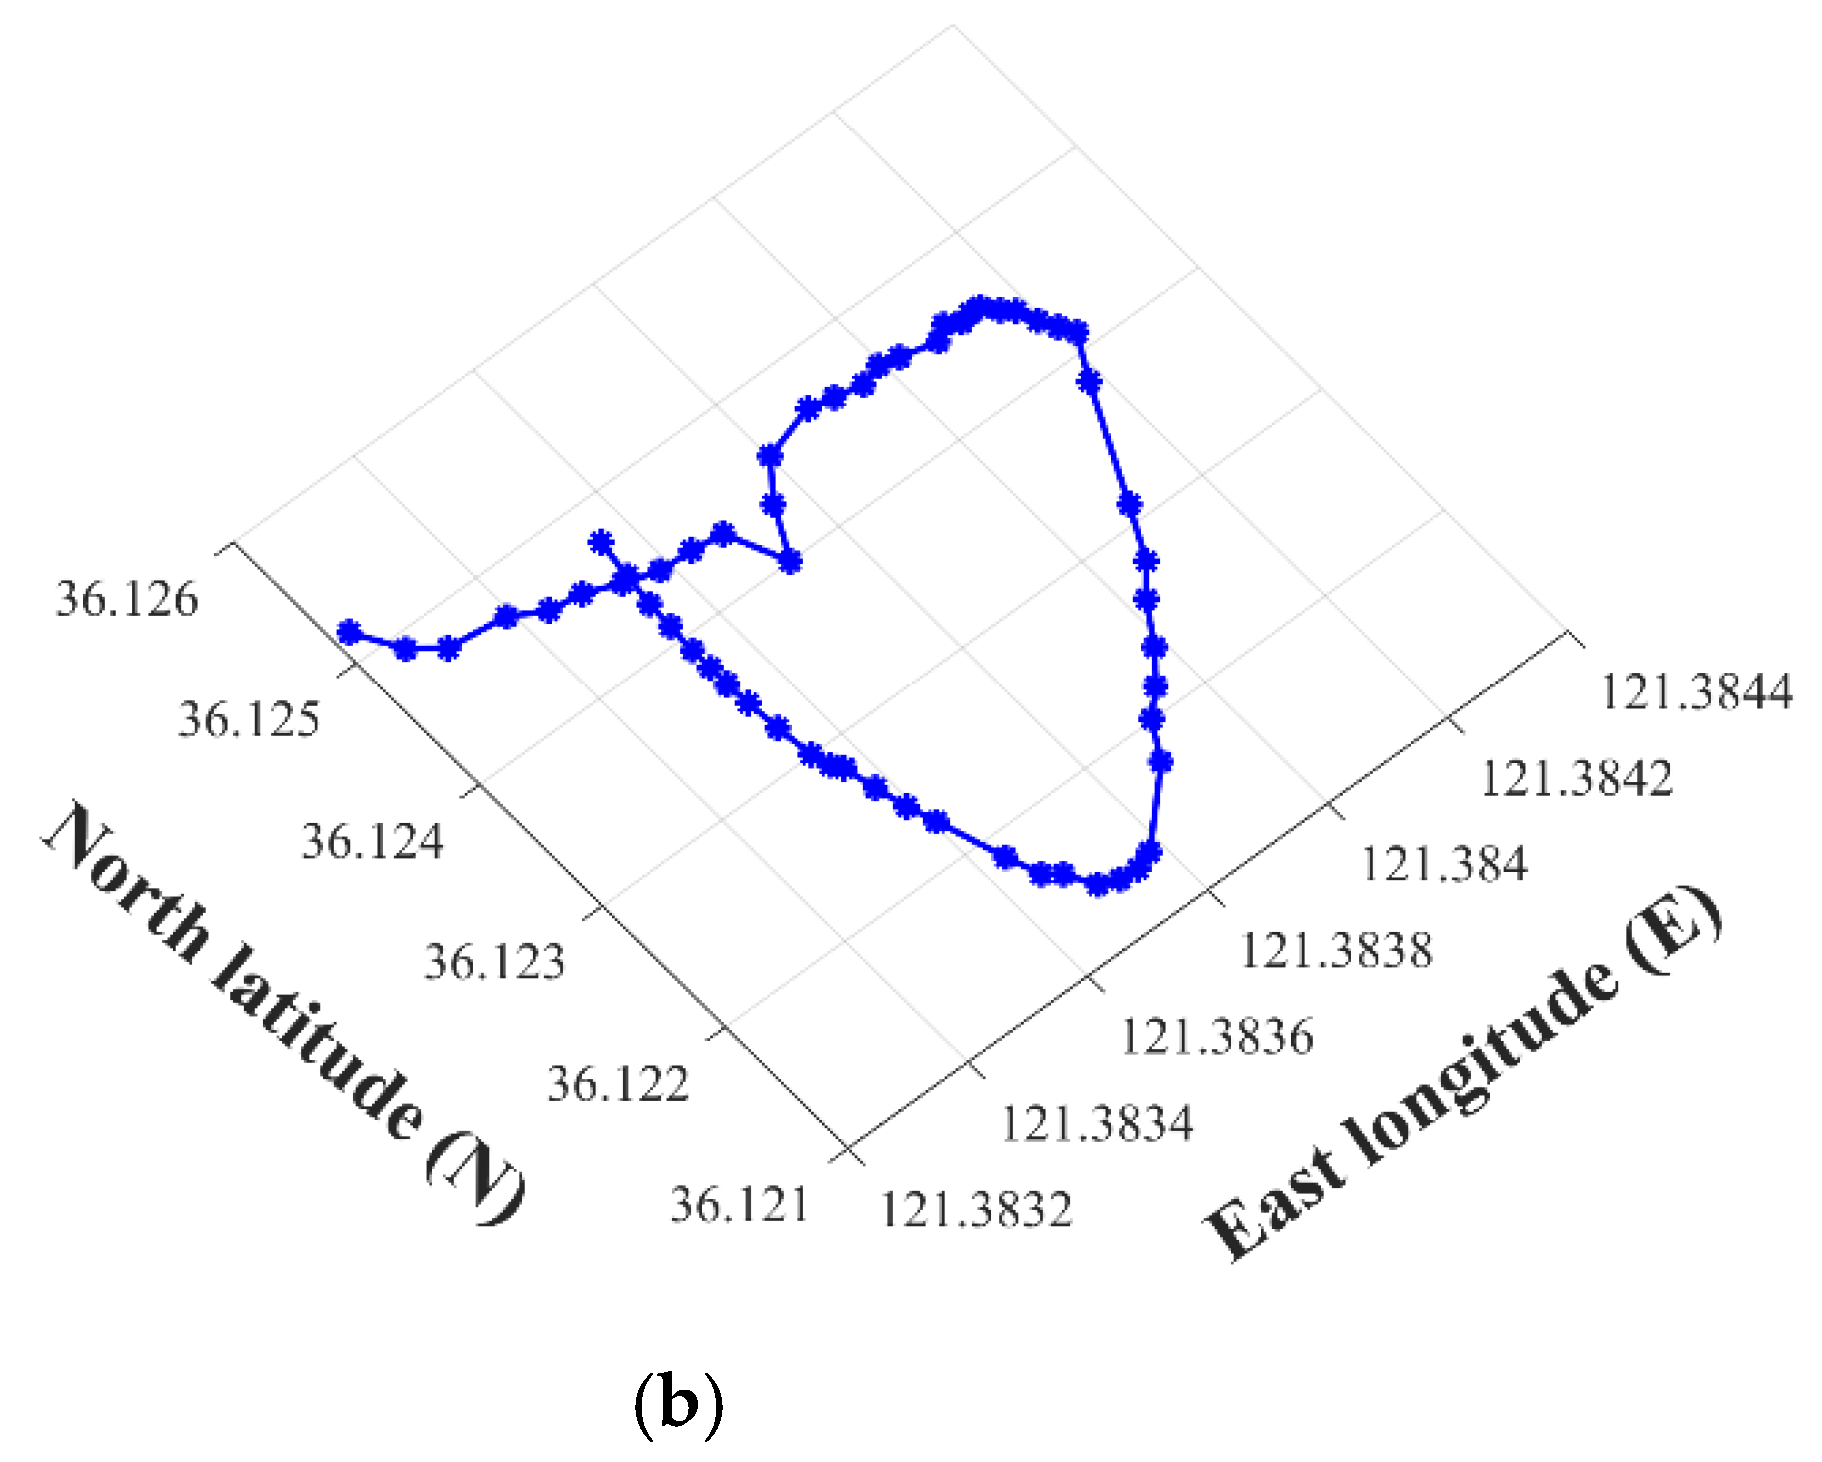
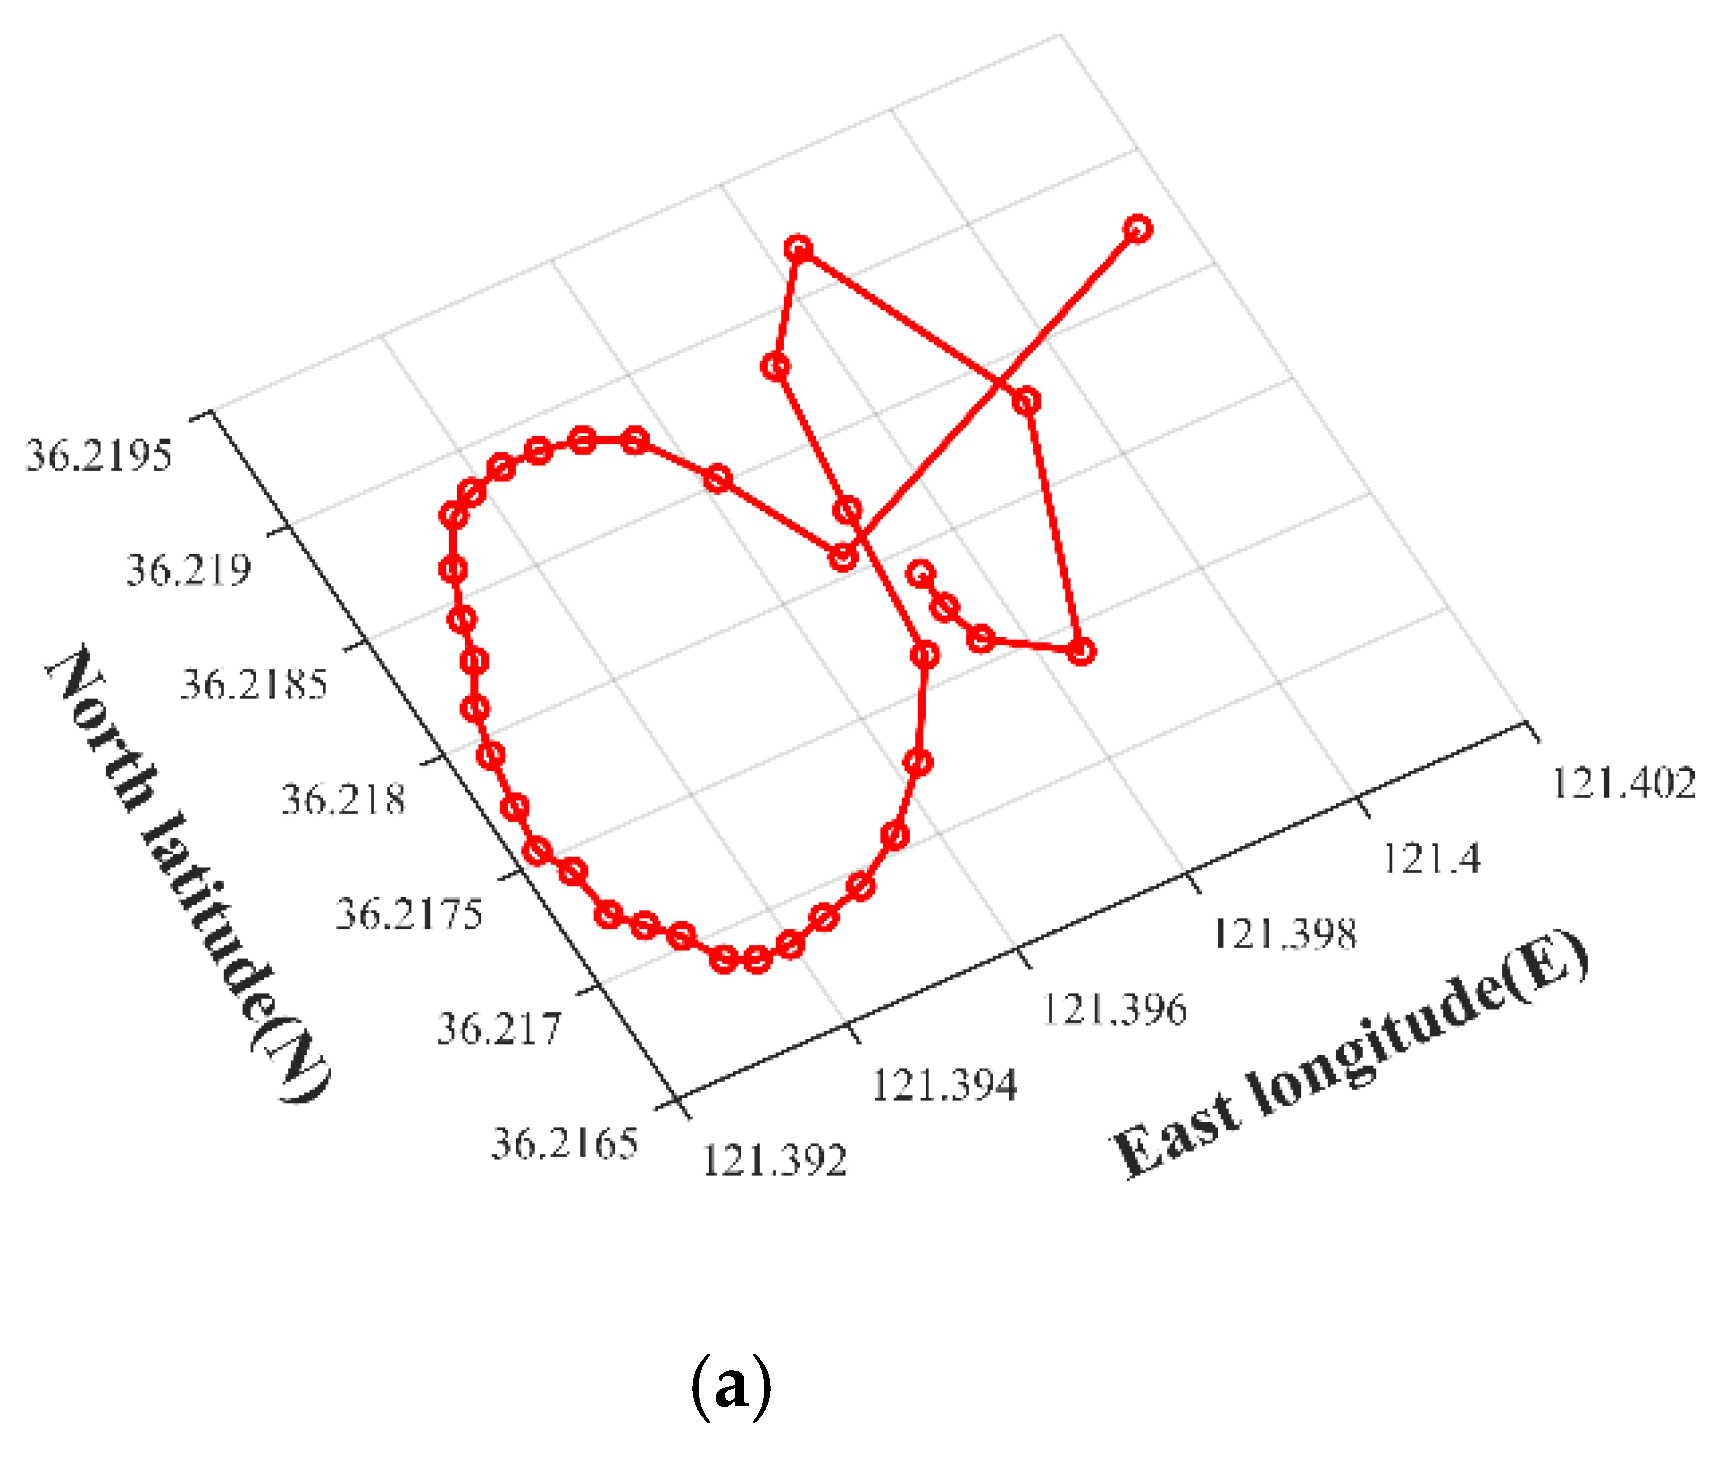
Figure 34.
The trajectories of the two “Black Pearl” wave gliders. (a) The trajectory with the SALL submerged glider; and (b) the trajectory with the conventional submerged glider.
Figure 34.
The trajectories of the two “Black Pearl” wave gliders. (a) The trajectory with the SALL submerged glider; and (b) the trajectory with the conventional submerged glider.
Table 1.
Non-dynamic parameters of the “Black Pearl” wave glider.
Table 1.
Non-dynamic parameters of the “Black Pearl” wave glider.
| Parameter | Value | Unit | Description |
|---|
| 30 | kg | Mass of the surface float |
| 30 | kg | Mass of the submerged glider |
| 65 | kg | Total mass of the wave glider |
| 3.8 | m | Distances between body frame center and submerged glider |
| 3.8 | m | Distances between body frame center and float mass center |
| 1.6 × 0.5 × 0.18 | m3 | Float dimension |
| 1.8 × 1.0 × 0.30 | m3 | Submerged glider dimension |
| 85 | kg | Float maximum displacement |
| 12 | kg | Submerged glider displacement |
| 7 | m | Length of the umbilical |
| 9.8 | m/s2 | Gravity constant |
Table 2.
Dynamic parameters of the “Black Pearl” wave glider.
Table 2.
Dynamic parameters of the “Black Pearl” wave glider.
| Parameter | Value | Unit | Description |
|---|
| λ11f | 43.5 | kg | Forward added mass of the surface float |
| λ11g | 65.1 | kg | Vertical added mass of the surface float |
| λ33f | 16.4 | kg | Forward added mass of the submerged glider |
| λ33g | 82.3 | kg | Vertical additional mass of the submerged glider |
| XFuu | −42.3 | kg/m | Forward resistance coefficient of the surface float |
| XFww | −18.4 | kg/m | Vertical resistance coefficient of the surface float |
| ZGuu | −87.6 | kg/m | Forward drag coefficient of the submerged glider |
| ZGww | −270 | kg/m | Vertical resistance coefficient of the submerged glider |
Table 3.
Main parameters of the hydrofoil.
Table 3.
Main parameters of the hydrofoil.
| Parameter | Value | Unit |
|---|
| Chord length, c | 0.16 | m |
| Hydrofoil thickness, d | 0.02 | m |
Hydrofoil shape
Moment of inertia, J | NACA0012
0.922 |
kg/m2 |
Free stream velocity, U∞
Distance between shaft center and mass center | 0.25
0.04 | m/s
m |
Table 4.
The numerical results of the different levels of cells.
Table 4.
The numerical results of the different levels of cells.
| Grid | Cells | K | Inflow Velocity | Average Thrust (N) |
|---|
| Grid1 | 21,185 | 4 N⋅m/rad | 0.25 m/s | 4.55757 |
| Grid2 | 29,204 | 4 N⋅m/rad | 0.25 m/s | 4.64766 |
| Grid3 | 45,682 | 4 N⋅m/rad | 0.25 m/s | 4.66012 |
| Grid4 | 80,507 | 4 N⋅m/rad | 0.25 m/s | 4.87065 |
| Grid5 | 185,166 | 4 N⋅m/rad | 0.25 m/s | 4.91025 |
| Grid6 | 676,596 | 4 N⋅m/rad | 0.25 m/s | 4.92469 |
Table 5.
The comparison of the tank experiment and numerical simulation results.
Table 5.
The comparison of the tank experiment and numerical simulation results.
| Type | Maximum Thrust (N) | Minimum Thrust (N) | Average Thrust (N) |
|---|
| Numerical simulation | 21.4 | 0 | 5.1575 |
| Tank experiment | 15.7 | −1.23 | 4.6601 |
Table 6.
The geometric dimension of the SALL submerged glider and conventional submerged glider.
Table 6.
The geometric dimension of the SALL submerged glider and conventional submerged glider.
| Model | Overall Size (mm) | Number of Hydrofoils | Size of Hydrofoils (mm) |
|---|
| SALL submerged glider | 325 × 1093 × 1884 | 12 | 500 × 160 × 20 |
| Conventional submerged glider | 325 × 1093 × 1884 | 12 | 500 × 160 × 20 |
Table 7.
The numerical simulations for the submerged glider.
Table 7.
The numerical simulations for the submerged glider.
| Simulated Model | Y-Axis Speed | The Angle of Movement Direction and Y-Axis | Lower Limit of Hydrofoil |
|---|
| SALL submerged glider | 0.471 × sin (1.57 t) | 0° | Follow-up |
| Conventional submerged glider | 0.471 × sin (1.57 t) | 10° | Fixed |
Table 8.
The average thrusts of the SALL submerged glider and conventional submerged glider under the different K.
Table 8.
The average thrusts of the SALL submerged glider and conventional submerged glider under the different K.
| Stiffness Coefficient | The Thrust of the Conventional Submerged Glider (N) | The Thrust of the SALL Submerged Glider (N) |
|---|
| λ = 0 | λ = 5 | λ = 10 | λ = 15 |
|---|
| K = 2 | 2.880 | 2.797 | 2.638 | 2.923 | 2.284 |
| K = 4 | 4.146 | 4.498 | 4.620 | 4.561 | 4.883 |
| K = 6 | 4.109 | 4.067 | 4.259 | 4.414 | 4.144 |
| K = 8 | 2.849 | 2.793 | 3.427 | 3.350 | 2.295 |
Table 9.
The average thrust change rates of the SALL submerged glider under the different K and λ.
Table 9.
The average thrust change rates of the SALL submerged glider under the different K and λ.
| Stiffness Coefficient | The Thrust of the Conventional Submerged Glider (N) | The Change Rate of Average Thrust |
|---|
| λ = 0 | λ = 5 | λ = 10 | λ = 15 |
|---|
| K = 2 | 2.880 | −2.88% | −8.40% | 1.50% | −20.70% |
| K = 4 | 4.146 | 8.50% | 11.43% | 10.01% | 17.78% |
| K = 6 | 4.109 | −1.02% | 3.65% | 7.42% | 0.85% |
| K = 8 | 2.849 | −1.97% | 20.70% | 20.29% | −19.45% |
Table 10.
The dimensions of the tank and experimental platform.
Table 10.
The dimensions of the tank and experimental platform.
| Dimension | Tank | Experimental Platform | Unit |
|---|
| Length | 6000 | 1884 | mm |
| Width | 2000 | 1093 | mm |
| Height | 1000 | 325 | mm |
Table 11.
The parameters of the tension sensor.
Table 11.
The parameters of the tension sensor.
| Model | Range (N) | Resolution (N) | Accuracy | Communication Interface |
|---|
| HF-500 | 500 | 0.1 | 0.5% | RS232 |
Table 12.
The parameters of the 3-axis attitude sensor.
Table 12.
The parameters of the 3-axis attitude sensor.
| Model | Communication Protocol | Baud Rate | Transmission Frequency | Transmission Distance |
|---|
| WT901C485 | Modbus | 4800~921,600 bps | 200 Hz (Max) | 10 m |
Table 13.
The of the SALL submerged glider and the conventional submerged glider.
Table 13.
The of the SALL submerged glider and the conventional submerged glider.
| Submerged Glider | | | | | |
|---|
| SALL submerged glider | 121.3940 | 36.2178 | 0.001387 | 0.000773 | 0.001272 |
| Conventional submerged glider | 121.3882 | 36.1234 | 0.002244 | 0.001213 | 0.002036 |


